design of an anterior cruciate ligament...
TRANSCRIPT

DESIGN OF AN ANTERIOR CRUCIATE LIGAMENT
INJURY REPRESSION SYSTEM
AMR ATTYAH, MARIBETH BURNS,
SAM MILLER, ANDREW TESNOW
SENIOR DESIGN SYST 490 - 001
1
It is said that 10,000 of practice hours creates expertise.
For an athlete, one wrong step can take all that away.

AGENDA
1.CONTEXT
2.CONOPS
3.ANALYSIS METHODOLOGY
4.PROJECT PLAN AND BUDGET
2

○ Definitions
○ The Knee System
○ Why are ACLI More Serious that Other Ligament Injuries?
○ Average ACLI Incident
○ Defining Project Scope
○ Project Scope
○ Knee Biomechanics
○ Risk Factors
○ Structural
○ Neuromuscular
○ Muscular
○ As-Is
○ Gap Analysis
○ Stakeholder Analysis
○ Problem & Need Statements
3
1. CONTEXT

DEFINITIONS
• ACL – Anterior Cruciate Ligament
• ACLI – Anterior Cruciate Ligament Injury
• Sub-Systems of ACLI Handling
– Repression – the attempted prevention of an ACLI
– Reconstruction – the surgical process to repair an ACLI
– Rehabilitation – the process of returning to previous level of athletic effort
• Knee Dynamics
– Valgus –knees coming together during athletic movement
– Quad Dominance – using quadriceps to absorb all the shock
– Q- angle – the angle between hip and the knee
• Dynamic Sports - Competitive physical activity characterized by constant change.
4

THE “KNEE SYSTEM”
1. Femur
2. Knee Cap
3. Shin
4. Fibula
5. Quadriceps Tendon
6. Patellar Tendon
7. Hamstring Tendons
8. Quadriceps
9. Hamstring
10. Calf
11. Meniscus
12. PCL
13. MCL
14. LCL
15. ACL
5
Wikipedia <2015> OhioDance <2012>

WHY ARE ACLI MORE SERIOUS THAN
OTHER LIGAMENT INJURIES?
6
Dr. David Geier <2014>
• The Synovial Fluid
– Non-Newtonian Fluid that reduces friction
between the cartilage
• Effects the ACL healing process
– Prevents blood from clotting on the torn ACL
– Blood clotting acts like a reconstructive scaffold
that facilitates scar tissue creation and healing.
• HyrdaRub <2006>
It won't heal on its own.
Torn ACL

AVERAGE ACLI INCIDENT BY SPORT AND GENDER FOR AN
NCAA ATHLETE
Sport Female Percentage Male Percentage
Basketball 15,381 29% 16,911 8%
Soccer 23,357 32% 21,601 12%
LAX 7,219 18% 9,266 17%
Football 0 0% 64,879 2%
Rugby 184 36% 63 18%
Average 28.75% 11.40%
7
Lee DY <2007> Prodromos <2007>
Females have a 16 degree Q-Angle on average compared to a Male’s 12 degree
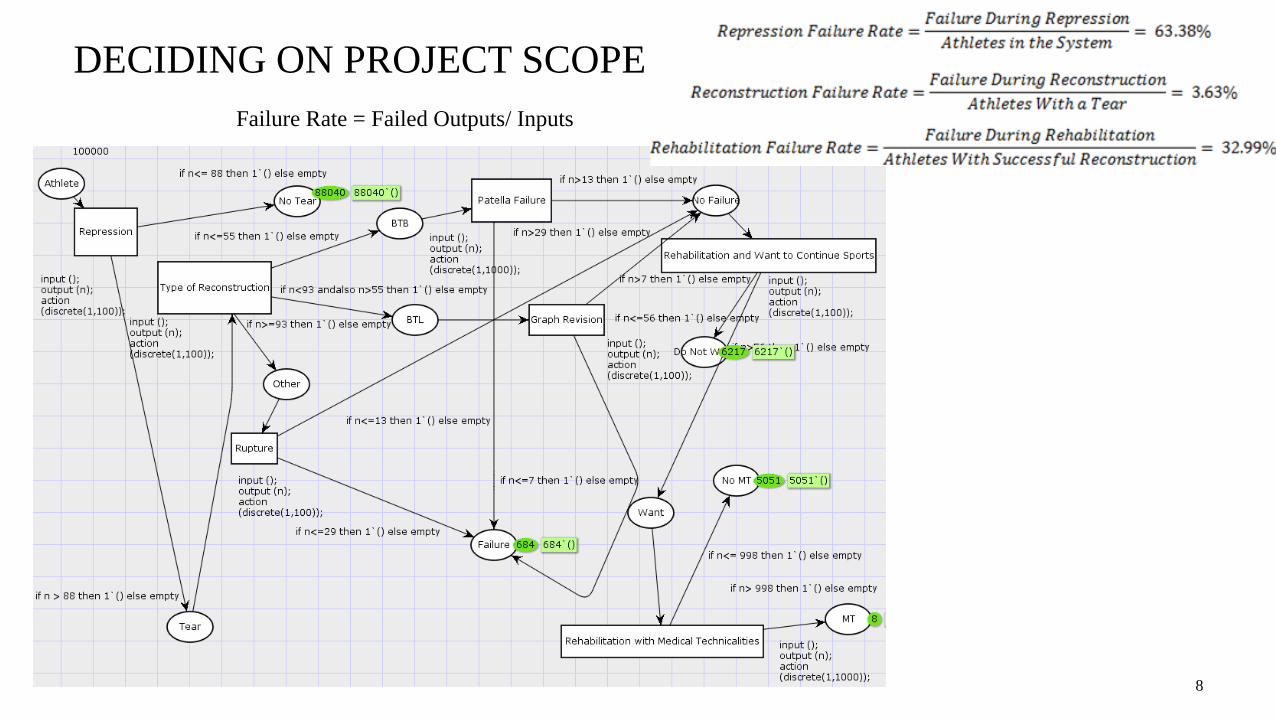
DECIDING ON PROJECT SCOPE
8
Failure Rate = Failed Outputs/ Inputs

ESTABLISHING OUR PROJECT SCOPE
9
Reasons to narrow scope to Repression:
● No unifying stakeholders governing all three processes.
● Phase 1 processes hold most weight.
● Our simulation shows that Repression contributes the most error to our
system and therefore the most opportunity.
● Repression has the most developed CONOPS and Design Alternatives.

MECHANISM OF ACL INJURY
Of Non-Contact Injuries
A B C A&B A&C
16% 9% 37% 37% 1%
Yohei Shimokochi <2008>
Carmen E. Quatman <2010>
● 70% of injuries are non-contact
● 30% are contact
● Different knee joint rotations loads the ACL at different
rates.
● Maximum shear force failure of an ACL = 2150 ± 157N
10

RISK FACTORS ARE SIMULATION INPUTS
• Structural
– Body Mass
– Tibia Length
• Neuromuscular Control
– Knee Valgus
– Knee Flexion Range
• Muscular
– Quadriceps Hamstring
Ratio
• Other
– Fatigue Level
– Shoe-Surface interface
– Intercondylar Notch Width
– Hormones
Strenuous Activities During Sports Inputs ACL load
ACL fails if: ACL load >= Max Stress to Failure
11

Tibia Length is an input factor.
STRUCTURAL
12
The higher the BODY MASS the higher the force the
body has to absorb to be erect

NEUROMUSCULAR
13
Gregory D. Myer <2010>
Knee Valgus Motion Knee Flexion Range Of Motion
Knee valgus motion is the change in distance the knee
moves in the Saggital plane during a drop jump movement
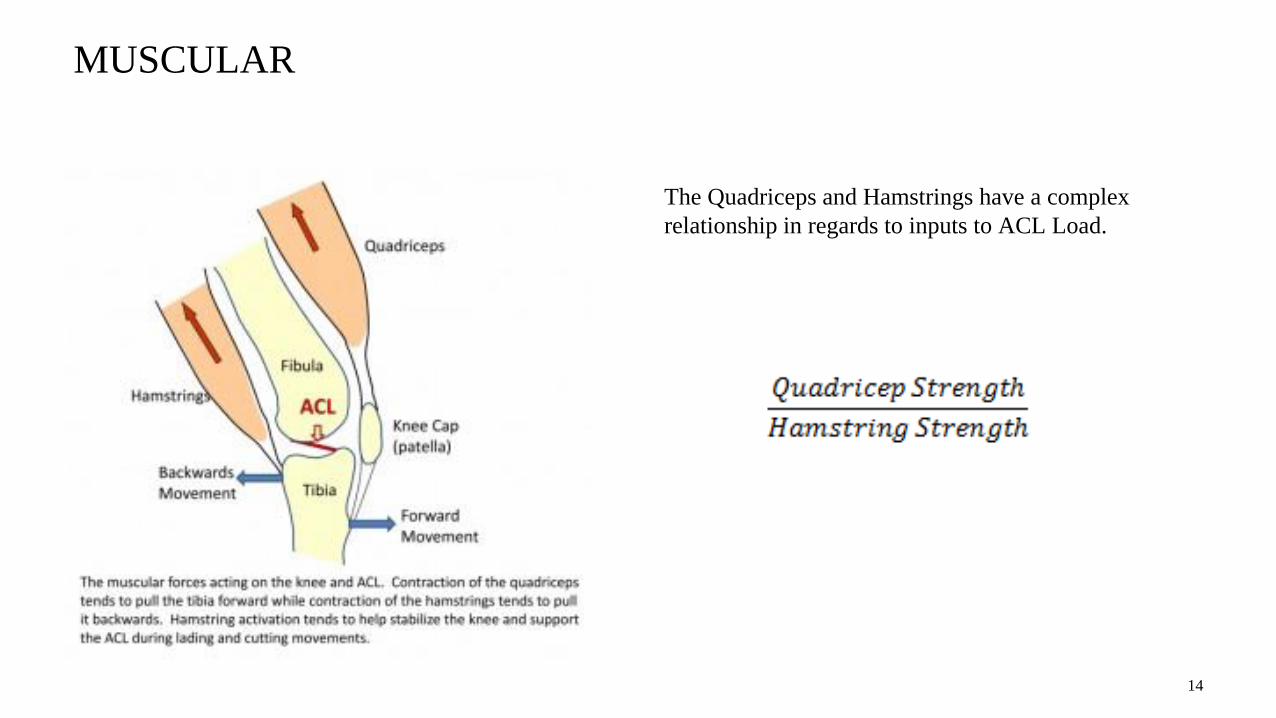
MUSCULAR
14
The Quadriceps and Hamstrings have a complex
relationship in regards to inputs to ACL Load.

• Prevent Injury and Enhance Performance Program (PEP)
– Running
– Flexibility
– Strength
– Plyometric
– Agility
• Knee Injury Prevention Program (KIPP)
– Plyometric
– Strength
– Agility
• Other
– Sportsmetrics
– Herman
– Lephart
– Derived Prevention Programs
CURRENT REPRESSION SYSTEM: TEAM TRAINING
• 62% Reduction in P(tear)
– 52% in Females
– 85% in Males
Noyes, Westin<2013>
15
Cost Duration Frequency
Central Texas
Pediatric Orthopedics
<2015>
$300 6 weeks 3x per week
Estimate Per School
Year
$1,800 36 weeks 3x per week
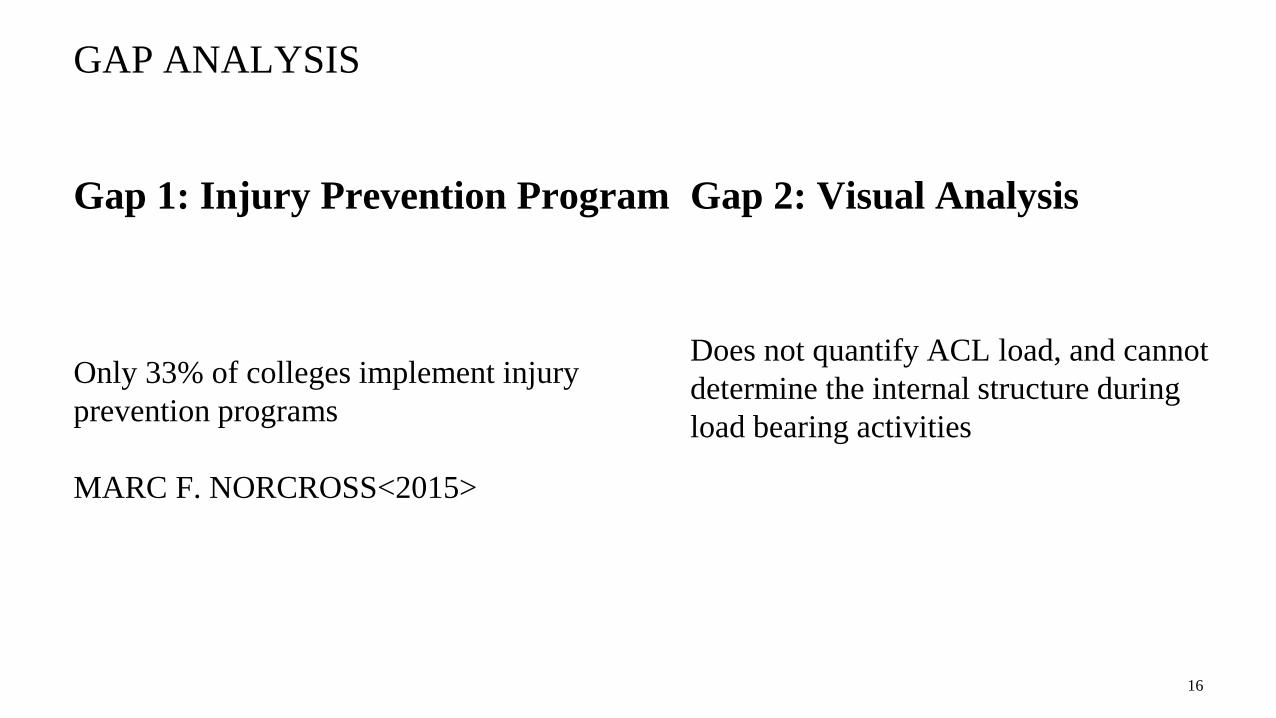
Only 33% of colleges implement injury
prevention programs
MARC F. NORCROSS<2015>
GAP ANALYSIS
16
Gap 1: Injury Prevention Program Gap 2: Visual Analysis
Does not quantify ACL load, and cannot
determine the internal structure during
load bearing activities

STAKEHOLDERS
• Athlete
• Coaching Staff
• Trainers
• Team Physician
• Insurances
• NCAA
• Teammates
• Family of Athlete
• Sponsors
– College Institutions
– Athletic Clothing Brands
• Orthopedic Surgeons
• Tool Manufacturers
– Support Gear
– Monitoring Tools
– Motion Analysis
17

18
STAKEHOLDER TENSIONS (AS-IS)

PROBLEM STATEMENT
13% OF NCAA ATHLETES PARTICIPATING IN DYNAMIC
SPORTS TEAR THEIR ACL IN A NON-CONTACT INJURIES
EACH YEAR AND ONLY 33% OF COACHES IMPLEMENT
REPRESSION TRAINING AND NOBODY IS ACCOUNTABLE.
19

NEED STATEMENT
THERE NEEDS TO BE A PRECISE SYSTEM THAT QUANTIFIES
THE RISK OF A TEAR, LOWERS THE PROBABILITY OF TEAR
RESULTING FROM NON-CONTACT ATHLETIC MOVES BY
XX%, AND WAY TO IMPLEMENT AND ENFORCE THE
SYSTEM TO ALL ATHLETES THROUGHOUT THEIR COLLEGE
CAREER.
20

21
○ Stakeholder Unified Action Plan
○ NCAA Influence
○ Stakeholder Tensions
○ Why this strategy is possible
○ Leveraging Insurance Companies
○ Mission Requirements
○ CONOPS
○ Functional Requirements
○ Design Alternatives
○ Design Requirements
○ Evaluation of Design Alternative (Identify)
○ Evaluation of Design Alternative (Mitigation)
○ Evaluation of Design Alternative (Warn)
2. CONCEPT OF OPERATIONS

STAKEHOLDER UNIFIED ACTION PLAN
22
Has the power to create and
enforce regulations
The NCAA gives the Physicians
power to prevent Athletes from
play based on Medical reasons
Facilitates Mitigation
Has a probability of tearing their
ACL
The National Collegiate Athletic Association is a
membership-driven organization dedicated to
safeguarding the wellbeing of student athletes.
An insurance company stands to
benefit from a system that lowers
the occurrence of ACLI The system will need to be
funded by the NCAA and
another sponsor
The system will lower the
number of college athletes that
suffer from ACLI

A NCAA REGULATION CAN LOWER NUMBER OF TEARS
23

STAKEHOLDER
TENSIONS (TO-BE)
24
25
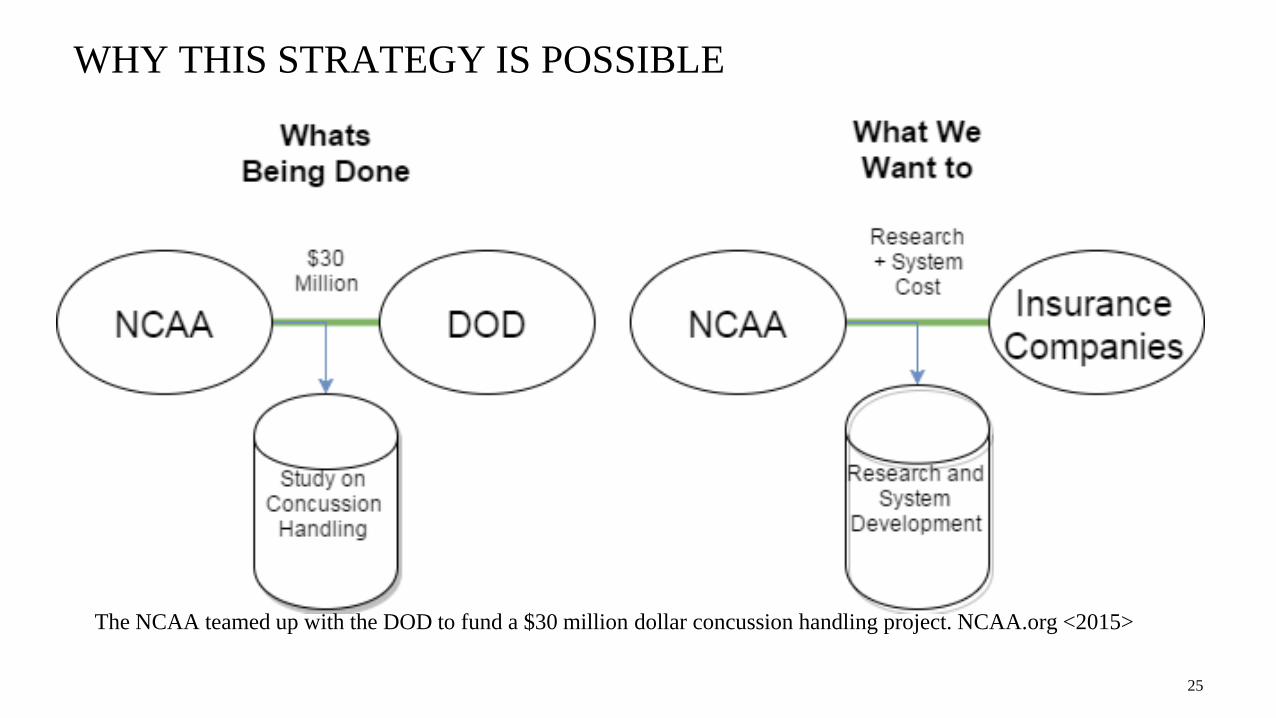
The NCAA teamed up with the DOD to fund a $30 million dollar concussion handling project. NCAA.org <2015>
WHY THIS STRATEGY IS POSSIBLE

LEVERAGING INSURANCE COMPANIES
26

MISSION REQUIREMENTS
Number Requirement
MR.1 The system shall reduce the probability of ACLI in collegiate athletes by XX%.
MR.2 The system shall work with individual athlete’s ranges of motion specific to the sport.
MR.3 The system shall cost no more than 80% the profit of the insurance company.
MR.4 The system shall cover an athlete through their entire NCAA career.
MR.5 The system shall not detract from a coach’s coaching time.
MR.6 The system shall be maintained throughout an athlete's NCAA career.
27

28
PROPOSED SYSTEM

FUNCTIONAL REQUIREMENTS
Number Requirement
FR.1.1 The system shall decrease ACL strain caused by knee valgus angle by XX%
FR.1.2 The system shall decrease strain caused by mass by XX%
FR.1.3 The system shall decrease strain caused by quadriceps/hamstring ratio by XX%.
FR.1.4 The system shall decrease strain caused by knee flexion angle by XX%.
FR.2.1 The system shall identify an athlete's probability of tear with XX% confidence.
FR.2.2 The system shall use team training, private training, and/or supports to mitigate an athlete’s
probability of tear by XX%.
FR.2.3 The system shall use warning tools monitor athlete's fatigue level with XX% confidence.
FR.4.1 The system shall start when an athlete starts a college sport.
FR.4.2 The system shall end when the athlete chooses to leave the sport.
FR.4.3 The system shall end when the athlete becomes ineligible to compete in the sport.
FR.6.1 The system shall receive updates within 30 days of a new and confirmed scientific study suggesting
change. 29

DESIGN ALTERNATIVE
30

DESIGN REQUIREMENTS
Number Requirement
DR.1 The system shall have non - dangerous, NCAA approved materials for equipment.
DR.2 The system shall take no longer than XX minutes to identify through each iteration.
DR.3 The system shall take no longer than XX minutes per week to mitigate.
DR.4 The system shall be able to monitor for a minimum of XX minutes per day.
DR.5 The system shall identify high risk athletes every 8 weeks.
DR.6 The system shall suggest a way to mitigate p(tear) based on how it was identified.
DR.7 The system shall suggest a way to control p(tear) based on how it was failed to be mitigated.
DR.8 The system shall not decrease an athlete’s athletic ability.
DR.9 The system shall decrease an athlete’s p(tear) by identifying, mitigating, and controlling.
31

Design
Alternative
Advantages Limitations Additional Cost
Visual
Analysis
• Direct observation or description of injury
mechanism
• Safe, and does not have side effects
• First or second hand information
• Cannot determine internal structure
stresses/strains
• Has to only focus on one at a time
• Video needs to be reviewed
• Error prone
$(# of extra hours *
physical trainer
payrate)
Clinical
Analysis
• Able to view neuromuscular deficiencies
• Can be done during an athlete’s yearly physical
• Evaluates p(tear) during dynamic movements
• Adequate specitivity 60-72%
• Cannot determine internal structure
stresses/strains
• Need trained team physicians
• Risk of injury during drop-jump test
• Low sensitivity, ranging from 67-87%
$(# of extra hours *
doctor payrate)
Laboratory
Based
Analysis
• Sensitive camera 5,000 frames
• 6 cameras to do 3D analysis
• Build a computer model from data gathered
from node clusters placed on athlete
• Able to take into account knee abduction angle
and knee abduction moment
• Need supervision
• Takes 1 hour to calibrate
• $9,600+
$100 per person
32
EVALUATION OF DESIGN ALTERNATIVE: IDENTIFY (1)

Design
Alternatives
Advantages Limitations Additional
Cost
DJO
Functional
Bracing
• Reduces ACL strain up 50%
• Control rotation instability
• Reduces tibial shear force applied on the tibia by
the quads
• Increases knee flexion angle by 7 deg
• More effective in rehab
• Some braces have metal or hard
plastic, dangerous
• Expensive
• May influence performance
•
$899.99 per
person
Knee Sleeves • Relieves pressure
• Improves coordination
• Offer knee stability
• Cheaper than knee brace
• No data that it reduces ACL strain $39.85 per
person
KT Tape • Restrict movement and supply support to the joint
• Cheapest alternative
• Knee position brace - new
technology
• Could do nothing
• Might weaken the knee
• Uncertainty
$12.99 per
person
33
EVALUATION OF DESIGN ALTERNATIVE: MITIGATE (2)

EVALUATION OF DESIGN ALTERNATIVE: WARN (3)
34
Design Alternative Advantages Limitations Additional
Cost
Polar Heart Rate
Monitor
Polar Electro <2015>
• Waterproof
• Portable, gives feedback to
coach if the athlete
• Safe, and does not have side
effects
• Can be used 24/7 for 2 weeks
before recharging
• Measures athletes’ fatigue
level
-Only monitor fatigue
level/heart rate or knee
position
-Can be uncomfortable
$15660 per
team
Smart Knee
Bendlabs <2015>
• Simple to use and read data
from
• Portable, gives feedback to
coach if the athlete
• Safe, and does not have side
effects
• More effective in
rehab
• Some braces have
metal or hard plastic,
dangerous
TBD

35
○ Simulation Objectives
○ Simulation Requirement
○ Simulation
○ Design of Experiment
○ Value Hierarchy
○ Utility Vs Cost
3. ANALYSIS METHODOLOGY
SIMULATION OBJECTIVES
The objective of our simulation is to simulate our system concept
using inputs from a kinematic model and different values for our
design alternatives.
Since our systems function is to lower the overall probability of
tear for a population, the outputs will be probabilities of tear.
36

Number Requirement
SR.1 The simulation shall have human metrics for inputs.
SR.1.1 The simulation shall have mass for an input.
SR.1.2 The simulation shall have quadriceps/hamstring ratio for an input.
SR.1.3 The simulation shall have knee flexion angle for an input.
SR.1.4 The simulation shall have tibial length for an input.
SR.1.5 The simulation shall have knee valgus motion for an input.
SR.1.6 The simulation shall have an identify method error rate for an input.
SR.1.7 The simulation shall have a mitigation option error rate for an input.
SR.1.8 The simulation shall have a warning tool error rate for an input.
SR.2 The simulation shall have probability of tear for an output with a specific confidence interval.
SR.3 The simulation shall model an individual persona.
SR.4 The simulation probabilities shall be sourced.
SR.5 The simulation shall simulation 100 different athlete combination.
SR.6 The simulation shall run each athletic persona 100 times to model a monte carlo simulation.
SIMULATION REQUIREMENTS
37

38
SIMULATION
GREEN: inputs that we have
figured out how they work in
the equation
RED: inputs that we have not
figured out how they work in
the equation
P(tear) = -.731857-0.00221432 flexion + 0.0030274 mass + 0.0516676 ratio + 0.0322922 tibia length + 0.0357644 valgus
Meyer et.al <2010>
Came from a regression model we linearized that came from a validated study using kinematics measuring devices

DESIGN OF EXPERIMENT TO ACHIEVE ACHIEVE EFFECTIVENESS
39
(not real values, only for demonstration)
Input Effectiveness
Output
Persona Tibia
Length
(cm)
Mass
(kgs)
Quad
Ham
Ratio
(%)
Knee Flexion
Angle
(deg)
Knee
Valgus
Motion
(cm)
Identify
Error
Rate
(%)
Mitigation
Error Rate
(%)
Warn
Error
Rate
(%)
P(Tear)
1 26 70 59 4 12 20 10 2 0.76
2 50 55 75 22 7 25 13 5 0.45
3 48 60 55 45 11 5 12 3 0.66
4 35 100 60 80 5 10 9 7 0.88
... ... ... ... ... ... ... ... ... ...
100 41 40 66 97 3 15 7 4 0.48
40
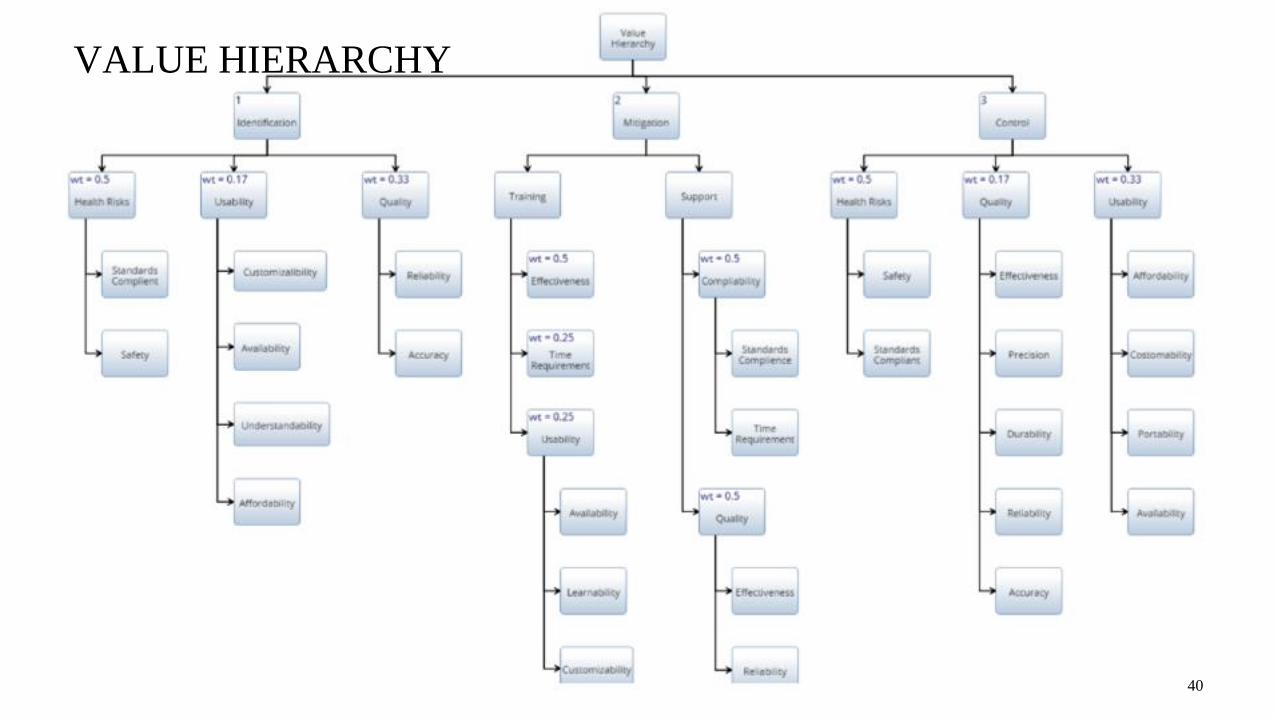
VALUE HIERARCHY

UTILITY VS COST PRESENTED TO INSURANCE COMPANIES
A Utility vs Cost analysis is integral to leveraging the Insurance companies and
therefore the implementation of our system.
A graph will show the best combinations of design alternatives multiplied the
weights in our value hierarchy against the total cost of those combinations of design
alternatives.
A key factor will be how the insurances profit will result from the effectiveness of
our system.
41
4. PROJECT PLAN AND BUDGET
○ What We Have Done and Where We Want to Go
○ Gantt Chart
○ RACI and Budget
○ EV
○ CPI/SPI
○ Project Risks
○ Risk Matrix
42
WHAT WE HAVE DONE AND WHERE WE WANT TO GO
43
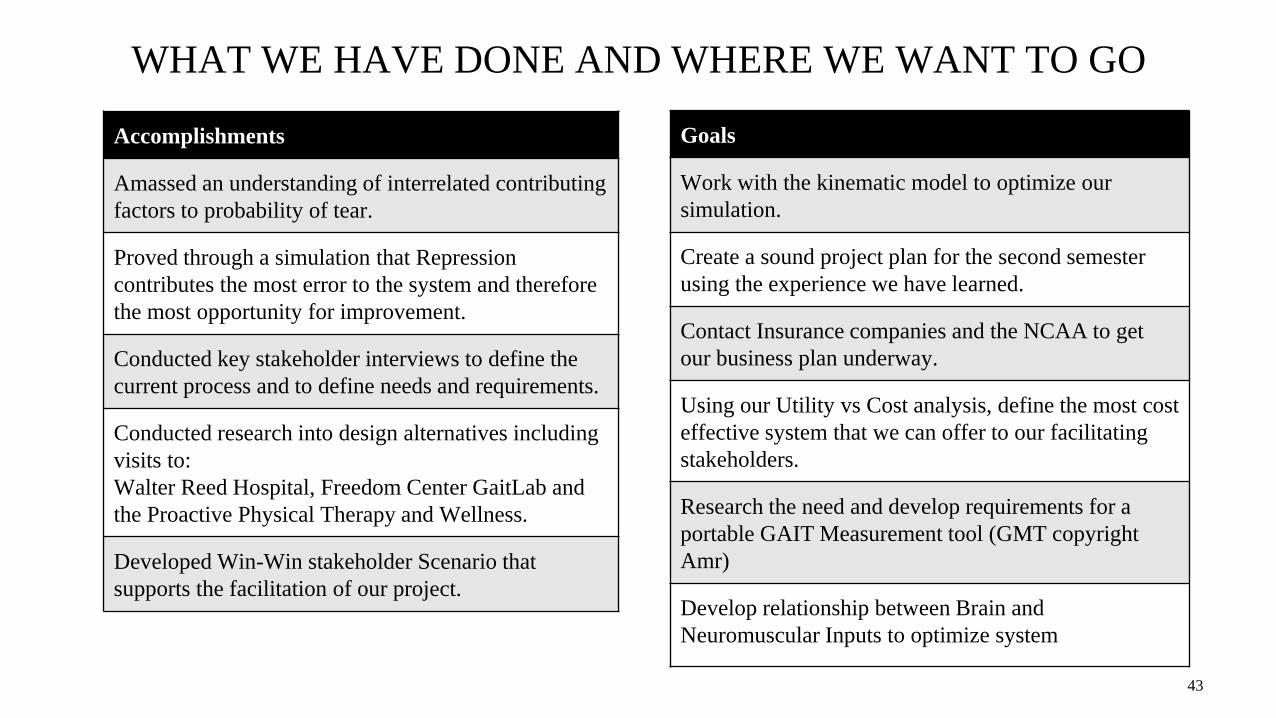
Accomplishments
Amassed an understanding of interrelated contributing
factors to probability of tear.
Proved through a simulation that Repression
contributes the most error to the system and therefore
the most opportunity for improvement.
Conducted key stakeholder interviews to define the
current process and to define needs and requirements.
Conducted research into design alternatives including
visits to:
Walter Reed Hospital, Freedom Center GaitLab and
the Proactive Physical Therapy and Wellness.
Developed Win-Win stakeholder Scenario that
supports the facilitation of our project.
Goals
Work with the kinematic model to optimize our
simulation.
Create a sound project plan for the second semester
using the experience we have learned.
Contact Insurance companies and the NCAA to get
our business plan underway.
Using our Utility vs Cost analysis, define the most cost
effective system that we can offer to our facilitating
stakeholders.
Research the need and develop requirements for a
portable GAIT Measurement tool (GMT copyright
Amr)
Develop relationship between Brain and
Neuromuscular Inputs to optimize system

GANTT CHART TO THE END OF THE SEMESTER
44

Amr Andrew Maribeth Sam
$60 $60 $60 $60
Amr Andrew Maribeth Sam
Alternatives R A I R
Analysis C R A C
CONOPS C A C C
Documentation C C I A
Modeling I I R A
Project Briefing R R A R
Project Management C C A C
Requirements R A R C
Research R R A R
Time Sheets R R A R
Weekly Accomplishment
Summaries
R R A R
BUDGET AND RACI MATRIX
45
Duration Total
168 days $174,837
Abbreviation Definition
R Responsible
A Accountable
C Consulted
I Informed

CPI/SPI
• Our Cost Performance Index has been
from 1 to 1.4. This means that we are not
wasting money.
• Both CPI and SPI are close to 1
• We have had a “need already satisfied by
new concurrent study” effect that caused
early disparity in production.
• Modeling this better in our schedule could
increase our SPI score and give a better
approximation early on.
• Lesson learned is to not underestimate
research time needed and to model
research as ongoing in original project
plan.
46
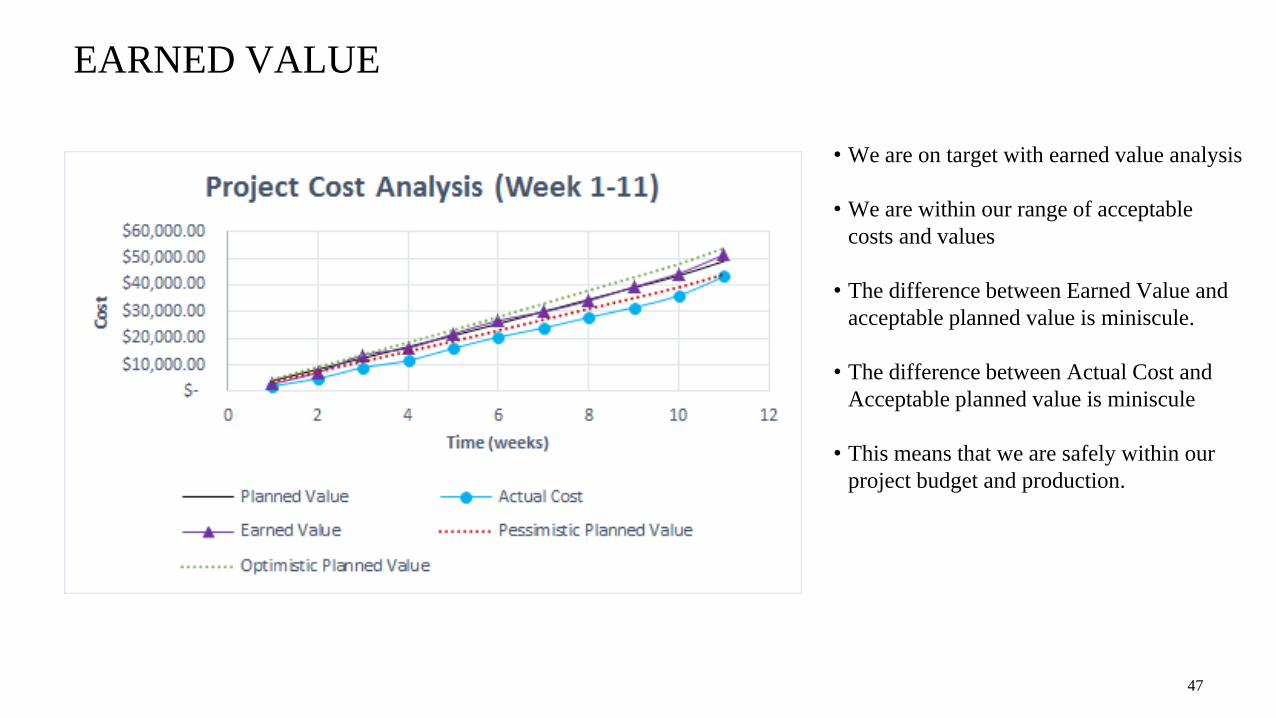
EARNED VALUE
• We are on target with earned value analysis
• We are within our range of acceptable
costs and values
• The difference between Earned Value and
acceptable planned value is miniscule.
• The difference between Actual Cost and
Acceptable planned value is miniscule
• This means that we are safely within our
project budget and production.
47

PROJECT RISK MITIGATION STRATEGIES
48
Number Risk names Mitigation Strategy
1. Insurance Companies dont buy in.
Find another financially strong stakeholder to facilitate study
with NCAA.
2. Model does not solve the problem. Periodic verification testing.
3. Model code is inaccurate. Periodic validation testing.
4 Model are not developed on time Meet milestones.

RISK MATRIX
49
Consequence
Pro
bab
ilit
y

Questions?
50

SUPPORTING SLIDES
51

QUANTIFYING ACL LOADS
Probability of an ACLI = F(Quad Dominance, Q-Angle,
Hormones)
Maximum stress to failure of an ACL = 2150 ± 157N
r= radius
beta = atan2(r32, (r12^2 + r22^2)^(½)
alpha = atan2(-r12/cosbeta, r22/cosbeta)
gamma = atan2(-r31/cosbeta, r33/cosbeta)
Wheeless’ Textbook of Orthopaedics <2013>
52
Scott G. Mclean <2004>
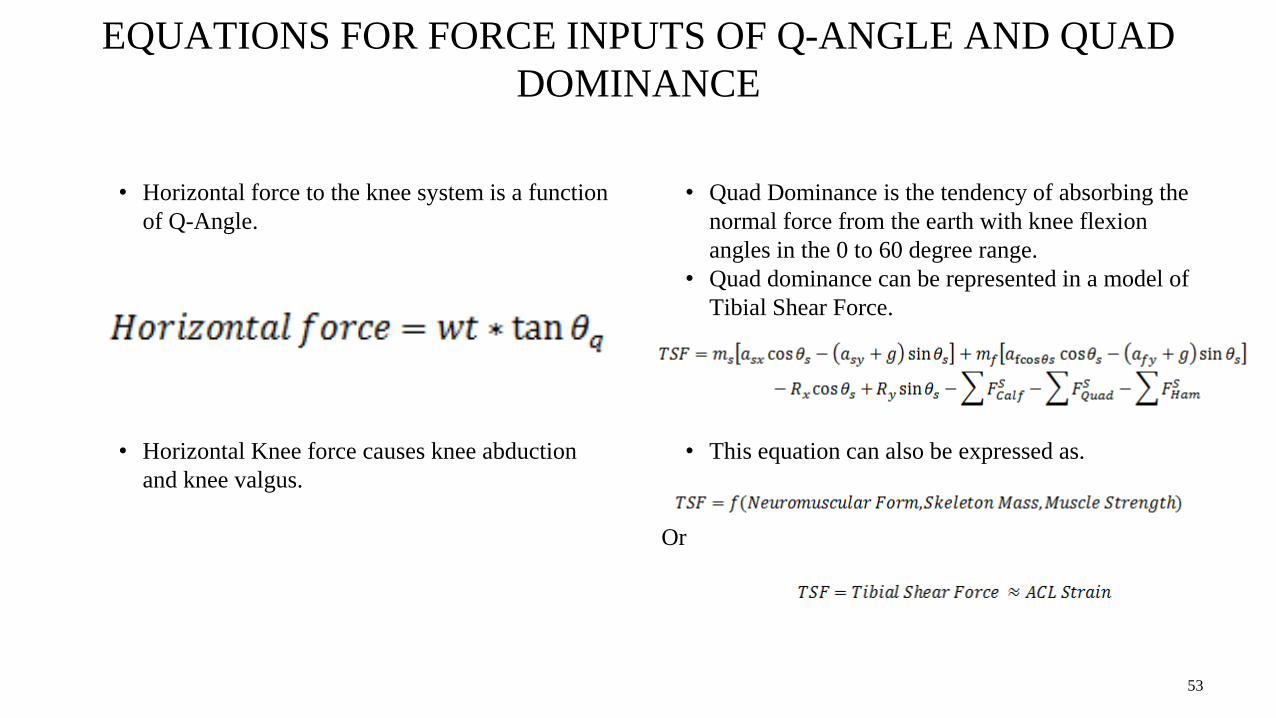
EQUATIONS FOR FORCE INPUTS OF Q-ANGLE AND QUAD
DOMINANCE
• Horizontal force to the knee system is a function
of Q-Angle.
• Horizontal Knee force causes knee abduction
and knee valgus.
• Quad Dominance is the tendency of absorbing the
normal force from the earth with knee flexion
angles in the 0 to 60 degree range.
• Quad dominance can be represented in a model of
Tibial Shear Force.
• This equation can also be expressed as.
Or
53

NEUROMUSCULAR
• Tibial Shear Force (TSF) is the force of the tibia
sliding under the knee.
• The ACL’s main purpose is to provide a
counterforce to this.
• The effect of Quad Dominance has an effect on
the body's distribution of force..
• Neuromuscular Form
–Knee Flexion Angle
–Valgus Knee Angle
• Muscular
–Quad/Ham Ratio
54
Mark Rippetoe <2015>
Cameron <2013>
<= Quad
Dominance

STRUCTURAL: Q-ANGLE
• Horizontal force
translates directly to
tension force on the
MCL.
• MCL protects an ACL
from horizontal shear
force which means a
torn ACL from
abduction results from
MCL tear
• James Monk <2015>
• For a 170 lb
Humanoid, a
degree of Q
equates to an
additional
approximated 3 lbs
of horizontal force
to the knee system.
55
Mark Rippetoe <2015>
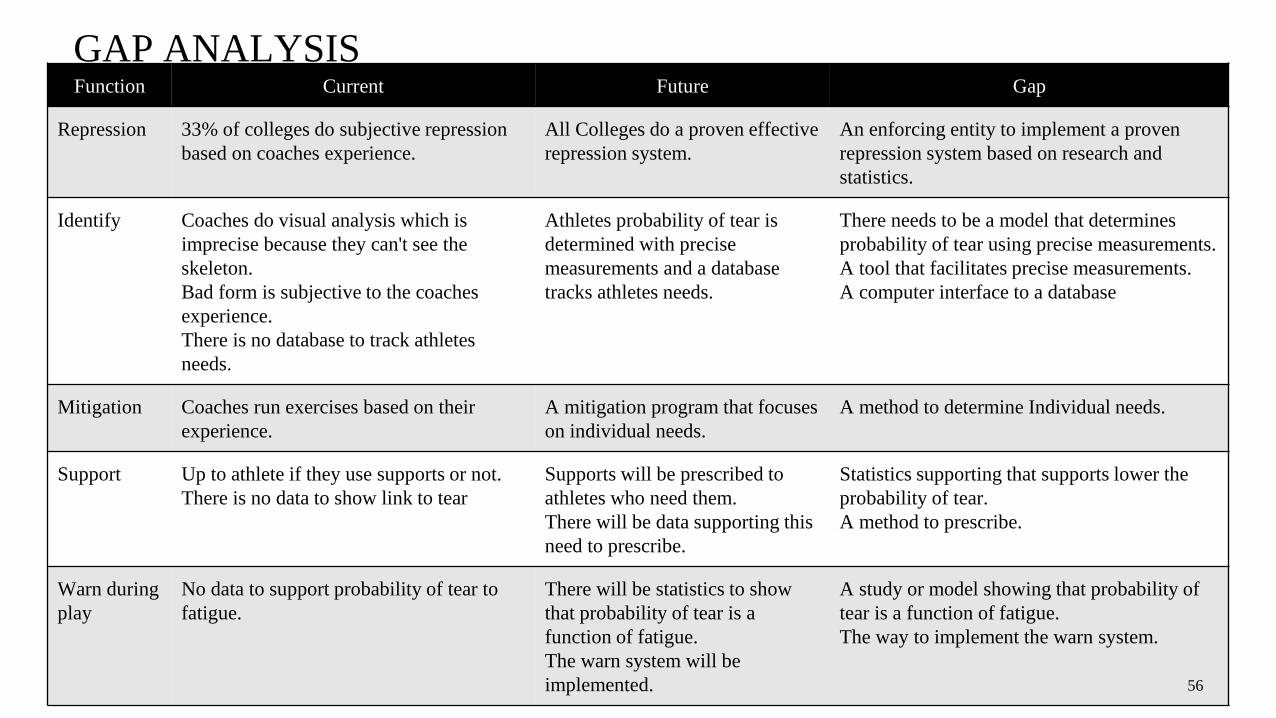
Function Current Future Gap
Repression 33% of colleges do subjective repression
based on coaches experience.
All Colleges do a proven effective
repression system.
An enforcing entity to implement a proven
repression system based on research and
statistics.
Identify Coaches do visual analysis which is
imprecise because they can't see the
skeleton.
Bad form is subjective to the coaches
experience.
There is no database to track athletes
needs.
Athletes probability of tear is
determined with precise
measurements and a database
tracks athletes needs.
There needs to be a model that determines
probability of tear using precise measurements.
A tool that facilitates precise measurements.
A computer interface to a database
Mitigation Coaches run exercises based on their
experience.
A mitigation program that focuses
on individual needs.
A method to determine Individual needs.
Support Up to athlete if they use supports or not.
There is no data to show link to tear
Supports will be prescribed to
athletes who need them.
There will be data supporting this
need to prescribe.
Statistics supporting that supports lower the
probability of tear.
A method to prescribe.
Warn during
play
No data to support probability of tear to
fatigue.
There will be statistics to show
that probability of tear is a
function of fatigue.
The warn system will be
implemented.
A study or model showing that probability of
tear is a function of fatigue.
The way to implement the warn system.
GAP ANALYSIS
56

RISK FACTORS EFFECT ON ACL STRAIN
57
Good
Form
Training
Fatigue
Level
shoe-
surface
interaction
Q Angle
Controllable
Inputs
Uncontrollable
Inputs Outputs

EXTERNAL
• Shoes-Surface Interaction
– Increasing COF of shoe surface
interaction results in decreasing
knee flexion angle and increasing
knee loading resulting in an
increased risk of ACL injury
• Shoes
– models with longer and narrower
cleats increase COF
• Surface
– Outdoor: grass (low COF) vs
Artificial grass (High COF)
– Indoor: wood (low COF) vs
Artificial rubberized (High COF)
• Weather
– Dry conditions(low rainfall, high
evaporation) increases COF
58 Noyes, Westin<2013>
COF Scale
Slippery Surface
Sticky Surface
0
1

59
Landing
Force
Knee
Abduction
Moment
Hip
Moment
Knee
Flexion
Angle
Knee Valgus
Angle
Hip
Flexion
Hip
Abduction
Angle
Knee
Separation
Distance
Sportsmetrics Herman
PEP
Peak
Internal
Rotation
Lephart
GAP 1: Risk Identification
Gap
Description: each program address
different types of risks

60
IDEF1: IDENTIFY

DESIGN ALTERNATIVE #1: VISUAL ANALYSIS
• Pros
– Direct observation or description of injury
mechanism
– Safe, and does not have side effects
– First or second hand information
• Cons
– Cannot determine internal structure
stresses/strains
– Has to be one on one or only focus on one at a
time
– Video needs to be reviewed
61
Myer et. al. <2010>

DESIGN ALTERNATIVE #2: PHYSICAL EXAM
• Pros:
– Analyze anatomic constraints
– Measures probability of an ACL tear
– Visualizes internal structures during time of
high strain
• Cons:
– Does not directly analyze injury mechanism
– Results can vary
– Need to train doctors
62
Precision Nutrition <2015>

DESIGN ALTERNATIVE #3: 3D ANALYSIS
• Pros
– Identify injury mechanism
– Mimic specific movements that occur during
injury.
– Estimate both kinematics and net kinetics at joint
during high risk movements
– Generally safe
• Cons
– Need supervision
– May cause muscle injuries if not used properly
– Expensive
63
3D Gait Analysis <2015>

DESIGN ALTERNATIVE #4: 2D ANALYSIS
• Pros
– Athlete performs exercises that have
large amounts of force
– Metrics based
– Measures valgus and knee flexion
• Cons
– Requires trained personnel
– Takes time to do analysis on metrics
– Not as Detailed at 3D
64
Contemplas GmbH <2015>

65
IDEF2:
MITIGATE
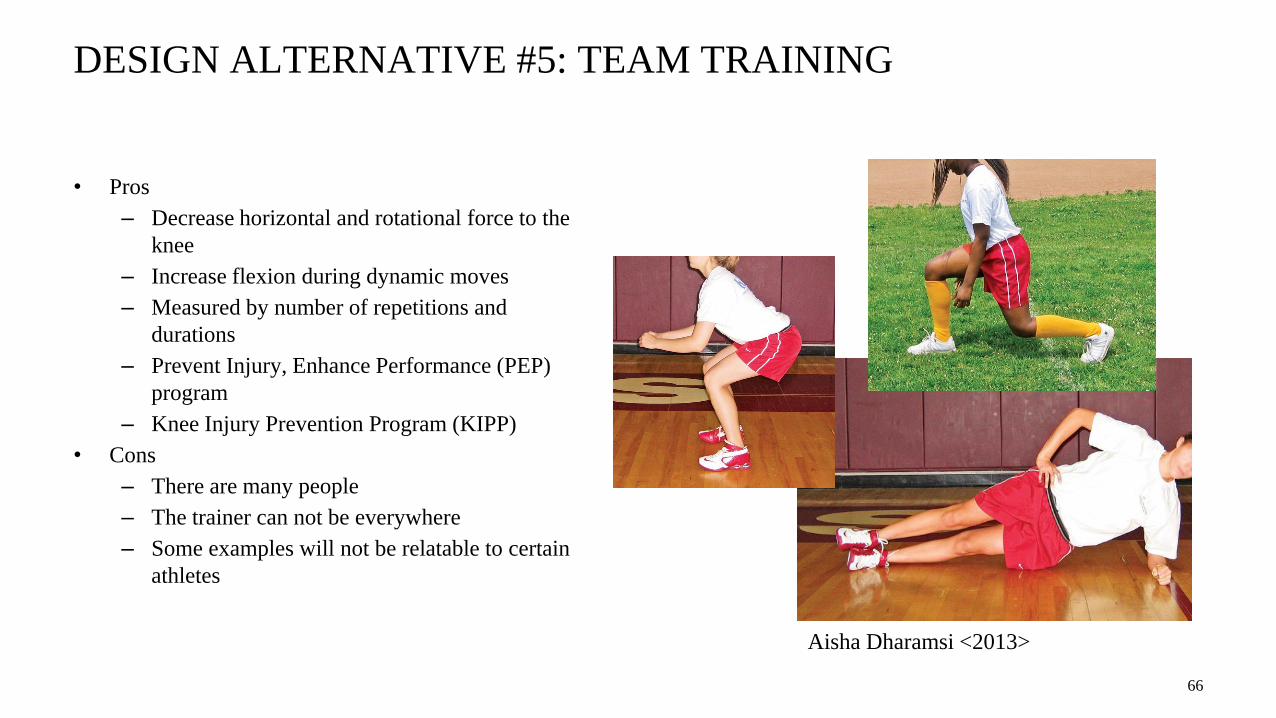
DESIGN ALTERNATIVE #5: TEAM TRAINING
• Pros
– Decrease horizontal and rotational force to the
knee
– Increase flexion during dynamic moves
– Measured by number of repetitions and
durations
– Prevent Injury, Enhance Performance (PEP)
program
– Knee Injury Prevention Program (KIPP)
• Cons
– There are many people
– The trainer can not be everywhere
– Some examples will not be relatable to certain
athletes
66
Aisha Dharamsi <2013>

DESIGN ALTERNATIVE #6: PERSONAL TRAINING
• Pros:
– Personalized exercise routine based on metrics
– Provides athlete with 1 on 1 training
– Better take into account q-angle and quad-
dominance
– Better takes care of athletes in varying thresholds
of likelihood of an ACLI
• Cons:
– Adds another time commitment
– Metrics needed to make best use
67
Al Lyman <2012>

DESIGN ALTERNATIVE #7: Virtual Reality Training
•Pros:
– Flexible to assign mitigation programs
to different student athlete
•Cons:
– Expensive
– Get dizzy
68
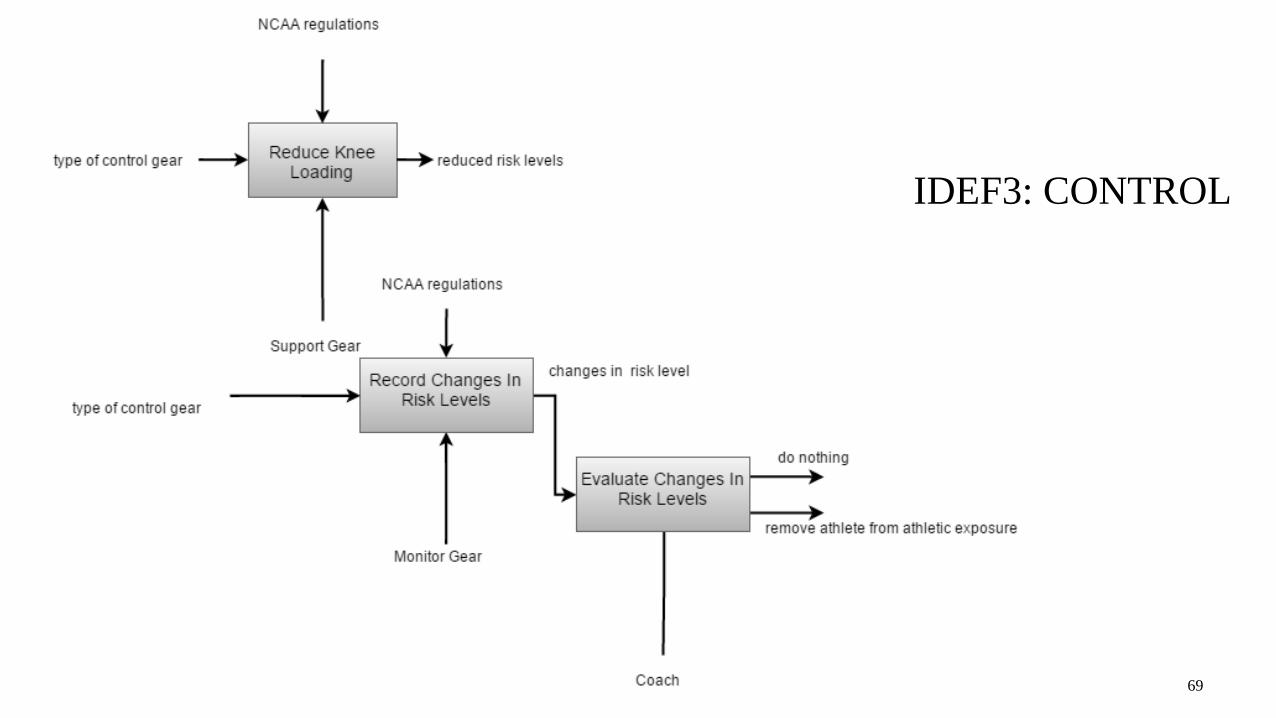
69
IDEF3: CONTROL
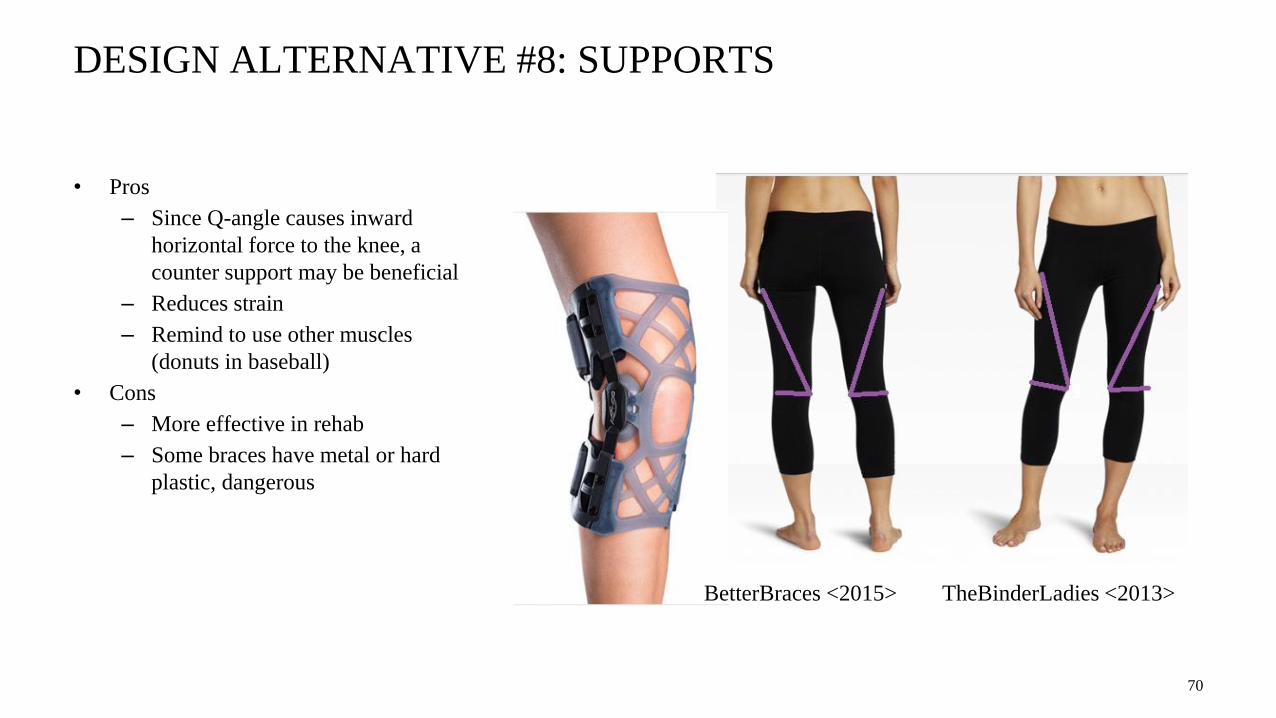
DESIGN ALTERNATIVE #8: SUPPORTS
• Pros
– Since Q-angle causes inward
horizontal force to the knee, a
counter support may be beneficial
– Reduces strain
– Remind to use other muscles
(donuts in baseball)
• Cons
– More effective in rehab
– Some braces have metal or hard
plastic, dangerous
70
BetterBraces <2015> TheBinderLadies <2013>

DESIGN ALTERNATIVE #9: HEART RATE MONITOR
• Pros
– simple to use and read data from
– portable, gives feedback to coach if the athlete
– safe, and does not have side effects
– Can wear during a sporting event
– Does not need to be used in a lab
• Cons
– Only monitor fatigue level/heart rate or knee
position
– Can be uncomfortable
71
Alibaba <2015>
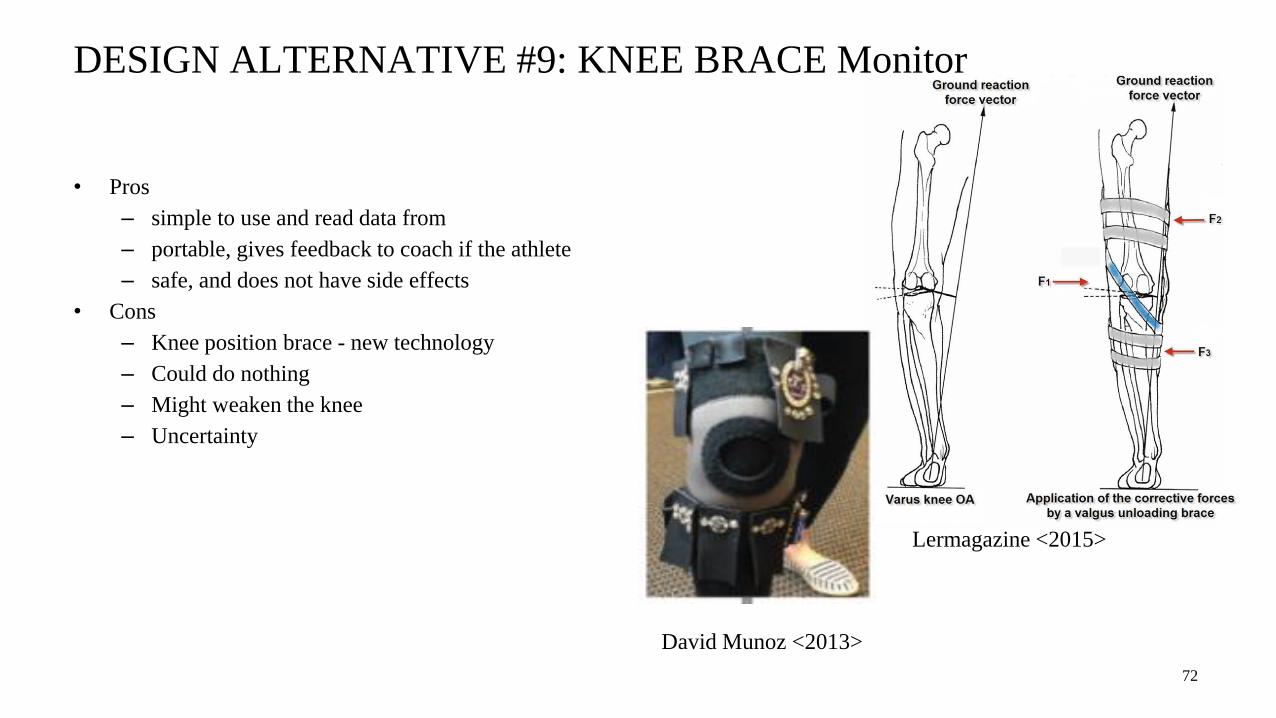
DESIGN ALTERNATIVE #9: KNEE BRACE Monitor
• Pros
– simple to use and read data from
– portable, gives feedback to coach if the athlete
– safe, and does not have side effects
• Cons
– Knee position brace - new technology
– Could do nothing
– Might weaken the knee
– Uncertainty
72
David Munoz <2013>
Lermagazine <2015>

TEST PLAN
73
Test Plan
Functional simulation of probability of ACL tear
Review of distributions for inputs used in simulation
Comparison of simulation outputs and known statistics

WBS
74

CRITICAL PATH FROM 10/26/2015 – 12/02/2015
75