design of bio-medical embedded system for tremor … · design of bio-medical embedded system for...
TRANSCRIPT

International Journal of Electronics Engineering Research.
ISSN 0975-6450 Volume 9, Number 7 (2017) pp. 1013-1026
© Research India Publications
http://www.ripublication.com
Design of Bio-Medical Embedded System for Tremor Analysis
Bhamidi Rama1
1Department of Electronics Technology Loyola Academy Degree & PG College
Old Alwal, Secunderabad 500 010 Telangana, India
I.V. Subba Reddy2*
2Department of Physics, GITAM University-Hyderabad Campus, Rudraram, Medak 502 329 Telangana, India
*Corresponding author
Abstract
Tremor is an involuntary action caused due to contraction of muscles. Doctors
diagnose the illness of a patient based on tremor, as it is considered to be an
important clinical symptom. Normally in medical diagnosis the method used
presently to identify the tremor is Electromyography recorders (EMG), these
readings depend on the emotions of the patient. So readings should be taken
when the patient is in calm and stable state. The instrument is not easily
portable because of its large size. These conditions definitely impose certain
limitations on the utility of EMG in the diagnosis of tremors in patients. To
overcome such limitations, the authors tried to propose and design a novel
embedded system in which the average intensity over the measurement
interval is recorded. The device is also highly portable for long-term
measurement and recording of tremor movements. The measured tremor
signals from MEMS sensor (accelerometer) through a Microcontroller are
displayed on a 2×16 LCD (liquid crystal display), at the same time the tremor
signals are transmitted to remote places, using MAX 232 IC and RS 232. A

1014 Bhamidi Rama and I.V. Subba Reddy
serial communication is achieved between Personal Computer and the
microcontroller. This microcontroller based portable embedded system for
tremor analysis is a very innovative development in bio-medical field which
can be used in the hospitals for diagnosis applications. The developed system
consists of a MEMS sensor (accelerometer), RF (radio frequency) module,
2×16 LCD display, and microcontroller with PC (personal computer)
interface. The MEMs sensor readings along X-axis and Y-axis for different
age groups are taken and a Statistical Software tool IBM SPSS 20.0
VERSION is used to analyze the readings. The overall power consumption of
the prototype board is also calculated and found to be 0.218 watthour.
Keywords: RF, MEMS, Microcontroller, Tremor, Patient, SPSS software,
power consumption.
I. INTRODUCTION
Tremor is one of the most important clinical symptom which must be taken care
during the diagnosis of the patients. Tremors also play a vital role in vitreoretinal
surgeries done by the doctors, because a small shake in hand will cause vision loss.
This disease occurs in persons having mental tensions or stress in their mind. Tremors
are also caused due to problems in some parts of the brain, which controls the muscles
in the body. Neurological disorders that produce tremors include multiple sclerosis,
stroke, traumatic brain injury and neurodegenerative disease. In these types of
disorders parts of brain stem gets damaged. The other cause is due to the use of some
types of drugs. The symptoms include a rhythmic shaking in the hands, arms, head
and legs. Some of them have difficulty in writing, drawing and problems in holding
things like utensils or fork. Some types of tremors are Parkinson’s, Essential,
Dystonic, Cerebellar, Psychogenic, Orthostatic tremors. Parkinson’s tremor is
commonly said to be of two types -Physiological and Pathological tremors.
Physiological tremors can occur due to various disorders such as tumors in brain and
also in patients who are addicted to drugs. Pathological tremors are due to hyper
thyroid and emotional stress.
Tremors cannot be cured. The treatment depends on accurate diagnosis of the cause.
Some types of tremors can be reduced, when the problem is identified at an early
stage, so that it disappears.
A three dimensional accelerometer sensor is used to measure the hand motion which
measures the motion of the hand using three single axis accelerometer made of
semiconductor [1]. The output of the sensor which is displacement is sensed using
differential capacitors.

Design of Bio-Medical Embedded System for Tremor Analysis 1015
The features of PSD process, based on the application of cumulants and polyspectra
representing different types of tremors and can stand as the basis for recognition
between them is done [2].
S.P.N.Singh [3] used an instrumented surgical tool, high-precision recordings of hand
tremor were taken during vitreoretinal microsurgery. The data obtained using a
compact, custom six-degree-of-freedom inertial sensing module is filtered and
analyzed to characterize the physiological hand tremor of the surgeon.
The magnitude and frequency of eye motions were recorded by taking photographs of
blood vessels of the eye. Simultaneous tracks of head and eye motions show that the
rapid eye motions are independent of head motion according to G.C.Higgins [4].
The oral dosage of caffeine and propanol effects is studied in order to reduce
physiological surgeon hand tremor. A test was done on 17 ophthalmic surgeons for 3
separate days and their hand tremor is measured using MADSAM, a high resolution
non contact position tracking system[5].
An attempt was made to check if propanol can decrease the surgical tremor and
anxiety in residents performing ocular microsurgery without causing any problem to
the patient, a 40mg medicine was induced 1 hour before performing the surgery and
found that it has a highly significant effect in decreasing the anxiety [6].
This paper reports [7] the development of a robotic system to perform a small scale
(sub millimeter) manipulation task requiring human judgment, sensory integration &
hand eye co-ordination.
This paper [8] describes the development and initial testing of a new and optimized
version of study hand manipulator of retinal surgeries. In this approach, Steady -hand
micromanipulation, tools are held simultaneously both in the operator’s hand and a
specially designed actively, Controlled robot arm. The robot controller senses the
forces and uses this information to provide smooth, trimmer free, precise positional
control and force scaling.
II. THE PROPOSED WORK
The proposed tremor monitoring system consists of a prototype board having
transmitter and receiver sections. When the device is switched on, the position of the
MEMS sensor is taken as the first value. The MEMs sensor is placed on the wrist of
the patient and readings are taken in four different positions-free position, without
load in the hand, with load in the hand and stretch position, along the X-axis and Y-
axis. If any tremors are observed, the sensed output is given to LM392 which has an
operational amplifier and voltage comparator inside the IC. The compared difference
is given to the microcontroller, Where it will perform the task that is specified in the

1016 Bhamidi Rama and I.V. Subba Reddy
program. Microcontroller will send the readings of the patient using the transmitter
and the LCD will display whether tremor has occurred or cured.It also displays
accurate analog values of X-axis and Y-axis and at the same time the microcontroller
will send the signals to RF transmitter. The RF transmitter will convert these signals
into radio frequency signals. These RF (Radio Frequency) signals are transmitted by
the transmitting antenna.
The signals which are transmitted by the transmitting antenna will be received by
receiving antenna and the data will be given to the RF receiver. The chosen pair of RF
transmitter and RF receiver will consist of same address lines, data lines and
frequency. The range of communication between transmitter and receiver is 50-100
meters. The received signals are given to the microcontroller. Microcontroller will
perform the task according to the developed code. SPSS 20.0 software is used to
analyze a sample of 251 readings taken on patients of different age groups and
observed the impact of tremor in four different positions.
III. SYSTEM FOR IMPLEMENTATION
It consists of two sections- transmitter and receiver section, the power consumed by
these two sections is calculated as 218.44 mW. It is the minimum power utilized even
when the equipment is used for 1 hour, the energy consumed will be 0.218 Watt hour.
A. Transmitter Section The power supply section will convert 230 V AC to 5 V DC which is required for the
microcontroller and other components. The MEMS sensor (MMA 7361- 3 axial
accelerometer) will sense 1/10th degree of variation in 3 dimensional plane. It is a
digital sensor which has got an inbuilt A/D converter and its output value is given to
the LM392. A comparator has been set with a reference voltage of 5 V and it is used
to compare the voltages that are acquired from MEMS sensor. Hence the voltages are
compared and given to the microcontroller (AT89S52). Microcontroller performs all
the tasks in accordance with the program. Microcontroller used is a 40 pin IC, in
which 32 pins are the input/output lines. The LCD display is used to display the status
of the patient which is acquired from the microcontroller and at the same time, the
signals are transmitted from RF transmitter. The frequency of RF transmitter is 434
MHz. The RF transmitter consists of IC-HT12E which is used to encode the signals.
This IC is capable of encoding 12 bits.

Design of Bio-Medical Embedded System for Tremor Analysis 1017
Fig.1. Block diagram of Transmitter
B. Receiver Section The power supply section will provide 5 V DC to the microcontroller and other
components in the receiver section. The transmitted signals from the RF transmitter
are received by the RF receiver and given to the microcontroller (AT89S52). The
frequency of RF receiver is 434 MHz. This RF receiver consists of HT12D IC which
is used to decode the signals. This IC is capable of decoding 12 bits. The chosen pair
of transmitter and receiver section have same address lines, data lines and frequency.
Here it has 12 address lines and 4 data lines. By using MAX 232 IC and RS 232
cable, data is transmitted between microcontroller and Personal Computer using serial
communication.
Fig.2. Block diagram of Receiver

1018 Bhamidi Rama and I.V. Subba Reddy
IV. HARDWARE
The prototype development board reveals the entire hardware of an embedded
system.
Fig.3. Prototype development board
V. STATISTICAL ANALYSIS
Samples are collected for different age groups of patients in the hospital having
different problems. The readings are taken in four different positions of the right
hand. The readings consists of analog-X value and analog-Y values. Analysis is done
on both X-axis and Y-axis readings, which are taken for different combinations.
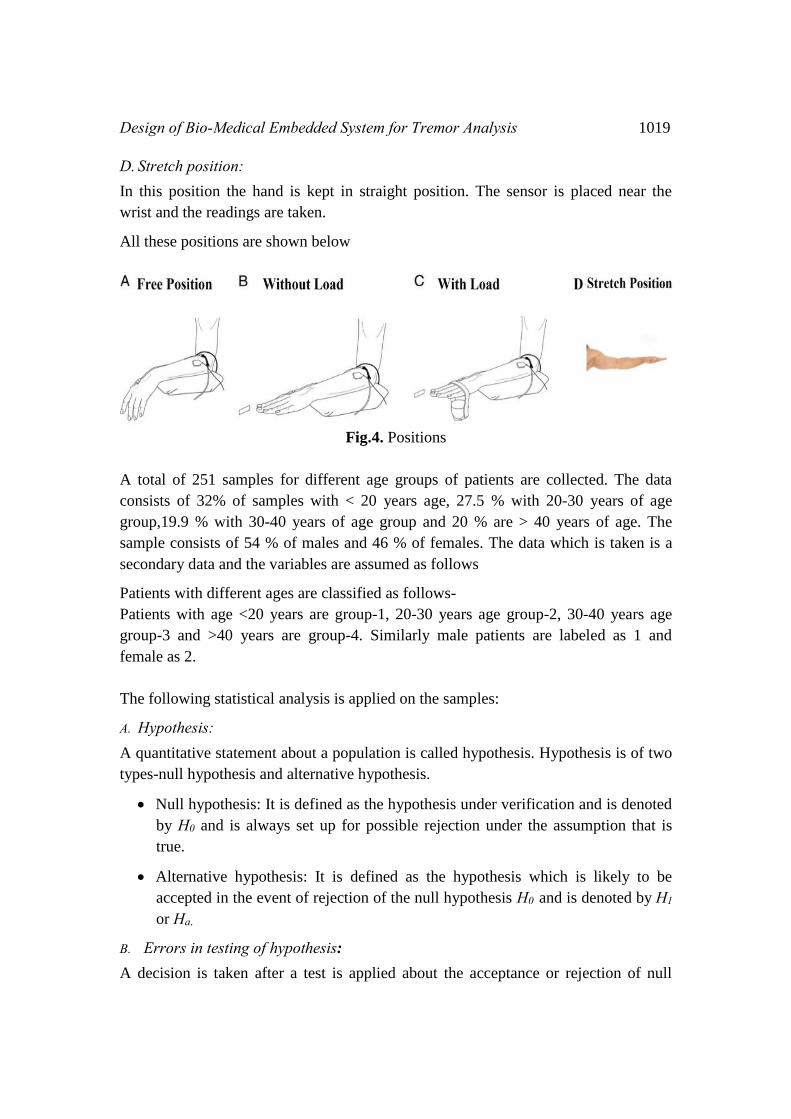
A. Free position: In this position the elbow is at rest position and from the wrist the fingers are left free.
The sensor is placed at the wrist and the readings are taken.
B. Without load position:
In this position the elbow is at rest position and from the wrist the fingers are
stretched. The sensor is placed near the wrist and the readings are taken.
C. With load position: In this position the elbow is at rest position and load is added near the palm. The
sensor is placed near the wrist and the readings are taken.
Design of Bio-Medical Embedded System for Tremor Analysis 1019
D. Stretch position: In this position the hand is kept in straight position. The sensor is placed near the
wrist and the readings are taken.
All these positions are shown below
Fig.4. Positions
A total of 251 samples for different age groups of patients are collected. The data
consists of 32% of samples with < 20 years age, 27.5 % with 20-30 years of age
group,19.9 % with 30-40 years of age group and 20 % are > 40 years of age. The
sample consists of 54 % of males and 46 % of females. The data which is taken is a
secondary data and the variables are assumed as follows
Patients with different ages are classified as follows-
Patients with age <20 years are group-1, 20-30 years age group-2, 30-40 years age
group-3 and >40 years are group-4. Similarly male patients are labeled as 1 and
female as 2.
The following statistical analysis is applied on the samples:
A. Hypothesis: A quantitative statement about a population is called hypothesis. Hypothesis is of two
types-null hypothesis and alternative hypothesis.
Null hypothesis: It is defined as the hypothesis under verification and is denoted
by H0 and is always set up for possible rejection under the assumption that is
true.
Alternative hypothesis: It is defined as the hypothesis which is likely to be
accepted in the event of rejection of the null hypothesis H0 and is denoted by H1
or Ha.
B. Errors in testing of hypothesis:
A decision is taken after a test is applied about the acceptance or rejection of null

1020 Bhamidi Rama and I.V. Subba Reddy
hypothesis against an alternative hypothesis. The decisions are of four types.
But the first two decisions are called errors in testing of hypothesis
i) Type-I error: It is the error committed if the null hypothesis (H0) is true but the test
rejects.
ii) Type-II error: It is the error committed if the null hypothesis (H0) is false but the
test accepts.
Level of significance:
The level of significance is denoted by α and is said to be the maximum probability of
committing type-I error
α = P (Committing Type-I error)
= P (H0 is rejected when it is true)
Power of the test:
The power of test is defined as the probability of rejecting a false hypothesis and is
denoted by 1-β.
Power of the test = P (H0 is rejected when it is false)
= 1- P (H0 is accepted when it is false)
= 1- P (Committing Type-II error)
= 1- β
A test in which both α and β are small and kept at minimum level is considered
desirable. If the sample size is increased then both α and β can be reduced.
C) One tailed and two tailed tests:
A test with the null hypothesis H0 : θ=θ0 against the alternative hypothesis H1 : θ≠θ0,
it is called a two tailed test.
A test with the null hypothesis H0: θ=θ0 against the alternative hypothesis H1: θ>θ0
(right tailed alternative) or H1: θ<θ0 (left tailed alternative) is called one tailed test.
D) Procedure for testing of hypothesis:
Set up a null hypothesis i.e. H0 : θ=θ0.
Set up a alternative hypothesis i.e. H1 : θ≠θ0 or H1: θ>θ0 or H1 : θ<θ0
Choose the level of significance, α.
Select appropriate test statistic Z. Select a random sample and compute the test

Design of Bio-Medical Embedded System for Tremor Analysis 1021
statistic. Calculate the tabulated value of Z at α % , Zα
Compare the test statistic value with the tabulated value at α % and make a
decision whether to accept or to reject the null hypothesis.
E) Large sample tests:
The sample size which is greater than or equal to 30, is called as large sample and the
test depending on large sample is called large sample test.
The assumption made while dealing with the problems relating to large samples are
Assumption-1: The random sampling distribution of the statistic is approximately
normal.
Assumption-2: Values given by the sample are sufficiently closed to the population
value and can be used on its place for calculating the standard error (SE) of the
statistics.
F) Large sample test for difference between two means: If two random samples of
size n1 and n2 are drawn from two normal populations with means μ1 and μ2, variances
σ12 and σ2
2, respectively.
Let 1x and 2x be the sample means for the first and second populations , respectively.
Then 1x ~
1
2
11 n
σ,μN equ. 1
and 2x ~
2
2
22 n
σ,μN equ. 2
Therefore 1x - 2x ~
2
2
2
1
2
121 ,
nnN
equ. 3
For this test the null hypothesis is 0: 21210 H against the two sided
alternative 211 : H . Now the test statistic
S.E(t)
E(t)tZ ~ 10,N =
)xxS.E()xxE()xx(
21
2121
equ. 4
)xxS.E(
)μ(μ)xx(Z21
2121
~ 1,0N
2
2
2
1
2
1
21
nσ
nσ
)xx(Z
~ 10,N
equ. 5
[Since μ1-μ2 = 0 from H0], now calculate Z

1022 Bhamidi Rama and I.V. Subba Reddy
Then find out the tabulated value of Z at α % i.e. Z If Z >
Z , reject the null
hypothesis H0, If Z <Z , accept the null hypothesis H0.
The following tests are done for various combinations of data taken
t-test
This test gives the significant difference between two means. It is calculated using
ratio of difference between two dispersion of values. The t-test is positive if the first
mean is larger than second and negative if it is smaller.
f-test
It is a technique to test the significance between two variances at a time. It is the
squares of two scaled sums of squares reflecting different sources of variability. The
advantage of f-test is that there is no needs to pre specify which treatments are to be
compared and need not be adjusted for multiple comparisons.
RESULTS
The variation for different positions of hand is shown in table. 1
Table 1.
S. No. Hypothesis (t-test) Significant
values
Conclusion
1(a) H1: There is a significant difference between the
variables with load X and without load X
0.001 Reject H0
1(b) H0:Thereis nosignificant difference between the
variables with load Y and without load Y
0.134 Accept H0
2(a) H0: There is no significant difference between
the variables with load X and free position X
0.194 Accept H0
2(b) H1: There is a significant difference between the
variables with load Y and free position Y
0.004 Reject H0
3(a) H1: There is a significant difference between the
variables with load X and stretch position X
0.02 Reject H0
3(b) H0: There is no significant difference between
the variables with load Y and stretch position Y
0.976 Accept H0
4(a) H1: There is a significant difference between the
variables free position X and without load X
0.022 Reject H0

Design of Bio-Medical Embedded System for Tremor Analysis 1023
4(b) H1: There is a significant difference between the
variables free position Y and without load Y
0.046 Reject H0
5(a) H0: There is no significant difference between
the variables without load X and stretch position
X
0.337 Accept H0
5(b) H0: There is no significant difference between
the variables without load Y and stretch position
Y
0.302 Accept H0
6(a) H0: There is no significant difference between
the variables free position X and stretch position
X
0.196 Accept H0
6(b) H1: There is a significant difference between the
variables free position Y and stretch position Y
0.005 Reject H0
Table. 2 shows the variation for different positions with respect to different age
groups.
Table 2
Sr.
No.
Hypothesis
(f-test)
Significant
Values
Conclusion
1(a) H0: There is no significant difference between the
variables with load X and age
0.089 Accept H0
1(b) H0: There is no significant difference between the
variables with load Y and age
0.275 Accept H0
2(a) H0: There is no significant difference between the
variables without load X and age
0.181 Accept H0
2(b) H0: There is no significant difference between the
variables without load Y and age
0.275 Accept H0
3(a) H0: There is no significant difference between the
variables free position X and age
0.498 Accept H0
3(b) H1: There is a significant difference between the
variables free position Y and age
0.006 Reject H0
4(a) H0: There is no significant difference between the
variables stretch position X and age
0.169 Accept H0
4(b) H0: There is no significant difference between the
variables stretch position Y and age
0.290 Accept H0

1024 Bhamidi Rama and I.V. Subba Reddy
Duncan test divides the entire data into two or three homogeneous groups. Identical
groups or subsets are placed at one place and different groups or subsets are placed at
another place. The graph shown below is based on Duncan test.
Fig. 5. Graphical representation of age on X-axis and variances of free position along
Y-axis based on Duncan test.
IV. CONCLUSIONS
This device is a low cost, highly portable device and can be used for remote
applications and also in order to detect tremors for tele-medicine purpose. This work
helps the doctors to monitor patients who are in Coma, as mild movements in the
body can be detected and sent on the doctors PC. It helps the doctors to identify how a
patient is responding to the treatment. The device is designed in such a way that the
sensor used to identify tremors have very small signal to noise ratio. The size of
MEMs sensor is compact and its performance is good. So this work is basically used
where tremors are to be monitored, recorded and analyzed for the treatment of
patients. It is found that there is an impact on patients of different age groups .A few
relations that take into consideration X and Y movements were identified, which
helps in detecting tremors and measuring their intensity.
A further improvement in this work can be done to increase the speed of data transfer
by using USB port instead of RS232 connected between PC and microcontroller and

Design of Bio-Medical Embedded System for Tremor Analysis 1025
obtaining the frequency of deviation along the control group and effected group using
signal processing.
V. ACKNOWLEDGEMENTS
The authors are thankful to the Saibaba charitable trust Hospital, Malkajgiri-
Secunderabad and also to our esteemed professor Dr. Y. Narsimha Murthy, to carry
out the research work with his valuable suggestions.
REFERENCES
[1] Y. Dileep Kumar and A. M.Prasad, “Mems Accelerometer System for Tremor
Analysis,” International Journal of Advanced Engineering and Global
Technology Vol-2, Issue-5, ISSN No: 2309-4893, May 2014.
[2] A. Michalski, and A. Chwaleba, “Mathematical approach to tremor recognition
in extrapyramidal disease,” Instrumentation & Measurement Magazine,
IEEE (Volume:6, Issue:1 ) ISSN: 1094-6969 Mar.2003.
[3] S. P. N Singh, and C. N. Riviere, "Physiological Tremor Amplitude during
Retinal Micro Surgery," Bioengineering Conference 2002, Proceedings of the
IEEE 28th Annual Northeast, Philadelphia, pp. 171-172, August 2002.
[4] G. C. Higgins, and K. F. Stutlz, "Frequency and Amplitude of Ocular Tremor,"
Journal of Optical Society of America, vol. 43, no. 12, pp. 1136-1140, 1953.
[5] M. U. Humayun, R. S. Rader, D. J. Pieramici, C. C. Awh, and E. de Juan,
Jr., "Quantitative Measurement of the Effects of Caffeine and Propranolol
on Surgeon Hand Tremor," Arch. Opthalmol., vol. 115, pp. 371- 374,
March 1997.
[6] M. J. Elman, J. Sugar, R. Fiscella, T. A. Deutsch, J. Noth, M. Nyberg, K.
Packo, and R. J. Anderson, "The Effect of Propranolol versus Placebo on
Resident Surgical Performance," Trans. Amer. Opthalmol. Soc., vol.96, pp. 283-
291, 1998.
[7] R. H. Taylor, P. S. Jensen, L. L. Whitcomb, A. Barnes, R. Kumar, and D.
Stoianovici, "A Steady-hand Robotic System for microsurgical Augmentation,"
The International Journal of Robotics Research, vol. 18, no. 12, pp. 1201-1210,
December 1999.
[8] B. Mitchell, J. Koo, I. Iordachita, P. Kazanzides, A. Kapoor, and J. Handa,
"Development and Application of a New Steady-hand Manipulator for Retinal
Surgery," IEEE Conference on Robotics and Automation, Rome, Italy, pp. 623-
629, April 2007.

1026 Bhamidi Rama and I.V. Subba Reddy
AUTHORS
Dr. I.V. Subba Reddy was born in India in 1975.He Completed his
B. Sc., M. Sc., and Ph. D. Currently he is working as Associate
Professor in Department of Physics, GITAM University Hyderabad.
Dr. Reddy received several national level fellowships and got the
prestigious Marie-Curie fellowship for Post Doctoral
Researcher/Adjunct Professor in the year 2008 from the University of Lodz, Poland.
Research Scientist/Visiting Professor in the year 2007 at Kyoto University, Japan and
Post Doctoral Researcher in the year 2005 from National Central University, Taiwan.
He received Chanakya Award under most promising Young Visionary category and is
a National Award given by Public Relations Council of India (PRCI) in 2013.
Bhamidi Rama has completed B.Sc, M.Sc App. Electronics and
M.Phil Electronics degrees. Currently she is working as Head of
the Dept. of Electronics Technology at Loyola Academy degree
& PG College .She has a wide teaching experience since 1995.
Worked as Controller of Exams for the academic year 2010-2012
at Loyola Academy Degree and PG College. She is receiving the best department
award from management for past 6 years. Coordinator for certificate courses
sponsored by UGC. As a chair person for Board of Studies she played a key role in
enhancing the syllabus according to the industrial needs. Her BRAIN CHILD is LAB
TO SCHOOL program, where practical’s of physics and chemistry of 9th &10th class
are taken to prepare models. These are done under her guidance by degree students
and are displayed at government schools. Her research areas are Microcontroller
based systems and