design of fast ion conducting cathode materials for grid
TRANSCRIPT

7506 | Phys. Chem. Chem. Phys., 2017, 19, 7506--7523 This journal is© the Owner Societies 2017
Cite this:Phys.Chem.Chem.Phys.,
2017, 19, 7506
Design of fast ion conducting cathode materialsfor grid-scale sodium-ion batteries†
Lee Loong Wong, Haomin Chen and Stefan Adams*
The obvious cost advantage as well as attractive electrochemical properties, including excellent cycling
stability and the potential of high rate performance, make sodium-ion batteries prime candidates in the
race to technically and commercially enable large-scale electrochemical energy storage. In this work,
we apply our bond valence site energy modelling method to further the understanding of rate
capabilities of a wide range of potential insertion-type sodium-ion battery cathode materials. We
demonstrate how a stretched exponential function permits us to systematically quantify the rate
performance, which in turn reveals guidelines for the design of novel sodium-ion battery chemistries
suitable for high power, grid-scale applications. Starting from a diffusion relaxation model, we establish a
semi-quantitative prediction of the rate-performance of half-cells from the structure of the cathode
material that factors in dimensionality of Na+ ion migration pathways, the height of the migration
barriers and the crystallite size of the active material. With the help of selected examples, we also
illustrate the respective roles of unoccupied low energy sites within the pathway and temperature
towards the overall rate capability of insertion-type cathode materials.
1. Introduction1.1. Background and motivation
Novel large-scale electrochemical energy storage systems withrevolutionary energy density and power performance are neededto manage power grids based on intermittent renewable sourcesand to put urban mobility on a sustainable basis. Among thetargets for large-scale electrochemical energy storage systems:� high energy density� high rate performance� high energy efficiency (i.e. low overpotential)� long cycle (and shelf) life� high safety, reliability and abuse tolerance� low costthe low cost and earth abundance of sodium is commonly
cited as the key motivation for a transition from Li- to Na-basedcell chemistry, especially in the context of large scale energystorage systems. Still a large fraction of this renewed explora-tion of sodium-based batteries just mimics approaches thatproved successful in Li-ion battery (LIB) technology. Relying onsodium analogues of the conventional layered transition metaloxide cathode materials is, however, problematic as far as itconcerns cathode materials containing relatively high cost tran-sition metals such as Co, both as it defies the purpose of cost
reduction and as it overlooks inherent differences in reactionmechanisms of sodium analogues of the classical layeredlithium transition metal oxides. In this work, we discuss a moresuitable approach in designing Na-ion battery (NIB) materialsand NIB systems taking advantage of peculiar properties ofsodium and we derive a method to predict the rate performanceof insertion cathode materials directly from the crystal structure.
1.2. External design constraints for sodium-ion batterymaterials
The cost advantage of Na will only translate into commerciallyviable large-scale NIBs, if the concept of earth-abundance isconsistently applied throughout the system design. From theabundance of elements in the Earth’s upper crust seen in Fig. 1the design of NIB electrode materials should concentrate on themost abundant transition metals Fe, Ti and Mn. Lower priorityshould be given to the less abundant first row transition metalsV, Cr or the most abundant second row transition metal Zr.Fig. 1 particularly emphasizes that relying on Co oxides will notbe sustainable and a transition to Ni or Cu offers only a marginaladvantage. On the other hand, Earth abundance is only onecondition for a low-cost material, and even if this is met, ascalable low cost processing technology is needed to realize thelow-cost potential.
In short, rather than copying what worked for LIBs, arational design of NIB materials has to focus on peculiaritiesof Na compounds. Based on the strong potential for fast ionmobility, the requirement to limit volume changes during
Department of Materials Science and Engineering, National University of Singapore,
Singapore 117575. E-mail: [email protected]
† Electronic supplementary information (ESI) available. See DOI: 10.1039/c7cp00037e
Received 3rd January 2017,Accepted 21st February 2017
DOI: 10.1039/c7cp00037e
rsc.li/pccp
PCCP
PAPER
Ope
n A
cces
s A
rtic
le. P
ublis
hed
on 2
1 Fe
brua
ry 2
017.
Dow
nloa
ded
on 1
1/18
/202
1 8:
18:3
9 A
M.
Thi
s ar
ticle
is li
cens
ed u
nder
a C
reat
ive
Com
mon
s A
ttrib
utio
n-N
onC
omm
erci
al 3
.0 U
npor
ted
Lic
ence
.
View Article OnlineView Journal | View Issue

This journal is© the Owner Societies 2017 Phys. Chem. Chem. Phys., 2017, 19, 7506--7523 | 7507
cycling, stability and energy density considerations we expect thatinsertion into open framework polyanionic oxides, oxyfluoridesor oxynitrides containing abundant transition metals yields themost promising class of NIB electrode materials.
Here, we will thus analyse for a range of such polyanionic NIBcathode materials how suitable the respective structure type is forfast Na+ mobility and hence for high rate performance insertion-typeNIBs. It will be shown that a stretched exponential functiondescription yields a rational quantitative measure of rate capabilitiesfor insertion-type cathode materials and allows to rationally quantifythe relative influence of migration barrier height, pathway dimen-sionality, the fraction of unoccupied low energy sites in the pathwaysas well as particle size and operation temperature on the achievablerate performance.
1.3. SWOT analysis of Na cathode materials and NIB systemdesign
Considering strengths and weaknesses of Na compounds forapplications in NIBs in comparison to LIB materials, the some-what lower cell voltage of NIBs slightly affects the achievableenergy densities, but will also tend to enhance both cycle andshelf life of NIBs (as well as to a minor extent battery safety) as itmoderates the requirements for the electrochemical window ofthe electrolyte. On the other hand, the larger size of Na+ tends toincrease the volume changes on cycling insertion compounds.This is inevitable for layered transition metal oxides wheresodiation/desodiation corresponds to adding or removing entiresodium layers in the crystal structure (and can only be mitigatedby restricting the battery capacity to a partial utilisation ofthe available Na). Moreover, the rate-capability of layered NIBcathode materials is often seriously hampered by Na+ orderingas the intra-layer Na+–Na+ distance becomes a crucial structure-controlling factor.2 In polyanion framework compounds, whereNa+ ions may be more evenly distributed over the unit cell
volume, both effects will be much less of a concern, as thesodiation corresponds to filling otherwise vacant channels in apersisting three-dimensional framework that defines the cellvolume within rather narrow boundaries. Moreover, the highercontribution of host guest interactions together with weakerNa+–Na+ interactions reduces the hazard of immobilising Na+
ordering. Thus, it appears straightforward to concentrate thesearch for NIB electrode materials on insertion type compounds,especially if a long cycle life is a key design target besides a highrate performance.
The higher atomic weight of sodium in combination withthe above-mentioned slightly higher anode potential obviouslyimply that NIBs cannot exceed LIBs in terms of gravimetricenergy density but can only come close to these. It is, however,often overlooked that NIBs have a strong potential to outshineLIBs in terms of rate performance: the higher atomic number andlarger size of Na+ ions also mean that Na+ are more polarizableand less polarizing than Li+. In addition, the motion of the heavierNa+ is less coupled to vibrations in the immobile oxide substruc-ture and hence less harmonic than for Li+. In total this meansthat, despite the requirement of larger size bottlenecks for ionicmotion, alkali ion motion through complex oxides is typicallyfaster in Na compounds than in Li analogues. Provided that thecharge carrier mobility within the electrode material controls theoverall rate performance of the system, this mobility advantageshould directly translate into opportunities for applicationsrequiring high rate performance. It is generally assumed thatfor batteries relying on insertion electrode materials the chargecarrier mobility inside the electrode material is indeed the ratelimiting factor (see e.g. ref. 3 and Scheme 1).
The mobility of electrons in mixed-conducting electrodematerials is often intrinsically higher and, if not, can beenhanced by conductive additives such as carbon coating.Therefore, the mobility of the inserted (or removed) cationstypically controls the rate performance and thus the potentialof a phase as a high rate performance electrode material. Assuggested by Kalantarian et al.4 an exception might be extremelynanosized materials with poor electronic conductivity, forwhich they qualitatively suggest from DFT calculations thatcathodes will show high rate performance if the dischargedstructure acts as p-type and the charged one as n-type semi-conductor, while for the reverse case only lower current ratesshould be sustained.
Fig. 1 Atom fraction of the lighter chemical elements in Earth’s uppercontinental crust vs. atomic number (data averaged from two compilationsin ref. 1). Transition metal elements are connected by a broken line as aguide to the eye. The abundant elements shown in green should be in thefocus of a sustainable materials design, while less common elementsshown in red and violet should be avoided in designing NIB materialsand the availability of elements of average abundance (shown in orange)may become a limiting factor for low cost large-scale applications.
Scheme 1 Interrelation of reversible energy storage mechanisms inNa-based batteries with system performance and rate limiting processes.
Paper PCCP
Ope
n A
cces
s A
rtic
le. P
ublis
hed
on 2
1 Fe
brua
ry 2
017.
Dow
nloa
ded
on 1
1/18
/202
1 8:
18:3
9 A
M.
Thi
s ar
ticle
is li
cens
ed u
nder
a C
reat
ive
Com
mon
s A
ttrib
utio
n-N
onC
omm
erci
al 3
.0 U
npor
ted
Lic
ence
.View Article Online

7508 | Phys. Chem. Chem. Phys., 2017, 19, 7506--7523 This journal is© the Owner Societies 2017
In this work, we discuss the rate performance assumingthat it is limited by ion mobility in the cathode material, whichwill be the default case in Na or Li-based batteries using metalanodes as well as in most practical Li- and Na-ion batteries. Theresulting findings will remain applicable for cases, where therate limiting process concerns an insertion-type anode.
1.4. Historical measures of rate performance
A few decades after the introduction of lead acid batteriesPeukert5 suggested a simple power law
t ¼ I1
I
� �k
t1 (1)
to approximately characterize the dependence of the dischargetime t of a lead acid battery on the drawn current, I, using thedischarge time t1 at a current of I1 = 1 A as a reference point.The deviation of the Peukert exponent k Z 1 from the idealvalue k = 1 (i.e. from a current–independent capacity) thenserved as a measure for the rate capability of the battery. Eqn (1)can be rearranged to yield the dependence of the relative capacityQ on the discharge current I
QðIÞQ1ðI ¼ 1 AÞ ¼
I
I1
t
t1¼ I1
I
� �k�1(2)
It is immediately obvious that eqn (2) can only be appliedover a limited range of currents I 4 I1 as the relationship wouldyield a nonsensical increase of the capacity to infinity whenapplied to arbitrarily small currents. Despite its obvious short-comings, Peukert’s law is still widely used in technical litera-ture both for lead acid batteries (often using different referencecurrents) and even for a wide range of other battery chemistriesthough it is commonly known that it does not yield a quanti-tative prediction of their rate performance.6 As will be shownbelow in Section 3.1, Peukert’s law is not only imprecise but yieldsa fundamentally incorrect rate dependence of the capacity for thetechnologically relevant range of discharge rates of insertionelectrode batteries and can only serve as a crude approximationfor extremely high or low rates.
Thus attempts to expand or amend the Peukert equationto mitigate deviations (cf. ref. 7) appear questionable andwe here aim to introduce a more rational way to quantify therate performance starting from the insight that the relevantrate-limiting processes are diffusion relaxation processes. Theapproach is extendable to the less common case that bothcharge transfer processes at the electrode surface and diffusionrate affect the overall rate performance in different rate domains.While the theory of frequency dependent relaxation processesis well established in the context of diffusion controlled impe-dance, as well as to explain diffusion effects on NMR or inelasticneutron spectroscopy, (for reviews see e.g. Dieterich et al.8 or Fu9)to the best of our knowledge the approach seems to have not yetbeen utilized to systematically derive a rational and quantitativecharacterization of the C-rate dependence of capacities forintercalation batteries.
2. Computational methods2.1. Bond-valence site energy method
Migration pathways for mobile Na+ are analysed both fromliterature crystal structure data and from series of snapshots ofmolecular dynamics (MD) simulations by our bond valence siteenergy approach, as discussed elsewhere.10–12 In brief, thismodelling of pathways for mobile alkali ions A as regions oflow bond valence site energy EBVSE(A) has been demonstrated tobe a simple and reliable way of identifying transport pathwaysin local structure models,12,13 provided that the local structuremodel captures the essential features of the real structure.While bond valences sA–X = exp[(R0,A–X � RA–X)/bA–X] and hencethe bond valence sum mismatch |DV| are often expressed inarbitrary ‘‘valence units’’, they can, as elaborated by ourgroup,14–16 be linked to an absolute energy scale by expressingthe bond valence as a Morse-type interaction energy betweencation Na+ and anion X.
EBVSEðNaÞ ¼Xx
D0
XNi¼1
sNa�Xsmin;Na�X
� �2
� 2 � sNa�Xsmin;Na�X
!" #þ Erepulsion
(3)
The required bond valence parameters are taken from oursoftBV database as published in ref. 15. Migration pathwaysfor Na+ are analysed as regions of low bond valence site energyEBVSE(Na) in grids spanning the structure model with a resolu-tion of ca. (0.1 Å).3 Starting from an analysis of local minimaand saddle points of EBVSE(Na), the grid analysis utilizes amodified Dewar, Healy and Stewart (DHS)-type path findingalgorithm to identify low energy paths connecting the local siteenergy minima.17
For the purpose of analysing EBVSE(Na) landscapes, Coulombrepulsions are considered only between mobile and immobilecations. Coulomb attraction terms are generally integrated intothe Morse attraction term. The charge screening is based on anerror function complement term
ErepulsionðA�BÞ ¼qAqB
RA�B� erfc RA�B
f � rA þ rBð Þ
� �(4)
where rA, rB are the covalent radii of the respective cation (oranion) pair A, B and f is a factor (typically of the order f E 0.75)that is empirically linked to the electronegativity distribution inthe respective crystal structure.18 In practice our software toolvaries f for each compound before calculating the pathways toachieve ambient pressure when using the softBV forcefield. Dueto the favourable convergence of the chosen interaction modelsa relatively short cut-off radius of 10 Å can be used enhancingcomputational efficiency. Both the Morse-type interactionsand the Coulomb-repulsion terms are force-shifted to ensurezero energy gradients at the cut-off distance. It may be notedthat the same force-field parameters can also be used toconduct MD simulations of the materials, though this requiresthat Coulomb repulsions between all cation–cation and anion–anion pairs are considered. As an example, MD simulationsof Na108Fe90(SO4)144 have been conducted with the softwareGULP19 as implemented in Materials Studio 6.0.20 Details of
PCCP Paper
Ope
n A
cces
s A
rtic
le. P
ublis
hed
on 2
1 Fe
brua
ry 2
017.
Dow
nloa
ded
on 1
1/18
/202
1 8:
18:3
9 A
M.
Thi
s ar
ticle
is li
cens
ed u
nder
a C
reat
ive
Com
mon
s A
ttrib
utio
n-N
onC
omm
erci
al 3
.0 U
npor
ted
Lic
ence
.View Article Online

This journal is© the Owner Societies 2017 Phys. Chem. Chem. Phys., 2017, 19, 7506--7523 | 7509
the simulation method and results for this compound can befound in our recent separate publication.21
3. Results3.1. Fitting of experimental rate capability data
As a basis for our study we gathered rate performance data forabout 25 NIB cathode materials from the recent literature22–47
focusing on room temperature data for composite electrodesystems, where the mobility of electronic charge carriers shouldbe high enough to be not rate limiting (either due to an intrinsi-cally high electronic conductivity of the active cathode material orby carbon coating). Data for carbon-coated materials are thereforepreferably adopted in this compilation.
At this stage, we also avoided materials with median particlesizes below 40 nm to ensure that the rate performance at highC-rate is primarily limited by bulk ionic transport. Fig. 2 showsa compilation of the relative capacity for some of the polyanion-type Na+ ion insertion cathode materials used in this study vs.the logarithm of the rate of discharge. Here the relative capacityQrel(C) is defined as the actual specific capacity Q of a cathodematerial at a given C-rate divided by its theoretical specificcapacity Qtheoretical. We found in general similar trend in all therate performances data – most compounds show considerablerelative capacity at low C-rate, but eventually exhibit rapid fadingwhere relative capacity drops to about 1/3 for every order ofmagnitude increase in C-rate. A qualitative approach might thus,as shown in Fig. 2, categorize the materials into the order ofmagnitude of the C-rate, where the rapid capacity fading sets in.
Peukert’s law is – as mentioned above – found to be funda-mentally unsuitable for a quantitative modelling of diffusionlimited rate performance. In the plot of Qrel vs. logarithm ofthe C-rate of Fig. 2 any power law such as Peukert’s law willinvariably suggest a convex function, while experimental data
consistently suggest a concave or sigmoidal shape of the Qrel(C)relationship. Thus Qrel(C) cannot be fitted meaningfully byeqn (2). For all the displayed systems, it is however possibleto fit the variation of Qrel(C) with reasonable precision whenassuming a stretched exponential relationship
QrelðCÞ ¼QðCÞ
Qtheoretical¼ 1� að Þ � exp � C
W
� �b" #
(5a)
with a stretching exponent b typically in the range 0.5 r b r 1and a ‘‘relaxation frequency’’ W that assumes values of the order0.04 to 200 h�1. Since the C-rate C for galvanostatic dischargeconditions corresponds to the inverse of the discharge time tthe correlation may alternatively be expressed as eqn (5b):
Qrel1
t
� �¼ QðCÞ
Qtheoretical¼ ð1� aÞ � exp � w
t
� �b� �(5b)
The three parameters of this empirical relationship haveclearly distinct physical meanings. The parameter a formallyindicates the fraction of the theoretical capacity that remainsinaccessible even at infinitely low C-rates, due to the consump-tion of mobile ions to form a SEI layer, due to an inadequatechoice of the voltage window, etc. Practically, it will also include acapacity loss due to slow processes (at the electrode–electrolyteinterface) for which the relaxation rate is below the studiedC-rate ‘‘frequency’’ window.
The characteristic relaxation frequency W in eqn (5a) (orrelaxation time w = 1/W in eqn (5b)) defines the point of inflectionof the stretched exponential function, i.e. for a C-rate C = W therelative capacity dropped to 1/e E 37% of its value at infinitelylow discharge rate. Therefore, it may be convenient to use for Wthe unit h�1 that is commonly used to specify the C rate. Thestretching exponent b defines the slope
dQrel
d lnðCÞ ¼dQrel
d ln1
t
� � ¼ �ð1� aÞe
b (6)
in the ‘‘nearly constant loss’’ region around the point of inflection.To facilitate a formal comparison with Peukert’s law eqn (5b)may also be rewritten using a linear approximation as
Qrel
ð1� aÞ ¼I
I0
t
t0� tb
tb þ wb
� �; (7)
where the reference state (I0,t0) now corresponds to an infinitelysmall discharge current. Thus, only for high C-rates wheret { w the rate dependences formally assume analogous func-tional forms with
t
t1
� �k�1k/ t
w
� �b(8)
In reality, the Peukert law is however applied for relativelylow rates, where the charge transfer kinetics at the electrode–electrolyte interface controls the reaction rate and overpotential,and this is often as much a question of system design as it isof electrode materials selection. Thus, despite such a formalanalogy it should not be expected that the conventional values
Fig. 2 Rate performance data of various polyanionic compounds recentlyreported in literature. All compounds eventually show rapid capacity fadingat higher C-rates. Different categories are formed based on the C-rate atwhich rapid capacity fading is observed. Dotted lines correspond to therate capability of materials predicted according to eqn (5a) assumingparameter values a = 0, b = 0.5 for all dotted lines, but varying values ofW = 0.1, 1, 10, 100, or 1000 h�1.
Paper PCCP
Ope
n A
cces
s A
rtic
le. P
ublis
hed
on 2
1 Fe
brua
ry 2
017.
Dow
nloa
ded
on 1
1/18
/202
1 8:
18:3
9 A
M.
Thi
s ar
ticle
is li
cens
ed u
nder
a C
reat
ive
Com
mon
s A
ttrib
utio
n-N
onC
omm
erci
al 3
.0 U
npor
ted
Lic
ence
.View Article Online

7510 | Phys. Chem. Chem. Phys., 2017, 19, 7506--7523 This journal is© the Owner Societies 2017
of k (1 o k o 1.5 describing the influence of activation over-potential effects on rate capability) can be related to theexponent b that characterises the effect of mass transportprocesses inside the electrode material on the rate capability.The formal analogy may in principle be utilized vice versa to setup a generalised version of eqn (5a) that describes the ratecapability over a wider range of C-rates under the influence ofboth activation and concentration polarisation by
QrelðCÞ ¼ a � exp � C
Wact
� �bact" #
þ 1� að Þ � exp � C
W
� �b" #
(9)
It may be noted that parameter a in eqn (9) now refers to thefraction of the capacity that is lost when the C-rate significantlyexceeds the relaxation frequency Wact of the charge transferprocess at the electrode surface. In contrast to the Peukertequation this functional form ensures that 0 r Qrel(C) r 1 forany C-rate. Peukert exponents in the range 1 o k o 1.5translate into 0 r bact r 1/3 and Wact will typically be ordersof magnitude smaller than W. For most experimental capacitydata sets C rates of the order of Wact will be below the rangeof studied C rates (C c Wact) and experimental data can befitted according to eqn (5a), i.e. assuming that concentrationpolarisation is the only relevant relaxation process.
3.2. Theory of rate performance of insertion electrodematerials
The observed stretched exponential, i.e. Kohlrausch–Williams–Watts-like,48,49 relationship of eqn (5a) between relative capacityQrel and C-rate may be understood as the consequence of two (ormore) competing relaxation processes. To illustrate this, let us firstconsider a one-dimensional (1D) diffusional process assuming twoindependent relaxation mechanisms for the local relaxation of anion at a site: the first process is a diffusion-independent relaxationinvolving the relaxation frequency C1 assumed for the sake ofsimplicity to be the same for all sites; the other involves aninstantaneous relaxation triggered by the arrival of a second ionforming an interstitialcy pair. Therefore, the response functiondescribing the polarisation decay after the sudden removal of asteady electric field can be written as the product of two terms:50–52
QrelðCÞ ¼ exp � C
C1
� �� �1� PðCÞ½ �; (10)
where P(C) is the probability that a triggering ion has reachedthe site within the period 1/C, and consequently [1 � P(C)] isthe probability that such an ion does not arrive within thatperiod. It may be noted in passing that all the relationshipswere originally derived in time space and are translated here tofrequency space to facilitate the comparison with eqn (5a).Bordewijk51 expanded the 1D diffusion-controlled relaxationmodel to include all relaxation-triggering species and not justnearest neighbours. In the limit of a large number of triggeringentities he finds
1� PðCÞ½ � ¼ exp � C
C2
� �0:5" #
(11)
in the case of diffusion-triggered relaxation in one dimension,where C2 is proportional to the diffusion constant D of the(triggering) ion so that in total the correlation function for 1Ddiffusion becomes
qðcÞ ¼ exp � C
C1
� �� �exp � C
C2
� �0:5" #
� exp � C
Ceff
� �b" #
(12)
and the effective stretching exponent b varying from 0.5 (forC1 c C2) to 1 (for C2 c C1). Bordewijk51 also showed (again intime rather than frequency space) that the same functional formresults for three-dimensional diffusion. To this end, he assumedthat the relaxation is initiated when a defect enters a sphericalregion around the central position. In that case both C1 and C2
will linearly depend on the diffusion coefficient (assuming thatthe diffusion-less relaxation process does no longer play a rolefor the 3D case) and C2/C1 will be a function of the defectconcentration, but will be independent of the diffusion coeffi-cient suggesting a transition from b = 0.5 to 1 as the defectconcentration increases. Later extensions of the model show thatformally analogous expressions also apply for intermediate incl.fractal dimensions.53 Thus, it should be kept in mind that thesame functional form will result irrespective of the local dimen-sionality of the ion migration pathways.
It may be noted that such a transition from non-Debye toDebye-type relaxation is consistently found from a variety ofmodels for dielectric relaxations in complex disordered systems(which mostly have been originally elaborated to further a deeperunderstanding of ion conduction in glasses) such as Ngai’s couplingconcept,54 where C1 and C2 may be thought of as resulting fromthe independent short range and correlated long-range motionof ions, respectively, or Funke’s jump relaxation model,55 wherethe competing relaxation rates correspond to the relaxation of themismatch in charge distribution due to an initially successful hopvia either a correlated backwards hop or by the rearrangementof the neighbouring ions. The latter concept appears particularlysuited for a straightforward application to the complex pathwaysidentified below in Section 3.3 of this paper.
3.3. Na+ migration pathways for Na-ion cathode materials
In this section, we will analyse both the C rate dependence ofthe discharge capacity and the pathways for Na+ ion migrationpathways through the structures of a wide range of potentialNIB cathode materials and discuss relationships between bothways of characterising the rate capability of the materials.
3.3.1. Cathodes with one-dimensional Na+ migration channels.Low-dimensional pathways for ion migration are commonly knownto be bottlenecks for fast ionic conductivity and according to themodel developed in Section 3.2 will have only limited rate-capability.Thus we start our survey on cathode materials made of earth-abundant elements with three classes of NIB cathode materials thatbased on the reported crystal structures should exhibit strictly one-dimensional pathways: alluaudite-type ‘‘Na2Fe2(SO4)3’’,22,25 olivine-type NaFePO4
38 and the Na0.44MnO2 structure type43,44,56,57 inorder to understand why their reported rate performancesdiffer substantially, as shown in Fig. 2 (and Fig. S1 in the ESI†).
PCCP Paper
Ope
n A
cces
s A
rtic
le. P
ublis
hed
on 2
1 Fe
brua
ry 2
017.
Dow
nloa
ded
on 1
1/18
/202
1 8:
18:3
9 A
M.
Thi
s ar
ticle
is li
cens
ed u
nder
a C
reat
ive
Com
mon
s A
ttrib
utio
n-N
onC
omm
erci
al 3
.0 U
npor
ted
Lic
ence
.View Article Online

This journal is© the Owner Societies 2017 Phys. Chem. Chem. Phys., 2017, 19, 7506--7523 | 7511
It may be noted in passing that the Q(C) curve shown forNa2.25Fe1.875(SO4)3 is one of the examples where a secondrelaxation process seems to be observable at a low C-rate (whichcan be nearly perfectly fitted by eqn (9) with the two relaxationfrequencies W E 40 h�1 and Wact = 0.09 h�1).
Alluaudite-type ‘‘Na2Fe2(SO4)3’’ originally caught our atten-tion due to its combination of low cost, high voltage and in factdecent rate performance.22 As compared to their phosphatecounterparts which typically show ca. 3 V for Fe3+/Fe2+ redoxcouple, the more electronegative SO4
2� units in this compoundlead to a high Fe redox potential of 3.8 V (vs. Na) and an initialreversible capacity of 102 mA h g�1.22 In the alluaudite struc-ture edge-sharing bi-octahedral Fe2O10 are interconnected viacorner-sharing SO4 tetrahedra to form a three-dimensionalframework with open tunnels (cf. Fig. 3). These tunnels areoccupied by three distinct types of Na+ ions (fully occupiedNa(1) site and partially occupied Na(2), Na(3) sites).
In their original work, Barpanda et al.22 noticed Fe deficiencywhile synthesizing ‘‘Na2Fe2(SO4)3’’ by low-temperature solid-state
reactions (and hence the formation of FeSO4 as an impurityphase). We consider this to be an inherent feature of thematerial under the chosen synthesis conditions and modelledit more generally as Na2+xFe2�x/2(SO4)3 with a representativelocal structure model.21 The validity of this assumption waslater corroborated by Oyama et al.58
Sodium ion migration pathways in ‘‘Na2Fe2(SO4)3’’ based onour BVSE method are shown in Fig. 4a and b. Long-rangeNa+ transport will be primarily one-dimensional along the cdirection involving two distinct 1D paths. One path follows theNa(3)–Na(3) channel with a low migration barrier of 0.25 eValongside desirable vacancies (50%). Fully occupied Na(1) sitesare connected to this path and contributes additional mobileNa+. Another path involves Na(2) (site occupancy 0.75) alsoalong the c direction with an activation energy of 0.48 eV. Ingeneral, there is a good agreement with the literature ab initiostudy.22 Quantitatively, the slight differences in migrationbarriers should partly be attributed to the different sodiumcontent, as the DFT analysis and our BVSE modelling involvesfully desodiated and sodiated structures, respectively. Indeed,in the BVSE analysis seen in Fig. 4c, fully occupied Na(1) sites,as to be expected, correspond to the lowest energy sites, while aca. 0.2 eV higher site energy is found for the partially occupiedNa(2) sites. In the hypothetical structure, Na0.125Fe2(SO4)3, fromthe DFT analysis, the Na(2) site becomes energetically morestable than Na(1) site. The energy barrier related to Na(3)–Na(3)hops is hardly affected, although the Na(3) site energy is signifi-cantly increased in the desodiated phase.
Based on the idealised stoichiometric structure model itappeared difficult to reconcile the excellent rate performanceof this compound to its migration pathway topology (i.e. purely1D conduction pathways). Based on previous studies, Fe sitedeficiency may open up additional pathways cross-linking thefast-ion conducting channels to higher dimensional pathway
Fig. 3 Structure of Na2+xFe2�x/2(SO4)3 (SG: C2/c) projected along (a) theb axis and (b) the c axis. Sodium ions are shown as yellow spheres and thetypes are marked accordingly. SO4 and FeO6 groups are represented byyellow tetrahedra and brown octahedra respectively. Black lines corre-spond to the unit cell.
Fig. 4 Na+ ion migration pathways based on BVSE model represented by blue energy isosurfaces superimposed on a structure model of Na2Fe2(SO4)3(a) projected along the fast channels c direction and (b) for a slice of the structure with 0.3 o x o 0.7 in the bc plane. This slice clearly shows two distinct1D paths involving all three Na+ types. (c) Migration barriers for Na+ ion diffusion in Na2.25Fe1.875(SO4)3 based on BVSE model for the experimental crystalstructure data from ref. 22. From left to right, the migration barriers correspond to transport long c axis for Na(2) channels, the connection between Na(2)and Na(1) sites, the local path allowing Na(1) to serve as additional Na+ source, and finally the fast Na(3) channel. Figure adapted from ref. 21.
Paper PCCP
Ope
n A
cces
s A
rtic
le. P
ublis
hed
on 2
1 Fe
brua
ry 2
017.
Dow
nloa
ded
on 1
1/18
/202
1 8:
18:3
9 A
M.
Thi
s ar
ticle
is li
cens
ed u
nder
a C
reat
ive
Com
mon
s A
ttrib
utio
n-N
onC
omm
erci
al 3
.0 U
npor
ted
Lic
ence
.View Article Online

7512 | Phys. Chem. Chem. Phys., 2017, 19, 7506--7523 This journal is© the Owner Societies 2017
networks with moderate activation energy.11,16 To explore the roleof vacancies at Fe sites, a local structure model was constructedbased on a 1� 1� 2 superstructure by assigning the sodium sitesaccording to their site occupancies. In particular, 1 out of the 16Fe sites is vacant (experimentally refined Fe site occupancyE0.94). The superstructure was subsequently relaxed based onour softBV force-field.
As seen in Fig. 5a and b, our BVSE model reveals the roleof vacant Fe2+ sites: they turn into interstitial sites for theNa+ which cross-link two adjacent Na(2) and Na(3) pathwaychannels. The resulting migration pathway is now effectively ofa higher dimensionality than the original 1D model. Suchcross-linking thus provides resilience against blocking defects,in combination with the facile migration along partially occu-pied 1D channels explains the experimentally observed highrate performance. As we showed in our previous study, BVSEreveals also other valuable insights into such local structuremodels incorporating Fe vacancies, including the modificationof migration profiles along the paths in the vicinity of suchdefects.21 The concentration and distribution of Fe vacanciesthus determines the overall rate performance and the practicaldimensionality of the pathways. The outstanding rate perfor-mance (W = 244 h�1) reported recently by Meng et al.25 forFe-depleted non-stoichiometric Na2.9Fe1.55(SO4)3 (i.e. x = 0.9)seems to confirm this interpretation.
The Na0.44MnO2 structure type for which we mainly useNa0.61[Mn0.27Fe0.34Ti0.39]O2 (NMFTO)43 as an example, is char-acterized by the presence of two distinct tunnels (cf. Fig. 6a) forthe Na+: part of the Na+ are hosted in large, S-shaped tunnels,and the remaining Na+ are hosted in smaller tunnels. This is incontrast with the NaFePO4 olivine structure type where all Na+
ion pathways are single channels (cf. Fig. 6c and d). In NaFePO4
(first prepared by ion exchange from LiFePO4)59 the one-dimensional pathways are fully isolated from each other andshould thus be highly susceptible to blocking by defects.
In NMFTO, BVSE model reveals three crystallographicallydistinct energy minima (cf. Fig. 6b) in the S-shaped tunnelsseparated by shallow energy barriers (o0.2 eV), where all threesites are partially occupied by sodium ions (site occupancyfactors for Na2: 0.797, Na3: 0.787, Na4: 0.195). Extremely shortapparent Na+–Na+ distances (Na2–Na4: 1.49 Å) within this
Fig. 5 (a) Isosurfaces of constant BVSE for Na+ superimposed on the geometry-optimised local structure model of Na2.25Fe1.875(SO4)3 projected alongthe c axis. (b) Details from the graph (a) showing a superposition of Na+ migration pathways for different BVSE values projecting the central portion of theunit cell 0.3 o y o 0.7 (close to the Fe site vacancy in this local structure model) along the b axis.
Fig. 6 Crystal structure of (a) Na0.61[Mn0.27Fe0.34Ti0.39]O2 and (c) olivineNaFePO4 showing channels along c and b axis, respectively suitable forNa+ conduction as represented by blue energy isosurfaces. In the formercompound, two types of tunnels exist: large, S-shaped tunnels (highlightedin purple) and small Na1 tunnel (highlighted in red) (b) migration pathwaysfor Na0.61[Mn0.27Fe0.34Ti0.39]O2 along the S-shaped tunnel (purple) andNa1 tunnel (red). (d) Migration pathways for olivine NaFePO4 along theb channels involving sodium sites (Na1) and interstitial sites (i).
PCCP Paper
Ope
n A
cces
s A
rtic
le. P
ublis
hed
on 2
1 Fe
brua
ry 2
017.
Dow
nloa
ded
on 1
1/18
/202
1 8:
18:3
9 A
M.
Thi
s ar
ticle
is li
cens
ed u
nder
a C
reat
ive
Com
mon
s A
ttrib
utio
n-N
onC
omm
erci
al 3
.0 U
npor
ted
Lic
ence
.View Article Online

This journal is© the Owner Societies 2017 Phys. Chem. Chem. Phys., 2017, 19, 7506--7523 | 7513
pathway are due to the distribution of locally mobile Na+ ionsover multiple adjacent energy minima.
Such interconnected low-lying energy sites extend in thec axis to form independent 1D tunnels. Within each of theseS-shaped tunnels, Na3–Na3 hops enable the formation of a contin-uous ribbon-like 1D pathway (cf. inset to Fig. 6b) that is expected tobe more resilient against blocking by impurity defects than the Na1channel. This is also in line with the respectable specific capacityobserved experimentally at low cycling rate even with micrometre-sized particles.43 The lowest energy sodium site was found to be theNa1 site within the small tunnel, where the presence of vacanciesalong this Na1 path (ca. 10% vacancies) distinguishes thiscompound from other members of the Na0.44MnO2 family, forwhich the Na1 sites are fully occupied. Coupled with a moderatemigration barrier of 0.39 eV, this supports the experimentalobservation that some Na+ ion extraction from these channelsmight be possible in NMFTO.43
The comparison among olivine, alluaudite and Na0.44MnO2
structure type cathode materials in terms of their rate perfor-mances in Fig. S1 (ESI†) shows that the rate-dependent capacityreduction is characterised by W = 0.5 h�1 in the single channelsof olivine-type NaFePO4, by ca. W = 0.8–1.5 h�1 for Na0.44MnO2-related cathode materials with their 1D pathway ribbons,but reaches W = 40 h�1 or 244 h�1 for the alluaudite-typeNa2+xFe2�x/2(SO4)3 (NFS) with x = 0.25 or x = 0.9 (the latter is alsooptimized by forming a composite with single-walled carbonnanotubes). It is to be stressed that such significant difference inrate performance between NFS and the other two structure typesis largely due to the cross-linking among its 1D channels viaFe vacancies, giving rise to paths of higher effective pathwaydimensionality. The tendency for cross-linking of pathways inthe other two structure types is much weaker as the formation ofa relevant concentration of antisite defects requires a substantialdefect formation energy and would involve a reduced mobility inchannel direction by the Fe on Na sites.
3.3.2. Two-dimensional Na+ migration channel materials withhigh migration barriers. The obvious vulnerability of materialscontaining strictly one-dimensional pathways might lead to theimpression that compositional analogues with two-dimensionalpathways should always have a major advantage. While this isin general also observed experimentally, it should be kept in
mind that beyond the pathway topology, the migration barrierwithin this pathway will control the rate-capability. To weigh theinfluence of pathway dimensionality against migration energyalong the pathway, we will look into a few cathode materials thataccording to our analysis exhibit two-dimensional (2D) path-ways, but with relatively high migration barriers along the paths(for details see Fig. S2 of the ESI†).
Among these, Eldfellite-type Na1+xFe(SO4)2 is one of themembers of the sulfate-based cathode family and could be seenas compositionally related to the alluaudite-type iron sulfatesdiscussed above.24 However, it has a distinct structure consistingof stacked layers of corner-sharing FeO6 and SO4 polyhedra(Fig. 7a), while two energy minima sites exist within the inter-layer spaces, namely the fully occupied Na1 sites (2c at 0, 0, 0.5)and interstitial site (4i at 0.226, 0.5, 0.278) that are vacant in thedesodiated state. Since the two site energies differ only slightly, itmight also be possible that sodium redistribution occurs uponsodiation to mitigate the Coulomb repulsion between Na onthe equilibrium and interstitial sites (Na–i distance = 2.66 Å;i–i distance = 4.08 Å).
In the absence of structural reports for synthetic eldfellite,our pathway analysis is based on the structure data for thevolcanic mineral Eldfellite.60 We relaxed the structure modelcomputationally using our softBV-based forcefield. In the relaxedstructure the occupied Na site becomes the most favourable site,but the energy of the i site is only minutely higher (cf. Fig. 7b).The high migration barrier of 0.93 eV also dictates that iondiffusion kinetics becomes increasingly sluggish as the chargedstate is approached. It may be noted here that (in the absenceof experimental data for the sodiated state) this barrier isdetermined for the desodiated state, whereas pathways for allother compounds in this paper are studied for the discharged(i.e. sodiated) state and (by analogy to our findings for structuretypes where both sodiated and desodiated phases could beanalysed) a somewhat lower barrier may be expected for thefully sodiated Na2Fe(SO4)2.
Details for further cathode materials featuring two-dimensionalNa-ion migration paths including tavorite-type Na2FePO4F andmaricite-type NaFePO4 are shown in the ESI† (cf. Fig. S3). In brief,the enhancement in rate performance (from W = 0.04 h�1 inmaricite NaFePO4 to W = 1.67 h�1 in Na2FePO4F) can be related
Fig. 7 (a) Eldfellite structure of NaFe(SO4)2 with layered Na+ conduction pathways being shown as cyan energy isosurface (b) reaction pathway involvedfor long-range 2D Na+ transport. Two symmetrically distinct energy sites were found, Na site and interstitial site.
Paper PCCP
Ope
n A
cces
s A
rtic
le. P
ublis
hed
on 2
1 Fe
brua
ry 2
017.
Dow
nloa
ded
on 1
1/18
/202
1 8:
18:3
9 A
M.
Thi
s ar
ticle
is li
cens
ed u
nder
a C
reat
ive
Com
mon
s A
ttrib
utio
n-N
onC
omm
erci
al 3
.0 U
npor
ted
Lic
ence
.View Article Online

7514 | Phys. Chem. Chem. Phys., 2017, 19, 7506--7523 This journal is© the Owner Societies 2017
to the lower migration barrier (1.4 eV vs. 0.58 eV). The overallkinetics in Na2FePO4F is still expected to be relatively slow due tothe moderately high migration barrier of 0.58 eV in combinationwith a lack of vacancies for sodium. Thus, a 2D transport networktopology does not necessarily translate into high rate capability.In the next section, we demonstrate how high rate performancecan be unlocked by lower migration barriers (o0.5 eV) whilemaintaining an at least 2-dimensional pathway network.
3.3.3. Pyrophosphates and related compounds. Transitionmetal pyrophosphates (PO4
3� groups) and mixed phosphates(P2O7
4� and PO43� groups) have been intensely studied as
cathode materials for both LIB and more recently also for NIBapplications. Interestingly, we found substantial differences inrate performances among the members of the pyrophosphateand the mixed phosphates family that could be explained basedon their structural differences.
The lowest rate performance in this family of compounds isobserved for the vanadium-based NaVP2O7 which crystallizesin space group P21/c with corner-sharing PO4 and VO6 groups(Fig. S4a, ESI†). A previous study on this compound as a cathodematerial reported poor performance, achieving only ca. 35%of theoretical capacity (108 mA h g�1) even at low cycling rateof 0.05C.34 Detailed pathway analysis of this compound isdiscussed in Fig. S4b (ESI†).
Among the Na2MP2O7 pyrophosphates with M = Fe, Mn,VO,63,64,67,68 consistently somewhat higher rate capabilities arenoted for the case M = Fe (the rate performance data for threeNa2�2xFe1+xP2O7 samples correspond to relaxation frequencies Wof 7–21 h�1) than for M = Mn or M = VO (both with W E 2–4 h�1),while both perform significantly better than the V-compounddescribed above (where the relaxation frequency can only beroughly estimated to W E 0.04 h�1 due to the limited range ofexperimental data). A study of a Na2FeP2O7–CNT composite28
even suggests W to be as high as 45 h�1. Here we explore thestructural origin of such differences.
Na2FeP2O7, has only been characterized in 2012 indepen-dently by three research groups who reported different poly-morphs – adopting either P%1 structure (Barpanda et al.65 andHonma et al.61) or P1 structure (Kim et al.62) with a reversiblecapacity of 90 mA h g�1 at 3.0 V (vs. Na/Na+). The Na+ pathwaytopology we found for Na2FeP2O7 starting from the P%1 structuraldata of ref. 63 (see Fig. S5, ESI†) is in excellent agreement with aprevious computational study based on atomistic methods.64
Based on our BVSE analysis, long-range Na+ transport in thiscompound is effectively two-dimensional in the (011) planes dueto the high barrier (0.83 eV) involved with Na1–i1 hop which actsas connection between adjacent (011) planes. Na+ transportpredominantly takes place in the [0, 1, �1] direction, involvingribbon-like 1D paths containing fully occupied Na2 and inter-stitial site i1, where i1 connects two adjacent Na2. Such Na2–i1paths are the bottlenecks for 1D percolation, with a corres-ponding barrier 0.33 eV.
The ‘‘large tunnels’’ previously reported contain partiallyoccupied Na4, Na5 and Na6.65 Within these tunnels, two sym-metrically equivalent, adjacent energy local minima separated bya barrier of o0.05 eV are occupied by Na6 each (occupancy 1/3),
while Na4 position coincides with the saddle point (occupancy 1/3).This can be simplified by the description of a single Na type(hereby named ‘Na4/6’) with total occupancy 1.0, delocalised inthis low energy region. On the other hand, Na5 sites are nearbywith site energy ca. 0.1 eV higher than Na4/Na6. In fact, the Na5site energy is the highest among all occupied Na sites, suggestingthat this is the least favourable site for Na+. This is in line withexperimental observation that Na5 occupancy is 0.5 while that ofNa1, Na2, Na3, and Na4/Na6 is 1.0.
The percolating 1D channels are subsequently connected bythe large tunnels to form 2D network via the path between therelatively high energy (and hence low occupancy) Na5 sites. Thepartial occupancy of Na sites is crucial in lowering the effectiveenergy barrier for 2D percolation via Na5–Na5 hops to 0.40 eVyielding a more robust network when compared to isolated 1Dpaths. Based on the overall reaction pathway, Na3 is expectedto constitute and additional source of Na+ ions for extractionvia a Na3–Na5 path with a moderate barrier of 0.46 eV (theseNa3 sites may be viewed as ‘‘side branches’’ to the main ‘‘largetunnels’’). Indeed, in the desodiated phase b-NaFeP2O7 (SG: P%1), Na3site occupancy drops to 0.5.63 Two further members of the pyrophos-phate family with M = Mn (W = 4.3 h�1) and VO (W = 2.9 h�1)that exhibit lower rate performances than Na2FeP2O7 are brieflydiscussed in the ESI† (see Fig. S6).
To reinforce the importance of built-in sodium site vacan-cies towards rate performance, we turn to the recently reportedsodium-deficient Na1.63Co1.13P2O7 (W = 15 h�1).36 We found thepathway topology to be similar to Na2FeP2O7 albeit with highermigration barriers (0.52 eV for 1D, 0.61 eV for 2D). Despite similarmigration barriers in both Na1.63Co1.13P2O7 and Na2MnP2O7, theformer (W = 15 h�1) is clearly outperforming the latter (W = 4.3 h�1)at higher C-rates. While all sodium sites are fully occupied inNa2MnP2O7, Na1.63Co1.13P2O7 exhibits highly disordered sodiumsites akin to the disordered Na5 and Na4/6 sites in Na2FeP2O7.Therefore, as we move from Na2FeP2O7 to Na1.63Co1.13P2O7, theminor decrease in W is mainly related to the increasing migrationbarrier, while from Na1.63Co1.13P2O7 to Na2MnP2O7, further dropin W is largely due to the diminishing availability of vacancies insodium sites.
Our model of Na1.63Co1.13P2O7 also includes the excess Co2+
and presence of Co3+ to compensate for sodium deficiencies.Due to the higher BV sum of Co on Co1 this site is consideredto contain a mixture of (redox inactive) Co3+ and Co2+ whilethe Co2 site is occupied by Co2+ in the sodiated form. Theremaining excess Co2+ ions are assigned to the Na6 sites assuggested by ref. 36. As these Na6 sites are side branches to themain percolating pathway, we do not expect the co-presence ofCo2+ at these sites to block the sodium extraction. Interestingly,the unusually high value of a = 20% of Na1.63Co1.13P2O7 (i.e. 20%of theoretical capacity inaccessible even at low C-rate) mightsuggest that these Co2+ ions at the Na6 sites, which shouldcontribute to ca. 13% of the total theoretical capacity, are alsoredox-inactive.
The case of Na1.63Co1.13P2O7 highlights the strategy of off-stoichiometry synthesis to improve the rate performancevia disordered sodium sites throughout the (dis)charge cycle.
PCCP Paper
Ope
n A
cces
s A
rtic
le. P
ublis
hed
on 2
1 Fe
brua
ry 2
017.
Dow
nloa
ded
on 1
1/18
/202
1 8:
18:3
9 A
M.
Thi
s ar
ticle
is li
cens
ed u
nder
a C
reat
ive
Com
mon
s A
ttrib
utio
n-N
onC
omm
erci
al 3
.0 U
npor
ted
Lic
ence
.View Article Online

This journal is© the Owner Societies 2017 Phys. Chem. Chem. Phys., 2017, 19, 7506--7523 | 7515
Since Na2FeP2O7 has naturally disordered Na4/6 and Na5 sites,intuitively this strategy should have limited success here.Indeed, we find that the pathway characteristics in the relatedNa2�2xFe1+xP2O7, in particular the case of Na1.56Fe1.22(P2O7)2,66
are less favourable than in Na2FeP2O7 in two ways. Firstly, someof the corresponding migration barriers in Na1.56Fe1.22(P2O7)2
are significantly increased. While the barrier for 1D percolationremains at 0.37 eV (marginally higher than 0.33 eV in Na2FeP2O7),the 2D barrier increases to 0.69 eV (as compared to 0.40 eV inNa2FeP2O7). Secondly, the link between the 1D channels nowno longer occurs via Na5–Na5 hops, but rather via the longNa5–Na3–Na1–Na2 (following the same sodium site nomencla-ture as in Na2FeP2O7). Furthermore, the latter path is nowsusceptible to blocking as the Na1 site is partially occupied withFe2+ in Na1.56Fe1.22(P2O7)2. Therefore, the effectiveness of higherdimensionality pathway in Na1.56Fe1.22(P2O7)2 is compromisedby both blocking effects as well as the resulting higher migra-tion barrier.
More recently, Kim et al. reported Na7V3(P2O7)4 as a 4Vcathode material for Na-ion battery.23 This compound retainsan impressive relative capacity of ca. 80% even at 10C cyclingrate and seems to have a second plateau of the relative capacityabove this value, so that the fit yields the extraordinary value ofW E 141 h�1. Unsurprisingly, we found that this compoundbears an unusually low migration barrier and contains vacantsites within the pathway. Our model reveals that Na7V3(P2O7)4
allows Na+ conduction involving Na3 and Na4 in an extended2D network in the ab-plane with a low migration barrier of0.23 eV (cf. Fig. 8c). While all the sodium sites are reportedexperimentally to be fully occupied, the availability of low-lyinginterstitial sites i1 within the 2D backbone should aid theoverall ionic transport. Furthermore, the polyanion framework
intersperses with the 2D networks (cf. Fig. 8a and b), in contrastto NaMO2-type layered compound where sodium ions constitutea whole layer between adjacent polyanion slabs. The more robustframework in the former therefore ensures a high mechanicalstability against sodium extraction/insertion. This is also verifiedexperimentally where the observed volume change is only 1%.23
An extension to the pyrophosphate family is the mixedphosphates involving (PO4)3� and (P2O7)4� polyanion groups(cf. Fig. S7a, ESI†). Mixed phosphates of the general formulaNa4M3(PO4)2P2O7 (M = Mn,29 Fe30,31) have shown respectablerate capability as evidenced in Fig. 2. In both compounds, wefound similar pathway topology consisting of interconnected1D paths of low to moderate barriers to form an overall3D percolating network for long-range ionic transport. Theestimated migration barrier for at least 1D transport is onlyapproximately 0.30 eV and 0.28 eV for M = Fe and M = Mn,respectively (cf. Fig. S7b, ESI†), in close agreement with an earliermolecular dynamics study.67 Higher-dimensional pathways aresubsequently activated at higher barriers. This combination ofenergetic considerations clearly explains their superior perfor-mance over Na2MnP2O7 and Na2VOP2O7. However, there is a lackof readily available low energy vacant sites within the sodium ionpathways of these mixed phosphates that may explain therelatively high fraction of the theoretical capacity that cannotbe realised even at low rates.
Another promising mixed phosphate compound is Na7V4PO4-(P2O7)4 (SG: P%421c) as shown in Fig. 9a.32 Our pathway model inFig. 9b reveals that the overall conduction network consists oftwo independent networks (both long-range percolating): 1Dpaths along c-direction and 3D paths formed by linking cross-shaped local clusters. These two networks are separated bya moderate barrier of 0.53 eV, while the effective migrationbarriers for the 1D and 3D network associated with long-rangetransport are 0.33 eV and 0.46 eV, respectively (cf. Fig. 9c). Thereis also a considerable amount of low-lying interstitial sites in theNa2 channels. A qualitative consideration of these factors thusreasonably qualifies this compound to have a rate performanceon par with or better than the previously discussed mixedphosphates compounds. In relation to this, it should be notedthat the rate performance shown in Fig. 2 for this compound isassociated with nanosizing and hierarchical composite design.Nonetheless, this highlights the fact that a compound which hasby default a decent rate capability without special optimizationsstands a chance to compete with top contenders with elaborateparticle morphology design.
Finally, the chemistry of pyrophosphates can be furtherenriched with the introduction of fluorides into the structure.The first sodium fluoropyrophosphate Na-ion battery cathodematerial with an open three-dimensional framework, Na4NiP2O7F2
(SG: Imma), was reported by Kundu et al.68 and found to have ahigh average voltage of ca. 5 V although only the Ni2+/3+ redoxcouple could be activated limiting the theoretical capacity toabout 75 mA h g�1. Ab initio calculations by the same groupsuggest a low migration barrier of 0.36 eV along the [010]direction and their experimental determination of the ionicconductivity (finding value of 0.32 eV) suggest that the material
Fig. 8 (a) Crystal structure of Na7V3(P2O7)4 (SG: C2/c) and (b) energy iso-surfaces representing Na+ conduction pathway projected along b-direction.Black solid line highlights the unit cell. (c) Reaction pathway shows a 2Dpercolating network containing Na3, Na4 and involving a low barrier of0.23 eV as well as additional sodium ions (Na1, Na2) which are accessiblevia moderate migration barriers of 0.3–0.4 eV.
Paper PCCP
Ope
n A
cces
s A
rtic
le. P
ublis
hed
on 2
1 Fe
brua
ry 2
017.
Dow
nloa
ded
on 1
1/18
/202
1 8:
18:3
9 A
M.
Thi
s ar
ticle
is li
cens
ed u
nder
a C
reat
ive
Com
mon
s A
ttrib
utio
n-N
onC
omm
erci
al 3
.0 U
npor
ted
Lic
ence
.View Article Online

7516 | Phys. Chem. Chem. Phys., 2017, 19, 7506--7523 This journal is© the Owner Societies 2017
should be able to sustain high rate performance, though thisremains to be experimentally verified. Details on the Na+ pathsin this compound can be found in the ESI† (see Fig. S8).
3.3.4. Antisite defect concentration effects in Na3MnPO4CO3.As an example of how defect formation can drastically alter themigration pathway, we studied Na3MnPO4CO3 which was firstdemonstrated by Ceder et al. as a sodium cathode materialexhibiting a voltage of 3.7 V (vs. Na/Na+), where both Mn2+/Mn3+
and Mn3+/Mn4+ redox couples were supposed to be redox active.42
Na3MnPO4CO3 adopts a layered structure constituting of corner-sharing polyhedra of PO4 and MnO6 groups. CO3 groups thatshare two O with one MnO6 octahedron ‘‘dip’’ into the inter-layerspace occupied by Na+ ions (Fig. 10a). Similar to Eldfellite,NaFe(SO4)2, and Na2FePO4F discussed above, the Na3MnPO4CO3
structure contains a two-dimensional Na+ pathway formed by theconnection of each Na2 site to four adjacent Na2 sites. Na1 sitesare attached to the main percolating pathway (Fig. 10b, inset) asadditional sources of Na+ ions via two Na1–Na2 connections. Asshown in Fig. 10b, moderate migration barriers were calculatedfor Na1–Na2 and Na2–Na2 hops – 0.66 eV and 0.52 eV respectively.Also, the energy plateau at the Na2 site may suggest high thermaldisplacements amplitudes, although there was no experimentalanisotropic displacement data to confirm this.
The combination of high-dimensional pathway and moderatemigration barriers (slightly above 0.5 eV) are in line with theobserved relaxation frequency (W = 1.5 h�1 similar to the one ofNa2FePO4F both in W and migration barrier), but the absolutecapacity is limited by an unusually large fraction of the
theoretical capacity that remains inaccessible even at low Crates (aE 0.31). Assuming that Na(2) sites are fully extracted sothat Mn is oxidised to Mn3+, achieving 100% of theoreticalcapacity (i.e. an oxidation to Mn4+) requires an extraction of50% of the Na from Na1 sites, which involves a slightly higherbarrier at 0.66 eV. The original authors already offered severalpossible reasons for the low capacity, including defects due tointense ball-milling. In a separate study, it was found that longball-milling time caused excessive formation of both Mn2+/Na(1)+ and Mn2+/Na(2)+ antisite defects (especially the latter)that in this structure are expected to reduce ionic conductivityand rate capability.69
To investigate the effects of such defect formation, wehave created and relaxed two 2 � 2 � 2 supercell structurescontaining these defects respectively. Interestingly, in bothcases, we observe that the displaced NaMn
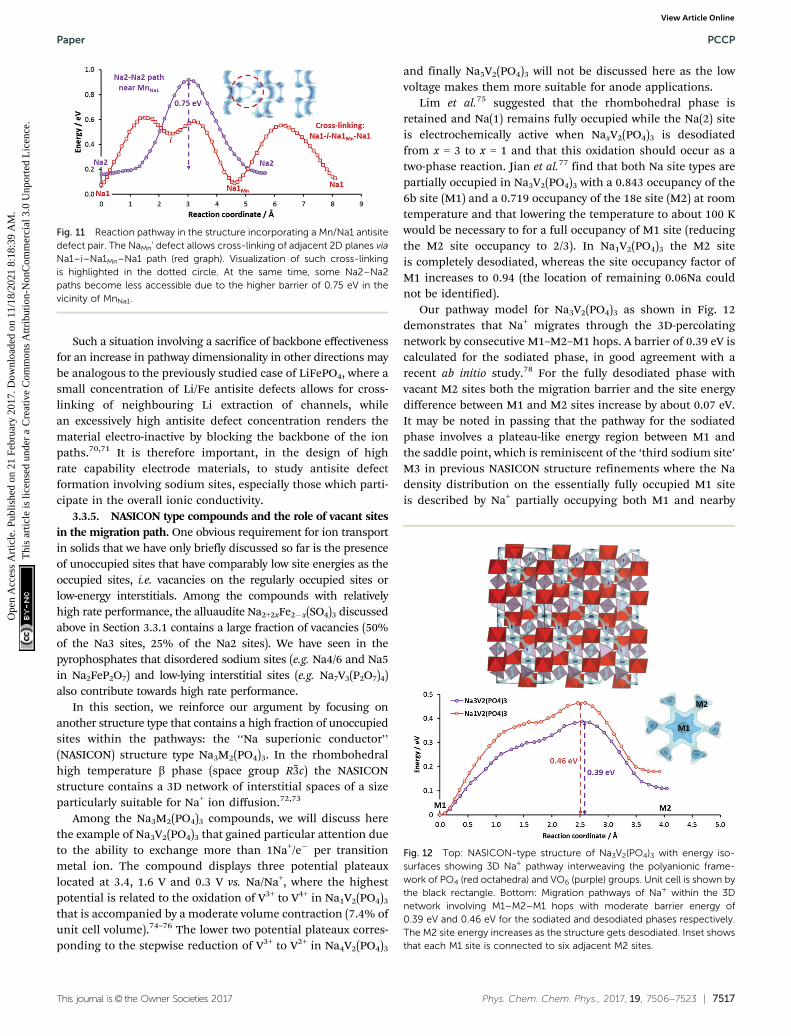
0 ion facilitates thecross-linking of two adjacent conduction planes. One suchexample is shown in Fig. 11 for the case of a Mn/Na1 antisitedefect, where the cross-linking path (Na1–i–NaMn–Na1) involvesa moderate migration barrier of ca. 0.5 eV comparable to thelong-range transport barrier 0.52 eV in the fully ordered struc-ture. Therefore, these sodium ions at defect sites are expectedto be equally extractable. The downside of this antisite defectformation is that it negatively affects the more importantNa2–Na2 backbone of the long-range migration path. AMnNa2
��blocks four Na2–Na2 paths and four Na1–Na2 pathsand a MnNa1
� raises the migration barrier of two out of the fouradjacent Na2–Na2 paths significantly from 0.52 eV to 0.75 eV(cf. Fig. 11) due to the stronger Coulombic repulsion fromdoubly-charged Mn2+ and Coulomb attraction to a nearbyCO3 group that is tilted towards Mn2+ (i.e. closer to the saddlepoints of the high-barrier Na2–Na2 paths).
Fig. 9 (a) Crystal structure of Na7V4PO4(P2O7)4 (space group P %421c) and(b) energy isosurfaces representing Na+ conduction pathway projectedalong c-direction. Black solid line and red dotted line highlight the unit celland the 1D pathway along c respectively. (c) Pathway topology of thiscompound can be described by the reaction graph where two conductionnetwork (one 1D and the other 3D) are separated by a moderate barrier of0.53 eV. The 3D network itself is made by inter-linking cross-like clusterswhere each cluster contains four identical Na1–Na3 local migration paths.
Fig. 10 (a) Crystal structure of Sidorenkite Na3MnPO4CO3 with energyisosurfaces between stacked slabs made of PO4 (light purple polyhedra),MnO6 (dark purple octahedra) and CO3 (brown triangle) groups. (b) Reactionpathway of a sodium ion in the b–c plane (inset) for long-range transport.
PCCP Paper
Ope
n A
cces
s A
rtic
le. P
ublis
hed
on 2
1 Fe
brua
ry 2
017.
Dow
nloa
ded
on 1
1/18
/202
1 8:
18:3
9 A
M.
Thi
s ar
ticle
is li
cens
ed u
nder
a C
reat
ive
Com
mon
s A
ttrib
utio
n-N
onC
omm
erci
al 3
.0 U
npor
ted
Lic
ence
.View Article Online
This journal is© the Owner Societies 2017 Phys. Chem. Chem. Phys., 2017, 19, 7506--7523 | 7517
Such a situation involving a sacrifice of backbone effectivenessfor an increase in pathway dimensionality in other directions maybe analogous to the previously studied case of LiFePO4, where asmall concentration of Li/Fe antisite defects allows for cross-linking of neighbouring Li extraction of channels, whilean excessively high antisite defect concentration renders thematerial electro-inactive by blocking the backbone of the ionpaths.70,71 It is therefore important, in the design of highrate capability electrode materials, to study antisite defectformation involving sodium sites, especially those which parti-cipate in the overall ionic conductivity.
3.3.5. NASICON type compounds and the role of vacant sitesin the migration path. One obvious requirement for ion transportin solids that we have only briefly discussed so far is the presenceof unoccupied sites that have comparably low site energies as theoccupied sites, i.e. vacancies on the regularly occupied sites orlow-energy interstitials. Among the compounds with relativelyhigh rate performance, the alluaudite Na2+2xFe2�x(SO4)3 discussedabove in Section 3.3.1 contains a large fraction of vacancies (50%of the Na3 sites, 25% of the Na2 sites). We have seen in thepyrophosphates that disordered sodium sites (e.g. Na4/6 and Na5in Na2FeP2O7) and low-lying interstitial sites (e.g. Na7V3(P2O7)4)also contribute towards high rate performance.
In this section, we reinforce our argument by focusing onanother structure type that contains a high fraction of unoccupiedsites within the pathways: the ‘‘Na superionic conductor’’(NASICON) structure type Na3M2(PO4)3. In the rhombohedralhigh temperature b phase (space group R%3c) the NASICONstructure contains a 3D network of interstitial spaces of a sizeparticularly suitable for Na+ ion diffusion.72,73
Among the Na3M2(PO4)3 compounds, we will discuss herethe example of Na3V2(PO4)3 that gained particular attention dueto the ability to exchange more than 1Na+/e� per transitionmetal ion. The compound displays three potential plateauxlocated at 3.4, 1.6 V and 0.3 V vs. Na/Na+, where the highestpotential is related to the oxidation of V3+ to V4+ in Na1V2(PO4)3
that is accompanied by a moderate volume contraction (7.4% ofunit cell volume).74–76 The lower two potential plateaux corres-ponding to the stepwise reduction of V3+ to V2+ in Na4V2(PO4)3
and finally Na5V2(PO4)3 will not be discussed here as the lowvoltage makes them more suitable for anode applications.
Lim et al.75 suggested that the rhombohedral phase isretained and Na(1) remains fully occupied while the Na(2) siteis electrochemically active when NaxV2(PO4)3 is desodiatedfrom x = 3 to x = 1 and that this oxidation should occur as atwo-phase reaction. Jian et al.77 find that both Na site types arepartially occupied in Na3V2(PO4)3 with a 0.843 occupancy of the6b site (M1) and a 0.719 occupancy of the 18e site (M2) at roomtemperature and that lowering the temperature to about 100 Kwould be necessary to for a full occupancy of M1 site (reducingthe M2 site occupancy to 2/3). In Na1V2(PO4)3 the M2 siteis completely desodiated, whereas the site occupancy factor ofM1 increases to 0.94 (the location of remaining 0.06Na couldnot be identified).
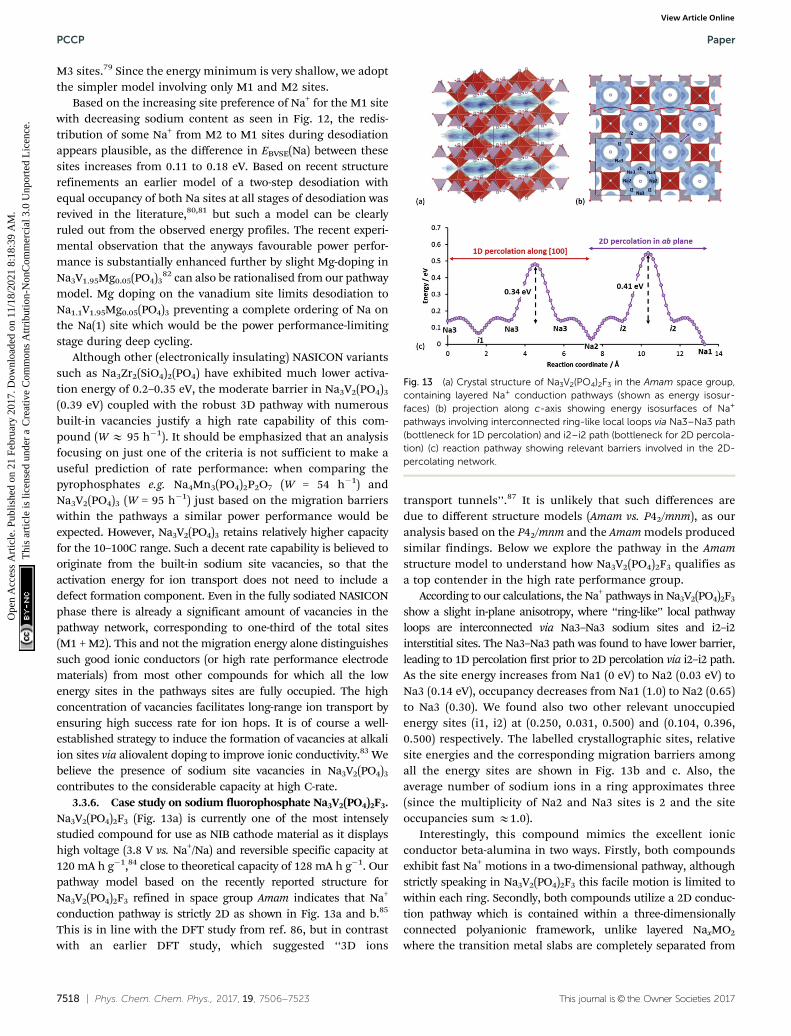
Our pathway model for Na3V2(PO4)3 as shown in Fig. 12demonstrates that Na+ migrates through the 3D-percolatingnetwork by consecutive M1–M2–M1 hops. A barrier of 0.39 eV iscalculated for the sodiated phase, in good agreement with arecent ab initio study.78 For the fully desodiated phase withvacant M2 sites both the migration barrier and the site energydifference between M1 and M2 sites increase by about 0.07 eV.It may be noted in passing that the pathway for the sodiatedphase involves a plateau-like energy region between M1 andthe saddle point, which is reminiscent of the ‘third sodium site’M3 in previous NASICON structure refinements where the Nadensity distribution on the essentially fully occupied M1 siteis described by Na+ partially occupying both M1 and nearby
Fig. 11 Reaction pathway in the structure incorporating a Mn/Na1 antisitedefect pair. The NaMn‘ defect allows cross-linking of adjacent 2D planes viaNa1–i–Na1Mn–Na1 path (red graph). Visualization of such cross-linkingis highlighted in the dotted circle. At the same time, some Na2–Na2paths become less accessible due to the higher barrier of 0.75 eV in thevicinity of MnNa1.
Fig. 12 Top: NASICON-type structure of Na3V2(PO4)3 with energy iso-surfaces showing 3D Na+ pathway interweaving the polyanionic frame-work of PO4 (red octahedra) and VO6 (purple) groups. Unit cell is shown bythe black rectangle. Bottom: Migration pathways of Na+ within the 3Dnetwork involving M1–M2–M1 hops with moderate barrier energy of0.39 eV and 0.46 eV for the sodiated and desodiated phases respectively.The M2 site energy increases as the structure gets desodiated. Inset showsthat each M1 site is connected to six adjacent M2 sites.
Paper PCCP
Ope
n A
cces
s A
rtic
le. P
ublis
hed
on 2
1 Fe
brua
ry 2
017.
Dow
nloa
ded
on 1
1/18
/202
1 8:
18:3
9 A
M.
Thi
s ar
ticle
is li
cens
ed u
nder
a C
reat
ive
Com
mon
s A
ttrib
utio
n-N
onC
omm
erci
al 3
.0 U
npor
ted
Lic
ence
.View Article Online
7518 | Phys. Chem. Chem. Phys., 2017, 19, 7506--7523 This journal is© the Owner Societies 2017
M3 sites.79 Since the energy minimum is very shallow, we adoptthe simpler model involving only M1 and M2 sites.
Based on the increasing site preference of Na+ for the M1 sitewith decreasing sodium content as seen in Fig. 12, the redis-tribution of some Na+ from M2 to M1 sites during desodiationappears plausible, as the difference in EBVSE(Na) between thesesites increases from 0.11 to 0.18 eV. Based on recent structurerefinements an earlier model of a two-step desodiation withequal occupancy of both Na sites at all stages of desodiation wasrevived in the literature,80,81 but such a model can be clearlyruled out from the observed energy profiles. The recent experi-mental observation that the anyways favourable power perfor-mance is substantially enhanced further by slight Mg-doping inNa3V1.95Mg0.05(PO4)3
82 can also be rationalised from our pathwaymodel. Mg doping on the vanadium site limits desodiation toNa1.1V1.95Mg0.05(PO4)3 preventing a complete ordering of Na onthe Na(1) site which would be the power performance-limitingstage during deep cycling.
Although other (electronically insulating) NASICON variantssuch as Na3Zr2(SiO4)2(PO4) have exhibited much lower activa-tion energy of 0.2–0.35 eV, the moderate barrier in Na3V2(PO4)3
(0.39 eV) coupled with the robust 3D pathway with numerousbuilt-in vacancies justify a high rate capability of this com-pound (W E 95 h�1). It should be emphasized that an analysisfocusing on just one of the criteria is not sufficient to make auseful prediction of rate performance: when comparing thepyrophosphates e.g. Na4Mn3(PO4)2P2O7 (W = 54 h�1) andNa3V2(PO4)3 (W = 95 h�1) just based on the migration barrierswithin the pathways a similar power performance would beexpected. However, Na3V2(PO4)3 retains relatively higher capacityfor the 10–100C range. Such a decent rate capability is believed tooriginate from the built-in sodium site vacancies, so that theactivation energy for ion transport does not need to include adefect formation component. Even in the fully sodiated NASICONphase there is already a significant amount of vacancies in thepathway network, corresponding to one-third of the total sites(M1 + M2). This and not the migration energy alone distinguishessuch good ionic conductors (or high rate performance electrodematerials) from most other compounds for which all the lowenergy sites in the pathways sites are fully occupied. The highconcentration of vacancies facilitates long-range ion transport byensuring high success rate for ion hops. It is of course a well-established strategy to induce the formation of vacancies at alkaliion sites via aliovalent doping to improve ionic conductivity.83 Webelieve the presence of sodium site vacancies in Na3V2(PO4)3
contributes to the considerable capacity at high C-rate.3.3.6. Case study on sodium fluorophosphate Na3V2(PO4)2F3.
Na3V2(PO4)2F3 (Fig. 13a) is currently one of the most intenselystudied compound for use as NIB cathode material as it displayshigh voltage (3.8 V vs. Na+/Na) and reversible specific capacity at120 mA h g�1,84 close to theoretical capacity of 128 mA h g�1. Ourpathway model based on the recently reported structure forNa3V2(PO4)2F3 refined in space group Amam indicates that Na+
conduction pathway is strictly 2D as shown in Fig. 13a and b.85
This is in line with the DFT study from ref. 86, but in contrastwith an earlier DFT study, which suggested ‘‘3D ions
transport tunnels’’.87 It is unlikely that such differences aredue to different structure models (Amam vs. P42/mnm), as ouranalysis based on the P42/mnm and the Amam models producedsimilar findings. Below we explore the pathway in the Amamstructure model to understand how Na3V2(PO4)2F3 qualifies asa top contender in the high rate performance group.
According to our calculations, the Na+ pathways in Na3V2(PO4)2F3
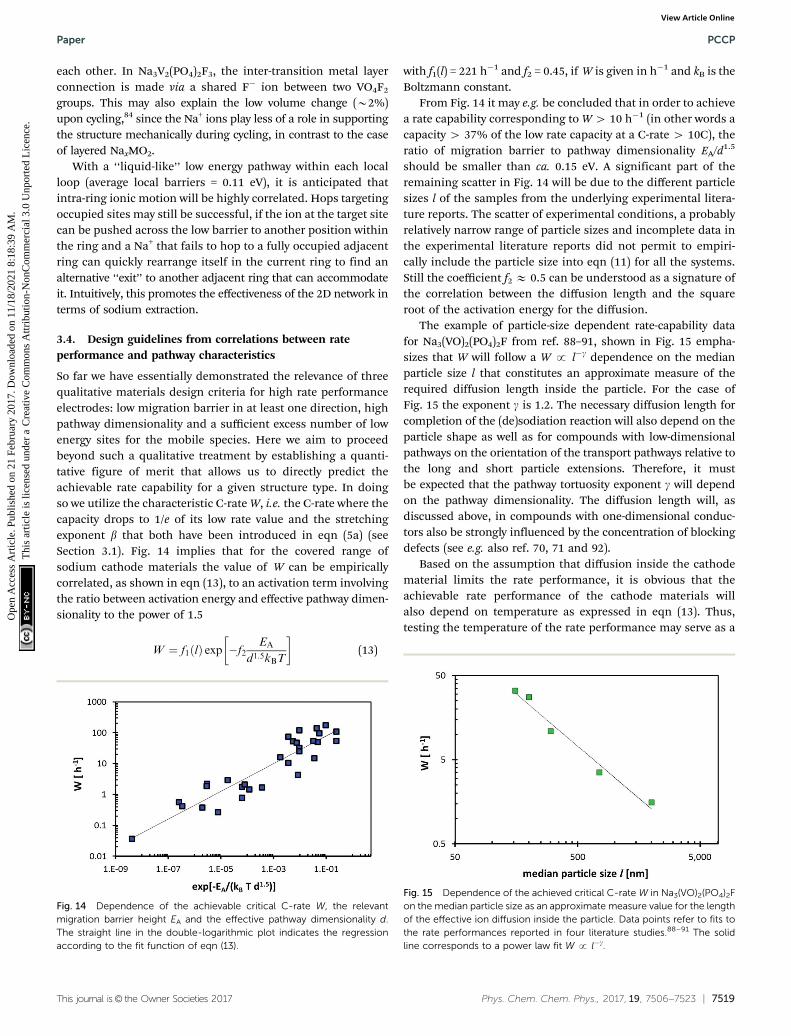
show a slight in-plane anisotropy, where ‘‘ring-like’’ local pathwayloops are interconnected via Na3–Na3 sodium sites and i2–i2interstitial sites. The Na3–Na3 path was found to have lower barrier,leading to 1D percolation first prior to 2D percolation via i2–i2 path.As the site energy increases from Na1 (0 eV) to Na2 (0.03 eV) toNa3 (0.14 eV), occupancy decreases from Na1 (1.0) to Na2 (0.65)to Na3 (0.30). We found also two other relevant unoccupiedenergy sites (i1, i2) at (0.250, 0.031, 0.500) and (0.104, 0.396,0.500) respectively. The labelled crystallographic sites, relativesite energies and the corresponding migration barriers amongall the energy sites are shown in Fig. 13b and c. Also, theaverage number of sodium ions in a ring approximates three(since the multiplicity of Na2 and Na3 sites is 2 and the siteoccupancies sum E1.0).
Interestingly, this compound mimics the excellent ionicconductor beta-alumina in two ways. Firstly, both compoundsexhibit fast Na+ motions in a two-dimensional pathway, althoughstrictly speaking in Na3V2(PO4)2F3 this facile motion is limited towithin each ring. Secondly, both compounds utilize a 2D conduc-tion pathway which is contained within a three-dimensionallyconnected polyanionic framework, unlike layered NaxMO2
where the transition metal slabs are completely separated from
Fig. 13 (a) Crystal structure of Na3V2(PO4)2F3 in the Amam space group,containing layered Na+ conduction pathways (shown as energy isosur-faces) (b) projection along c-axis showing energy isosurfaces of Na+
pathways involving interconnected ring-like local loops via Na3–Na3 path(bottleneck for 1D percolation) and i2–i2 path (bottleneck for 2D percola-tion) (c) reaction pathway showing relevant barriers involved in the 2D-percolating network.
PCCP Paper
Ope
n A
cces
s A
rtic
le. P
ublis
hed
on 2
1 Fe
brua
ry 2
017.
Dow
nloa
ded
on 1
1/18
/202
1 8:
18:3
9 A
M.
Thi
s ar
ticle
is li
cens
ed u
nder
a C
reat
ive
Com
mon
s A
ttrib
utio
n-N
onC
omm
erci
al 3
.0 U
npor
ted
Lic
ence
.View Article Online
This journal is© the Owner Societies 2017 Phys. Chem. Chem. Phys., 2017, 19, 7506--7523 | 7519
each other. In Na3V2(PO4)2F3, the inter-transition metal layerconnection is made via a shared F� ion between two VO4F2
groups. This may also explain the low volume change (B2%)upon cycling,84 since the Na+ ions play less of a role in supportingthe structure mechanically during cycling, in contrast to the caseof layered NaxMO2.
With a ‘‘liquid-like’’ low energy pathway within each localloop (average local barriers = 0.11 eV), it is anticipated thatintra-ring ionic motion will be highly correlated. Hops targetingoccupied sites may still be successful, if the ion at the target sitecan be pushed across the low barrier to another position withinthe ring and a Na+ that fails to hop to a fully occupied adjacentring can quickly rearrange itself in the current ring to find analternative ‘‘exit’’ to another adjacent ring that can accommodateit. Intuitively, this promotes the effectiveness of the 2D network interms of sodium extraction.
3.4. Design guidelines from correlations between rateperformance and pathway characteristics
So far we have essentially demonstrated the relevance of threequalitative materials design criteria for high rate performanceelectrodes: low migration barrier in at least one direction, highpathway dimensionality and a sufficient excess number of lowenergy sites for the mobile species. Here we aim to proceedbeyond such a qualitative treatment by establishing a quanti-tative figure of merit that allows us to directly predict theachievable rate capability for a given structure type. In doingso we utilize the characteristic C-rate W, i.e. the C-rate where thecapacity drops to 1/e of its low rate value and the stretchingexponent b that both have been introduced in eqn (5a) (seeSection 3.1). Fig. 14 implies that for the covered range ofsodium cathode materials the value of W can be empiricallycorrelated, as shown in eqn (13), to an activation term involvingthe ratio between activation energy and effective pathway dimen-sionality to the power of 1.5
W ¼ f1ðlÞ exp �f2EA
d1:5kBT
� �(13)
with f1(l) = 221 h�1 and f2 = 0.45, if W is given in h�1 and kB is theBoltzmann constant.
From Fig. 14 it may e.g. be concluded that in order to achievea rate capability corresponding to W 4 10 h�1 (in other words acapacity 4 37% of the low rate capacity at a C-rate 4 10C), theratio of migration barrier to pathway dimensionality EA/d1.5
should be smaller than ca. 0.15 eV. A significant part of theremaining scatter in Fig. 14 will be due to the different particlesizes l of the samples from the underlying experimental litera-ture reports. The scatter of experimental conditions, a probablyrelatively narrow range of particle sizes and incomplete data inthe experimental literature reports did not permit to empiri-cally include the particle size into eqn (11) for all the systems.Still the coefficient f2 E 0.5 can be understood as a signature ofthe correlation between the diffusion length and the squareroot of the activation energy for the diffusion.
The example of particle-size dependent rate-capability datafor Na3(VO)2(PO4)2F from ref. 88–91, shown in Fig. 15 empha-sizes that W will follow a W p l�g dependence on the medianparticle size l that constitutes an approximate measure of therequired diffusion length inside the particle. For the case ofFig. 15 the exponent g is 1.2. The necessary diffusion length forcompletion of the (de)sodiation reaction will also depend on theparticle shape as well as for compounds with low-dimensionalpathways on the orientation of the transport pathways relative tothe long and short particle extensions. Therefore, it mustbe expected that the pathway tortuosity exponent g will dependon the pathway dimensionality. The diffusion length will, asdiscussed above, in compounds with one-dimensional conduc-tors also be strongly influenced by the concentration of blockingdefects (see e.g. also ref. 70, 71 and 92).
Based on the assumption that diffusion inside the cathodematerial limits the rate performance, it is obvious that theachievable rate performance of the cathode materials willalso depend on temperature as expressed in eqn (13). Thus,testing the temperature of the rate performance may serve as a
Fig. 14 Dependence of the achievable critical C-rate W, the relevantmigration barrier height EA and the effective pathway dimensionality d.The straight line in the double-logarithmic plot indicates the regressionaccording to the fit function of eqn (13).
Fig. 15 Dependence of the achieved critical C-rate W in Na3(VO)2(PO4)2Fon the median particle size as an approximate measure value for the lengthof the effective ion diffusion inside the particle. Data points refer to fits tothe rate performances reported in four literature studies.88–91 The solidline corresponds to a power law fit W p l�g.
Paper PCCP
Ope
n A
cces
s A
rtic
le. P
ublis
hed
on 2
1 Fe
brua
ry 2
017.
Dow
nloa
ded
on 1
1/18
/202
1 8:
18:3
9 A
M.
Thi
s ar
ticle
is li
cens
ed u
nder
a C
reat
ive
Com
mon
s A
ttrib
utio
n-N
onC
omm
erci
al 3
.0 U
npor
ted
Lic
ence
.View Article Online

7520 | Phys. Chem. Chem. Phys., 2017, 19, 7506--7523 This journal is© the Owner Societies 2017
plausibility test. As an example, data from ref. 27 for Na2FeP2O7
and Na1.56Fe1.22P2O7 confirm that the temperature dependenceof the rate performance can be expressed by the exponentialrelationship between W and T (cf. Fig. 16)
W = f1e�A/kBT, (14)
where f1 and A are positive constants. As seen from Fig. 16 thesetwo compounds with similar pathway topology and migrationbarriers will also exhibit a similar temperature dependence oftheir rate performance that may be related to the activationenergy EA and pathway dimensionality d as the key descriptorsof the pathway network. Taking Na2FeP2O7 as an example, adoubling of W from 10 to 20 h�1 already requires a temperatureincrease from 25 1C to 45 1C.
Besides W, the value of the stretching exponent b in eqn (5a)also represents a structural feature. Essentially it relates to howcomplex the transport process will be. In more ordered compoundswhere defect formation and defect migration have to be consideredand most attempted hops will be unsuccessful, a value of bE 0.5 isto be expected, while in ‘‘fast-ion conductors’’ with a high concen-tration of mobile defects (which may be interstitial ions of or vacantlow energy sites for the mobile species) it will approximate bE 1 asthe creation of additional defects plays no significant role for theanyways high success rate of elementary migration steps for mobileions with sufficient kinetic energy. Indeed Fig. 17 shows a transi-tion from b E 0.5 to a value close to b E 1 as a function of the‘‘defect concentration’’, which for the sake of simplicity is here justtaken as the sum of the interstitial Na+ ions and the number ofvacant low energy Na sites, relative to the number of Na per unitcell. More refined measures for the ‘‘defect concentration’’ mayfurther reduce the scatter of the values.
A maybe not so intuitive consequence of the different stretch-ing exponent values b for different cathode materials may beworth noting. It implies opposite design guidelines for batteriesand battery–supercapacitor hybrid systems (pseudo-capacitors).Pseudo-capacitors operate at high C-rates c W and therefore itwill be advantageous to choose materials for which the exponent bis low (ideally 0.5), whereas for high rate batteries operating atrates just below W it is crucial to use a material with b E 1 to
retain a high capacity. At a rate of W/4 a material with b = 0.5e.g. retains only 61% of its capacity, while for b = 1 it wouldretain 78% of its low-rate capacity. When operated at a rate of4W a material with b = 0.5 still has 13.5% of its low-rate capacitywhereas for a material with b = 1 the capacity dropped alreadyto 1.8% of its low-rate value. For battery materials with high-dimensional pathways but low defect concentrations (and henceb E 0.5) the capacity at C-rates slightly below W can be signifi-cantly enhanced by introducing redox-inactive aliovalentdopants that boost the defect concentration (while in com-pounds with low-dimensional pathways this holds only if thedopants do not block the pathways).
The third empirical parameter a, i.e. the fraction of the notrealised theoretical capacity at low rates comprises a variety ofeffects such as interfacial kinetics, pathway blocking by impurities,chemical incompatibilities of cathode components, SEI formation,low electronic conductivity, volume changes and phase transitionsduring (de)sodiation etc. so that we cannot expect to derive astrong correlation to any structural feature. Still, it is observed thata high pathway dimensionality, low activation energy (and thus ahigh W value) tends to favour a low a value, i.e. an almost completeutilisation of the theoretical capacity.
4. Conclusions
In this work, we have proposed to quantify the rate performancesof sodium cathode materials in half-cells using the stretchedexponential function. This allows a systematic comparison amongdifferent compounds in terms of the critical C-rate W, inaccessiblefraction of theoretical capacity a, and defect concentration-dependent b. We have also shown that W is fundamentallyrelated to the underlying structural features as they in turndetermine the pathway topology, which can be characterizedby two main descriptors: limiting migration barrier EA andpathway dimension d. The dependence of W on particle sizeand temperature is also demonstrated. We believe our work wouldfacilitate a deeper understanding of the various contributing factors
Fig. 16 Dependence of the achieved critical C-rate W in two selectedpyrophosphate compounds on the operating temperature. Data pointsrefer to fits to the rate performances reported in ref. 27. The dotted linescorrespond to a W = ce�b/T fit.
Fig. 17 Dependence of the stretching exponent b on the number of defects ofthe mobile species relative to the number of sodium ions per formula unit forthe studied compounds. To reduce experimental scatter results for compoundswith similar defect concentrations are averaged. Error bars indicate the standarddeviation of this average. The broken line is a guide to the eye.
PCCP Paper
Ope
n A
cces
s A
rtic
le. P
ublis
hed
on 2
1 Fe
brua
ry 2
017.
Dow
nloa
ded
on 1
1/18
/202
1 8:
18:3
9 A
M.
Thi
s ar
ticle
is li
cens
ed u
nder
a C
reat
ive
Com
mon
s A
ttrib
utio
n-N
onC
omm
erci
al 3
.0 U
npor
ted
Lic
ence
.View Article Online
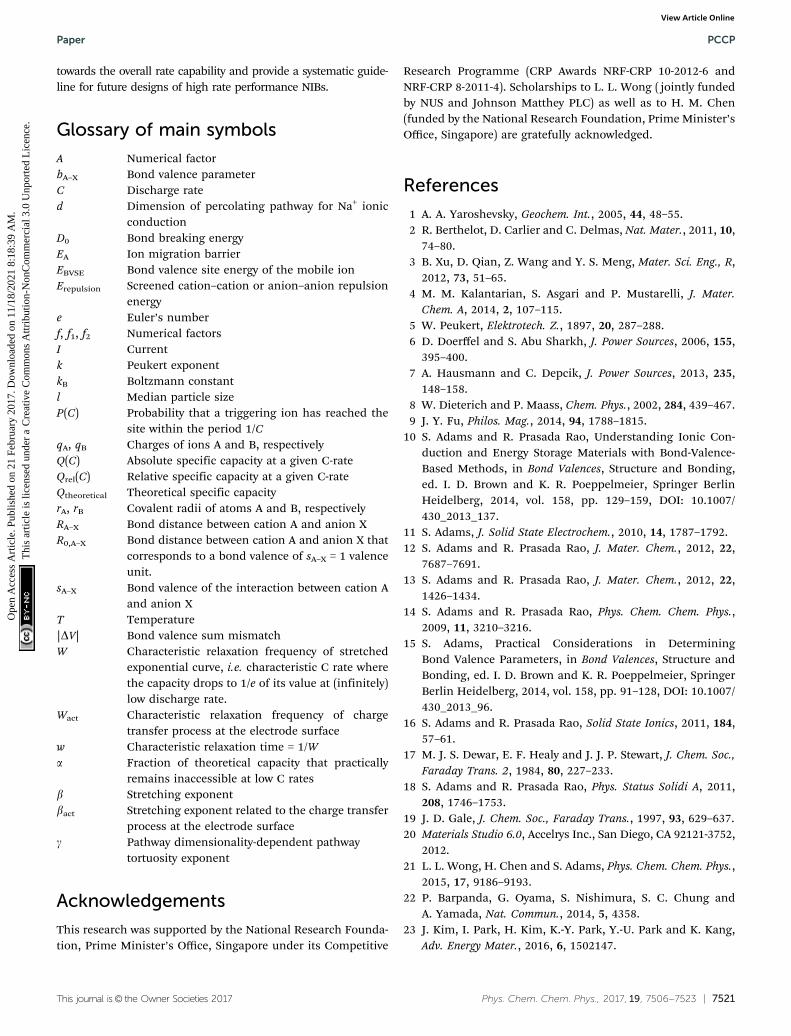
This journal is© the Owner Societies 2017 Phys. Chem. Chem. Phys., 2017, 19, 7506--7523 | 7521
towards the overall rate capability and provide a systematic guide-line for future designs of high rate performance NIBs.
Glossary of main symbols
A Numerical factorbA–X Bond valence parameterC Discharge rated Dimension of percolating pathway for Na+ ionic
conductionD0 Bond breaking energyEA Ion migration barrierEBVSE Bond valence site energy of the mobile ionErepulsion Screened cation–cation or anion–anion repulsion
energye Euler’s numberf, f1, f2 Numerical factorsI Currentk Peukert exponentkB Boltzmann constantl Median particle sizeP(C) Probability that a triggering ion has reached the
site within the period 1/CqA, qB Charges of ions A and B, respectivelyQ(C) Absolute specific capacity at a given C-rateQrel(C) Relative specific capacity at a given C-rateQtheoretical Theoretical specific capacityrA, rB Covalent radii of atoms A and B, respectivelyRA–X Bond distance between cation A and anion XR0,A–X Bond distance between cation A and anion X that
corresponds to a bond valence of sA–X = 1 valenceunit.
sA–X Bond valence of the interaction between cation Aand anion X
T Temperature|DV| Bond valence sum mismatchW Characteristic relaxation frequency of stretched
exponential curve, i.e. characteristic C rate wherethe capacity drops to 1/e of its value at (infinitely)low discharge rate.
Wact Characteristic relaxation frequency of chargetransfer process at the electrode surface
w Characteristic relaxation time = 1/Wa Fraction of theoretical capacity that practically
remains inaccessible at low C ratesb Stretching exponentbact Stretching exponent related to the charge transfer
process at the electrode surfaceg Pathway dimensionality-dependent pathway
tortuosity exponent
Acknowledgements
This research was supported by the National Research Founda-tion, Prime Minister’s Office, Singapore under its Competitive
Research Programme (CRP Awards NRF-CRP 10-2012-6 andNRF-CRP 8-2011-4). Scholarships to L. L. Wong ( jointly fundedby NUS and Johnson Matthey PLC) as well as to H. M. Chen(funded by the National Research Foundation, Prime Minister’sOffice, Singapore) are gratefully acknowledged.
References
1 A. A. Yaroshevsky, Geochem. Int., 2005, 44, 48–55.2 R. Berthelot, D. Carlier and C. Delmas, Nat. Mater., 2011, 10,
74–80.3 B. Xu, D. Qian, Z. Wang and Y. S. Meng, Mater. Sci. Eng., R,
2012, 73, 51–65.4 M. M. Kalantarian, S. Asgari and P. Mustarelli, J. Mater.
Chem. A, 2014, 2, 107–115.5 W. Peukert, Elektrotech. Z., 1897, 20, 287–288.6 D. Doerffel and S. Abu Sharkh, J. Power Sources, 2006, 155,
395–400.7 A. Hausmann and C. Depcik, J. Power Sources, 2013, 235,
148–158.8 W. Dieterich and P. Maass, Chem. Phys., 2002, 284, 439–467.9 J. Y. Fu, Philos. Mag., 2014, 94, 1788–1815.
10 S. Adams and R. Prasada Rao, Understanding Ionic Con-duction and Energy Storage Materials with Bond-Valence-Based Methods, in Bond Valences, Structure and Bonding,ed. I. D. Brown and K. R. Poeppelmeier, Springer BerlinHeidelberg, 2014, vol. 158, pp. 129–159, DOI: 10.1007/430_2013_137.
11 S. Adams, J. Solid State Electrochem., 2010, 14, 1787–1792.12 S. Adams and R. Prasada Rao, J. Mater. Chem., 2012, 22,
7687–7691.13 S. Adams and R. Prasada Rao, J. Mater. Chem., 2012, 22,
1426–1434.14 S. Adams and R. Prasada Rao, Phys. Chem. Chem. Phys.,
2009, 11, 3210–3216.15 S. Adams, Practical Considerations in Determining
Bond Valence Parameters, in Bond Valences, Structure andBonding, ed. I. D. Brown and K. R. Poeppelmeier, SpringerBerlin Heidelberg, 2014, vol. 158, pp. 91–128, DOI: 10.1007/430_2013_96.
16 S. Adams and R. Prasada Rao, Solid State Ionics, 2011, 184,57–61.
17 M. J. S. Dewar, E. F. Healy and J. J. P. Stewart, J. Chem. Soc.,Faraday Trans. 2, 1984, 80, 227–233.
18 S. Adams and R. Prasada Rao, Phys. Status Solidi A, 2011,208, 1746–1753.
19 J. D. Gale, J. Chem. Soc., Faraday Trans., 1997, 93, 629–637.20 Materials Studio 6.0, Accelrys Inc., San Diego, CA 92121-3752,
2012.21 L. L. Wong, H. Chen and S. Adams, Phys. Chem. Chem. Phys.,
2015, 17, 9186–9193.22 P. Barpanda, G. Oyama, S. Nishimura, S. C. Chung and
A. Yamada, Nat. Commun., 2014, 5, 4358.23 J. Kim, I. Park, H. Kim, K.-Y. Park, Y.-U. Park and K. Kang,
Adv. Energy Mater., 2016, 6, 1502147.
Paper PCCP
Ope
n A
cces
s A
rtic
le. P
ublis
hed
on 2
1 Fe
brua
ry 2
017.
Dow
nloa
ded
on 1
1/18
/202
1 8:
18:3
9 A
M.
Thi
s ar
ticle
is li
cens
ed u
nder
a C
reat
ive
Com
mon
s A
ttrib
utio
n-N
onC
omm
erci
al 3
.0 U
npor
ted
Lic
ence
.View Article Online
7522 | Phys. Chem. Chem. Phys., 2017, 19, 7506--7523 This journal is© the Owner Societies 2017
24 P. Singh, K. Shiva, H. Celio and J. B. Goodenough, EnergyEnviron. Sci., 2015, 8, 3000–3005.
25 Y. Meng, T. Yu, S. Zhang and C. Deng, J. Mater. Chem. A,2016, 4, 1624–1631.
26 G. Li, D. Jiang, H. Wang, X. Lan, H. Zhong and Y. Jiang,J. Power Sources, 2014, 265, 325–334.
27 C.-Y. Chen, K. Matsumoto, T. Nohira and R. Hagiwara,J. Electrochem. Soc., 2015, 162, A176–A180.
28 G. Longoni, J. E. Wang, Y. H. Jung, D. K. Kim, C. M. Mariand R. Ruffo, J. Power Sources, 2016, 302, 61–69.
29 H. Kim, G. Yoon, I. Park, K.-Y. Park, B. Lee, J. Kim, Y.-U.Park, S.-K. Jung, H.-D. Lim, D. Ahn, S. Lee and K. Kang,Energy Environ. Sci., 2015, 8, 3325–3335.
30 H. Kim, I. Park, D.-H. Seo, S. Lee, S.-W. Kim, W. J. Kwon,Y.-U. Park, C. S. Kim, S. Jeon and K. Kang, J. Am. Chem. Soc.,2012, 134, 10369–10372.
31 H. Kim, I. Park, S. Lee, H. Kim, K.-Y. Park, Y. Park, H. Kim,J. Kim, H.-D. Lim, W.-S. Yoon and K. Kang, Chem. Mater.,2013, 25, 3614–3622.
32 S. Zhang, C. Deng and Y. Meng, J. Mater. Chem. A, 2014, 2,20538–20544.
33 P. Barpanda, G. Liu, M. Avdeev and A. Yamada, ChemElec-troChem, 2014, 1, 1488–1491.
34 Y. Kee, N. Dimov, A. Staikov, P. Barpanda, Y.-C. Lu,K. Minami and S. Okada, RSC Adv., 2015, 5, 64991–64996.
35 C. S. Park, H. Kim, R. A. Shakoor, E. Yang, S. Y. Lim,R. Kahraman, Y. Jung and J. W. Choi, J. Am. Chem. Soc.,2013, 135, 2787–2792.
36 H. Kim, C. S. Park, J. W. Choi and Y. Jung, Angew. Chem., Int.Ed., 2016, 55, 6662–6666.
37 P. P. Prosini, C. Cento, A. Masci and M. Carewska, SolidState Ionics, 2014, 263, 1–8.
38 Y. Zhu, Y. Xu, Y. Liu, C. Luo and C. Wang, Nanoscale, 2013,5, 780–787.
39 Y.-L. Ruan, K. Wang, S.-D. Song, X. Han and B.-W. Cheng,Electrochim. Acta, 2015, 160, 330–336.
40 Y.-U. Park, D.-H. Seo, H.-S. Kwon, B. Kim, J. Kim, H. Kim,I. Kim, H.-I. Yoo and K. Kang, J. Am. Chem. Soc., 2013, 135,13870–13878.
41 L. Wang, J. Song, R. Qiao, L. A. Wray, M. A. Hossain, Y.-D. Chuang, W. Yang, Y. Lu, D. Evans, J.-J. Lee, S. Vail,X. Zhao, M. Nishijima, S. Kakimoto and J. B. Goodenough,J. Am. Chem. Soc., 2015, 137, 2658–2664.
42 H. Chen, Q. Hao, O. Zivkovic, G. Hautier, L.-S. Du, Y. Tang,Y.-Y. Hu, X. Ma, C. P. Grey and G. Ceder, Chem. Mater., 2013,25, 2777–2786.
43 S. Xu, Y. Wang, L. Ben, Y. Lyu, N. Song, Z. Yang, Y. Li, L. Mu,H.-T. Yang, L. Gu, Y.-S. Hu, H. Li, Z.-H. Cheng, L. Chen andX. Huang, Adv. Energy Mater., 2015, 5, 1501156.
44 M. Jayakumar, K. Hemalatha, K. Ramesha and A. S.Prakash, Phys. Chem. Chem. Phys., 2015, 17, 20733–20740.
45 Y. Kawabe, N. Yabuuchi, M. Kajiyama, N. Fukuhara,T. Inamasu, R. Okuyama, I. Nakai and S. Komaba, Electro-chem. Commun., 2011, 13, 1225–1228.
46 M. Xu, L. Wang, X. Zhao, J. Song, H. Xie, Y. Lua and J. B.Goodenough, Phys. Chem. Chem. Phys., 2013, 15, 13032–13037.
47 K. H. Ha, S. H. Woo, D. Mok, N.-S. Choi, Y. Park, S. M. Oh,Y. Kim, J. Kim, J. Lee, L. F. Nazar and K. T. Lee, Adv. EnergyMater., 2013, 3, 770–776.
48 R. Kohlrausch, Ann. Phys., 1854, 167, 56–82; R. Kohlrausch,Ann. Phys., 1854, 167, 179–214.
49 G. Williams and D. C. Watts, Trans. Faraday Soc., 1970, 66,80–85.
50 S. H. Glarum, J. Chem. Phys., 1960, 33, 369.51 P. Bordewijk, Chem. Phys. Lett., 1975, 32, 592.52 S. R. Elliott and A. P. Owens, Philos. Mag. B, 1989, 60,
777–792.53 J. Klafter and M. F. Shlesinger, Proc. Natl. Acad. Sci. U. S. A.,
1986, 83, 848.54 K. L. Ngai, Comments Solid State Phys., 1979, 9, 127; K. L. Ngai,
Comments Solid State Phys., 1979, 9, 141; K. L. Ngai andR. W. Rendell, J. Non-Cryst. Solids, 1990, 131, 233.
55 (a) K. Funke, B. Roling and M. Lange, Solid State Ionics,1998, 105, 195–208; (b) K. Funke, R. D. Banhatti andC. Cramer, Phys. Chem. Chem. Phys., 2005, 7, 157–165.
56 S. Guo, H. Yu, D. Liu, W. Tian, X. Liu, N. Hanada, M. Ishidaand H. Zhou, Chem. Commun., 2014, 50, 7998–8001.
57 X. Jiang, S. Liu, H. Xu, L. Chen, J. Yang and Y. Qian, Chem.Commun., 2015, 51, 8480–8483.
58 G. Oyama, S.-i. Nishimura, Y. Suzuki, M. Okubo andA. Yamada, ChemElectroChem, 2015, 2, 1019–1023.
59 T. Shiratsuchi, S. Okada, J. Yamaki and T. Nishida, J. PowerSources, 2006, 159, 268–271.
60 T. Balic Zunic, A. Garavelli, P. Acquafredda, E. Leonardsenand S. P. Jakobsson, Mineral. Mag., 2009, 73, 51–57.
61 T. Honma, T. Togashi, N. Ito and T. Komatsu, J. Ceram.Soc. Jpn., 2012, 120, 344–346.
62 H. Kim, R. A. Shakoor, C. Park, S. Y. Lim, J. S. Kim, Y. N. Jo,W. Cho, K. Miyasaka, R. Kahraman, Y. Jung and J. W. Choi,Adv. Funct. Mater., 2013, 23, 1147–1155.
63 P. Barpanda, G. Liu, C. D. Ling, M. Tamaru, M. Avdeev,S. Chung, Y. Yamada and A. Yamada, Chem. Mater., 2013,25, 3480–3487.
64 J. M. Clark, P. Barpanda, A. Yamada and M. Islam, J. Mater.Chem. A, 2014, 2, 11807–11812.
65 P. Barpanda, T. Ye, S. Nishimura, S. Chung, Y. Yamada,M. Okubo, H. Zhou and A. Yamada, Electrochem. Commun.,2012, 24, 116–119.
66 J. Angenault, J. C. Couturier, M. Quarton and F. Robert,Eur. J. Solid State Inorg. Chem., 1995, 32, 335–343.
67 S. M. Wood, C. Eames, E. Kendrick and M. S. Islam,J. Phys. Chem. C, 2015, 119, 15935–15941.
68 D. Kundu, R. Tripathi, G. Popov, W. R. M. Makahnouk andL. F. Nazar, Chem. Mater., 2015, 27, 885–891.
69 C. Wang, M. Sawicki, J. A. Kaduk and L. L. Shaw,J. Electrochem. Soc., 2015, 162, A1601–A1609.
70 S. Adams, Appl. Energy, 2012, 90, 323–328.71 R. P. Rao, M. V. Reddy, S. Adams and B. V. R. Chowdari,
Mater. Res. Bull., 2015, 66, 71–75.72 V. Palomares, M. Casas-Cabanas, E. Castillo-Martı́nez,
M. H. Han and T. Rojo, Energy Environ. Sci., 2013, 6,2312–2337.
PCCP Paper
Ope
n A
cces
s A
rtic
le. P
ublis
hed
on 2
1 Fe
brua
ry 2
017.
Dow
nloa
ded
on 1
1/18
/202
1 8:
18:3
9 A
M.
Thi
s ar
ticle
is li
cens
ed u
nder
a C
reat
ive
Com
mon
s A
ttrib
utio
n-N
onC
omm
erci
al 3
.0 U
npor
ted
Lic
ence
.View Article Online

This journal is© the Owner Societies 2017 Phys. Chem. Chem. Phys., 2017, 19, 7506--7523 | 7523
73 R. Prasada Rao, M. H. Chen and S. Adams, J. Solid StateElectrochem., 2012, 16, 3349–3354.
74 Z. Jian, C. Yuan, W. Han, X. Lu, L. Gu, X. Xi, Y.-S. Hu, H. Li,W. Chen, D. Chen, Y. Ikuhara and L. Chen, Adv. Funct.Mater., 2014, 24, 4265–4272.
75 S. Y. Lim, H. Kim, R. A. Shakoor, Y. Jung and J. W. Choi,J. Electrochem. Soc., 2012, 159, A1393–A1397.
76 Z. Jian, Y. Sun and X. Ji, Chem. Commun., 2015, 51,6381–6383.
77 Z. L. Jian, L. Zhao, H. L. Pan, Y. S. Hu, H. Li, W. Chen andL. Q. Chen, Electrochem. Commun., 2012, 14, 86–89.
78 K. M. Bui, V. A. Dinh, S. Okada and T. Ohno, Phys. Chem.Chem. Phys., 2015, 17, 30433–30439.
79 J. P. Boilot, G. Collin and Ph. Colomban, Mater. Res. Bull.,1987, 22, 669–676.
80 J. Gopalakrishnan and K. K. Rangan, Chem. Mater., 1992, 4,745–747.
81 W. Song, X. Cao, Z. Wu, J. Chen, K. Huangfu, X. Wang,Y. Huang and X. Ji, Phys. Chem. Chem. Phys., 2014, 16,17681–17687.
82 H. Li, X. Yu, Y. Bai, F. Wu, C. Wu, L. Y. Liu and X.-Q. Yang,J. Mater. Chem. A, 2015, 3, 9578–9586.
83 A. D. Robertson, A. R. West and A. G. Ritchie, Solid StateIonics, 1997, 104, 1–11.
84 R. A. Shakoor, D. H. Seo, H. Kim, Y. U. Park, J. Kim,S. W. Kim, H. Gwon, S. Lee and K. Kang, J. Mater. Chem.,2012, 22, 20535–20541.
85 M. Bianchini, N. Brisset, F. Fauth, F. Weill, E. Elkaim,E. Suard, C. Masquelier and L. Croguennec, Chem. Mater.,2014, 26, 4238–4247.
86 I. L. Matts, S. Dacek, T. K. Pietrzak, R. Malik and G. Ceder,Chem. Mater., 2015, 27, 6008–6015.
87 W. Song, X. Cao, Z. Wu, J. Chen, Y. Zhu, H. Hou, Q. Lan andX. Ji, Langmuir, 2014, 30, 12438–12446.
88 Y. Qi, L. Mu, J. Zhao, Y.-S. Hu, H. Liu and S. Dai, Angew.Chem., Int. Ed., 2015, 54, 9911–9916.
89 H. Jin, J. Dong, E. Uchaker, Q. Zhang, X. Zhou, S. Hou, J. Liand G. Cao, J. Mater. Chem. A, 2015, 3, 17563–17568.
90 M. Xu, P. Xiao, S. Stauffer, J. Song, G. Henkelman andJ. B. Goodenough, Chem. Mater., 2014, 26, 3089–3097.
91 P. Serras, V. Palomares, P. Kubiak, L. Lezama and T. Rojo,Electrochem. Commun., 2013, 34, 344–347.
92 R. Malik, D. Burch, M. Bazant and G. Ceder, Nano Lett.,2010, 10, 4123–4127.
Paper PCCP
Ope
n A
cces
s A
rtic
le. P
ublis
hed
on 2
1 Fe
brua
ry 2
017.
Dow
nloa
ded
on 1
1/18
/202
1 8:
18:3
9 A
M.
Thi
s ar
ticle
is li
cens
ed u
nder
a C
reat
ive
Com
mon
s A
ttrib
utio
n-N
onC
omm
erci
al 3
.0 U
npor
ted
Lic
ence
.View Article Online