design of for the - ucl discoverydiscovery.ucl.ac.uk/1447208/1/filippo...
TRANSCRIPT

1
Design and pre‐testing
of lipid‐based, ready‐to‐use foods for the prevention and treatment
of malnutrition in low‐resource settings
Filippo Dibari
Thesis submitted to University College London
in part fulfilment of the degree of PhD
Institute of Global Health
(formally the Centre for International Health and Development)
Institute of Child Health / UCL

2
Source: Filippo Dibari, Benin 2006.

3
Declaration I, Filippo Dibari, confirm that the work presented in this thesis is my own. Where information has been derived from other sources, I confirm that this has been indicated.
(Filippo Dibari)

4
Abstract
Background
Managing child and adult undernutrition is a global public health priority. In poor settings,
improved specialised products are needed for treatment and prevention, including for
chronic disease/HIV.
Objective
To develop a method for the design and pre‐clinical testing of novel, low‐cost Ready‐to‐Use
Therapeutic Foods (RUTF), to be also applied to supplementary/complementary feeding
interventions.
A method was developed and tested, using four sequential studies, with HIV‐positive
Kenyan adults with severe acute malnutrition (case‐study).
A qualitative study explored adherence and consumption barriers with the current UN‐
standard peanut/milk‐powder‐based therapeutic formulation (P‐RUTF).
A study using Linear Programming (LP) designed an improved, cheaper formulation
soy/maize/sorghum‐based (SMS‐RUTF), considered accurate if: its manufactured
prototype, compared to calculated values; it had a measured energy density difference
(EDD) <10%; a protein or lipid difference (P/LD) <5g/100g.
An acceptability study (4‐weeks‐cross‐over design; washout one‐week) compared use
of SMS‐RUTF against P‐RUTF (n=41), using 18 consumption/safety/preference criteria.
Based on a literature review (28 randomized controlled trials of micronutrient
supplementation; outcomes: increased survival and CD4 cell count, reduced viral load),
four criteria to determine micronutrient specifications for the SMS‐RUTF fortification
were developed and applied.

5
Results
The reported compliance with the prescribed RUTF was relatively low, and informed
the necessary formulation improvements.
The LP‐determined formulation was accurate (EDD: 7%; PD and LD: 2.3 and 1.0g/100g).
The LP‐based prototype was acceptable and safe, but with an average number of days
of nausea and vomit (0.16 and 0.04 d) occurred with a higher frequency (P < 0.05) than
in the control (0.09 and 0.02 d).
The existing evidence for determining micronutrient specifications for SMS‐RUTF
posed some challenges for the development of manufacturing specifications. Twelve of
the micronutrient specifications developed for SMS‐RUTF fortificant premix were
equivalent to the UN minimum standards; eleven were 2 to 10 times higher.
Conclusions
The proposed set of methods can be used to design and pre‐clinically test
improved/cheaper RUTF products, targeting malnourished adults. Novel formulations
should be clinically trialled before widespread‐use.

6
Abbreviations and acronyms
Abbreviation Complete form ACF Action Contre la Faim AIDS Acquired Immunological Deficiency SyndromeART Anti‐Retroviral TherapyBMI Body mass index CI Confidence Interval CIAA Confédération des Industries Agro‐Alimentaires de l'UE ‐ Confederation of
the food and drink industries of the EU CMAM Community‐based Management of Acute Malnutrition COREQ Consolidated criteria for reporting qualitative research CSB Corn Soy Blend CTC Community‐based Therapeutic CareDALY Disability‐adjusted life‐years DDS Diet Diversity Score DFE Dietary Folate Equivalents DFID Department for International DevelopmentDOTS Directly Observed Treatment Services DRI Dietary Recommended Intakes EAR Estimated Average Requirement EDD Energy Density Difference EFSA European Food Security Agency EPZ Export Processing Zone ERNA European Responsible Nutrition Alliance FANTA Food and Nutrition Technical AssistanceFAO Food and Agriculture Organization FBF Fortified blended food FCD Food Composition Database FDA Food and Drug AdministrationGAIN Global Alliance for Improved Nutrition GAM Global Acute Malnutrition GDP Gross Domestic Product GNC Global Nutrition ClusterHAART HAART ‐ Highly Active Antiretroviral TherapyHIV Human Immunodeficiency Virus HTP Harmonized Training Package IFAD International Fund for Agriculture iLiNS The International Lipid‐Based Nutrient SupplementsILSI International Life Sciences Institute IOM Institute of Medicine IQR Interquartile Range IRD Institute for Research and DevelopmentKEMRI Kenya Medical Research Institute LNS Lipid‐based Nutrient Supplement LNS Lipid nutrient supplement

7
Abbreviation Complete form LOAEL Lowest‐Observed‐Adverse‐Effect Level LP Linear ProgrammingMAM Moderate Acute Malnutrition MDG Millennium Development Goal(s) MoH Ministry of Health MSF Médecins Sans FrontiersMTCT Mother to Child Transmission MUAC Middle Upper Arm Circumference MUAC Mid‐Upper Arm Circumference NGO Non‐Governmental OrganizationNHMRC National Health and Medical Research Council NOAEL No‐Observed‐Adverse‐Effect Level PDCAAS Protein Digestibility‐corrected Amino Acid Score PEM Protein Energy MalnutritionPEPFAR President’s Emergency Plan for AIDS Relief P‐RUTF Peanut butter, milk powder based RUTF p‐value Value of statistical probability QFD Quality Functional Deployment ModelRCT Randomized Controlled Trial RDA Recommended Dietary Allowances RDI Reference Daily Intake RNI Recommended Nutrient Intake RUCF Ready‐to‐Use Complementary FoodRUF Ready‐to‐Use Food RUSF Ready‐to‐Use Supplementary Food RUTF Ready‐to‐Use Therapeutic FoodRUTFH Ready‐to‐Use Therapeutic Food for HIV/TBSAM Severe Acute Malnutrition SD Standard Deviation SFP Supplementary Feeding ProgrammeSMS‐RUTFh Soy, maize, sorghum RUTF specific for HIV and TBSTD Standard Deviation TB Tuberculosis TFC/P Therapeutic Feeding Centre/Programme TFD True Faecal DigestibilityTFP Therapeutic Feeding Programme UCL University College London UN United Nations UNHCR United National High Commission for the RefugeesUNICEF United Nations International Children’s Fund USD United States Dollar USDA United States Department of Agriculture WAM Weight‐for‐age % of medianWAZ Weight‐for‐age Z‐score WFDAS World Food Dietary Assessment System WFP World Food Programme WHM Weight‐for‐height % of median

8
Abbreviation Complete form WHO World Health Organization WHZ Weight‐for‐height Z‐score WPC Whey Protein Concentrate WPHNA World Public Health Nutrition Association WTO World Trade Organization

9
Table of Contents Declaration ............................................................................................................................... 2
Abstract .................................................................................................................................... 4
Abbreviations and acronyms .................................................................................................... 6
Table of Contents ..................................................................................................................... 9
Table of Figures ...................................................................................................................... 15
Tables ..................................................................................................................................... 17
Acknowledgements ................................................................................................................ 19
Foreword ................................................................................................................................ 20
Thesis outline ......................................................................................................................... 20
Role and description of the PhD student ............................................................................... 22
1 Background .................................................................................................................... 25
1.1 Malnutrition: a global public issue ......................................................................... 26
1.1.1 Malnutrition and its sub‐forms ...................................................................... 26
1.1.2 Prevalence of paediatric and adult malnutrition ........................................... 36
1.2 Management of undernutrition ............................................................................. 39
1.2.1 Evolution of the management of undernutrition .......................................... 43
1.2.2 Current classification ...................................................................................... 60
1.3 Ready‐to‐use foods for the management of undernutrition ................................. 61
1.3.1 Nomenclature ................................................................................................ 61
1.3.2 General description ........................................................................................ 67
1.3.3 Institutions and organizations with interest in ready‐to‐use foods ............... 69
1.3.4 Current research areas ................................................................................... 75
1.4 The problems and the knowledge gaps ................................................................. 76
1.4.1 How should improved RUF products be designed? ....................................... 76
1.4.2 How can novel RUF acceptability and safety be tested, prior to trialling their
effectiveness? ................................................................................................................. 77
1.4.3 What is the adherence to paediatric RUF formulations when used for older
people? 78
1.4.4 How can the cost of RUF be minimized? ........................................................ 78
1.4.5 How can micronutrients specifications in novel RUF be determined, when
requirements are unknown? .......................................................................................... 79

10
2 Rationale, aim, study plan, objectives and research questions ..................................... 80
2.1 Rationale ................................................................................................................ 81
2.2 General aim ............................................................................................................ 81
2.3 Study plan: the case‐study, the sub‐studies, and their objectives ......................... 81
2.3.1 The case‐study ............................................................................................... 81
2.3.2 The sub‐studies .............................................................................................. 82
3 Understanding the challenges in current usage of ready‐to‐use foods: an investigation
of adherence in a HIV/TB therapeutic nutrition programme in Kenya (sub‐study 1) ............ 85
3.1 Adherence .............................................................................................................. 86
3.1.1 The importance of adherence ........................................................................ 87
3.1.2 The determinants of adherence ..................................................................... 88
3.1.3 Recent evidence on adherence ...................................................................... 92
3.1.4 Measurement of adherence .......................................................................... 93
3.2 The overall and specific setting of the study .......................................................... 99
3.2.1 Kenya: generalities and nutrition‐related facts .............................................. 99
3.2.2 Kenya and HIV: prevalence and response .................................................... 100
3.2.3 Kenya and TB: prevalence and response ...................................................... 100
3.2.4 MSF: the HIV/TB programme in Nyanza Province ........................................ 101
3.2.5 The MSF nutrition programme .................................................................... 102
3.2.6 The Ahoua (et al. ) study .............................................................................. 103
3.3 Objectives of the study ........................................................................................ 104
3.4 Methods ............................................................................................................... 105
3.4.1 Study setting ................................................................................................ 105
3.4.2 Study design ................................................................................................. 105
3.5 Results .................................................................................................................. 108
3.5.1 Study group characteristics .......................................................................... 108
3.5.2 Understanding adherence ............................................................................ 113
3.5.3 Key barriers to adherence ............................................................................ 114
3.6 Discussion ............................................................................................................. 117
3.6.1 Factors related to product design ................................................................ 117
3.6.2 Factors related to programme design .......................................................... 118
3.6.3 Limitations of this study ............................................................................... 119

11
3.7 Conclusions .......................................................................................................... 120
4 Designing the RUF formulation (sub‐study 2) .............................................................. 121
4.1 Evolution of the use of Linear Programming ........................................................ 122
4.2 Linear programming applied to nutrition ............................................................ 123
4.3 The linear programming method ......................................................................... 126
4.4 The main elements in linear programming .......................................................... 126
4.4.1 Types of constraints ...................................................................................... 127
4.4.2 Constraints and unfeasible models .............................................................. 128
4.4.3 Software to apply linear programming ........................................................ 128
4.4.4 Food composition databases ....................................................................... 129
4.5 Why is linear programming important? ............................................................... 131
4.6 Objectives of the study ........................................................................................ 132
4.7 Method ................................................................................................................ 132
4.7.1 Phase A: food composition databases and food prices................................ 134
4.7.2 Phase B: Setting up and running the linear programming model ................ 136
4.7.3 Phase C: comparison with laboratory results and sensitivity analysis ......... 141
4.7.4 Prototype production: consideration about its processing technology ....... 141
4.8 Results .................................................................................................................. 142
4.9 Discussion ............................................................................................................. 145
4.10 Conclusions .......................................................................................................... 149
5 Trialling the acceptability and the safety of a novel RUF formulation: a randomized
controlled clinical crossover trial (sub‐study 3) ................................................................... 151
5.1 Introduction ......................................................................................................... 152
5.2 Acceptability ......................................................................................................... 152
5.2.1 The determinants of acceptability ............................................................... 153
5.2.2 Measurements of acceptability of foods ..................................................... 155
5.3 Safety .................................................................................................................... 158
5.3.1 Determinants of food safety ........................................................................ 158
5.3.2 The guiding principles to assess safety in novel foods ................................. 159
5.4 Objectives of the study ........................................................................................ 164
5.5 Material and methods .......................................................................................... 164
5.5.1 Trial and control products ............................................................................ 164

12
5.5.2 Study population .......................................................................................... 164
5.5.3 Study design ................................................................................................. 165
5.5.4 Study procedure and outcomes ................................................................... 166
5.5.5 Sample size ................................................................................................... 167
5.5.6 Statistical methods ....................................................................................... 167
5.5.7 Ethical issues ................................................................................................ 168
5.6 Results .................................................................................................................. 168
5.6.1 Characteristics of the participants ............................................................... 168
5.6.2 Measurement of acceptability ..................................................................... 171
5.7 Discussion ............................................................................................................. 174
5.7.1 The acceptability of SMS‐RUTFh .................................................................. 174
5.7.2 Lesson learnt about the method .................................................................. 175
5.8 Conclusion ............................................................................................................ 176
6 Determining micronutrient specifications for ready‐to‐use food, when
recommendations are not available: a method proposal (sub‐study 4) .............................. 177
6.1 Introduction ......................................................................................................... 178
6.1.1 Nutrient recommendations ......................................................................... 178
6.1.2 The dietary recommended intakes (DRI) ..................................................... 180
6.1.3 The criteria to determine nutrient recommendations ................................. 181
6.1.4 Micronutrients, HIV and TB .......................................................................... 185
6.1.5 What do the existing review studies tell us? ................................................ 191
6.2 Method to determine micronutrient specifications for a ready‐to‐use food, when
recommendations are not available ................................................................................ 193
6.2.1 Literature review strategy ............................................................................ 194
6.2.2 Parameters to determine the micronutrient specifications ......................... 194
6.2.3 Summary of the method .............................................................................. 200
6.3 Results .................................................................................................................. 202
6.3.1 The RCT studies ............................................................................................ 202
6.3.2 Randomized controlled trials using multiple micronutrient supplements .. 213
6.3.3 RCT studies with two or fewer micronutrient supplements ........................ 214
6.3.4 Safe Upper limits (UL) of daily micronutrient intake .................................... 215
6.3.5 The SMS‐RUTFh specifications ..................................................................... 227

13
6.3.6 Meeting the specification ratios .................................................................. 242
6.4 Discussion ............................................................................................................. 243
6.4.1 Was it correct to express the specifications as energy densities? ............... 243
6.4.2 What were the limitations in considering standard ranges from the 2007 UN
Joint Statement? .......................................................................................................... 244
6.4.3 Should the proposed specifications be close to the adult RDA values? ...... 246
6.4.4 Was it correct to apply the recommended UL values to ensure the safety of
the specifications? ....................................................................................................... 247
6.4.5 Were the ratios of key micronutrients appropriate for addressing the type of
wasting? 249
6.4.6 Was the evidence sufficiently robust to derive micronutrient specifications?
249
6.5 Conclusions .......................................................................................................... 253
7 General discussion and implications ............................................................................ 256
7.1 Key findings .......................................................................................................... 257
7.1.1 The framework ............................................................................................. 258
7.1.2 The Quality Functional Deployment model ................................................. 263
7.2 Generalizability of the findings ............................................................................ 265
7.2.1 Criteria to define the generalizability of the findings in public health research
265
7.2.2 Experiences in implementing the developed framework in other settings . 266
7.2.3 Conclusions about the generalizability of the framework ........................... 268
7.3 Implications of this study ..................................................................................... 268
7.4 Acknowledgement of limitations ......................................................................... 268
7.5 Recommendations for further research ............................................................... 270
7.5.1 Quality standards ......................................................................................... 270
7.5.2 Optimization of micronutrient absorption, digestibility, processing, and
packaging ..................................................................................................................... 271
7.5.3 Cost‐effectiveness analysis ........................................................................... 272
7.5.4 Use of probiotics, prebiotics or synbiotics in RUF ........................................ 273
7.5.5 Legal definition and protection .................................................................... 274
7.6 Summary of the main conclusions ....................................................................... 275

14
8 References .................................................................................................................... 277
9 Appendices ................................................................................................................... 326
9.1 Research articles .................................................................................................. 327
9.1.1 Directly related to this thesis ....................................................................... 327
9.1.2 Presentations to meetings and conferences ................................................ 328
9.2 Study‐related material ......................................................................................... 329
9.2.1 Ethical approval of the Kenyan studies ........................................................ 329
9.2.2 Compliance study ......................................................................................... 330
9.2.3 Acceptability and safety study ..................................................................... 335
9.3 Published articles ................................................................................................. 353

15
Table of Figures
Figure 1 ‐ Nutrition conceptual framework ........................................................................... 27
Figure 2 – Clinical forms of severe acute malnutrition: marasmus and bilateral pitting
oedema with skin changes of kwashiorkor. ........................................................................... 31
Figure 3 ‐ Prevalence of severe acute malnutrition in Africa. ................................................ 38
Figure 4 ‐ Flow‐chart for the choice of food aid items. .......................................................... 41
Figure 5 ‐ The Jamaican Paediatrician Cecily Williams (1893 ‐1992). .................................... 43
Figure 6 ‐ The first pictures of a dietetic disease (Kwashiorkor) never described before on a
medical journal. ..................................................................................................................... 43
Figure 7 ‐ Spatial distributions of per‐quadrat coverage in two feeding interventions
(Malawi). ................................................................................................................................ 54
Figure 8 ‐ Nutrition commodities ordered by UNICEF country offices (in Kcal). .................... 56
Figure 9 ‐ Relation between Application and Amount of LNS used. ...................................... 61
Figure 10 ‐ Map and logos of the RUF manufacturers collaborating with Nutriset. .............. 63
Figure 11 – Examples of equipment for spray drying for milk and whey powders (a), and of
extrusion of cereals and pulses blends (b). ............................................................................ 68
Figure 12 ‐ Packaging of RUF: sachet and cup. ...................................................................... 68
Figure 13 – Child self‐administering RUF. .............................................................................. 68
Figure 14 ‐ Trend of RUTF and RUF deliveries (MSF) ............................................................. 70
Figure 15 ‐ Logos of the academic institutions, NGO and private enterprises involved in the
iLiNS project. .......................................................................................................................... 71
Figure 16 ‐ Map of Kenya ....................................................................................................... 99
Figure 17 ‐ Proposed design and validation method for novel Ready‐to‐Use Foods. .......... 134
Figure 18 ‐ Microsoft Excel Sheet to optimize RUF formulation using Linear Programming.
............................................................................................................................................. 140
Figure 19 ‐ Algorithm to confirm the safety of a novel RUF ................................................ 160
Figure 20‐ Flow‐chart of the participants through the trial. ................................................ 170
Figure 21 – Diagram illustrating, in the proposed method, the links between scientific
evidence, nutrition recommendations, and product specifications .................................... 178
Figure 22 ‐ Relative positions of selected Dietary Reference Intake values ......................... 180
Figure 23 ‐ Ranking of validity of types of evidence for setting nutrient requirements ...... 182

16
Figure 24 ‐ Possible role of micronutrient deficiencies in HIV progression. ........................ 185
Figure 25 – Determination of micronutrient densities in a RUTF to rehabilitate HIV and/or
TB wasting in adults. ............................................................................................................ 195
Figure 26 – Estimated daily intakes of RUTF per adult wasted HIV/TB‐infected patients, and
expected nutrition and health outcomes............................................................................. 197
Figure 27 ‐ Summary of the method and its sequential steps. ............................................ 201
Figure 28 ‐ Literature research. Period: 1998 – 2011........................................................... 202
Figure 29 –A design and validation framework for novel RUF. ............................................ 259
Figure 30 ‐ Quality Functional Deployment model for the design of an improved ready‐to‐
use therapeutic food to rehabilitate wasted adults living with HIV and/or with TB. ........... 263

17
Tables
Table 1‐Classification of malnutrition forms . ....................................................................... 29
Table 2‐ Comparison of classifications of acute malnutrition (WFH, and/or oedema) and
associated risk of death (MUAC) in children and adults. ....................................................... 33
Table 3 ‐ Evolution of the management of acute malnutrition since 1933. ........................... 46
Table 4 ‐ Procurement of RUTF by UNICEF country programmes in 2003‐8 (over 100 MT). . 57
Table 5 ‐ Countries with reported SAM percentage for which UNICEF has not procured RUTF
in 2008. .................................................................................................................................. 58
Table 6 – Endorsed types of functional foods ........................................................................ 62
Table 7 ‐ UNICEF‐approved global RUTF suppliers ................................................................. 63
Table 8 ‐ Nutrition composition of RUTF ................................................................................ 67
Table 9 ‐ Maximum toxin levels allowed in RUTF ................................................................... 69
Table 10‐ Profile of patient participants. .............................................................................. 108
Table 11 ‐ Summary of methods and participants. .............................................................. 109
Table 12‐ Summary of key themes and sub‐themes. ........................................................... 110
Table 13 Components of the LP model and prototype RUTF formulation ........................... 138
Table 14 Sensitivity analysis of the final optimized model. ................................................. 144
Table 15 Comparison of the LP‐optimized model and the laboratory composition analysis of
the same formulation. ......................................................................................................... 145
Table 16 ‐ Characteristics of the participants at the start of the study (day 1), unless
specified otherwise. ............................................................................................................. 169
Table 17 ‐ Diet Diversity Score in phase 2 of the trial. ......................................................... 170
Table 18 ‐ Product consumption in the two combined groups (N1=20; N2=21). .................. 172
Table 19 ‐ Safety criteria using 24‐hour morbidity recall in combined groups (N1=20; N2=21).
............................................................................................................................................. 173
Table 20 ‐ Criteria for food preference (Likert score type; 5‐items) in the two groups (N1=20;
N2=21), expressed on the last days of phase 1 and 2 of the trial. ........................................ 173
Table 21‐ Criteria to order the strength of available evidence (when poor or limited). ...... 184
Table 22 Summary of randomized, controlled, micronutrient supplementation trials in HIV
and/or TB adults. .................................................................................................................. 205

18
Table 23 ‐ Composition and dosage of micronutrients used in reviewed trials. .................. 211
Table 24 ‐ Micronutrient composition in the RCT used to determine SMS‐RUTFh
specifications........................................................................................................................ 216
Table 25 ‐ Ratios between micronutrients: comparison between SMS‐RUTFh and the
reference ratios. ................................................................................................................... 242
Table 26‐ Nutrients provided by two food supplements, expressed as amount per day and
compared with estimated average requirements (EAR) for adults. ..................................... 244
Table 27 ‐ Definitions of internal and external validity, applicability and transferability. .... 265

19
Acknowledgements
This PhD is dedicated to the patients, the families and staff of the MSF HIV clinic, in Homa
Bay, Kenya. I am deeply grateful to them and to all whose help and support made this work
possible.
I also thank, at UCL: Marko Kerac, Melody Tondeur, Carlos Grijalva, and Mary Wickenden.
At Valid International and Valid Nutrition: Steve Collins (who, together with Mark Myatt,
believed in me since the first day we met), Anne Walsh, Lio Fieschi, Nicky Dent, Saul
Guerrero, Kate Sadler, Tanya Khara, and Immaculate for the “Communicable Valid‐addiction
syndrome”.
At MSF: Christine Genevier, Malik Allaouna, Anna Tavares, Manuela Rehr, Pamela Pomito,
and the rest of the MSF team at the HIV clinic of Homa Bay. I learnt and I enjoyed a lot with
them.
In Kenya: Ngetich Weldon Kiprono, Margareth Waga, and Brenda Akinyi. I could not have
had more valuable collaborators.
Paper co‐authors: Andrew Seal (UCL), Paluku Bahwere (Valid International), Helena Huerga
(MSF), Abel Hailu Irena (Valid International), Victor Owino (Valid Nutrition), El Hadji Diop
(Valid International), Isabelle Le Gall (MSF), David Mwaniki (KEMRI). Some of them became
friends too.
Institutional and funding support from: Valid International (via a DFID‐funded core grant
from CONCERN).
Personal: last but not least at all, I also dedicate this thesis to my “life‐partner‐in‐crime”
Paolo Paron for believing and supporting the realization of my wildest dreams, to my
parents for having transferred onto me their embarrassing stubbornness, to my two sisters
Camilla Dibari e Matilde Strippini for existing and genuinely loving me.

20
Foreword
Almost 9 million child deaths every year,
one‐third of the total, are related to undernutrition 1.
More than any other cause of mortality 1.
However, the problem of malnutrition remains a matter of shame 2.
Thesis outline
In Chapter 1, I present the background to this thesis, outlining how undernutrition is a
current global public health issue. I also describe the evolution of the management of acute
malnutrition, highlighting lipid‐based, ready‐to‐use food (RUF) as a key intervention within
the treatment package, and identify the current problems and knowledge gaps that
urgently need to be solved and filled.
In Chapter 2, I present the aims, the objectives, the study plan and the research questions.
In Chapter 3, I describe and discuss a method to understand the factors affecting usage of
current formulations of ready‐to‐use foods (sub‐study 1). As a case study, I tested this
method by investigating the adherence to a therapeutic nutrition intervention, in a Kenyan
HIV/TB programme.
In Chapter 4, I describe and discuss a method to design cheaper RUF formulations, fulfilling
macro‐nutrient requirements and food‐related standards (sub‐study 2).
In Chapter 5, I describe and discuss a method to test the acceptability and the safety of a
novel RUF formulation (sub‐study 3). I tested this method comparing the consumption, the

21
safety and the preference of a cheaper RUF with the most commonly used product with
HIV/TB patients in Kenya.
In Chapter 6, I propose and discuss an evidence‐based method to derive RUF micronutrient
specifications for malnourished groups, when requirements are not available (sub‐study 4).
In Chapter 7, I collate the key findings from the four studies into a method framework to
design RUF products, discussing the product design model, the generalisability of the
framework to other formulations, its limitations and its implications for nutrition treatment
programmes, concluding with recommendations for policy and research.
The Appendices contain other materials which are not included in the main body of the
thesis for reasons of space and flow. Also listed are publications arising from and closely
related to the research described.

22
Role and description of the PhD student
This thesis would not have been possible without the help and support of many individuals
and organizations. Following the time sequence of the research work, their contribution is
summarized in this section, and was agreed with both the sponsor of this study, the
organization Valid International, and my PhD supervisors.
Before the enrolment into the PhD programme
My wish to fight hunger in poor countries started in my early adolescence, grew during my
studies (MSc) in Food Science and Engineering (University of Udine, Italy; 1988‐1993), which
included a six month research project in Burundi, and consolidated during four years of
community‐based work with underprivileged communities in the Amazon forest of Brazil.
However, providing more and better food to groups in need proved to be inadequate to my
personal quest of working with hunger.
Those experiences induced me (i) to look closer at undernutrition, at ways of assessing the
size of the problem at community level, at the effects of such problems, and (ii) to develop
efficient interventions and solutions. Therefore, after a few years of work at FAO and in
IFAD programmes, and missions in Mozambique, Somalia, and Salvador, I completed a MSc
course in Public Health Nutrition, at the London School of Hygiene and Tropical Medicine
(2002‐2003).
In 2003‐2004, after experience as programme manager in a therapeutic feeding programme
(Democratic Republic of Congo), I engaged with nutrition research activities at the Institute
of Child Health (UCL) and WFP under the supervision of Dr Andy Seal, my tutor in this
thesis. In our assignment, we looked at the impact of WFP fortified blended food in
preventing pellagra in Angola.
In 2005, I started to work with the organization Valid International, covering three areas of
responsibility: the design and production set‐up of novel ready‐to‐use therapeutic foods,
the undertaking of programme coverage surveys, and the set‐up of community‐based
programmes for the management of acute malnutrition in African countries (Benin, Niger,

23
and Kenya, among others), in Asia (Bangladesh, Sri Lanka and Vietnam) and in central
America (Haiti).
During the enrolment into the PhD programme
Based on the work experience gained, in 2006, with the support from Valid International,
and a fund available from Concern World Wide, I conceived the scope of this thesis. Its
focus consists of the development of methods for the design and pre‐testing of ready‐to‐
use foods to prevent and manage acute malnutrition.
I officially enrolled into the UCL MPhil programme in November 2007 and Prof Tomkins
accepted to become my second supervisor, providing important guidance on the latest
drafts of my doctorate. In 2009, upgrading to the UCL PhD programme, the examining
commission helped me in achieving what is the current doctorate structure. Since 2007, Dr
Seal provided regular feedback on my research activities, and, based on the sub‐study 1, 2
and 3 of this thesis, helped me in getting three papers published in peer‐reviewed journals
(see section With first authorship at page 327).
In collaboration with the NGO Médecins San Frontiers (MSF), in a Kenyan HIV clinic located
on the Lake Victoria, I conducted the data collection of the first and the third core‐studies,
described here. The development of the linear programming based method for the second
sub‐study was supported by the collaboration with the largest food aid manufacturer in
Africa. In Nairobi, Insta Limited factory produced, at both small and large scales, the ready‐
to‐use food prototypes, while its laboratory conducted the chemical analysis.
The methodological approach and the results in the fourth and last sub‐study, looking at
RUF micronutrient specifications, when requirements are not available, was initially
discussed with Professor Friis from the University of Copenhagen, and its later stages
discussed with both Professor Mike Golden and MSF (Susan Sheperd and Saskia Van der
Kam).
Follow up of the PhD programme
The topic of this thesis is consistent with my current commitments. Since November 2012, I

24
work as Chief of the Nutrition Unit in the Mozambique Country Office of the World Food
Programme of the United Nations. With this current position, I manage an implementation
research controlled trial, funded by the Children Investment Foundation Fund (CIFF;
London), looking at prevention of stunting in children under two years of age (n=150,000 in
3.5 years will be enrolled in the intervention group only), and using lipid‐based, ready‐to‐
use complementary foods. The trial outcomes will shape future policies in stunting
prevention. Furthermore, in collaboration with other international agencies, academic
bodies and most of all the local Mozambican Government, I am looking into local/regional
design, testing and production of improved lipid‐based, ready‐to‐use foods for treatment of
chronically ill (HIV/TB) Mozambican adults.

25
1 Background

26
1.1 Malnutrition: a global public issue
It is an exciting time to work and research in the area of malnutrition. In a recent policy
paper, the WFP suggests that “recent years have seen rapidly growing interest in
nutrition, galvanized by The Lancet medical journal’s 2008 series, which describe the
scale and consequences of maternal and child undernutrition, and identify proven
interventions and strategies for reducing this burden”3. It is, therefore, not surprising that,
in middle and low‐income countries, “from 2004 and 2007, an estimated USD 350 million
were committed to nutrition programming annually”4, showing a slow but steady increasing
trend in this area of interventions.
1.1.1 Malnutrition and its sub‐forms
Malnutrition is a general term, which includes different forms of both undernutrition and
overnutrition. In general, malnutrition is a physical condition “which makes individuals
more susceptible to disease”5 and sometimes death. The present research focuses on the
forms of undernutrition occurring with high prevalence in “low‐income and middle‐income
economies, sometimes referred to as developing economies” by the World Bank6.
During the last decades, the classifications of malnutrition and its sub‐forms evolved
through a large number of definitions7–9. In this thesis, these are mostly based on the
“Harmonized Training Package (HTP) ‐ Resource Material for Training on Nutrition in
Emergencies”5, prepared by Nutrition Works on behalf of the UN Global Nutrition Cluster
(GNC). The following sections summarize the definitions of under‐ and overnutrition.

27
The HTP defines undernutrition as “an insufficient intake of energy, protein or
micronutrients that in turn leads to nutritional deficiency. Undernutrition encompasses
stunting, wasting and micronutrient deficiencies”. When present, this form of malnutrition
“weakens the immune system and increases the risk and severity of infections”3.
Overnutrition is defined as “abnormal or excessive fat accumulation that may impair
health”10. Undernutrition is common in low‐income groups in developing countries and is
strongly associated with poverty5. Many low‐ and middle‐income countries are facing a
"double burden" of both under and overnutrition10. In this thesis, overnutrition is not
covered in depth. This is because this form of malnutrition is relatively less associated with
emergency or low‐resources countries, compared to high‐resource world regions.
Undernutrition is “a complex, multi‐faceted problem”3 and the consequence of a large
number of health and environmental factors (Figure 1). However, inadequate dietary intake
Figure 1 ‐ Nutrition conceptual framework
Adapted by Levine and Chastre479 from UNICEF.

28
or low food absorption, in the presence of one or more diseases are the immediate causes.
Morbidity is associated with loss of appetite, malabsorption and/or loss of nutrients
through diarrhoea or vomiting5. “The ill persons need more nutrients to rehabilitate and if
they do not meet their needs they become malnourished”5. This relationship is known as
the malnutrition‐infection cycle11.

29
Table 1‐Classification of malnutrition forms .
Form of Malnutrition Anthropometry (WFH, BMI) and/or Mortality Risk (MUAC)
Infant <6 months
Children 6‐59 months Children 5‐19 years Adult
Undernutrition
Acute (Wasting )
Severe Clinical signs* and risk factors**
Weight‐for‐height Z‐score: < ‐3 SD MUAC: <115mm
MUAC for age Z‐score: < ‐3 SD
BMI‐for‐age Z‐score: <‐3SD~ MUAC: 170mm (men) & 160 mm (women)+ BMI: <16 kg/m2
Moderate Clinical signs* and risk factors**
Weight‐for‐height Z‐score: < ‐2 SD to ≥ ‐3 SD
MUAC: ≥ 115mm & < 125mm
BMI‐for‐age Z‐score: >‐3SD & <‐2SD~~
MUAC: <190 mm (women) & 200 mm (men) BMI: <17 to >16
Nutritional oedema
‐ Yes Yes Yes
Chronic (Stunting)
Severe ‐ Height‐for‐age Z‐score: < ‐3 SD ‐ ‐
Moderate ‐ Height‐for‐age Z‐score: <‐2 SD to ≥‐3 SD ‐ ‐
Underweight Severe ‐ Weight‐for‐age Z‐score: < ‐3 SD ‐ ‐
Moderate ‐ Weight‐for‐age Z‐score: <‐2 SD to ≥‐3 SD ‐ ‐
Overnutrition
Overweight
‐ ‐ BMI‐for‐age Z‐score: >+1SD to < +2SD BMI‐for‐age Z‐score: >+1SD to < +2SD BMI: >25 to <30 kg/m2
Obesity ‐ ‐ BMI‐for‐age Z‐score: >+2SD BMI‐for‐age Z‐score: >+2SD BMI: >30 kg/m2
Adjusted from HTP 20115, unless specified. HTP, Harmonised Training Package; MUAC, middle upper arm circumference; SD, standard deviation; BMI, body mass index. * E.g. oedema, visible wasting, too weak to suckle, not gaining weight despite feeding. ** E.g. insufficient breast milk, absence of mother. ~ The reported classification reports “severe thinness” rather than SAM or wasting. ~~ The reported classification reports “Thinness” rather than MAM. + Source: Ferro‐Luzzi (1996)12.

30
In undernutrition, acute, chronic and underweight are often
referred to as sub‐forms. In Table 1, these are classified
separately. However, malnourished people can also present
two or three forms simultaneously5, showing a higher
morbidity risk13. The following sections describe them in more
detail.
1.1.1.1 Acute malnutrition in children, adolescents and adults
Clinical forms of acute malnutrition can be defined by the
characteristics of severe wasting, also called marasmus,
and/or bilateral pitting oedema, found in Kwashiorkor as well
as in a range of other clinical signs.
Marasmus is a form of severe undernutrition, referred to
alternatively as non‐oedematous malnutrition. The
Wellcome Classification associated marasmus with
“severe wasting of fat and muscle, which the body
breaks down to make energy leaving ‘skin and bones’. A
child with marasmus is extremely thin with a wizened
‘old man’ appearance”5 (see Figure 2).
Kwashiorkor is a form of severe undernutrition, also referred
to as oedematous malnutrition. Kwashiorkor is
associated with growth failure (when compared with
healthy children) and characterised by oedema, loss of
appetite, thin, sparse or discoloured hair and skin with
discoloured patches that may crack and peel.
Kwashiorkor is associated with a pitting oedema
affecting both sides of the body (bilateral) (see Figure
2). Oedema is defined by the HTP as “swelling from
excessive accumulation of watery fluid in cells, or
tissues”.
Marasmic kwashiorkor is a form of severe undernutrition diagnosed by the presence of
Box 1 – Use of Z‐scores in nutritional indices
In the latest WHO classification, MUAC‐for‐age, Weight‐for‐height, Height‐for‐age, and Weight‐for‐age are indices based on the use of Z‐scores. The Z‐score describes how far a measurement is from the median, or the average in a healthy population. In 2006, WHO released growth curves aiming to set an international standard of how children “should grow when free of disease, and when their care follows healthy practices such as breastfeeding and non‐smoking”480. For example, the BMI‐for‐age Z‐score, another index calculated for an individual, indicates how many standard deviation units an individual’s BMI value is away from the median for the same age in the WHO standards481. The index can be positive or negative. If positive, the index suggests that the BMI is higher than the median value of an individual of the same age in the WHO reference. If negative, the BMI is lower than the same reference.
Ninety‐five percent of the WHO Growth Standard population has anthropometric Z‐scores between ‐2 and +2. This range is considered normal. For example, if a child’s Z‐score falls outside (>+2 or <‐2), this signals a deviation from the norm in his or her nutritional status 5.

31
Box 2 ‐ Formula to calculate body mass index
Body mass index =
Weight (kg) / height2 (m)
severe wasting and bilateral oedema.
Risk of short‐term death is assessed by the circumference of the left middle upper arm
(MUAC)1415, whereas nutritional indices referring to Z‐scores (explained in Box 1) are more
indicated to define the anthropometry of children presenting moderate (MAM) or severe
acute malnutrition (SAM). In addition, the presence of bilateral pitting oedema is
considered diagnostic for SAM.
Different cut‐offs values for those criteria are used for different age groups (Table 2). Acute
malnutrition can be found in very young children. Infants under six months of age affected
by SAM or MAM, presenting oedema, and/or visible wasting, are often too weak to suckle,
and may not gain weight despite correct feeding practices. Anthropometric measurements
cut‐offs are currently not available.
In SAM, children with less than five years of age show a weight‐for‐height Z‐score lower
than ‐3 standard deviations (SD). Middle upper‐arm circumference (MUAC) lower than 115
millimeters suggests high risk of short‐term mortality.
Children of the same age, affected by
MAM, are identified by weight‐for‐
height Z‐score ratio equivalent to or
higher than ‐3 SD, up to a maximum of ‐
2 SD. MUAC should be equivalent to, or
higher, than 115 mm, and lower than 125 mm to identify children at moderate risk of short‐
Figure 2 – Clinical forms of severe acute malnutrition: marasmus and bilateral pitting
oedema with skin changes of kwashiorkor.
Source: Valid International (2007).

32
term death.
In children and adolescents (5 to 19 years of age), SAM is defined respectively by a body
mass index (BMI)‐for‐age Z‐score lower than ‐3 SD, or, in case of MAM, by the same index
equivalent to or higher than ‐3 SD and lower than ‐2 SD.
Severely wasted male and female adults often present a MUAC respectively of 170 and 160
mm according to Ferro‐Luzzi and James12, and/or a BMI lower than 16 kg/m2. In the
moderate acute form, the MUAC cut‐off values for males and females are 200 and 190 mm.
BMI is calculated based on the weight (in kg) divided by the square of the height (in m) of
the individual (see Box 2).
However, in emergency‐settings, the diagnostic criteria suggested by Collins et al. 16 are
different. In these contexts, wasted adults of both genders should be admitted to
therapeutic feeding programmes when: their MUAC is below 160 mm, irrespective of
clinical signs; or their MUAC is between 161 and 185 mm in association either with bilateral
pitting oedema, or with inability to stand, or with apparent dehydration. According to the
same authors, admission to adult supplementary feeding centres should be based upon
MUAC between 161 and 185 mm. Table 2 compares the criteria to classify malnutrition in
children and adults.

33
1.1.1.2 Stunting (chronic malnutrition)
Chronic malnutrition or stunting share some of the underlying causes with acute
malnutrition. However, stunted children are identified only over a longer‐term, because of
limitations in the available diagnostic measurements. This form of malnutrition slows down
growth and reduces essential cognitive development in the affected children. Their height
remains evidently too short for their age.
It is commonly accepted5 that, after 24 months from birth, this condition may become
irreversible, and is likely to lead to stunted adults with reduced physical and cognitive
capacity. However, some recent evidence suggest that stunting is not an irreversible
condition. Prentice et al. 17 looked at early growth patterns in children from 54 resource‐
poor countries in Africa and Southeast Asia, and concluded that substantial height catch‐up
occurs between 24 months and midchildhood, and again between midchildhood and
adulthood, even in the absence of any interventions. More evidence is urgently needed.
Height‐for‐age is the index used to identify stunting. Moderate stunting is defined by a
Table 2‐ Comparison of classifications of acute malnutrition (WFH, and/or oedema) and
associated risk of death (MUAC) in children and adults.
In the first and the second tables, the classifications refer to children with 6 months to 5 years of
age and to adults. Source: Harmonized Training Package5.

34
deviation, from the norm, which is lower than ‐2 SD and higher than, or equivalent to, ‐3
SD. Severely stunted children are identified when the same index is lower than ‐3 SD.
1.1.1.3 Underweight
Underweight is a general measure that captures the presence of wasting and/or stunting. It
is therefore a composite indicator, reflecting either acute or chronic undernutrition without
distinguishing between the two.
Children with severe or moderate underweight show a weight‐for‐age Z‐score respectively
lower than ‐3 SD, or included between ‐3 and ‐2 SD.
1.1.1.4 HIV and TB wasting
Wasting associated with an infection differs from undernutrition due to low food intake.
The latter, as earlier defined, is related to nutritional or dietary causes, like reduced energy
or nutrient intakes. This sort of malnutrition was called “primary” in order to differentiate it
from “secondary” malnutrition, which is subsequent to an infection such as HIV and TB18,19.
The latter are associated with the loss of appetite20,21, which may also contribute to a
reduction of food intake.
Severe acute malnutrition is an important risk factor for mortality among HIV‐infected
children living in resource‐limited settings22. Complications like electrolyte disorders,
micronutrient deficiencies, and severe infections are often associated with SAM in HIV
positive children22.
Anthropometry, measured in adults, is strongly correlated with survival in presence of HIV
and TB wasting23,24. Paton et al. 25 observed that BMI < 17 kg/m2 is significantly associated
with higher adult mortality25, even in patients initiating anti‐retroviral treatment (ART).
However, no international agreement was found about BMI or MUAC cut‐offs to define
wasting syndrome associated with these infections. Moreover, very little evidence is
available showing the presence of nutritional oedema associated with HIV and TB, at least
in adults. In a recent study from Zambia26, HIV positive and negative children were found,
respectively, to be more likely to present marasmus or Kwashiorkor.

35
When treatment is available, ART side effects may be worse in malnourished than in
individuals, who are normal from the nutrition status point of view. This may be because of
the documented toxicity of ART27. The latter may affect their quality of life and their long‐
term survival22. Metabolic complications of ART include lipodistrophy, dyslipidemia, lactic
acidosis, insulin resistance, and osteopenia22.
1.1.1.5 Micronutrient deficiencies
Micronutrient malnutrition affects populations in emergencies and other settings. This form
of malnutrition is a significant cause of morbidity, mortality, and reduced human capital5.
Black et al. suggest that micronutrient deficiencies are responsible for most childhood
deaths and often co‐occur with stunting and/or wasting1. An inadequate dietary intake is
often the main cause. But infections can often alter the micronutrient levels in the plasma,
while reducing absorption of specific nutrients and increasing, as a consequence, their
intake requirements5. Poor growth in under‐fives results not only from a deficiency of
protein and energy, but also from an inadequate intake of vital minerals, and vitamins9,28.
The standards for micronutrients dietary requirements according to sex and age‐group are
available from the US Institute of Medicine, the WHO, the FAO, and the European
Commission. WHO considers anaemia, iodine‐related disorders and vitamin A deficiency
among the main priorities29. That is so, in particular among populations depending on food
aid.
In emergency settings, Seal and Prudhon30 report that micronutrient deficiencies have been
documented for years, especially in refugee camps where they were most frequently
assessed. For these specific contexts, the authors suggest methods to monitor the
micronutrient content of the diet, and to measure micronutrient deficiencies in humans,
taking into account programming issues.
1.1.1.6 Low weight at birth
Infant weight at birth is strongly associated not only with their chances of survival, growth,
long‐term health and psychosocial development, but also with their mothers’ health and
their nutritional status31. There is evidence that less than 2.5 kilograms at birth is a severe
health risk factor31.
1.1.1.7 Overweight and obesity
Overweight and obesity are forms of malnutrition. Kuczmarski et al. 32 define overweight as

36
the “weight that exceeds the threshold of a criterion standard or reference value”. A
review33 found that the available “studies have used a wide variety of obesity definitions
and cut off points”. However, most of them were based on BMI values33. For both forms of
overnutrition, Table 1 provides the anthropometric definitions in use by the UN.
The European regional office of WHO34 suggests that the cut‐off points of the 2006 BMI‐for‐
age reference for children, with less than five years, for the diagnosis of overweight and
obesity were set as the 97th and the 99th per centile, respectively. For those aged five to
nineteen years, overweight is defined as a BMI‐for‐age value over +1 SD and obesity as a
BMI‐for‐age value equal to or over +2 SD. Adults, whose BMI is greater than or equal to 25
kg/m2, are considered overweight, while if their BMI is at least equivalent to 30, they are
considered obese10.
After having defined malnutrition and its sub‐forms, the following sections explore their
prevalence at the global scale.
1.1.2 Prevalence of paediatric and adult malnutrition
Malnutrition is a global health issue, and the public health burden is not decreasing. In the
last two decades, for instance, UNICEF reports that, in developing countries, the relative
reduction of stunting was 28 per cent. However, due to population growth, the overall
number of African children under 5 years old who are stunted has increased, from an
estimated 43 million in 1990 to 52 million in 2008. Simultaneously, underweight prevalence
decreased very little, with only 3 per cent reduction in Africa (28% in 1990) and 6 per cent
in Asia (37% in 1990)35.
Hill et al. 36 consider nutrition an “ascendant issue on global and national policy agendas in
recent years, as a result of the global food crisis and growing recognition of the magnitude
and consequences of these problems for human and economic development”. This was
already reflected in universal recent policies such as the Millennium Development Goals
and the Copenhagen Consensus37,38, where nutrition‐related topics appeared among the
top priorities.
More recently, the World Bank advocated that nutrition should be repositioned at the top
of the priority agenda39, promoting the collaboration from a wide range of stakeholders.
This alliance includes governmental, non governmental institutions, donors and the private

37
sector. The initiative called Scaling Up Nutrition, is currently engaged in raising an annual
investment of USD 6.2 billion, needed to provide treatment to 3.5 million under five
children affected by SAM or MAM40.
1.1.2.1 Prevalence of Undernutrition
In 2012, the WFP policy document number 5 reports that “there are a staggering number of
hungry and undernourished people in the world. About 1 billion are undernourished,
while 2 billion suffer from micronutrient deficiencies”3. Among children under 5, 127
million are underweight41 and 56 million suffer from wasting1. WFP reports also that
“the 195 million stunted children are at higher risk of mortality and of suffering irreversible,
long‐term consequences” when compared with non‐stunted children3. Almost 9 million
child deaths every year, one‐third of the total, are related to undernutrition, more than any
other cause of mortality1, while it can be argued that actual causes of death from clinically
defined SAM are often not recorded by current disease classification.
In 2008, in a special issue of the medical journal The Lancet, Black et al. 1 confirm the
dramatic size of undernutrition and the related consequences. The data were based on 388
national surveys from 139 countries1. The global prevalence of underweight, stunting, and
wasting among children below 5 years of age, were based on the WHO Child Growth
Standards released in 2006. Of the 556 million children under 5 years of age in low‐income
countries, 20 per cent (112 million) were underweight, 32 per cent (178 million) were
stunted, and 10 per cent (55 million) were wasted, including 3.5 per cent (19 million) who
were severely wasted. Thus, about 36 million children are suffering from moderate wasting.
The impact of undernutrition was also estimated. Maternal and child undernutrition is the
underlying cause of 3.5 million deaths every year, 35 per cent of the disease burden in
children younger than 5 years and 11 per cent of total global disability‐adjusted life‐years
(DALY)1. The DALY is a measure of overall disease burden, expressed as the number of years
lost due to ill‐health, disability or early death. Stunting, severe wasting, and intrauterine
growth restriction together are responsible for 2.2 million deaths, and 21 per cent of DALY
for children younger than 5 years1. This is “the largest per centage of any risk factor ” in this
age group1.
Undernutrition has an impact on the economy of affected countries. Child undernutrition
costs poor economies USD 6.7 billion, or more than 6 per cent of their GDP 42. Of this total,

38
Figure 3 ‐ Prevalence of severe acute malnutrition in Africa.
90 per cent is caused by higher death rates and lower education levels42.
Human immunodeficiency virus contributes to increase mortality among undernourished
children. A systematic review and meta‐analysis43 explored HIV prevalence and mortality in
children undergoing treatment for SAM in sub‐Saharan Africa. In this study, among children
from 17 feeding programmes (n=4,891), 29.2 per cent were HIV‐infected and they were
more than three times more likely to die than HIV‐uninfected children43.
Less evidence is available to define the size of prevalence among adolescence and adults.
However, recent studies23,44–49 report that HIV/TB wasting in adults is a public health issue in
Sub‐Saharan Africa, in spite of the increasing access to ART. Uthman et al. 44 report that
demographic and health surveys from 11 sub‐Saharan African countries estimated that 10.3
per cent of HIV infected women (aged 15‐49 years) had BMI lower than 18.5 kg/m2.
Furthermore, severe wasting was found in advanced stages of the disease. For instance, in
urban Lusaka, Zambia, 9, 8 and 17 per cent (n=40,778) of people initiating ART were found
with a BMI lower than 16.0, 16.0 to 17.0, and 17.0 to 18.5 kg/m2 respectively45.
Undernutrition is also prevalent among older people. Whereas the population of the world

39
is ageing, undernutrition amongst individuals in this life‐stage is a global crisis, and set to
increase50. Visvanathan suggests50 that malnutrition is due to decreased intake and weight
loss, both in low and in high‐resources settings. At present, almost 44 per cent of healthy,
community dwelling, older people in developed countries are at risk of malnutrition51. More
precise figures are missing in countries with low‐income economies.
1.1.2.2 Prevalence of undernutrition in presence of overnutrition: the
double burden effect
According to WHO10, worldwide obesity has more than doubled since 1980. In 2008, 1.5
billion adults, 20 years and older, were overweight. Among these, over 200 million men and
nearly 300 million women were obese10. Nearly 43 million children under the age of five
were overweight in 201010. However, obesity is preventable10.
The same WHO document reports that many low‐ and middle‐income countries are now
facing a "double burden" of disease. Infections and undernutrition co‐exist with a rapid
upsurge in “non‐communicable disease risk factors”, as obesity and overweight are
currently called. Initially, this seemed particularly true in urban settings10. However, recent
evidence shows that rural areas are also increasingly affected52. Therefore, finding
undernutrition and obesity existing side‐by‐side within the same country, the same
community, and the same household has become less uncommon.
In both poor and large economies, children are more prone to follow inadequate food
habits10. High‐fat, high‐sugar, high‐salt, energy‐dense, and micronutrient‐poor foods tend
to be lower in cost. When these come together with low levels of physical activity, obesity
syndrome becomes evident. However, unmonitored distribution or uncontrolled marketing
of food aid items with high energy density and sugar content may represent similar public
health risks.
The previous sections of this thesis reported the staggering prevalence of the existing
forms of malnutrition, in particular of undernutrition. The following part describes how the
latter is managed.
1.2 Management of undernutrition
The management of undernutrition is complex. This is because it requires a combination of

40
methods, specific for its forms, degrees and settings. Briony et al. 53 define the management
of undernutrition as a “graded process of increasing levels of intervention”. These include
“improving energy and nutrient intake from ordinary foods; fortifying the energy and
nutrient intake of food and other forms of supplementation; enteral nutrition; and
parenteral nutrition”. These approaches are routinely applied in high‐resources settings.
Undernutrition tends to be more common in low‐resources settings. But here, its
management is often more challenging. For this reason, food‐based programmes were
often tailored according to three main situations: (i) non‐emergency /development, (ii)
emergency and (iii) chronic emergency contexts.
In recent years, the USAID, the UN Nutrition Cluster, UNHCR, and WFP suggested, for these
specific settings, which type of programme and food commodities are more adequate.
However, it was concluded that “there is no one food product that can meet every kind of
programming goal, and no one programming approach that fits all needs”54.
In 2011, USAID54 in collaboration with members from WFP and other institutions developed
a flow chart to help policy makers and donors in taking more informed decisions about
programmes and choice of food‐products. The flow chart, available in Figure 4, describes
how the “non‐emergency/development” and “chronic emergency” contexts rely on
programs using food “primarily for explicit nutritional” or “non‐nutritional purposes”.
Emergency contexts may require general or selective distribution according to local
availability of food aid items, wasting prevalence, timing issues and logistic constraints.
In summary, despite the complexity of this decision tool, the large variety of food aid
products and their vast number of combinations is rather evident.

41
Figure 4 ‐ Flow‐chart for the choice of food aid items.
Non-emergency / development
Or Chronic Emergency Program
Emergency
Nutritional Purposes
Non-Nutritional Purposes
Blanket feeding
Target feeding
Reducing SeasonalPeaks in wasting
Prevention of Stunting / Wasting
Prevention of Stunting
Addressing HIV / TB + wasting
Management of wasting
Growth Promotion /Resolving Faltering
Children U5: CSB+ oil or RUSF
PLW, Children 6-24months: CSB+ or RUSF
Children 6-24 months: CSB+ oil or RUSFPLW: CSB+ or RUSF (for 6 months post-birth)
Household: Grain, Oil, and Pulse (protective ration)
Adults and children: CSB+ oil or RUSF or RUTF
PLW and Children U5 (<-2 SD): CSB+ oil or RUSF
Children U5: CSB+ oil or RUSFPLW (wasted, inadequate weight gain): CSB+ or RUSF
Incentive or Pay
Vulnerable GroupFeeding
Food for Education
FFW/FFT
HIV/TB
OVC/Caretakers
School Feeding
Pre-School Feeding
Pay
Pay in the context of deficiency
Oil + Pulse + Grain (amount based on prevailing wage rates)
Options:(1) Oil + Pulse + SFG/SFB/SFCM; (2) Oil + Pulse + Fortified flour/meal
(amount based on prevailing wage rates)
Food InsecurityWith Elevated
Nutritional status
Food Insecurity
Options:(1) Oil + Pulse + SFG/SFB/SFCM; (2) Oil + Pulse + Fortified flour/meal;
(3) Oil + Pulse + Grain + MNP
Oil + Pulse + Grain
Incentive forattendance
Deliveringmicronutrients
Allaying short-termhunger
Options: (1) take home: Grain or Oil;(2) On-site: HEB or Oil + Pulse + Grain
Options: (1) HEB; (2) Oil + Pulse + SFG/SFB/SFCM;(3) Oil + Pulse + Fortified Cereal; (4) Oil + Pulse + Grain + MNP
On-site: Oil + Pulse + Grain
Phase 1(onset)
Phase 2(General Distribution)
Phase 2(Selective feeding)
Question:is fortified flour/meal available? yes
noQuestion: is
SFG/SFB/SFCMavailable?
yes
no Grain, Oil, Pulse, HF and (1) CSB + Oil, or (2) RUSF for U2s
Grain, SFG/SFB/SFCM, Oil, Pulse, and(1) CSB + Oil, or (2) RUSF for U2s
Fortified flour/meal, Oil, Pulse, and(1) CSB + Oil, or (2) RUSF for U2s
Prevalence of wasting:(<-2 SD) > 15% or 10-14% with aggravating factors
Prevalence of wasting:(-3/-2 SD) >?* (screened adults or children)
Prevalence of wasting:(<-2 SD) 10-14% or 5-9% with aggravating factors
(screened U5s)
Blanket SupplementaryFeeding
Therapeutic Feeding
Targeted SupplementaryFeeding
CSB + Oil or RUSF
Inpatient
Community-based
RUTF or F100or SP450
RUTF
CSB + Oil or RUSF
Options: (1) Emergency Bars (A20 bars, etc.), (2) HEBs; (3) HDRs; (4) Meal Replacers (MREs, BP5); (5) LNS (U2)
Note: BP‐5 Compact food; CSB, Corn‐soy blend; FBP, Food by Prescription; FFE, food for education and child nutrition; FFT, food for training; FFW, food for work; HDR, humanitarian daily rations; HEBs, High‐Energy biscuits; LNS, lipid‐based nutrient supplement; MCHN, Maternal and Child Health and Nutrition; MNP, Micronutrient powder; MREs, meals ready to eat; OVC, orphans and vulnerable children; PLW, pregnant and lactating women; PM2A, Prevention of Malnutrition in Children Under Two Approach; RUSF, ready‐to‐use supplementary food; RUTF, ready‐to‐use therapeutic food; SFB, Soy‐fortified bulgur; SFCM, soy fortified corn meal; SFG, soy‐fortified grits; U2, under 2 years of age; U5, under 5 years of age. Source: USAID 201154. * The minimum prevalence value was missing.

42
Each branch of the flow chart informs practitioners and donors, involved in large feeding
programmes, of the ration and food adequate choice. For emergency contexts, the diagram
helps in choosing packaged products used to promote survival, while preventing starvation.
This is valid for phase 1 of emergency onsets, whereas in phase 2, choices are made based
on the availability of food products and prevailing nutrition situation (general food
distribution and selective feeding).
The choice of the food‐items is relatively large, and includes processed and non‐processed
commodities. The programmes designed with explicit nutritional purposes (Figure 4) mainly
use two groups of processed food products: fortified blended flours (FBF) and lipid‐based
foods, both fortified.
In the first case, flours based on corn, soy, bulgur, or wheat are blended into formulations,
first fortified with micronutrients, then cooked into a porridge. The second category of
products includes “safe, palatable foods with a high energy content and adequate amounts
of vitamins and minerals”55. Therefore, it can be argued that the convenience in the latter
group may often be higher than in the former.
For this reason, some of them are increasingly used in therapeutic, or supplementary
feeding programmes. The following sections of this thesis explore in detail their
importance. However, the current methods and protocols stand on the shoulders of
previous pioneering research and their applications, including their successes and failures.
Their value, therefore, deserves to be recognized, and their evolution described. The
following section retraces the history of the current therapeutic and supplementary feeding
protocols to treat undernutrition and its acute form.

43
Figure 5 ‐ The Jamaican Paediatrician Cecily Williams (1893 ‐1992).
Source: reference number 482.
Figure 6 ‐ The first pictures of a dietetic disease (Kwashiorkor) never described before on a medical journal.
(a)
(b)
The original captions of photo (a) and (b) report “case 2 and 3 after their death”. Source: Williams et al. (1935)56
1.2.1 Evolution of the management of undernutrition
Undernutrition is as old as history itself. Its descriptions fill an
undocumented number of pages in the literature of mankind. And
yet, in the era of modern medicine, its management has had a
relatively short, but interesting evolution.
The Jamaican paediatrician Cecily
Williams is probably among the first ones
to describe, in a peer‐reviewed journal
published in English language, a specific
form of undernutrition, and to suggest its
treatment. In 1933, her article56 reports:
“There is a well‐marked syndrome, not uncommonly found
among the children of the Gold Coast Colony (Ghana), which I
have not found described.
…The syndrome consists of oedema, chiefly of the hands and
feet, followed by wasting; diarrhoea; irritability; sores, chiefly of
the mucous membranes; and desquamation of areas of the skin
in a manner and distribution which is constant and unique”.
The description suggests that the disease:
“…appears to be due to some dietetic deficiency and to be
uniformly fatal unless treated early”.
The management of the condition was also described:
“…My general impression is that the most important elements in
the treatment adopted were cod‐liver oil and a good brand of
tinned milk”.

44
Two years later, from the pages of The Lancet journal, Williams names this disease
“kwashiorkor”. In the Ga language, coastal Ghana, the term means "the sickness the baby
gets when the new baby comes". From the perspective of the local population, the
expression describes the cause of the condition in an older child, who has
been weaned from the breast, when a younger sibling comes.
In the following decades, other authors described undernutrition in very large populations.
Ancel Keys, in 1945, is probably the first author who describes the physiology of starvation
in volunteers57 with a modern medical perspective9.
Since then, new evidence has filled the existing knowledge gaps in undernutrition, to
improve its treatment and, later on, to support the up‐scaling of its prevention
programmes. The historical development of the management of acute malnutrition is
summarized in Table 3, and described in detail in the next five sections.
1.2.1.1 Phase 1: the theory of protein‐energy malnutrition and the role
of infections (1933‐58)
The relationship between status of undernutrition, its dietary treatment and infections has
been a topic of study for much of the 20th century58. In 1933 and 1935, Williams56,59 first
described Kwashiorkor in Africa, which was also found later (1954) in Latin America60. But
already in 1950, Keys described the link between the disappearance of famines with the
population returning to a normal diet61. In Europe, Marasmus was described during and
after the Second World War9.
The treatment based on this early classification of undernutrition was based on diets high in
both protein and energy9. From this perspective, Protein‐Energy Malnutrition (PEM), was
“attributable principally to dietary deficiencies and therefore it could be prevented or
treated by dietary measures alone”58. “Children were then admitted to large inpatient
feeding centres based on their arm circumference for height or for age, and then treated
with a mixture of dried skimmed milk, oil, and sugar, diluted into clean water”62 .
Based on this approach, the effectiveness was limited, and the mortality still high, according
to narrative studies (data not reported)58. The understanding of the cause was insufficient,

45
and Keusch argues that was due to little exposure of human nutritionists to immunologists
or infection specialists58. This type of management continued to be common during the
next few decades.
In his “history of malnutrition, infection and immunity”, Keusch58 calls the years preceding
1959 “the dark ages”. In that year, for the first time, Scrimshaw, Taylor and Gordon63
describe the “powerful pathway” of “the cyclical interactions between malnutrition and
infection”. This consisted of a “cycle of malnutrition‐infection, more nutritional
deterioration‐more infection”58. From this perspective, improving nutritional intake was
insufficient to fully reverse this cycle. That was due to the presence of repeated exposure to
infections, highly prevalent in developing countries. Keusch highlights how only then it
became clear that “a dual attack on nutrition and infection was needed for an optimal
response”.

46
Table 3 ‐ Evolution of the management of acute malnutrition since 1933.
Knowledge gap Achieved knowledge (type of study) New management protocol based on: Source
Phase 1: 1933‐1959 The scientific evidence to manage acute
malnutrition and to reduce associated case fatality rate is limited
Malnutrition is attributed to a deficiency in protein and energy
(observational)
Infections and undermined immunological response worsen undernutrition status (observational)
High protein and energy diets in association with medical treatment
Williams56, Scrimshaw et al. 63
Phase 2: 1960‐1989 In SAM, the case fatality rates remain high, and
the causes are not understood
Untreated water and mother “ignorance” are recognized as other main
causes of case fatality
Additional rehydration protocols, water and sanitation operations, and educational programmes
Beaton & Ghassemi64
Phase 3: 1990‐1999 Case fatality rates remain high and, in people
nutritionally rehabilitated from SAM, protein‐related metabolic dysfunctions are observed,
but not explained
The roles of appetite and type I / II nutrients explain protein‐related
dysfunctions (physiology‐based observational)
Nutritional requirements, tailored for treatment of SAM are proposed, (observational), and their dietary application (therapeutic milk
formulas) increases the survival rate in treated groups (observational)
Additional protocol consisting of 10 consecutive steps, in in‐patient settings, and introducing F75 & F100 milk formulas Impact assessment focusing on recovery and survival rates
Brown et al. 65,71, Golden et al. 66–69, WHO70
Phase 4: 2000‐2007 In home‐based care, the setting conditions are inadequate limiting the application of the 10‐
steps protocol, early admission of children with SAM is difficult, programme coverage levels are
relatively low, and viable alternatives are needed
The combination of community involvement, MUAC, and RUTF, is
suitable for home‐based treatment of GAM (observational), increases early recruitment of cases both with (in‐patient programme) and without (out‐patient) medical complications (observational), and
improves programme coverage levels (case‐control and observational)
In controlled conditions (RCT) a RUTF‐based regime increases daily energy intake and weight gain, shortening the rehabilitation time of
children affected by SAM
An additional protocol, integrating in‐ and out‐patient care, focusing on community involvement, early diagnostics (MUAC), and weekly supply of RUTF for supplementary and therapeutic feeding, drugs and medical check ups An impact assessment focusing predominantly on coverage
Diop et al. 71, UN Joint Statement55, Myatt et al. 72, Myatt et al. 73

47
Knowledge gap Achieved knowledge (type of study) New management protocol based on: Source
Phase 5: 2008‐2011 The prevalence of SAM among children under 6 months of age, and the nutritional and dietary
requirements for MAM and for wasting syndromes associated with HIV are unknown
The burden of SAM in children under 6 months of age is high (data review), and recommendations for treatment are urgently needed
Nutritional and dietary requirements for treatment of MAM in children
are proposed (literature review)
Recommendations for treatment of HIV wasting are recognized to be urgently needed (literature review)
Improved protocols include RUSF and specifically designed fortified blended flours, as part of food aid options Evidence‐based guidelines for treatment of children under 6 months of age with SAM, and for adults living with HIV are missing or insufficient
Golden28, USAID54, Kerac et al. 74, Forrester et al. 75

48
1.2.1.2 Phase 2: the disillusion
Even if reducing infections, the new protocol to treat undernutrition caused physicians like
Srikantia76, and Gopalan77 to be perplexed about its results. Their work launched the base
for the recognition that, in SAM, child recovery based on large protein intakes remained
inadequate. They described the increasing evidence78–84 that once rehabilitated, the
children still “suffered from liver dysfunction with reduced levels of” enzymes metabolizing
amino acids, and “abnormal urinary” catabolites. Soon after McLaren summarizes the same
findings in the publication called “The great protein fiasco”85, which marks the conceptual
shift from Protein‐malnutrition to Protein‐Energy malnutrition.
Later on, it became clearer that the treated children were unable “to return to be normal”9.
This was reflected in post‐recovery compromised renal functions, glucose intolerance, and
abnormal insulin secretion86–88. While the causes remained undisclosed, the wording
“protein‐energy” started to seem “inappropriate”9 to describe the complexity of the
treatment required.
However, it was only in 1982, after at least two decades, that the partial failure of the PEM
approach in saving lives was fully recognized. Beaton and Ghassemi64, looking at 200 reports
from high‐protein, high‐energy feeding interventions around the world, found that “the
programs reviewed were not effective”64, that “preventing ‘less‐than‐severe’ malnutrition
was not clear”64 and that “the observed growth response accounts for only a small part of
the net increase in energy intake”64.
In a personal communication (September, 2012), Tomkins suggested that at that time,
Jamaica was one of the few countries having enough resources to adequately study
metabolic problems associated to PEM. In addition to this, here mortality due to SAM was
rare.
However, the disillusion about the poor results, derived from the PEM approach, led the
decision makers to focus on two aspects: the clinical aetiology as primary cause of
malnutrition, reinforcing the role of the infections, and the theory that “mothers are
ignorant and that education is the main intervention required”9.
Policy makers promptly responded and produced policies accounting for these two

49
elements. Soon after, in low‐resources settings, large programmes to improve water access
and sanitation became more common than ever9. Golden9 finds that this approach is still
present in the recent Lancet series, in 2008.
Although known and accepted long before (personal communication: Tomkins, September
2012), decision makers waited until 1989, before evidence emerged that that the reduction
of diarrhoea due to sanitation interventions may be too small to have a large impact on
malnutrition by itself89, and that, most of all, “mothers were not to blame”9. More recently,
the Lancet Series on Nutrition (2008)90 still promote handwashing‐interventions despite the
controversial available evidence on their favour in promoting children growth.
1.2.1.3 Phase 3: appetite and the theory of type I and II nutrients
In the meantime, since the early 80’s, important physiological studies, focusing on appetite,
highlighted the new steps to take to move on.
Evidence showed that “appetite is a measure of metabolic wellbeing”. Moreover, appetite
was found to be “particularly disturbed with livery dysfunction during the metabolic
response to infections”65, but, most of all, by the deficiency of certain essential nutrients9.
Pioneering studies conducted in Jamaica65,91, looking at the treatment of severely
malnourished children, confirmed this relation. The impact of this discovery is emphasized
by Golden9:
…dietary surveys will indeed show that they (children with SAM) have a
reduced energy intake, but this will not be due to energy deficiency and not
be corrected by giving additional energy in the form of carbohydrate or lipid.
Golden continues saying that severe malnutrition…
…will only be cured by giving the specific nutrients that are missing in the
habitual diet that cause the loss of appetite.
The role of the appetite and the specific elements increasing survival in starving individuals
merged into the theory of “type I and II nutrients”. This theory, formulated, systematized
and published66–69 in the early years 90’s, is still considered valid by many nowadays28,
although it does not explain the severe anorexia seen in the presence of infection.

50
Box 3‐ Guidelines for the inpatient treatment of severely malnourished children
The WHO 1999 protocol to treat SAM is based on the F75, and the F100 milk formulas, used in combination with ten activities, summarized as follows:
Adjusted by HTP 20115 from WHO 199970.
The theory proposed by Golden suggests that nutrients called type I (see their list in foot
note number1) are “needed for particular biochemical functions in the body”28. Deficiency
of these nutrients does not generally lead to growth failure28. On the other hand, “type II
nutrients (foot note2) are likely to become limiting in the diet before the protein”9. “If the
diet is poor, then when weight is lost from an infection, there will be insufficient type II
nutrient density to allow for catch‐up growth during convalescence”9. The resurgence of
appetite is an indicator that the type II nutrient balance has been re‐established.
The theory was soon applied. In 1989, the type I and II nutrients theory was behind a
“factorial approach to design a diet that would provide all the building blocks for re‐
synthesis of normal body tissues”9. The diet showed to be rather successful92, becoming the
foundation of the current protocol for in‐patient treatment of SAM70.
The nutrient profile of the diet was soon replicated in an industrially processed therapeutic
milk, called F100 (formula with 100 kcal/ml). In 1993, F100 was successfully clinically tested
in emergency settings. However, the F100 formula had to wait for 1999 to become part of
1 Namely: calcium, iron, copper, selenium, iodine, vitamin B1, B2, B12, C, E, A, and K, niacin, pyridoxine, folic acid, biotin, pantothenic acid, manganese, chromium, molybdenum, fluorine and essential fatty acids28. 2 Namely: protein, sulphur, potassium, magnesium, phosphorus, and zinc28.

51
the WHO guidelines to treat SAM in children, adolescence and adults70.
The WHO protocol also included the use of a second formula milk, termed F75 (75 kcal/ml),
who’s energy density was lower when compared to F100.
In the WHO protocol70, the complete treatment is composed by ten steps organized in two
phases. The first, called Stabilisation phase, based on the F75 formula, re‐establishes the full
functionality of the metabolism, resulting in the re‐appearance of appetite. Once the
appetite is confirmed to last at least few days, the following Rehabilitation phase aims for
the full recovery of weight gain. The steps and their sequences are detailed in Box 3 and are
based from the extensive research work conducted in Jamaica.
Briend and Collins62 suggest that “with these new dietary protocols and relatively intensive
medical care, recovery rates improved, often exceeding 75 per cent ”, and that “mortality
rates were reduced to below 10 per cent ”and that, from a clinical perspective, “these
protocols were considered as rather successful”.
The protocol showed, however, two major constraints. This regime could treat only people
in in‐patient programmes. F100 is a liquid milk‐based diet, it is prone to contamination, and
“it can be used exclusively in health facilities to prevent misuse”9. Because of this
reasons, the life of large numbers of starving people, living far from clinic facilities, could
not be saved. Golden recognizes that “in many settings it is not possible for mothers to
leave their families for extended periods, or to travel long distances”9. Other authors62
suggested that “this was especially the case in open situations amongst dispersed
communities living in chronic poverty, where often specialized inpatient feeding
centres were not accessible. In their absence, children had to be referred to overcrowded
paediatric or general wards ill‐equipped to give adequate care to malnourished
children. Having the mother staying with the child for several weeks was also a major
problem when they were engaged in agriculture or other life sustaining activities”.
In poor settings, health staff struggles to correctly implement the WHO 1999 guidelines. In
1996, Schofield and Ashworth93 reported that “the median case fatality from SAM has
remained unchanged” (20 to 30 per cent), “with the highest levels (50 to 60 per cent) being
among those with oedematous malnutrition”. The cause is likely due to “faulty case‐
management”93, because in health facilities of poor countries, the work load of nurses and
doctors is often overwhelmed by the large number of patients, the health equipment often

52
is not maintained in function, and the hygienic conditions are limited by overcrowded
wards. The same authors conclude that, in such contexts, rigorously implementing the
WHO 1999 protocol proved to be challenging93.
Therefore, in spite of the achievements based on F75 and F100 formulas, Collins and
Briend62 polemically argue that “between 1950 and 2000, efforts to treat these children as
inpatients in district hospitals or clinics failed to address” this public health burden.
1.2.1.4 Phase 4: large coverage, high recovery, and low mortality
At the beginning of the new millennium, an innovative product was tested. A derivative of
F100, in the form of a paste, called ready‐to‐use therapeutic food (RUTF), allowed mothers,
living far from the health facilities, to treat their severely malnourished children directly at
home, whenever there was no medical complication. Mobile clinics provided a weekly
medical check‐up for the child, and supplied the mother with RUTF, counselling and
training. These visits followed a schedule which was previously agreed together with the
community leaders.
The main ingredients in RUTF were peanut, milk powder, oil, sugar, fortified by a premix of
vitamins and minerals. The brand name of the first RUTF was Plumpy’Nut, and was
produced initially in France by the manufacturer of F100, called Nutriset. Since then, the
number of manufactures has increased. In 2012, Komrska94 reports that twelve suppliers
were approved by the UNICEF Supply Division to produce and distribute RUTF at a global
level.
The evidence behind RUTF effectiveness was robust. In 2003, in a RCT conducted under
strict direct observation in a Senegalese health facility71, children with SAM showed a
significantly higher daily energy intake, faster weight gain, and a shorter treatment duration
when treated with RUTF compared with F100. Cases fatality (2 out of 30 children) was
reported only in the F100 study arm.
Based on the contribution from previous studies on home‐based care models, conducted in
Bangladesh95 and Jamaica96, a few years later, the first protocol based on RUTF was released
and named “Community‐based Therapeutic Care”97. Similar, home‐based approaches were
developed by a number of NGOs, including MSF and ACF. In 2007, the UN endorsed home‐
based treatment of SAM with a new name: “Community‐based Management of Acute

53
Malnutrition” (CMAM)55. In the following years, CMAM becomes a mainstream activity in
humanitarian feeding programmes, treating large populations in Africa, in Asia and in
Central America (Haiti) affected by SAM.
Briend and Collins62 emphasize that “when the model was endorsed by the UN, mortality
rates had been reduced to less than 5 per cent ”98 and that “by 2009, all major relief
agencies and 25 national governments had formally adopted this new model”. In 2010,
“approximately one million cases of SAM were treated annually, with programs expanding
by approximately 30 per cent every year”62. The same authors summarized the CMAM
protocol in the following way:
i. “the introduction of techniques to engage with communities to promote early
presentation and compliance;
ii. handing over the identification of SAM to the community through the use of MUAC;
iii. the development of Ready to Use Therapeutic Foods (RUTF).”
The previous and the new models to treat acute malnutrition are complementary. The
previously described model to treat SAM, based on F75/F100, becomes one of the
components of the new model (CMAM), which includes also the use of RUTF. The criteria
based on medical complications and appetite determine the admission to one of the two
programme approaches. Children with medical complications and little appetite are
referred to in‐patient programmes97 which follow the WHO 1999 protocol and where
therapeutic formula milks are used. With the successful treatment of the medical
complications, and the return of their appetite, children are discharged from the in‐patient
programme, enrolled in the out‐patient programme, and treated with RUTF. Children
initially presenting no medical complication and appetite are directly enrolled in the out‐
patient programme and treated with RUTF at community‐level. Children already in the out‐
patient programme, presenting medical complications and/or low appetite, are admitted, or
re‐admitted, into the in‐patient programme and follow the same rehabilitation path.
Children discharged from the severe phase of CMAM/CTC, are admitted to a supplementary
feeding programme, if one is operating, until complete recovery.

54
The CMAM/CTC approach is efficient in reaching cases of SAM even when located far from
the in‐patient facilities. An indicator called “coverage” measures this aspect of programme
performance, and in this new phase of the management of SAM, the concept of
programme coverage received emphasis like never before. The Sphere Project99 defines
coverage as the number of “individuals who need treatment, against those actually
receiving treatment”. Coverage can be affected by the “location and accessibility of
programme sites”. In the current guidelines for feeding programmes coverage is expected
to be above “50 per cent in rural areas, 70 per cent in urban areas and 90 per cent in a
camp situation”99. In 2010, Guerrero suggested that “the impact of public health nutrition
programmes is determined by a combination of recovery and coverage rates”100. However,
after a few years, the importance of coverage increased and some authors argue72 that “a
high coverage programme with a low cure rate may be better at meeting need than a low
coverage programme with a high cure rate”.
In 2007, a study in Malawi72, comparing two interventions, the first based on F75/F100
(WHO 1999 guidelines) and the second one on RUTF (CMAM 2007), found that the latter
Figure 7 ‐ Spatial distributions of per‐quadrat coverage in two feeding interventions (Malawi).
In the first map (Mchinji district), the protocol to manage SAM was based on WHO 1999. In the second map (Dowa district), the protocol was based on Community‐based Management of Acute Malnutrition 2007 guidelines. The “x” and the acronym NRU correspond to nutritional rehabilitation unit, whereas OTP stands for out‐patient therapeutic programme.

55
“enabled higher impact on severe malnutrition in this population”. The first programme
reported 24.5 per cent and the second 73.6 per cent of the children in need enrolled in
each of the two programmes. Figure 7 compares the differences between the spatial
distributions of coverage for the two programmes.
In the following year, further evidence confirmed the efficacy, the safety and the cost‐
effectiveness of RUTF in uncomplicated SAM. In 2010, a systematic review101 for home‐
based therapeutic nutrition found 7 observational trials. The review concluded that “RUTF
was at least as efficacious as F‐100 in increasing weight and more effective in comparison to
home‐based dietary therapies”. The combined results showed that recovery rate, mortality
and default in treatment with RUTF were 88.3, 0.7 and 3.6 per cent, respectively with a
mean weight gain of 3.2 g/kg/day. In Lusaka, Bachman102 found that the use of RUTF in a
“Community‐based Therapeutic Care for SAM appears highly cost effective”. The primary
outcomes were mortality‐within‐one‐year, and disability adjusted life years (DALYs) after
twelve months survival.
In only a few years, after the RCT study undertaken in Senegal (2003), RUTF was not only
used to manage cases of SAM, but even to prevent them. In the drought of year 2006, in
western Africa, MSF tentatively extended the use of RUF to moderately malnourished
children. The intervertion reported high cure and low default rates, compared to results
typically obtained with the standard treatment of moderate malnutrition with fortified
blended flours103,104. The use of RUTF for moderately malnourished children flattened the
typical seasonal rise of admissions in SAM feeding interventions.
Cost is often a limiting factor in humanitarian interventions based on selective targeting.
This is because the latter is more resources intensive. Blanket supplementary feeding
programmes may be cheaper and in some cases relatively easier to implement. For this
reason, in the same study, but in the following year (2007), MSF explored “whether it would
be more feasible and effective to aim for blanket coverage with a nutritional supplement,
which could prevent the development of stunting and wasting”104. Therefore, a new ready‐
to‐use food (RUF), developed as a child diet supplement was distributed during six month,
during the 2007 year hunger gap, in a district of Niger. Sixty‐thousand children received the
product, and “the incidence of severe acute malnutrition (MUAC<110 mm) remained at
extremely low levels”. Moreover, 92.3 per cent of the children were successfully treated,

56
Figure 8 ‐ Nutrition commodities ordered by UNICEF country
offices (in Kcal).
Source: UNICEF / Duke University 2009 119.
with a weight gain of 5.1 g/kg/d, and only 1.8 per cent suffered from a fatality case (death).
This operational research and intervention strategy attracted some criticism. Latham et al.
reacted, urging that the prevention of malnutrition should not be based on an industrially
processed product, but on the eradication of the causes, and suggesting that the use of
“RUTF would be a catastrophe”, since it would be responsible for displacing breastfeeding
practices105.
The latter issue was supported by little evidence. The following year, in the Democratic
Republic of Congo, one RCT study106 assessed “the breast‐milk intake of 9 to 10 month old
infants given either a ready‐to‐use complementary food (RUCF) paste or a standard corn‐
soy blend porridge” commonly used in the complementary feeding phase. The technique
used was based on a “deuterium‐dose‐to‐the‐mother dilution”. No differences in breast‐
milk intake were observed
between infants
consuming either RUCF or
the porridge. A second RCT
study107, in rural Malawi,
found similar results. In
children of similar age,
twelve‐month‐long
complementary feeding
with 50 g/d of a RUTF‐like
product was significantly
more likely to have a
positive and sustained
impact on the incidence of
severe stunting, than with
a maize‐soy flour. Also in this case, the breast milk intake did not differ in the two groups.
In spite of this evidence, the debate about the use of lipid‐based RUF remains. In 2011, the
World Public Health Nutrition Association (WPHNA) voiced deep concerns about the future
risk, associated with these products, of increasing the global phenomenon of the dual
burden108, described in section 1.1.2.2. The same year, within a public‐private partnership,

57
Table 4 ‐ Procurement of RUTF by UNICEF country programmes in 2003‐8 (over 100 MT).
Source: UNICEF (200?).
both in developed and less developed countries, USAID in collaboration with WFP provided
important recommendations109 in order to improve the distribution, the targeting and the
marketing of these and other food aid items. The concerns raised by WPHNA were not
included in the recommendations.
1.2.1.5 Phase 5: scaling‐up the procurement of low‐cost, evidence‐base
RUF to treat other forms of malnutrition
At the end of the first decade of the third millennium, the use of RUTF is increasing
exponentially (Figure 8). At the same time, this and novel formulations are being tested for
the treatment of other forms of malnutrition. This section describes the scaling‐up of the
demand of RUF and summarizes which other forms of malnutrition RUF are increasingly
used for.
In 2009, Ashworth and Ferguson110 reported that beside MSF, the NGO GOAL also
distributed “RUTF for moderately malnourished children with medical complications”,
while some UNHCR and UNICEF programmes provided “RUTF for moderately malnourished
children with HIV”.

58
Table 5 ‐ Countries with reported SAM percentage for which UNICEF has not procured RUTF in 2008.
The figures in parenthesis report the average percentage of children suffering from global acute malnutrition in period
2000‐2006 483. Source: UNICEF 2008 121.
An undocumented correlation exists between the rise of evidence‐based positive outcomes
in RUTF‐related programmes72,107,111–118, and the steep increase of its demand. This can be
also associated with the role played by UNICEF and MSF as described in section 1.3.3 of this
chapter. A study119 commissioned by UNICEF reported that the market for RUTF “had been
growing steadily throughout the decade” and had “more than doubled in the year following
the UN joint statement (2007)”. “Production capacity of RUTF also increased, but at times
has not been able to keep pace with rising demand” (Figure 8). In 2010, Yach et al. 120
confirmed that global “demand for a high‐quality, safe, and nutritious RUTF is not being
met”.
In 2008, UNICEF released one of its first call of proposals for “sustainable and affordable
supply” of RUTF for the years 2008 to 2010121. The document solicits 20,000 metric tonnes,
and reports that “RUTF is considered to be a key tool to achieve the Millennium
Development Goals (MDGs)”. Interestingly, the solicited forecasted procurement was
limited to only twenty‐two per cent of the countries where SAM was reported (data from
UNICEF (2012)41), probably on the basis of priority ranking versus their SAM prevalence
rates (see Table 5).
Ready‐to‐use therapeutic food spreads were used to treat and prevent other forms of
malnutrition, for example wasting associated to HIV and/or TB infections. In this case, the
results were conflicting. This type of wasting, an example of secondary malnutrition, is
challenging to treat, because has “clinical characteristics and implications for treatment
different from those better known in primary malnutrition”. To what extent this is true is an
increasing subject of study and debate 75. For example, Ndekha et al. 116 compared the

59
weight gain in 491 underweight (BMI<18.5) HIV‐positive adults, who received either RUTF
or CSB. Survival did not differ in the two groups. However, the patients receiving fortified
spread had a greater increase in BMI and fat‐free body mass than those receiving corn‐soy
blend. Other authors report encouraging results in using RUF, but their studies did not have
a control group122–126. For this reason, their evidence is less robust. Few other more
convincing trials125–128 and a recent review study129 supported, evidence‐based, the
introduction of RUTF into HIV programmes for wasted adults. In 2011, treatment for the
latter was reported to be available, at 23 per cent of the HIV treatment and care African
programmes, supported by the President’s Emergency Plan for AIDS Relief (PEPFAR)130.
However, in adult HIV wasting, the issue related to survival remains not entirely
understood.
Between 2007 and 2012, evidence on new versions of ready‐to‐use foods (RUF), and their
effectiveness, was increasingly described in peer‐reviewed publications. The new RUF are
mostly in the form of paste and trialled against a variety of forms of undernutrition, in a
range of age‐groups, for supplementary and therapeutic purposes.
Recently, research and international humanitarian agencies have shifted their focus to
prevention and treatment of children affected by MAM. In a three‐arm RCT131, moderately
wasted Malawian children (WHZ >‐3 and <‐2) receiving a RUF based on soy and peanut,
called ready‐to‐use supplementary food (RUSF), which is cheaper than RUTF, had a similar
recovery rate to those receiving a fortified, more expensive RUSF. The latter was based on
soy and milk. The children in either RUSF group were more likely to recover than those
receiving porridge made from CSB. In 2008, in a UN conference on dietary management of
MAM, Golden proposed nutrient requirements to rehabilitate children from this form of
malnutrition, and published them the following year on the UN Food and Nutrition
Bulletin28.
In the same years, in Ghana, a placebo‐RCT132 tested the “hypothesis that multiple
micronutrients added to home‐prepared complementary foods would increase growth and
that the effect would be greatest in the presence of added energy from fat”. The three
complementary foods were a micronutrient powder (brand: Sprinkles), a crushable
micronutrient tablet (Nutritabs), or a micronutrient fortified RUSF spread (Nutributter). All
the interventions showed positive effects on the children’s development milestones,

60
however, only the RUF improved their growth velocity (data about fatality rate were not
included).
In summary, in recent years the management of undernutrition began to rely on a range of
industrial products. However, in spite of this proliferation, their classification, their design
and the process of validation prior to their clinical trialling is not yet sufficiently explored
and described.
1.2.2 Current classification
In spite of their increasing importance, RUF classification is insufficiently developed.
Referring to RUF, USAID suggests that “the most significant change in food aid during the
21st century has been the arrival of a new family of products in the form of lipid‐based
spreads”54. WFP also argues that “the development of RUF have revolutionized the
treatment of severe acute malnutrition, and catalyzed the development of other food‐
based commodities for treating and preventing less severe as well as other forms of
undernutrition”133. In spite of their success, a general classification, internationally
recognized, was not found. This observation can be extended also to the other food aid
products. The Codex Alimentarius is the FAO/WHO “global reference point for consumers,
food producers and processors, national food control agencies and the international food
trade”134. Its web page (accessed on 28/02/2012; http://www.codexalimentarius.net) does
not provide a classification of any product to manage undernutrition.
Although not internationally accepted, some definitions were proposed for lipid‐based,
paste‐alike, ready‐to‐use foods. The following sections first report their definitions in the
available literature, describing their nutrient contents, their processing, their safety
aspects, and their supply chain. The last section explores important new areas of research.

61
Figure 9 ‐ Relation between Application and Amount of LNS used.
Source: iLiNS Project 135.
1.3 Ready‐to‐use foods for the management of undernutrition
1.3.1 Nomenclature
1.3.1.1 Ready‐to‐use, general term and the similarities with functional
foods
RUF is a general term. Therefore,
researchers from the iLiNS Project135
suggested the term lipid‐base nutrient
supplement (LNS), should be defined as
“a family of products designed to
deliver nutrients to vulnerable people”.
Lipid‐based supplements provide “a
range of vitamins and minerals, but
unlike most other multiple
micronutrient supplements”, because energy, protein, and essential fatty acids are also
included (see Figure 9). These “formulations and doses can be tailored to meet
the nutrient needs of specific groups and to fit in particular programmatic contexts”.
However the term LNS can be misleading in some specific cases. For instance, when used
for therapeutic nutrition interventions, RUTF is not a supplement, because it is used for
exclusive feeding until recovery. For this reason, the form RUF will be preferred and
maintained in the following sections. Furthermore, some RUF are not lipid‐based such as
Afya, a compressed food bar136.
RUF for the management of undernutrition could be considered a specific type of functional
food. The European Commission and the International Life Science Institute define
functional food when:
“...(the food is) satisfactorily demonstrated to affect beneficially one or more target
functions in the body, beyond adequate nutritional effects in a way that is relevant
to either an improved state of health and well‐being and/or reduction of risk of
disease.

62
Table 6 – Endorsed types of functional foods
Type of functional food Definition Example
Fortified product A food fortified with additional nutrients Fruit juices fortified with vitamin C
Enriched product A food with added new nutrients or components not normally found in a particular food
Margarine with plant sterol ester, probiotics, probiotics
Altered products A food from which a deleterious component has been removed, reduced or replaced with another substance with beneficial effects
Fibres as fat releasers in meat or ice cream products
Enhanced commodities A food in which one of the components has been naturally enhanced through special growing conditions, new feed composition, genetic manipulation, or otherwise
Eggs with increased omega 3 content achieved by altered chicken feed
Source: Istevan et al. (2008)139
“…Functional foods must remain foods.
“…They are not pills or capsules, but part of a normal food pattern.”137.
Table 6 reports examples of functional foods, and whose global market is estimated to at least 33 billion USD per year138.
RUF could also be considered close to a functional food for other reasons. Sub‐types of
functional foods also include “spreads”139. However, this endorsed category currently
consists of cholesterol‐lowering products, “containing phytostanol esters which are
supposed to lower cholesterol level”139. The spreads are currently commercialized in the
form of margarines, milk, cheese, cream, and eggs139,140. For this reason, despite the existing
similarities, the endorsement of lipid pastes for these purposes currently limit the
application of the “functional food” definition to RUF spreads.
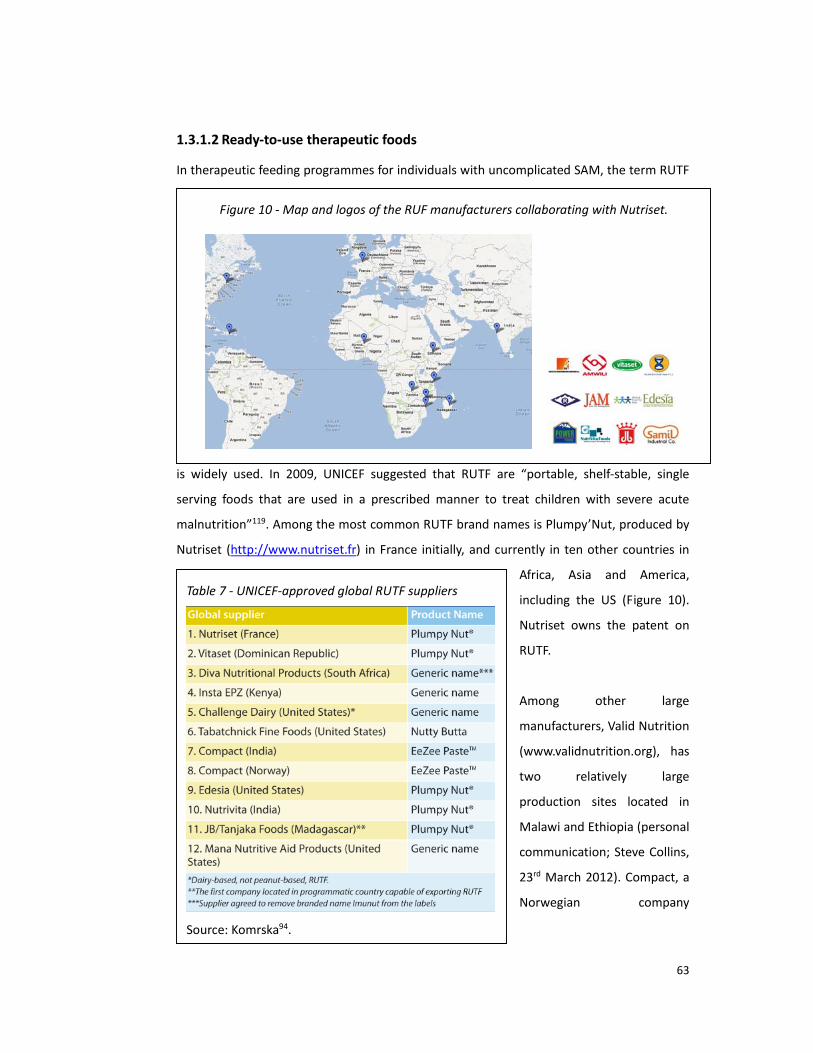
63
Figure 10 ‐ Map and logos of the RUF manufacturers collaborating with Nutriset.
Table 7 ‐ UNICEF‐approved global RUTF suppliers
Source: Komrska94.
1.3.1.2 Ready‐to‐use therapeutic foods
In therapeutic feeding programmes for individuals with uncomplicated SAM, the term RUTF
is widely used. In 2009, UNICEF suggested that RUTF are “portable, shelf‐stable, single
serving foods that are used in a prescribed manner to treat children with severe acute
malnutrition”119. Among the most common RUTF brand names is Plumpy’Nut, produced by
Nutriset (http://www.nutriset.fr) in France initially, and currently in ten other countries in
Africa, Asia and America,
including the US (Figure 10).
Nutriset owns the patent on
RUTF.
Among other large
manufacturers, Valid Nutrition
(www.validnutrition.org), has
two relatively large
production sites located in
Malawi and Ethiopia (personal
communication; Steve Collins,
23rd March 2012). Compact, a
Norwegian company

64
(http://www.compactforlife.com) also produces a RUTF, whose brand name is “eeZeePaste”.
Their manufacturing sites include Norway, Denmark but also Kenya, Dubai, India, and
Malaysia. Other manufacturers from other countries are listed in Table 7, published in
2012.
Another example of RUTF is BP‐100, produced by Compact, and more similar to a
“compressed biscuit” than a paste. The World Bank argues that its “technology is more
difficult to re‐produce in developing countries”40. A similar consideration is also supported
by other authors141, and the available literature does not report the availability of this
processing technique in any developing countries. However, in the food technology
literature, no reference was found to confirm the World Bank statement.
This product also generated considerations of a different nature. In 2008, WFP was
concerned with “the difficulty for the consumers to distinguish between nutritious and non‐
nutritious biscuits, and the possible promotion of a habit of biscuit consumption which may
in fact lead to consumption of non‐nutritious, high‐sugar, biscuits”142. Because of these
reported reasons, BP‐100 will be not considered in the following sections of this thesis.
The main ingredients of the RUTF, trialled in the RCT described in other sections of this
thesis, are peanut butter, milk powder, oil, sugar and the micronutrient premix.
1.3.1.3 Ready‐to‐use supplementary foods
A new category of product called ready‐to‐use supplementary foods (RUSF) are similar to
RUTF in terms of appearance, but their formulation “addresses micronutrient deficiencies”
in MAM. In 2009, UNICEF suggested that RUSF are “portable and shelf‐stable products that
meet the supplementary nutrient needs of those who are not severely malnourished”119
and that “growing demand for RUSF products might decrease global demand for RUTF”119.
The currently tested formulations104,131,143,144 include ingredients such as soy, whey, lentils,
rice together with oil, sugar and the micronutrient premix. Plumpy’Sup and Plumpy’doz are
two of the RUSF commercialized by Nutriset145.
1.3.1.4 Ready‐to‐use complementary foods
In 2012, Owino et al. 146 defined a ready‐to‐use complementary food (RUCF) as a paste
“formulated to provide the recommended daily allowance of all micronutrients for 6 to 12
months old infants each day”. In a first trial in Ghana132, Nutributter, one brand from

65
Nutriset, provided significantly less daily energy than RUTF but a full complement of
micronutrients in a similar group of children. The study showed that RUSF can prevent child
stunting and support their normal motor development. Another study reduced iron
deficiency in infants, using the same product147.
In Malawi, similar products were tested in three other studies. In a RCT148, a peanut/soy
based fortified spread was associated with higher weight gain in infants, when compared
with its control, a porridge fortified with fish powder. Another study149 randomized infants
to receive a year‐long dietary supplementation with ready‐to‐use fortified spread or a
traditional micronutrient‐fortified maize‐soy flour. The results did not show a significantly
larger effect than the control on mean weight gain. However, incidence of severe
stunting was tested in a followup study150 with a double dose. In this case, the study
showed that a twelve‐month‐long complementary feeding with 50 g/d of the same
supplement was likely to have a positive and sustained impact.
QBmix and Plumpy’soy are other forms of RUCF, at least according to one of the leading
manufacturers’ perspective. From its website3, Nutriset define them suitable for
“prevention of nutritional deficiencies”. QBmix is currently trialled in few studies, whereas
Plumpy’soy used in pregnant women resulted in higher birth length than did a prenatal,
multiple micronutrient, tablet‐based supplementation151.
In the literature, a number of acronyms and names were found for RUF products. The
following section fixes the nomenclature used in this thesis.
1.3.1.5 Proposed nomenclature
As reported above, “ready‐to‐use” food is a generic term, and its sub‐types can be many.
The main subsets, previously described by Kerac152 in 2010, include:
• RUTF = ready‐to‐use THERAPEUTIC food – for SAM in both children and adults
• RUSF = ready‐to‐use SUPPLEMENTARY food – for MAM in both children and
adults
• RUCF = ready‐to‐use COMPLEMENTARY food – for general use as a
complementary food or for preventing malnutrition in infants and young
3 http://www.nutriset.fr/.

66
XXX‐RUYF‐ZZ
children
Since then, the rapid proliferation of RUF has increased. Their ingredients, their nutrient
specifications, and target age‐groups, differ within the same RUF sub‐types. Therefore, the
following nomenclature may be better at distinguishing RUF sub‐categories.
The “Y” letter designates therapeutic (T), supplementary (S) or complementary (C), whereas
“X” and “Z” can include further pieces of information:
‐ The ingredients of the RUF (letter “X”)
Not all the ingredients need to be mentioned. Oil and sugar are common to
most RUF. Therefore, only the other food ingredients are to be indicated.
The first ingredient reported is the one in higher weight per centage,
whereas the others follow a decreasing order.
‐ Other information – (letter “Z”)
Acronyms suggest the life‐stage and/or other aspects.
For instance the acronym for a theoretical RUF, whose formulation addresses moderate
malnutrition in children under five years and living with HIV, and whose ingredients include
soy, lentils, rice, oil, sugar and a micronutrient premix, may be termed “SLR‐RUSF‐U5H”.
This is more clearly explained, as follows:
S = soy
L = lentil
R = rice
RUSF = ready‐to‐use supplementary food
U5 = under five years of age
H = HIV

67
Table 8 ‐ Nutrition composition of RUTF
Source: UN Joint Statement (2007) 55
1.3.2 General description
1.3.2.1 Nutritional aspects
RUF must contain most of the “40
nutrients essential for health”28. Nutrient
standards have been proposed by the UN
for RUTF55. These specify energy in RUTF
500‐1,000 Kcal/d, total lipids (45‐60 per
cent), protein contents (10‐12 per cent
per cent of their contribution to the total
energy), and essential fatty acids such as
omega‐6 (3 to 10 per cent of total energy)
and omega‐3 (0.3 to 2.5 per cent of total
energy). In RUSF the omega n‐6/n‐3 ratio
should be below 15 and preferably
between 5 and 9153. The standards for
RUTF are reported in Table 8. In 2012,
WHO proposed the nutrient composition
of supplementary foods for use in the
management of moderate acute
malnutrition in children154, assuming that
the supplementary food covers 70% of
their energy intake .
In 2007, a UN Joint Statement document specified 23 micronutrients RUTF standards of
both type I and II, in the form of range, or of minimum amount. In 2009, Golden28 argued
that an improved way to describe the standards for RUSF consists of nutrient/energy
densities, expressed as unit of each nutrient in 1,000 kcal of the product.
Protein quality in RUF is important. This parameter is recommended by WHO to be
measured using the protein digestibility‐corrected amino acid score (PDCAAS)155. In RUTF
for children under five, “at least half of the proteins contained in the foods should come
from milk products” according to the UN Joint Statement (2007). Based on simple

68
Figure 12 ‐ Packaging of RUF: sachet and cup.
Source: Nutriset 145
Figure 13 – Child self‐administering RUF.
Source: Valid Nutrition.
calculations, this statement corresponds to a PDCAAS of at least 100 per cent156. More
recently, the UN have endorsed a new, but more complex method to evaluate protein
quality content in foods157.
1.3.2.2 Ingredients, processing, packaging and safety
The iLiNS project web site (http://www.ilins.org/; accessed 05/03/2012) suggests that RUF
formulations “can include a variety of
ingredients, but typically contain
vegetable fat, peanut/groundnut
paste, milk powder and sugar.” This
was true for the first clinical trial, in
2003, undertaken by Diop et al. 71
confirming the same efficacy in weight gain for both RUTF and F100 formula milk in
children with SAM. Since then, the ingredients were replaced by others. iLiNS reports that
“alternative recipes and formulations are currently
being explored in efforts to develop affordable and
culturally acceptable products for a range of settings.
Other ingredients have included whey, soy protein
isolate, and sesame, cashew, and chickpea paste,
among others”.
Manary reported that RUF “production sufficient to
meet the needs of several thousand children can be
achieved with a dedicated manufacturing facility
Figure 11 – Examples of equipment for spray drying for milk and whey powders (a), and of extrusion of cereals and pulses blends (b).
(a) (b)
Source: web sites of MilkPowderTech484 and ACF Mechanical Equipment485.
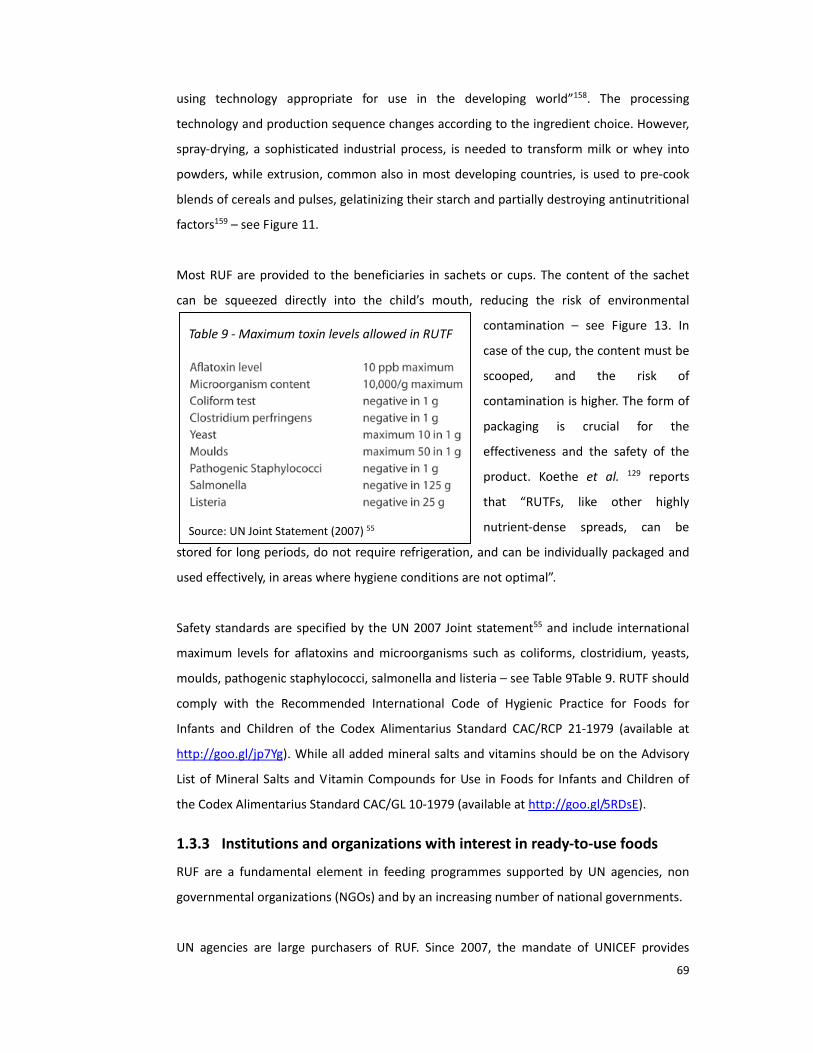
69
Table 9 ‐ Maximum toxin levels allowed in RUTF
Source: UN Joint Statement (2007) 55
using technology appropriate for use in the developing world”158. The processing
technology and production sequence changes according to the ingredient choice. However,
spray‐drying, a sophisticated industrial process, is needed to transform milk or whey into
powders, while extrusion, common also in most developing countries, is used to pre‐cook
blends of cereals and pulses, gelatinizing their starch and partially destroying antinutritional
factors159 – see Figure 11.
Most RUF are provided to the beneficiaries in sachets or cups. The content of the sachet
can be squeezed directly into the child’s mouth, reducing the risk of environmental
contamination – see Figure 13. In
case of the cup, the content must be
scooped, and the risk of
contamination is higher. The form of
packaging is crucial for the
effectiveness and the safety of the
product. Koethe et al. 129 reports
that “RUTFs, like other highly
nutrient‐dense spreads, can be
stored for long periods, do not require refrigeration, and can be individually packaged and
used effectively, in areas where hygiene conditions are not optimal”.
Safety standards are specified by the UN 2007 Joint statement55 and include international
maximum levels for aflatoxins and microorganisms such as coliforms, clostridium, yeasts,
moulds, pathogenic staphylococci, salmonella and listeria – see Table 9Table 9. RUTF should
comply with the Recommended International Code of Hygienic Practice for Foods for
Infants and Children of the Codex Alimentarius Standard CAC/RCP 21‐1979 (available at
http://goo.gl/jp7Yg). While all added mineral salts and vitamins should be on the Advisory
List of Mineral Salts and Vitamin Compounds for Use in Foods for Infants and Children of
the Codex Alimentarius Standard CAC/GL 10‐1979 (available at http://goo.gl/5RDsE).
1.3.3 Institutions and organizations with interest in ready‐to‐use foods
RUF are a fundamental element in feeding programmes supported by UN agencies, non
governmental organizations (NGOs) and by an increasing number of national governments.
UN agencies are large purchasers of RUF. Since 2007, the mandate of UNICEF provides

70
Figure 14 ‐ Trend of RUTF and RUF deliveries (MSF)
Source: MSF Nutrition Working Group – Report 2009 4
advocacy, supply and logistic support to other governmental and non governmental
institutions and organizations involved in therapeutic feeding for uncomplicated children in
community settings160. UNICEF is “the leading global procurer of RUTF”119. UNICEF Country
Offices identify the needs and obtain funding for RUTF. A purchase order is processed
through the UNICEF Supply Division and released to the manufacturers, initiating the
production and transportation around the world119.
UNICEF is not the only UN agency involved in RUF procurement and delivery. Section 1.2.1.4
of this thesis reported the exponential increase of UNICEF demand for RUTF since 2007.
Similarly, WFP, another UN agency, is constantly augmenting its procurement of RUSF. In
2012, the WFP Executive Board released the Nutrition Policy Item number 53, which puts
the three following priorities at the very top of its agenda: (i) treating moderate acute
malnutrition (wasting); (ii) preventing acute malnutrition (wasting); (iii) preventing
chronic malnutrition (stunting). Talking about the way to achieve these goals, the policy
paper reports that WFP “in recent years, has scaled up the use of lipid‐based, ready‐
to‐use foods, such as peanut and chickpea‐based pastes”. The policy paper reports that
“in the absence of specially developed foods for adults with undernutrition related to HIV
or tuberculosis, ready‐
to‐use products are also
increasingly used for
these groups”. WFP
reaches more than 90
million beneficiaries of
many ages every year3.
In many feeding interventions, NGO are partnering with UNICEF, WFP and sometime with
national governments. In these partnerships, NGO receive and deliver the RUF through
their own feeding programmes. Nevertheless, some NGO often procure directly their
volumes of RUF spreads119. From 2004 to 2008, MSF, one large NGO, purchased 30 per cent
of the total amount of RUTF on the global market (see Figure 15), and in 2009 distributed
20 per cent of the entire RUTF world production4 treating 208,922 people with SAM. Other
NGO procuring RUF are Action Against Hunger, and Concern World Wide, but no data were
found for these organizations.

71
Figure 15 ‐ Logos of the academic institutions, NGO and private enterprises involved in the iLiNS project.
Source: iLiNS Project135.
The President’s Emergency Plan for
AIDS Relief provides nutritional
support services in HIV care in sub‐
Saharan African countries. In 2011,
Anema et al. 130 found that in a total
of 336 HIV care and treatment sites,
serving 467,175 patients, 31 per cent
treated SAM using some sort of RUTF.
Figure 15 shows the logos of the few
African, American and European academic institutions and one manufacturer interested in
the development and improvement of RUF spreads. International Lipid‐Based Nutrient
Supplements (iLiNS) Project is a “research collaboration that grew out of a shared
commitment to accelerate progress in preventing malnutrition”. This academic‐private
sector partnership, based at University of California / Davis, includes the universities of
Tampere (Finland), Ghana and Malawi, the Research Institute of Burkina Faso, the NGO
Helen Keller International, Project Peanut Butter, and the enterprise Nutriset.
Another university in Europe focuses on crucial aspects directly related to RUF production.
The Irish University of Cork has recently engaged on a research looking at the impact on
livelihood and market opportunities for Malawian smallholder farmers supplying plant‐
based ingredients for a local RUF factory161. The project is undertaken in collaboration with
Valid Nutrition.
Some organizations and manufacturers sought ways to produce without conflicting with the
patent restrictions. In 2007, Nutriset and Valid Nutrition signed a “Licence Agreement”162.
This document enabled “Valid Nutrition to independently manufacture peanut based RUF
covered by the Nutriset patent in developing countries and to market these products under
the Valid Nutrition brand name”162. However, further criticism was targeted at the existence
of the patent. In 2009, MSF wrote an open letter “calling for the establishment of a more
flexible licensing policy”163. Nutriset responded formally, and initiated a new market
strategy. Today, on reaching agreement with Nutriset, companies and NGOs are allowed to
make the patented pastes in African countries with the Nutriset logo on the product labels

72
and without paying any license fees164. However, the debate has continued up to present
and in 2010, two non‐profit American organizations sued the French company in order to
remove the patent protection165. The result of this legal action is currently unknown.
A report from the Duke University in collaboration with UNICEF119 describes how, in low‐
resources countries, Ministries of Health (MoH) “work with national or international NGO
partners, and the UNICEF Country Officer, to release RUTF for distribution to the districts,
where the District Nutrition Officer and/or NGO partners store RUTF until it can be used”.
These MoH have showed a wide range of responses towards the introduction of RUF
products. In some cases they endorsed directly the latter into their policies and nutritional
protocols, whereas in others, they took more evidence‐based approaches. The two extreme
cases may be represented by the recent events in Kenya and India, two countries whose
prevalence of mild to severe wasting were estimated to be respectively of 7 (2008 and
2009) and 20 per cent (2005 and 2006)41.
1.3.3.1 The Kenyan case
Kenya represents a successful case of integration of RUF into national protocols endorsed by
the MoH. Since RUTF was endorsed by the UN in 2007, the demand for RUTF by
humanitarian organizations in East Africa has far exceeded the available supply. In 2012,
USAID reported54 that “too few regional businesses are willing to tackle the challenges that
RUTF manufacturing presents”. Insta Products is one of them. This Kenyan processing
factory located in the outskirts of Nairobi since 2009, supplies an average of 4,500 metric
tons of RUTF per year across the region, reaching vulnerable populations in Ethiopia,
Somalia and Sudan (personal communication; Stuart Allison, Insta Manager; 2011).
In Kenya, RUTF is currently “prescribed” to HIV wasted patients. With 6.7 per cent of HIV
national prevalence, 1,200,000 infected Kenyans and 50 per cent of the population are
living in food insecurity (data from 2005)166. The Government soon became aware of the
benefits that, via Insta, a public‐private collaboration could provide to the health of its
citizens. Since 2010, with the support of USAID, the local MoH has included RUF in the HIV‐
related services package, for in‐ and out‐patient hospital care. One of the pillars of the
programme is a private‐public partnership that includes capacity building within Kenya's
Ministries such as Medical Services, Public Health and Sanitation, as well as with grass‐root
organizations167. In the protocol endorsed by the government, RUTF is “prescribed” in
combination with normal food rations for household consumption167. Currently, the

73
programme includes 155 primary health sites, which facilitate support to 261 satellite
health facilities. By June 2010, the HIV nutrition program reached a total of 171,281 clients,
46 per cent of which were malnourished adults167 (no further data about reduction of
fatality rate or recovery was provided in this document).
1.3.3.2 The Indian case
In India, in 2008, RUTF procurement was at the centre of a debate between the local MoH
and UNICEF. This country represents an important case study because the SAM case load, in
this country, is extremely large. More than eight hundred thousands under‐five Indian
children suffer from severe acute malnutrition168. For decades Indian hospitals have treated
SAM with local foods, similarly to what reported in Africa before the arrival of F100 and
RUTF105.
In 2008, the government of India started a dispute with UNICEF over RUTF introduction in
the country169. UNICEF imported a large quantity of RUTF to treat children with SAM in two
Indian states, apparently without the authorization from the local authorities. Therefore,
the national government stated that these supplies were to be sent out of the country. The
collaboration between UNICEF and the Government became difficult, as reported by the
international press. A peer‐reviewed article170 from the Indian “Working Group for Children
Under Six” argues that “it is hard to explain why it has been permitted for a somewhat alien
product to be introduced at such large scale”.
This debate was only started in two Indian states, but soon it became a concern for the
entire country. In 2009, the MoH organized a “National Consensus Workshop on
Management of Children with SAM through Medical Nutrition Therapy”. On this occasion,
representatives from the Indian MoH, NGO and research community had the chance to
discuss the use of RUTF to treat SAM in uncomplicated children at community level. Valid
International and MSF supported my participation at the conference.
Less than a year later, the journal Indian Paediatrics (volume 47, number 8) published an
issue with nine original papers written mostly by Indian authors. Based on the available
evidence, the papers supported the endorsement of RUTF, and urged the improvement of
the existing guidelines. Their evidence‐based conclusions are expected to contribute, in the
long run, helping India to catch up with the rest of the countries treating their severely
malnourished children with RUTF.

74
Some of these articles critically looked at the African experience. Three papers included
systematic and narrative reviews of the efficacy, the safety and the coverage of RUTF‐based
interventions in Africa9,62,101. The same journal issue looked also at what was done in India.
Two studies171,172 evaluated the feasibility and the outcome of home‐ and hospital‐based
rehabilitation of severely malnourished children without using RUTF or F100, but using local
Indian dietary prescriptions. Both studies showed that the recovery rate in the children was
suboptimal. A third study, describing a randomized controlled trial, assessed the
effectiveness of a locally made therapeutic spread in decreasing mild to moderate
malnutrition. The authors report that “the RUTF was prepared at a local bakery and packed
into polythene bags (250 g per bag), heat‐sealed and distributed to the pre‐schools. The
RUTF was produced by mixing together ground roasted peanut butter, milk powder, sugar
and gingili oil”. The latter, based on sesamum indicum, is commonly used to soften hair and
skin in India. Therefore, it can be argued that its use was culturally acceptable. In the same
trial, the control consisted of the current standard of care, consisting of “teaching caregivers
how to make a fortified cereal‐milk supplement”, similar to a porridge. The author
concluded that “community‐based treatment showed weight gain in both groups, the gain
being higher with RUTF”.
The same journal issue described the local production of fortified lipid‐based spreads. One
study reported that “production of RUTF is a simple process”, and that “all the ingredients
and equipment for RUTF are widely available” locally. The authors explore three production
models already tested in India: (i) dairy cooperatives and private manufacturers able to
produce large quantities to meet regional requirements, (ii) small and niche food
manufacturers producing smaller volumes, but with a larger presence in most parts of India;
and (iii) “hand made” RUTF manufactured by “village industries” for immediate local
consumption. The publication concluded suggesting that “it is time public health/ medical
communities and civil society come together to make effective community management of
SAM an immediate reality”.
A paper titling “Management of Children with Severe Acute Malnutrition: A National
Priority”173 closed the Journal issue. One of its sections reports that in India “there is
unprecedented political and bureaucratic will to address the national embarrassment of
SAM” and that “the national funding agencies and Indian scientists also perceive the need

75
for prioritising this area for research”. The conclusive sentence warns that “arguments
against product based nutritional therapy in community settings should not obstruct urgent
evidence creation to feed national policy”.
1.3.4 Current research areas
The potential of RUF products has just recently started to be fully recognized, opening wide
areas of research. WFP recently confirmed that RUF have a role to play3, being not only in
high demand, but also in an increasingly variety of forms54, addressing nutritional issues in
new target groups. This seems to be confirmed by the number and the pace of evidence
published in the last few years. Only a sample is reported here.
In 2009, Chaparro and Dewey174 suggest that, in large general food distributions, RUF
spreads may have more potential to reach children under two and pregnant and lactating
mothers, than other food commodities, however, more evidence is needed. In 2012, in a
factorial randomized trial, RUF spread was showed to mitigate weight loss among HIV‐
infected women during exclusive breastfeeding175. Some authors concluded that this is a
“rapidly changing area of research”54, and reporting that currently “numerous studies are
ongoing”54.
Despite research in RUF is ongoing, some areas may not be receiving adequate attention.
The following section describes important problems and knowledge gaps that I have
identified and will be tackled in the rest of this thesis.

76
1.4 The problems and the knowledge gaps
Some aspects of therapeutic, supplementary and complementary feeding with RUF spreads
require more evidence‐based understanding. Some authors raised this specific point when
looking closer at the available knowledge about RUTF and SAM management. However, the
same apply to most of the other RUF spreads. For instance, the current RUTF formulation is
based on results from a limited number of studies, in a few settings, showing rapid weight
gain. The latter may not be ideal when leading to a rapid increase in fat rather than lean
body mass, and negative, long term, health consequences. Moreover, in other settings,
with different underlying nutrient deficiencies and infectious disease profiles, similar
weight gains would perhaps occur with nutrient levels different from those in use95,176–178.
Therefore, exploring these hypotheses is important. However, testing improved RUF
prototype formulations is costly.
Improving each preliminary phase of their design, before trialling their clinical effectiveness
in expensive studies, is therefore crucial.
1.4.1 How should improved RUF products be designed?
The peanut‐based of Ready‐to‐Use Therapeutic Food was not a formulation optimized,
whose target goal was the lower cost. Instead its original design aimed at being as little
different as possible from the existing F100 product, which was known to be efficacious in
rehabilitating children from severe acute malnutrition.
Therefore, a validated method to design and trial novel optimized RUF is currently not
available. This was officially recognised only in 2008, during the conference which approved
the use of RUSF spread to prevent and/or treat MAM28,153. UN, NGO and academic bodies
expressed the need for an evidence‐based method to test and validate novel improved
RUF179. This is a strategic aspect, because it potentially affects future developments in the
treatment of many forms of undernutrition, in other life stages.
One of the conference documents suggested, as a followup activity, “to design a complete
framework to test a new product”. However, at present, there is no internationally
endorsed protocol to design products of this kind.

77
1.4.2 How can novel RUF acceptability and safety be tested, prior to
trialling their effectiveness?
Testing the acceptability and the safety of improved RUF spreads can be challenging. That
may be described by a few examples. The formulation of the RUTF currently used in most
therapeutic feeding programmes includes milk powder and peanut butter. These two
ingredients seemed to be among the causes of a low level of acceptability among
beneficiaries in Cambodia, as reported by MSF180. A qualitative socio‐anthropological
investigation, conducted by Boudier, from the French Institute of Research for Development
(IRD) explored this aspect181. A traditionally accepted ingredient (fish sauce) was introduced
into the formulation, and its preference assessed in a trial with a simple design 180. The
results were not in favour of the novel formulation. Safety was not included among the
parameters.
In India, for similar reasons, another formulation was designed and more successfully tested
for its acceptability. Thirty‐one wasted children were offered pre‐set amounts of RUTF or its
control, a local porridge, in unlimited amounts for two days. Energy intake and acceptability
were the primary outcomes of this trial. Only one child was excluded after becoming sick
during the study. After a statistical analysis of the data, the conclusions were that the RUTF
and its control “were both well accepted“. At the time of this thesis, a literature review did
not highlight any effectiveness trial based on the described product. However, in the
acceptability trial, it could be argued that the limited time of exposure to the spread may
have not been sufficient to highlight potential risks of side effects.
In Malawi, similar conclusions from an acceptability study had a negative impact on the
subsequent RCT. Fellows (personal communication; 2008) reports that an initial pilot study,
with no control for comparison, that tested the preference for an improved RUTF in wasted
children, showed high acceptability, among children and caretakers, after one day of
testing. Chickpeas and sesame were among the ingredients. The RCT was therefore
initiated. However, the randomized delivery of the improved RUTF had to be soon
interrupted. The reason was that, after few days, the care givers had reported, in their
children, a stomach pain consistently associated with the RUTF consumption. The trial was,
therefore, never concluded.
However, a few important lessons were learnt. Changing ingredients may result in a

78
negative impact on the health and, potentially, the survival of vulnerable undernourished
people. Moreover, trials with a short duration, and/or weak design, may fail to identify
potential risks of low acceptability and safety. Therefore, it was agreed that any sort of
deviation from tested RUF formulations should be carefully based on sound evidence,
derived from robust randomized controlled trials (RCT)182. However, at present, there is
little agreement about how to adequately assess the acceptability and the safety in
products of this type.
1.4.3 What is the adherence to paediatric RUF formulations when used for
older people?
A paediatric RUF is currently used in adults. In 2007, the UN officially approved the use of
RUTF for the treatment of acute malnutrition in children under five years of age 55. The
same paediatric formulation is currently supplied to large HIV programmes aiming at the
nutritional rehabilitation of wasted adults. However, as reported in section 1.2.1.5, this
formulation is costly, and its choice in this life‐stage group only partially supported by
conflicting evidence116,127. These controversies were recommended to be urgently better
understood129. Understanding patients’ adherence to RUTF may shed some light.
Looking at how adult patients comply with a prescription based on the paediatric RUTF
formulation seems crucial, but the current data are little. Furthermore, the method
designed to carry this research may suggest lessons to improve the RUF spread and/or its
delivering intervention.
1.4.4 How can the cost of RUF be minimized?
Ways to reduce RUF costs need to be further explored and improved. According to
UNICEF119, sixty‐eight per cent of Plumpy’Nut final overall price, excluding manufacturing
and transport costs, consists of food ingredients. In Kenya, in March 2008, one kilogram
of Plumpy’Nut costs approximately 5.00 USD (personal communication: Malik Allouna,
MSF/France, Kenya mission). This suggests that the indicative price for the food ingredients
component was 3.4 USD/kg.
In RUF, some ingredients are more expensive than others. Milk powder, when present,
represents ~50 per cent of the final cost, and cheaper food ingredients are in demand to
replace it. In 2011, whey powder was recommended by some large donors54, in spite of the
fact that experts voiced the need to test its safety first183,184. However, whey is only 20 to 40

79
per cent cheaper than milk, is not available anywhere, may be culturally unacceptable in
countries where unknown, and requires sophisticated technology. Therefore, solutions at
lower cost should be urgently sought.
Lower transport and reduction of importation costs are likely to result in a price advantage
for locally produced RUTF. The regional agriculture economy may benefit due to local
purchase of the ingredients, increasing national self‐reliance on local food crops. Based on
these considerations, frequently found in the international debate about RUF use, it would
be very advantageous if locally available and cheaper commodities could replace expensive
imported food ingredients in future formulations. However, replacing costly ingredients,
while still meeting each of the nutritional standards described at page 67 and avoiding an
extended trial‐and‐error approach is likely to be challenging.
Therefore, a crucial knowledge gap is how to develop a method for designing the cheapest
formulation of a RUF that fulfils pre‐defined nutrients requirements, using region‐specific
foods that are culturally acceptable, and that can be processed with locally available
technologies.
1.4.5 How can micronutrients specifications in novel RUF be determined,
when requirements are unknown?
In some forms of malnutrition of global public concern, evidence may be often too little or
too weak to determine improved nutrient requirements. Therefore, the specifications for
RUF cannot be determined. An example is provided by wasting associated with HIV. The
current RUTF formulation showed relatively satisfactory survival rates in children affected
by HIV and/or TB43,185. However the same is not true in adults116, and a recent systematic
review study urges further research “to test high‐dose multiple micronutrient supplements”
which “may be appropriate only for short‐term nutritional rehabilitation in underweight
and malnourished adults with HIV”75.
No evidence‐based method to determine micronutrient specifications for RUF, when
nutrient recommendations are unknown, is currently available. However, there is an urgent
demand for this method, and its applications.

80
2 Rationale, aim, study plan, objectives and research questions

81
2.1 Rationale
This area of research is strategically important for global nutrition and health. The thesis
explores the development of methods to fill the knowledge gaps described above. These
methods will be incorporated into an overall framework for the design and preliminary
testing of novel RUF products that I will develop.
With these reasons in mind, I conceived the following general aim and objectives. They are
summarized here and explored in detail in the next chapters of this thesis.
2.2 General aim
To develop a series of methods and an overall framework for the design and preliminary
testing of lower cost, lipid‐based ready‐to‐use foods, for the prevention or treatment of
undernutrition.
2.3 Study plan: the case‐study, the sub‐studies, and their objectives
The study plan was composed by four separate sub‐studies, each with one specific objective
and method. A case‐study helped to assess the methods, when applied to design an
improved RUF.
2.3.1 The case‐study
The case‐study was selected purposively. Its application aimed to highlight lessons to learn
from the practice. The choice of the case‐study took into account each of the described
knowledge gaps and problems.
For this purpose,
I selected the design of a low‐cost, acceptable and safe RUTF, specific for wasted adults, living with HIV with (or without) active TB.
This case‐study covers all the raised issues related to RUF design and testing. The
prevalence of HIV wasting among adults is a public health concern, as described in section
1.1.2.1. In this group, the current paediatric formulation for RUTF does not seem to

82
increase survival, as reported in section 1.2.1.5. Therefore, a framework to design a novel
formulation is urgently needed (issue number 1 described in section 1.4.1). The improved
RUF should be acceptable and safe (issue number 2 in section 1.4.2). The section 1.4.3
describes how the design must be consumer‐driven. Therefore, the product improvements
must be based on the preferences and the suggestions expressed by the wasted adults
currently or previously exposed to the most common product (issue number 3 in section
1.4.3). The novel formulation must be economically viable, therefore its cost should be as
cheap as possible (issue number 4 in section 1.4.4), while still meeting its nutrients
specifications. Little is currently known about the micronutrient recommendations for
adults with HIV wasting, associated or not with TB. Therefore, in this specific group, the RUF
micronutrient specifications represent an additional challenge (issue number 5, in section
1.4.5).
2.3.2 The sub‐studies
Each problem or knowledge gap described in sections 1.4.1 to 1.4.5 guided the overall
research aim. In accordance with the framework method, the general research purpose was
broken‐down into four sub‐studies, which were applied to the selected case‐study. Each
sub‐study had a specific aim, met a specific objective, and responded to an individual
research question.
Sub‐study 1 ‐ Adherence and key barriers
Aim of the study: Development of a method to understand the factors
affecting usage of current formulations of RUF
Specific objective: To investigate compliance with RUTF in a HIV/TB
therapeutic nutrition programme in Kenya
Research questions: (i) what is the adherence to a protocol, when using a
specific RUTF (Plumpy’Nut), among malnourished adults
living with HIV?
(ii) what are the key barriers to their adherence?

83
Sub‐study 2 – Formulation of improved ready‐to‐use foods
Aim: Testing of a method for optimal design of novel RUF
formulations
Specific objective: To design a formulation that fulfils the international
macro‐nutrient requirements and food‐related standards
for the design of a cheaper RUF
Research question: How can a linear programming based method be used to
design the cheapest formulation of a RUF that fulfils pre‐
defined macronutrients requirements, and uses
regionally‐specific foods which are culturally acceptable
and can be processed with locally available technologies?
Sub‐study 3 ‐ Acceptability and safety
Aim: Development of a method for trialling the acceptability and
safety of a novel RUF formulation
Specific objective: To compare the acceptability and the safety of a novel
RUF with the most commonly used product, using a
randomized controlled clinical crossover trial with HIV/TB
patients in Kenya
Research question: What is the consumption, safety, and preference for a
novel RUTF, in comparison to the current standard
product used to manage HIV/TB wasting in adults?
Sub‐study 4 ‐ Designing micronutrient specifications when requirements are not available
Aim: Development of a method for deriving recommended RUF
micronutrient specifications for malnourished groups

84
Specific objective: To design a method to derive micronutrient specifications
in a RUTF for wasted adults living with HIV/TB, whose
requirements are currently unknown.
Research question: What are the micronutrient specifications for a RUTF to
manage HIV/TB wasting in adults?

85
3 Understanding the challenges in current usage of ready‐to‐use foods: an investigation of adherence in a HIV/TB therapeutic nutrition programme in Kenya (sub‐study 1)

86
3.1 Adherence
In the human history, the importance of therapeutic adherence was early recognized. In
ancient Greece, Hippocrates was aware of the fact that patients pretended to have taken
their medication186. At the end of the 1950s, three physiologists drew closer attention to
the adherence phenomenon, studying the therapeutic effects of a tuberculostatic agent in
out‐patient settings187. Later, in 1975, David Sackett described adherence in depth, when
low compliance was found responsible for unpredictable or disappointing responses to one
treatment of hypertension188. The same author states that much still needs to be
understood in this area of research.
According to Donovan, in 1995, “one of the most striking reasons for the lack of progress in
compliance research is the absence of a crucial factor: the patient’s perspective”189. The
latter is the element which distinguishes adherence from compliance. According to the large
variety of definitions available in the literature, compliance “is a word with negative
connotations. It suggests yielding, complaisance and submission” 190. The patient should not
be perceived as “passive, acquiescent recipient of expert advice as opposed to an active
collaborator in the treatment process”191. Therefore, based on this new perspective, WHO
proposes the following definition of adherence191:
“The extent to which a person’s behaviour – taking medication, following a diet,
and/or executing lifestyle changes, corresponds with agreed recommendations
from a health care provider”.
Claxton et al. agrees with this definition, suggesting that adherence is
“an essential component of a successful health outcome”, and, most of all, is “largely
in the domain of the patient”192.
In a review of seventy‐six studies, the same author concludes that the definitions of
adherence are numerous and varying because of the many ways in which it was assessed
and measured193. However, distinguishing degrees of adherence, such as partial or total
non‐adherence, may be challenging. For instance, when dose‐taking and dose‐timing
measures are used, partial non‐adherence can be defined as “taking less then the

87
prescribed amount of medication or taking the medication at inappropriate intervals” 193,
whereas “total non‐adherence can be defined as discontinuation of treatment”193.
Currently, there is no agreement on cut‐offs for partial‐ or non‐adherence levels. However,
based on a review of the available literature, Krueger et al. found that most authors
considered non‐adherence when the consumption of the doses prescribed was lower than
80 or 90 per cent, “while others considered any missed dose as evidence of non‐
adherence”194. Moreover, from the classification point of view, there is agreement that
patient’s non‐adherence can be both “intentional or unintentional”190.
In UK, the term concordance has been also used to define adherence or compliance. In
1998, the members of the Royal Pharmaceutical Society of Great Britain considered that the
way of thinking about compliance was insufficient195. Therefore the current terminology
was changed from compliance to concordance, “which means agreement and harmony”.
The concordance approach considers “the patient as a decision maker”195, and her/his
“professional empathy” with the medical staff196 the cornerstone of the treatment success.
Because of its current large use in the found literature, in this chapter, despite its semantic
limitations, adherence remains the preferred term.
3.1.1 The importance of adherence
In the literature, there is consensus that adherence to treatment is important, and its
reasons are many. Adherence is a “key link between process and outcome in medical
care”190,197.“The responsibility for fulfilment of the prescribed regimen lies with the
patient”192, and the most carefully chosen and optimal medication cannot work, if the
patient does not take it appropriately”192. This is consistent with the available evidences.
For instance, a literature review192 has confirmed the direct relationship between the
number of daily doses, rate of adherence, and positive health outcomes. This was found
also in complex treatment regimes where sophisticated electronic monitoring systems were
in use198.
It can, therefore, be argued that “non‐adherence is detrimental”, because it “wastes
resources, and causes preventable morbidity and mortality, and the loss of healthcare
dollars and productivity”199. However, authors recognize that systematically reviewing non‐
adherence in the available literature can be challenging, because the documented evidence

88
is little. This seems to be because researchers are aware that when measurements of
adherence are considered, the interpretation of the results can become complex, while
“studies with significant results could have a greater likelihood of publication”199.
According to the available evidence, however, investing resources in improving adherence is
expected to be cost‐effective. Claxton et al. reports that “health care personnel expend
many resources caring for patients who do not respond to initial treatment with a new
drug”192.
In low‐income countries, absence of information about adherence to nutrition programmes
hampers the evaluation of their effectiveness. For instance, the World Bank 40 reports that
nutrition “interventions have been deferred … because data on compliance and delivery
mechanisms are unclear”. To support this statement the report uses the cases of zinc and
calcium supplementation programmes in African and Asian countries40.
Very similar considerations are applicable also to out‐patient nutrition programmes, where
lipid‐based RUF spreads are used. In 2002, Collins et al. 200 voiced the importance of
understanding “the role of community groups and mother‐to‐mother educational
techniques” to improve adherence in community‐based treatment of SAM. Almost ten
years later, in 2011, similar recommendations are again found in the scientific literature. In
a HIV care programme, in Uganda and Kenya, supported by MSF, Ahoua et al. 127 highly rank
the “understanding of adherence” with RUTF‐treatment to improve health outcomes, and
to make the same intervention more cost‐effective.
3.1.2 The determinants of adherence
The literature describes a large number of determinants of adherence to treatment. These
include factors related to the environment in which the patient lives, the setting in which
the treatment is supplied, and the counselling session, if any, that comes together with the
regimen. This section first describes the determinants in general settings, and secondly
focuses specifically on low‐resources contexts, and in particular on nutrition programmes.
The environment of the patient is an important determinant for adherence because
“patients live in a social environment. Social support involves the help that family members,
friends, or caregivers provide to help patients adhere to their medication regimens”194.

89
Therefore, it should not be surprising that “patients who believe they have social support
demonstrate greater treatment adherence” 194. Other review studies 193,201,202 confirm that
“family cohesion and the stability of home life”, together with patients’ membership to one
or more support groups appear to be additional predictors of adherence.
The clinical setting also influences the degree of adherence. For instance, in health service
settings, Krueger et al. 194 found that “long waiting periods and a lack of continuity of care
are more likely to lead to non‐compliance”.
However, counselling and the relationship between patient and health staff are among the
strongest determinant of adherence. In a large review study, Vermeire et al. 190 report that
the non‐adherence is associated with the complexity of medical regimens, as much as poor
communication, and patients’ concerns, which the health staff were unable to solve. For
this reason, it was concluded that adherence “seems to be related to the quality, duration
and frequency of interaction” between the patient and health service provider 190.
Counselling is one of the most important forms of interaction between patient and health
staff. In nutrition and medical interventions, “regular dietetic followup and detailed
discussion of the disease by the physician have also been found to be associated with
adherence” 193,203. One study suggested some possible reasons. Correct application of
counselling techniques may trigger a “patient’s belief that a medication will work or is
working”194, enhancing the patient’s “ability to endure the side effects” of the treatment,
and maintaining “a positive attitude” 194. Not surprisingly, in another review study, Hall et
al. 193 found that adherence was not necessarily associated with “correct knowledge” in the
patient group, but when the health staff had confidence in the treatment effectiveness 193.
The same author 193 also suggests that health staff’s “descriptive accounts and explanations
of the illness” and the treatment can influence both the attitude and the beliefs in the
patient, increasing, therefore, his or her level of adherence.
The frequency of nutrition supplement doses may be important in determining adherence.
In a study involving south‐east Asian pregnant women, the reduction in the frequency and
size of iron supplement doses improved both their adherence with the treatment and,
therefore, their haemoglobin status 204. At least one other study reports similar conclusions.
In Indonesian non pregnant women, a descriptive review suggested that “compliance may

90
be improved when it is not necessary to take tablets on a daily basis”, but once‐weekly and
twice‐weekly 205.
Lack of logistical intervention to support patients was suggested to reduce their adherence
to treatment regime. But only one evidence was found sustaining this observation. Among
Palestinian refugees, complex procedures for the delivery of drugs were deemed to have
increased patient drop‐out 206.
In treatment adherence, some factors were surprisingly not found to be influential, and
quality of life is among them 193. Hall et al. 193, confirmed by Vermeire et al. 190, found that
socio‐economic factors and demographic variables such as sex, marital status, and number
of people in the household are also poor indicators of adherence, while, at least in these
studies, age remains a controversial predictor 190,193.
Because of the limited knowledge gained about adherence, understanding its patterns and
its determinants holds some challenges. For instance, although in two studies 189,207 almost
two hundred different doctor‐, patient‐ and encounter‐related models have been explored,
none of the latter was found to be an ultimate robust predictor of adherence level189,207.
This unexpected limit induced Lassen et al. to conclude that “none of the suggested
explanations has accounted for more than a modest part of the observed variations in
compliance” 208, and Vermeire 190 shares the same opinion. If this is true, much is still to be
discovered in this area of knowledge.
In studies looking at micronutrient supplementation, side effects may be responsible for
non‐adherence. But some of the available studies show controversial conclusions. Ekstrom
et al. 209 found that adherence was still low, even when using a form of iron that produces
few side effects. Another study seems to contradict these findings. In Norway, pregnant
women receiving a similar form of iron supplements complied as well as women taking
placebo 210. The low frequency in reporting side‐effects may explain the difficult to explain
these results in other studies. In Burma, only three per cent of women stated that side
effects were the reason why they stopped taking their supplements 211, consistently with
what Vermeire et al. 190 found: “side‐effects are, surprisingly, only mentioned by five to ten
per cent as a reason for non‐compliance”. In the available literature about supplementation,
the role of side effects in relation to adherence remains currently a knowledge gap.

91
In nutrition supplementation, there is evidence that colour, shape, smell, taste, and the way
of supplement provision (i.e. tablet, syrup, capsule or injection) can affect adherence. One
study in Mexico found that pregnant women preferred more injections, or red tablets than
brown or white tablets, because they felt that red is the colour thought to strengthen the
blood 212. Capsules were preferred by women in Tanzania, because of the association with
antibiotics, considered to be the most effective form of treatment 209. The importance of
those adherence determinants may, therefore, vary according to the given contexts and
treatments.
Overall, there is sufficient evidence to conclude that identifying the determinants of low
adherence is an objective difficulty, and some authors tried, at least, to understand the
reasons existing at its root. Claxton et al. suggests that adherence “data, based on patient
self‐reporting, may be erroneous not because patients consciously falsify dosing reports,
but because patients may forget about taken or missed”. Other authors suggest a different
perspective to the problem. Observing how patients ultimately do determine adherence190,
Di Mateo et al. 213 identify a close similarity between them and market “consumers”, who
are often consciously, or unconsciously, “demanding”. This approach stresses the need for
understanding and interpreting the patient’s knowledge, attitude and practice in order to
increase treatment adherence. At the consultation, “patients hold sets of beliefs and
theories about health and illness”190, and, therefore, knowing “what sense individuals make
of the advice given to them” becomes crucial190. On other hand, Di Matteo et al. 199 also
hypothesizes that “many patients misunderstand, forget, or choose not to follow the
recommendations of their health professionals”. In these cases, “the offering of medical
recommendations that are misunderstood or subsequently forgotten or ignored, is a waste
of scarce healthcare resources and suggests a systemic problem” 199.
In nutrition interventions designed for poor settings, adherence determinants were also
explored, even if not sufficiently. For instance, in Kenya, a review 214 of a large national
programme to supply wasted adults living with HIV with a fortified porridge flours found
that cost of public transport to reach the clinic was an important determinant. Without
decentralized services, or integrated with the HIV care, the beneficiaries were able to carry
home only small amounts of the ration. In the same setting, also other logistic barriers were
reported. The intervention suffered from shortage of staff, of counselling rooms, stock‐outs,

92
and lack of alignment between client schedules for the fortified porridge and the ART
services. The final perception among the beneficiaries was reported to be that the porridge
was not “user‐friendly”.
Stigma can be attached to treatment, and, therefore, influencing adherence. The same
Kenyan review study 214 concluded that the perception, at community‐level, of a food
specifically targeting HIV positive people, reduced its consumption. However, low
adherence may be due also to other causes. Because of food insecurity in the patient’s
households, other family members, not necessarily HIV positive, may have consumed his or
her limited supply. This phenomenon was more frequent when the client was a woman.
Therefore, in these settings gender is an important adherence determinant. Another
study127 from Kenya and Uganda reached similar conclusions. In these two countries, gender
was found to determine nutritional recovery in HIV and TB severely wasted adults,
supplemented with RUTF spreads.
The way of proposing the food and its taste were also found to be determinants of
adherence. In the Kenyan fortified porridge programme, focus group participants felt
“uneasy” with the concept of pre‐cooked flour, as well as with the need to use unusually
shorter cooking times.
Knowing the current levels of adherence to treatments is as important as accounting for its
determinants. The following section quantitatively explores the levels of adherence
reported in the recent medical literature.
3.1.3 Recent evidence on adherence
The evidence on patient adherence to medical treatment includes hundreds of empirical
studies over the past fifty years. That is due to “chronic disease becoming more prevalent
and treatment more dependent on patient self‐management” 199.
In 2004, in a large meta‐analysis, Di Matteo et al. 199 included 569 studies reporting
adherence, and finding this to be the highest in HIV, arthritis, gastrointestinal disorders, and
cancer treatment, while the lowest adherence was reported in pulmonary disease,
diabetes, and sleep care. In the same study, the average non‐adherence rate was 24.8 per
cent, with the highest rate in patients with HIV, arthritis,
gastrointestinal disorders and cancer. This seems to be confirmed by Cramer et al. 215, who

93
found means of non‐adherence of 42 and 35 among patients with psychiatric disorders and
depression, respectively.
More recently, research on adherence degrees produced controversial conclusions. Dulmen
et al. 216 considered 38 systematic reviews and found that “many adherence interventions
appear to be directed at the chronically ill”. While, in another review study 217, it was found
that “in general, adherence rates are higher among patients with acute conditions
compared to patients with chronic diseases”, and apparently, in these patients, adherence
“is disappointingly low, dropping most dramatically after the first six months of
therapy” 218. In 2007, based on a set of contradictory evidence 187,190,219,220, it was suggested
that “the research about adherence (levels) seems to have got stuck”216.
The literature about adherence levels to diet‐based treatments is poor, and only one review
study on dietary adherence was found. In a gluten‐free food regimen, Hall et al. 193 reports
that more than 60 per cent of the adults, all with celiac disease, were not following the
dietetic prescriptions. However, “lack of comparability between studies, in terms of design,
methods, definitions and measurement of adherence” may weaken this study
conclusions193. It can be concluded that well documented levels of adherence are,
therefore, limited 221.
Although its current levels could not be ultimately established, adherence to treatment was
measured with a variety of methods, which were experimented in a large number of
studies. The latter are summarized in the following section.
3.1.4 Measurement of adherence
Measuring adherence to treatment in the correct way is important. Therefore, its accurate
estimation cannot be over‐emphasized. The following sub‐sections explore both the theory
and the practice of adherence measuring.
3.1.4.1 Models of adherence and its determinants
The available literature reports models to estimate adherence to treatment, and also calls
them approaches or frameworks. These are often numerous, complex and sometime
overlapping. Since a consensus was not achieved, researchers grouped them into categories
or clusters, summarized in the following paragraphs.

94
In one review study 213, three models, namely the Health Belief model, the Theory of
Planned Behavior, and the Transtheoretical approach, are summarized in the following way:
common components of these frameworks “involve health professional‐patient
communication, patients' cognitive and social processes (e.g., beliefs, norms), and patients'
resources (e.g., financial, psychological, and social support)”.
Other researchers preferred alternative approaches. Roter et al. clustered the ways to
measure adherence according to the following four theories: the Behavioural approach,
the Educational model, the Affective framework, or combinations of all these 222. Dulmen et
al. 216 grouped the models as Technical, Behavioural, Educational, Social and Multifaceted.
In reading of the vast available literature, and aware of its limits, I identified four general
model groups to measure adherence to treatment. In the first one, the correlation between
health outcomes and the dosages, the packaging or the frequency of the drug intake, are
often at the centre of the measurement. This approach is for instance typical in the often
so‐called technical models. In models considered behavioural, the correlation between
health outcomes and memory aids and reminders for the patient (via telephone, computer
or by home visits) is explored. From the perspective of the latter theory, “human behaviour
depends on stimuli or cues that elicit certain responses and on the rewards that reinforce
behaviour” 216.
The third model is referring to Educational elements or “cognitive didactic approaches”,
that include “teaching and providing knowledge” 216, and are defined as “educational
interventions given with the intent of improving the person's ability to
manage his or her disease “ 223. These models involve “different ways to educate patients:
individual versus group education, face to face contact, audio‐visually, in writing, by
telephone, by e‐mail or via home visits” 216. Collaborative Care can be considered part of
the Educational Model, and was defined as a systematic approach involving any figure of
“health professionals or other care providers”224.
Social models, belonging to the fourth group, are more focused on the support that the
environment of the patient can provide. In a large review study, Di Matteo 213 found that
“practical, emotional or undifferentiated” social supports had the strongest relationship
with adherence. However, it is “not yet understood how social support contributes to

95
health, and which factors moderate and mediate this relationship” 216. Multifaceted models
include different approaches. Dulmen et al. 216 describe them as “effective for long‐term
care”, but also “exceedingly complex and labour‐intensive” to measure.
Despite the available models, measuring adherence adequately, remains challenging 216.
This is for at least two reasons. One is that there is a scarcity of comparative studies
explicitly contrasting theoretical models or their components 216. The second one is that
“research into a phenomenon as complex as adherence is inevitably fragmented” 190,
therefore “a model or theory to integrate the different studies” to support its adequate
measuring was not found 190. However, some authors conclude that “innovations in theory
and practice are badly needed” 216.
3.1.4.2 Ways of measuring adherence
Consensus on one model to understand and explain treatment adherence levels is missing.
The same is true for a standardized protocol meant to measure them with accuracy 194.
Most studies report the method which they applied, but, in general, their degree of
complexity is high216. This is explained by Di Matteo et al. in the following way: “there is no
one adherence measure against which to calibrate others, making concurrent validation
impossible” 213. The little documented in the literature is reported in this section.
Measures of adherence can be direct or indirect. The former consists only of direct
observation, is “practical only in single‐dose therapy, intermittent administration and
hospitalized patients” 225, and is carried out whenever possible by an “independent
observer”194. Indirect measures may be taken in many more ways, applied individually or in
combination 194. These include medical records and/or charts, interviews, self‐reports,
collateral reports, electronic monitoring, tests based on Likert scales, pharmacy reports,
assessments of the motivation to adhere, pill counts or checks on container refilling, diaries,
physical and biochemical tests 194,213,216. The latter usually consists of “detection of a
chemical (metabolite or marker) in a body fluid (blood, urine)” 194. Although this is an
objective approach, methods based on body fluid are still considered indirect 194, and can
be resource demanding.
However, most of the listed methods present flaws. For instance, “interviews and all self‐
report methods are vulnerable to overestimates of compliance and underestimates of non‐
compliance” 190. When comparing methods, “self‐reports have been shown to overestimate

96
adherence by as much as 200 per cent, compared with biochemical measures” 194. Krueger
et al. 194 explains this phenomenon based on “the patient’s desire to appear compliant”,
and suggesting that “patients do not remember exactly when they took their medication or
record the times at which they were supposed to take it”. “Drugs counts also appear to
overestimate adherence, because patients may discard any remaining pills if they know
that a count will be conducted” 194. Vermeire et al. 190 concluded that “interviews and all
self‐report methods are vulnerable to overestimates of compliance and underestimates of
non‐compliance”. Also the method based on the refill record is not exempt of issues. In the
available literature it was found that this is a “reliable method of determining whether
someone picked up the prescription, but it provides no information about a patient’s actual
medication use” 194.
Methods in studies looking at dietetic adherence, may face additional challenges.
Unfortunately, despite the large number of studies looking at the efficacy of prescribed
dietetic patterns or supplements, in most existing studies, the differences in adherence
levels are not discussed 226. When documentation is available, the methods were described
in the following way. Dietetic assessments are often conducted by an expert, and are
usually based on an interview or a food diary, considered the most objective, non‐invasive
method of measuring adherence 193,202,227,228.
Analysis of these measurements must often take into account the synergic effects or
interactions between nutrients or foods that comprise the diet 229–231. This can be an
additional issue. To solve this, interactions indexes are in use, often based on food groups.
This approach requires food categorisation processes, which are complex when evaluating
mixed dishes 231. Despite these difficulties232, grouping foods to obtain index scores remain
“a very useful method” to increase the accuracy of dietetic adherence measurement232.
3.1.4.3 Measuring adherence in low‐resources contexts
The studies measuring dietetic adherence in emergency or low‐resource contexts are few,
but increasing in number. This section reports studies, which described how adherence to
micronutrient supplementation, fortified staple food supply, and RUF‐based treatment was
measured.
In a Kenyan refugee camp, a study 226 explored the factors influencing the adherence to a
micronutrient supplementation programme using qualitative methods. These included

97
focus group and key informant interviews. The tools used during the survey included free
lists, ranking exercises, scenarios, and open‐ended questions. The surveys were conducted
in the traditional languages of the interviewees, and interpreters were used throughout the
research activities.
In the same country, in 2009, a report reviewed a large national programme called “food‐
by‐prescription” 214. Thanks to this intervention, in an out‐patient setting, wasted adults
received fortified porridge flour. Also in this study, qualitative measures included interviews
and focus groups. The data were matched with an index called length of stay, defined as
“total time that a client remained in the food by prescription program before s/he exited”.
The time, therefore, comprised the days on active and non‐active treatment, periods of
missed food supplementation, and non‐adherence. The same year, another large report on
the same type of programme was reviewed by Greenaway 233 using the same qualitative
methods.
Few studies documented adherence to nutritional therapy using lipid‐based, ready‐to‐use
pastes. In Senegal, Diop et al. 71 compared the efficacy of the therapeutic formula milk F100
(described in section 1.2) and the peanut‐based RUTF formula in children under five years
of age. However, the children were consuming the RUTF in the feeding centre attached to a
clinic. A direct measurement of adherence, as direct observation, was, therefore, simple to
implement, but its results less applicable when generalised to other settings.
In Malawi, Ndekha et al. 116 also compared the same RUTF formula but with a fortified
porridge flour in wasted adults living with HIV. Adherence was measured only when study
participants failed to return to scheduled clinic visits for antiretroviral therapy. In these
cases, they were visited at home and information regarding adherence were collected with
interviews. Data about their treatment, clinical status and anthropometry were included. At
completion of the trial data collection, “social scientists from the University of Malawi, who
were not involved in any other aspect of the study, led open ended focus group discussions
to explore the use, acceptability, and sharing of the food supplements and to assess dietary
compliance”.
In the Democratic Republic of Congo, Bisimwa et al. 234 assessed the effectiveness of a
fortified soybean‐maize‐sorghum RUCF paste. This was compared with fortified corn soy

98
blend porridge. The prevalence of underweight and stunting, in infants, was the primary
outcome of this study. Adherence to the complementary feeding instructions was measured
using questionnaires, asking the mothers for the amount of food the children were
consuming, and counting the containers of either RUCF (sachets) or porridge (bags) already
used.
Seven other studies 62,101,124,125,128,129,152 looking at different aspects of nutrition
interventions using lipid‐based, ready‐to‐use pastes highlighted the importance of
measuring adherence in order to interpret the results. Surprisingly, this outcome measure
was not part of their method and/or result sections.
The documented ways to measure adherence to nutritional treatment in limited‐resource
settings are limited in number. This conclusion is consistent with a recent USAID document
looking into ways to improve food aid 109, and reading: “many, if not most, studies fail to
monitor compliance, which is a key factor in recovery with the use of nutritionally enhanced
products”. However, the current situation is improved by the contribution from the
adherence study described in the following sections. This includes the description of the
overall and specific settings of the study, its method, its results, followed by their discussion
and conclusions.

99
Figure 16 ‐ Map of Kenya
Source: FAO 2005 237
3.2 The overall and specific setting of the study
This study took place in Kenya, East Africa.
The following sub‐sections first introduce
the reader to the generalities of this
country, including its nutrition, health and
HIV/TB profiles, and then describe the
specificities of the study setting.
3.2.1 Kenya: generalities and
nutrition‐related facts
With its typical tropical climate, Kenya is
located in Eastern Africa, sharing its
borders with Somalia and Ethiopia to the
North, Uganda to the west and Tanzania
to the South. Nairobi is the capital and
Mombasa is the second largest city and
the main harbour of the region, located
on the Indian Ocean (East side of the
country). Kisumu is the third town and
the main port on the Lake Victoria.
According to the latest UN data, in 2009 Kenya had a population of almost forty millions,
with a density of 68.6 person per square kilometre 235, which is close to that reported for
neighbouring countries. The same year, the Kenyan gross domestic product was
approximately 30 million US dollars, showing an increase in the last years of approximately
2.6 per cent per year 235. Basic primary care is provided at healthcare centres and
dispensaries. Sub‐district, district and provincial hospitals provide secondary care, such as
integrated curative and rehabilitative care.
The recent drought and the food crisis in the whole region had large negative impacts on
most sectors 236. Despite this, the World Bank recently praised the Kenyan efforts to
improve gender‐ and water‐related interventions 236.

100
Kenya is currently a rural country. In 2009, only 22 per cent of the population lived in urban
areas, with an annual increase of 4.2 per cent. In 2010, the life expectancy increased up to
56 years, which is higher than the average in the region. In the same year, the national
under‐five mortality rate was 128 per 1,000 live births41, which is far higher than the MDG
target of 35 per 1,000 live births, set to be reached by 2015. The same sources suggest that
the stunting, underweight and wasting prevalences of children under five years of age are
stable (35, 16 and 7 per cent, respectively). Insufficient breastfeeding practice is still an
issue, with only 32 per cent of children less than six months of age being exclusively
breastfed 41. Maize is the basic staple of the Kenyan diet. Ugali, the main dish, is a thick
porridge of maize meal that is usually eaten with a sauce of vegetables or meat, or
accompanied with fermented milk 237.
3.2.2 Kenya and HIV: prevalence and response
Currently, the progression of the HIV/AIDS epidemic is a major cause of poverty and food
insecurity, “killing active adults, devastating families and increasing the number of orphans”
237. The national HIV prevalence in 2007 was estimated at 7.4 per cent in the age group of
15 to 49 years, and at 7.1 per cent in the age group from 15 to 64 238. An estimated 70 per
cent of HIV infected people live in rural areas 238. However, in this country, the syndrome is
considered by UNAIDS as “geographically heterogeneous” 238. In Kenya, Nyanza province
had the highest prevalence (13.9 per cent ) in 2010 239.
The Government launched a Strategic Plan (KNASP III) 2009/2010 ‐ 2012/2013 that seeks to
respond to the HIV public health concern. The intervention focuses on the reduction of the
number of new infections by 50 per cent, on the reduction of HIV related mortality by 25
per cent, and drastically increasing access to treatment and care services, for those who are
in need 238. In 2012, in Nyanza Province, “the initial years of rapid HIV service expansion
coincided with a drop in adult mortality by a third” 240.
3.2.3 Kenya and TB: prevalence and response
Kenya ranks 13th on the list of 22 high‐burden tuberculosis (TB) countries in the world and
has the fifth highest burden in Africa. According to the WHO Global TB Report 2009 241,
Kenya had more than approximately 132,000 new TB cases and an incidence rate of 142
new sputum smear‐positive cases per 100,000 population.

101
Kenya continues to treat more and more TB patients each year. However, widespread co‐
infection with HIV (close to 48 per cent of new TB patients) makes TB treatment difficult.
While the number of new cases appears to be declining, the number of patients requiring
re‐treatment has increased 241.
In 2007, the government demonstrated increased political commitment by upgrading the
division dealing with TB health issues within the MOH, and with increased funding for TB
control. A larger proportion of TB patients benefited from improved “Directly Observed
Treatment Short course” services (DOTS). The programme implements TB and HIV/ AIDS
treatment services, community‐based DOTS, and public‐private mix DOTS, as well as
activities to address multi‐drug resistant TB programmes 241.
The international NGO Médecins Sans Frontières / Doctors Without Borders (MSF) has two
large HIV and TB programmes in Kenya, both in the capital Nairobi and in Nyanza area.
3.2.4 MSF: the HIV/TB programme in Nyanza Province
Since the beginning of the 1990s, MSF has supported the local national health services in
Homa Bay, Nyanza Province (Kenya). At the time of this study, the MSF intervention
supported the district hospital and four primary health care facilities. The district referral
hospital offers health services to a rural area with approximately 300,000 inhabitants127. In
collaboration with the Ministry of Health, MSF provided outpatient and inpatient HIV and
TB care 127. With the aid of MSF, when necessary, patients were also referred and
transported for hospitalization 127.
In the MSF/MoH programme, the eligibility criteria for starting a combination of ART were
as recommended by the WHO guidelines (2006). The criteria admit all patients with WHO
clinical stage 4, or patients with CD4 counts of less than 200 cells/mm3 127. In the MSF
intervention, CD4 cell counts were monitored at ART start, at six months, and yearly after
the first 12 months of therapy. No routine viral load monitoring was performed 127. Once a
new patient was eligible for ART, he/she received three pre‐ART counselling sessions: first,
on the day of ART eligibility assessment; second, two weeks later; and third, one to two
weeks thereafter. The process took between 15 to 30 days, but may have varied according
to patient clinical status or readiness to initiate ART 127.

102
The record system of the HIV programme included the software database FUCHIA, designed
to hold data from MSF HIV programmes around the world.
3.2.5 The MSF nutrition programme
In mid‐2006, MSF, in collaboration with the MoH, began providing RUTF to all severely
malnourished patients attending the HIV/TB programme in Homa Bay127. The same
intervention started simultaneously in the Nairobi slum of Mathare 127. The RUTF provided
was an energy dense peanut‐based spread (Plumpy’nut®, Nutriset, Malaunay, France),
originally designed for the treatment of children with SAM 127 and thoroughly described in
section 1.3 at page 61 of this thesis.
Only patients diagnosed with WHO stage 3 or 4 conditions were enrolled in the Homa Bay
HIV / TB nutrition programme 127. Among these, malnourished adults, aged 15 years or
older, received therapeutic feeding if their BMI was less than 17 kg/m2, or they had bilateral
pitting oedema in the lower extremities 127.
Enrolled patients received four sachets of RUTF (2,000 kcal) per day in the outpatient clinic,
and were clinically assessed every two weeks or monthly before renewal of the RUTF
prescription 127.
During the counselling sessions frequently asked questions from the patients and the
caretakers about the frequency and the amount of RUTF to consume were answered.
However, no training and counselling material were supplied to support the health staff
members in this activity. During the first or the following visits, the capacity of swallowing
or accepting the RUTF was not systematically assessed by the health staff, despite this is
part of the guidelines of the treatment of SAM 97. Although wasted children with medical
complications were enrolled ‐ in accordance with the same guidelines 97 – into a residential
therapeutic feeding programme based at the district hospital, adults and adolescents older
than 15 years of age were included only in the out‐patient programme.
Patients were defined as “cured” and discharged 127 from treatment using the criterion of
BMI above or equal to 18 kg/m2 and no oedema for at least two consecutive weeks.
Therefore, patients meeting the predefined exit criterion were discharged, after full clinical
review, at any time after enrolment 127.

103
Patients who were unresponsive (“uncured” according to the protocol definition127) to
nutritional therapy after six months of treatment (not reaching BMI ≥ 18 kg/m2) were
reviewed by a physician for further investigations and management 127. After clinical
assessment to exclude presence of undiagnosed pathologies, they were discharged from
the nutrition programme, referred to patient support groups, and given a supply of corn‐
soya blend, beans and oil, through local aid agencies.
A written protocol reported in detail the contents of the nutrition programme, and was
available for the programme staff. However, at the time of the study, no training was
provided to the health staff to ease its application.
From January 2008 to March 2009, MSF admitted 782 malnourished adults into the
therapeutic nutrition programme, and the monthly mean weight gain was 1.8 (SD 0.5)
g/kg/d. Data prior to 2008 was not available.
After two years from the beginning of the nutrition programme, a tailored database, hosted
by the software EpiData‐Entry, was designed and tailored for the Homa Bay HIV nutrition
programme. The records included also the FUCHIA patient code.
3.2.6 The Ahoua (et al. ) study
A retrospective study, conducted by Ahoua et al. 127, discussed the results from the cohort
analysis of east African adult patients enrolled in MSF interventions, from 2006 to 2008.
Beside Homa bay, the study also included data from the MSF programme in Mathare, a
large Nairobi slum, and from Arua town, in Uganda. The three sites used the same protocols
for HIV / TB treatment and for the nutritional rehabilitation of their patients’ cohorts (see
section 3.2.4 and 3.2.5).
Within the nutrition programme, the study focused on predictors of treatment failure. The
study used multiple logistic regression, and four failure outcome categories: patients
“discharged uncured” (remaining in the programme for longer than six months),
“defaulting”, “dead” or discharged because of “other reasons”. The following section reports
the main results and the study conclusions. Unfortunately, the article presents the data for
the three MSF sub‐programmes altogether, rather than unpacking them per site.

104
In the three MSF interventions, 15.4 per cent (n=8,685) of the HIV‐positive adults were
enrolled in the nutrition programme. On day one of the treatment, their BMI was 15.8
kg/m2 (IQR 14.9‐16.4), and only 12 per cent of the cohort had previously received ART
drugs. At the end of the study, only 47.7 per cent (total n=1,106) of the patients were
considered “cured”, and their follow‐up time lasted approximately four months (IQR 2.2‐
6.1). Forty‐eight per cent of the patients were “non‐cured within six months”, of whom 11.9
and 22.6 per cent died or defaulted from care. More than four per cent were discharged
because of “other reasons”. Increased risk of nutrition programme failure was found to be
higher in men (OR = 1.5, 95 per cent CI 1.2‐2.0), in patients with BMI below 16 kg/m2 at
study enrolment (OR = 2.2, 95 per cent CI 1.7‐2.8), and in patients who did not start ART
when eligible (OR = 4.5, 95 per cent CI 2.7‐7.7), as well as for those who were ineligible for
ART at enrolment (OR = 1.6, 95 per cent CI 1.0‐2.5). The weight gain among the cured
patients was 1.6 g/kg/d.
The study concluded that the administration of ART together with RUTF increases the
chances of nutritional recovery of the study cohort, that the cure rates varied widely and
that early nutritional support with RUTF seemed to be more effective when provided in the
early stages of wasting. However, the percentage of not cured was high. For this reason, the
authors voice “the need to clearly define and evaluate the most effective ways of
administering” therapeutic nutrition care, based on RUTF, in wasted adults living with HIV.
No measurement of adherence was included in this study.
Therefore, in this chapter, aware of the different models for understanding adherence and
their limitations described in the literature, I investigate the adherence and explore the
potential key barriers existing in the Homa Bay nutrition programme, in order to shed some
light on its low nutritional rehabilitation rate.
3.3 Objectives of the study
Aim of the study: Development of a method to understand how current
formulations of RUF affect its usage
Specific objective: To investigate adherence with RUTF in a HIV/TB therapeutic

105
nutrition programme in Kenya
Research questions: (i) what is the adherence to a protocol using a specific RUTF
(Plumpy’nut) among malnourished adults living with HIV?
(ii) what are the key barriers to patient adherence?
The present study is among the first to qualitatively investigate adherence with nutritional
protocols based on RUTF that aims at rehabilitating malnourished HIV adults. The following
sections report the results according to COREQ guidelines 242.
3.4 Methods
3.4.1 Study setting
The setting of the study was described in sections 3.2.4, 3.2.5 and 3.2.6.
3.4.2 Study design
In this study, I applied three qualitative methods based on focus groups, interviews and
direct observations. I considered their results valid, when found to be consistent, one to
another. Focus group discussions involved patients and caretakers, and one separate session
with members of MoH/MSF medical staff. Semi‐structured interviews were administered
one‐to‐one to patients. Direct, unobtrusive, observations of the Plumpy’nut distribution
and consumption occurred in the HIV/TB wards. The questionnaires and the focus group
discussions used a variety of techniques including free listing, ranking exercises and open‐
ended questions (see footnotes in Table 12).
3.4.2.1 Questionnaires and focus group guides
Two guides were developed and piloted for use in the focus groups: one for patients and
caretakers, and one for the health staff members. The guides and questionnaires covered
four topics:
(1) information provided to patients about the recommended use and consumption of
Plumpy’nut;
(2) knowledge and attitude of patients about the role of Plumpy’nut in their therapy;

106
(3) dietary practices and Plumpy’nut consumption;
(4) patient’ and caretaker’s experience of the Plumpy’nut distribution system.
A checklist for the direct observations was developed, and covered the ways of consuming
Plumpy’nut, their advantages and disadvantages, together with the role of the caretaker.
All the focus groups were recorded on tape, transcribed and additional notes allowed the
checking of information that was not clear from the recordings. The focus groups and
interviews did not last more than one and a half hours, and one hour, respectively. The
direct observation sessions lasted between thirty minutes and one hour. A small number of
photographs were taken with the informed consent of the patients.
3.4.2.2 The research team and the relation with the subjects
The focus groups discussions and interviews were conducted in the Luo language. Two
native speakers, a female and a male, were recruited as interpreters and provided with two
days training on the study and methods to be used. Time for familiarization with the study
guides was provided.
As principal researcher, I am a Caucasian male who was trained in public health nutrition at
MSc level, and I was not a MSF employee. I attended all focus groups sessions and
benefited from simultaneous translation by an interpreter. I personally facilitated, in
English, the focus group discussion with the health staff, and subsequently transcribed the
recorded tape myself. Other discussions were facilitated by the study interpreters.
Discussion transcripts were not returned to the study members for comments or
corrections. All participants were provided with information about the study and assured
that clinical services or RUTF provision would not be affected by refusal to participate.
3.4.2.3 Identification of the common themes
I manually coded the focus group discussion transcripts, highlighting key words, key
concepts and any minor or contradictory themes, using both hard‐ and soft‐copies, marking
methods and mind‐mapping approaches. I regularly reviewed the records of the direct
observations, and I summarised the found pieces of evidence. I entered the quantitative
data from the interviews and the clinical and socio‐economic profile of the focus group

107
participants in EpiInfo version 3.4.3 and analyzed the same in Stata version 8.
I subsequently prepared detailed tables for each identified theme and its associated sub‐
themes. The theme tables contained separate columns referring to the evidence obtained
on each theme using one of the three research methods (see Table 12). This allowed
triangulation of evidence, comparison and discussion of the common themes that emerged.
Following this process the themes and sub‐themes from the separate tables were compiled
and overall conclusions drawn. Conclusions and associated recommendations were
discussed with the health and management staff of the programme during a feedback
process.
3.4.2.4 Subjects recruitment and sampling
The study subjects, enrolled at the MoH/MSF HIV/TB programme in Homa Bay health
district, Nyanza Province, Kenya, came from three groups: patients enrolled in the program
(some already nutritionally rehabilitated); their caretakers; and medical staff (counsellors,
nurses and clinical officers). Patients younger than 15 years of age were not admitted into
the study group. The patients were recruited either at the MoH/MSF HIV clinic A and B at
the Homa Bay Hospital, or from TB wards 7 and 8 of the same hospital.
The study followed a non‐probabilistic, purposive, heterogeneity, non proportional quota
sampling system. Data saturation was achieved after approximately two thirds of the study;
however, recruitment continued along the whole planned period (3 weeks). During the
study time, the patients, coming for their usual routine visit, were invited to participate by
the nurse in charge of the nutrition programme. All the health staff working at the clinic
during the study agreed to participate.
All the focus group discussions and interviews occurred in a quiet area within the HIV clinic
compound in the presence of the researcher and his assistants only, whereas the direct
observations were performed in the TB multi‐drug resistance ward at the Homa Bay general
hospital.

108
3.5 Results
3.5.1 Study group characteristics
Table 10 provides descriptive data on the 46 patient participants. Thirty‐four were still
under treatment with Plumpy’nut®. More than half of them were females and the average
age was thirty‐three years. All patients were married and the majority had their spouse still
alive while 12 out of the 46 patients were widowers. All subjects who were approached
agreed to participate in the study and provided informed written consent. Data about the
duration of nutritional rehabilitation was not availed by MSF.
Table 10‐ Profile of patient participants.
Characteristic (n=46)
Participants (n and
percentage, if appropriate)
Male 18 (39%) Female 28 (61%)
Age (years) 33.3 Married (missing records = 1) 45 (100%)
Spouse alive 33 (73%)Widowers 12 (27%)
Mean number of children* (missing records = 1) 3.0 Serological status (missing records = 6)
HIV positive 24 (60%) HIV positive and TB sputum‐positive 16 (40%)
Nutritional rehabilitation (missing records = 1)
Enrolled in the nutrition programme at the time of the study not malnourished † anymore 15 (33%) currently malnourished 19‡ (42%)
Discharged by the time of the study 11 (25%)
* NB: age not specified. † BMI >17 and/or MUAC >160. ‡ This group included 13 outpatients and 6 inpatients. The inpatients were from the TB multi‐drug resistance ward.
Table 11 summarises the methods used and the number of patients, carers and health staff

109
participants.
Twenty‐two current and ex‐patients received one‐to‐one interviews and 18 participated in
focus group discussions. Six inpatients were directly observed. Two carers were recruited to
participate in focus group discussions. Eight MoH/MSF employees participated in the focus
groups with the medical staff (counsellors, nurses and medical doctors). None of the
subjects were involved in more than one data collection method.
Among the outpatients (n=13) who were still malnourished, 6 travelled to the clinic without
a carer on the day of the study (2 missing data). Only one walked while the rest took public
transport and the average time to reach the clinic was almost two hours. The 6 in‐patients
recruited for the direct observations were found in the TB wards of the Homa Bay Hospital
and they were all HIV positive; two of them were multi drug resistant and their appetite
might have been affected by their TB status and/or HIV status plus specific drug side‐
effects.
Table 11 ‐ Summary of methods and participants.
Method Participants*(n=56)
Individual interviews with current and ex‐patients 225 focus group discussions from 3 to 5 participants, including:
Current and ex‐patients 18 Carers 2
Direct observations on individual in‐patients and their carers role 61 focus group discussion with health staff 8 * None of the study subjects participated in more than one method.

110
Table 12‐ Summary of key themes and sub‐themes.
Theme
Individual interviews
Focus group discussions†
Direct observations
Adherence with Plumpy’nut®
Only approximately half of the patients complied with the prescribed amount
X‡ ‐ X
Positive aspects reported about Plumpy’nut® ‐ Participants think that:
It is similar to a drug rather than a food, in terms of both usage and role in the recovery X‡§ X ‐
It “brings strength” X‡§ X ‐
It “allows to go back to work” X‡§ X ‐
Increases weight gain XठX
Decreases the feeling of hunger X‡§ X ‐
Has a smell and packaging which are well accepted XठX X
Offers the possibility to mix it with other food and therefore reduce: X‡§ X X o diet boredom X‡ X§¶ ‐o nausea
X‡ X§¶ X
Negative aspects reported about Plumpy’nut® ‐ Participants think that:
It can cause nausea and vomiting XठX X
First 3 to 4 days of consumption are crucial for adherence, then later it becomes easier ‐ X X
The taste is: o too sweet X‡§ X§¶ ‐ o too oily X‡§ X§¶ ‐ o too salty X‡§ X§¶ ‐
Consistency should be more liquid or like a biscuit or a powder (milk powder) X‡§ X ‐
It comprises a monotonous diet, leading to boredom
X‡§ X ‐
Sharing Plumpy’nut® with both other adults and/or children is a common practice X‡ X ‐Reasons for sharing:

Theme
Individual interviews
Focus group discussions†
Direct observations
food insecurity in the household ‐ X§ ‐
children like it X‡§ X§ ‐
the partner or relative is ill and/or HIV positive but not malnourished (energy booster)
‐ X§ ‐
Mixing Plumpy’nut with foods is a common practice X X X Reasons for mixing:
to reduce monotony of the diet X‡§ X§ X
to reduce nausea, vomit, salty taste X‡§ X§ X
because the Plumpy’nut has separated into oil and solid phases X‡§ ‐ ‐
because Plumpy’nut with water reminds participants of a traditional food ‐ X§ ‐
because it was suggested by the health staff ‐ X§ ‐
Knowledge and attitudes of medical staff
Medical staff expressed doubts about the positive role played by Plumpy’nut in nutritional rehabilitation; ART was perceived as much more important
‐ X ‐
Patient counselling
Counselling messages focus on: o human nutrition (e.g. “proteins are available in meat, eggs and cheese”) o improvement of general conditions when consuming Plumpy’nut® (weight gain,
appetite, strength)
X‡§ X§¶ ‐
Most patients did not know the relationship that exists between HIV infection, their thinness and their ART therapy.
X‡§ X§ ‐
Staff declared that they did not know what counselling to provide to patients with severe clinical conditions (e.g. oral thrush)
X‡§ X§ X
Most patients do not receive routine information about why, when and how to consume
Plumpy’nut; when this happens, it comes from individual initiative of the health staff
X‡§ X§ X
Distribution system for Plumpy’nut
Half of the patients still under nutritional rehabilitation come to the HIV clinic without a X‡ X ‐

Theme
Individual interviews
Focus group discussions†
Direct observations
caretaker
The patients cannot carry more than a 2 weeks supply of Plumpy’nut® (approximately 6 kg) instead of the whole month’s supply
X‡ X X
The appointment schedule for ART or clinical checks is monthly in most cases, therefore patients or caretakers do not come back to collect the missing 2 weeks supply of
Plumpy’nut
X‡ X ‐
Very weak patients are in absolute need of the caretaker even to open the sachets, to mix it with other food (when needed) and consume it
‐ ‐ X
Bulky supply (6 to 12 kg) and branded container (box) are very noticeable and associated with stigma within the community
X‡ X X
* None of the study subjects participated in more than one method. † The focus groups involved either pa ents together with caretakers (5 groups, with 3 to 5 par cipants), or health staff members (1 group with 8 participants). ‡ Tool used: closed and/or open questions. § Tool used: free listing. ¶ Tool used: ranking exercise to select the main themes reported here. ** ART drugs change certain flavour perception.

113
3.5.2 Understanding adherence
The following sections summarize the key themes emerging from the analysis of the results.
Overall, only 14 out of 22 interviewed patients reported adhering with the prescribed
amount of Plumpy’nut®.
3.5.2.1 Perceptions about Plumpy’nut
Table 12 lists the aspects which may both enhance or decrease the adherence with
Plumpy’nut, and were mentioned during the majority of focus groups and interviews. It
was frequently reported that Plumpy’nut can be “associated with a drug” (same role and
effect of a drug), “brings (physical) strength” and “allows to go back to work”. Increases in
weight gain were reported, and feelings of hunger said to decrease. The positive feelings
about use of the product can be summarised by the quote: “ART is a drug to fight the
infections, but does not give strength like Plumpy’nut® to go back to work”.
Turning to the negative perceptions of participants, some patients complained that the
taste of Plumpy’nut was responsible for nausea and the vomiting. Participants also argued
that the “first three or four days are the most critical ones” and that “after then, it becomes
easier” to adhere to the prescription. Among the patients interviewed, only one out of 40
mentioned oral thrushes as the main cause for low acceptability. In contrast, the health
staff focus group voiced that the initial clinical conditions including swallowing capacity are
crucial for the patients’ adherence. The interviewees provided suggestions about how to
improve the product (see Table 12).
The medical staff expressed doubts about the role of Plumpy’nut, in promoting weight
gain, since “ART is far more important in severely malnourished patients”.
3.5.2.2 Sharing practices
Adherence was found to be closely linked with food sharing practices. More than half (14
out of 22) of the interviewed patients reported sharing the Plumpy’nut with children and
other adults, and this was confirmed by most focus groups. The medical staff was
particularly concerned about the sharing practice at the community level, based on their
observation that, “…in the hospital wards, it is common”.

114
In two of the focus groups, patients reported incidents of Plumpy’nut trading or selling.
This, however, seems to be limited to school children, because, among adults the product
was associated with HIV treatment, and thus potentially stigmatising.
The majority of the patients, who declared that they tried to prevent sharing (“hiding the
product in the closet from children”; “…or from adults”), did so because Plumpy’nut was
considered part of the “medical drug prescription”. Only one interviewee reported that
Plumpy’nut could be actually harmful for an HIV negative person.
One member of the medical staff suggested that Plumpy’nut is so important for the
household food security that sharing represents a strategy to delay the moment of
programme discharge.
3.5.2.3 Mixing Plumpy’nut with other foods
Only one patient reported exclusively consuming Plumpy’nut, while mixing Plumpy’nut
with other food was a common practice mainly with local staple starchy food (ugali), fresh
vegetables, fish, rice, cereals, legumes, meat, cooked vegetables (sukuma wiki), and
chapatti (in order of reported frequencies).
Monotony of diet, nausea, vomiting or salty taste was the main reasons for mixing. Stirring
Plumpy’nut into hot water produces something that is similar to a popular, peanut‐based,
traditional food (ogila).
Some others mentioned that “once you start mixing the Plumpy’nut, it is hard to go back
and eat it alone”. Members of the medical staff suggested (contrary to programme
recommendations) that patients with severe clinical conditions (e.g. oral thrush) should mix
the Plumpy’nut with tea.
3.5.3 Key barriers to adherence
3.5.3.1 Inability to transport ration
Physical weakness, absence of a carer during the collection of supplies, cost of transport,
and stigma were key barriers to adherence.
The prescribed supply of Plumpy’nut per outpatient was monthly and weighed

115
approximately 12 kilograms. A malnourished outpatient without a carer did not have
strength enough to carry such weight. Therefore, the outpatients were invited to take half
the monthly ration and come back to collect the second half of the supply in two weeks
time. Health staff members reported that most patients could not afford to travel twice a
month to the clinic.
It can be speculated that these patients spread out the two weeks provision along the
entire month. This is consistent with the reports of many patients. No data could be found
on how many patients came back to collect the missing mid‐month supply or the
relationship with defaulting and survival.
3.5.3.2 Stigma associated with therapeutic foods
In a region where HIV‐related secondary malnutrition is common and treated with
Plumpy’nut®, this product has become strongly associated to HIV.
For this reason many patients were reluctant to walk home with boxes reading the brand
name (Plumpy’nut®). One patient said “I can disguise the ART tablets saying that they cure
something else, but I cannot disguise Plumpy’nut® because a month’s supply is too bulky
and visible”.
3.5.3.3 Clinical status and role of the carer
Among the in‐patients who were directly observed, all the ones with a severe clinical
condition could not adhere to the prescribed amount. Two of these died during the course
of the study. Alternative therapeutic diets, such as therapeutic liquid milks (formulas F75
and F100), whose intake may have been easier for severely ill patients, were not available.
It was reported and observed that in‐patients in the ward with the most severe clinical
conditions can consume Plumpy’nut only if mixed with other suitable food (water or
porridge for example). This requires assistance from the carer. Patients with severe clinical
conditions were so weak that they did not have sufficient strength even to open the sachet
and to mix the product with the foods.
The Focus Group Discussion with the health staff voiced that often malnourished patients
showed swallowing difficulties due to extended oral thrush. The MoH/MSF protocol for
therapeutic nutrition did not require the medical staff to report the presence or the degree
of swallowing difficulty. Therefore, quantitative data were not available, and written

116
prescription reports of oral thrush treatement could not be availed for the research.
However, direct observation confirmed that most malnourished patients enrolled to the
ward showed evident pain in swallowing any type of food, including RUTF in partially
diluted form.

117
3.6 Discussion
This study indicated that adherence with therapeutic feeding within this HIV programme is
likely to be low. We have identified a number of issues that may reduce the consumption of
RUTF to below the prescribed level.
Although the nature of the study setting might have affected the patients’ response, some
of the findings are likely to be generalisable to other HIV and adult nutrition programmes
that use this specific therapeutic food and a similar nutritional protocol.
This study identified two groups of factors, which limit specifically RUTF‐based protocol
adherence:
a. factors directly related to the product design, and
b. factors related to programme design.
3.6.1 Factors related to product design
Factors intrinsic to the product design are many, and their nature is varied. Their
interpretation must take into account the origin of this RUTF. Although widely used for
other patient groups, it is important to note that Plumpy’nut was designed for treating
severe acute malnutrition in children.
There is evidence 243 to suggest that reported symptoms such as nausea and vomiting when
eating the RUTF could be related to the drug treatment too. The taste of Plumpy’nut was
not considered suitable by many adult patients and, therefore, they often reduced intake or
mixed it with other foods. Plumpy’nut is fortified with KCl, which has a salty bitter taste
(private communication: Briend, February 2014). The practice of mixing may compromise
the efficacy of RUTF by reducing overall energy and nutrient intake, and delaying nutrition
rehabilitation.
Despite the problems of taste and consistency acceptability, the results of this research

118
suggested that most patients valued the nutritional therapy provided by Plumpy’nut.
Their attitude towards the product was more positive than most medical employees,
perhaps because of lack of staff training on the anticipated benefits. However, the
interviewed patients would reduce the sweetness (somebody suggested the addition of
lemon juice), and would like to change the consistence into something “more liquid”, or
“into the form of a biscuit” or powder. Rarer comments mentioned included suggestions
for improving the packaging, such as “the sachet packaging should be replaced with ice‐
cream cup with lid”.
3.6.2 Factors related to programme design
Certain problems in accessing and consuming the therapeutic food were accentuated by
the design of the overall programme and inappropriate staff training.
Patients were not informed about how to correctly consume the RUTF. For example,
counselling messages inappropriately advised adding the RUTF to tea, and feeding
strategies that were not feasible for the patient. Suggesting to eat RUTF at meal times
(three times per day), and/or together with ART drugs was not conducive to ensuring
adequate intake. Some of the patients admitted that they disregard such advices because of
the “strong” – difficult to eat ‐ nature of the product, their bad clinical conditions combined
with ART side effects (lack of appetite, nausea, vomiting, etc.).
More appropriate advice would have been based on therapeutic feeding guidelines 97 and
have recommended small bites of RUTF throughout the day until the twenty‐four hours
prescription of sachets had been consumed. Box 1 presents the most common questions
expressed by patients during this study. In the followup of this study, the same questions
were used to lead to improved key counselling messages.
Frail patients who came to a clinic appointment without a carer sometimes ended up losing
half of the prescribed RUTF supply as they were unable to transport the food to their home.
The situation could be improved by redesign of the distribution system, perhaps involving
community based organisations to support home‐based care. Their importance is
recognized in many HIV and nutrition interventions and protocols 244–248. The health
programme also needed to acknowledge and address the stigma‐factor attached to
Plumpy’nut. This could involve the use of anonymous packaging.

119
Box 4
During dietetic counselling sessions, the topics to be covered should respond to the following questions expressed by patients during the
study: What is Plumpy’nut (food/drug; composition)? Who is supposed to use it? What are its components? How often should I eat it along the day? What should I do when I do not manage to eat it because of nausea, vomiting or lack of appetite? Could I mix it with other foods? What should I avoid to drink or eat together with
Plumpy’nut? What are the consequences if I share my ration of
Plumpy’nut with other persons? Is it good for somebody who is not
HIV positive to eat Plumpy’nut? Is it good for somebody who is not
thin to eat Plumpy’nut? When
should I stop eating Plumpy’nut? Will I become thin again when I stop eating it?
In case of extremely frail patients, the carer played a
fundamental role in trying to overcome key barriers for
adherence like just opening the sachets or mixing it
with other foods.
Both groups of adherence determinants identified in
this study suffered from some limitations, described in
the following section.
3.6.3 Limitations of this study
This research did not correlate the collected data with
clinical information such as patients’ survival, CD4
count, weight gain or BMI changes which might have
helped in understanding the impact of such programme
in presence of household/community sharing, food
mixing, lack of counselling, and clinical difficulties in
swallowing among others. The access to the clinical
information was not granted by MSF and the MoH,
because of confidentiality‐related reasons.
Reduced swallowing capacity was reported by study participants and directly observed.
However, the research protocol had not foreseen to assess this aspect, and therefore only
limited information could be collected.
The data analysis was done manually. The same analysis could have been peformed with
the aid of a specialized software. However, at the time of the development of the research
protocol (2007), such tool did not seem to be priority. That was in view of the only
systematic review study available at that time, aiming at a mimimum criterion list for
reporting qualitative research 242, and which found that only two out of twenty‐two papers
had reported the use of this kind of software.
Other limitations are related to the HIV therapy and the study setting. This research did not
aim to understand the link between nutritional therapy and ART adherence. Moreover,
RUTF are meant to be used in out‐patient programmes, but this study was restrained by
lack of observations at community level. In both cases, these information may have
enriched the interpretation of the collected results.

120
The two study interpreters were not only employed as health promoters in the MoH HIV
programme, but also HIV/TB patients in the same intervention. One of them had been
previously successfully rehabilitated in the nutritional programme. Therefore, they might
have previously met some of the patients enrolled in the study, and/or developed specific
perceptions about the topic, introducing possible biases.
3.7 Conclusions
Overall, the research suggests that training and information material is needed to ensure
that medical staff can support the patient to overcome the first most crucial phase of the
treatment. The very first contact with the patient should include a test to assess swallowing
capacity.
Reduced capacity to swallow is common and it may imply a lower adherence with
nutritional therapy and an increase in mortality risk. Consistent with the community‐based
management of malnutrition approach 55,97 medical staff should ask the patient to eat some
RUTF in their presence to verify her/his swallowing capacity. According to the results of this
test, dietetic solutions must be discussed, agreed together with the patient, and the carer
when present. Patients who are not able to swallow at all should be hospitalized and
treated according to the in‐patient nutritional therapeutic protocol developed by WHO 70
which utilises milk based liquid therapeutic nutritional products, such as F75 and F100.
The study showed that the Plumpy’nut, designed for malnourished children, needs
improvement to meet the palatability preferences expressed by adult patients. Reduction of
perception of sweetness and fat components was requested by the patients. However,
HIV/TB therapeutic nutrition programmes should not introduce newly designed RUTFs until
positive clinical results have been demonstrated.
Further studies more closely correlating adherence and recovery rates are likely to improve
the medical staff perception about the effectiveness of this kind of programmes, possibly
improving their performance as well.

121
4 Designing the RUF formulation (sub‐study 2)

122
In this chapter I describe a method to design an improved RUF formulation, minimizing its
cost while fulfilling food‐related standards and the international macronutrient
requirements for this kind of products.
The method is based on a mathematical algorithm called Linear Programming. Its general
features are described and contextualized, in the sections called “Evolution of the use of
Linear Programming”, and “Linear programming applied to nutrition”. Following the latter,
other sections focus, in order, on the description of the method in mathematical terms, on
the specific objectives of this sub‐study, on the phases which composed the applied
method, on the obtained results of this sub‐study, on their discussion, and on the drawn
conclusions.
4.1 Evolution of the use of Linear Programming
Linear Programming (LP), an algorithm useful for planning and decision making, has
contributed to shaping the modern world.
The founders of this tool are generally regarded as George Dantzig, who devised the
method in 1947, and John Von Neumann, who established its theory, that same year 249.
Dantzig called the theory behind LP “the maximisation of a linear function subject to linear
inequality constraints”249, and his motivation initially consisted of the need to solve complex
planning problems in wartime operations, reducing the costs of the army, and increasing its
efficiency on the battlefield. However, soon after, advanced developments of this method
also supported decision‐making in large‐scale enterprises, at worldwide scale. Its
applications are many, and described here as follows.
Nowadays, many industries use LP as a standard tool to allocate a finite set of resources in
an optimal way. In most cases, cost minimization is the final goal of LP applications.
Examples include airline crew scheduling, shipping or telecommunication networks, oil
refining and blending, and stock and bond portfolio selections 250. Linear Programming has
become popular also in academic circles, for operations research and management
scientists, numerical analysts, mathematicians, and economists, who have written a large
number of papers on this method, its applications and its further developments.

123
It is, however, only today that LP is applied in small‐scale companies, where its use allows
minimizing costs, and maximising profits, within the available resources. This delay is due to
the relatively recent advent of powerful personal computers 251,252. As the inventor
admitted, LP calculations are time consuming, and they were impossible without readily
accessible computer technology 251.
The LP method was applied in nutrition, often to minimize costs, but not only. The following
section describes in which ways researchers, practitioners, policy and decision‐makers have
employed LP in the areas of animal, first, and human nutrition, later.
4.2 Linear programming applied to nutrition
In 1945, the nobel prize‐winner George Stigler posed the problem of cost minimization of a
balanced diet 253, and soon after the animal nutrition industry started using the advantages
offered by LP 251. In livestock feeding this method offers a large number of advantages and
applications. For instance, LP cuts costs in production of animal feeds 254, improving their
formulations 255, and helping in the determination of their nutrient requirements 256. Linear
programming also helped in determining to what extent cow food intake is constrained by
the maximum feeding time available each day, by the daily rumen processing capacity, by
the sodium requirements, by the energy metabolism 257, and helped predict optimized
animal diet choices 258.
In 1959, the first LP application to human nutrition was described by Smith et al. 259. Since
then, a wide variety of applications followed, ranging from optimized management of food
supplies on national and global scales, to menu planning for specific groups of people 260. In
1983, the first paper described how to use LP to develop a diet in poor countries from the
southern regions of the world 260.
Two questions are often asked, when researchers apply LP to nutrition‐related fields. These
are:
I. Is it possible to design or to improve nutrition recommendations, interventions, or
diets using a pre‐set range of limitations (e.g. food availability, price, access, etc.)?

124
II. If this is possible, what is the lowest‐cost solution or formulation?
The following sections describe examples of LP applications used to answer the two
questions above.
WHO urges countries to promote improved feeding practices to ensure optimal health in
adults, and ideal growth and development in children 261. Linear programming contributed
in refining the same WHO nutrition recommendations. For instance, in a Malawian
population, LP evaluated and improved diets recommended for young children during the
complementary feeding period, while applying the WHO guidelines, and looking at
consumption patterns of local foods 252. The conclusions of this study contributed to tailor
more adequate nutrition interventions, during the hunger season in Malawi.
In another LP study 262, the same authors predicted the food choices that an individual from
French low socio‐economic groups would make to reduce his or her food budget, while
retaining a diet as close as possible to the one in the average population. The study
assumed that economic constraints may contribute to unhealthy food choices. Evidence
was found that economic measures are needed to improve the nutritional quality of diets
consumed by underprivileged groups of French society.
The therapeutic formula milk F100 is used as the standard therapy for SAM, according to
WHO 70. However, it was not clear if optimized combinations of local foods from poor
countries could achieve the same nutrient density levels of F100. With this objective,
Ferguson et al. 263 explored the feasibility of formulating diets based on foods from Ghana,
Bangladesh, and Latin America. None of the food combinations based on LP‐models
achieved the F100 densities of vitamin E, Riboflavin, Thiamine, Niacin, Zinc, Calcium and
Copper. Therefore, the study concluded that the clinical efficacy of food‐based therapeutic
diets used to treat SAM should be thoroughly tested before use.
Linear programming can contribute to develop food‐based dietary guidelines, which are
required to combat micronutrient deficiencies. With this purpose in mind, Ferguson et al.
264 developed a rigorous four phase approach to designing this type of guideline, and
illustrated the approach for Malawian children.

125
In other two studies, LP helped in optimizing the diet of two populations. In Thailand,
Anderson and Earle 260 used LP to achieve an ideal diet formulation to be at the least cost,
to meet specific nutritional requirements, to avoid over‐supply of certain nutrients. The LP
model included the composition of 150 common Thai foods. In Malawi, Briend et al. 265
used LP to determine a lowest‐cost, nutritionally adequate diet for children using locally
available food.
A method called Nutrient Profiling ranks foods based on their nutrient contents, and
identifies commodities with a quality which is considered nutritionally good for their price.
In a LP study, this approach was validated by Maillot et al. 266 in a large French survey. In
the first part of the study, the authors correlated intake data of foods with their nutrient
composition and with their prices. In a second part, the LP models designed theoretical
diets that fulfilled nutritional recommendations at a minimal cost. The models from the LP
were in agreement with the nutrient profiling rankings, suggesting that the latter can help
identify foods of good nutritional quality accounting for their price.
Food prices can be analysed by LP to assess the economic values of fortified food
supplements. Food prices and nutrient contents are linearly related to food weight.
Therefore, LP can estimate the effect of introducing a food supplement on the minimal cost,
required to provide a nutritional adequate diet to a population group267. Aiming for
nutrition adequacy, the same method also provides an estimate of the expenses saved by
the same group when consuming the fortified item, and compare them to the sums spent
by the donor, after the distribution of the food supplement 267.
Linear programming is a reliable tool to design feeding recommendations. In Indonesia, one
study 268 aimed to assess the application of population‐specific, food‐based feeding
recommendations, developed with LP, to combat micronutrient deficiencies. The LP model
was compared with another way to define requirements, which used data from both a
cross‐sectional dietary survey among infants living in a poor town district, and a food survey
in three local markets. Results from both approaches agreed that theoretical micronutrient
requirements could not be achieved using local food sources, and suggested that LP may be
a reliable, and less resource‐intensive method for this type of study.
Despite its potential, most of the acquired knowledge in LP applied to nutrition often

126
remains limited to the research realm. Briend et al. suggests that “its application into
human nutrition practice is long overdue” 251. That is true if considering the solutions for
complex calculations, offered by relatively affordable computers of the current times. This
aspect will be further described in the following section called “Software to apply linear
programming”.
Briend et al. 265 attributes one of the main reasons of this delay to the “complexity of
mathematically modelling the underlying structure of food selection practices” and choices
in human beings. It could be argued, that the same may be simpler in the feeding industry
for animals.
In the next section, I introduce how the LP method and its components can contribute to
minimize the cost of a diet, of a food, and more specifically of a RUF formulation.
4.3 The linear programming method
4.4 The main elements in linear programming
In mathematical terms, linear programming is “a tool to optimize (minimize or maximize) a
linear function of a set of decision variables while respecting multiple linear constraints” 269.
In LP, the linear function is called the objective function (OF).
When used for selecting the lowest cost diet/formulation, the objective function can be
expressed in the following form 252:
Y = k0 + k1W1 + k2W2 +…+ knWn (A)
where Y is the cost, k1, k2… kn are constants, equivalent, for instance, to the cost per unit
weight for food ingredients F1 to Fn, and W1, W2,…Wn are the decision variables (DV), i.e. the
weights of foods F1, F2…Fn in grams.
The usual aim will be to minimize the cost of the formulation (Y) by changing the weight of
the different ingredients while, at the same time, meeting a range of different constraints.
These mathematical constraints (equality, greater than, or less than) are imposed on one or

127
more of the DV (W1, W2,…Wn ) to ensure that the nutrient content of the product meets
design requirements and does not exceed upper thresholds.
Constraints in food formulation problems may be linear or non‐linear but LP can only be
applied when all the constraints are linear 252. A constraint is considered linear when it can
be expressed in the following way:
k1W1 + k2W2 + … + knWn > a0 or (B)
k1W1 + k2W2 + … + knWn < b0 or
k1W1 + k2W2 + … + knWn = c0
where a0, b0, and c0 are constants.
Models including non‐linear constraints may have several solutions (local optimums)
depending on the initial values, and cannot be solved using LP. In optimizing dietary models,
imposing the acceptable range of the ratio between the energy contribution from protein
and total energy is an example of a non‐linear constraint. If not too complex, non‐linear
constraints can be linearized, using mathematical transformations. The latter method will
be described in detail in the methods section (see “Linearization of non‐linear constraints”).
4.4.1 Types of constraints
In LP, the constraints are important because the applicability of the models depends on the
validity of the introduced constraints 262.
For instance, nutritient constraints aim to ensure that optimized diets or foods meet the
nutritional needs of most people in the population 252. This type of constraint defines the
acceptable ranges of energy, protein, lipid, carbohydrate or micronutrients.
Nutrient constraints are common in published studies. For instance, several constraints of
this kind were used by Briend et al. 269 to predict nutrients that are potentially low in child’s
diet, whereas Ferguson et al. 264 defined the constraints based on the recommended
nutrients intakes.

128
However, some authors 267 warn that if only nutritional constraints are used, “LP can lead to
unrealistic diets”, “which may not be eaten in practice”. To avoid this problem, constraints
addressing palatability, texture and portion size may need to be introduced into the model
267. This approach was applied for the first time in 1959 by Smith 259, and became common
in the following studies, which included among others, constraints for the consumption of
different food groups 252. The choice of food group and portion size ranges should be based
on previous food consumption surveys 265.
In summary, based on the available literature, nutrient‐, palatability‐, texture‐ and portion
size‐related constraints were identified as being useful in the design of realistic diets.
4.4.2 Constraints and unfeasible models
A LP solution is feasible when all its constraints are achievable in combination. When the
highest possible concentration of a nutrient is less than a minimum constraint, or when the
lowest concentration of a nutrient is higher than a maximum constraint, or an equality
constraint cannot be respected, the model is considered unfeasible 263,264.
Models which are non‐optimal may be reformulated, based on informed decisions from
Sensitivity Analysis, which, using LP jargon, measures the strength of the different
constraints. More precisely, the Sensitivity Analysis quantifies how much ingredient costs
and formulation constraints can vary without requiring a change in the values of the LP
decision variables and constraints. The Sensitivity Analysis function is available as part of
some of the LP software described in the following section.
4.4.3 Software to apply linear programming
“Even for an expert, it is impossible to use intuition and guessing alone to arrive at solutions
to problems which require solving hundreds of equations simultaneously” 251. For this
reason, nowadays, computer software identifying optimized LP models are available. Some
authors 265,267 reported the following software to be of common use:
(a) Nutrisurvey (available on http://www.nutrisurvey.net/) is ideal for field‐work
purposes, user‐friendly, but not flexible in terms of functions;
(b) Microdiet (available from Salford University since 1990) was designed to prescribe
personalized diets in clinical settings or institutional practice;

129
(c) Microsoft Excel software (version 2007) comes with the Solver add‐in that includes
LP‐based functions, (including Sensitivity Analysis), that some authors251,265 describe
as “user‐friendly”.
4.4.4 Food composition databases
The validity of the LP‐optimized formulations relies also on the accuracy of the nutrient data
from the food composition dataset (FCD) in use, whose main elements consist of (i) a list of
foods, and (ii) their nutrient contents.
When comparing two or more FCD, the way both foods and their nutrients are defined can
be confusing. For this reason, the preparation of reliable data on food requires a precise
nomenclature, a detailed description of the commodities, and accurate validated protocols
to estimate their nutrient contents 270.
The process of finding international consensus on these aspects has taken time. In
February 1947, the Committee on Calorie Conversion Factors and Food Composition Tables
was convened by FAO, and only in 1989 did the FAO service INFOODS published the first set
of food identifiers, also called “tag‐names”. Since then, tag‐names in FCD have constantly
been updated 271 and organized in at least four systems:
The food classification systems are specific for nations (or regions), whose
identifiers are based on national criteria and whose food groups may be highly
specific 272;
The Codex Alimentarius Food Standards are prepared by the FAO and WHO Codex
Alimentarius Commission, in order to protect the health of the consumer and to
facilitate international trade in foods 272;
The CIAA Food Categorization System is approved by the European Commission,
and developed by the Confederation of the Food and Drink Industries of the
European Union 272;
The Harmonized Commodity Description and Coding System is prepared by the
WTO, and used to generate global trade statistics.

130
Some studies263,265 applying the LP‐based method found that some of the tag‐names from
the available FCD were only partially matching the selected foods. In this case, the authors
replaced the corresponding nutrient values with others from alternative FCD.
In most FCD, the nutrient contents are organized in tables. When available, technical notes
come together with the tables, and describe the methods used to compile the datasets,
their calculation processes, the units applied271. The notes are important in comparing food
nutrients, coming from different databases. The variety of the methods and the calculation
processes in use is large, and this makes the collation of composition data from national
and regional datasets into global collections challenging. It is not surprising that most of the
international FCD tables are expensive to compile, and, for this reason, the same
collections are often only commercially available, rather than for free distribution.
The web site of the FAO INFOODS Secretariat
(http://www.fao.org/infoods/tables_int_en.stm), however, reports at least fifteen
international non commercial FCD tables, but most of them are dealing with specific food
groups. These include foods important for biodiversity aspects (FCD released by INFOODS
Food Composition Database for Biodiversity), sea food (Chemical and Nutritional
Composition of Finfishes, Whales, Crustaceans, Molluscs and Their Products), staple crops
(ILSI Crop Composition Database), and tropical foods (Tables of Representative Values of
Foods Commonly Used in Tropical Countries) among others.
At least two studies 263,265 looking at LP‐optimized diets used a FCD called World Food
Dietary Assessment System (WFDAS) 273. This is the base for the FAO food composition
database called Minilist 273,274, and includes a list of 48 nutrients in 1,800 foods coming from
six countries (Egypt, Kenya, Mexico, Senegal, India, and Indonesia) in four continents.
Designed by the University of California, Berkeley, with funding from USAID, UNU and
INFOODS, the program is in the public domain free distribution, and “generally accepted as
being among the best”275.
In Ghana, a RCT, which compared the growth in groups of children receiving micronutrient
supplements, used the WFDAS collection 132. Similarly, a FAO study 276 used the WFDAS to
validate dietary diversity score as an indicator of nutrient adequacy for non‐breastfeeding
children .

131
The WFDAS offers an additional advantage. During human digestion, the phytate, which is
contained in vegetal foods, limits the absorptions of key micronutrients, and for this reason
it is necessary to quantify it. However, its content is often missing in most datasets, but not
in WFDAS, which was, therefore used by Stein et al. 275 for this reason. In their study, these
authors managed to analyze the health benefits of biofortification. It is not surprising that
Gibson et al. 270, therefore, recommend the WFDAS dataset for most uses, and mostly for
study related to low‐income countries, where micronutrients deficiencies are common.
4.5 Why is linear programming important?
In nutrition, the reasons LP is important are many and two are the most cited. First, the LP‐
method is able to consider numerous factors, called constraints, guaranteeing that multiple
desirable criteria, such as nutrient recommendations, are simultaneously met 264. Secondly,
LP can help to reduce diet operational costs260.
In trialling diet recommendations or specific food specifications, LP replaces at least two
more traditional methods, termed, by some authors251, “trial and error approach” and
“expert guessing”. The first approach, an iterative method used to design diets, requires
multiple backwards steps, and repeated diet designs to arrive at a solution that may or may
not be optimal. Therefore, it is very resource intensive 269. The other traditional method,
based on more generic experts’ advice, may instead suffer from a lower degree of rigour
than LP 269.
In the management of undernutrition, LP is important, because has the potential to
improve food‐based formulations. For instance, the most common RUTF product is based
on results from a limited number of studies, in a few settings, showing rapid weight gain 277.
Consequently, in other settings, with different underlying nutrient deficiencies and
infectious disease profiles, similar weight gains would perhaps occur, with nutrient levels
different from those in use 95,176,178,263. Therefore, LP can efficiently identify improved
combinations of RUTF ingredients that meet sets of improved specifications and these can
subsequently be clinically tested.
Linear programming can decrease the cost of RUF spreads. As reported in section 1.3.3,
improved lipid‐based therapeutic, supplementary, and complementary foods are in

132
demand. However, their cost hampers scaling‐up of nutrition programmes based on these
products 40. In RUF design, optimizing the combination of affordable, acceptable, locally
available food ingredients, to meet endorsed nutritional requirements, represents an
alternative option to be urgently developed.
Although LP offers evident advantages, no study was found testing a LP‐based method for
designing cheaper formulations of a RUF, which fulfils predefined macronutrient
requirements, uses region‐specific and culturally acceptable food, and that can be
processed with locally available technologies.
For this reason, I undertook the study described in the following sections.
4.6 Objectives of the study
Aim: Testing a method for optimal design of novel RUF
formulations
Specific objective: To design a cheaper RUF formulation that fulfils
international macronutrient requirements and food‐
related standards
Research question: How can linear programming based methods be used to
design the cheapest formulation of a RUF that fulfils pre‐
defined macronutrients requirements, uses regionally‐
specific foods, which are culturally acceptable, and can be
processed with locally available technologies?
4.7 Method
To explore the use of LP, I applied it in the process of formulating a RUTF prototype. After
being manufactured from locally available commodities, the aim was that this formulation
would be tested for use in adult therapeutic feeding programmes in East Africa.
In this study, the LP elements are the same described in the section “The linear
programming method” at page 126 of this chapter. The OF consisted of identifying the

133
lowest price, which was given by the sum of each food ingredient cost, multiplied by the DV,
while respecting the predefined constraints.
The overall formulation, which, overall, included design, manufacture, and testing of the
RUTF, consisted of four separate phases (see Figure 17). The preliminary stage A involved
defining the target group and the desired composition of the prototype product. Potential
food ingredients, nutrient composition and price data were identified and compiled in this
phase.
In step B, using Microsoft Excel (version 2007) and its Solver add‐in function, I first defined
and secondly applied the OF, the DV, and the constraints in order to set up and identify the
LP‐optimized model.
Phase C consisted of assessing the preliminary adequacy of the optimized model. First, a
small scale test batch of the RUTF prototype was manufactured. Secondly, this allowed me
to confirm that the desired texture was achieved, and to compare the LP‐model macro‐
nutrient estimates with the laboratory‐based results. In phase D, safety and acceptability
tests were conducted with the unfortified product, and are described more in depth in
subsequent chapters. Therefore, the following sections of this chapter focus mainly on
Phase A, B and C.

134
Figure 17 ‐ Proposed design and validation method for novel Ready‐to‐Use Foods.
IDENTIFYRUF target group
IDENTIFYCommodities and
prices
SELECTFood composition
data bases
DEFINELinear Programming (LP)
elements
(type of malnutrition, age group, geographical area, etc.)
SET UPComposition and prices
spread sheetfor 100 g foods
(objective function, decision variables, mathematical
linear constraints)
SET UP and RUNLP spread sheet
OPTIMIZEDFormulation
PRODUCESmall amount of product
RUNSensitivity Analysis
CHECKTexture parameters
CROSSCHECKMacro-nutrients
with laboratory analysis
UNDERTAKEAcceptability, safety and
clinical trials
TRIALLEDformulation
Phase B
Phase A
Phase C
No
Yes
OK?
Phase D
4.7.1 Phase A: food composition databases and food prices
In this phase, I selected the FCD and identified the commodities to use in the RUTF
formulation.
As introduced in previous sections, the validity of the LP optimized prototype formulation
depends on the accuracy of the FCD. The following criteria, therefore, helped in selecting

135
their most adequate sources of compositional data:
widest representation of commodity composition from around the world;
largest number of nutrient data values per food;
food descriptors matching the selected ingredients;
dataset internationally respected, ideally including methods cited in peer‐reviewed
journals.
For the identification of the commodities, I relied on the Kenyan cereal/pulse blends
processor Insta Products EPZ Ltd (Athi River, Nairobi), which, since the early 80s , has been
the largest food aid producer in the region, supplying humanitarian organizations such as
MSF, WFP, and the Kenyan MoH (Stuart Allison, private communication; 2008). Since,
nutrition interventions across the entire East Africa currently distribute food products from
Insta, at the time of this study, this manufacturer seemed a strategic choice for the
potential production, at scale, of future RUF spreads.
In close consultation with Insta, I identified one commodity for each of four preselected
food categories, namely (i) cereals (important for their carbohydrate contribution), (ii)
pulses (for their protein content), (iii) sugar (contributing to the final taste of the product)
and (iv) oil (high in energy density and crucial for the final texture of the product)
The choice of the variety of the cereal and the pulse had to satisfy general criteria that were
agreed with Insta: cultural acceptability, high content of essential amino acids, and low
price.
Based on the selected FCD, I compared the essential amino acid contents in the candidate
cereals and pulses. Then I confirmed their cultural acceptability by verifying their presence
on the traditional markets of the capital (Nairobi). Price data were provided by Insta, based
on the past few years of their procurement records.
Representativeness of the food prices is important to achieve a realistically cheaper
product. In view of this, Insta staff ensured that the food prices for the selected
commodities were representative of an overall period lasting three to five years, accounting
for the typical price seasonal fluctuations, and for the most common market types of

136
procurement (national or international).
4.7.2 Phase B: Setting up and running the linear programming model
In this study, the OF consisted of identifying the lowest price given by the sum of each food
ingredient cost (C1, C2,…Cn), multiplied by the DV (food weights: W1, W2,…Wn), while
respecting four groups of predefined constraints, derived from specifications for this class of
product:
o energy and nutrient concentration;
o palatability;
o texture;
o total food ingredient weight.
The constraints and the LP model are described in the following sections and summarized in
Table 13.
Energy and nutrient concentration constraints
Linear Programming constraints were introduced to ensure the RUTF formulation
met the UN 2007 standards 55 for energy density, and the ratio of protein, fat, and
essential fatty acids to energy (see values in Table 13).
Palatability‐related constraints
Palatability constraints are common in dietary LP 265 and aim to avoid the creation
of unacceptable tastes. In this thesis, the first sub‐study, which was looking at
compliance with the currently used paediatric RUTF. HIV/TB wasted Kenyan adults
voiced the need for a reduction of the sugar content, which is equivalent to a value
between 24 (personal communication: Briend, 2014) and 28 per cent according to
two studies 278,158.
Therefore, the per centage of sugar was constrained from 15 to 18 per cent (see
Table 13), based on preliminary taste testing, although such small reductions in
sugar may become challenging to be detected.

137
In small amounts, sorghum improves the taste of extruded pulse/cereal blends
(personal communication: Stuart Allison, Insta Products EPZ Ltd; March 30th, 2008).
We introduced a minimum constraint of 7 to 10 per cent for sorghum (see Table
13). The constraint range was based on preliminary work done with experimental
formulations.
Texture‐related constraints
Texture‐related constraints aim for a specific consistency in the final food mix. RUF
must have a paste‐like property in order to be squeezed into the mouth by the
wasted adult and children, or by their caregivers. Therefore, a fluid consistency was
not suitable. A texture similar to a biscuit can produce choking in children 279, and
therefore was also considered unacceptable.
A solid phase particle size below 200 microns 158 and a fat content ranging from 28
to 36 per cent generally led, during the preliminary tests, to a suitable paste
texture. The latter criterion was included as a constraint in the LP model (see Table
13).
Total food ingredient weight constraint
Once the RUF is shown to be acceptable and safe (see Figure 17), a premix of
vitamins and minerals is added to the formulation (Phase D). The weight of the food
ingredients, therefore, needs to be constrained so as to allow sufficient space for
inclusion of the vitamin and mineral fortificant in the finalized product.
A typical recipe for ready‐to‐use therapeutic food contains 1.6 per cent of premix158.
However, estimations indicated that up to three per cent of the final product weight
might be required for the premix. In agreement with the premix supplier, this per
centage allows the inclusion of essential complementary components such as
vitamin stabilizers and a micronutrient carrier, which consists of a refined starch
powder (DSM, private communication; 2008).
I, therefore, used an equality constraint to fix the weight of the RUTF food
ingredients at 97 g (see Table 13).

138
Table 13 Components of the LP model and prototype RUTF formulation
In 100 g of product Initial Target
Requirements Optimized Solution
Objective function (cost minimization (USD)): na.1 0.07
Decision variables: weights of the selected foods2:
Soybeans, g n.a. 31.9
Maize, g n.a. 15.3
Sorghum, g n.a. 7.0
Oil, g n.a. 27.3
Sugar, g n.a. 15.5
Constraints: Energy and nutrients
Energy, kcal/100 g 520.13‐550.0 518.9 Protein energy/total energy4, % 10.0 – 12.0 10.0
Fat energy/total energy4, % 45.0 – 60.0 60.0 (n‐3) Fatty acids energy/total energy4, % 0.3 – 2.5 0.9(n‐6) Fatty acids energy/total energy4, % 3.0 – 10.0 10.0
Palatability Sugar (sweetness), g/100 g 15.0‐18.05 15.5
Sorghum (taste improvement), g/100 g 7.0‐10.0 7.0
Texture‐related Fat content, g/100 g 28.0‐36.0 34.6
Maximum food ingredient weight Final total weight, g 97.0 97.0
Monitored variables (not included as constraints): Quality of protein expressed as PDCAAS6, % 75.0 – 89.07 85.7
TFD8, % n.a. 83.0
Limiting amino‐acid n.a. lysine
1 The cost of the currently available product (Plumpy’nut®) is approximately 0.5 USD/100 g when delivered in East Africa, at the time of this study. The reference includes costs such as manufacturing, transport from Europe, packaging, and import taxes. 2 Soy descriptor: soy flour full fat, raw (USDA SR20 280). Maize descriptor: maizemeal, wholegrain, white (FAO‐Minilist 273; item code CF00096). Sorghum descriptor: descriptor: sorghum, decorticated, flour (FAO‐Minilist 273; item code CF00154). Palm oil descriptor: Oil, vegetable, palm (USDA SR20 280). Sugar descriptor: sugar, white, cane or beetroot (FAO‐Minilist 273; item code SF00168) . 3 The UN minimum specification is 520.1 kcal/100 g 55. The constraint was relaxed to 518.9 kcal/100 g in order to achieve a feasible LP solution. 4 The constraint formulae were converted to a linear form as described in the methods. 5 The available literature 158 on paediatric RUTF reports a sugar content of 28 g/100 g. The constraint range was reduced to 15‐18 g to make it more suitable for wasted adults living with HIV/TB (based on section 3.5 at page 108). 6 PDCAAS: protein digestibility‐corrected amino acid score 281. 7 Calculation of PDCAAS based on 55,158,282 and using food composition data from 280,283. 8 TFD: true faecal digestibility coefficient calculated using the following foods (and descriptors): maize (corn, extruded cereal), soy (soy flour), sorghum (sorghum, cooked) 281,284.

139
Box 5 Protein Digestibility Amino Acid Score and True Protein Digestibility.
In human nutrition, for the measurement of the protein value of a food, FAO and WHO suggest the protein digestibility–corrected amino acid score (PDCAAS) method281. This is “based on comparison of the concentration of the first limiting essential amino acid (AA) in the (food) test protein with the concentration of that amino acid in a reference (scoring) pattern” or on the following formula:
PDCAAS(%) = _mg of the limiting AA in 1 g of test protein x (true faecal digestibility(%)) x 100_
mg of same AA in 1 g of reference protein
The score obtained is corrected for a true digestibility coefficient, which is specific for the food reference protein 284. Based on the formulation provided by Manary158, the PDCAAS value of the peanut‐ and milk powder‐based RUTF is 85.7 per cent.
4.7.2.1 Linearization of non‐linear constraints
In this study I transformed non‐linear nutrient ratio constraints, such as the proportion of energy coming from protein, the proportion of energy coming from fat, and the proportion of energy coming from (n‐3) and (n‐6) fatty acids into equivalent linear constraints. For example, the UN specifications55 for RUTF require that the proportion of total energy (E) coming from protein is higher than 0.10 and lower than 0.12. This was expressed in the following non‐linear form:
(P1W1 + P2W2 … + PnWn) / (E1W1 + E2W2 … + EnWn) > 0.10 and < 0.12 where P1, P2,…Pn and E1, E2,…En represent, respectively, the energy content from protein and the total energy content (Kcal), in W1, W2,…Wn (g), of each food ingredient F1, F2…Fn. Therefore, the protein:energy non‐linear constraint was expressed as a linearized function of the weight of different foods:
W1 (P1 – 0.10 E1) + W2 (P2 – 0.10 E2) ….Wn (Pn – 0.10 En) > 0
and
W1 (P1 – 0.12 E1) + W2 (P2 – 0.12 E2) ….Wn (Pn – 0.12 En) < 0
Although LP can be quickly performed by a personal computer 267, some authors 265 suggest
avoiding to linearize non‐linear constraints wherever possible, because of the complexity
entailed in the process. Therefore, I avoided including more complex non‐linear/linearized
constraints in the formulation, such as protein quality, expressed as Protein Digestibility‐

140
Figure 18 ‐ Microsoft Excel Sheet to optimize RUF formulation using Linear Programming.
In the figure, the colours (if visible) are associated with elements which are part of the linear programming‐based model: blue for the ingredients formulation, red for the “target” of the LP model (minimization of the final formulation price), yellow for the constraints applied in the model, orange for the standards to apply, purple for the linearized constraints and which, originally, were not‐linear. The Microsoft add‐in Solver function is visible in the window on the right side.
corrected Amino Acid Score (PDCAAS; see Box 5 for its description) 281, and true faecal
digestibility (TFD; see Box 5 for its description) 284. However, I calculated and manually
assessed these two parameters in the final model.
4.7.2.2 Model optimization: the step sequence
In the process of running the LP model, I performed, in sequence, the following steps:
creation of the data layout on a Microsoft Excel spreadsheet (see Figure 18);
activation of add‐in Solver Function (SF; see Figure 18), which is supplied with
standard installations of Excel, as reported in previous sections;
assignment of the OF, DV, and constraints described previously;
activation of the Solver Function to identify the optimized LP model (see Figure 18);
(if needed) activation of the Sensitivity Analysis function, which is supplied with the
standard installation of the Microsoft Excel Solver add‐in, as reported in section
4.4.3.

141
4.7.3 Phase C: comparison with laboratory results and sensitivity analysis
The Kenyan manufacturer (Insta Products EPZ Limited, Athi River, Nairobi) produced small
batches of a RUTF prototype based on the LP‐optimized formulation. A Kenyan laboratory
(Polucon Services Limited, Msaada Avenue, Mombasa) performed the analysis (in triplicate)
of the total energy, protein and fat content (see Table 15) in the prototype.
In this phase, I compared the lab‐based results of the prototype against the LP‐based
estimates. I considered the model to be acceptable only if, in the two sets of data the
difference in the relative energy density was below 10 per cent, and the difference in both
protein and lipid densities were below 5 g/100 g. In food technology, these pre‐stated
difference values are cut‐offs commonly used, although, they were not found described as
such in the peer‐reviewed literature.
To be acceptable, the prototype should also have been aligned with the considerations
reported in the section “Texture‐related constraints” (sub‐chapter 4.7.2). Once data from
the macro‐nutrient comparison and the prototype texture were available, I considered the
model acceptable, or not, based on an informed choice. In the algorithm of Figure 17, this
step is represented by the symbol sequence “ok?”, “yes”, or ”no”.
If the LP‐model was not acceptable, a re‐formulation of the model was needed. With this
purpose, first I performed a Sensitivity Analysis, with the SF add‐in. The output of this
function consists of a table reporting how much individual ingredient costs and formulation
constraints can vary, without requiring a change in the values of the other LP decision
variables or constraints. Secondly, I increased or decreased the constraints, within the
interval suggested by the Sensitivity Analysis report, wherever possible achieving an
acceptable model using the selected ingredients. In Figure 17, this step is symbolized by the
dotted line.
4.7.4 Prototype production: consideration about its processing technology
When producing the prototype at Insta Ltd., I also considered food technology‐related
aspects. In food aid interventions, processed cereals and pulses for human consumption,
involving no or limited cooking, must have a degree of starch gelatinization equivalent to or
higher than 80 per cent (private communication; MSF Food Technologist, 2008), whereas
their antinutritional factors must be non‐existent.

142
Extrusion‐based technologies may help in achieving these results. According to one large
review study, the correct application of these processing techniques achieves levels of
starch gelatinization sufficient for digestion 159 while destroying most antinutritional
factors159. However, another study suggests that the overall digestibility does “not seem to
substantially improve”285 in presence of extrusion. This is so, because extrusion led, in this
study, to a higher carbohydrate fermentation in the colon, presumably as a result of fiber
solubilisation, with a possible suppressive effect on appetite. Moreover, this industrial
method is available in most African capital cities, where also pre‐extruding and milling
operations can be commonly found. In view of these aspects, this technology was applied
when producing the prototype.
4.8 Results
Based on the described method, I found that the improved RUF formulation, whose
prototype reproduced a LP‐based model, could be considered acceptable, modifying one of
the pre‐set criteria, and without the need to perform a Sensitivity Analysis.
Maize, soy, sorghum, palm olein oil, and sugar were the chosen commodities.
In the optimized solution, some energy and nutrient calculated values (protein energy/total
energy; fat energy/total energy; (n‐6) fatty acids energy/total energy) collided with the
minimum or the maximum limits of the pre‐set constraints.
Described in section 4.4.4, the WFDAS 273 was the ideal nutrient composition data source,
since it fulfilled most of the pre‐defined selection criteria. The WFDAS is based on data from
six countries from East, West and North Africa, Central America, and South and South‐east
Asia. All these areas are affected by malnutrition, and therefore consistent with the goal of
this study. However, essential (n‐3) and (n‐6) fatty acids were missing in the WFDAS. For
these nutrients, I, therefore, used data from the USDA SR20 and Nutrisurvey
databases280,283.
Nutrients for maize, sorghum and sugar were obtained from WFDAS, and the tag names for
these and the other commodities are available in the footnote in Table 13. Data for soy
beans and palm olein oil were selected from another source, USDA SR20 (released in 2009),
because their descriptors were closer to the commodities available. However, in this

143
dataset, soy figures for lysine and tryptophan were, respectively, 27 and 58 per cent higher
than in WFDAS data.
The prices of maize, soy, sorghum, oil and sugar were respectively 0.3, 0.6, 0.3, 1.2 and 0.7
USD/Kg.
The final price of the formulation was 0.7 USD/kg. The initial minimum energy density
constraint (520.1 kcal/100 g) was manually relaxed by only 0.2 per cent (518.9 kcal/100 g) in
order to achieve a possible solution (see Table 13).
All the resulting ratios between energy from protein (0.10), from fat (0.60), from (n‐3) and
(n‐6) fatty acids (0.009 and 0.10 respectively), and the total energy content matched the UN
standards (see Table 13).
Expressed by the PDCAAS per centage, the quality of the protein (PDCAAS: 85.7 per cent;
lysine was the limiting amino acid) was close to the upper level of the reference range (75‐
89 per cent). Part of the calculation of the PDCAAS, the True Faecal Digestibility coefficient
(TFD) was 83.0 per cent. PDCAAS and TFD specifications are included in Table 13, whereas
the process of estimating the PDCAAS and the TFD scores are described in Box 5.
Expressed as relative difference, the total energy in the LP model was 3.0 per cent lower
than the lab‐based figures. The protein and the lipid contents estimated with LP were
respectively 2.3 and 1.0 g/100 g lower and higher than the contents measured in the
sample (see Table 15).

144
Table 14 Sensitivity analysis of the final optimized model.
Constraint
Allowable decrease
Allowable increase
Nutritional:
Total energy, kcal >518.9 1.24 0.03
<550.0 31.0 <0.001
Protein energy/total energy > 0.10 1.18 0.004
< 0.12 10.38 <0.001
Fat energy/total energy > 0.45 <0.001 77.85
< 0.60 0.01 0.33
(n‐3) Fatty acids energy/total energy > 0.003 <0.001 2.87
> 0.025 8.54 <0.001
(n‐6) Fatty acids energy/total energy > 0.03 <0.001 36.3
< 0.10 0.003 <0.001
Palatability:
Sugar level, g >15 <0.001 0.50
<18 2.4 <0.001
Sorghum, g >7 0.87 0.02
<10 <0.001 3.0
Texture:
Fat level, g >28 <0.001 6.6
<36 1.4 <0.001
Maximum food ingredient weight:
Final amount, g =97 0.001 0.05
All the figures refer to 100 grams of product. Calculations were performed using Microsoft Excel (2007) with the Solver add‐in function and the Sensitivity Analysis Report option.

145
Table 15 Comparison of the LP‐optimized model and the laboratory composition analysis of the same formulation.
Calculated Nutrient densities1
Laboratory results2
Absolute difference
Relative difference
A B B ‐ A = C (C/A) x 100
Energy kcal/100, g 518.9 534.7 66.0 3.0
Protein g/100, g 13.0 15.3 2.3 17.7
Protein energy/total energy 0.10 0.11 0.01 ‐ Lipid
g/100, g 34.6 33.6 ‐1.0 ‐2.9
Fat energy/total energy 0.60 0.56 ‐0.04 ‐ 1 Sources of food composition are 273,283. 2 Methods applied (parameters, other information): Pearson (energy); Gafta May 91 (protein, Nx6.25%; lipid). By Polucon Services Limited, Msaada Avenue, Mombasa, Kenya; test report no. 2008/1282. Individual values for calculation of the variation were not available.
4.9 Discussion
In this study, I used the described method to successfully design a prototype RUTF product
for the rehabilitation of HIV/TB wasted adults with SAM in East Africa.
Although today this method can be easily applied, historically, LP has received relatively
little attention. This is so, perhaps, because computers were not widely available when LP
was first conceptualized and disseminated252. The example illustrated in this chapter was
implemented using software widely available (Microsoft Excel Office 2007 and its Solver
add‐in function).
In the optimized solution, three calculated energy and nutrient densities were exactly
equivalent to the upper or lower limits from the pre‐set constraints. This type of result is
often observed when applying Linear Programming. As a consequence, criteria which
behave in such a way become influential in the final optimized formulation. Therefore, in
these cases, it may be relevant to compare the calculated values with the real values
coming from the prototype. In my formulation, the energy from (n‐6) fatty acids could not
be tested, however, all the other calculated figures seem to match the prototype values,
proving their robustness.

146
In the prototype formulation, laboratory analysis confirmed that the energy, protein, and
lipid values were within the pre‐established cut‐offs (see Table 15). The relative difference
in the energy density (3 per cent) was below the pre‐set threshold (10 per cent), and the
protein and lipid absolute differences (2.3 and 1.0 g/100 g respectively) were lower than the
limit of 5 g/100 g. However, the relative difference in protein was large (17.7 per cent). This
was not surprising, since it is known that protein content, in particular from cereals and
pulses, can vary by a factor or two, depending on variety and fertilizer usage 286. Except for
protein, these results indirectly confirmed the relative accuracy of the FCD. However, food
composition analysis (phase C in Figure 17), in particular for protein, remains a
recommended step.
In this RUTF prototype, the subjective texture criteria (not too gritty, not too fluid), and the
criteria for a sufficiently high PDCAAS were met. If the PDCAAS had not been close to the
desired value, the limiting essential amino acid in the formulation, lysine in our case, could
have been included as a constraint (Table 13), forcing the model to include a greater
proportion of lysine‐rich foods into the formulation.
In line with other LP studies in human nutrition 265, taste constraints were also introduced.
The following sub‐study assessed the preference towards this LP‐optimized prototype. The
results are presented in chapter 5.
It was not possible to meet the initial energy constraint. However, a global optimum model
was successfully found by gradually relaxing the total energy constraint. Goal programming
is an alternative method to LP, has been successfully applied to other dietary problems
260,261,268, and allows the model solution to have a range of OF, rather than a single one 259.
However, Goal Programming is more complex to apply. Since a solution could be found to
the LP model by manually relaxing the energy constraint by only 0.2 per cent, we avoided
using this more laborious method. In more complicated cases, a method based on Goal
Programming may become more interesting than the approach described in this thesis.
In phase C (Figure 17) of the present study, adjustments to the formulation were not
needed. However, in another models, the Sensitivity Analysis (data in Table 14) could be
used to guide the analyst on how much each individual constraint could be varied without
requiring a change in all the others.

147
In this study, the findings support the use of LP as a valuable tool to minimize the cost of a
RUF formulation. According to UNICEF 119, sixty‐eight per cent of Plumpy’nut®’s final overall
price, excluding production and transport costs, consists of food ingredients. In Kenya, one
kilogram of Plumpy’nut® costs approximately 5.00 USD (personal communication: Malik
Allouna, MSF/France, Kenya mission; 2008). This suggests that the indicative price for the
food ingredients component was 3.4 USD/kg at least for Plumpy’nut®. Therefore, the
ingredient costs for the LP derived RUTF prototype formulation (approximately 0.70
USD/Kg) is likely to be substantially cheaper, even after the addition of the micronutrient
premix4. Importantly, the lower transport and importation costs are also likely to result in a
price advantage for locally produced RUTF. The regional agriculture economy may also
benefit due to local purchase of the ingredients. However, more robust methods for
economic assessment of RUF formulations are needed to support decision makers.
Future standard protocols for RUF design should address also other economic aspects,
including validated methods to obtain food price data in low‐income countries for use in LP
models. In this study, it was challenging to find price data for ingredients, which well
represented seasonal fluctuations at national or regional levels.
Some constraints were highlighted in applying LP to design food formulations of this kind.
The accuracy of the novel RUF was highly dependent on the quality of the available FCD.
Since the 1970’s, researchers have realized that most foods exhibit variations in
composition, and that a single table value cannot fully represent any particular food 286.
Nutrients figures must therefore be considered as estimates 286.
Section 4.4.4 describes the improvements proposed for FCD data collection and
management. For example, INFOODS 271,274 and Codex Alimentarius web pages 287 report
information on standardized nutrient analyses, and recent international protocols and
software 288 trying to harmonize food tag‐names. Despite these initiatives, no FCD source,
used for this LP exercise, reported coefficients of variation or standard deviation figures, in
spite of their use being internationally recommended 286. Moreover, WFDAS showed some
limitations. In this dataset, the same item descriptors were sometimes reported more than
4 At the time of this thesis, the supplier had not communicated the final cost of the micronutrient
premix.

148
once, or did not specify the food variety (e.g. in case of sorghum: white or red types).
In this study, lysine and tryptophan in soy beans data, retrieved from an American database
280, were higher than in merged non‐American databases 273. This might have overestimated
the final RUTF protein quality. However, the Kenyan manufacturer reported that US soy
beans were often present on the local market, and so may be used in products
manufactured in East Africa.
The oil descriptor used, palm oil, was different from the actual used commodity, which was
palm olein oil. Palm olein is an industrially prepared fraction of palm oil. Therefore, it can be
speculated that its nutrient composition, mainly in terms of (n‐3) and (n‐6) fatty acids, are
different. Unfortunately, the laboratory used in this study, and probably most industrial
laboratories in Africa, are not equipped to measure (n‐3) and (n‐6) fatty acids. Rancidity of
these nutrients is a major risk for the stability of food product with high fat content.
Therefore, close monitoring of its shelf life is important.
Other important limitations of the chosen approach were related to difficulties in taking
into account the presence of anti‐nutritional factors in cereals and legumes. Michaelsen et
al. 153 consider anti‐nutritional factors “to have a negative impact on the solubility or
digestibility of required nutrients and thereby reduce the amounts of bioavailable nutrients
and available energy in the foods”. These factors include (i) phytate and polyphenol
compounds, which inhibit the absorption of proteins and minerals, like iron, zinc and
calcium; (ii) alfa‐amylase or protease inhibitors, which reduce respectively starch and
protein digestion, (iii) phytohemagglutinins, which bind carbohydrate‐containing
molecules, (iv) saponins, which have negative effects on the permeability of the small
intestinal mucosa, and (v) high content of soluble dietary fibers or alfa‐galactosides, which
may lead to flatulence. Therefore, these factors may contribute to reduce the nutritional
rehabilitation of the beneficiaries of RUF’s, or to prevent their growth or weight gain. For
these reasons, the mathematical model should ideally include them, expressed as
maximum level constraints. However, their actual contents in the foods was either unknown
or expensive to estimate.
The designed formulation, which does not contain milk powder, may not be efficacious in
rehabilitating children under five from severe acute malnutrition. This seems to be proved

149
but two randomized clinical trials undertaken while the finalzing the writing of this thesis.
The first study, described by Oakley et al.182, assessed malnutrition recovery in two cohorts
of children, who received a RUTF with either a 10% or a 25% of milk powder. Recovery
among children receiving 25 per cent milk RUTF was slightly greater than children receiving
10 per cent milk RUTF (84 per cent compared with 81 per cent after eight weeks; P < 0.001).
The second study, by Irena et al.289 tested the formulation optimized in this chapter. This
randomized controlled clinical trial assessed the recovery rates in two cohorts of children
under five years of age, who received RUTF with either 25 per cent milk powder or the milk‐
free formulation. The recovery rates for SMS‐RUTF and P‐RUTF were 53.3 per cent and 60.8
per cent for the intention‐to‐treat (ITT) analysis and 77.9 per cent and 81.8 per cent for per
protocol (PP) analyses, respectively. However, specifically in children with an age above 24
months of age, the recovery rate was equivalent in presence of both products.
The two studies suggest that nutrient components from milk in the RUF formulation play a
role in management of acute malnutrition, at least in children under five years of age.
Another hypothesis is that the antinutrient factors in the SMS‐RUTF may have reduced the
trial outcomes of both studies.
4.10 Conclusions
This paper describes a widely applicable method for the rational design of therapeutic food
products at minimum cost. The study provided a prototype formulation, which met all the
predefined requirements, except for one relaxed by 0.2 per cent, and also suggested, as a
lesson learnt, the need for improved methods to determine the ingredient prices to use in
the model.
The RUTF cost (based only on food ingredients) was approximately four to five folds
cheaper than the current standard product (food ingredients and premix). Using the
methods described here, public health nutritionists and food technologists could apply
these steps to design other RUF formulations, such as ready‐to‐use supplementary or
complementary foods.
However, the macronutrient content of LP prototypes always need to be confirmed by food
composition analysis and the finalized products trialled under field conditions before they

150
can be recommended for general use 182,268. This is true in particular in view of the fact that
RUF formulations with similar macronutrient composition (e.g. protein quantity and
quality), but different in food ingredients (e.g. dairy products replaced by combinations of
pulses and cereals) may not lead to similar efficacy in rehabilitating from or preventing
undernutrition.

151
5 Trialling the acceptability and the safety of a novel RUF formulation: a randomized controlled clinical crossover trial (sub‐study 3)

152
5.1 Introduction
Ready‐to‐use foods must be both acceptable and safe in order to be efficacious. This
chapter describes concepts of acceptability and safety and their determinants in health care
and, most of all, in food science. It includes a brief review of the ways of measuring
acceptability and safety, as described in the literature, and describes how these were
applied to a case study. The last sections discuss the challenges in the interpretation of the
collected data, while drawing conclusions which are useful for future similar studies.
5.2 Acceptability
Research looking into acceptability, both in health care or in food science, is relatively new,
but an increase in the number of studies was noticed during the 1980’s 290,291.
In 1981, Kadzin suggested that a health care treatment procedure is acceptable when “non
professionals, lay persons, clients and other potential consumers” consider it “appropriate,
fair and reasonable for the problem or the client”, but also “non intrusive”, and meeting
“with conventional notions about what treatment should be”292. Currently, this is the most
accepted definition290,292,293 of health treatment acceptability.
In food science, disciplines such as dietetics, medicine, agriculture, social anthropology,
sociology and psychology fuelled research exploring food acceptability 294. However, Mc
Ewan suggests that “there is no clear consensus as to what food acceptability actually is”
295. That is confirmed by the current literature, where terms such as preference 295,296,
consumption 297 or acceptance 298 were found inter‐changeable meaning.
One general definition suggests that food acceptability measures the “interaction between
an individual and food”295, while another suggests that “the disposition of an individual to
accept a particular food or drink, in particular circumstances, at a moment in time” is a
more adequate way to describe the same concept299. However, in these and many other
existing definitions, three components, namely physiology, attitudes and sensation, are
common features 295, whose numerous determinants are crucial for understanding and
interpreting food acceptability.

153
5.2.1 The determinants of acceptability
There is consensus that “the process by which man accepts or rejects foods is of a multi‐
dimensional nature” 300. However, exploring the large literature available, most
determinants of acceptability can be grouped into at least three categories: determinants
related strictly to food characteristics, others highlighting the importance of the consumer’s
features, and a third group concerning the context where a food is consumed. The following
sections explore these three categories of determinants, whose boundaries remain,
however, imprecise.
The determinants of acceptability directly influenced by the food are many. These include
the food’s chemical and nutritional composition, including the role of chemosensory
compounds 301, but also the environment in which the flavours are perceived 301. Also, the
physical structure and properties of foods300, including their visual attributes such as light,
fluid and thick appearance, creaminess, and flavour notes 300 are known to affect food
acceptability. In some studies, the interaction of chemical senses with other oro‐nasal
sensation301 and sweetness‐related factors302 are well described, whereas the hedonic‐
response to sweetness is known to be potentiated by the presence of fat components302.
The latter clearly play a major role in determining acceptability, contributing to overall
palatability302, not only during chewing and swallowing 302, but also during digestion, with
their activation capacity of satiety303, which all increased or decreased the acceptability of
foods in the available studies.
In studies looking at the monotony or the variety of food choices, within or across meals303,
over short (days, or weeks) or long periods of time (months or years)303, diet diversity was
found to be an important determinant of satiety feelings303. Menus, planned and previously
communicated to the consumers, were found to influence food acceptability 303, as much as
the food serving sizes304, their combination of meal items304, or the sensations produced by
immediately prior events301.
Culinary aspects studied in staple foods, such as their typical “processing techniques” and
“characteristics of flavour combinations” 301, were determinants of acceptability as strong as
the visual presentation, the label information and the package options related to the same
food items 301.

154
Other determinants of acceptability seem to be related, instead, more directly to the food
consumer. These include her/is gender300,302,304, age300,304, genetic300,302,
physiological295,300,302, hunger/appetite conditions295, or specific metabolic issues302. Among
the latter, the literature reports that the food consumer is influenced by her/is overall
nutritional status, and in particular by her/is body302 and fat mass302, as well as weight
cycling302.
In other studies, the level of education of the consumer300, psychological factors301, such as
“the recall of pleasure”301, and “the prediction of future feelings” 301 were found to be
strong determinants. Others described in depth were potential behavioural issues such as
eating disorders302, abnormal “brain mechanisms” 302, but also beliefs, attitudes, food
habits, radical opinions about food choices, perceptions of product safety 302, or “food
appropriateness” to specific situations or the time of consumption 305.
Food acceptability determinants may have also a social dimension. For instance, the
“effort” to obtain or the price of the chosen food302 or social‐cultural aspects related
directly to the food choices302, including their “convenience”, their “prestige”, the
perception of nutritional added values302, and the past or anticipated future events “that
enter the mind of the subject at the time the reference event is occurring”301 were found to
strongly influence the way foods were considered acceptable.
Food acceptance cannot be understood without accounting for its context, as suggested
by Rozin et al. 301. This last group of determinants are related to the environment in which
the food is consumed and/or socio‐cultural factor attached to it. For instance, the way
humans socially interact304 affects food preference. That is true, at least, for the presence of
family members, and when cultural habits, including religious elements300 or features from
naturally or artificially created groups304 are present.
Urban and/or rural environments302, or more generally the location of the consumption,
may influence the acceptability of foods. For instance, the consumer reaction in a
institutional setting, like a food‐sensory analysis laboratory, is known to be often different
from the one observed in a public place like a restaurant, or a private situation like a home
or a kitchen 295,304,306. Moreover the level of ability to make food choices, like, for instance,
during a sensory test, or a convivial meeting proved to be a predictor of food

155
acceptability306. That is because of the presence, the absence and the degree of instructions
to follow, which directly and significantly affect the measure of meal energy intake306.
The determinants interact between themselves. But because of their large number, the way
the described determinants affect each other is not entirely understood. However, few
models have been proposed. For instance, Costell et al. 300 suggest that a consumer’s
response to a given food is mainly defined simultaneously by four intertwined elements. A
sensory component is the first one which is described and correlated to the sensory
properties of the product. Another is an affective component, responsible for positive or
negative responses towards a product, whereas a cognitive component comes from the
knowledge and opinions about the same food item. A behavioural component involves
intentions or actions, defining how willing a consumer is to do something in a pre‐defined
situation. In other words, a food consumer never responds to an individual component
input, but to all the inputs in combination, and is affected by the potential interactions
between them 300. The degree of each component input should be described by categories
which are food‐, consumer‐ and context‐related300.
The presented approach can, therefore, explain why taste preferences alone, for instance,
do not necessarily predict food preferences and their related intakes302. This is so, although
one review study304 suggests that “meal and food choice continue to be the strongest
factors that influences food perception and acceptability” 304.
In summary, the determinants of food acceptability are multidimensional and challenging
to understand but their study is, nevertheless, important. This is because it can provide
help in understanding eating disorders306, and in measuring the acceptability of novel foods,
“accurately and cheaply”295. The latter is relevant to my study, and described in the
following sections.
5.2.2 Measurements of acceptability of foods
Depending on the subject under study, “different approaches, study designs and
methodologies may be adopted to study food acceptability”300. The best way to measure
acceptability of foods should be based on the determinants of interest, as described above.
Because there are many, a large number of tools have been designed.

156
The most common are described in the following parts of this section, and included both
qualitative and quantitative approaches, such as general questionnaires and interviews,
food frequency questionnaires, food intake measurements, Likert‐scale questionnaires,
focus groups, consumers’ diaries, blood chemistry samples, body weight, BMI and bowel
function measures.
Knox et al. 294 opted for pre‐validated questionnaires and interviews, which described diet
histories and, therefore, assess the acceptability of a range of foods. However, these tools
suffer from observer biases, due to the limited capacity of human memory, and its
involuntary distortion of events 294. Repeated 24‐hour recalls are, therefore, often preferred
294 and complemented by in‐depth interviews300 in order to reduce this data collection‐
based problem.
Food frequency questionnaires are tools easy to administer, and, therefore, often used in
food acceptability studies. Although inaccurate for the comparison of individual diets, these
questionnaires remain valid when looking for the degree of acceptability existing among
defined study groups294.
Food intake measurements are common in many acceptability studies294,302,303. Intakes are
expressed as the simple weight of intake, or, more accurately, as weight of intake per person
body weight per time unit. However, these measurements can be resources demanding,
time‐intensive, and may alter the subjects’ eating habits, distorting the interpretation of
reality 294.
Likert‐scales can be used to measure the degree of acceptability or rejection of health
treatment307, foods302, or food supplements308, but also their names, label design,
appropriateness305. These methods are quick to administer, require minimal labour305 and
they come in different validated versions292 with scales from 5 to 15 points. Their results
should be expressed as the median score308.
Focus groups involving facilitators, note‐takers, audio‐recorders, group dynamics, brain
storming, non‐verbal interactions between patients, food consumers, and/or caregivers, are
often used to explore ideas, opinions and perceptions in acceptability studies 300,307, despite
the fact that interpretation of their outputs can be labour intensive.

157
Consumers’ diaries have been described as useful tools by some authors 294,295,306. This is so,
although the high degree of cooperation required from the participants means that sample
attrition over the record‐keeping can produce largely self‐selected samples 294. Moreover,
self‐report studies need to be validated by direct observational studies 306, often resource‐
demanding.
Physiological measures were largely employed in food acceptability studies. These included
body weight, BMI measures308, whereas blood biochemistry samples were often used to
test the sensitivity and the sensibility of other research tools 308. The median and
interquartile range describing the functionality of the study participants’ bowel were used
to assess adverse events or general problems with adherence to dietary interventions and
their controls308.
The conclusions from food acceptability studies cannot be generalised to other populations,
unless these have very similar socio‐cultural backgrounds and/or physiological features 294.
For instance, children’s, adults’ and adolescents’ food preferences require different models
of interpretations. Children are often guided by taste alone, whereas, in contrast, food
choices of adults tend to be influenced by nutritional beliefs and social attitudes 302, and
surveys on adolescents’ food habits suggest that food preferences are based on food‐
related attitudes rather than taste preferences, or beliefs302.
Therefore, it is safe to argue that measuring true food acceptability is challenging. The most
common research methods have focused on the evaluation of sensory‐related aspects306,
rather than including social and cultural determinants. These are important determinants,
but they often incur into measurement biases295.
In summary, in studying food acceptability, some authors concluded that “from examining a
single, simple, restricted, refined, experimental situation, it is impossible to comprehend
either the variety or possible patterns of the variables controlling them”306. Therefore, only
an adequate combination of the research methods and instruments described can be
comprehensive enough to assess the acceptability of one, or more foods307.
In my study, measuring the acceptability of ready‐to‐use foods presented challenges and

158
required solutions which differed from the assessment of their safety, which is described
below.
5.3 Safety
Prior to being offered to malnourished individuals, ready‐to‐use foods must be proved to be
safe. Throughout human history, the need for an adequate and safe supply of food has been
a driving force for innovation in agriculture, food industry, and human culture in general 309.
For instance, the “development of food thermal processing” (or food bottling), which
occurred at the end of the eighteenth century thanks to the contribution of Nicolas
Appert310, contributed to the victory of many Napoleon’s wars. That was because, food
bottling, under heat, increased the safety of the food supplies, improving the health and,
therefore, the performance of his troops310.
More recently, food safety became part of the institutional concerns of the modern society,
at least in western countries. In 1908, the United States of America (US) Federal Food, Drug
and Cosmetic Act prohibited additions of any toxic substance to food, and in 1976, the US
Food Safety Council developed criteria for the evaluation of safety in food supplies and their
ingredients. Since 1930, the Food and Drug Administration agency (FDA), in the US, , and
since 2002, the European Food Security Agency (EFSA), , have been charged with ensuring
the safety of the national food supplies.
According to Chassy et al. 309 “the situation is far different” in low economy countries.
There, consumers and concerned institutions are more focused on “obtaining adequate
food supplies and ensuring food security, than they are with food safety, although –
paradoxically – their food is frequently contaminated with biological and chemical agents
that have adverse effects on health” 309.
In today food risk analysis, a food is considered safe when we are reasonably certain that it
will cause no harm if it is used as intended, under the anticipated conditions of
consumption311. Because food safety is a Public Health prerequisite312, it is also utterly
important to be assessed, together with its determinants.
5.3.1 Determinants of food safety
The main determinants of food safety can be summarized in four categories.

159
a. Bacterial and viral pathogens ‐ when present in consumed food, they can infect
humans, causing illnesses309;
b. Toxins ‐ formed before and/or after food processing or cooking, they are produced
by bacteria and fungi 309. The latter, common in grains and nuts, are known to cause
health issues as such as cancer, toxicity syndromes, gangrene, convulsions, and, in
the long term, suppressions of the immune system309;
c. Natural intoxicants – these are toxic molecules produced by plants as part of their
defences309. An example of these substances is represented by the antinutritional
factors found in legumes 309. In the millenniums of human history, the process of
crop domestication reduced the initial concentration of such toxicants;
d. Inadequate forms of semi‐industrial / industrial processing, and home‐based
preparation of food (cooking) – these methods have the capacity to reduce to
minimum the adverse effects from the determinants mentioned above313, but only
when applied correctly.
In summary, a food and its ingredients are considered safe, when their
processing/preparation methods are correctly applied and, simultaneously, chemical and
microbiological analysis confirm that their (a), (b), and (c) determinants are within
acceptable ranges. The latter are pre‐determined by public national and international
institutions concerned with food borne diseases. However, in innovative foods, the methods
and the principles used to confirm their safety are specific to this category of products314,
and are described in the following section.
5.3.2 The guiding principles to assess safety in novel foods
A food can be defined novel, when it has not been previously consumed by humans 309, and
its safety assessment is always an essential part of its development313. For instance, since
2007, the European Food Safety Authority (EFSA) requires any food, which is novel in
Europe, to undergo rigorous pre‐market safety evaluations 315 in order to minimise the risk
of food‐borne diseases for consumers 315.
In a novel food, three guiding principles assess its safety based on comparison with a pre‐

160
Figure 19 ‐ Algorithm to confirm the safety of a novel RUF
NovelRUF
ComparatorRUF
History of safe use
yes no
Novel RUFis safe
yes no
Novel RUFas safe-in-use as
comparator?
Components substantiallyequivalent?
Novel RUFis unsafe
To be provedin human OR animal beings
No need for further controls
on safety of the novel RUF
The text in bold indicates the application of one of the guiding principles supporting the testing of a novel food safety. Source: adjusted from the references 101,309,312,313,315,316.
determined bench‐mark product, called the “comparator”313. The principles are called
“history of safe use”, “substantial equivalence”, and “safety‐in‐use”, and are described in the
following sub‐chapter sections, and their sequence of use is showed in Figure 19.
Whenever available, the control food is similar in many aspects to the innovative food, and
must be proved to be safe by virtue of its established ‘history of safe use’ 313.
5.3.2.1 Principle “history of safe use”
Since the 1990s, the expression “history of safe use” is found in documents guiding the
choice of comparator foods prepared by regulatory authorities (see Figure 19). This
principle “forms the cornerstone of the safety evaluation of novel foods”313. However, in
2007, some authors313 argued that existing criteria to consider a comparator “safe to use”
should be improved.
For instance, a piece of
evidence for considering a
comparator safe is the
documented absence of
‘history of un‐safety’ 313.
This is defined, ideally, as
lack of “robust and
reliable, peer‐reviewed,
scientific publications,
governmental documents
and scientific expert
opinions” suggesting cases
of un‐safety313. However,
in reality, anecdotal
evidence sometimes is the
only information
available313. Therefore,
some comparators may be
considered “safe in use”,
while in reality they are
not.

161
Sometimes, no comparator with an acceptable ‘history of safe use’ may be found. In this
case, the novel food is not necessarily unsafe, but requires complex assessment
programmes313. These are not described here, because I identified a suitable comparator
food, as described in the methods section of this chapter.
Whenever its “history of safe use” is documented, the comparator food assists the safety
evaluation of the novel food, testing the existence of a “substantial equivalence” between
the two products313. The concept supporting this approach is described more in depth in
the following section.
5.3.2.2 Substantial equivalence between comparator and novel food
The “substantial equivalence” approach is meant to demonstrate any potential difference of
safety risk between the comparator and the novel food (see Figure 19). The founding
assumption is that food components, which are identical in the two products, pose the
same level of risk309. Therefore, both in the comparator and the novel food, their
components must be first characterised, and subsequently critically compared.
At least two types of components are generally considered. The typical information
components include the food chemical and microbiological hazards, food preparation and
processing, and the description of their consumer populations, whereas component data
consist of the food moisture, protein, fat, amino and fatty acids, and micronutrient profiles,
among others 313.
Based on this principle, only two cases are possible. If the components of both foods are
identical, “substantial equivalence” between the novel food and its comparator is
confirmed. Therefore, at least according to the European guidelines 315, novel foods
demonstrated to be substantially equivalent to their comparators are to be considered safe,
and no further safety assessment is required. However some authors309 argue that this
approach does not entirely eliminate the possibility that a novel food is unsafe, but it
establishes only a “reasonable likelihood”315.
In the second option, the comparison of the two component documentations fails to prove
substantial equivalence between the novel food and its comparator. In view of this , any
highlighted hazard needs to be further understood 315. In the literature315, the comparison
of typical components involves verifying the existence of a certain level of risk of a lower

162
digestibility, a higher intolerance, and/or the presence of allergenicity in novel foods. If so,
simultaneously in the novel food and its comparator, any of those risks must be clinically
trialled by a study named “assessment of safety in use” 314 (see Figure 19).
5.3.2.3 Trialling safety‐in‐use
No endorsed protocol to plan trials to test safety‐in‐use in novel foods is currently available.
However, the related scientific literature suggests which trial study design is at least ideal,
and discusses when human participants, rather than animal, are needed.
The trials should include a control group. Moreover, a randomized allocation of the novel
food and comparator among the study arms is recommended 312. The number of the study
groups should depend on the trial design, which is ideally factorial 316. Few other study
design features should be considered. These include: limiting the chance of both the
observer and the participants knowing which intervention/control exposure they were
allocated to315; statistical determination of the sample size for each study arm 312; and data
analysis controlling for the participants’ anthropometry and overall diet312.
Animal studies are cheaper, but often can not replace trials involving human beings315. This
is because the generalisability of the study results from animals to humans is often limited.
However, the EFSA 315 developed a guide, summarized here, suggesting when studies testing
novel food safety‐in‐use may consider human study groups, taking into consideration at
least three type of risks. These are: general safety, nutritional, and allergenic hazards.
In order to consider “generally safe” the involvement of human beings when testing novel
foods for safety‐in‐use, EFSA recommends “a preliminary systematic review of the relevant
existing information”. In the study area of this doctorate, one recent systematic review 101
concludes that the home based therapeutic rehabilitation of SAM “appears to be safe”5.
When planning safety‐in‐use trials, concerns about nutritional hazards may be raised. In this
case, EFSA suggests to estimate the nutritional risk posed by hypothetical higher intake
ranges of the novel food in the population of interest315. Effects from prolonged storage,
excessive or incorrect processing and cooking should be also thoroughly discussed 315. In
5 In the study, safety was defined as low or no correlation with morbidities like diarrhoea, malaria and respiratory infections, and mortality.

163
our study, the macronutrient profile in the novel food meets the standard
recommendations for RUF products 55 (see section 1.3.2.1). However, the choice of the
technology (see section 1.3.2.2) to process the blend of pulses and cereals in the novel food
tested in this doctorate may affect some nutritional aspects. For instance the digestibility of
the starch or the absorption of some of the nutrients may be below the ideal levels..
When testing safety‐in‐use of novel foods, allergenic reactions may occur in association
with one or more ingredients. However, in this case, EFSA recognizes that it is not possible
to make an assessment without “testing in humans”315. Furthermore, based on the
international code of Good Clinical practices, the need to assess a possible risk of
allergenicity in humans must be also justified by the level of potential benefits 315. In our
study, peanuts are ingredients in the control product, although absent in the novel food.
Peanut is a current public health concern, but no documentation was found suggesting
adverse events due to potential allergenic reactions, neither in adults, nor in children who
consumed RUF‐control. This should not exclude the potential risk of allergenic reactions in
such products.
In summary, the safety of a novel RUTF to be administered to wasted populations must be
tested with a safety‐in‐use trial. The reason is that the “substantial equivalence” between
the most common RUTF (based on the Plumpy’nut formulation) and the RUTF developed in
chapter 4 cannot be shown. That is because of difference in their ingredients and the
processing technologies employed for production.
Only seldom, humans should be part of studies testing food “safety in use”312,317. However,
the risk of harm can be managed. In the improved RUTF formulation, potential highlighted
hazards require closely monitoring of the study individuals’ health condition, in order to
ensure that they stop consuming the paste as soon as any adverse event may start to arise.
On the other hand, the peanut‐ and milk powder‐based RUTF is the ideal comparator of
novel improved RUTF products. That is because its absence of documented adverse events
remains unchallenged, both in wasted children and adults.
The importance of assessing and preventing potential adverse events in the early stages of
human studies, could not be overemphasized. For this reason, after the definition of the
study objectives, in the “safety in use” trial of the RUTF formulation optimized in chapter 4,
the setting and the profile of the participants were cautiously chosen, as described below.

164
5.4 Objectives of the study
Aim: Development of a method for trialling the acceptability and
safety of a novel RUF formulation
Specific objective: To compare the acceptability and the safety of a novel RUF
with the most commonly used product, using a randomized
controlled clinical crossover trial with HIV/TB patients in
Kenya
Research question: What are the lessons learnt in applying a method to
compare acceptability and safety of a novel RUF with the
most commonly used product?
5.5 Material and methods
The trial that I describe in this chapter tested, in wasted adults living with HIV and/or active
TB, the acceptability and the safety of the RUTF formulation designed in chapter 4 against
an ideal comparator food. Both products are described in the following section.
5.5.1 Trial and control products
The trial RUTF (produced by Valid Nutrition, Derry Duff, Ireland, at Insta Limited, Nairobi,
Kenya) contained soybeans, maize and sorghum, no micronutrients premix, and is referred
to here as SMS‐RUTFh (“h” standing for adult HIV/TB). The control product (Plumpy’nut®,
produced by Nutriset, Malaunay, France318) contained peanut butter, milk powder, a premix
of vitamins and minerals, and is referred to here as P‐RUTF. Both products contained sugar
(24‐28 and 15/100 g respectively for P‐RUTF and SMS‐RUTFh) and their macronutrients
(energy, protein, lipids) closely met the UN requirements for RUTF as reported in chapter
1.3.2. Both their consistencies were paste‐like, but their tastes and colours were different.
5.5.2 Study population
The study was carried out in two locations, two kilometres from each other, in Homa Bay
town, Kenya. The participants, enrolled after written informed consent was provided, were
patients recruited from the District hospital, supported by the Ministry of Health (MoH) and

165
Médecins Sans Frontières‐France (MSF). The patients from the two study groups met each
other only at enrolment (day one), and/or incidentally in the routine medical hospital visits.
The participants, HIV and/or TB infected, were considered eligible if receiving ART and/or
TB treatment, their age was equal to or above 18 years, and their BMI was between 18 and
24 kg/m2. According to the last criterion, the study group was not malnourished, and this
aimed to minimize their risk of adverse events.
The exclusion criteria consisted of previous enrolment in a nutritional therapeutic
programme, oral problems that prevented adequate swallowing (although typical AIDS oral
thrush was not an exclusion criteria), and any specific food intolerance (e.g. peanut allergy).
Subjects missing more than three days were considered defaulters.
5.5.3 Study design
The study design was a two‐arm crossover randomized control trial. At enrolment the
patients were given a number from 1 to 2, randomly generated using an Excel spreadsheet
(Rand function), that corresponded to one of the trial groups. Each group received one of
the two products during each phase, which was assigned to the participants following an
AB/BA sequence.
Under direct observation, during two weeks (10 working days), water ad libitum and 250
grams of one of the two products were offered to the patients as a replacement of the
midday meal, with the message “please eat as much as you wish”. An extra 50 grams was
available upon request.
A maximum of two hours was allowed to consume the product, and no left‐over could be
taken away. After two weeks (phase 1), the study was interrupted for a seven day washout
period and then resumed for two more weeks (phase 2).
The professional background of the research staff included nursing, nutrition, and
counselling. None of them was working for the MoH or MSF, and they worked in a different
study group each day, interviewing randomly assigned patients. The ratio of staff members
versus patients was equivalent to 1 to 3. In‐depth questionnaires and focus group guidelines
were provided in both English and the local language (Dholuo), after being anonymously
back‐translated. The packaging concealed the product identification.

166
5.5.4 Study procedure and outcomes
In order to consider RUTFH acceptable and safe, it had to fulfil simultaneously the following
criteria and sub‐criteria for consumption, safety and preference.
5.5.4.1 Criterion 1: consumption
The consumption criterion consisted of three sub‐criteria. The sub‐criteria ‘average
consumption’ was satisfied if average SMS‐RUTFh intake was more than 75 per cent (187.5
g) of the offered amount within one hour (criterion 1.1; Table 18), whereas SMS‐RUTFh
‘daily consumption’ was met if its intake was higher than 75 per cent of the offered food for
more than 75 per cent of the days on the trial (criterion 1.2). Finally the ‘comparative
energy intake’ criterion (1.3) was satisfied if the average energy intake per kg of body
weight was significantly higher than 75 per cent of the energy intake from the P‐RUTF.
5.5.4.2 Criterion 2: safety
Soy, maize, sorghum RUTFh was considered acceptable from the safety point of view if
participants did not report any of five co‐morbidity events more frequently than in the
control product (criteria 2.1‐2.5; Table 19). This parameter was expressed as the mean
number of days in which morbidity events occurred during product consumption (10 days
or less). Prior to the acceptability trial, microbiological testing of SMS‐RUTFh was
performed. The results were in conformity with the UN specifications for such products55.
The choice of the most frequent co‐morbidity events was based on a preliminary review of
the available literature.
5.5.4.3 Criterion 3: preference
A product was considered preferred if its score was higher than the alternative in the
following aspects: general preference, colour, taste, sweetness, and texture (criteria 3.1‐3.5;
Table 20). At the end of the trial, each participant was asked to select the most preferred
product (criterion 3.6), and two focus groups were held to investigate participants’
experiences and perceptions that other methods may not have captured.
5.5.4.4 Data collection
Quantitative data was collected daily and included: body weight, height and MUAC, weight
of RUTF intake (Salter scale M021, max 500 ± 5g), 24‐hour recall of nine clinical events, and
individual eating duration. Body weight, MUAC and height were collected daily, weekly and
at baseline, respectively. Individual interviews of all participants were held to evaluate the

167
preference for each product and used a 5‐point Likert scale (with lower scores representing
greater liking of a RUTF)319.
Focus groups, 30 to 40 minutes long, used pre‐selected lists of discussion themes, and the
facilitators followed a written manual. Discussions undertaken in the local language were
digitally recorded, transcribed into English, and twice a week, a diet diversity score (DDS)
questionnaire (0‐12 items type 320) recorded the foods consumed at home.
5.5.4.5 Management of adverse events
Patients reporting any of the five clinical events for more than three consecutive days would
have been immediately referred to the local clinic, and withdrawn from the study if the
cause was considered to be related to RUTF intake.
5.5.5 Sample size
A paediatric acceptability crossover trial on RUTF 321 involved a sample size of thirty‐one
children, during two days of RUTF feeding, to detect a significant difference with alfa and
beta errors of 0.05 and 0.95. Its power calculation, based on of RUTF daily intake,
considered one standard deviation an acceptable difference to be detected.
However since previous research on RUTF acceptability was not available in adults, the
nature of our study was exploratory. For this reason, when compared to the Indian
paediatric study, the sample size (n=50 including drop outs) and the number of feeding days
(10 repeated measures/RUTF/individual) were both increased, but limited by the available
budget.
5.5.6 Statistical methods
Student’s T test and regression models were used to test for differences between
continuous data. The Wilcoxon rank‐sum (Mann Whitney) test and sign test were used for
non‐normally distributed, un‐paired, continuous data, whereas the Wilcoxon matched‐pairs
signed‐rank test was used for non‐normally distributed, paired continuous data, including
the Likert scale 5‐items score. The double‐sided Fisher exact test was used to compare
categorical data, and odds ratios and confidence intervals were calculated.
A linear regression model compared the energy intake of the two products after adjusting
for potential confounders, including clinical events, socio‐economic data and

168
anthropometry at enrolment. Logistic regression models explored if preference for a
product could be influenced by group membership.
Analysis of ordinal score for preference criteria was based on logistic (not ordinal)
regression, after regrouping the data into two categories (scores 1 and score 2, 3, 4 or 5 out
of 5). This was because of the instability of the model, due to too few cases when cross
tabulating outcomes and predictors.
When applicable, regression models benefitted from the robust standard error approach322,
so that the participant’s series of repeated measurements were considered as individual
clusters. Absence of carry over effect was checked prior to treatment‐effect analysis,
following a method described by Jones and Kenward323.
Statistical comparisons were two‐tailed, and all testing was conducted at alfa equivalent to
0.05, on per protocol data. EpiData version 3.1 software was used for data entry, and data
analysis was undertaken using Stata IC version 10.
5.5.7 Ethical issues
This acceptability and safety trial were embedded into a larger research programme which
had ethical approval granted by the Kenyan Medical Research Institute and National Ethical
Review Committee (SSC No. 1414) to test the clinical effectiveness of SMS‐RUTFh.
5.6 Results
5.6.1 Characteristics of the participants
On the 30th of June 2008, the study staff enrolled 51 patients into a five‐week trial (see
Figure 20). Two patients were excluded because they lived too far away. Twenty‐four and 25
participants were randomly allocated into group 1 and 2 respectively. During the first phase
of the trial, eight patients defaulted for more than three days, and were excluded. Two of
them stopped coming after the second day of the trial for unknown reasons, and could not
be traced. Six patients dropped out because of reasons not associated with products intake
(transfer, other commitments). Forty‐one patients successfully completed the study.
At admission, sex, marital status, BMI, and MUAC (Table 16) in the two groups were

169
statistically similar. The DDS did not highlight any statistical significant difference in terms of
kinds of food intake at household level, between the two groups. No difference was
detected between the two weeks DDS, nor within the same week for the same patients
Table 17. No carry over regarding amount and daily energy intake was reported (P>0.05).
Table 16 ‐ Characteristics of the participants at the start of the study (day 1), unless specified otherwise.
Group 1
(n=20) 2
(n=21)
Females, n (%) 17 (85.0) 15 (71.4) Age*, years 34 (29; 42) 30 (27; 35) Marital Status, n (%)
Currently married Never been married
Previously married and now widower
10 (50.0) 1 (5.0) 9 (45.0)
12 (57.1) 3 (14.3) 6 (28.6)
BMI at enrolment*, kg/m 20.3 (18.9; 22.1) 19.9 (19.1; 21.8) MUAC at enrolment*, mm 260 (229; 274) 266 (248; 280)
Diet Diversity Score† 7.5 (6.9; 8.2) 7.3 (6.7; 7.9) Participants who had tasted P‐RUTF at least once before the trial, n (%)
20 (100) 21 (100)
* Median and inter‐quartile range (IQR). † Medians and IQR of four measures over two weeks, two consecutive days per week (phase 2 of the trial).

170
Figure 20‐ Flow‐chart of the participants through the trial.
Table 17 ‐ Diet Diversity Score in phase 2 of the trial.
Week 1 2
Tuesday Thursday Tuesday Thursday
Group 1 (n=19) 7.4 (6.5; 8.2) 7.7 (6.9; 8.5) 7.4 (6.5; 8.3) 7.6 (7.0; 8.2)
Group 2 (n=21) 7.8 (7.1; 8.5) 6.7 (5.9; 7.6) 7.7 (6.8; 8.6) 6.9 (6.7; 7.7)
Groups combined 7.6 (7.1; 8.1) 7.2 (6.6; 7.8) 7.6 (6.9; 8.2) 7.2 (6.7; 7.7)
The diversity score is expressed as mean (95% confidence intervals).

171
5.6.2 Measurement of acceptability
5.6.2.1 Measurement of consumption
Both average and daily consumption measurements were above the threshold (P<0.001;
Table 18) for SMS‐RUTFh, confirming that: all the patients consumed more than 75 per cent
of SMS‐RUTFh within an hour (criterion 1.1); that acceptable consumption occurred on
more than 75 per cent of the trial days (criterion 1.2); and its energy intake was higher than
75 per cent of the P‐RUTF intake in the two groups combined (P<0.001) (criterion 1.3).
A linear regression model (robust standard‐error, 40‐cluster analysis; R2= 0.11; P=0.01;
N=779) showed that the difference between the energy intakes of the two products (SMS‐
RUTFh and P‐RUTF) was not statistically significant (P=0.06) when adjusted for confounders
identified by a stepwise analysis (initial BMI, negatively correlated with energy intake,
P=0.002; presence of throat sores, negatively correlated, P=0.13; 9 subjects out of 41
reported presence of throat sores).
Other potential confounders, which showed no or very small influence in the explored
model and were not included, were age, and days of diarrhoea, nausea, and flatulence.
However, the statistical power of the available sample size was likely to be relatively small.
5.6.2.2 Evaluation of possible morbidity effects
Most types of morbidity did not differ according to product consumption Table 19. Also, the
average number of days with reported nausea and vomiting in participants consuming SMS‐
RUTFh was low (0.16 and 0.04 days of illness; 381 repeated daily measures).
However when applying robust standard error analysis, the data showed that these
morbidities were significantly more frequent than when subjects were consuming P‐RUTF
(0.09 vs. 0.02; 398 repeated measures; P=0.04 and 0.03). Nausea or vomiting never
occurred for more than three consecutive days.
5.6.2.3 Measurement of patient’s preference
Results from the fortnightly interviews indicated higher scores for general preference, taste
and sweetness for SMS‐RUTFh (criterion 3.1, 3.3 and 3.4; P<0.001; Table 20), whereas no
product was preferred in terms of colour (criterion 3.2). SMS‐RUTFh texture was less
preferred than the control (criterion 3.5; p=0.02).

172
At the end of the trial, the analysis of the combined sample (n=41) showed there was no
difference in preference (criterion 3.6) between products (P=0.8). SMS‐RUTFh and P‐RUTF
were preferred respectively by 52 per cent (95%CI: 36; 69) and 48 per cent (32; 64) of the
participants. However, for most patients, the preferred product was the one allocated to
them in the first phase of the trial. For participants starting phase 1 with product A, the
odds to prefer product A were 5.4 times (95% CI, 1.4‐20.4) higher than for participants
starting product A in phase 2 (P=0.02).
The two focus groups organized on the last day supported the findings from the
quantitative data and also suggested that “SMS‐RUTFh texture needed to be refined”, while
“P‐RUTF tasted salty” and “provoked more cases of flatulence”. Moreover the patients were
“not happy about changing the product from phase 1 to 2, once they had got accustomed
to the first provided product”, but felt that “the products were increasing weight” and
physical “strength”, and “reducing hunger feelings”. No morbidity event was mentioned
during the focus groups.
Table 18 ‐ Product consumption in the two combined groups (N1=20; N2=21).
RUTF consumption*
SMS‐RUTFh (n=381)
P‐RUTF (n=398) Threshold
P Value†
P Value‡
A B C1.1: Average consumption, g/d (95%CI)
232.5 (218.9; 246.1)
243.0 (230.9; 255.0)
187.5§ <0.001 <0.001
C1.2: Daily consumption¶, % (95%CI)
86.1 (78.8; 93.4)
87.7 (81.4; 94.0)
75.0 <0.001 <0.001
C1.3: Comparative energy intake: kcal intake/kg body wt/d
(95%CI)
22.7 (19.5; 25.9)
24.5 (22.9; 26.0)
18.4 (17.2; 19.5)**
<0.001 <0.001
* Least square means and 95% confidence intervals. † P value between SMS‐RUTFh and threshold. ‡ P value between P‐RUTF and threshold. § The threshold is 0.75 times the 250 g initially provided. ¶Per centage of days with consumption higher than 75% of the provided amount (250 g)
** The thresholds are 0.75 times the P‐RUTF figures.

173
Table 19 ‐ Safety criteria using 24‐hour morbidity recall in combined groups (N1=20; N2=21).
Criteria Number of days*
during which morbidity events occurred P value
SMS‐RUTFh(n=381)
P‐RUTF(n‐398)
A B C2.1: Nausea 0.16 (0.05; 0.47) 0.09 (0.05; 0.14) 0.04 C2.2: Vomit 0.04 (0.01; 0.19) 0.02 (0.01; 0.04) 0.03 C2.3: Stomach pain 0.14 (0.05; 0.38) 0.16 (0.10; 0.25) NS C2.4: Flatulence 0.13 (0.05; 0.36) 0.16 (0.09; 0.26) NS C2.5: Diarrhoea 0.36 (0.03; 0.70) 0.31 (0.13; 0.49) NS *Least square mean and 95% confidence interval. NS: non significant.
Table 20 ‐ Criteria for food preference (Likert score type; 5‐items) in the two groups (N1=20; N2=21), expressed on the last days of phase 1 and 2 of the trial.
Criteria SMS‐RUTFh* P‐RUTF* P value
(n=39) (n=41)
C3.1: General preference
Median (IQR) 1 (1;2) 2 (2; 3) <0.001 Mean (95%CI) 1.4 (1.2; 1.5) 2.4 (2.1; 2.8)
C3.2: Colour
Median (IQR) 2 (1; 3) 2 (1; 3) NS Mean (95%CI) 2.0 (1.6; 2.4) 2.1 (1.7; 2.4)
C3.3: Taste
Median (IQR) 1 (1; 2) 3 (2; 4) <0.001 Mean (95%CI) 1.5 (1.3; 1.8) 2.7 (2.3; 3.1)
C3.4: Sweetness
Median (IQR) 1 (1; 2) 3 (2; 4) <0.001 Mean (95%CI) 1.7 (1.3; 2.0) 2.3 (2.5; 3.3)
C3.5: Texture
Median (IQR) 2 (1; 4) 2 (1; 2) 0.02 Mean (95%CI) 2.3 (1.8; 2.7) 1.7 (1.4; 1.9)
* The scores range was from 1 (very good) to 5 (very bad). NS: non significant.

174
5.7 Discussion
The present study demonstrated that most pre‐stated criteria for acceptability of a novel
RUF were satisfied, confirmed the utility of the proposed method and, at the same time,
illustrated lessons that will contribute to improving future trials of a similar kind.
5.7.1 The acceptability of SMS‐RUTFh
The findings of this study suggest that, in this participant group, SMS‐RUTFh intake was
adequate, and it was preferred in some regards to the current standard product. The
patients could consume most of the trial product provided throughout the study, exceeding
the selected threshold for adequate energy intake based on the control RUTF.
In spite of the higher (8%) energy density of P‐RUTF, the energy intakes of the two products
were statistically similar when adjusted for possible confounders; but the study might be
underpowered to highlight a difference. Among the identified confounders, it can be
speculated that throat sores reduce the swallowing‐capacity of the patients.
The qualitative study on the compliance of the use of P‐RUTF, theme of chapter 3, achieved
a similar conclusion. In SAM patients, cases of swallowing difficulty, need to be detected
early by medical staff, and ideally addressed with appropriate in‐patient care using
therapeutic milk formulas (F75 and F100)70. As soon as the swallowing capacity is restored,
generally in a few days, RUTF‐based nutrition can be started and home‐based care
established.
The regression analysis found no evidence of increased morbidity associated with SMS‐
RUTFh consumption for most parameters. Although the frequencies of nausea and
vomiting were higher in SMS‐RUTFh than in the control product, they never affected
participants for a prolonged period, and days of illness appeared to be randomly scattered
along the time course of the trial. The regression models showed that the two co‐
morbidities were not associated with a decreased energy intake. This suggests that the
cause(s) might be due to chance or unknown factors, but that these and other events need
close monitoring during any future clinical trial.

175
The score for general preference was higher for SMS‐RUTFh and its taste and sweetness
were also preferred. However, its texture was less liked than P‐RUTF, and this suggested the
need for improved industrial processing to enhance the SMS‐RUTFh consistency.
The order the RUTFs were offered to the participants was important. SMS‐RUTFh
consumption increased or decreased, according to whether it was provided as the first or
second product. That might be because it was difficult for participants to adapt to a novel
product once they are accustomed to the previous one.
Some constraints were highlighted. The participants of the trial were enrolled in the
MoH/MSF HIV programme and had all been exposed to P‐RUTF. Information of this kind,
acquired prior to direct experience, could have shaped the food consumption and
preferences as suggested by Costell et al. 300.
5.7.2 Lesson learnt about the method
This study highlighted important aspects in the application of methods to assess RUF
acceptability. Among these, the results confirmed that a combination of both quantitative
and qualitative measures is needed to capture the complex of factors influencing
acceptability. The carry over effect analysis, recommended in crossover studies324, showed
that the wash‐out period (one week) was adequate and might be reduced for future trials.
The sample size (n=41) compares favourably with an Indian study, whose sample size was
powered for a difference of at least one standard deviation. Determining the equivalence or
non‐inferiority of SMS‐RUTFh to the current standard product, rather than its statistical
superiority to pre‐stated thresholds, represents an alternative study design used to robustly
validate a novel therapy 325, but requires a large sample size 326. Other randomized trials
71,116,321, comparing RUTF with alternative food‐based therapies, did not apply these
methods. It is also important to note that the method described here is designed to be used
in conducting an acceptability trial that precedes a RCT of clinical efficacy.
The study had some constraints. Ten days of RUTF intake, in each phase of our study, might
have been too short to simulate the nutrition rehabilitation therapy in wasted adults (3
months; MSF/Kenya, personal communication, 2008). The main use of RUTF is in out‐
patient and exclusive feeding programmes. The study patients, instead, had access to the
RUTF during only one daily meal, far from their households, while they were observed by

176
the research staff.
The SMS‐RUTF did not contain the micronutrients premix, which might alter the final taste
of the product and the findings of the trial. A taste comparison between RUTF with and
without premix therefore must be carried out in order to confirm these acceptability
results.
Aflatoxin is a global public health concern327–329. RUTF’s containing peanuts in particular, but
also other legumes and cereals, are potential carriers of this toxin. Therefore, they can
increase the risk associated with morbidities. Safe limits of aflatoxin level intakes are still
surrounded by a global debate. In spite, our study did not account for this health issue,
creation of evidence in this area is in urgently needed.
5.8 Conclusion
There is no “gold standard” to test food acceptability. In spite of such a constraint, this
exploratory study demonstrated the utility of this method and the acceptability of a novel,
locally produced, RUTF. Its safety, mainly from the points of view of nausea and vomit,
should be carefully monitored during the following clinical trial. Lessons about the method
were learnt from the implementation of the study and they should contribute to improving
future trials.

256
7 General discussion and implications

257
This research described an innovative method to design and pre‐test improved and cost‐
effective RUF spreads, prior to subsequent clinical trialling. A case study was used to
identify the strengths and the weaknesses of this method. This work was varied out with
the overall goal of improving the performance of community‐based, humanitarian feeding
programmes.
As documented in the first part of this thesis, undernutrition, in all its sub‐forms, is still a
worldwide morbidity and mortality risk factor both for children1 and for adults45. Its
consequences, notably the physiological and psychological impairment of its victims, are
often among the main causes of reduced survival. Eight decades of medical and nutrition
research (section 1.2.1) has led to improved dietary solutions in low‐resources settings,
based on lipid‐based, ready‐to‐use food products described in section 1.3. Section 1.4
detailed how the lack of a framework to design and validate improved and, potentially,
cheaper formulations is currently limiting the global scale‐up of their production and use,
despite funding being available 40.
The method described in this thesis proposes an evidence‐based framework for the pre‐
clinical product design and validation. The following sections discuss the key findings of the
proposed new approach, highlight the potential implications for interested policy‐makers,
donors, public health practitioners, and food technologists, list areas for further research,
and explores the limitations encountered.
7.1 Key findings
Based on the results reported and discussed in detail in the previous chapters, I describe
here the main key findings observed in the application of the proposed method to the
chosen study group. The study group consisted of adult patients, suffering from HIV
wasting.
First, I tested a method to explore the adherence of the study group to the current nutrition
rehabilitation therapy, and the key barriers to compliance. The application of the qualitative
method, in a HIV programme in Kenya, found a low level of reported adherence to the
prescribed dose of P‐RUTF. Other important findings suggested that an improved approach
to treating malnourished HIV‐positive adults must consider strategies to support patients
without a caregiver; that the current product (P‐RUTF) must be more suited to adult taste;

258
that specific dietetic training for health staff is needed; and that liquid therapeutic foods
(F75 and/or F100) must be provided to severely ill patients, unable to swallow.
Secondly, I tested a method to formulate and improve RUF products. The method, based on
linear programming, formulated a RUTF which was three to five times cheaper than the
current standard, based on locally processed foods (soy, maize, sorghum, among other
ingredients), regionally available, and met local cultural and taste preferences of the study
group. The formulation, called SMS‐RUTFh, met also the macronutrient requirements in the
rehabilitation of both wasted adults and children.
Subsequently, I tested a method to confirm the acceptability and the safety of the novel
RUTF spread. A randomized, semi‐blinded, controlled, crossover trial found that the SMS‐
RUTFh appears to be acceptable, and can be safely clinically trialled, if close monitoring of
vomiting and nausea is included.
Lastly, micronutrient requirements for the treatment of HIV wasting in association with
active TB are currently not available. Therefore, I developed an evidence based method to
propose RUTF micronutrient specifications for the considered study group.
7.1.1 The framework
Based on the outcomes of my thesis, I developed a framework that summarizes the entire
process to develop, pre‐test and clinically trial novel RUF products. The clinical trialling is
not part of the aim of this thesis. However, for reasons of completeness, it was included in
the framework described in Figure 29. Furthermore, a complete clinical protocol was
designed in collaboration with MSF/Netherlands to trial the RUF developed in my case
study.
In my framework, the design and the pre‐testing were organized in a sequence of three
phases or process stages. The results of each phase formed the basis for the subsequent
phase. In Figure 29, the outputs of phases A, B and C were respectively (i) the set‐up of all
the parameters to insert into the LP model, (ii) the optimized theoretical LP formulation,
and (iii) a prototype tested for its acceptability and safety, which includes the micronutrient
premix. The three phases were based on one, or more, sub‐studies of this thesis, and they
are described in the following sections.

259
Figure 29 –A design and validation framework for novel RUF.
IDENTIFYRUF target group
IDENTIFYCommodities and
prices
SELECTFood composition
data bases
DEFINELinear Programming (LP)
elements
(type of malnutrition, age group, geographical area, etc.)
SET UPComposition and prices
spread sheetfor 100 g foods
(objective function, decision variables, mathematical
linear constraints)
SET UP and RUNLP spread sheet
OPTIMIZEDFormulation
PRODUCESmall amount of product
RUNSensitivity Analysis
CHECKTexture parameters
CROSSCHECKMacro-nutrients
with laboratory analysis
UNDERTAKEAcceptability and safety
trials
DESIGNMicro-nutrient premix
COMPLETEFormulation
UNDERTAKEClinical trial
TRIALLEDformulation
Phase B
Phase A
Phase C
Phase D
Without premix in the formulation
With premix in the formulation
No
Yes
OK?
MICRONUTRIENTREQUIREMENTS
are available
Yes No
DETERMINEMicro-nutrient specs

260
7.1.1.1 Phase A
In stage A of the framework, the group to be rehabilitated by the RUF spread in a
hypothetical nutrition intervention is defined. On these bases, the requirements of the
improved product are then set.
Sub‐study 1 proposed and tested a method to identify what improvements to the product
may be required, from the perspective of the consumers. The same study also offered
important insights into the barriers limiting RUF adherence from a programme‐based point
of view. However, the latter are intervention‐specific, and therefore do not appear in the
flow chart in Figure 29.
In phase A the potential food ingredients are identified, along with data on the
macronutrient composition and price, which were compiled to set up the LP model. This
operation is undertaken in phase B of the framework.
7.1.1.2 Phase B
The objective of phase B of the framework is the optimization of the RUF formulation. The
method discussed in the sub‐study 2 suggested one of the possible ways to pre‐set the
decision variables, the constraints, and the objective function in the LP model. Some of the
LP constraints consist of the demands raised by the RUF users.
The optimal formulation identified by the LP model is theoretical. Its limitations were
discussed in depth in sub‐study 2. Its conclusions suggested that the quality of existing data
for the macronutrient composition of the food ingredients may be inadequate. Therefore,
comparing the estimated nutrients in the LP model with those measured in the prototype
was one of the main aims of phase C.
7.1.1.3 Phase C
Phase C of the framework has three objectives:
To ensure that the LP‐based prototype meets the pre‐set macronutrient
requirements (method discussed in sub‐study 2);
To test, in as controlled trial, the level of acceptability and safety of the LP‐based
prototype (sub‐study 3);

261
To ensure that the density of the micronutrients meet the specifications in the final
RUF; when their requirements are not available, these must be separately
determined (sub‐study 4)
In the LP‐based prototype, the macronutrients must be as close as possible to the
requirements pre‐determined for the target group. Therefore, the prototype
macronutrients were analysed in a laboratory specializing in food analysis.
In our case study, the prototype macronutrients were found to be within the acceptable
pre‐set range. However, if this had not been the case, the sensitivity analysis tool, described
in the same sub‐study, could have helped to identify how to improve the LP model settings,
if necessary by relaxing some of the constraints and re‐running the LP model. In the
algorithm on Figure 29, the dotted arrow describes this path. The macronutrients in the
second optimized formulation would have been re‐tested as an additional check.
The texture parameters, described in sub‐study 2, also need to be assessed. In our case
study, the texture met the pre‐set standards. However, if this had not been the case, the LP
sensitivity analysis tool could also have helped here.
Once both the macronutrients and the texture were considered satisfactory, the prototype
acceptability and its safety had to be confirmed. They were compared in a crossover‐
controlled trial in which two groups alternately received the prototype (intervention; SMS‐
RUTFh) and the current most frequently used product (control; P‐RUTF). The strengths and
weaknesses of this study design were discussed in sub‐study 3. In our case, the level of
acceptability and safety were found to be sufficiently high for the optimized formulation.
The RUF product is ready to be clinically trialled only when its micronutrient densities meet
the pre‐set requirements for the target group. When these are known, a premix can be
designed.
However, the micronutrient requirements may not be available. In this case, sub‐study 4
suggested a method to determine the specifications of the final formulation for the RUF.
Those are based on relevant clinical trials, or their systematic reviews, enrolling study
participants, whose characteristics and form of malnutrition are as close as possible to the

262
target group for the improved RUF spread. In our case study, twenty‐three micronutrient
specifications were proposed. The limitations of the described method are case‐specific,
and the sub‐study 4 discusses them in depth.
Once mixed with the optimized formulation prototype, micronutrient fortificant powders
may change the final taste of the RUF. For this reason, before proceeding with clinical
trialling, a sensory analysis should be undertaken. If taste‐related issues arise, alternative
chemical forms that are commercially available, should be identified in consultation with
the premix supplier.

263
Figure 30 ‐ Quality Functional Deployment model for the design of an improved ready‐to‐use therapeutic food to rehabilitate wasted adults living with HIV and/or with TB.
7.1.2 The Quality Functional Deployment model
In the development of the design and validation framework described above, I was guided
by existing models and frameworks that are currently in industry. One of the these is the
Quality Functional Deployment Model (QFD) approach, which is widely used to improve
both food and non‐food industrial product design 461. The following sections describe how
the QFD informed the development of the framework described above.
As described in the literature 462,463, the “QFD house” contains, in sequence, three elements
called WHATs, TARGETs and HOWs (Figure 30).
In the section called WHAT, the product users inform the designer about what to improve in
the current standard RUTF (Figure 30). Based on the sub‐study 1, wasted adults, caretakers

264
and health staff members expressed the need for RUTF “to increase body strength and
weight”, for a decreased sweetness and for a texture making swallowing easy. The WHAT
section also included other elements. Among the agencies endorsing, supplying and
delivering RUTF to HIV/TB wasted adults, there is a demand for an increase in survival and
recovery rates. The product should be also safe and cheaper than the current formulation,
possibly formulated with locally available ingredients, which, therefore, may better meet
the patients’ taste and preferences.
For each element, reported in the WHAT section, I identified specific quantitative
objectives, which are included in the TARGETS section of Figure 30. These included meeting
pre‐set palatability (sugar 15‐18%; sorghum >7 g/100 g) and UN 2007 macronutrient
requirements. Nonetheless, in the comparison with the current standard, the product had
to comply with a lower cost (USD/kg), a texture based on a fat content of 28‐36 per cent, an
equivalent or higher consumption or preference rate, and an equivalent or inferior co‐
morbidity event incidence. In the study group, based on the available literature, I assumed
that improved micronutrient specifications would lead to a reduction of side‐effects in
adults taking TB drugs, and an increase in survival and recovery rates. Therefore, the related
TARGET, in the lack of micronutrient requirements, consisted in determining product
specifications, set on robust scientific evidence.
In the following step, I identified ways (called HOWs in the QFD approach) to achieve each
TARGET (see in Figure 30). For this purpose, during the formulation phase, I proposed to
decrease the sugar level, introduce sorghum, and optimize the combination of cheaper, but
nutritious ingredients in order to meet pre‐set requirements of macronutrients and texture.
To confirm the increase, decrease or equivalence of the pre‐set TARGETS based on the
current standard (P‐RUTF), I compared the latter with the novel formulation, which were
given to, respectively, a control and an intervention study groups. In the absence of
micronutrient requirements for the target group, I developed a method, based on robust
scientific evidence, in order to achieve improved RUTF specifications.
In the “QFD roof” (Figure 30), I identified which activities, from the HOW area, could be
clustered for convenience. The HOW activities were grouped into the sub‐studies 2, 3 and 4.
That was done because the linear programming sub‐study could simultaneously tackle the
choice of the ingredients, their constrained formulation, and the improvement of the
ultimate RUTF taste. The sub‐study no. 3 (cross‐over trial), contained study activities related

265
Table 27 ‐ Definitions of internal and external validity, applicability and transferability.
Term Definition
Internal validity The likelihood that study results are valid for the original study population.
External validity The likelihood that study findings could be generalized to other (unspecified or more general) samples or settings
Applicability The likelihood that an intervention could be implemented in a new, specific setting
Transferability The likelihood that the study findings could be replicated in a new, specific setting (i.e. that its effectiveness would remain the same)
Source: definition reported by Dekkers et al. 486, and Burchett et al. 466. Some definitions were adapted from 487–489.
to comparisons of consumption, preference and safety in the two products. Only the
determination of micronutrient specifications required a separate study activity (sub‐study
no. 4).
According to a well implemented QFD approach, each element‐for‐improvement, expressed
initially in the WHAT section, must have a correspondent activity (HOW). This can be
verified in the central area of the QFD matrix (Figure 30), where each WHAT must have at
least one intersection with at least one HOW. The intersection is symbolized by a cross (“+”).
Rows, or columns, without a cross would suggest respectively that the final matrix failed to
achieve one improvement, or that one study activity was not needed. In my study case, the
proposed QFD met all the pre‐set improvement goals, and all the activities were
consistently object‐driven.
For the purposes of this thesis research, the QFD approach, summarised in Figure 2,
represented an efficient tool for planning purposes. The QFD matrix suggested an ideal
sequence of steps to take in order to design and pre‐test novel RUF formulations, allowing
efficient grouping of the needed activities, therefore, limiting any waste of resources.
However, I considered the illustration tool in Figure 29 more appropriate and user‐friendly
than QFD (Figure 30), in describing the final design and validation process of RUF products.
7.2 Generalizability of the findings
7.2.1 Criteria to define the generalizability of the findings in public health
research
In addition to the case study presented in this thesis, the proposed design and validation
framework may contribute to
improve the design of other
types of RUF products. It is
hoped that these may be used
to rehabilitate and/or prevent
forms of malnutrition, in
settings, and in life‐stage
groups which differ from the
ones described here.
However, prior to this, the

266
generalizability of any innovative method must be proved, before decision makers and
donors can endorse it.
In public health, the definition of generalizability, and the criteria to measure it, are a
current concern 464–467, because of their complexity. The literature reports at least four
terms associated with the concept of generalizability (see in Table 27). Those include
internal and external validity, applicability and transferability.
The internal and external validity is the likelihood that study results may be valid
respectively only within the original study population, or in any other setting. A study
intervention can be considered “applicable” when its results are valid in a limited number of
different settings. Moreover, study findings are “transferable” when their effectiveness level
does not change, if replicated in another setting.
The method proposed was tested only in on one study group and in one setting. However,
encouraged by the results encountered in this thesis, I have applied the proposed method
in other world regions and study populations. In most cases, the purpose came from
implementing agencies, and their urgent demand for improved formulation solutions. The
outputs consisted of the design and the pre‐testing of novel RUF spread formulations,
designed for other forms of malnutrition, and targeting other age groups and geographical
settings. Although not driven by the same research goal, the application of the method
proposed in this thesis is this way is helping to define the level of “applicability” or
“transferability” of its results to other contexts.
For this reason the following section summarizes the experiences gained from
implementing the developed framework in other settings.
7.2.2 Experiences in implementing the developed framework in other
settings
In Sri Lanka in 2009, in in collaboration with the local Medical Research Council, and with
funds from Irish Aid, a formulation based on soy, rice, milk powder and lentils was designed,
and its acceptability and safety pre‐trialled among children from a slum in Colombo. The
research protocol followed the methods described in sub‐study numbers 3 and 4 of this
thesis. However, the control products were both Plumpy’nut and BP‐100. The collected data
showed that the criteria for consumption, safety and preference met the minimum
parameters 144. Furthermore, both the novel formulation and Plumpy'nut® showed a similar

267
weight gain, significantly superior to the one found when providing BP100. The limitations
of the study were no different to those observed in sub‐studies 2 and 3 of this thesis. At the
current moment, the formulation is to be tested for its effectiveness in Bangladesh by an
international NGO. More information about the design and the pre‐testing study are
available in a published paper, available in annexes.
In 2010, in Vietnam, in collaboration with the national Nutrition Institute, a formulation
based on soy, rice, mung beans and milk powder was designed based on the findings from
sub‐study number 2. The formulation is currently being tested for its acceptability, safety
and effectiveness by other research institutions.
Five formulations were designed for the sub‐Saharan African region, but for forms of
malnutrition different from the one of my case study.
One RUCF spread contained sorghum and maize, while a second also included milk
powder and sorghum. In 2012, the findings comparing the latter with a fortified
porridge were reported in a peer‐reviewed journal 234 (the paper is available in
annexes). No difference was noticed in terms of preventing stunting between the
intervention and the control groups. A side‐study based on the same formulations
and on the deuterium‐dose‐to‐the‐mother dilution technique showed no reduction
in breast‐milk intake associated with the RUCF 106.
Whey protein concentrate (WPC) is cheaper than milk powder. Two forms of WPC
(34, and 80% protein content) were tested for replacing milk powder in three RUTF
formulations, in Zambia. One of these (whey protein at 80%) was based on maize,
soy and sorghum, whereas the other two contained peanut butter (whey protein at
34 and 80% respectively). Their prototypes are currently being tested.
One SMS‐RUTF was trialled in wasted Zambian children. It contained the food
ingredients of the product described in this thesis, and met the pre‐set
macronutrient specifications of UN 2007 for RUTF. The acceptability of the product
was reported in a peer‐reviewed paper 146. The findings from its effectiveness trial
are still to be released.

268
7.2.3 Conclusions about the generalizability of the framework
In spite of the successful application of the proposed method in at least six study
populations and settings, the generalizability of the framework cannot be taken for granted.
This is because these studies were not purposively designed to measure its level of
replication. Furthermore, there is limited consensus about the criteria to use to determine
the level of study generalizability 464–467.
However, it can be argued that the applicability of the proposed method seems to be
promising, at least in the regions and for the groups where the proposed framework to
improve the current RUF spreads was applied.
7.3 Implications of this study
Potentially, the findings of this thesis have direct implications for institutions in both the
public and private sectors.
As described in section 1.3.3, in the public sector, policy makers, donors, and humanitarian
agencies have voiced the urgent need for a framework to design and validate improved and
cheaper RUF formulations. Moreover, their recommendations for further research
coincided with the identified knowledge gaps tackled in this thesis. Since the applicability of
our findings was documented, representatives from the public sector may consider
endorsing versions of the proposed design and validation framework.
In the private sector, there may be demand for the proposed framework among global and
local food manufacturers at different levels and scales. In 2012, the manufacturers qualified
to distribute RUTF, based on the UNICEF Supply Division requirements, were nineteen 94
and “expected to increase in the coming years, especially in countries where RUTF is used”
94. The World Bank expects these firms to be fuelled by economic sources including
“government finances, private sector corporations, and international financial aid” 40.
However, the proposed framework will become a successful practice only if “the
development, evaluation, and promotion of these foods are at the interface of private and
public interests” 269.
7.4 Acknowledgement of limitations
The method described here showed some limitations.

269
In the sub‐study 1, which looked at the HIV positive patients’ adherence within a RUF‐based
nutrition rehabilitation programme, clinical information about the patients could not be
collected. This may have helped in understanding the impact of RUF‐based approach in
presence of household/community sharing, food mixing, lack of counselling, and clinical
difficulties in swallowing.
The sub‐study 2 described the application of a mathematical model approach to formulate
an improved RUF product. Although the proposed approach achieved its goal with one
constraint adjustment, the economic aspects of the choice of the ingredients, the impact of
using alternative food composition databases and the advantages of more complex
mathematical models may have improved the proposed approach. In particular, future
models should include maximum level constraints of anti‐nutritional factors, or minimum
levels of dairy product derivates.
In the sub‐study 3, which described a method for trialling the acceptability and safety of a
novel RUF formulation, the conclusions may have been limited by the relatively short
duration of the study, by only one‐meal observation per day, and by the fact that the study
participants may not be representative of the future RUTF beneficiary group, because they
were not malnourished.
Furthermore, in the proposed method framework, the RUF spread does not contain the
micronutrient premix, because the premix is designed and procured on the basis of a
formulation already proved acceptable. This means that the proposed framework fails to
test whether the presence of the premix negatively influences the preference and the
consumption of the improved product.
The sub‐study 4 described the development of a method for determining the micronutrient
specifications for a RUF‐based supplement. However, the evidence used to determine the
specifications were based on studies which were heterogeneous. Therefore, the compiling
of the results has been challenging. In view of this, the validity of the method must be
confirmed.
The overall method described in this thesis is consistent with the use of the QFD model,
which also showed some limitations. For instance, QFD does not address the fact that food
“raw materials show a natural predisposition for variation” which does not tally with the

270
somewhat inflexible character of QFD charts regarding changes 462,468. This same problem
was confirmed, in section 4.9, by the limitations of the food composition databases used to
optimize the LP model. Furthermore, QFD does not capture the interactions among the
attributes listed by the consumers, limiting the potentiality of the method.
7.5 Recommendations for further research
The proposed method raises many questions for several areas of further research. The
following sections list them, describing their importance.
7.5.1 Quality standards
Research question – how should the current safety standards be improved for RUF spreads,
in view of the higher morbidity and mortality risks of the consumers?
As described in section 1.4, standards for RUF to guide the manufacturers’ activities
are currently missing. So far, agencies like MSF and UNICEF have relied on the
current practice codes designed by Codex Alimentarius for children’s food products
formulated, processed and packaged for the western market. However, the settings
and the consumers of RUF spreads may be different and often inapplicable from the
point of view of the current standards. Therefore, a tailored approach may be
needed. Among the most urgent specifications required are protocols to determine
the shelf life of these products, and of their micronutrients, taking into account the
extreme conditions (i.e. temperature, transport, etc.) of the humanitarian food
supply chain.
Research question – how can field‐based, quick and reliable quality tests (microbiological
and chemical) be developed to ensure the efficacy and the safety of RUF products?
In wasted people, the adequate concentration of micronutrients is crucial to
achieve nutritional rehabilitation and increase survival 28. Microbiological safety is a
great concern in the target populations, because RUF is consumed without cooking.
Bacterial contamination, harmless in healthy people can be fatal in wasted human
beings.
However, food quality laboratories in developing countries have a limited capacity
to perform both these kinds of analysis. This was confirmed by a recent study

271
looking at the development of one RUF spread in Africa 146. Quick, cheap, and
portable tests should therefore be urgently designed and produced to allow
operators in the field to check on the RUF safety before its delivery. They should
come with acceptable ranges for each key nutrient of the RUF product.
7.5.2 Optimization of micronutrient absorption, digestibility, processing,
and packaging
Research question – in wasted people, what is the true level of absorption of micronutrients
from RUF premixes?
In undernutrition research, little is known about the real level of micronutrient
absorption. This might be because the research methods for this kind of study are
costly and complex to implement 469. This last issue may present an additional
challenge in low‐resource settings. In the available literature, some authors 28,174
suggest lists of chemical forms for most micronutrients to be included in foods used
in feeding programmes. However, their absorption ratio remains undocumented.
This matters for each micronutrient. Studies identifying the optimal chemical form
for both type I and II micronutrients for RUF formulation are urgently needed in
order to optimize their absorption.
Research question – can the digestibility of RUF products be monitored and, if needed,
increased?
Little is known about the current level of digestibility in undernourished patients,
when fed with RUF products. UNICEF Supply Division and MSF consider food aid
plant‐based items digestible when their level of pre‐gelatinized carbohydrate is at
least 80 per cent. In low‐income countries, the choice of technologies to gelatinize
the starch, in flours with cereals and legumes, are limited and often expensive.
Our study suggested that extrusion was ideal in the considered study case setting.
However, nausea and vomiting were more frequent in association with RUTF
containing extruded soy, maize, sorghum rather than milk powder and roasted
peanut in not wasted adults.

272
In general, little is known about the implications of processing technologies on the
digestibility in undernourished people. Only one study was found looking at
digestibility improvement using different techniques to process food aid items. This
study 285 compared the starch digestibility of a blended corn‐soy flour mix, prepared
with and without extrusion cooking. The study was conducted in eight healthy
volunteers, using 13C enrichment of breath samples for 8 hours, measuring breath
H2 concentration during 12 hours to assess bacterial fermentation in the colon, and
asking the volunteers to report hunger on a visual scale during eight hours at
intervals of four hours. The conclusions suggested that extrusion did not seem to
substantially improve blended foods digestibility and may promote carbohydrate
fermentation in the colon and increase satiety.
However, other techniques, such as infra‐red or micronization, that exist in some
low‐income countries and may be used in combination with extrusion, may provide
cost‐effective solutions to improve digestibility of RUF. Endorsed protocols are
urgently needed to assess digestibility of RUF in the undernourished.
Research question – which context‐specific options can be developed for the processing and
packaging of RUF so as to extend shelf life?
Section 1.3 reported how RUF production is getting closer to the areas where it is
used. This approach has implications for the final RUF costs. Beside the ingredients
and transport, the processing and the packaging are the most expensive steps, and
they influence the product shelf life. With nitrogen‐flush packaging, for instance,
the spread can be safely consumed after two years from the production 470.
However, the machinery needed “is the most expensive component of a RUTF
production line” and, RUF spreads packed with non‐airtight sachets will need to be
consumed within a few months, limiting their utility 470. This is an additional
challenge “when storage and transportation are unpredictable” 470. There is,
therefore, a demand for the development of appropriate technical solutions.
7.5.3 Cost‐effectiveness analysis
Research question – what are the criteria to assess the cost‐effectiveness of improved RUF
formulations?

273
The findings from cost‐effectiveness analyses may better guide health and nutrition
policies and practices. This is because “the ratio of net health‐care costs to net
health benefits provides an index by which priorities may be set” 471. Cost‐
effectiveness was only found described in a few studies, which were limited to one
type of RUTF 472–474 and focused on the programme rather than the product. It can
be speculated that with a proliferation of formulations, the economic perspective
will assume increasing importance. However, at present no internationally
endorsed cost‐effectiveness method is available to support decisions on which RUF
formulations to use in feeding programmes.
7.5.4 Use of probiotics, prebiotics or synbiotics in RUF
Research question – is there any benefit in adding probiotics, prebiotics or synbiotics to RUF
spreads destined for wasted HIV positive people?
Conflicting evidence surrounds the use of probiotics, prebiotics and synbiotics.
Recently, Cunnigham et al. 475 report increasing evidence that “probiotics bacteria may
stabilize CD4 cell numbers in HIV‐1 infected children and are likely to have
protective effects against inflammation and chronic immune activation of the
gastrointestinal immune system”. In most studies, probiotics and their derivates were
mostly provided in liquid‐based food carriers. When offered to the consumer in a RUF
spread, the results were less positive. Kerac et al. 152,476 report that in an African, HIV‐
prevalent setting, a specific type of synbiotics “did not improve severe acute
malnutrition outcomes”. However, the same study highlights that a “subgroup analysis
showed possible trends towards reduced outpatient mortality in the symbiotic group”.
The authors suggest that this “might be caused by bias, confounding, or chance, but is
biologically plausible, has potential for public health impact, and should be explored in
future studies”.
The commercial strains and genetic types of pro‐, pre‐ and synbiotics available on the
market are many. It can be speculated that some strains may be more vital and effective
than others in the RUF food matrix. Their vitality may also vary during the shelf life of
the RUF, and the adequate dose needed is not known. Further studies are required to
investigate their efficacy and effectiveness.

274
7.5.5 Legal definition and protection
Research question – how to define RUF products from the legal point of view?
Categories of foods are described by international organizations to ease
transnational trade operations. Today, RUF products are global products with an
increasing regional consumption among vulnerable people in low‐resource settings.
However, RUF items do not yet benefit from a formal legal recognition framework,
and no legal definition of RUF is currently available. Section 1.3.1.1 of this thesis
identified some common elements between the definition of RUF and functional
foods. However, further research in this area is urgently needed, and should include
the implications for future policy and practice.
Research question – what policies and practices are necessary to legally protect RUF
formulations in view of its urgent humanitarian use?
According to the available evidence, the patenting of RUF products seems to delay their
availability on the market, thereby limiting the rehabilitation of people in need. The
impact of this approach was not documented sufficiently and possible alternatives need
to be further explored. However, new legal forms aiming to protect innovations, while
guaranteeing their open‐access, are currently being developed. Pre‐agreed Licensing,
like the one between Valid Nutrition and Nutriset, is a promising example, but more
comprehensive legal solutions to ensure prompt and wide geographical disposal of RUF
are crucial.
Recently, the number of scientific publications filling current knowledge gaps about the use
of RUF in treating and preventing undernutrition has increased. Based on the literature477,478
published before this thesis submission, the list of research questions for the development
of improved RUF products should include:
How to determine the micronutrients specifications taking into account the phytate
contents of the RUF ingredients?
How to measure the risk of aflatoxin‐based morbidities associated to RUF products?
What is the minimum amount of expensive ingredients (e.g. milk powder) in RUF

275
products to achieve still cost‐effectiveness?
What are the risks and the strengths of RUF‐based interventions in contexts
presenting nutrition in transition?
7.6 Summary of the main conclusions
This thesis designed and pre‐tested an innovative method to improve cost‐effective RUF
spreads for the prevention or treatment of undernutrition, prior to subsequent clinical
trialling.
The proposed method was:
a. tested on a case‐study, which consisted of the design of a low‐cost, acceptable and
safe RUTF, specific for wasted adults, living with HIV with (or without) active TB;
b. unpacked into four sequential sub‐studies:
Sub‐study 1 concluded that the level of reported compliance with the
prescribed dose of the current standard RUTF was low. Based on the
collected evidence, an improved approach to treating malnourished HIV‐
positive adults in limited resource contexts is needed and must consider
strategies to support patients without a caregiver, development of
therapeutic foods more suited to adult taste, and specific dietetic training
for health staff.
The conclusions of the sub‐study 2 were that a mathematical approach
called linear programming can contribute to the design of RUF
(therapeutic, supplementary, or complementary), targeting different forms
of malnutrition, while using commodities that are cheaper, regionally
available, and meeting local cultural preferences.
Sub‐study 3 reached the conclusion that the improved RUTF prototype
from sub‐study 2 appears to be acceptable and can be safely clinically
trialled, if close monitoring of vomiting and nausea is included.

276
Sub‐study 4 concluded that the developed method used to determine the
specifications of vitamins and minerals to be included in a RUF may be
limited by the heterogeneity of the available RCT studies. However, some
evidence was found that multiple micronutrients, provided in a high‐dose,
were associated with positive health outcomes and survival. In view of
this, although the doses used in the selected studies informed the novel
specifications, the validity of the proposed method needs to be confirmed.
Based on the four sub‐study outcomes, I developed a framework that summarizes the
entire process to develop, pre‐test and clinically trial novel RUF products.
Opportunities for future research should be taken. These should focus on the RUF quality
standards, on the optimization of the absorption and digestibility of the micronutrients, on
the processing, the packaging, the cost‐effectiveness analysis, the legal definition and
protection of RUF formulations.

277
8 References
1 Black RE, Allen LH, Bhutta ZA, et al. Maternal and child undernutrition:
global and regional exposures and health consequences. Lancet 2008; 371:
243–60.
2 Singhvi M, Kaur S, Kumari S. World largest child nutrition program: all is not
well? Int J Res Econ Soc Sci 2012; 2: 86–91.
3 Aranda da Silva M, Bloem M. WFP Nutrition Policy. Rome, 2012.
4 Group NW. MSF-Inter-section Nutrition Activity Report 2009. Geneva, 2009.
5 Shoham J, Walters T, Kiess L, Nkoroi LA. The Harmonised Training Package
(HTP): Resource Material for Training on Nutrition in Emergencies, Version
2 (2011). NutritionWorks, Emergency Nutrition Network, Global Nutrition
Cluster. Training 2011; 2.
6 World Bank. How we Classify Countries.
2012.http://data.worldbank.org/about/country-classifications (accessed 20
Feb2012).
7 Waterlow JC. Classification and definition of Protein Calorie malnutrition.
BMJ 1972; 3: 566–9.
8 Waterlow JC. Metabolic adaptation to low intakes of energy and protein. Ann
Rev Nutr 1986; 6: 495–526.
9 Golden MH. Evolution of nutritional management of acute malnutrition.
Indian Pediatr 2010; 47: 667–78.
10 WHO. Obesity and overweight (Fact sheet N°311 - updated March 2011).
http://www.who.int/mediacentre/factsheets/fs311/en/ (accessed 21 Feb2012).
11 Tomkins A, Watson F. Malnutrition and infection. A review. Geneva, WHO,
1989.

278
12 Ferro-Luzzi A, James WP. Adult malnutrition: simple assessment techniques
for use in emergencies. Br J Nutr 1996; 75: 3–10.
13 Nandy S, Irving M, Gordon D, Subramanian SV, Davey Smith G. Poverty,
child undernutrition and morbidity: new evidence from India. Bull World Heal
Organ 2005; 83: 161–240.
14 Briend A, Zimick S. Validation of arm circumference as an index of risk in 1
to 4 year olds. NutrRes 1986; 6: 249–61.
15 Rasmussen J, Andersen A, Fisker AB, et al. Mid-upper-arm-circumference
and mid-upper-arm circumference z-score: the best predictor of mortality?
Eur J Clin Nutr 2012; 66: 998–1003.
16 Collins S, Duffield A, Myatt M. Assessment of nutritional status of adults in
emergency-affected populations. Geneva, ACC/SCN, 2000.
17 Prentice AM, Ward KA, Goldberg GR, et al. Critical windows for nutritional
interventions against stunting. Am J Clin Nutr 2013.
18 Navarro-Colorado C. Diagnosis and short term prognosis of malnutrition in
adults in complex emergencies. 2005.
19 Collins S. The assessment and treatment of severe adult malnutrition during
famine. , London: University of London, 2001.
20 Lorenz KA, Shapiro MF, Asch SM, Bozzette SA, Hays RD. Associations of
symptoms and health-related quality of life: findings from a national study of
persons with HIV infection. Ann Intern Med 2001; 134: 854–60.
21 Macallan DC. Malnutrition in tuberculosis. Diagn Microbiol Infect Dis 1999;
34: 153–7.
22 Musoke PM, Fergusson P. Severe malnutrition and metabolic complications
of HIV-infected children in the antiretroviral era: clinical care and
management in resource-limited settings. Am J Clin Nutr 2011.

279
23 Zachariah R, Fitzgerald M, Massaquoi M, et al. Risk factors for high early
mortality in patients on antiretroviral treatment in a rural district of Malawi.
AIDS 2006; 20: 2355–60.
24 Zachariah R, Spielmann MP, Harries AD, Salaniponi FML. Moderate to
severe malnutrition in patients with tuberculosis is a risk factor associated
with early death. Trans R Soc Trop Med Hyg 2002; 96: 291–4.
25 Paton NI, Sangeetha S, Earnest A, Bellamy R. The impact of malnutrition on
survival and the CD4 count response in HIV-infected patients starting
antiretroviral therapy. HIV Med 2006; 7: 323–30.
26 Amadi B, Kelly P, Mwiya M, et al. Intestinal and systemic infection, HIV,
and mortality in Zambian children with persistent diarrhea and malnutrition. J
Pediatr Gastroenterol Nutr 2001; 32: 550–4.
27 Calmy A, Hirschel B, Cooper DA, Carr A. Clinical update: adverse effects of
antiretroviral therapy. Lancet 2007; 370: 12–4.
28 Golden M. Proposed recommended nutrient densities for moderately
malnourished children. Food Nutr Bull 2009; 30: S267–S342.
29 WHO. WHO: Nutrition health topics. http://www.who.int/nutrition/topics/en/
(accessed 21 Feb2012).
30 Seal AJ, Prudhon C. Assessing micronutrient deficiencies in emergencies,
Nutrition. Geneva, UN / SCN, 2007.
31 UNICEF, WHO. Low Birth weight: Country, regional and global estimates.
New York, UNICEF, 2004.
32 Kuczmarski RJ, Flegal KM. Criteria for definition of overweight in transition:
background and recommendations for the United States. Am J Clin Nutr 2000;
72: 1074–81.
33 Reilly JJ. Health consequences of obesity. Arch Dis Child 2003; 88: 748–52.

280
34 WHO. Body mass index. http://www.euro.who.int/en/what-we-do/health-
topics/disease-prevention/nutrition/a-healthy-lifestyle/body-mass-index-bmi
(accessed 2 May2012).
35 UNICEF. Tracking progress on child and maternal nutrition. A survival and
development priority. New York, 2009.
36 Hill R, Gonzalez W, Pelletier DL. The formulation of consensus on nutrition
policy: Policy actors’ perspectives on good process. Food Nutr Bull 2011; 32:
13.
37 (UNSG) UN Secretary-General. UN / Millennium Development Goals.
2000.http://www.un.org/millenniumgoals.
38 Copenhagen Consensus Centre. Copenhagen Consensus.
2008.http://www.copenhagenconsensus.com (accessed 7 Feb2011).
39 World Bank. Repositioning Nutrition as Central to Development: A Strategy
for Large-Scale Action. Washington DC, World Bank, 2006.
40 Horton S, Shekar M, McDonald C, Mahal A, Brooks JK. Scaling-Up
Nutrition. What will it cost? Washington, DC, The World Bank, 2010.
41 UNICEF. ChildInfo: Monitoring the Situation of Children and Women.
2012.http://www.childinfo.org/undernutrition_status.html (accessed 8
Mar2012).
42 Martinez R, Fernandez A. The cost of hunger: Social and economic impact of
child undernutrition in Central America and the Dominican Republic, United
Nat. Santiago, United Nations,
2008http://www.bvsde.paho.org/texcom/nutricion/costohe.pdf.
43 Fergusson P, Tomkins A. HIV prevalence and mortality among children
undergoing treatment for severe acute malnutrition in sub-Saharan Africa: a
systematic review and meta-analysis. Trans R Soc Trop Med Hyg 2009; 103:
541–8.

281
44 Uthman OA. Prevalence and pattern of HIV-related malnutrition among
women in sub-Saharan Africa: a meta-analysis of demographic health surveys.
BMC Public Health 2008; 8: 226–30.
45 Koethe JR, Lukusa A, Giganti MJ, et al. Association between weight gain and
clinical outcomes among malnourished adults initiating antiretroviral therapy
in Lusaka, Zambia. J Acquir Immune Defic Syndr 2010; 53: 507–13.
46 Greenaway K. Food by Prescription: A Landscape Paper. Geneva, GAIN,
2009.
47 Johannessen A, Naman E, Ngowi BJ, et al. Predictors of mortality in HIV-
infected patients starting antiretroviral therapy in a rural hospital in Tanzania.
BMC Infect Dis 2008; 8: 52.
48 Stringer JS, Zulu I, Levy J, et al. Rapid scale-up of antiretroviral therapy at
primary care sites in Zambia: feasibility and early outcomes. JAMA 2006;
296: 782–93.
49 Kadiyala S, Rawat R. Food access and diet quality independently predict
nutritional status among people living with HIV in Uganda. Public Health
Nutr 2012; 1: 1–7.
50 Visvanathan R. Under-nutrition in older people: a serious and growing global
problem! J Postgrad Med 2003; 49: 352–60.
51 De Groot CP, van Staveren WA, de Graaf C. Determinants of macronutrient
intake in elderly people. Eur J Clin Nutr 2000; 54: S70–6.
52 Oddo VM, Rah JH, Semba RD, et al. Predictors of maternal and child double
burden of malnutrition in rural Indonesia and Bangladesh. Am J Clin Nutr
2012; 95: 951–8.
53 Thomas B. Manual of dietetic practice, 4th ed. Oxford, Iowa, Blackwell Pub.,
2007http://www.worldcat.org/title/manual-of-dietetic-practice/oclc/71842665
(accessed 25 Feb2012).

282
54 USAID. Delivering improved nutrition. Food Aid Quality Review Report to
the USAID. Washington, USAID, 2011.
55 WHO, WFP, UN/SCN, UNICEF. Community-Based Management of Severe
Acute Malnutrition. Geneva, WHO, 2007.
56 Williams CD. A nutritional disease of child-hood associated with maize. Arch
Dis Child 1933; viii: 423.
57 Keys A, Brožek J, Henschel A, Mickelsen O, Taylor HL. The biology of
human starvation. (2 vols). .
58 Keusch GT. The History of Nutrition: Malnutrition, Infection and Immunity. J
Nutr 2003; 133: 336S–340.
59 Williams CD. Kwashiorkor: A nutritional disease of children associated with
a maize diet. Lancet 1935; 2: 1151–2.
60 Autret M, Behar M. Infantile multiple deficiency syndrome in Central
America (Kwashiorkor). Bull World Health Organ 1954; 11: 891–966.
61 Keys A. The biology of human starvation. Minnesota, Minnesota press, 1950.
62 Briend A, Collins S. Therapeutic nutrition for children with severe acute
malnutrition: Summary of African experience. Indian Pediatr 2010; 47: 655–
9.
63 Scrimshaw NS, Taylor CE, Gordon JE. Interactions of nutrition and infection.
Am J Med Sci 1959; 237: 367–403.
64 Beaton G, Ghassemi H. Supplementary feeding programmes for young
children in developing countries. Am J Clin Nutr 1982; 35: 864–916.
65 Brown KH, Stallings RY, de Kanashiro HC, Lopez de Romaña G, Black RE.
Effects of common illnesses on infants’ energy intakes from breast milk and
other foods during longitudinal community-based studies in Huascar (Lima),
Peru. Am J Clin Nutr 1990; 52: 1005–13.

283
66 Golden M. The role of individual nutrient deficiencies in growth retardation of
children as exemplified by zinc and protein. In: Linear growth retardation in
less developed countries. New York, Raven Press, 1988: 143–63.
67 Golden MHN. The nature of nutritional deficiency in relation to growth
failure and poverty. PadiatrScandSuppl 1991; 374: 95–110.
68 Golden MH. Specific deficiencies versus growth failure: type I and type II
nutrients. SCN News 1995; : 10–4.
69 Golden MHN. Severe Malnutrition. In: Weatherall DJ, Ledington JGG,
Warrell DA, eds. Oxford Textbook of Medicine. Oxford, Oxford University
Press, 1996: 1278–9.
70 WHO. Management of severe malnutrition: a manual for physicians and other
senior health workers. Geneva, WHO, 1999.
71 Diop H, Dossou N, Ndour M, Briend A, Wade S. Comparison of the efficacy
of a solid ready-to-use food and a liquid, milk-based diet for the rehabilitation
of severely malnourished children: a randomized trial. Am J Clin Nutr 2003;
78: 302–7.
72 Sadler K, Myatt M, Feleke T, Collins S. A comparison of the programme
coverage of two therapeutic feeding interventions implemented in
neighbouring districts of Malawi. Public Health Nutr 2007.
73 Myatt M, Khara T, Collins S. A review of methods to detect cases of severely
malnourished children in the community for their admission into community-
based therapeutic care programs. Food Nutr Bull 2006; 27.
74 Kerac M, Blencowe H, Grijalva-Eternod C, et al. Prevalence of wasting
among under 6-month-old infants in developing countries and implications of
new case definitions using WHO growth standards: a secondary data analysis.
Arch Dis Child 2011; 96: 1008–13.

284
75 Forrester JE, Sztam KA. Micronutrients in HIV/AIDS: is there evidence to
change the WHO 2003 recommendations? Am J Clin Nutr 2011; S94: 1683S–
9S.
76 Srikantia SG. Ferritin in nutritional oedema. Lancet 1958; 1: 667.
77 Gopalan C. Kwashiorkor and marasmus: evolution and distinguishing
features. In: Widdowson EM, ed. Calories Deficiencies and Protein
Deficiencies. London, McCance RA, 1968: 48–58.
78 Stephen JL, Waterlow JC. Effect of malnutrition on activity of two enzymes
concerned with aminoacid metabolism in human liver. Lancet 1968; 291:
118–9.
79 Antener I, Verwilghen AM, Van Geert C, Mauron J. Biochemical study of
malnutrition. Part VI: Histidine and its metabolites. Int J Vitam Nutr Res
1983; 53: 199–209.
80 Whitehead RG. An unidentified compound in the serum of children with
Kwashiorkor (Protein-calorie malnutrition). Nature 1964; 204: 389.
81 Dean RFA, Whitehead RG. The metabolism of aromatic aminoacids in
Kwashiorkor. Lancet 1963; 281: 188–91.
82 Whitehead RG. Histidine metabolism in Kwashiorkor. Lancet 1962; 280:
203–4.
83 Whitehead RG, Milburn TR. Metabolites of Phenylalanine in the Urine of
Children with Kwashiorkor. Nature 1962; 196: 580–1.
84 Whitehead RG, Arnestein HR V. Imidazole Acrylic Acid Excretion in
Kwashiorkor. Nature 1961; 190: 1105–6.
85 Mclaren D. The great protein fiasco. Lancet 1974; 304: 93–6.
86 Alleyne GA. The excretion of water and solute by malnourished children.
West Indian Med J 1966; 15: 150–4.

285
87 Alleyne GAO. The effect of severe protein caloric malnutrition on the renal
function of Jamaican children. Pediatrics 1967; 39: 400–11.
88 James WPT, Coore HG. Persistent Impairment of Insulin Secretion and
Glucose Tolerance after Malnutrition. Am J Clin Nutr 1970; 23: 386–9.
89 Hasan KZ, Briend A, Aziz KM, Hoque BA, Patwary MY, Huttly SR. Lack of
impact of a water and sanitation intervention on the nutritional status of
children in rural Bangladesh. Eur J Clin Nutr 1989; 43: 837–43.
90 Bhutta Z a, Ahmed T, Black RE, et al. What works? Interventions for
maternal and child undernutrition and survival. Lancet 2008; 371: 417–40.
91 Brown K, Peerson J, Lopez de Romana G, de Kanashiro H, Black R. Validity
and epidemiology of reported poor appetite among Peruvian infants from a
low-income, periurban community. Am J Clin Nutr 1995; 61: 26–32.
92 Morris A, Golden MHN, Ramdath D. A new recovery diet for use in the
treatment of malnutrition. West Indian Med J 1989; 38 (S1): 64.
93 Schofield C, Ashworth A. Why have mortality rates for severe malnutrition
remained so high? Bull World Heal Org 1996; 74: 223–9.
94 Kormska J. Increasing access to ready-to-use therapeutic foods. F Exch 2012;
42: 46–7.
95 Khanum S, Ashworth A, Huttly SR. Controlled trial of three approaches to the
treatment of severe malnutrition [see comments]. Lancet 1994; 344: 1728–32.
96 Bredow MT, Jackson AA. Community based, effective, low cost approach to
the treatment of severe malnutrition in rural Jamaica. ArchDisChild 1994; 71:
297–303.
97 Valid International, Concern Worldwide. Community-based Therapeutic Care
(CTC): A Field Manual. Oxford, Valid International, 2006.
98 Collins S, Dent N, Binns P, Bahwere P, Sadler K, Hallam A. Management of
severe acute malnutrition in children. Lancet 2006; 368: 1992–2000.

286
99 The Sphere Project. The Sphere Handbook 2011: Humanitarian Charter and
Minimum Standards in Humanitarian Response. Rugby, UK, Practical Action,
2011.
100 Guerrero S, Myatt M, Collins S. Determinants of coverage in community-
based therapeutic care programmes: towards a joint quantitative and
qualitative analysis. Disasters 2010; 34: 571–85.
101 Gera T. Efficacy and safety of therapeutic nutrition products for home based
therapeutic nutrition for severe acute malnutrition: A systematic review.
Indian Pediatr 2010; 47: 709–18.
102 Bachmann MO. Cost effectiveness of community-based therapeutic care for
children with severe acute malnutrition in Zambia: decision tree model. Cost
Eff Resour Alloc 2009; 7: 2.
103 Navarro-Colorado C. A retrospective study of emergency supplementary
feeding programmes: Emergency Nutrition Network/Save the Children UK.
London, 2007.
104 Defourny I, Minetti A, Harczi G, et al. A large-scale distribution of milk-
based fortified spreads: evidence for a new approach in regions with high
burden of acute malnutrition. PLoS Med ONE 2009; 4: 5455.
105 Latham MC, Jonsson U, Sterken E, Kent G. RUTF stuff. Can the children be
saved with fortified peanut paste? World Nutr 2010; 2: 62–85.
106 Owino VO, Bahwere P, Bisimwa G, Mwangi CM, Collins S. Breast-milk
intake of 9-10-mo-old rural infants given a ready-to-use complementary food
in South Kivu, Democratic Republic of Congo. Am J Clin Nutr 2011; 93:
1300–4.
107 Phuka JC, Maleta K, Thakwalakwa C, et al. Postintervention growth of
Malawian children who received 12-mo dietary complementation with a lipid-
based nutrient supplement or maize-soy flour. Am J Clin Nutr 2009; 89: 382–
90.

287
108 WPHNA. The global game plan of Big Snack. World Nutr 2011; 2: 55–61.
109 USAID. Improving the Nutritional Quality of U.S. Food Aid:
Recommendations for Changes to Products and Programs, Tufts Univ.
Washington, USAID, 2011.
110 Ashworth A, Ferguson E. Dietary counseling in the management of moderate
malnourishment in children. Food Nutr Bull 2009; 30: S405–S433.
111 Maleta K, Kuittinen J, Duggan MB, et al. Supplementary feeding of
underweight, stunted Malawian children with a ready-to-use food. J Pediatr
Gastroenterol Nutr 2004; 38: 152–8.
112 Patel MP, Sandige HL, Ndekha MJ, Briend A, Ashorn P, Manary MJ.
Supplemental feeding with ready-to-use therapeutic food in Malawian
children at risk of malnutrition. J Heal Popul Nutr 2005; 23: 351–7.
113 Matilsky DK, Maleta K, Castleman T, Manary MJ. Supplementary feeding
with fortified spreads results in higher recovery rates than with a corn/soy
blend in moderately wasted children. J Nutr 2009; 139: 773–8.
114 Ciliberto MA, Sandige H, Ndekha MJ, et al. Comparison of home-based
therapy with ready-to-use therapeutic food with standard therapy in the
treatment of malnourished Malawian children: a controlled, clinical
effectiveness trial. Am J Clin Nutr 2005; 81: 864–70.
115 Linneman Z, Matilsky D, Ndekha M, Manary MJ, Maleta K. A large-scale
operational study of home-based therapy with ready-to-use therapeutic food in
childhood malnutrition in Malawi. Matern Child Nutr 2007; 3: 206–15.
116 Ndekha MJ, van Oosterhout JJG, Zijlstra EE, Manary M, Saloojee H, Manary
MJ. Supplementary feeding with either ready-to-use fortified spread or corn-
soy blend in wasted adults starting antiretroviral therapy in Malawi:
randomised, investigator blinded, controlled trial. BMJ 2009; 338: b1867–
b1867.

288
117 Van Oosterhout JJ, Ndekha M, Moore E, Kumwenda JJ, Zijlstra EE, Manary
M. The benefit of supplementary feeding for wasted Malawian adults
initiating ART. AIDS Care 2010; 22: 737–42.
118 Collins S, Sadler K, Dent N, et al. Key issues in the success of community-
based management of severe malnutrition. Food Nutr Bull 2006; 27: S49–S82.
119 UNICEF. A supply chain analysis of ready-to-use therapeutic foods for the
horn of Africa: the nutrition articulation project. New York, 2009.
120 Yach D, Feldman ZA, Bradley DG, Khan M. Can the food industry help
tackle the growing global burden of undernutrition? Am J Public Health 2010;
100: 974–80.
121 UNICEF. Request for proposal (RFP-DAN-2008-500418): UNICEF wishes to
receive proposals for RUTF for delivery during the period of 2008-2010.
2008.
122 Guerrero S, Bahwere P, Sadler K, Collins S. Integrating CTC and HIV/AIDS
Support in Malawi. F Exch 2005; 1: 8–10.
123 Sadler K, Bahwere P, Guerrero S, Collins S. Community-based therapeutic
care in HIV-affected populations. Trans R Soc Trop Med Hyg 2006; 100: 6–9.
124 Bahwere P, Deconinck H, Banda T, Mtimuni A, Collins S. Impact of
household food insecurity on the nutritional status and the response to
therapeutic feeding of people living with human immunodeficiency virus.
Patient Prefer Adherence 2011; 5: 619–27.
125 Bahwere P. Effective Therapeutic Feeding with Chickpea Sesame Based
Ready-To-Use Therapeutic Food (CS-RUTF) in Wasted Adults with
Confirmed or Suspected AIDS. World J AIDS 2011; 01: 169–81.
126 Bahwere P, Piwoz E, Joshua MC, et al. Uptake of HIV testing and outcomes
within a Community-based Therapeutic Care (CTC) programme to treat
severe acute malnutrition in Malawi: a descriptive study. BMC Infect Dis
2008; 8.

289
127 Ahoua L, Umutoni C, Huerga H, et al. Nutrition outcomes of HIV-infected
malnourished adults treated with ready-to-use therapeutic food in sub-Saharan
Africa: a longitudinal study. J Int AIDS Soc 2011; 14: 2.
128 Bahwere P, Sadler K, Collins S. Acceptability and effectiveness of chickpea
sesame-based ready-to-use therapeutic food in malnourished HIV-positive
adults. Patient Prefer Adherence 2009; 3: 67–75.
129 Koethe JR, Chi BH, Megazzini KM, Heimburger DC, Stringer JS a.
Macronutrient supplementation for malnourished HIV-infected adults: a
review of the evidence in resource-adequate and resource-constrained settings.
Clin Infect Dis 2009; 49: 787–98.
130 Anema A, Zhang W, Wu Y, et al. Availability of nutritional support services
in HIV care and treatment sites in sub-Saharan African countries. Public
Health Nutr 2011; : 1–10.
131 Matilsky DK, Maleta K, Castleman T, Manary MJ. Supplementary feeding
with fortified spreads results in higher recovery rates than with a corn/soy
blend in moderately wasted children. J Nutr 2009; 139: 773–8.
132 Adu-Afarwuah S, Lartey A, Brown KH, Zlotkin S, Briend A, Dewey KG.
Randomized comparison of 3 types of micronutrient supplements for home
fortification of complementary foods in Ghana: effects on growth and motor
development. Am J Clin Nutr 2007; 86: 412–20.
133 WFP, DSM. Ten minutes to learn about nutrition programming. Sight Life
2008; 3(S): 1–43.
134 FAO, WHO. Understanding the Codex Alimentarius, FAO/WHO. Rome,
2006.
135 UC Davis. iLiNS Project. http://www.ilins.org/ (accessed 25 Mar2012).
136 Afya - Nutritional supplement for HIV and TB.
http://www.compactforlife.com/afya-tb-and-hiv-food/ (accessed 5 May2012).

290
137 Diplock AT, Aggett PJ, Ashwell M, Bornet F, Fern EB, Roberfroid MB.
Scientific concepts of functional foods in Europe: Consensus document. Br J
Nutr 1999; 81: S1–S27.
138 Menrad K. Market and marketing of functional food in Europe. J Food Eng
2003; 56: 181–8.
139 Siró I, Kápolna E, Kápolna B, Lugasi A. Functional food. Product
development, marketing and consumer acceptance—A review. Appetite 2008;
51: 456–67.
140 Szente L, Szejtli J. Cyclodextrins as food ingredients. Trends Food Sci &
Technol 2004; 15: 137–42.
141 Collins S, Jeya H. Alternative RUTF formulations (Special Supplement 2). F
Exch 2004; 1: 35.
142 De Pee S, Bloem MW. Current and potential role of specially formulated
foods and food supplements for preventing malnutrition among 6-23 months
old and treating moderate malnutrition among 6-59 months old children.
Geneva, WHO, 2008.
143 Lagrone LN, Trehan I, Meuli GJ, et al. A novel fortified blended flour, corn-
soy blend “plus-plus,” is not inferior to lipid-based ready-to-use
supplementary foods for the treatment of moderate acute malnutrition in
Malawian children. Am J Clin Nutr 2011; 95: 221–219.
144 Dibari F. Acceptability trial of a novel RUTF based on soy, lentils and rice. F
Exch 2010; 39: 12–3.
145 Nutriset. 2011.www.nutriset.fr (accessed 17 Jul2011).
146 Owino VO, Irena AH, Dibari F, Collins S. Development and acceptability of a
novel milk-free soybean-maize-sorghum ready-to-use therapeutic food (SMS-
RUTF) based on industrial extrusion cooking process. Matern Child Nutr
2014; 10: 126–34.

291
147 Adu-Afarwuah S, Lartey A, Brown KH, Zlotkin S, Briend A, Dewey KG.
Home fortification of complementary foods with micronutrient supplements is
well accepted and has positive effects on infant iron status in Ghana. Am J
Clin Nutr 2008; 87: 929–38.
148 Lin CA, Manary MJ, Maleta K, Briend A, Ashorn P. An energy-dense
complementary food is associated with a modest increase in weight gain when
compared with a fortified porridge in Malawian children aged 6-18 months. J
Nutr 2008; 138: 593–8.
149 Phuka JC, Maleta K, Thakwalakwa C, et al. Complementary feeding with
fortified spread and incidence of severe stunting in 6- to 18-month-old rural
Malawians. Arch Pediatr Adolesc Med 2008; 162: 619–26.
150 Phuka JC, Maleta K, Thakwalakwa C, et al. Postintervention growth of
Malawian children who received 12-mo dietary complementation with a lipid-
based nutrient supplement or maize-soy flour. Am J Clin Nutr 2009; 89: 382–
90.
151 Huybregts L, Roberfroid D, Lanou H, et al. Prenatal food supplementation
fortified with multiple micronutrients increases birth length: a randomized
controlled trial in rural Burkina Faso. Am J Clin Nutr 2009; 90: 1593–600.
152 Kerac M. Improving the treatment of Severe Acute Malnutrition in
Childhood: A randomized controlled trial of Synbiotic-enhanced therapeutic
food with long term follow-up of post-treatment mortality and morbidity.
London, University College of London, 2010.
153 Michaelsen KF, Hoppe C, Roos N, et al. Choice of foods and ingredients for
moderately malnourished children 6 months to 5 years of age. Food Nutr Bull
2009; 30: S343–S404.
154 WHO. Technical note: supplementary foods for the management of moderate
acute malnutrition in infants and children 6–59 months of age. Geneva, WHO,
2012.

292
155 WHO. Protein and Amino Acid Requirements in Human Nutrition, WHO
Techni. Geneve, WHO, 2007.
156 Manary M. Protein source and quality in therapeutic foods affect the immune
response and outcome in severe acute malnutrition. Food Nutr Bull 2013; 2:
256–8.
157 FAO. Dietary protein quality evaluation in human nutrition, Food and N.
Rome, FAO, 2013.
158 Manary MJ. Local production and provision of ready-to-use therapeutic food
for the treatment of severe childhood malnutrition. Food Nutr Bull 2006; 27:
S83–S89.
159 Singh S, Gamlath S, Wakeling L. Nutritional aspects of food extrusion: a
review. Int J Food Sci Technol 2007; 42: 916–29.
160 UNICEF. The Nutrition Articulation Project.
2012.http://www.unicef.org/supply/index_50035.html (accessed 22 Mar2012).
161 Valid Nutrition, University of Cork, Self Help Africa, Irish Aid. Market
Innovation for Smallholder Groundnut Farmers Research Programme. An
introduction to the ongoing cross-country Livelihood Impact Analysis.
Dublin, 2012.
162 Valid Nutrition. Nutriset and Valid Nutrition sign licence agreement. F Exch
2008; 32: 18.
163 on Schoen-Angerer T. MSF: Nutriset patent impeding access to treatment of
Severe Acute Malnutrition. MSF - Access Campaign.
2009.http://www.msfaccess.org/content/msf-nutriset-patent-impeding-access-
treatment-severe-acute-malnutrition (accessed 18 Apr2012).
164 Nutriset. Nutriset/IRD’s Patents Usage Agreement. Nutr. Web Site.
http://www.nutriset.fr/en/access/patents-for-development/online-patent-usage-
agreement.html (accessed 18 Apr2012).

293
165 Schofield H. Legal fight over Plumpy’nut, the hunger wonder-product. BBC
news. 2010.http://news.bbc.co.uk/2/hi/europe/8610427.stm (accessed 18
Apr2012).
166 Ministry of Medical Services. Kenya Guidelines for an Integrated Approach
to the Nutritional Care of HIV-infected children. .
167 fhi360. Kenya Nutrition and HIV Program (NHP). fhi360 Proj.
2011.http://pshi.fhi360.org/whatwedo/projects/nhp.html (accessed 6
Mar2012).
168 UNICEF, WHO, World Bank. 2012 Joint child malnutrition estimates -
Levels and trends. 2012.http://www.who.int/nutgrowthdb/estimates2012/en/.
169 Nagarajan R. Government crosses sword with UNICEF over serving packaged
food. The Times of India 2009; 8.
170 Six WG for CU. Should India use Commercially Produced Ready to Use
Therapeutic Foods (RUTF) for Severe Acute Malnutrition (SAM). Soc Med
2009; 4 : 52–5.
171 Wilkinson RJ, Llewelyn M, Toossi Z, et al. Influence of vitamin D deficiency
and vitamin D receptor polymorphisms on tuberculosis among Gujarati
Asians in west London: a case-control study. Lancet 2000; 355: 618–21.
172 Mamidi RS, Kulkarni B, Radhakrishna K V, Shatrugna V. Hospital based
nutrition rehabilitation of severely undernourished children using energy
dense local foods. Indian Pediatr 2010; 47: 687–93.
173 Kapil U, Sachdev.HPS. Management of Children with Severe Acute
Malnutrition: A National Priority. Indian Pediatr 2010; 47: 651–3.
174 Chaparro CM, Dewey K. Use of lipid-based nutrient supplements (LNS) to
improve the nutrient adequacy of general food distribution rations for
vulnerable sub-groups in emergency settings. , Blackwell Publishing Ltd,
2010.

294
175 Kayira D, Bentley ME, Wiener J, et al. A lipid-based nutrient supplement
mitigates weight loss among HIV-infected women in a factorial randomized
trial to prevent mother-to-child transmission during exclusive breastfeeding.
Am J Clin Nutr 2012; 95: 759–65.
176 Ashraf H, Ahmed T, Hossain MI, et al. Day-care management of children
with severe malnutrition in an urban health clinic in Dhaka, Bangladesh. J
Trop Pediatr 2007; 53: 171–8.
177 Ferguson EL, Briend A, Darmon N. Can optimal combinations of local foods
achieve the nutrient density of the F100 catch-up diet for severe malnutrition?
J Pediatr Gastroenterol Nutr 2008; 46: 447–52.
178 Greco L, Balungi J, Amono K, Iriso R, Corrado B. Effect of a low-cost food
on the recovery and death rate of malnourished children. J Pediatr
Gastroenterol Nutr 2006; 43: 512–7.
179 Navarro-Colorado C. Validating new foods for supplementary feeding.
Towards the development of a validation system for food supplements for
moderate malnutrition. Discussion paper. Geneva, 2008.
180 MSF. Evaluation du gout du noveau produit nutritionnel “thai fish
plumpy.”Paris, 2008.
181 Bourdier F. Socio-anthropological investigation related to the acceptability of
Plumpy’nut in Cambodia. Marseille, IRD, 2009.
182 Oakley E, Reinking J, Sandige H, et al. A ready-to-use therapeutic food
containing 10% milk is less effective than one with 25% milk in the treatment
of severely malnourished children. J Nutr 2010; 140: 2248–52.
183 Hoppe C, Andersen GS, Jacobsen S, et al. The use of whey or skimmed milk
powder in fortified blended foods for vulnerable groups. J Nutr 2008; 138:
145S–161S.
184 Zimmer J. More evidence is needed for reformulation of fortified blended
foods with whey protein concentrate. J Nutr 2012; 142: 1–2.

295
185 K S, Kerac M, Collins S, et al. Improving the management of severe
malnutrition in an area of high HIV prevalence. Arch Dis Child 2006.
186 Sackett DL. Introduction. In: Haynes B, Taylor D, Sackett DL, eds.
Compliance in health care. Baltimore, The John Hopkins University Press,
1979.
187 Dunbar-Jacob J, Dwyer E. Compliance with antihypertensive regimen: a
review of the research in the 1980s. Ann Behav Med 1991; 12: 31–9.
188 Sackett DL, Haynes RB, Gibson E. Randomised clinical trial of strategies for
improving medication compliance in primary hypertension. Lancet 1975; 1:
1205–7.
189 Donovan JL. Patient decision making. The missing ingredient in compliance
research. Int J Technol Assess Health Care 1995; 11: 443–55.
190 Vermeire E, Hearnshaw H, Van Royen P, Denekens J. Patient adherence to
treatment: three decades of research. A comprehensive review. J Clin Pharm
Ther 2001; 26: 331–42.
191 WHO. Adherence to long-term therapies: evidence for action. Geneva, WHO,
2003.
192 Claxton AJ, Cramer J, Pierce C. A systematic review of the associations
between dose regimens and medication compliance. Clin Ther 2001; 23:
1296–310.
193 Hall NJ, Rubin G, Charnock A. Systematic review: adherence to a gluten-free
diet in adult patients with coeliac disease. Aliment Pharmacol Ther 2009; 30:
315–30.
194 Krueger K, Berger B, Felkey B. Medication adherence and persistence: A
comprehensive review. Adv Ther 2005; 22: 313–56.
195 Foster P, Hudson S. From compliance to concordance: a challenge for
contraceptive prescribers. Health Care Anal 1998; 6: 123–30.

296
196 Miborn H, Cochrane G. Treating the patient as a decision maker is not always
appropriate. Br Med J 1997; 314: 3141.
197 Urquhart J. Patient non-compliance with drug regimens: Measurement,
clinical correlates, economic impact. Eur Heart J 1996; 17: 8–15.
198 Cramer JA, Mattson RH, Prevey ML, Scheyer RD, Ouellette VL. How Often
Is Medication Taken as Prescribed? A Novel Assessment Technique . JAMA J
Am Med Assoc 1989; 261 : 3273–7.
199 Di Matteo MR. Variations in Patients’ Adherence to Medical
Recommendations: A Quantitative Review of 50 Years of Research. Med
Care 2004; 42.
200 Collins S, Sadler K. Outpatient care for severely malnourished children in
emergency relief programmes: a retrospective cohort study. Lancet 2002; 360:
1824–30.
201 Butterworth JR, Banfield LM, Iqbal TH, Cooper BT. Factors relating to
compliance with a gluten-free diet in patients with coeliac disease:
comparison of white Caucasian and South Asian patients. Clin Nutr 2004; 23:
1127–34.
202 Leffler D, Edwards-George J, Dennis M, et al. Factors that Influence
Adherence to a Gluten-Free Diet in Adults with Celiac Disease. Dig Dis Sci
2008; 53: 1573–81.
203 Lohi S, Mustalahti K, Kaukinen K, et al. Increasing prevalence of coeliac
disease over time. Aliment Pharmacol Ther 2007; 26: 1217–25.
204 Chanarin I, Rothman D. Further Observations on the Relation between Iron
and Folate Status in Pregnancy. BMJ 1971; 2.
205 Schultink W. Iron –supplementation programmes: Compliance of target
groups and frequency of tablet intake. Food Nutr Bull 1996; 17.

297
206 Pappagallo S, Bull DL. Operational problems of an iron supplementation
programme for pregnant women: an assessment of UNRWA experience. Bull
World Health Organ 1996; 74: 25–33.
207 Anon. Working party from compliance to concordance. Achieving shared
goals in medicine taking. London, Royal Pharmaceutical Society of Great
Britain, 1997.
208 Lassen LC. Patient Compliance in General Practice. Scand J Prim Health
Care 1989; 7: 179–80.
209 Ekstrom EC, Kavishe FP, Habicht JP, Frongillo EA, Rasmussen KM, Hemed
L. Adherence to iron supplementation during pregnancy in Tanzania:
determinants and hematologic consequences . Am J Clin Nutr 1996; 64 : 368–
74.
210 Romslo I, Haram K, Sagen N, Augensen K. Iron requirement in normal
pregnancy as assessed by serum ferritin, serum transferrin saturation and
erythrocyte protoporphyrin determinations. BJOG An Int J Obstet Gynaecol
1983; 90: 101–7.
211 Charoenlarp P, Dhanamitta S, Kaewvichit R, et al. A WHO collaborative
study on iron supplementation in Burma and in Thailand . Am J Clin Nutr
1988; 47 : 280–97.
212 Schrimshaw S, Zambrana R, Estupinana S, Luna R, Rivera H. Mass
communication/education strategies for improvement of prenatal health
behaviours in Mexico., Maternal N. , International Centre for Research on
Women, 1990.
213 Di Matteo MR. Enhancing patient adherence to medical recommendations.
JAMA 1994; 271: 79, 83.
214 Food and Nutrition Technical Assistance II Project (FANTA-2). Review of
Kenya’s Food by Prescription Program. Washington DC, 2009.

298
215 Cramer JA, Rosenheck R. Compliance with medication regimens for mental
and physical disorders. Psychiatr Serv 1998; 49: 196–201.
216 Van Dulmen S, Sluijs E, van Dijk L, de Ridder D, Heerdink R, Bensing J.
Patient adherence to medical treatment: a review of reviews. BMC Health
Serv Res 2007; 7: 55.
217 De Geest S, Sabaté E, WHO. Adherence to long-term therapies: evidence for
action. Geneva, WHO, 2003.
218 Osterberg L, Blaschke T. Adherence to Medication. N Engl J Med 2005; 353:
487–97.
219 Haynes RB. Patient compliance then and now. Patient Educ Couns 1987; 10:
103–5.
220 Loghman-Adham M. Medication noncompliance in patients with chronic
disease: issues in dialysis and renal transplantation. Am J Manag Care 2003;
9: 155–71.
221 Brian Haynes R, Ann McKibbon K, Kanani R. Systematic review of
randomised trials of interventions to assist patients to follow prescriptions for
medications. Lancet 1996; 348: 383–6.
222 Roter DL, Hall JA, Merisca R, Nordstrom B, Cretin D, Svarstad B.
Effectiveness of Interventions to Improve Patient Compliance: A Meta-
Analysis. Med Care 1998; 36.
223 Brown SA. Studies of educational interventions and outcomes in diabetic
adults: a meta-analysis revisited. Patient Educ Couns 1990; 16: 189–215.
224 Vergouwen ACM, Bakker A, Katon WJ, Verheij TJ, Koerselman F.
Improving adherence to antidepressants: a systematic review of interventions.
J Clin Psychiatry 2003; 64: 1415–20.

299
225 Gordis L. Conceptual and methodologic problems in measuring patient
compliance. In: Compliance in health care. Baltimore, The John Hopkins
University Press, 1979: 23–45.
226 Seal AJ. Adherence to antenatal micronutrient supplementation:
understanding community perspectives and attitudes. Geneva, UNHCR, 2001.
227 De Santo NG, Cirillo M, Perna A, et al. The heart in uremia: role of
hypertension, hypotension, and sleep apnea. Am J Kidney Dis 2001; 38: S38–
S46.
228 Ciacci C, Cirillo M, Cavallaro R, Mazzacca G. Long-term follow-up of celiac
adults on gluten-free diet: prevalence and correlates of intestinal damage.
Digestion 2002; 66: 178–85.
229 Hu FB. The Mediterranean Diet and Mortality — Olive Oil and Beyond. N
Engl J Med 2003; 348: 2595–6.
230 Kant AK. Dietary patterns and health outcomes. J. Am. Diet. Assoc. 2004;
104: 615–35.
231 Bach A, Serra-Majem L, Carrasco JL, et al. The use of indexes evaluating the
adherence to the Mediterranean diet in epidemiological studies: a review.
Public Health Nutr 2006; 9: 132–46.
232 Ciccarone E, Di Castelnuovo A, Salcuni M, et al. A high-score Mediterranean
dietary pattern is associated with a reduced risk of peripheral arterial disease
in Italian patients with Type 2 diabetes. J Thromb Haemost 2003; 1: 1744–52.
233 Greenaway K. Food by Prescription : A Landscape Paper. October. 2009.
234 Bisimwa G, Owino VO, Bahwere P, et al. Randomized controlled trial of the
effectiveness of a soybean-maize-sorghum–based ready-to-use
complementary food paste on infant growth in South Kivu, Democratic
Republic of Congo. Am J Clin Nutr 2012; 95: 1157–64.

300
235 United Nations. UN data: Kenya.
http://data.un.org/CountryProfile.aspx?crName=kenya (accessed 14
May2012).
236 World Bank. Kenya Country Profile.
http://data.worldbank.org/country/kenya#cp_cc (accessed 14 May2012).
237 FAO. Nutrition Country Profile: Kenya. Rome, FAO, 2005.
238 UNAIDS. Kenya Country Situation (2009). Geneva, UNAIDS, 2011.
239 NACC. UNGASS 2010. Nairobi, Maisha, 2011.
240 Gargano JW, Laserson K, Muttai H, et al. The adult population impact of HIV
care and antiretroviral therapy (ART) - Nyanza province, Kenya, 2003-2008.
AIDS 2012; 26: 1545–54.
241 WHO. WHO Global TB Report 2009. Geneva, WHO,
2011http://www.who.int/globalatlas/dataQuery .
242 Tong A, Sainsbury P, Craig J. Consolidated criteria for reporting qualitative
research (COREQ): a 32-item checklist for interviews and focus groups. Int J
Qual Heal Care 2007; 19: 349–57.
243 FANTA, Food and Nutrition Technical Assistance Project. HIV / AIDS : A
Guide for Nutritional Care and Support. Washington DC, FANTA, 2004.
244 Family Health International. HIV, Nutrition and Food: a Practical Guide for
Technical Staff and Clinicians. Durham, US, FHI,
2007C:\VALID\PHD\PHD-BIBLIO\PHD BIBLIO\malnutrition .
245 Piwoz E. Nutrition and HIV/AIDS: Evidence, Gaps and Priority Actions.
Washington DC, USAID, 2004.
246 FANTA. Ethiopia Nutrition and HIV Tools. Washington DC, FANTA, 2008.

301
247 FANTA. Nutrition Care for People Living with HIV and AIDS: Training
Manual for Community and Home-Based Care Providers Facilitators Guide
and Participant Handouts. Washington DC, FANTA, 2008.
248 Bonnard P. HIV/AIDS Mitigation: Using What We Already Know. 2002.
249 Dantizig GB. Maximization of a linear function of variables subject to linear
inequalities. In: Koopmans TC, ed. Activity Analysis of Production and
Allocation, Wiley & Ch. New York, Wiley & Chapman-Hall, 1947: 339–47.
250 Overton ML. Linear Programming. In: Encyclopedia Americana. Ohio,
Grolier Inc., 1997.
251 Briend A. Trial and error methods, “expert” guessing or linear programming?
Formulating sound nutritional recommendations for complementary feeding.
Standing Comm Nutr News 2003; 27: 36–9.
252 Darmon N, Ferguson E, Briend A. Linear and nonlinear programming to
optimize the nutrient density of a population’s diet: an example based on diets
of preschool children in rural Malawi. Am J Clin Nutr 2002; 75: 245–53.
253 Stigler GJ. The Cost of Subsistence. J Farm Econ 1945; 27: 303–14.
254 Chappell AE. Linear Programming Cuts Costs in Production of Animal Feeds.
J Oper Res Soc 1974; 25: 19–26.
255 Munford AG. The use of iterative linear programming in practical
applications of animal diet formulation. Math Comput Simul 1996; 42: 255–
61.
256 Wilton JW, Morris CA, Leigh AO, Jenson EA, Pfeiffer WC. A linear
programming model for beef cattle production. Can J Anim Sci 1974; 54:
693–707.
257 Belovsky GE. Diet optimization in a generalist herbivore: The moose. Theor
Popul Biol 1978; 14: 105–34.

302
258 Nolet BA, Van der Veer P, Evers EGJ, Ottenheim MM. A linear programming
model of diet choice of free-living beavers. Netherlands J Zool 1994; 45:
315–73.
259 Smiths VE, Smith VE. Linear programming models for the determination of
palatable human diets. J Farm Econ 1959; 31: 272–83.
260 Anderson AM, Earle MD. Diet planning in the third world by linear and goal
programming. J Oper Res Soc 1983; 34: 9–16.
261 Ferguson EL, Darmon N, Fahmida U, Fitriyanti S, Harper TB, Premachandra
IM. Design of optimal food-based complementary feeding recommendations
and identification of key “problem nutrients” using goal programming. JNutr
2006; 136: 2399–404.
262 Darmon N, Ferguson EL, Briend A. A cost constraint alone has adverse
effects on food selection and nutrient density: an analysis of human diets by
linear programming. J Nutr 2002; 132: 3764–71.
263 Ferguson EL, Briend A, Darmon N. Can optimal combinations of local foods
achieve the nutrient density of the F100 catch-up diet for severe malnutrition?
J Pediatr Gastroenterol Nutr 2008; 46: 447–52.
264 Ferguson EL, Darmon N, Briend A, Premachandra IM. Food-based dietary
guidelines can be developed and tested using linear programming analysis. J
Nutr 2004; 134: 951–7.
265 Briend A, Darmon N, Ferguson E, Erhardt JG. Linear Programming: A
Mathematical Tool for Analyzing and Optimizing Children’s Diets During the
Complementary Feeding Period. J Pediatr Gastroenterol Nutr 2003; 36: 12–
22.
266 Maillot M, Ferguson EL, Drewnowski A, Darmon N. Nutrient profiling can
help identify foods of good nutritional quality for their price: a validation
study with linear programming. J Nutr 2008; 138: 1107–13.

303
267 Briend A, Ferguson E, Darmon N. Local food price analysis by linear
programming: A new approach to assess the economic value of fortifi ed food
supplements. Food Nutr Bull 2001; 22: 184–9.
268 Santika O, Fahmida U, Ferguson EL. Development of food-based
complementary feeding recommendations for 9- to 11-month-old peri-urban
Indonesian infants using linear programming. J Nutr 2009; 139: 135–41.
269 Nestel P, Briend A, de Benoist B, et al. Complementary Food Supplements to
Achieve Micronutrient Adequacy for Infants and Young Children. J Pediatr
Gastroenterol Nutr 2003; 36: 316–28.
270 Gibson RS, Sazawal S, Peerson JM. Design and quality control issues related
to dietary assessment, randomized clinical trials and meta-analysis of field-
based studies in developing countries. J Nutr 2003; 133: 1569S–1573S.
271 Charrondiere UR, Burlingame B. Identifying food components: INFOODS
tagnames and other component identification systems. J food Compos Anal
2007; 20: 713–6.
272 Ireland JD, Moeller A. Review of International Food Classification and
Description. J food Compos Anal 2000; 13: 529–38.
273 Calloway DH, Murphy SP. World Food Dietary Assessment System.
1998.http://otl.berkeley.edu/Worldfood.html (accessed 12 Feb2011).
274 FAO. INFOODS. 2007.http://www.fao.org/infoods/index_en.stm (accessed
20 Jul2010).
275 Stein A, Meenakshi J, Qaim M, Nestel P, Sachdev H, Butta Z. Analyzing the
Health Benefits of Biofortified Staple Crops by Means of the Disability-
Adjusted Life Years Approach: a Handbook Focusing on Iron, Zinc and
Vitamin A, HarvestPlu. Washington, IFPRI, CIAT, 2005.
276 Nantel G, Kennedy G. Basic guidelines for validation of a simple dietary
diversity score as an indicator of dietary nutrient adequacy for non-
breastfeeding children 2-6 years. Rome, FAO, 2006.

304
277 Waterlow JC. Protein energy malnutrition. London, Edward Arnold, 1992.
278 Sandige H, Ndekha MJ, Briend A, Ashorn P, Manary MJ. Home-based
treatment of malnourished Malawian children with locally produced or
imported ready-to-use food. J Pediatr Gastroenterol Nutr 2004; 39: 141–6.
279 University UN. Formulations for fortified complementary foods and
supplements: Review of successful products for improving the nutritional
status of infants and young children. Food Nutr Bull 2009; 30 : S239–S255.
280 USDA. USDA National Nutrient Database for Standard Reference (Release
24). 2008.http://www.ars.usda.gov/Services/docs.htm?docid=8964 (accessed
10 Jul2008).
281 Schaafsma G. The Protein Digestibility-Corrected Amino Acid Score. J Nutr
2000; 130: 1865S–1867.
282 Golden MHN, Briend A, Grellety Y. Report of a meeting on supplementary
feeding programmes with particular reference to refugee populations. Eur J
Clin Nutr 1995; 49: 137–45.
283 Nutrisurvey. Nutrition Surveys and Calculations. Guidelines, Software and
additional Information. 2007.
284 South Africa Department of Health. True Protein Digestibility Values.
2002.www.doh.gov.za/docs/regulations/2002/reg1055annex.html (accessed
10 Aug2010).
285 Meance S, Achour L, Briend A. Comparison of starch digestibility of a
blended food prepared with and without extrusion cooking. Eur J Clin Nutr
1999; 53: 844–8.
286 Greenfield H, Southgate DAT. Food composition data. Production,
management and use. Rome, FAO, 2003.
287 FAO/WHO. Codex Alimentarius. 2007.www.codexalimentarius.net/
(accessed 15 Aug2010).

305
288 Ireland JD, Moeller A. Langual 2009. The Langual Thesaurus. EuroFIR
Technical Report D1.8.43. Norwich, UK, EuroFIR, 2009.
289 Irena AH, Bahwere P, Owino VO, et al. Comparison of the effectiveness of a
milk-free soy-maize-sorghum-based ready-to-use therapeutic food to standard
ready-to-use therapeutic food with 25% milk in nutrition management of
severely acutely malnourished Zambian children: an equivalence non-blin.
Matern Child Nutr 2013.http://www.ncbi.nlm.nih.gov/pubmed/23782554
(accessed 7 Jul2013).
290 Carter SL. Review of Recent Treatment Acceptability Research. Educ Train
Dev Disabil 2007; 42: 301–16.
291 Cooke LJ, Chambers LC, Añez E V, Wardle J. Facilitating or undermining?
The effect of reward on food acceptance. A narrative review. Appetite 2011;
57: 493–7.
292 Miltenberger RG. Assessment of Treatment Acceptability. Topics Early Child
Spec Educ; 10: 24–38.
293 J. EM. Clinical and biochemical effects of dietary fish oil supplements in
rheumatoid-arthritis. J Rheumatol 1988; 15: 1471.
294 Knox B, Kremer J, Pearce J. Food preference during human pregnancy: A
review. Food Qual Prefer 1990; 2: 131–54.
295 McEwan JA, Thomson DMH. A behavioural interpretation of food
acceptability. Food Qual Prefer 1988; 1: 3–9.
296 Cardello A V, Maller O. Relationships Between Food Preferences and Food
Acceptance Ratings. J Food Sci 1982; 47: 1553–7.
297 Pilgrim FJ. The components of food acceptance and their measurement. Am J
Clin Nutr; 5: 171–5.

306
298 Sheperd R. Factors influencing food preferences and choice. In: Shepherd R,
ed. Handbook of the psychophysiology of human eating. Chirchester, Wiley,
1989: 3 –24.
299 Booth DA, Conner MT, Gibson EL. Measurement of food perception, food
preference, and nutrient selection. Ann N Y Acad Sci 1989; 561: 226–42.
300 Costell E, Tarrega A, Bayarri S. Food Acceptance: The Role of Consumer
Perception and Attitudes. Chemosens Percept 2010; 3 : 42–50.
301 Rozin P, Tuorila H. Simultaneous and temporal contextual influences on food
acceptance. Food Qual Prefer 1993; 4: 11–20.
302 Drewnowski A. Taste Preferences and Food Intake. Annu Rev Nutr 1997; 17:
237–53.
303 Meiselman HL, DeGraaf C, Lesher LL. The effects of variety and monotony
on food acceptance and intake at a midday meal. Physiol & Behav 1AD;
70: 119–25.
304 King SC, Meiselman HL, Hottenstein AW, Work TM, Cronk V. The effects
of contextual variables on food acceptability: A confirmatory study. Food
Qual Prefer 2007; 18: 58–65.
305 Cardello A V, Schutz HG. Food appropriateness measures as an adjunct to
consumer preference/acceptability evaluation. Food Qual Prefer 1996; 7:
239–49.
306 Meiselman HL. Methodology and theory in human eating research. Appetite
1992; 19: 49–55.
307 Finn CA, Sladeczek IE. Assessing the Social Validity of Behavioral
Interventions: A Review of Treatment Acceptability Measures. Sch Psychol Q
2001; 16: 176–206.

307
308 Mayr P, Kalde S, Vogt M, Kuhn KS. Safety, acceptability and efficacy of a
high-energy, fibre-containing oral nutritional supplement in malnourished
patients: an observational study. J Hum Nutr Diet 2000; 13: 255–63.
309 Chassy BM. Food safety risks and consumer health. N Biotechnol 2010; 27:
534–44.
310 Featherstone S. A review of development in and challenges of thermal
processing over the past 200years — A tribute to Nicolas Appert. Food Res
Int 2012; 47: 156–60.
311 Laehteenmaeki-Uutela A. European Novel Food Legislation as a Restriction
to Trade, EAAE. Turku, Turku School of Economics, 2007.
312 Howlett J, Edwards DG, Cockburn A, et al. The safety assessment of novel
foods and concepts to determine their safety in use. Int J Food Sci Nutr 2003;
54 Suppl: S1–32.
313 Constable A, Jonas D, Cockburn A, et al. History of safe use as applied to the
safety assessment of novel foods and foods derived from genetically modified
organisms. Food Chem Toxicol 2007; 45: 2513–25.
314 Edwards G. Safety assessment of novel foods and strategies to determine their
safety in use. Toxicol Appl Pharmacol 2005; 207: 623–7.
315 EU Advisory Committee on Novel Foods and Processes. Consideration of the
use of human studies in the pre-market safety assessment of novel foods.
http://www.acnfp.gov.uk/acnfppapers/inforelatass/guidetastehuman/guidlines
pre-market (accessed 7 Feb2011).
316 Huang H-Y, Caballero B, Chang S, et al. The Efficacy and Safety of
Multivitamin and Mineral Supplement Use to Prevent Cancer and Chronic
Disease in Adults: A Systematic Review for a National Institutes of Health
State-of-the-Science Conference. Ann Intern Med 2006; 145: 372–84.
317 Edwards G. Safety assessment of novel foods and strategies. Toxicol Appl
Pharmacol 2005; 207 : 623–7.

308
318 Nutriset. Plumpy’nut. http://www.nutriset.fr/en/product-range/produit-par-
produit/plumpynut-ready-to-use-therapeutic-food-rutf.html (accessed 28
Jul2011).
319 Ling AM, Horwath C. Self-efficacy and consumption of fruit and vegetables:
validation of a summated scale. Am J Health Promot; 13: 290–8.
320 FANTA. Dietary Diversity as a Household Food Security Indicator.
Washington DC, Fanta, 2002.
321 Dube B, Rongsen T, Mazumder S, et al. Comparison of Ready-to-Use
Therapeutic Food with cereal legume-based khichri among malnourished
children. Indian Pediatr 2009; 46: 383–8.
322 Kirkwood BR. Essentials of Medical Statistics. Oxford, Blackwell Science
Ltd, 1992.
323 Jones B, Kenward MG. Design and analysis of cross-over trials. London,
Chapman and Hall, 2003.
324 Mills EJ, Chan AW, Wu P, Vail A, Guyatt GH, Altman DG. Design, analysis,
and presentation of crossover trials. Trials 2009; 10: 27.
325 Chadwick D. Safety and efficacy of vigabatrin and carbamazepine in ne wly
diagnosed epilepsy: a multicentre randomised double-blind study. Lancet
1999; 354: 13–9.
326 Piaggio G, Elbourne DR, Altman DG, Pocock SJ, Evans SJW, for the
CONSORT Group. Reporting of noninferiority and equivalence randomized
trials. JAMA 2006; 295: 1152–60.
327 Liu Y, Wu F. Global burden of aflatoxin-induced hepatocellular carcinoma: a
risk assessment. Environ Health Perspect 2010; 118: 818–24.
328 Williams JH, Phillips TD, Jolly PE, Stiles JK, Jolly CM, Aggarwal D. Human
aflatoxicosis in developing countries: a review of toxicology, exposure,

309
potential health consequences, and interventions. AmJClinNutr 2004; 80:
1106–22.
329 Hawkes C, Ruel M. The links between agriculture and health: an intersectoral
opportunity to improve the health and livelihoods of the poor. BullWorld Heal
Organ 2006; 84: 984–90.
330 Prudhon C, Briend A, Weise Prinzo Z, Daelmans BMEG, Mason JB. WHO,
UNICEF, and SCN Informal Consultation on Community-Based.
Management of Severe Malnutrition in Children Management of Severe
Malnutrition in Children. Geneva, SCN-WHO, 2007.
331 WHO. Dietary recommendations / Nutritional requirements.
http://www.who.int/nutrition/topics/nutrecomm/en/index.html (accessed 20
Mar2012).
332 WHO, FAO. Vitamin and mineral requirements in human nutrition. Geneva,
WHO, 2004.
333 FAO. Fat and fatty acids in human nutrition. Report of an expert consultation.
Rome, FAO, 2008.
334 Harper AE. Contributions of Women Scientists in the U.S. to the
Development of Recommended Dietary Allowances. J Nutr 2003; 133: 3698–
702.
335 Institute of Medicine. Dietary Reference Intakes Research Synthesis:
Workshop Summary. Washington, D.C., The National Academies Press,
2006http://www.nap.edu/catalog.php?record_id=11767 (accessed 1 Oct2011).
336 Food and Drug Administration. Food Labeling Guide. College Park, MD,
2009.
337 FAO, WHO. Human Vitamin and Mineral Requirements - Report of a joint
FAO/WHO expert consultation Bangkok, Thailand. Rome, FAO/WHO, 2001.

310
338 Standing Committee on the Scientific Evaluation of Dietary Reference Intakes
Institute of Medicine (IOM) F and NB. Dietary Reference Intakes for
Calcium, Phosphorus, Magnesium, Vitamin D, and Fluoride. Washington DC,
National Academy Press, 1997.
339 WHO. Diet, nutrition and the prevention of chronic diseases. Tech Rep Ser
2003.http://www.who.int/dietphysicalactivity/publications/trs916/en/
(accessed 1 Oct2011).
340 World Cancer Research Fund. Food, Nutrition, Physical Activity, and the
Prevention of Cancer: a Global Perspective. Washington DC, 2007.
341 Allen LH, Peerson JM, Olney DK. Provision of multiple rather than two or
fewer micronutrients more effectively improves growth and other outcomes in
micronutrient-deficient children and adults. J Nutr 2009; 139: 1022–30.
342 USAID. Nutrition and Tuberculosis: a review of the literature and
considerations for TB control programs. Washington, USAID, 2008.
343 Friis H. Micronutrients and HIV infection: a review of current evidence.
Geneva, WHO, 2005.
344 Friis H, Michaelsen KF. Micronutrients and HIV infection: a review. Eur J
Clin Nutr 1998; 52: 157–63.
345 Butensky EA. The role of nutrition in pediatric HIV/AIDS: a review of
micronutrient research. J Pediatr Nurs 2001; 16: 402–11.
346 Irlam JH, Visser ME, Rollins N, Siegfried N. Micronutrient supplementation
in children and adults with HIV infection. Cochrane database Syst Rev 2005.
347 Drain PK, Kupka R, Mugusi F, Fawzi WW. Micronutrients in HIV-positive
persons receiving highly active antiretroviral therapy. Am J Clin Nutr 2007;
85: 333–45.

311
348 Autran B, Carcelain G, Li TS, et al. Positive effects of combined antiretroviral
therapy on CD4+ T cell homeostasis and function in advanced HIV disease.
Science 1997; 277: 112–6.
349 Wanke CA, Silva M, Knox TA, Forrester J, Speigelman D, Gorbach SL.
Weight loss and wasting remain common complications in individuals
infected with human immunodeficiency virus in the era of highly active
antiretroviral therapy. Clin Infect Dis 2000; 31: 803–5.
350 Tang AM, Jacobson DL, Spiegelman D, Knox TA, Wanke C. Increasing risk
of 5% or greater unintentional weight loss in a cohort of HIV-infected
patients, 1995 to 2003. J Acquir Immune Defic Syndr 2005; 40: 70–6.
351 Shevitz AH, Knox TA. Nutrition in the era of highly active antiretroviral
therapy. Clin Infect Dis 2001; 32: 1769–75.
352 Miller TL. Nutritional aspects of HIV-infected children receiving highly
active antiretroviral therapy. AIDS 2003; 17 Suppl 1: S130–S140.
353 Abba K, Sudarsanam TD, Grobler L, Volmink J. Nutritional supplements for
people being treated for active tuberculosis. Cochrane Database Syst Rev
2009; : CD006086.
354 Marston B, De Cock KM. Multivitamins, nutrition, and antiretroviral therapy
for HIV disease in Africa. N EnglJ Med 2004; 351: 78–80.
355 Mehta S, Fawzi W. Effects of vitamins, including vitamin A, on HIV/AIDS
patients. Vitam Horm 2007; 75: 355–83.
356 WHO, FAO. Guidelines on food fortification with micronutrients. Geneva,
WHO, 2006.
357 Scrimshaw NS, SanGiovanni JP. Synergism of nutrition, infection, and
immunity: an overview. Am J Clin Nutr 1997; 66: 464S–477S.

312
358 Cunningham-Rundles S, McNeeley DF, Moon A. Mechanisms of nutrient
modulation of the immune response. J Allergy Clin Immunol 2005; 115:
1119–28.
359 McComsey GA, Lederman MM. High doses of riboflavin and thiamine may
help in secondary prevention of hyperlactatemia. AIDS Read 2002; 12: 222–4.
360 Dalton SD, Rahimi AR. Emerging role of riboflavin in the treatment of
nucleoside analogue-induced type B lactic acidosis. AIDS Patient Care STDS
2001; 15: 611–4.
361 Tang AM, Graham NM, Kirby AJ, McCall LD, Willett W, Saah AJ. Dietary
micronutrient intake and risk of progression to acquired immunodeficiency
syndrome (AIDS) in human immunodeficiency virus type 1 (HIV-1)-infected
homosexual men. Am J Epidemiol 1993; 138 : 937.
362 Tang AM, Graham NM, Saah AJ. Effects of micronutrient intake on survival
in human immunodefciency virust type 1. Am J Epidemiol 1996; 143 : 1244.
363 Fawzi WW, Msamanga GI, Hunter D, et al. Randomized trial of vitamin
supplements in relation to transmission of HIV-1 through breastfeeding and
early child mortality. AIDS 2002; 16: 1935–44.
364 Humphrey JH, Iliff PJ, Marinda ET, et al. Effects of a single large dose of
vitamin A, given during the postpartum period to HIV-positive women and
their infants, on child HIV infection, HIV-free survival, and mortality. J Infect
Dis 2006; 193: 860–71.
365 McClelland RS, Baeten JM, Overbaugh J, et al. Micronutrient
supplementation increases genital tract shedding of HIV-1 in women: results
of a randomized trial. J Acquir Immune Defic Syndr 2004; 37 : 1657–63.
366 Sappey C, Boelaert JR, Legrand-Poels S, Forceille C, Favier A, Piette J. Iron
chelation decreases NF-kB and HIV type 1 activation due to oxidative stress.
AIDS Res Hum Retroviruses 1995; 11: 1049.

313
367 Slain D, Amsden JR, Khakoo RA, Fisher MA, Lalka D, Hobbs GR. Effect of
high-dose vitamin C on the steady-state pharmacokinetics of the protease
inhibitor indinavir in healthy volunteers. Pharmacotherapy 2005; 25: 165–70.
368 Friis H. Micronutrient interventions and HIV infection: a review of current
evidence. Trop Med Int Heal 2006; 11: 1849–57.
369 Piwoz E, Preble E. HIV/AIDS and Nutrition: A review of the literature and
recommendations for National Care and Support in Sub-Saharan Africa.
Washington DC , SARA Project, USAID, 2000.
370 Oguntibeju OO, van den Heever WM, Van Schalkwyk FE. The
interrelationship between nutrition and the immune system in HIV infection: a
review. PakJ BiolSci 2007; 10: 4327–38.
371 Irlam JH, Visser MM, Rollins NN, Siegfried N. Micronutrient
supplementation in children and adults with HIV infection. Cochrane
Database Syst Rev 2010; : 1–115.
372 Madec Y, Szumilin E, Genevier C, et al. Weight gain at 3 months of
antiretroviral therapy is strongly associated with survival: evidence from two
developing countries. AIDS 2009; 27: 853–61.
373 Dibari F, Bahwere P, Le Gall I, Guerrero S, Mwaniki D, Seal A. A qualitative
investigation of adherence to nutritional therapy in malnourished adult AIDS
patients in Kenya. Public Health Nutr 2010; 2: 1–8.
374 WHO. Nutrient requirements for people living with HIV/AIDS - Report of a
technical consultation. Geneva, WHO, 2003.
375 Ockenga J, Grimble R, Jonkers-Schuitema C, et al. ESPEN Guidelines on
Enteral Nutrition: Wasting in HIV and other chronic infectious diseases. Clin
Nutr 2006; 25: 319–29.
376 British Medical Association, Royal Pharmaceutical Society of Great Britain.
BNF 56. London, 2008.

314
377 Irlam J, Visser M, Rollins NN, Siegfried N. Micronutrient supplementation in
children and adults with HIV infection (Review). Cochrane Libr 2011.
378 Sinclair D, Abba K, Grobler L, Sudarsanam TD. Nutritional supplements for
people being treated for active tuberculosis. Cochrane Database Syst Rev
2011; 11: 1–115.
379 De Pee S, Bloem M. Foreword: The role of nutrition and food insecurity in
HIV and tuberculosis infections and the implications for interventions in
resource-limited settings. Food Nutr Bull 2011; 31.
380 Chandrasekhar A, Gupta A. Nutrition and disease progression pre-highly
active antiretroviral therapy (HAART) and post-HAART: can good nutrition
delay time to HAART and affect response to HAART? Am J Clin Nutr 2011.
381 MSF. HIV-Nutrition Protocol. MSF/France Kenya. Nairobi, 2007.
382 Suttmann U, Ockenga J, Schneider H, et al. Weight gain and increased
concentrations of receptor proteins for tumor necrosis factor after patients
with symptomatic HIV infection received fortified nutrition support. J Am
Diet Assoc 1996; 96: 565–9.
383 Kelly P, Katubulushi M, Todd J, et al. Micronutrient supplementation has
limited effects on intestinal infectious disease and mortality in a Zambian
population of mixed HIV status: a cluster randomized trial. Am J Clin Nutr
2008; 88: 1010–7.
384 Fawzi WW, Msamanga GI, Spiegelman D, et al. A randomized trial of
multivitamin supplements and HIV disease progression and mortality. N Engl
J Med 2004; 351: 23–32.
385 Range N, Changalucha J, Krarup H, Magnussen P, Andersen AB, Friis H. The
effect of multi-vitamin/mineral supplementation on mortality during treatment
of pulmonary tuberculosis: a randomised two-by-two factorial trial in
Mwanza, Tanzania. Br J Nutr 2006; 95: 762–70.

315
386 Villamor E, Mugusi F, Urassa E, et al. A trial of the Effect of Micronutrient
Supplementation on Treatment Outcome, T Cell Counts, Morbidity, and
Mortality in Adults with Pulmonary Tubercolosis. J Infect Dis 2008; 197: 1 –
3.
387 Kaiser JD, Campa AM, Ondercin JP, Leoung GS, Pless RF, Baum MK.
Micronutrient supplementation increases CD4 count in HIV-infected
individuals on highly active antiretroviral therapy: a prospective, double-
blinded, placebo-controlled trial. J Acquir Immune Defic Syndr 2006; 42:
523–8.
388 Semba RD, Kumwenda J, Zijlstra E, et al. Micronutrient supplements and
mortality of HIV-infected adults with pulmonary TB: a controlled clinical
trial. Int J Tuberc Lung Dis 2007; 11: 854–9.
389 Kawai K, Kupka R, Mugusi F, et al. A randomized trial to determine the
optimal dosage of multivitamin supplements to reduce adverse pregnancy
outcomes among HIV-infected women in Tanzania. Am J Clin Nutr 2010; 91:
391–7.
390 Austin J, Singhal N, Voigt R, et al. A community randomized controlled
clinical trial of mixed carotenoids and micronutrient supplementation of
patients with acquired immunodeficiency syndrome. Eur J Clin Nutr 2006;
60: 1266–76.
391 Jiamton S, Pepin J, Suttent R, et al. A randomized trial of the impact of
multiple micronutrient supplementation on mortality among HIV-infected
individuals living in Bangkok. AIDS 2003; 17: 2461–9.
392 Villamor E, Saathoff E, Manji K, Msamanga G, Hunter DJ, Fawzi WW.
Vitamin supplements, socioeconomic status, and morbidity events as
predictors of wasting in HIV-infected women from Tanzania. Am J Clin Nutr
2005; 82: 857–65.

316
393 Allard JP, Aghdassi E, Chau J, et al. Effects of vitamin E and C
supplementation on oxidative stress and viral load in HIV-infected subjects.
AIDS 1998; 12: 1653–9.
394 Baum MK, Lai S, Sales S, Page JB, Campa A. Randomized, controlled
clinical trial of zinc supplementation to prevent immunological failure in HIV-
infected adults. Clin Infect Dis 2010; 50: 1653–60.
395 Baeten JM, McClelland RS, Overbaugh J, et al. Vitamin A supplementation
and human immunodeficiency virus type 1 shedding in women: results of a
randomized clinical trial. J Infect Dis 2002; 185: 1187–91.
396 Burbano X, Miguez-Burbano MJ, McCollister K, et al. Impact of a selenium
chemoprevention clinical trial on hospital admissions of HIV-infected
participants. HIV Clin Trials 2002; 3: 483–91.
397 De Souza Júnior O, Treitinger A, Baggio GL, et al. alpha-Tocopherol as an
antiretroviral therapy supplement for HIV-1-infected patients for increased
lymphocyte viability. Clin Chem Lab Med 2005; 43: 376–82.
398 Kupka R, Mugusi F, Aboud S, et al. Randomized, double-blind, placebo-
controlled trial of selenium supplements among HIV-infected pregnant
women in Tanzania: effects on maternal and child outcomes. Am J Clin Nutr
2008; 87: 1802–8.
399 Hurwitz BE, Klaus JR, Llabre MM, et al. Suppression of human
immunodeficiency virus type 1 viral load with selenium supplementation: a
randomized controlled trial. Arch Intern Med 2007; 167: 148–54.
400 Jaruga P, Jaruga B, Gackowski D, et al. Supplementation with antioxidant
vitamins prevents oxidative modification of DNA in lymphocytes of HIV-
infected patients. Free Radic Biol Med 2002; 32: 414–20.
401 Karyadi E, West CE, Schultink W, et al. A double-blind, placebo-controlled
study of vitamin A and zinc supplementation in persons with tuberculosis in
Indonesia: effects on clinical response and nutritional status. Am J Clin Nutr
2002; 75: 720–7.

317
402 Kelly P, Musonda R, Kafwembe E, Kaetano L, Keane E, Farthing M.
Micronutrient supplementation in the AIDS diarrhoea-wasting syndrome in
Zambia: a randomized controlled trial. AIDS 1999; 13 : 495–500.
403 Nursyam EW, Amin Z, Rumende CM. The effect of vitamin D as
supplementary treatment in patients with moderately advanced pulmonary
tuberculous lesion. Acta Med Indones 2006; 38: 3–5.
404 Pichard C, Sudre P, Karsegard V, et al. A randomized double-blind controlled
study of 6 months of oral nutritional supplementation with arginine and
omega-3 fatty acids in HIV-infected patients. Swiss HIV Cohort Study. AIDS
1998; 12: 53–63.
405 Schon T, Elias D, Moges F, et al. Arginine as an adjuvant to chemotherapy
improves clinical outcome in active tuberculosis. Eur Respir J 2003; 21: 483–
8.
406 Seyedrezazadeh E, Ostadrahimi A, Mahboob S, Assadi Y, Ghaemmagami J,
Pourmogaddam M. Effect of vitamin E and selenium supplementation on
oxidative stress status in pulmonary tuberculosis patients. Respirology 2008;
13: 294–8.
407 Spada C, Treitinger A, Reis M, et al. An evaluation of antiretroviral therapy
associated with alpha-tocopherol supplementation in HIV-infected patients.
Clin Chem Lab Med 2002; 40: 456–9.
408 Swanson B, Keithley JK, Zeller JM, Sha BE. A pilot study of the safety and
efficacy of supplemental arginine to enhance immune function in persons with
HIV/AIDS. Nutrition 2002; 18: 688–90.
409 Villamor E, Aboud S, Koulinska IN, et al. Zinc supplementation to HIV-1-
infected pregnant women: effects on maternal anthropometry, viral load, and
early mother-to-child transmission. Eur J Clin Nutr 2006; 60: 862–9.
410 Wejse C, Gomes VF, Rabna P, et al. Vitamin D as supplementary treatment
for tuberculosis: a double-blind, randomized, placebo-controlled trial. Am J
Respir Crit Care Med 2009; 179: 843–50.

318
411 Fawzi WW, Msamanga GI, Spiegelman D, et al. Randomised trial of effects
of vitamin supplements on pregnancy outcomes and T cell counts in HIV-1-
infected women in Tanzania. Lancet 1998; 351: 1477–82.
412 Standing Committee on the Scientific Evaluation of Dietary Reference Intakes
Institute of Medicine (IOM) F and NB. Dietary Reference intakes for thiamin,
riboflavin, niacin, vitamin B6, folate, vitamin B12, pantothenic acid, biotin,
and choline. Washington, DC, National Academy Press , 1998.
413 Standing Committee on the Scientific Evaluation of Dietary Reference Intakes
Institute of Medicine (IOM) F and NB. Dietary Reference Intakes for Vitamin
A, Vitamin K, Arsenic, Boron, Chromium, Copper, Iodine, Iron, Manganese,
Molybdenum, Nickel, Silicon, Vanadium, and Zinc. Washington DC, National
Academy Press, 2002.
414 European Commission SC on F (SCF). Tolerable upper intake levels for
vitamins and minerals. 2003.http://ec.europa.eu/food/fs/sc/scf/out80_en.html
(accessed 17 Jul2011).
415 Institute of Medicine. Dietary Reference Intakes for Water, Potassium,
Sodium, Chloride, and Sulfate. Washington, The National Academies Press,
2005.
416 Dietary Reference Intakes for Calcium and Vitamin D - Institute of Medicine.
2011.http://www.iom.edu/Reports/2010/Dietary-Reference-Intakes-for-
Calcium-and-Vitamin-D.aspx (accessed 24 Sep2011).
417 Standing Committee on the Scientific Evaluation of Dietary Reference Intakes
Institute of Medicine (IOM) F and NB, Standing Committee on the Scientific
Evaluation of Dietary Reference Intakes Institute of Medicine (IOM), Board F
and N. Dietary Reference Intakes for Vitamin A, Vitamin K, Arsenic, Boron,
Chromium, Copper, Iodine, Iron, Manganese, Molybdenum, Nickel, Silicon,
Vanadium, and Zinc. Washington DC, National Academy Press,
2000http://www.nap.edu/catalog/5776.html .

319
418 European Responsible Nutrition Alliance (ERNA), European Federation
Association of Health Product Manufacturers (EHPM). Vitamin and mineral
supplements: a risk management model. Brussels, ERNA, 2004.
419 Tantibhedhyangkul P, Hashim SA. Medium-chain triglyceride feeding in
premature infants: effects on calcium and magnesium absorption. Pediatrics
1978; 61: 537–45.
420 Jackson A, Golden MN. The human rumne. Lancet 1978; 312: 764–7.
421 Srikantia SG, Gopalan C. Renal function in nutritional oedema. Indian J Med
Res 1959; 47: 467–70.
422 Dempster WS, Sive AA, Rosseau S, Malan H, Heese H V. Misplaced iron in
kwashiorkor. Eur J Clin Nutr 1995; 49: 208–10.
423 Ramdath DD, Golden MH. Non-haematological aspects of iron nutrition. Nutr
Res Rev 1989; 2: 29–49.
424 Sive AA, Dempster WS, Rosseau S, Kelly M, Malan H, Heese HD. Bone
marrow and chelatable iron in patients with protein energy malnutrition. S Afr
Med J 1996; 86: 1410–3.
425 Golden MHN, Ramdath D. Free radicals in the pathogenesis of kwashiorkor.
Proc Nutr Soc 1987; 46: 53–68.
426 Waterlow JC. Fatty livers in the West Indies. Lancet 1948; 1: 769.
427 Smith IF, Taiwo O, Golden MH. Plant protein rehabilitation diets and iron
supplementation of the protein-energy malnourished child. Eur J Clin Nutr
1989; 43: 763–8.
428 Levander OA, Beck MA. Selenium and viral virulence. Br Med Bull 1999; 55:
528–33.
429 Levander OA. Coxsackievirus as a model of viral evolution driven by dietary
oxidative stress. Nutr Rev 2000; 58: S17–S24.

320
430 Levander OA. The selenium-coxsackievirus connection: chronicle of a
collaboration. J Nutr 2000; 130: 485S–488S.
431 Sun QA, Su D, Novoselov S V, Carlson BA, Hatfield DL, Gladyshev VN.
Reaction mechanism and regulation of mammalian thioredoxin/glutathione
reductase. Biochemistry 2005; 44: 14528–37.
432 Kalantari P, Narayan V, Natarajan SK, et al. Thioredoxin reductase-1
negatively regulates HIV-1 transactivating protein Tat-dependent transcription
in human macrophages. J Biol Chem 2008; 283: 33183–90.
433 Blanck HM, Bowman BA, Serdula MK, Khan LK, Kohn W, Woodruff BA.
Angular stomatitis and riboflavin status among adolescent Bhutanese refugees
living in southeastern Nepal. Am J Clin Nutr 2002; 76: 430–5.
434 Powers HJ, Wright AJ, Fairweather-Tait SJ. The effect of riboflavin
deficiency in rats on the absorption and distribution of iron. Br J Nutr 1988;
59: 381–7.
435 Williams EA, Powers HJ, Rumsey RD. Morphological changes in the rat
small intestine in response to riboflavin depletion. Br J Nutr 1995; 73: 141–6.
436 Golden MMHNMM. Proposed recommended nutrient densities for
moderately malnourished children. Food Nutr Bull 2009; 30: S267–S342.
437 MSF. Tubercolosis. Practical guide for clinicians, nurses, laboratory
technicians and medical auxiliares, 5th ed. Paris, 2010.
438 Ghitis J, Tripathy K, Mayoral G. Malabsorption in the tropics. 2. Tropical
sprue versus primary protein malnutrition: vitamin B12 and folic acid studies.
Am J Clin Nutr 1967; 20: 1206–11.
439 Fawzi WW, Mbise RL, Hertzmark E, et al. A randomized trial of vitamin A
supplements in relation to mortality among human immunodeficiency virus-
infected and uninfected children in Tanzania. Pediatr Infect Dis J 1999; 18:
127–33.

321
440 Martineau AR, Timms PM, Bothamley GH, et al. High-dose vitamin D(3)
during intensive-phase antimicrobial treatment of pulmonary tuberculosis: a
double-blind randomised controlled trial. Lancet 2011; 377: 242–50.
441 Martineau AR, Honecker FU, Wilkinson RJ, Griffiths CJ. Vitamin D in the
treatment of pulmonary tuberculosis. J Steroid Biochem Mol Biol 2007; 103:
793–8.
442 Ralph AP, Kelly PM, Anstey NM. L-arginine and vitamin D: novel adjunctive
immunotherapies in tuberculosis. Trends Microbiol 2008; 16: 336–44.
443 Fabri M, Stenger S, Shin D-M, et al. Vitamin D Is Required for IFN- -
Mediated Antimicrobial Activity of Human Macrophages. Sci Transl Med
2011; 3: 104ra102–104ra102.
444 Martineau AR, Nanzer AM, Satkunam KR, et al. Influence of a single oral
dose of vitamin D(2) on serum 25-hydroxyvitamin D concentrations in
tuberculosis patients. Int J Tuberc Lung Dis 2009; 13: 119–25.
445 Vieth R, Chan PC, MacFarlane GD. Efficacy and safety of vitamin D3 intake
exceeding the lowest observed adverse effect level. Am J Clin Nutr 2001; 73:
288–94.
446 Benn CS, Friis H, Wejse C. Should Micronutrient Supplementation Be
Integrated into the Case Management of Tuberculosis? J Infect Dis 2008; 197
: 1–3.
447 Standing Committee on the Scientific Evaluation of Dietary Reference Intakes
Institute of Medicine (IOM). Dietary Reference Intakes for Vitamin C,
Vitamin E, Selenium, and Carotenoids. Washington DC, National Academy
Press, 2000.
448 Beck J, Ferrucci L, Sun K, et al. Low serum selenium concentrations are
associated with poor grip strength among older women living in the
community. BioFactors 2007; 29: 37–44.

322
449 Beck MA. Selenium and vitamin E status: impact on viral pathogenicity. J
Nutr 2007; 137: 1338–40.
450 Dotan Y, Lichtenberg D, Pinchuk I. No evidence supports vitamin E
indiscriminate supplementation. BioFactors; 35: 469–73.
451 Prendergast A, Walker AS, Mulenga V, Chintu C, Gibb DM. Improved
growth and anemia in HIV-infected African children taking cotrimoxazole
prophylaxis. Clin Infect Dis 2011; 52: 953–6.
452 Walker AS, Ford D, Gilks CF, et al. Daily co-trimoxazole prophylaxis in
severely immunosuppressed HIV-infected adults in Africa started on
combination antiretroviral therapy: an observational analysis of the DART
cohort. Lancet 2010; 375: 1278–86.
453 Brenchley JM, Price DA, Schacker TW, et al. Microbial translocation is a
cause of systemic immune activation in chronic HIV infection. Nat Med 2006;
12: 1365–71.
454 Zlotkin S. A critical assessment of the upper intake levels for infants and
children. J Nutr 2006; 136: 502S–506S.
455 Sztam KA, Fawzi WW, Duggan C. Macronutrient Supplementation and Food
Prices in HIV Treatment. J Nutr 2010; Supplement: 213S–223S.
456 De Pee S, Semba RD. Role of nutrition in HIV infection: Review of evidence
for more effective programming in resource-limited settings. Food Nutr Bull
2010; 31: S313–S344.
457 Raiten DJ. Nutrition and pharmacology: general principles and implications
for HIV. Am J Clin Nutr 2011.
458 Burbano X, Miguez MJ, Lecusay R, et al. Thrombocytopenia in HIV-infected
drug users in the HAART era. Platelets 2001; 12: 456–61.

323
459 Kelly P, Zulu I, Amadi B, et al. Morbidity and nutritional impairment in
relation to CD4 count in a Zambian population with high HIV prevalence.
Acta Trop 2002; 83: 151–8.
460 Baum MK, Lai S, Sales S, Page JB, Campa A. Randomized, controlled
clinical trial of zinc supplementation to prevent immunological failure in HIV-
infected adults. Clin Infect Dis 2010; 50: 1653–60.
461 Chan L-K, Wu M-L. Quality function deployment: A literature review. Eur J
Oper Res 2002; 143: 463–97.
462 Costa AIA, Dekker M, Jongen WMF. Quality function deployment in the food
industry: a review. Trends Food Sci & Technol 2000; 11: 306–14.
463 Chan L-K, Wu M-L. Quality Function Deployment: A Comprehensive
Review of Its Concepts and Methods. Qual Eng 2002; 15: 23–35.
464 Pibouleau L, Boutron I, Reeves BC, Nizard R, Ravaud P. Applicability and
generalisability of published results of randomised controlled trials and non-
randomised studies evaluating four orthopaedic procedures: methodological
systematic review. Bmj 2009; 339: b4538–b4538.
465 Ahmad N, Boutron I, Dechartres A, Durieux P, Ravaud P. Applicability and
generalisability of the results of systematic reviews to public health practice
and policy: a systematic review. Trials 2010; 11: 20.
466 Burchett H, Umoquit M, Dobrow M. How do we know when research from
one setting can be useful in another? A review of external validity,
applicability and transferability frameworks. J Health Serv Res Policy 2011;
16: 238–44.
467 Weiss NS, Koepsell TD, Psaty BM. Generalizability of the results of
randomized trials. Arch Intern Med 2008; 168: 133–5.
468 Dekker M, Linnemann AR. Product development in the food industry. In:
Jongen W, Meulenberg M, eds. Innovation of food production systems:

324
product quality and consumer acceptance. Wageningen, NL, Wageningen
Pers, 1998: 67–8.
469 Dibari F, Tondeur MC. Informal workshop on bioavailability of
micronutrients in RUTF. F Exch 2010; 38: 21.
470 Beesabathuni KN, Natchu UCM. Production and Distribution of a Therapeutic
Nutritional Product for Severe Acute Malnutrition in India: Opportunities and
Challenges. Indian Pediatr 2010; 47: 702–6.
471 Weinstein MC, Stason WB. Foundations of Cost-Effectiveness Analysis for
Health and Medical Practices. N Engl J Med 1977; 296: 716–21.
472 Tekeste A. Cost-effectiveness analysis of Community-based and inpatient
therapeutic feeding programs to treat severe acute malnutrition in Sidama
Zone, SNNPRS, Ethiopia. 2007.
473 Wilford R, Golden K, Walker DG. Cost-effectiveness of community-based
management of acute malnutrition in Malawi. Heal Policy Plan
2011.PM:21378101.
474 Hallam A. Preliminary cost-effectiveness analysis of Concern/Valid
International CTC Programme in Malawi. , 2003.
475 Cunningham-Rundles S, Ahrné S, Johann-Liang R, et al. Effect of probiotic
bacteria on microbial host defense, growth, and immune function in human
immunodeficiency virus type-1 infection. Nutrients 2011; 3: 1042–70.
476 Kerac M, Bunn J, Seal A, et al. Probiotics and prebiotics for severe acute
malnutrition (PRONUT study): a double-blind efficacy randomised controlled
trial in Malawi. Lancet 2009; 374: 136–44.
477 Arimond M, Zeilani M, Jungjohann S, et al. Considerations in developing
lipid-based nutrient supplements for prevention of undernutrition: experience
from the International Lipid-Based Nutrient Supplements (iLiNS) Project.
Matern Child Nutr 2013.

325
478 Santini A, Novellino E, Armini V, Ritieni A. State of the art of Ready-to-Use
Therapeutic Food: A tool for nutraceuticals addition to foodstuff. Food Chem
2013; 140: 843–9.
479 Levine S, Chastre C. Missing the Point: An analysis of food security
interventions in the Great Lakes. London, Humanitarian Practice Network,
ODI, 2004.
480 WHO. WHO child growth standards. Acta Paediatr. 2006; 95: 1–101.
481 De Onis M, Onyango AW, Borghi E, Siyam A, Nishida C, Siekmann J.
Development of a WHO growth reference for school-aged children and
adolescents. Bull World Health Organ 2007; 85: 660–7.
482 Tortello R. A pioneer, a survivor. http://jamaica-
gleaner.com/pages/history/story0037.htm (accessed 31 Mar2012).
483 UNICEF. State or the World’s Children 2008: Child Survival. New York,
UNICEF, 2007.
484 Milk Powder Tech. Milk Powder Tech web site. http://alturl.com/36mjq
(accessed 9 Aug2012).
485 ACF Mecahnical Equipment. ACF Mecahnical Equipment web site.
http://alturl.com/oqkur (accessed 9 Aug2012).
486 Dekkers OM, von Elm E, Algra A, Romijn JA, Vandenbroucke JP. How to
assess the external validity of therapeutic trials: a conceptual approach. Int J
Epidemiol 2010; 39: 89–94.
487 Ferguson L. External Validity, Generalizability, and Knowledge Utilization. J
Nurs Scholarsh 2004; 36: 16–22.
488 Lavis JN, Posada FB, Haines A, Osei E. Use of research to inform public
policymaking. The Lancet . 2004; 364: 1615–21.
489 Wang S, Moss JR, Hiller JE. Applicability and transferability of interventions
in evidence-based public health . Heal Promot Int 21 : 76–83.

326
9 Appendices

327
9.1 Research articles
9.1.1 Directly related to this thesis
With first authorship of the PhD candidate:
1. Dibari F, Bahwere P, Huerga H, et al. Development of a cross‐over randomized trial method to determine the acceptability and safety of novel ready‐to‐use therapeutic foods. Nutrition 2013; 29: 107–12.
2. Dibari F, Diop H, Collins S, Seal A. Low‐Cost , Ready‐to‐Use Therapeutic Foods Can Be
Designed Using Locally Available Commodities with the Aid of Linear Programming. The Journal of nutrition 2012; 142: 955–66.
3. Dibari F, Le Gall I, Guerrero S, Mwaniki D, Seal A. A qualitative investigation of
adherence to nutritional therapy in malnourished adult AIDS patients in Kenya. Public Health Nutr 2012; 15: 316–23.
4. Dibari F. Acceptability trial of a novel RUTF based on soy, lentils and rice. Field
Exchange 2010; 39: 12–3.
With co‐authorship of the PhD candidate:
1 Irena AH, Bahwere P, Owino VO, Victor O. Owino, ElHadji I. Diop, Max O. Bachmann, Clara Mbwili‐Muleya, Filippo Dibari, Kate Sadler and Steve Collins. Comparison of the effectiveness of a milk‐free soy‐maize‐sorghum‐based ready‐to‐use therapeutic food to standard ready‐to‐use therapeutic food with 25% milk in nutrition management of severely acutely malnourished Zambian children: an equivalence non‐blinded cluster randomised controlled trial. Maternal & child nutrition 2013.
2 Owino VO, Irena AH, Dibari F, Collins S. Development and acceptability of a novel milk‐free soybean‐maize‐sorghum ready‐to‐use therapeutic food (SMS‐RUTF) based on industrial extrusion cooking process. Maternal and Child Nutrition 2012; in press.
3 Bisimwa G, Owino VO, Bahwere P, et al. Randomized controlled trial of the effectiveness of a soybean‐maize‐sorghum–based ready‐to‐use complementary food paste on infant growth in South Kivu, Democratic Republic of Congo. The American Journal of Clinical Nutrition 2012; 95: 1157–64.

328
9.1.2 Presentations to meetings and conferences
Action Against Hunger ‐ Hunger Talks. October 2012. London
‘Linear Programming: A Nutritional Perspective – watch on http://goo.gl/w79Gg
Medicus Mundi ‐ “An Ideal Match?! Connecting NGOs and Academia in Research for Global Health”. September 2011. Amsterdam.
A cheaper ready‐to‐use therapeutic food (RUTF) specific for wasted adults living with HIV/TB in low‐income countries: a randomised clinical trial testing its effectiveness in an MSF/Holland programme (Zimbabwe).
Gain Regional Forum – Johannesburg 2010
Is it possible to rehabilitate adult HIV/TB wasting in high prevalence rural areas? An on‐going Kenyan experience – watch on http://goo.gl/LoZoM.
Rank Prize ‐ Mini‐symposium on Nutrition and HIV. Winderemere, UK 2009
Operational aspects of therapeutic nutritional rehabilitation for HIV/TB patients: the use of ready to use therapeutic foods
39th Union World Conference on Lung Health – Paris October 2008
Operational aspects of therapeutic nutritional rehabilitation for HIV/TB patients: the use of ready to use therapeutic foods
5th TICH Annual Scientific Conference. Kisumu, Kenya May 2008
Are UN nutrient requirements for adults living with HIV appropriate when applied to nutritional therapy for the severely malnourished?
FAO/HQ – Rome, September 2007
HIV & severe acute malnutrition: improvements in the use of Ready to Use Foods in limited‐resources contexts
Concern International, Irish Aid and WFP ‐ Inter‐agency Consultative Group Workshop ‐ Food Assistance Programming in the Context of HIV, Food Assistance in the Context of HIV Handbook Review. Dublin December 2006.
Are UN nutrient requirements for adults living with HIV appropriate when applied to nutritional therapy for the severely malnourished?

329
9.2 Study‐related material
9.2.1 Ethical approval of the Kenyan studies

330
9.2.2 Compliance study [071114]
QUESTIONNAIRE – Patient I.D. CODE: ______ Date: __/11/2007 Starting time: ___:___ Finishing time: ___:___ Name translator: ______________________Place: ______________________ Key informant information [patient]: Consent given [yes/no]
FUCHIA No.
Age Sex Married[Yes/No]
Widow[yes/no]
Children[number]
Hiv/TB Under Plumpynut [yes/ex]
With a buddy or a carer [yes/no]
1. What did you receive for the treatment of your thinness? [Question 1.b]
- Nothing stop
- Afya stop
- Plumpynut® [Question 1.b]
- Foundation+ stop
1.b According to you, is Plumpynut® a food or a drug ? [Question 2]
2. How much Plumpynut® did you receive for the treatment? _______________
sachets/day 3. What did the medical staff tell you about the Plumpynut®?
- ______________________________________________________ - ______________________________________________________ - ______________________________________________________ - ______________________________________________________ - ______________________________________________________
4. Could you eat all the sachets per day that the medical staff prescribed?
- Yes [Question 5]
- No [Question 7]
5. What are the DISADVANTAGES provided by the Plumpynut®? [ Question 6]
- ______________________________________________________ - ______________________________________________________ - ______________________________________________________ - ______________________________________________________ - ______________________________________________________
6. What are the ADVANTAGES provided by the Plumpynut®? [ Question 8]

331
- ______________________________________________________ - ______________________________________________________ - ______________________________________________________ - ______________________________________________________ - ______________________________________________________
7. Why you could not apply the indications suggested by the medical staff? [ Question
5] - ______________________________________________________ - ______________________________________________________ - ______________________________________________________ - ______________________________________________________ - ______________________________________________________
8. Did you manage to eat all the amount of Plumpynut® prescribed per day?
- Yes [Question 9]
- No [Question 12]
9. Did you mix the Plumpynut® with other food?
- Yes [Question 10]
- No [Question 13]
10. Which food did you mix the Plumpynut® with? [ Question 11]
- ______________________________________________________ - ______________________________________________________ - ______________________________________________________
11. What was roughly the proportion of mixing? [ Question 13]
- ______________________________________________________ - ______________________________________________________ - ______________________________________________________
12. Why did you not manage to eat the prescribed amount of Plumpynut®? [ Question 9]
- ______________________________________________________ - ______________________________________________________ - ______________________________________________________
13. What do you think about the packaging of Plumpynut®? [ Question 14] - ______________________________________________________ - ______________________________________________________ - ______________________________________________________ - ______________________________________________________ - ______________________________________________________
14. How would you IMPROVE the Plumpynut® in terms of: [ Question 15]
- Taste?‐‐‐‐‐‐‐‐‐‐‐‐‐‐‐‐‐‐‐‐‐‐‐‐‐‐‐‐‐‐‐‐‐‐‐‐‐‐‐‐‐‐‐‐‐‐‐‐‐‐‐‐‐‐‐‐‐‐‐‐‐‐‐‐‐‐‐‐‐‐‐‐‐‐‐‐‐‐‐‐‐‐‐‐‐‐‐‐‐‐‐‐‐‐‐‐
- Consistence?‐‐‐‐‐‐‐‐‐‐‐‐‐‐‐‐‐‐‐‐‐‐‐‐‐‐‐‐‐‐‐‐‐‐‐‐‐‐‐‐‐‐‐‐‐‐‐‐‐‐‐‐‐‐‐‐‐‐‐‐‐‐‐‐‐‐‐‐‐‐‐‐‐‐‐‐‐‐‐‐‐‐‐‐‐‐‐
- Smell?‐‐‐‐‐‐‐‐‐‐‐‐‐‐‐‐‐‐‐‐‐‐‐‐‐‐‐‐‐‐‐‐‐‐‐‐‐‐‐‐‐‐‐‐‐‐‐‐‐‐‐‐‐‐‐‐‐‐‐‐‐‐‐‐‐‐‐‐‐‐‐‐‐‐‐‐‐‐‐‐‐‐‐‐‐‐‐‐‐‐‐‐‐‐‐

332
- Packaging? ‐‐‐‐‐‐‐‐‐‐‐‐‐‐‐‐‐‐‐‐‐‐‐‐‐‐‐‐‐‐‐‐‐‐‐‐‐‐‐‐‐‐‐‐‐‐‐‐‐‐‐‐‐‐‐‐‐‐‐‐‐‐‐‐‐‐‐‐‐‐‐‐‐‐‐‐‐‐‐‐‐‐‐‐‐‐‐‐‐
15. Did you make other people taste the product?
- Yes [Question 16]
- No [Question 17]
16. Who were they? [ Question 18]
- Children comments? ‐‐‐‐‐‐‐‐‐‐‐‐‐‐‐‐‐‐‐‐‐‐‐‐‐‐‐‐‐‐‐‐‐‐‐‐‐‐‐‐‐‐‐‐‐‐‐‐‐‐‐‐‐‐‐‐‐‐
- Adults comments? ‐‐‐‐‐‐‐‐‐‐‐‐‐‐‐‐‐‐‐‐‐‐‐‐‐‐‐‐‐‐‐‐‐‐‐‐‐‐‐‐‐‐‐‐‐‐‐‐‐‐‐‐‐‐‐‐‐‐
17. Why you did not want to make other people taste the Plumpynut®? [ Question 18]
- ______________________________________________________ - ______________________________________________________ - ______________________________________________________
18. Please, can you share a negative STORY related to Plumpynut®? [ Question 19]
- ______________________________________________________ - ______________________________________________________ - ______________________________________________________
19. Please, can you share a positive STORY related to Plumpynut®? [ Question 20]
- ______________________________________________________ - ______________________________________________________ - ______________________________________________________
20. What did you normally eat in the same day beside the Plumpynut®? stop
- ______________________________________________________ - ______________________________________________________ - ______________________________________________________

333

334

335
9.2.3 Acceptability and safety study
9.2.3.1 Informed Consent
Check list of contents for the study subject consent
Survey Information Sheet for Requesting Participants Consent - IMPORTANT for the ADMINISTRATOR or the information sheet (to read BEFORE starting):
Explain the following topics ONLY if: the patient is ABLE to understand them. I.e.: same language of the speaker (DhoLuo, or
English, etc.), healthy mental status, not under drugs, etc. TIME is available to explore all the different aspects, including answering to possible
questions TOPICS to cover for informed consent:
(please tick on the little box beside)
The University of London and Valid International are working together with MoH, MSF, KEMRI and other implementing partners to promote the nutritional status of the adult population in the Homabay area who are malnourished and who are also living with HIV. The aim of the survey is to test a new nutritional therapy specific for people are malnourished and who might be having the virus of HIV and therefore in need of ART.
The new nutritional product will be tested in this first phase of the study on patients who are HIV+, under ART but who are not malnourished or in complex clinical conditions
If you decide not to participate to the study you will still receive the routine health care
Two different therapeutic nutritional products are now available and being tested. The old one is currently used by MSF when adults or children are malnourished disregarding their HIV status. A new one has been designed specifically for people living with HIV and may help to decrease the possibility of infections and produce quicker weight gain.
You will be not told which nutritional therapeutic product you are given to make the results of the study more objective. But, if you wish, you can request to know which one you have received at the end of the study.
The new product is very similar to the old one, but is cheaper and has different amounts of vitamins and minerals. It is expected to be at least as good as the old kind of product or even better.
The risk of the new product being at all harmful has been minimized as much as possible by carrying out various analysis on the product
If the new product is found to be more efficient than the old one in helping people living recover and gain weight many people in the whole world will benefit enormously from it.
If the new product will perform just as well it will be still good because the new one is cheaper than the old one so more product can be produced and more people can benefit.
If you decide to take part in the survey you may choose to stop participating at any time you wish and nothing bad will happen. You will continue to receive any food aid and/or health care you are already getting in the normal way.
If during your treatment you delay in coming to the clinic, somebody from our team will try to call your phone number (if any) and to try to understand the reason for your defaulting.

336
If you do not want this to happen now or later, you will be still entitled to participate to get full medical assistance During the study you may be invited to be interviewed about problems you faced along the consumption of the food. Your opinion will be very important to allow us to improve the product and the delivery service for other people. The opinions you will share with us will be not associated to your identification.
If you do not want to share your opinions with us, you will be still entitled to participate to the study.
Please feel free to ask any questions you may have at any time during the study.
Which criteria for admission? If not respected you will be not admitted – sorry!
BMI 18.5 – 20
Residents or living close to Homa Bay town
What should I do to participate to the study?
Every day you MUST come with you the MSF or MoH patient card (blue or yellow)
You will come/arrive to the study site (Homa Bay downtown):
between 11:30am and 13:00pm and you will remain there only for two or three hours maximum
every day (from Monday to Fridaty):
o from the 30th of June to the 11th of July (2 weeks) and
o from the 21st of July to the 1st of August (other 2 weeks)
VERY IMPORTANT:
If you will miss more than 2 days: you will be asked not to come back to the study
you will be not admitted anymore
What will I get during the study?
you will get free lunch based on Plumpynut or the new product
you will get clean drinkable water
you will get a reimbursement of 100 KSh for the transport every day
you will get a certificate of participation to the study

337
Homa bay: __/__/2008
CONSENT FORM Title of project:
A randomized controlled non-inferiority trial of a low-cost, nutrient-dense food, for malnourished HIV positive Kenyan adults being treated with standard ART -
Acceptability Trial phase
(Please put your initials in the box)
1. I confirm that I have read and understood the information details of the study provided in information sheet dated for the above study and have had the opportunity to ask questions. An gi adier ni asomo kendo awinjo andikegi duto maluore gi risachni kendo aydo thuolo mar penjo mondo olerna kwende ma ok awinjo
2. I confirm that I have had sufficient time to consider whether or not I want to be included in the study An gi adiera ni ne omiya thuolo moromo mondo ayangi awuon ka adwaro donjo e risachni kata ooyo.
3. I understand that my participation is voluntary and that I am free to withdraw at any time, without giving any reason, without my medical care or legal rights being affected. Angeyo ni donjo e risachni en yiro mara kendo anyalo wuokie samoro a mora mahero ma onge gima aluoro ka luwore gi ngimana mapile
4. I understand that sections of any of my medical notes may be looked at by responsible individuals from the research project team or from regulatory authorities where it is relevant to my taking part in research. I give permission for these individuals to have access to my records. Angeyo ni bugena mag osubtal inyalo ngiyo gi jotich mochungne risachni
5. I am happy to receive the tracing team in case I do not come to the fixed appointment. An gi adier ni asomo kendo awinjo andikegi duto maluore gi risachni kendo. Mora mahero ma onge gima aluoro ka luwore gi ngimana mapile
6.
I agree to take part in the above study. Ayie mondo abed achiel kuom joma odonjo e risachni
1 form for Patient; 1 to be kept as part of the study documentation,
(Continued on next page)

338
1 form for Patient; 1 to be kept as part of the study documentation, Homa bay: __/__/2008
Name of patient (Nyingi) Date (Tarik) Signature (Seyi mari)
Name of Person taking consent (if different from researcher) (Nying ngama ndiko jatuo)
Date (Tarik) Signature (Seyi mar jandiko)
Researcher (to be contacted if there are any problems) (Nying ngama ochungne risach ma onego wuogo ka nitie wach moro)
Date (Tarik) Signature (Seyi mar ngama ochung ne risachni)
Comments or concerns during the study
If you have any comments or concerns you may discuss these with the investigator (Filippo Dibari, Tel. 0728 163455). If you wish to go further and complain about any aspect of the way you have been approached or treated during the course of the study, you should write or get in touch with anyone of the MoH/MSF clinicians who are fully aware of the study (tel. 05922401), the MSF field coordinator (Tel. 05922401). Ka ini wach moro amora to inyalo wuoyo gi ngama ochungne risach ni miluongo ni Filippo. To ka wach moro ochuanyi inyalo wuoyo gi to Migawo mag thieth e Homa Bay District kata gi ngama ochungne MSF
9.2.3.2 Data collection forms
A: SOCIO‐DEMOGRAPHIC DATA Survey Id. No. __/__/ Date of interview __/__/2008 First name……………………………………….. Age (years) __/__/ Village/Town of residence…………………………………………. Sex (1=Male) (2=Female) Marital status (1=Single) (2=married) (3=separated/divorced ) (4= widowed.) Number of children/siblings __/__/ Education Attained/Mother/Father:
(1=No formal education) (2=Adult education) (3=Primary school only) (4=primary school + training) (5=A few years in secondary school) (6=Form four only) (7=Form four + training)

339
(8=Form six only) (9=form six+ training) (10=College/university)
Economic activity/Mother/Father (1=Farming only) (2=trading/artisan) (3=pastoralist only) (4=farming pastoralist) (5=trading/artisan+farming) (6=Formal employment) (7=informal employment) (8=Disabled or too old.)
Tribe (1=Luo) (2=kisii) (3=kamba) (4=Kalenjin) (5‐ Others (Specify:______________) Religion (1= Catholic) (2=protestant) (3=muslim) (4‐traditional) (5‐none) Phone number(s) for contact (if any) __/__/__/__/__/__/__/__/__/__/ This phone number belongs to (please tick):
(1=The client) (2=Member of the family of the client) (3=Neighbour or other)
B. Socio‐economic indicators: living conditions
1 Of which material are the walls of the main house made of? ...................
(1=mud and wooden pole) (2=unburnt mud brick) (3=burnt bricks) (4= cement or stone blocks) (5=iron sheets) (6=timber)
2. Which roofing material is your house made of? (1=iron sheets) (2=papyrus/grass thatch) (3=tiles) (4=other (specify:____________________) 3. What is your main source of cooking fuel? (1=firewood) (2=charcoal) (3=paraffin) (4=gas) (5=electricity)
4. What is your main source of lighting?
(1=open fire) (2=kerosene burner) (3=kerosene lamp) (4=electricity) (5=gas lamp)
(6=others (specify:________________________) 5a.Which of the following items do you posses?
(1=radio) (2=bicycle) (3=motor cycle) (4=tv) (5=car)
b. Do you have any of these animals? (Specify the number) Goats……………............... (1=yes) (2=NO) Sheep…………………….. (1=yes) (2=NO) Cows……………………... (1=yes) (2=NO) Poultry…………………….(1=yes) (2=NO) Others (specify)………… (1=yes) (2=NO) 6. Where do your children (brothers/sisters) go to school?
Child 1: __/ Child 2: __/

340
Child 3: __/ Child 4: __/ Child 5: __/
(1=Public day secondary/primary) (2=private day secondary/primary) (3=Boarding secondary/primary school) (4=Not school going age) (5=read at home)

341
b) DIETARY DIVERSITY QUESTIONNAIRE Date: __/__/__/ Survey Id.No.: __/__/ Name:_________________________________________ Fluent in Swahili/English (yes=1) (No=2)
Please describe the foods (meals and snacks) that you ate yesterday from the moment you woke up until when you went to bed, whether at home or outside the home. Start with the first food eaten in the morning. Diher nyisa chiemo mane miichamo nyoro chakre saa mane ichiewo nyaka saa mane idhi nindo, e odi kata oko mar odi.Chakna gi chiemo mi chamo gokinyi.
Question number
Food group Examples
Coding categories
1 CEREALS Kothe
Any foods made from millet, sorghum, maize, rice, wheat (ugali, bread, biscuits, cakes porridge or pastes or other locally available grains. Chiemo mora mora molos gi bel, kal, bando,ochele, ngano, kata nyuka mimatho molos gi gigi.
1
(YES=1)
(NO=2)
2 VITAMIN A RICH VEGETABLES AND TUBERS
pumpkin, carrots or sweet potatoes that are orange inside, sweet pepper and other vitamin A rich vegetables. Budho, carrot, rabuon ratong gi mamoko.
2
(YES=1)
(NO=2)
3 WHITE TUBERS AND ROOTS
Irish potatoes, white yams,white sweet potatoes cassava, or foods made from roots. Gwacho/waru, nduma, rabuon marachar, marieba gi mamoko
3
(YES=1)
(NO=2)
4 DARK GREEN LEAFY VEGETABLES
dark green/leafy vegetables e.g. amaranthus, black night shade, spider plant, cowpeas leaves, pumpkin leaves, kales, spinach, cassava leaves + other wild ones. Mchicha/ododo, dek, boo, susa, sukuma,spinach, it marieba, mrende gi mamoko
4
(YES=1)
(NO=2)
5 OTHER VEGETABLES
other vegetables (e.g. tomato, onion, eggplant) , including wild vegetables nyanya, kitunguu, gi mamoko
5 (YES=1)
(NO=2)
6 VITAMIN A RICH FRUITS
ripe mangoes, paw paws, water melon +other locally available vitamin A-rich fruits maembe, poo poo, water melon gi mamoko
6 (YES=1)
(NO=2)

342
Question number
Food group
Examples
Coding categories
7 OTHER FRUITS Oranges, passion, pineapples, Ovacado, bananas, including wild fruits. Machungwa, ovacado, matunda, rabolo gi mamoko.
7 (YES=1)
(NO=2)
8 ORGAN MEAT (IRON-RICH)
liver, kidney, heart, gizzard, intestines or other organ meats or blood-based foods. Chuny, nyama rogno, obo, matumbo, remo gi mamoko.
8 (YES=1)
(NO=2)
9 FLESH MEATS beef, pork, lamb, goat, rabbit, wild game, chicken, duck, or other birds. Ring-dhiang, anguro, rombo,diel, apuoyo, le, gweno.
9 (YES=1)
(NO=2)
10 EGGS Tong’
All types 10 (YES=1)
(NO=2)
11 FISH Rech
Fresh or dried fish or shellfish. Manumo koso mothol; Omena, ngege, mbuta gi mamoko
11 (YES=1)
(NO=2)
12 LEGUMES, NUTS AND SEEDS
beans, peas, lentils, nuts, seeds or foods made from these. Ng’or oganda, njugu, ndengu kata chiemo molos gi magi
12 (YES=1)
(NO=2)
13 MILK AND MILK PRODUCTS chakgi
milk, yogurt or other milk products 13 (YES=1)
(NO=2)
14 OILS AND FATS Mor tedo
oil, fats or butter added to food or used for cooking 14 (YES=1)
(NO=2)
15 SWEETS Tamtam/peremende
sugar, honey, sweetened soda or sugary foods such as chocolates, sweets or candies sukari, mar kich, soda, chocolate,tamtam
15 (YES=1)
(NO=2)
16 SPICES, CONDIMENTS, BEVERAGES
Spices, black pepper, salt), coffee, tea alcoholic beverages e.g. beer, wine Or local examples.Apilo, chumbi, chach majani, chach kahawa,beer, busaa, chang’aa
16 (YES=1)
(NO=2)
Individual level only Did you eat anything (meal or snack) OUTSIDE of the home yesterday?
(YES=1)
(NO=2)

343
HEDONISTIC SCALE – phase 2 – 2nd week Client name:__/__/__/__/__/__/__/__/__/__/__/__/__/
Surv.No.Id.: __/__/
Group: (1) (2)
Place: (Kamaria = 1) (DSTV=2)
Questions
1.1. Ask them if they liked the ____________ and circle their responses from the list below
(very happy) (happy) (okay) (Not happy) (very unhappy)
1 2 3 4 5
1.2. Ask them what they think the __________ looks or taste like and record their
response.
1.3. Ask them what it is that they like about the _____________ and record their responses in the order they are given.
a.
b.
c.
d.
1.4. Ask them what they do not like about the ______________ and record their responses in the order they are given
e.
f.
g.
h.

344
2. Make sure that by the end of the answers, they have given their opinion on each of the
following aspects and record their assessment by circling a number on the scale of 1-5 below
very happy happy okay not happy very unhappy
Colour 1 2 3 4 5
Taste 1 2 3 4 5
Sweetness 1 2 3 4 5
Texture (thickness/smoothness) 1 2 3 4 5
3. Write here any other comments made by the client that are not described above. 4. General comment

345
PATIENT QUESTIONNAIRE [ Acceptability TRIAL – Homa Bay – Valid International / MSF-F ]
PART 1 - At admission
To fill by Valid International staff member:
1. Remember to the client that he/she could not qualify due to the criteria
2. No. of the MoH/MSF card: __/__/__/__/__/__/__/__/
3. First name: __/__/__/__/__/__/__/__/__/__/__/__/__/__/__/
4. CRITERIA 1 - Age (years): __/__/
5. CRITERIA 2 - To be filled by MSF Medical staff member – possible clinical exclusion criteria
Presence of oedema Yes/No
Adults with severe cerebral palsy or obvious dysmorphic features suggestive of an underlying syndrome (e.g. Trisomy 21) – excluding lipodistrophy
Yes/No
Amputated limbs (if occurring during the trial) Yes/No
With general mental health problems (e.g. Down syndrome, etc.) Yes/No
Any uncontrolled or untreatable systemic opportunistic infection at the time of study entry or irreversible oral problems that prevent adequate swallowing (NB: typical AIDS oral thrush would not be an exclusion criteria)
Yes/No
Name (capital letters) of MSF Medical Staff Member: _______________________________________________________
Signature: _________________________________ Date: __/__/2008
To fill by Valid International staff member: CRITERIA 3 - Weight (kg): __/ , __/__/ Height (meters): __/ , __/__/ BMI (kg/m2): __/ , __/__/
(ONLY acceptable range: 18.5 – 19.9)
CRITERIA 4 - Village/Town of residence: __/__/__/__/__/__/__/__/__/__/__/__/__/ NB: H.Bay or very close!!!!
CRITERIA 5 - Under Antiretroviral drugs right now? __/ (no=1; yes=2) NB: he/she MUST be under ART!!!!!!
CRITERIA 6 - Did the patient give his/her informed consent given: __/ (no=1; yes=2) NB: consent SHOULD be
given!Sex: __/ (Female=1; Male=2) If a woman, is the patient lactating? __/ (No=1; Yes=2)
Marital Status: __/ (Married=1; Not Married=2; Widower=3)
Phone number(s) for contact (if any): __/__/__/__/__/__/__/__/__/__/__/__/__/__/ Under Plumpynut in the past? __/ (No=1; Yes=2)
FUCHIA number: __/__/__/__/__/__/__/__/__/__/__/__/__/ IMPORTANT: assign the survey ID No. + Group + Client Responsible here beneath

346
PART 2 - GENERAL
Mon
day
30/0
6/20
08
Tue
sday
01
/07/
2008
Wed
nesd
ay
02/0
7/20
08
Thu
rsda
y 03
/07/
2008
Frid
ay
04/0
7/20
08
Mon
day
07/0
7/20
08
Tue
sday
08
/07/
2008
Wed
nesd
ay
09/0
7/20
08
Thu
rsda
y 10
/07/
2008
Frid
ay
11/0
7/20
08
Weight (in kg) __/__/ , __/ __/__/ , __/ __/__/ , __/ __/__/ , __/ __/__/ , __/ __/__/ , __/ __/__/ , __/ __/__/ , __/ __/__/ , __/ __/__/ , __/
MUAC (in cm) __/__/ , __/ __/__/ , __/
Did the patient come with a carer? (No=1; Yes=2) __/ __/ __/ __/ __/ __/ __/ __/ __/ __/ Presence of oral sores? – check! (No=1; Yes=2) __/ __/ __/ __/ __/ __/ __/ __/ __/ __/ Presence of throat sores? – check! (No=1; Yes=2) __/ __/ __/ __/ __/ __/ __/ __/ __/ __/ Does the patient manage to swallow? – make a test!
(No=1; Yes=2) __/ __/ __/ __/ __/ __/ __/ __/ __/ __/ Ho do you feel today?
Not hungry?=1 Little hungry=2 Hungry=3 Very hungry=4 __/ __/ __/ __/ __/ __/ __/ __/ __/ __/
Does the patient present any visible sign of illness?
(No=1; Yes=2) NB: if Yes report to Filippo __/ __/ __/ __/ __/ __/ __/ __/ __/ __/

347
PART 3 – 24 HOURS RECALL – sheet 1/2
Question: Koro adwa penji ka inyalo paro matin kuom gik motimore chakre nyoro kogwen nyaka sani, be inyalo yiena atim kamano? Now I am going to ask you to remember few things regarding what happened since yesterday at dawn until now, is that ok with you? NB: administer this questionnaire BEFORE the consumption of the product!
Mon
day
30/0
6/20
08
Tue
sday
01
/07/
2008
Wed
nesd
ay
02/0
7/20
08
Thu
rsda
y 03
/07/
2008
Frid
ay
04/0
7/20
08
Mon
day
07/0
7/20
08
Tue
sday
08
/07/
2008
Wed
nesd
ay
09/0
7/20
08
Thu
rsda
y 10
/07/
2008
Frid
ay
11/0
7/20
08
Question 1: Chakre nyoro kogwen, be isewinjo koyo kata liet? Since yesterday morning at dawn did you feel any fever?
(No=1; Yes=2) __/ __/ __/ __/ __/ __/ __/ __/ __/ __/ Question 2:Chakre nyoro kogwen, be isediewo? to ka ne odiewo, idhi e choo didi? Since yesterday morning at dawn did you have any case of liquid dhiarrea? If so, how many times did you go to the toilet approximately?
Number of times:
__/__/
Number of times:
__/__/
Number of times:
__/__/
Number of times:
__/__/
Number of times:
__/__/
Number of times:
__/__/
Number of times:
__/__/
Number of times:
__/__/
Number of times:
__/__/
Number of times:
__/__/
Question 3: Chakre nyoro kogwen be isewinjo ka chuny lewi? Since yesterday morning at dawn did you feel any nausea?
(No=1; Yes=2) __/ __/ __/ __/ __/ __/ __/ __/ __/ __/ Question 4: Be ise ng’ok chakre nyoro kogwen? Have you vomited since yesterday morning at dawn?
(No=1; Yes=2) __/ __/ __/ __/ __/ __/ __/ __/ __/ __/ Question 5: Chakre nyoro kogwen,be isewinjo ka iyi obir? Since yesterday morning at dawn did you feel a sort of fullness of the stomach?
(No=1; Yes=2) __/ __/ __/ __/ __/ __/ __/ __/ __/ __/

348
sheet 2/2
Mon
day
30
/06/
200
8
Tue
sday
01
/07/
200
8
We
dnes
day
02
/07/
200
8
Thu
rsda
y 03
/07/
200
8
Frid
ay
04/0
7/2
008
Mon
day
07
/07/
200
8
Tue
sday
08
/07/
200
8
We
dnes
day
09
/07/
200
8
Thu
rsda
y 10
/07/
200
8
Frid
ay
11/0
7/20
08
Question 6: Chakre nyoro kogwen, be isewinjo ka iyi rami? Since yesterday morning at dawn did you feel pain at your belly? (No=1; Yes=2) __/ __/ __/ __/ __/ __/ __/ __/ __/ __/ Question 7: Chakre nyoro kogwen, be isebedo gi chandrwok mar golo muya? Since yesterday morning at dawn did you have problems like flatulence?
(No=1; Yes=2) __/ __/ __/ __/ __/ __/ __/ __/ __/ __/ Question 8: Chakre nyoro kogwen, be dendi kamora amora no oili ma ok ni kare? Since yesterday morning at dawn did some parts of your skin unusually itching ?
(No=1; Yes=2) __/ __/ __/ __/ __/ __/ __/ __/ __/ __/ Question 9: Chakre nyoro kogwen, be isebedo ki fuolo? Since yesterday morning at dawn did you have cough attacks?
(No=1; Yes=2) __/ __/ __/ __/ __/ __/ __/ __/ __/ __/ Question 10: Chakre nyoro kogwen, be isewinjo gimoro mopogore kata nyien kata gimora amora ma diher nyisa? Since yesterday morning at dawn did you notice anything strange or new?
(No=1; Yes=2) __/ __/ __/ __/ __/ __/ __/ __/ __/ __/ Question 11: Chakre nyoro __/ __/ __/ __/ __/ __/ __/ __/ __/ __/

349
Mon
day
30/0
6/2
008
Tue
sday
01
/07/
200
8
Wed
nesd
ay
02/0
7/2
008
Thu
rsda
y 03
/07/
200
8
Frid
ay
04/0
7/2
008
Mon
day
07/0
7/2
008
Tue
sday
08
/07/
200
8
Wed
nesd
ay
09/0
7/2
008
Thu
rsda
y 10
/07/
200
8
Frid
ay
11/0
7/20
08
kogwen, be isemwonyo yien moro amora mag vitamins? Since yesterday morning at dawn did you take any vitamins pills?
(No=1; Yes=2) Question 12: Chakre nyoro kogwen, be isemadho nyuka mi imiyo u gi MSF?(ma ok plumpy) Since yesterday morning at dawn did you take any fortified porridge provided by MSF? (NB: not the plumpynut!) (No=1; Yes=2) __/ __/ __/ __/ __/ __/ __/ __/ __/ __/

350
PART 4 - PRODUCT
250 g to give Mon
day
30/0
6/20
08
Tue
sday
01
/07/
2008
Wed
nesd
ay
02/0
7/20
08
Thu
rsda
y 03
/07/
2008
Frid
ay
04/0
7/20
08
Mon
day
07/0
7/20
08
Tue
sday
08
/07/
2008
Wed
nesd
ay
09/0
7/20
08
Thu
rsda
y 10
/07/
2008
Frid
ay
11/0
7/20
08
1. Did you calibrate the scale before using it?
(No=1; Yes=2) __/ __/ __/ __/ __/ __/ __/ __/ __/ __/
2. Did you take the tare of the container ?
(No=1; Yes=2) __/ __/ __/ __/ __/ __/ __/ __/ __/ __/
3. Kind of product (Plumpynut=1; RUTFH=2) __/ __/ __/ __/ __/ __/ __/ __/ __/ __/
4. Time to start (hours : minutes) __/__/ : __/__/
__/__/ : __/__/ __/__/ : __/__/ __/__/ : __/__/ __/__/ : __/__/ __/__/ : __/__/ __/__/ : __/__/
__/__/ : __/__/ __/__/ : __/__/
__/__/ : __/__/
5. Quantity given (in grams) - 250 grams
A __/__/__/ __/__/__/ __/__/__/ __/__/__/ __/__/__/ __/__/__/ __/__/__/ __/__/__/ __/__/__/ __/__/__/
6. Quantity left (in grams)
B __/__/__/ __/__/__/ __/__/__/ __/__/__/ __/__/__/ __/__/__/ __/__/__/ __/__/__/ __/__/__/ __/__/__/
7. Quantity wasted and/or spilled (in grams)
C __/__/__/ __/__/__/ __/__/__/ __/__/__/ __/__/__/ __/__/__/ __/__/__/ __/__/__/ __/__/__/ __/__/__/
8. Quantity eaten (in grams)
NB: D = A – B - C D
__/__/__/ __/__/__/ __/__/__/ __/__/__/ __/__/__/ __/__/__/ __/__/__/ __/__/__/ __/__/__/ __/__/__/
Question: Be diher mondo omedi chiemo no icham ka? Do you wish to have an extra amount to eat here?
(No=1; Yes=2) __/ __/ __/ __/ __/ __/ __/ __/ __/ __/
9. Time to finish (hours : minutes) __/__/ : __/__/
__/__/ : __/__/ __/__/ : __/__/ __/__/ : __/__/ __/__/ : __/__/ __/__/ : __/__/ __/__/ : __/__/
__/__/ : __/__/ __/__/ : __/__/
__/__/ : __/__/

351
PART 5 - WATER
250 ml to give Mon
day
30/0
6/20
08
Tue
sday
01
/07/
2008
Wed
nesd
ay
02/0
7/20
08
Thu
rsda
y 03
/07/
2008
Frid
ay
04/0
7/20
08
Mon
day
07/0
7/20
08
Tue
sday
08
/07/
2008
Wed
nesd
ay
09/0
7/20
08
Thu
rsda
y 10
/07/
2008
Frid
ay
11/0
7/20
08
1. Brand of water (name) <_____> <_____> <_____> <_____> <_____> <_____> <_____> <_____> <_____> <_____>
2. Quantity given (in ml) 250 ml or more
A __/__/__/ __/__/__/ __/__/__/ __/__/__/ __/__/__/ __/__/__/ __/__/__/ __/__/__/ __/__/__/ __/__/__/
3. Quantity left (in ml)
B __/__/__/ __/__/__/ __/__/__/ __/__/__/ __/__/__/ __/__/__/ __/__/__/ __/__/__/ __/__/__/ __/__/__/
4. Quantity wasted and/or spilled (in ml)
C __/__/__/ __/__/__/ __/__/__/ __/__/__/ __/__/__/ __/__/__/ __/__/__/ __/__/__/ __/__/__/ __/__/__/
5. Quantity drunk (in ml)
NB: D = A – B - C D
__/__/__/ __/__/__/ __/__/__/ __/__/__/ __/__/__/ __/__/__/ __/__/__/ __/__/__/ __/__/__/ __/__/__/

352
PART 6 - FURTHER OBSERVATIONS / QUESTIONS
Mon
day
30/0
6/20
08
Tue
sday
01
/07/
2008
Wed
nesd
ay
02/0
7/20
08
Thu
rsda
y 03
/07/
2008
Frid
ay
04/0
7/20
08
Mon
day
07/0
7/20
08
Tue
sday
08
/07/
2008
Wed
nesd
ay
09/0
7/20
08
Thu
rsda
y 10
/07/
2008
Frid
ay
11/0
7/20
08
The patient : Refuses to continue = 1 Is reluctant to continue = 2 Accepts to continue but not very
enthusiastic = 3 Is eager to continue taking = 4 __/ __/ __/ __/ __/ __/ __/ __/ __/ __/ Question: Koro akwayo mondo ibed abeda thuolo mondo inyisa kaka iwinjo chiemo ma wamiyi ni? You can honestly express your opinion. How do you find the product? Ober (Good) = 1 Omit ahinya (Too sweet) = 2 Moo ng’eny (Too oily) = 3 Chumbi ng’eny (Too salty) = 4 Mit ahinya kendo moo ng’eny
ahinya (Too sweet & oily) = 5 Omit ahinya kendo chumbi
ng’eny ahinya (Too sweet & salty) = 6
Chumbi ng’eny kendo moo ng’eny ahinya (Too salty & oily) = 7
Omit ahinya, chumbi ng’eny kendo moo ng’eny ahinya (Too sweet & oily & salty) = 8 __/ __/ __/ __/ __/
SIGNATURES OF THE RESPONSIBLE (for the client)

353
9.3 Published articles

Public Health Nutrition: page 1 of 8 doi:10.1017/S1368980010003435
A qualitative investigation of adherence to nutritional therapy inmalnourished adult AIDS patients in Kenya
Filippo Dibari1,2,*, Paluku Bahwere1, Isabelle Le Gall3, Saul Guerrero1,David Mwaniki4,5 and Andrew Seal21Valid International, 35 Leopold Street, Oxford OX4 1TW, UK: 2UCL Centre for International Health andDevelopment, Institute of Child Health, 30 Guilford Street, London WC1N 1EH, UK: 3MSF-France, Nairobi,Kenya/Paris, France: 4Centre for Public Health, Kenya Medical Research Institute, KEMRI/CPHR, Nairobi,Kenya: 5Academy for Educational Development/Regional Office for Eastern and Central Africa, Nairobi, Kenya
Submitted 2 June 2010: Accepted 25 October 2010
Abstract
Objective: To understand factors affecting the compliance of malnourished,HIV-positive adults with a nutritional protocol using ready-to-use therapeuticfood (RUTF; Plumpy’nut�R ).Design: Qualitative study using key informant interviews, focus group discussionsand direct observations.Setting: Ministry of Health HIV/programme supported by Medecins Sans Frontiers(MSF) in Nyanza Province, Kenya.Subjects: Adult patients (n 46) currently or previously affected by HIV-associatedwasting and receiving anti-retroviral therapy, their caregivers (n 2) and MoH/MSFmedical employees (n 8).Results: Thirty-four out of forty-six patients were receiving RUTF (8360 kJ/d) at thetime of the study and nineteen of them were wasted (BMI , 17 kg/m2). Six ofthe thirteen wasted out-patients came to the clinic without a caregiver and wereunable to carry their monthly provision (12 kg) of RUTF home because of physicalfrailty. Despite the patients’ enthusiasm about their weight gain and rapidresumption of labour activities, the taste of the product, diet monotony andclinical conditions associated with HIV made it impossible for half of them toconsume the daily prescription. Sharing the RUTF with other household membersand mixing with other foods were common. Staff training did not include ther-apeutic dietetic counselling.Conclusions: The level of reported compliance with the prescribed dose of RUTFwas low. An improved approach to treating malnourished HIV-positive adults inlimited resource contexts is needed and must consider strategies to supportpatients without a caregiver, development of therapeutic foods more suited toadult taste, specific dietetic training for health staff and the provision of liquidtherapeutic foods for severely ill patients.
KeywordsHIV
WastingSupplementation
Ready-to-use therapeutic food
Undernutrition associated with HIV is a public health
concern in Africa. Demographic and health surveys in eleven
sub-Saharan countries estimated that 10?3% of HIV-infected
women (aged 15–49 years) had a BMI ,18?5kg/m2(1); data
for men were not available. In urban Lusaka, Zambia, 9% of
adults (3624 out of 40 778) started anti-retroviral therapy
(ART) with a BMI , 16?0kg/m2(2).
Despite the increasing availability of ART, and
patients enrolled in food programmes while on treatment
reporting greater adherence to their medication(3,4),
HIV wasting is still common. Although the beneficial
effects of ART on severe malnutrition in adults are well
documented, Carr(5) reported severe toxicity associated
with ART in well-nourished individuals, and it has been
suggested that side effects may be worse in malnourished
individuals(6).
However, the relationship between nutritional status,
therapy and survival of adults undergoing ART is con-
troversial. According to Paton et al.(7), a BMI , 17 kg/m2
at the time of starting ART is associated with decreased
survival in adults. A large observational study of patients
receiving ART in Kenya and Cambodia (n 5069) showed
that a weight gain of only 5 % in 3 months increased
survival in adults with a BMI , 17 kg/m2(8).
Bahwere et al.(9) reported that a novel ready-to-use
therapeutic food (RUTF), nutritionally similar to commercially
SPublic
Hea
lth
Nutr
itio
n
*Corresponding author: Email [email protected] r The Authors 2011

available paediatric RUTF, was acceptable to malnourished
Malawian patients who were not receiving ART, and that it
improved their physical activity performance, nutritional
status and survival.
On the other hand, Ndekha et al.(10) found no differ-
ence in short-term survival when providing an energy-
dense RUTF, or a lower-density porridge-based food,
despite an increased weight gain with RUTF (n 450).
A retrospective analysis(11) of surveillance data on
adults under ART (n 329) and with a BMI , 17 kg/m2,
who were either receiving or not receiving an RUTF
(Afya; Compact AS, Bergen, Norway), also reported that it
was difficult to conclude a clear benefit of supplementary
food in the early months of ART in terms of survival.
In 2007, the UN officially approved the use of RUTF for
the treatment of acute malnutrition in children(12). This
approach has also been adopted in nutrition and health
programmes in developing countries targeting adults
with HIV/AIDS. However, only a paediatric formulation is
commercially available and there is limited evidence for its
efficacy, and little data on acceptability and adherence to
this formulation in HIV/tuberculosis (TB)-positive adults.
To understand why nutritional support may not be
providing consistent benefits, it is necessary to investi-
gate, among other things, the compliance of patients to
nutritional treatment and understand the factors that
affect this. In the present paper, we use ‘compliance’
to describe the extent to which a person’s behaviour –
taking medication, following a diet and/or executing
lifestyle changes – corresponds to agreed recommenda-
tions from a health-care provider(13–15).
The research questions of the present study aim (i) to
understand and describe compliance with a protocol based
on a specific RUTF (Plumpy’nut�R ; Nutriset, Malaunay,
France) among malnourished adults living with HIV; and
(ii) to determine any key barriers to compliance.
To our knowledge, the present study is the first
to qualitatively investigate compliance with nutritional
protocols based on RUTF that aim at rehabilitating mal-
nourished HIV adults. We report the results according to
the COREQ (consolidated criteria for reporting qualitative
research) guidelines(16).
Experimental methods
The present research took place in Homa Bay, Nyanza
Province, which is on the Kenyan side of Lake Victoria. In
Kenya, in 2007, the prevalence of HIV was the highest
in Nyanza Province (15?3 %), more than double the
national prevalence estimate(17). In January 2006, the
non-governmental organisation Medecins Sans Frontieres
(MSF), France, introduced a nutritional rehabilitation
programme for malnourished adults enrolled in the
Ministry of Health (MoH) ART programme, Kenya, which
utilised the most commonly available RUTF (brand
name: Plumpy’nut�R ; 8360 kJ/d (2000 kcal/d) equal to four
sachets of 92 g each). Adults ($15 years of age) were
considered malnourished (admission criteria) when BMI
was ,17 kg/m2 and/or middle upper-arm circumference
(MUAC) was ,185 mm and/or the presence of oedema
was observed. Discharge criteria from the nutrition pro-
gramme included BMI $18 kg/m2 and MUAC $ 185 mm,
and absence of oedema in at least two consecutive visits.
Along with the supply of RUTF, the medical staff provided
generic nutritional counselling. These same staff members
had never received any specific training in therapeutic
nutritional treatment counselling for HIV adult patients.
Subjects recruitment and sampling
The study subjects, enrolled at the MoH/MSF HIV/TB
programme in Homa Bay health district, Nyanza Province,
Kenya, came from three groups: patients enrolled in the
programme (some already nutritionally rehabilitated);
their caregivers; and medical staff (counsellors, nurses and
clinical officers). Patients ,15 years of age were not
admitted into the study group. The patients were recruited
either at MoH/MSF HIV clinics A and B at Homa Bay
hospital or from TB wards 7 and 8 of the same hospital.
The study followed a non-probabilistic, purposive,
heterogeneous, non-proportional quota sampling system.
Data saturation was achieved after approximately two-
thirds of the study; however, recruitment continued along
the entire planned period (3 weeks). During the study
period, patients coming for their usual routine visit were
invited to participate by the nurse in charge of the nutrition
programme. All the health staff working at the clinic during
the study agreed to participate. All focus group discussions
and interviews occurred in a quiet area within the HIV
clinic compound in the presence of researchers only,
whereas direct observations were made in the TB multi-
drug resistance ward at Homa Bay hospital.
Data collection and data analysis
The research applied three qualitative methods and the
results were triangulated. Focus group discussions involved
patients and caregivers and one separate session with
members of the MoH/MSF medical staff; semi-structured
interviews were administered to patients on a one-to-
one basis; direct unobtrusive observations were made of
Plumpy’nut�R distribution and consumption in the HIV/TB
wards. The questionnaires and focus group discussions used
a variety of techniques, including free listing, ranking exer-
cises and open-ended questions (see footnotes in Table 3).
Questionnaires and focus group guides
Two guides were developed and piloted for use in the focus
groups: one for patients and caregivers and one for the
health staff members. The guides and questionnaires cov-
ered four topics: (i) information provided to patients about
the recommended use and consumption of Plumpy’nut�R ;
(ii) knowledge and attitude of patients about the role of
SPublic
Hea
lth
Nutr
itio
n2 F Dibari et al.

Plumpy’nut�R in their therapy; (iii) dietary practices and
Plumpy’nut�R consumption; and (iv) patient’s and caregiver’s
experience of the Plumpy’nut�R distribution system.
A checklist for the direct observations was developed
and covered the ways of consuming Plumpy’nut�R , their
advantages and disadvantages, together with the role of
the caregiver.
All focus group discussions were recorded on tape,
allowing the checking of information that was not clear
from the written notes. The focus group discussions
and interviews did not last for more than 1.5 and 1 h,
respectively. The direct observation sessions lasted
between 30 min and 1 h. A small number of photographs
were taken with the informed consent of patients.
The research team and the relationship with subjects
The focus group discussions and interviews were con-
ducted in the Luo language. Two native speakers, a female
and a male, were recruited as interpreters and provided
with 2d training on the study and methods to be used.
Time for familiarisation with the study guides was provided.
The principal researcher was a Caucasian male who
was trained in public health nutrition at MSc level, and
was not an MSF employee. He attended all focus group
sessions and benefited from simultaneous translation by
an interpreter. The principal researcher personally facili-
tated, in English, the focus group discussion with the
health staff, and subsequently transcribed the recorded
tape himself. Other discussions were facilitated by the
study interpreters. The discussion transcript was not
returned to the members for comments or corrections. All
participants were provided with information about the
study and assured that clinical services or RUTF provision
would not be affected by refusal to participate.
Identification of common themes
The focus group discussion transcripts were manually
coded by the principal researcher, highlighting keywords,
key concepts and any minor or contradictory themes.
Records of direct observations were reviewed and evi-
dence summarised. Quantitative data from the interviews
and the clinical and socio-economic profile of the focus
group participants were entered in EpiInfo version 3?4?3
(Centers for Disease Control and Prevention, Atlanta, GA,
USA) and analysed in the STATA statistical software pack-
age version 8?0 (Stata Corp., College Station, TX, USA).
Detailed tables were prepared for each identified theme
and its associated sub-themes. The theme tables contained
separate columns referring to the evidence obtained on
each theme using one of the three research methods. This
allowed triangulation of evidence and comparison and
discussion of the common themes that emerged. Following
this process, the themes and sub-themes from the separate
tables were compiled and overall conclusions drawn.
Conclusions and associated recommendations were
discussed with the health and management staff of the
programme during a feedback process.
Results
From January 2008 to March 2009, MSF admitted 782
malnourished adults into the therapeutic nutrition pro-
gramme; the monthly mean weight gain was 1?8 (SD 0?5)
and 1?8 (SD 0?6) g/kg per d, respectively, for severely and
moderately malnourished adults.
Study group characteristics
Table 1 provides descriptive data on the forty-six parti-
cipating patients. Thirty-four were still under treatment
with Plumpy’nut�R . More than half of them were women
and the average age was 33 years. All patients were
married and the majority had their spouse still alive;
twelve out of the forty-six patients were widowers. All
subjects who were approached agreed to participate in
the study and provided written informed consent.
Table 2 summarises the methods used and the number
of patients, caregivers and health staff participants.
Twenty-two current and ex-patients received one-to-one
interviews and eighteen participated in focus group
discussions. Six in-patients were directly observed. Two
caregivers were recruited to participate in focus group
discussions. Eight MoH/MSF employees participated in
the focus groups with the medical staff (counsellors,
nurses and medical doctors). None of the subjects were
involved in more than one data collection method.
SPublic
Hea
lth
Nutr
itio
n
Table 1 Profile of participating patients (n 46)
Participants
Characteristic n %
Male 18 39Female 28 61Age (years) 33?3Married (missing records 5 1) 45 100
Spouse alive 33 73Widowers 12 27
Mean number of children (missingrecords 5 1)*
3?0
Serological status (missing records 5 6)HIV positive 24 60HIV/TB positive 16 40
Nutritional rehabilitation (missingrecords 5 1)Enrolled into the nutrition programme at
the time of the studyNo longer meeting admission criteria
of malnutrition-15 33
Meeting admission criteria ofmalnutrition-
-
19 42
Discharged by the time of the study 11 25
TB, tuberculosis; MUAC, middle upper-arm circumference.*Age not specified.-BMI $17 kg/m2 and/or MUAC $185 mm.-
-
This group included thirteen out-patients and six in-patients. The in-patientswere from the TB multi-drug resistance ward.
RUTF compliance during AIDS 3

Among the out-patients (n 13) who were still mal-
nourished, six travelled to the clinic without a caregiver
on the day of the study (two missing data). One walked,
whereas the rest took public transport; the average time
to reach the clinic was almost 2 h. The six in-patients
recruited for the direct observations were found in the
TB wards of Homa Bay hospital and they were all HIV
positive; two of them were multi-drug resistant and their
appetite might have been affected by their TB status
and/or HIV status, plus by side effects of specific drugs.
Understanding compliance
The following sections summarise the key themes emer-
ging from the analysis of the results. Only fourteen out of
twenty-two interviewed patients reported complying with
the prescribed amount of Plumpy’nut�R .
Perceptions about Plumpy’nut�R
Table 3 lists the aspects that may both enhance or
decrease compliance with Plumpy’nut�R , and were
mentioned during the majority of focus groups and
interviews. It was frequently reported that Plumpy’nut�R
can be ‘associated with a drug’ (same role and effect of a
drug), ‘brings (physical) strength’ and ‘allows to go back
to work’. Increases in weight gain were reported and
feelings of hunger said to decrease. Positive feelings
about the use of the product can be summarised by the
quote: ‘ART is a drug to fight the infections, but does not
give strength like Plumpy’nut�R to go back to work’.
Turning to the negative perceptions of participants,
some patients complained that the taste of Plumpy’nut�R
was responsible for nausea and vomiting. Participants
also argued that the ‘first 3 or 4d are the most critical ones’
and that ‘after then, it becomes easier’ to comply with the
prescription. Among the patients interviewed, only one
out of forty mentioned oral thrush as the main cause for
low acceptability. In contrast, the health staff focus group
voiced that the initial clinical conditions including swal-
lowing capacity are crucial for patients’ compliance. The
interviewees provided suggestions about how to improve
the product (see Table 3).
The medical staff expressed doubts about the role of
Plumpy’nut�R in promoting weight gain, since ‘ART is far
more important in severely malnourished patients’.
Sharing practices
Compliance was found to be closely linked with food-
sharing practices. More than half (fourteen out of twenty-
two) of the interviewed patients reported sharing
Plumpy’nut�R with children and other adults and this was
confirmed by most focus groups. The medical staff was
particularly concerned about the sharing practice at the
community level, because of their observation that ‘yin the
hospital wards, it is common’. In two of the focus groups,
patients reported incidents of Plumpy’nut�R trading or sell-
ing. This, however, seems to be limited to schoolchildren,
because among adults the product was associated with
HIV treatment and was thus potentially stigmatising. The
majority of patients who declared that they tried to prevent
sharing (‘hiding the product in the closet from children’;
‘yor from adults’) did so because Plumpy’nut�R was con-
sidered part of the ‘medical drug prescription’. Only one
interviewee reported that Plumpy’nut�R could be actually
harmful for an HIV-negative person. One member of the
medical staff suggested that Plumpy’nut�R is so important for
household food security that sharing represents a strategy
to delay the moment of programme discharge.
Mixing Plumpy’nut�R with other foods
Only one patient reported consuming Plumpy’nut�R exclu-
sively, whereas mixing Plumpy’nut�R with other food was
a common practice mainly with local staple starchy food
(ugali), fresh vegetables, fish, rice, cereals, legumes, meat,
cooked vegetables (sukuma wiki) and chapatti (in order of
reported frequencies). Monotony of diet, nausea, vomiting
or salty taste were the main reasons for mixing. Stirring
Plumpy’nut�R into hot water produces something that is
similar to a popular, peanut-based, traditional food (ogila).
Some others mentioned that ‘once you start mixing the
Plumpy’nut�R , it is hard to go back and eat it alone’. Members
of the medical staff suggested (contrary to programme
recommendations) that patients with severe clinical condi-
tions (e.g. oral thrush) should mix the Plumpy’nut�R with tea.
Key barriers to compliance
Inability to transport ration
Physical weakness, absence of a caregiver during
collection of supplies, cost of transport and stigma were
key barriers to compliance. The prescribed supply of
Plumpy’nut�R per out-patient was monthly and weighed
approximately 12 kg. A malnourished out-patient without
a caregiver did not have enough strength to carry such
weight. Therefore, the out-patients were invited to take
half of the monthly ration and come back to collect the
second half of the supply in 2 weeks’ time. Health staff
members reported that most patients could not afford to
travel twice a month to the clinic. It can be speculated that
these patients spread out the 2 weeks’ provision along
the entire month. This is consistent with the reports of
many patients. No data could be collected on how many
SPublic
Hea
lth
Nutr
itio
n
Table 2 Summary of methods and participants
MethodsParticipants
(n 56)*
Individual interviews with current and ex-patients 22Five focus group discussions from three to five
participants, including:Current and ex-patients 18Caregivers 2
Direct observations on individual in-patients and theircaregiver’s role
6
One focus group discussion with health staff 8
*None of the study subjects participated in more than one method.
4 F Dibari et al.

SPublic
Hea
lth
Nutr
itio
n
Table 3 Summary of key themes and sub-themes
ThemeIndividualinterviews
Focus groupdiscussions*
Directobservations
Compliance with Plumpy’nut�R
> Only approximately half of the patients complied with the prescribed amount X- – X
Positive aspects reported about Plumpy’nut�R – participants think that:> It is similar to a drug rather than a food, in terms of both usage and role in recovery> It ‘brings strength’> It ‘allows to go back to work’> Increases weight gain> Decreases the feeling of hunger> Has a smell and packaging that are well accepted> Offers the possibility to mix it with other food and therefore reduce:
J diet boredomJ nausea
X--
-
X –X--
-
X –X--
-
X –X--
-
XX--
-
X –X--
-
X XX--
-
X XX- X-
-y –X- X-
-y X
Negative aspects reported about Plumpy’nut�R – participants think that:> It can cause nausea and vomiting> The first 3–4 d of consumption are crucial for compliance, becoming easier later> The taste is:
J too sweetJ too oilyJ too salty
> Consistency should be more liquid or like a biscuit or a powder (milk powder)> It comprises a monotonous diet, leading to boredom
X--
-
X X– X X
X--
-
X-
-y –X--
-
X-
-y –X--
-
X-
-y –X--
-
X –X--
-
X –
Sharing Plumpy’nut�R with both other adults and/or children is a common practice X- X –Reasons for sharing:> Food insecurity in the household> Children like it> The partner or relative is ill and/or HIV positive but not malnourished (energy booster)
– X-
-
–X--
-
X-
-
–– X-
-
–
Mixing Plumpy’nut�R with foods is a common practice X X XReasons for mixing:> To reduce monotony of the diet> To reduce nausea, vomit, salty taste> Because the Plumpy’nut�R has separated into oil and solid phases> Because Plumpy’nut�R with water reminds participants of a traditional food> Because it was suggested by the health staff
X--
-
X-
-
XX--
-
X-
-
XX--
-
– –– X-
-–
– X-
-
–
Knowledge and attitudes of medical staffMedical staff expressed doubts about the positive role played by Plumpy’nut�R in nutritional
rehabilitation; ART was perceived as being much more important– X –
Patient counselling> Counselling messages focus on:
J human nutrition (e.g. ‘proteins are available in meat, eggs and cheese’)J improvement of general conditions when consuming Plumpy’nut�R (weight gain, appetite,
strength)> Most patients did not know the relationship that exists between HIV infection, their thinness
and their ART therapy> Staff declared that they did not know what counselling to provide to patients with severe
clinical conditions (e.g. oral thrush)> Most patients do not receive routine information about why, when and how to consume
Plumpy’nut�R ; when this happens, it comes from the individual initiative of the health staff
X--
-
X-
-y –
X--
-
X-
-
–
X--
-
X-
-
X
X--
-
X-
-
X
Distribution system for Plumpy’nut�R
> Half of the patients still under nutritional rehabilitation come to the HIV clinic without acaregiver
> The patients cannot carry more than a 2 weeks’ supply of Plumpy’nut�R (,6 kg) instead of thewhole month’s supply
> The appointment schedule for ART or clinical check-ups is monthly in most cases; therefore,patients or caregivers do not come back to collect the missing 2 weeks’ supply ofPlumpy’nut�R
> Very weak patients are in absolute need of the caregiver even to open the sachets, to mix itwith other food (when needed) and consume it
> Bulky supply (6–12 kg) and branded container (box) are very noticeable and associated withstigma within the community
X- X –
X- X X
X- X –
– – X
X- X X
ART, anti-retroviral therapy.*The focus groups involved either patients together with caregivers (five groups, with three to five participants) or health staff members (one group with eightparticipants).-Tool used: closed and/or open questions.-
-
Tool used: free listing.yTool used: ranking exercise to select the main themes reported here.
RUTF compliance during AIDS 5

patients came back to collect the missing mid-month
supply or the relationship with defaulting and survival.
Stigma associated with therapeutic foods
In a region where HIV-related secondary malnutrition is
common and treated with Plumpy’nut�R , this product has
become strongly associated with HIV. For this reason
many patients were reluctant to walk home with boxes
reading the brand name (Plumpy’nut�R ). One patient said
‘I can disguise the ART tablets saying that they cure
something else, but I cannot disguise Plumpy’nut�R
because a month’s supply is too bulky and visible’.
Clinical status and role of the caregiver
Among the in-patients who were directly observed, all
patients with a severe clinical condition could not comply
with the prescribed amount. Two of them died during the
course of the study. Alternative therapeutic diets, such as
therapeutic liquid milk (formulas F75 and F100), the
intake of which may have been easier for severely ill
patients, was not available.
It was reported and observed that in-patients in the
ward with the most severe clinical conditions can consume
Plumpy’nut�R only if mixed with other suitable food (e.g.
water or porridge). This requires assistance from the care-
giver. Patients with severe clinical conditions were so weak
that they did not have sufficient strength even to open the
sachet and mix the product with food.
Discussion
The present study has indicated that compliance with
therapeutic feeding within this HIV programme is likely
to be low. We have identified a number of issues that may
reduce the consumption of RUTF to below the prescribed
level. Although the nature of the study setting might have
affected the patients’ response, some of the findings are
likely to be generalisable to other HIV and adult nutrition
programmes that use this specific therapeutic food and a
similar nutritional protocol.
The present study identified two groups of factors that
limit specifically an RUTF-based protocol compliance:
(i) factors directly related to the product design and
(ii) factors related to programme design.
Factors related to product design
Although widely used for other patient groups, it is
important to note that Plumpy’nut�R was designed for
treating severe acute malnutrition in children. There is
evidence(18) to suggest that reported symptoms such
as nausea and vomiting when consuming RUTF could
be related to the drug treatment too. The taste of
Plumpy’nut�R was not considered suitable by many adult
patients and therefore they often reduced intake or mixed
it with other food. This practice may compromise the
efficacy of RUTF by reducing overall energy and nutrient
intake and delaying nutritional rehabilitation.
Despite the problems of taste and consistency accept-
ability, the results of this research suggested that most
patients valued the nutritional therapy provided by
Plumpy’nut�R . Their attitude towards the product was more
positive than that of most medical employees, perhaps
because of lack of staff training on the anticipated benefits.
However, the interviewed patients would reduce the
sweetness (somebody suggested the addition of lemon
juice), and would like to change the consistency into
something ‘more liquid’ or ‘into the form of a biscuit’ or
powder. Rarer comments mentioned included suggestions
for improving the packaging, such as ‘the sachet packaging
should be replaced with ice-cream cup with lid’.
Factors related to programme design
Certain problems in accessing and consuming the ther-
apeutic food were accentuated by the design of the
overall programme and inappropriate staff training.
Patients were not informed about how to correctly con-
sume the RUTF. For example, counselling messages
inappropriately advised adding the RUTF to tea and
advised feeding strategies that were not feasible for
the patient. Advice to consume RUTF at meal times
(3 times/d) and/or together with ART drugs was not
conducive to ensuring adequate intake. Some of the
patients admitted that they disregarded such advice
because of the ‘strong’ – difficult to eat – nature of the
product, their bad clinical conditions combined with ART
side effects (lack of appetite, nausea, vomiting, etc.).
More appropriate advice would have been that based
on therapeutic feeding guidelines(19) and should have
recommended having small bites of RUTF throughout the
day until the daily prescription of sachets was consumed.
Box 1 presents the most common questions expressed by
SPublic
Hea
lth
Nutr
itio
n
Box 1
During dietetic counselling* sessions, the topics to
be covered should respond to the following ques-
tions expressed by patients during the study: What
is Plumpy’nut�R (food/drug; composition)? Who is
supposed to use it? What are its components? How
often should I eat it along the day? What should I do
when I do not manage to eat it because of nausea,
vomiting or lack of appetite? Could I mix it with
other foods? What should I avoid to drink or eat
together with Plumpy’nut�R ? What are the conse-
quences if I share my ration of Plumpy’nut�R with
other persons? Is it good for somebody who is not
HIV positive to eat Plumpy’nut�R ? Is it good for
somebody who is not thin to eat Plumpy’nut�R ?
When should I stop eating Plumpy’nut�R ? Will I
become thin again when I stop eating it?
*For an example of dietetic counselling material for HIV ther-
apeutic feeding in adults, contact [email protected].
6 F Dibari et al.

patients during the present study. The same questions
lead to key counselling messages.
Frail patients who came to a clinic appointment with-
out a caregiver sometimes ended up losing half of the
prescribed RUTF supply, as they were unable to transport
the food to their home. The situation could be improved
by re-design of the distribution system, perhaps involving
community-based organisations to support home-based
care. Their importance is recognised in many HIV and
nutrition interventions and protocols(20–24). The health
programme also needed to acknowledge and address
the stigma factor attached to Plumpy’nut�R . This could
involve the use of anonymous packaging.
In case of extremely frail patients, the caregiver played
a fundamental role in trying to overcome key barriers
for compliance, such as simply opening the sachets or
mixing it with other foods.
Main limitations of the present study
The present research did not correlate the collected data
with clinical information such as patients’ survival, CD4
count, weight gain or BMI changes that might have
helped in understanding the impact of such a programme
in the presence of household/community sharing, food
mixing, lack of counselling and clinical difficulties in
swallowing among others.
The present research did not aim to understand the link
between nutritional therapy and ART compliance. RUTF
is meant to be used in out-patient programmes, but the
present study was restrained by lack of observations at
the community level.
The two study interpreters were not only employed as
health promoters in the MoH HIV programme but were
also clients of the MoH/MSF HIV/TB programme. One of
them had been previously successfully rehabilitated in the
nutritional programme. Therefore, they might have pre-
viously met some of the patients enrolled in the study
and/or developed specific perceptions about the topic,
introducing possible bias.
Conclusions
Overall, the research suggests that training and information
material is needed to ensure that medical staff can support
the patient to overcome the first most crucial phase of
the treatment. The very first contact with the patient should
include a test to assess the swallowing capacity. Reduced
capacity to swallow is common and it may imply a
lower compliance with nutritional therapy and an increase
in mortality risk. Consistent with the community-based
management of malnutrition approach, medical staff
should ask the patient to consume some amount of RUTF
in his presence to verify his swallowing capacity. Accord-
ing to the results of this test, dietetic solutions must be
discussed and agreed upon together with the patient and
the caregiver when present. Patients who are unable to
swallow at all should be hospitalised and treated according
to the in-patient nutritional therapeutic protocol developed
by WHO(25), which utilises milk-based liquid therapeutic
nutritional products such as F75 and F100.
The study showed that Plumpy’nut�R , designed for
malnourished children, needs improvement to meet the
palatability preferences expressed by adult patients.
A reduction in the perception of sweetness and fat com-
ponents was solicited by the patients. However, any
HIV/TB therapeutic nutrition programme should not
introduce newly designed RUTF until positive clinical
results have been demonstrated.
Further studies more closely correlating compliance
and recovery rates are likely to improve the perception
of medical staff towards the effectiveness of this kind of
programme, possibly improving their performance as well.
Acknowledgements
The present study was funded by Valid Nutrition via a grant
from Irish International Cooperation. Valid Nutrition is
involved in the development of ready-to-use therapeutic
foods for use in AIDS patients. The authors have no conflict
of interest to declare. F.D. conceptualised the study, col-
lected and analysed the data and wrote the draft manuscript;
P.B. and S.G. assisted in study design and interpretation
of the data; I.L.G. and D.M. facilitated data collection and
supported the fieldwork; A.S. provided overall research
supervision and contributed to the study design and to later
versions of the manuscript. Other contributions came from
Lio Fieschi and Nicky Dent who gave useful technical
advice. The authors express deep appreciation to the study
team, the participants and the staff of the MSF-France and
Homa Bay TB multi-drugs resistance ward for their support,
and in particular to Pamela Pomito.
References
1. Uthman OA (2008) Prevalence and pattern of HIV-relatedmalnutrition among women in sub-Saharan Africa: a meta-analysis of demographic health surveys. BMC PublicHealth 8, 226–230.
2. Koethe JR, Lukusa A, Giganti MJ et al. (2010) Associationbetween weight gain and clinical outcomes amongmalnourished adults initiating antiretroviral therapy inLusaka, Zambia. J Acquir Immune Defic Syndr 53,507–513.
3. Wanke CA, Silva M, Knox TA et al. (2000) Weight loss andwasting remain common complications in individualsinfected with human immunodeficiency virus in the eraof highly active antiretroviral therapy. Clin Infect Dis 31,803–805.
4. Byron E, Gillespie S & Nangami M (2006) Integratingnutrition security with treatment of people living with HIV:lessons from Kenya. Food Nutr Bull 29, 87–97.
5. Carr A (2003) Toxicity of antiretroviral therapy andimplications for drug development. Nat Rev Drug Discov2, 624–634.
SPublic
Hea
lth
Nutr
itio
nRUTF compliance during AIDS 7

6. Koethe JR, Chi BH, Megazzini KM et al. (2009) Macro-nutrient supplementation for malnourished HIV-infectedadults: a review of the evidence in resource-adequateand resource-constrained settings. Clin Infect Dis 49,787–798.
7. Paton NI, Sangeetha S, Earnest A et al. (2006) The impact ofmalnutrition on survival and the CD4 count response inHIV-infected patients starting antiretroviral therapy. HIVMed 7, 323–330.
8. Madec Y, Szumilin E, Genevier C et al. (2009) Weight gainat 3 months of antiretroviral therapy is strongly associatedwith survival: evidence from two developing countries.AIDS 27, 853–861.
9. Bahwere P, Sadler K & Collins S (2009) Acceptability andeffectiveness of chickpea sesame-based ready-to-use ther-apeutic food in malnourished HIV-positive adults. PatientPrefer Adherence 3, 67–75.
10. Ndekha MJ, van Oosterhout JJ, Zijlstra EE et al. (2009)Supplementary feeding with either ready-to-use fortifiedspread or corn–soy blend in wasted adults startingantiretroviral therapy in Malawi: randomised, investigatorblinded, controlled trial. BMJ 338, b1867–b1875.
11. Sauvageot D, Huerga H, Genevier C et al. (2007) Doesready-to-use food supplementation (Afya) improve short-term outcomes in HIV-infected malnourished adultscommencing ART in rural Kenya? Lessons learned. http://www.epicentre.msf.org/about-us/folder.events/2007-epicentre-scientific-day/
12. World Health Organization, World Food Programme,United Nations Standing Committee on Nutrition et al.(2007) Community-Based Management of Severe AcuteMalnutrition. Geneva: WHO.
13. Rand CS (1993) Measuring adherence with therapy forchronic diseases: implications for the treatment of hetero-zygous familial hypercholesterolemia. Am J Cardiol 72,68D–74D.
14. Haynes RB (1979) Determinants of Compliance: TheDisease and the Mechanics of Treatment. Baltimore, MD:John Hopkins University Press.
15. World Health Organization (2003) Adherence to Long-termTherapies: Evidence for Action. Geneva: WHO.
16. Tong A, Sainsbury P & Craig J (2007) Consolidated criteria forreporting qualitative research (COREQ): a 32-item checklistfor interviews and focus groups. Int J Qual Health Care 19,349–357.
17. National AIDS and STD Control Programme (2007) KenyaAIDS Indicator Survey 2007: Preliminary Report. Nairobi:NASCOP (Ministry of Health, Kenya).
18. Food and Nutrition Technical Assistance Project (2004)HIV/AIDS: A Guide for Nutritional Care and Support,2nd ed. Washington, DC: Academy for Educational Develop-ment; available at http://www.fantaproject.org/downloads/pdfs/HIVAIDS_Guide02.pdf
19. Valid International Concern Worldwide (2006) Community-based Therapeutic Care (CTC): A Field Manual. Oxford: ValidInternational.
20. Family Health International (2007) HIV, Nutrition andFood: A Practical Guide for Technical Staff and Clinicians.Durham, NC: FHI.
21. Piwoz E (2004) Nutrition and HIV/AIDS: Evidence, Gapsand Priority Actions. Washington, DC: SARA, FANTA.
22. Food and Nutrition Technical Assistance Project (2008)Ethiopia Nutrition and HIV Tools. Washington, DC: FANTA.
23. Food and Nutrition Technical Assistance Project (2008) NutritionCare for People Living with HIV and AIDS: Training Manualfor Community and Home-Based Care Providers FacilitatorsGuide and Participant Handouts. Washington, DC: FANTA.
24. Bonnard P (2002) HIV/AIDS Mitigation: Using What WeAlready Know. Technical Note. Washington, DC: FANTA.
25. World Health Organization (1999) Management of SevereMalnutrition: A Manual for Physicians and Other SeniorHealth Workers. Geneva: WHO.
SPublic
Hea
lth
Nutr
itio
n8 F Dibari et al.

The Journal of Nutrition
Methodology and Mathematical Modeling
Low-Cost, Ready-to-Use Therapeutic Foods CanBe Designed Using Locally Available Commoditieswith the Aid of Linear Programming1,2
Filippo Dibari,3,4* El Hadji I. Diop,3 Steven Collins,3 and Andrew Seal4
3Valid Nutrition, Cuibın Farm, Derry Duff, Bantry, Co. Cork, Ireland; and 4UCL Centre for International Health and Development,
Institute of Child Health, London, UK
Abstract
According to the United Nations (UN), 25 million children ,5 y of age are currently affected by severe acute malnutrition
and need to be treated using special nutritional products such as ready-to-use therapeutic foods (RUTF). Improved
formulations are in demand, but a standardized approach for RUTF design has not yet been described. Amethod relying on
linear programming (LP) analysis was developed and piloted in the design of a RUTF prototype for the treatment of wasting
in East African children and adults. The LP objective function and decision variables consisted of the lowest formulation
price and the weights of the chosen commodities (soy, sorghum, maize, oil, and sugar), respectively. The LP constraints
were based on current UN recommendations for the macronutrient content of therapeutic food and included palatability,
texture, and maximum food ingredient weight criteria. Nonlinear constraints for nutrient ratios were converted to linear
equations to allow their use in LP. The formulation was considered accurate if laboratory results confirmed an energy
density difference ,10% and a protein or lipid difference ,5 g × 100 g21 compared to the LP formulation estimates. With
this test prototype, the differenceswere 7%, and 2.3 and21.0 g × 100 g21, respectively, and the formulation accuracywas
considered good. LP can contribute to the design of ready-to-use foods (therapeutic, supplementary, or complementary),
targeting different forms of malnutrition, while using commodities that are cheaper, regionally available, and meet local
cultural preferences. However, as with all prototype feeding products for medical use, composition analysis, safety,
acceptability, and clinical effectiveness trials must be conducted to validate the formulation. J. Nutr. 142: 955–961, 2012.
Introduction
Since 2007, the United Nations (UN)5 (1) has recommended theuse of ready-to-use therapeutic food (RUTF) at the communitylevel for the treatment of pediatric severe acute malnutrition(SAM) in low-income countries (1). The reason is that RUTF doesnot require any preparation or addition of water before ingestion,can be stored for long periods without refrigeration, allows in-dividual packaging, and can therefore be used effectively in situ-ations with nonoptimal hygiene conditions (2). Moreover, RUTFmeets the specifications for type I and II micronutrient densities(1,3) that have been found to contribute to effective managementof SAM in children (3). A classification of this range of products isavailable elsewhere (4). Plumpy’nut is the most common com-
mercial brand that has been clinically trialed so far (5,6), but anincreasing number of therapeutic products are being tested.
RUTF is not always available where needed. India alonecounts 8 million SAM children (7) in need of nutritional reha-bilitation (8), yet it has not been possible to legally import RUTFfrom Europe since 2009. In this and other countries, the re-latively high cost of Western brands and local policies haveprevented the widespread importation of RUTF, boosting thedemand for regionally appropriate solutions (9).
The market for products to use in feeding programs is large.The World Bank estimates that each year, ;$6.2 billion areneeded to treat 3.5 million children,5 y of age affected by SAMormoderate acute malnutrition (10). If not treated on time, thesemight represent more than one-third of all pediatric deathsworldwide (10). A large coalition of international institutions iscurrently engaged in raising the needed funds (11).
However, some aspects of therapeutic feeding still requiremore evidence-based understanding. The current RUTF formu-lation is based on results from a limited number of studies, in afew settings, showing rapid weight gain (12). Consequently, inother settings, with different underlying nutrient deficiencies andinfectious disease profiles, similar weight gains would perhapsoccur, with nutrient levels different from those in use (13–16).
1 Supported by Valid Nutrition via a grant from the Irish International Cooperation.2 Author disclosures: F. Dibari, E. H. I. Diop, and S. Collins (Director) work for Valid
Nutrition. Valid Nutrition is involved in trialing, manufacturing, and marketing the
ready-to-use foods described in this paper. A. Seal, no conflicts of interest.
* To whom correspondence should be addressed. E-mail: filippo@validinterna-
tional.org.
5 Abbreviations used: DV, decision variable; FCD, food composition database;
LP, linear programming; OF, objective function; PDCAAS, protein digestibility--
corrected amino-acid score; RUF, ready-to-use food; RUTF, ready-to-use
therapeutic food; SAM, severe acute malnutrition; TFD, true fecal digestibility;
UN, United Nations; WFDAS, World Food Dietary Assessment System.
ã 2012 American Society for Nutrition.
Manuscript received January 5, 2012. Initial review completed January 30, 2012. Revision accepted March 1, 2012. 955First published online March 28, 2012; doi:10.3945/jn.111.156943.
at UN
IV C
OLLE
GE
LON
DO
N on N
ovember 16, 2012
jn.nutrition.orgD
ownloaded from

The current commercial formulation of RUTF is not acceptableto all the patients in need of therapeutic nutrition in developingcountries. A study reported that adult HIV-positive wasted patientsin Africa struggled to comply with the current RUTF-basedtreatment (17). The same study recommended improving the for-mulation to meet the tastes of the beneficiaries and increase itsacceptability.
Evidence-based nutrition research ideally relies on costlyrandomized clinical trials. Therefore, a robust method is re-quired to design the trial RUTF before randomized clinical trialimplementation. At present, there is no internationally endorsedprotocol to design products of this kind.
A design method based on linear programming (LP) can helpin the development of novel RUTF and other products withsimilar properties, termed here ready-to-use foods (RUF). LPanalysis is an operational research approach that is used tomodel complex multifactorial problems, including diet-relatedones (18). Since 1959 LP has been applied to human nutrition(19) and since 1983, also to diet planning for developingcountries (20). More recently, with the aid of specific software,LP was used for complementary feeding programs (21) or inthe design of diets for specific populations (22,23). LP is alsoused to design personal diets, define institutional nutritionalpractices, support decision-making in nutrition education oragricultural programs, define food fortification activities, andundertake analysis of economic constraints on human diets (22–24). LP can be used for assessing the economic value of fortifiedfood supplements (25) and in predicting limiting nutrients inspecific diets (21).
LP is a suitable decision tool for designing novel food-basedformulations. The method helps by identifying the cheapestpossible combination of food ingredients that meet a set ofnutritional requirements (20,23,26), avoiding a “trial and error”approach (21,27).
The objective of this study was to test a LP-based method fordesigning the cheapest formulation of a RUF that fulfilspredefined macronutrients requirements by using region-specificfoods that are culturally acceptable and can be processed withlocally available technologies. To our knowledge, this is the firststudy describing how LP can be used to design RUF. The studyshould be of interest to international nutritionists and foodtechnologists involved in designing novel RUF.
Materials and Methods
Developing a LP model for RUTF
LP is a tool to optimize (minimize or maximize) a linear objective
function (OF) while respecting multiple linear equality and inequalityconstraints (21). When used for selecting the lowest cost diet/formula-
tion, the OF can be expressed in the following form (22):
Y¼ k0 þ k1W1 þ k2W2 þ :::þ knWn;
where Y is the cost, k1, k2… kn are constants, equivalent, for instance, tothe cost per unit weight for food ingredients F1 to Fn, and W1, W2,…Wn
are the decision variables (DV), i.e., the weights of foods F1, F2…Fn in
grams. The usual aim will be to minimize the cost of the formulation (Y)
by changing the weight of the different ingredients while meeting a rangeof different constraints. These mathematical constraints (equality,
greater than, or less than) are imposed on one or more of the DV (W1,
W2,…Wn) to ensure that the nutrient content of the product meets design
requirements and does not exceed upper thresholds. A LP solution isfeasible when all its constraints are achievable. When the highest
possible concentration of a nutrient is less than a minimum constraint,
when the lowest concentration of a nutrient is higher than a maximum
constraint, or an equality constraint cannot be respected, the model is
considered unfeasible (16,18). Constraints in food formulation problems
may be linear or nonlinear, but LP can be applied only when all the
constraints are linear (22). A constraint is considered linear when it canbe expressed in the following way:
k1W1 þ k2W2 þ.þ knWn $a0 or
k1W1 þ k2W2 þ.þ knWn #b0 or ;
k1W1 þ k2W2 þ.þ knWn ¼ c0
where a0, b0, and c0 are constants. Models including nonlinear
constraints may have several solutions (local optimums) depending on
the initial values and cannot be solved using LP.In this study, we transformed nonlinear nutrient ratio constraints,
such as the proportion of energy coming from protein, the proportion of
energy coming from fat, and the proportion of energy coming from (n-3)
and (n-6) fatty acids, into equivalent linear constraints. For example, theUN specifications for RUTF require that the proportion of total energy
(E) coming from protein is .0.10 and ,0.12 (1). This was expressed in
the following nonlinear form:
ðP1W1 þ P2W2.þ PnWnÞ=ðE1W1 þ E2W2.
þEnWnÞ $0:10 and # 0:12
where P1, P2,…Pn and E1, E2,…En represent, respectively, the energy
content from protein and the total energy content (kJ) in W1, W2,…Wn
(g) of each food ingredient F1, F2…Fn. Therefore, the protein:energy
constraint (C) was expressed as a linearized function of the weight of
different foods:
W1ðP120:10E1Þ þW2ðP220:10E2Þ.WnðPn20:10EnÞ $ 0
and
W1ðP120:12E1Þ þW2ðP220:12E2Þ.WnðPn20:12EnÞ # 0
Some authors (21) suggest avoiding nonlinear constraints wherever
possible because of their complexity. Therefore, we avoided including
more complex nonlinear constraints in the formulation such as proteinquality expressed as protein digestibility-corrected amino-acid score
(PDCAAS) (28) and true fecal digestibility (TFD) (28,29). However,
these 2 parameters were calculated and manually assessed in the final
model.In this study, the OF consisted of identifying the lowest price given by
the sum of each food ingredient cost (C1, C2,…Cn) multiplied by the DV
(food weights: W1, W2,…Wn) while respecting the predefined con-
straints. Other definitions and graphic illustrations of LP theory areavailable elsewhere (16,18,20–22,26).
An example of a RUTF formulation optimized by LP
To explore the use of LP, we used it in the process of formulating aprototype RUTF that could be used in both adult and pediatric
therapeutic feeding programs in East Africa and could be manufactured
from locally available commodities. Such a product would yieldconsiderable reductions in the logistic complexity and costs in large
humanitarian operations.
The overall design, manufacture, and testing of the RUTF consisted
of 4 phases (Fig. 1). The preliminary stage A involved identifying thetarget group and the desired composition of the prototype product.
Potential food ingredients, nutrient composition, and price data were
then identified and compiled. The DV, constraints, and OF for the LP
model were defined and used in step B to set up and solve the LP modelusing Microsoft Excel (version 2007) and the Solver add-in. Phase C
consisted of assessing the sensitivity of the optimized model and then
manufacturing a small-scale test batch of the RUTF prototype to checkthe texture and compare the calculated composition with laboratory-
based results. In phase D, safety and acceptability tests were conducted
with the unfortified product. At the same time, the fortificant premix was
designed, added, and its shelf life monitored. Soon after, clinical trialswere used to validate the prototype formulation. Results from phase D
will be reported elsewhere.
956 Dibari et al.
at UN
IV C
OLLE
GE
LON
DO
N on N
ovember 16, 2012
jn.nutrition.orgD
ownloaded from

Phase A: FCD and food prices
Choice of the FCD. The validity of the LP-optimized prototype
formulation depends on the accuracy of the food composition database
(FCD). The FCD sources were selected by using the following criteria:
1) the widest representation of commodity composition data fromaround the world; 2) the largest number of nutrient data values per
food; 3) food descriptors matching the selected ingredients; and 4)internationally respected datasets, ideally with methods cited in peer-
reviewed journals.
Choice of the food ingredients. Initially, one of the largest East African
food aid manufacturers (Insta Products EPZ) identified one specific com-modity for each of 4 preselected food categories: cereals, sugar, and oil.
Most East African capitals host extrusion industrial units for precookingand milling of cereals and/or pulses blends. In mixes of preground pulses
and cereals, the correct application of extrusion processing achieves levels of
starch gelatinization sufficient for digestion (30) while destroying most
antinutritional factors (30).
Phase B: Setting up and running the LP model
The design of the RUTF had to respect several prestated conditions, which
were derived from specifications for this class of product and fromexperience gained in the design of similar products. Four groups of con-
straints were considered: energy and nutrient concentration, palatability,
texture, and total food ingredient weight. The linear and linearized nu-trient concentration constraints that were applied are listed in Table 1.
FIGURE 1 Proposed design and validation method for novel RUF. RUF, ready-to-use food.
Ready-to-use therapeutic foods and linear programming 957
at UN
IV C
OLLE
GE
LON
DO
N on N
ovember 16, 2012
jn.nutrition.orgD
ownloaded from

Energy and nutrient concentration constraints. LP constraints were
introduced to ensure that the RUTF formulation met the UN 2007
standards (1) for energy density and the ratios of protein, fat, andessential fatty acids to energy (Table 1).
Palatability-related constraints. Palatability constraints are common in
dietary LP (21) and aim to avoid the creation of unacceptable tastes. In astudy (17) looking at compliance with the current commercially available
pediatric RUTF, HIV/TB-wasted Kenyan adults voiced the need for a
reduction of the current sugar content (28%) (31). Lower sugar density
was also shown to be acceptable to,5-y-old Zambian children in anotherpreliminary study (personal communication, Abel Hailu, Valid Nutrition).
Therefore, the sugar content was constrained to 15–18% (Table 1).
Sorghum improves the taste of extruded pulses/cereals blends, even ifpresent in a small amount (personal communication, Stuart Allison,
Insta Products EPZ). We introduced a minimum constraint of 7–10% for
sorghum (Table 1) based on work with preliminary formulations.
Texture-related constraints. Texture-related constraints aim for a
specific consistency in the food mix. RUFmust have a paste-like property
in order to be squeezed into the mouth by the adult and children patients,
or by their caregivers. Therefore, a fluid consistency was not suitable. Atexture similar to a biscuit can produce choking in children (32) and
therefore was also considered unacceptable. A solid phase particle size
,200 microns (31) and a fat range of 28–36% generally lead to a
suitable paste texture during preliminary tests. The latter criterion wasincluded as a constraint in the LP model (Table 1).
Total food ingredient weight constraint. Once the RUF is shownto be acceptable and safe (Fig. 1), a premix of vitamins and minerals
is added to the formulation (phase D). The weight of the food
ingredients therefore needs to be constrained to allow sufficient space
for inclusion of the vitamin and mineral fortificant in the finalizedproduct. Calculations indicated that up to 3% of the final product
weight might be required for the premix. We therefore used an
equality constraint to fix the weight of the RUTF food ingredients at
97 g (Table 1).
LP model and the software. The process of running the LP model
consisted of: 1) creation of the data layout on a Microsoft Excelspreadsheet; 2) activation of add-in Solver Function, which is supplied
with standard installations of Excel; 3) assignment of the OF, DV, and
constraints; 4) running the LP procedure to solve the OF; and 5) a
sensitivity analysis. Steps 1–3 were applied following the proceduresuggested elsewhere (21).
Phase C: comparison with laboratory results and sensitivity
analysis
Comparison of FCD-based figures with the results from laboratory-
based analysis. The Kenyan manufacturer (Insta Products EPZ)
produced the prototype RUTF formulation in small batches and a local
laboratory (Polucon Services Limited) performed the analysis (intriplicate) of the total energy, protein, and fat contents (Table 2). LP
estimates, based on the FCD figures, were defined as acceptable when the
difference in relative energy density was ,10% and the difference inboth protein and lipid densities were ,5 g � 100 g21. Both differences
were prestated and based on cutoffs used in food technology practice.
Sensitivity analysis. Sensitivity analyses reported by the Solver Function(see Table 3) were used to quantify how much ingredient costs and
formulation constraints can vary without requiring a change in the values
of the LP DV. This can be useful if ingredient costs are likely to vary and
decisions need to be made about when to consider reformulation.
Results
The FAO-Minilist (33) was the first choice as the FCD source,because it fulfilled most of the selected criteria. FAO-Minilist,downloaded from the Nutrisurvey Web site (34), is a selectionfrom the larger World Food Dietary Assessment System(WFDAS) database (35). The WFDAS is based on data from 6countries from East, West, and North Africa, Central America,and South and Southeast Asia. All these areas are affected bymalnutrition and are therefore of interest for the goal of thisstudy. Other published studies have used the WFDAS dataset forLP dietetic purposes (16,21). FAO-Minilist and WFDAS in-cluded phytate among the antinutrients, although relevantnutrients, such as (n-3) and (n-6) fatty acids, were missing.Therefore, we added values for these nutrients from the USDASR20 and Nutrisurvey databases (34,36).
Maize, soy, sorghum, palm olein oil, and sugar were thechosen commodities. Nutrients for maize (descriptor for this and
TABLE 1 Components of the LP model and prototypeRUTF formulation
Initial targetrequirements
Optimizedsolution
OF, cost minimization, $ NA1 0.07
DV: weights of the selected foods2
Soybeans, g NA 31.9
Maize, g NA 15.3
Sorghum, g NA 7.0
Oil, g NA 27.3
Sugar, g NA 15.5
Constraints
Energy and nutrients
Energy, kJ/100 g 2174.0–2299.03 2169.0
Protein energy/total energy4, % 10.0–12.0 10.0
Fat energy/total energy4, % 45.0–60.0 60.0
(n-3) Fatty acid energy/total energy4, % 0.3–2.5 0.9
(n-6) Fatty acid energy/total energy4, % 3.0–10.0 10.0
Palatability
Sugar (sweetness), g/100 g 15.0–18.05 15.5
Sorghum (taste improvement), g/100 g 7.0–10.0 7.0
Texture-related
Fat content, g/100 g 28.0–36.0 34.6
Maximum food ingredient weight
Final total weight, g 97.0 97.0
Monitored variables (not included as constraints)
Quality of protein expressed as PDCAAS,6 % 75.0–89.07 85.7
TFD,8 % NA 83.0
Limiting amino acid NA Lysine
1 The cost of the currently available product (Plumpy’nut) is ~$0.50/100 g when
delivered in East Africa, at the time of this study. The reference includes costs such as
manufacturing, transport from Europe, packaging, and import taxes. All the figures
refer to 100 g of product. DV, decision variable; LP, linear programming; OF, objective
function; PDCAAS: protein digestibility-corrected amino acid score; RUTF, ready-to-
use therapeutic food; TFD, true fecal digestibility.2 Soy descriptor: soy flour full fat, raw [USDA SR20 (36)]. Maize descriptor: maizemeal,
wholegrain, white [FAO-Minilist (33); item code CF00096]. Sorghum descriptor:
sorghum, decorticated, flour [FAO-Minilist (33); item code CF00154]. Palm oil
descriptor: oil, vegetable, palm [USDA SR20 (36)]. Sugar descriptor: sugar, white,
cane, or beetroot [FAO-Minilist (33); item code SF00168].3 The UN specification is 2174 kJ � 100 g21 (1). The constraint was relaxed to 2169 kJ �100 g21 to achieve a feasible LP solution.4 The constraint formulae were converted to a linear form as described in ’’Methods.’’5 The available literature (31) on pediatric RUTF reports a sugar content of 28 g � 10021.
The constraint range was reduced to 15–18 g to make it more suitable for wasted
adults living with HIV/TB [based on (17)].6 From (28).7 Calculation of PDCAAS based on (1,31,44) and using food composition data from
(34,35).8 TFD coefficient calculated using the following foods (and descriptors): maize (corn,
extruded cereal), soy (soy flour), sorghum (sorghum, cooked) (28,29).
958 Dibari et al.
at UN
IV C
OLLE
GE
LON
DO
N on N
ovember 16, 2012
jn.nutrition.orgD
ownloaded from

the other commodities are listed in the footnote in Table 1),sorghum, and sugar were obtained from FAO-Minilist (year ofrelease not specified). Data for soybeans and palm olein oil wereselected from USDA SR20 (released in 2009), because theirdescriptors were closer to the available commodities. However,lysine and tryptophan in soybeans data from USDA SR20 were,respectively, 27 and 58% higher than in the WFDAS data. Theprices of maize, soy, sorghum, oil, and sugar were 0.30, 0.60,0.30, 1.20, and $0.70 � kg21 respectively.
The final price of the formulation was $0.70 � kg21. Theinitial minimum energy density constraint (2174 kJ � 100 g21)was manually relaxed by 0.2% (2169 kJ � 100 g21) to achieve apossible solution (Table 1). All the resulting ratios betweenenergy from protein (0.10), from fat (0.60), and from (n-3) and(n-6) fatty acids (0.009 and 0.10, respectively) and the totalenergy content matched the UN standards (Table 1). The qualityof the protein (PDCAAS: 85.7%; TFD: 83.0%; lysine was thelimiting amino acid) was close to the upper level of the referencerange (75–89%). PDCAAS and TFD specifications and descrip-tors are included in Table 1.
The total energy in the LP model was 3.0% lower than in thelaboratory-based figures. The protein and lipid contents esti-mated with LP were 2.3 and 1.0 g � 100 g21, respectively, lowerand higher than the contents measured in the sample (Table 2).
Discussion
The method described above was used to successfully design aprototype RUTF formulation for the rehabilitation of HIV/TB-wasted adults and children ,5 y with SAM in East Africa. Thesafety and acceptability of the prototype RUTF was subse-quently confirmed in a trial (F. Dibari, P. Bahwere, H. Huerga, A.H. Irena, V. Owino, S. Collins, A. Seal, unpublished data).
Today, LP can be easily applied, whereas, historically, it re-ceived relatively little attention, perhaps because computers werenot widely available when LP was first conceptualized and dis-seminated (22). The example illustrated in this paper was im-plemented using widely available software (Microsoft Excel Office2007 and the Solver add-in). Other proprietary software, specif-ically designed for nutritional use and including LP functions, arealso available, namely Microdiet (37) and Nutrisurvey (34).
In our study, laboratory analysis confirmed that the energy,protein, and lipid values of the prototype formulation werewithin the preestablished cutoffs, before and after that theenergy constraint was relaxed (0.2%) (Table 2). The relativedifference in the energy density (3%) was below the threshold of10% and the protein and lipid absolute differences (2.3 and1.0 g � 100 g21, respectively) were lower than the limit of5 g � 100 g21. However, the relative difference in protein was
large (17.7%). This was not surprising, because it is known thatprotein content, in particular from cereals and pulses, can varyby a factor or two, depending on variety and fertilizer usage(38). These results indirectly confirmed the relative accuracyof the FCD; however, food composition analysis (phase C in Fig.1), at least for protein, remains a recommended step.
In this RUTF prototype, the subjective texture criteria (nottoo gritty, not too fluid) and the criteria for a sufficiently highPDCAAS were met. If the PDCAAS had not been close to thedesired value, the limiting essential amino acid in the formula-tion, lysine in our case, could have been included as a constraint(Table 1). Introducing a minimum constraint for the finalcontent of lysine would have forced the model to include agreater proportion of lysine-rich foods in the formulation.
Taste constraints were also introduced in line with other LPstudies in human nutrition (21). Trials confirmed that the RUTFprototype adequately met the sweetness preferences of bothadults and children. However, it was found that it was notpossible to meet the initial energy constraint. A global optimummodel was successfully found by gradually relaxing the totalenergy constraint.
TABLE 3 Sensitivity analysis of the final optimized model1
ConstraintAllowableincrease
Allowabledecrease
Nutritional
Total energy, kJ .2169 0.03 1.24
,2299 ,0.001 31.0
Protein energy/total energy .0.10 0.004 1.18
,0.12 ,0.001 10.38
Fat energy/total energy .0.45 77.85 ,0.001
,0.60 0.33 0.01
(n-3) Fatty acid energy/total energy .0.003 2.87 ,0.001
.0.025 ,0.001 8.54
(n-6) Fatty acid energy/total energy .0.03 36.3 ,0.001
,0.10 ,0.001 0.003
Palatability
Sugar, g .15 0.50 ,0.001
,18 ,0.001 2.4
Sorghum, g .7 0.02 0.87
,10 3.0 ,0.001
Texture
Fat, g .28 6.6 ,0.001
,36 ,0.001 1.4
Maximum food ingredient weight
Final amount, g 97 0.05 0.001
1 All the values refer to 100 g of product. Calculations were performed using Microsoft
Excel (2007) with the Solver add-in function and the Sensitivity Analysis Report option.
TABLE 2 Comparison of the LP-optimized model and the laboratory composition analysis of thesame formulation
Calculated nutrient densities1 Laboratory results2 Absolute difference Relative difference
A B B 2 A = C (C/A) x 100Energy kJ/100 g 2169.0 2235.0 66.0 3.0
Protein g/100 g 13.0 15.3 2.3 17.7
Protein energy/total energy 0.10 0.11 0.01 —
Lipid g/100 g 34.6 33.6 21.0 22.9
Fat energy/total energy 0.60 0.56 20.04 —
1 Sources of food composition (34,35). LP, linear programming.2 Methods applied (parameters, other information): Pearson (energy); Gafta May 91 (protein, Nx6.25%; lipid). By Polucon Services Limited,
Msaada Avenue, Mombasa, Kenya; test report no. 2008/1282.
Ready-to-use therapeutic foods and linear programming 959
at UN
IV C
OLLE
GE
LON
DO
N on N
ovember 16, 2012
jn.nutrition.orgD
ownloaded from

Goal programming, an alternative to LP, can also be appliedto dietary problems and is described elsewhere (39). It allows thesolution to have a range of OF rather than a single one (27).However, goal programming is more complex to apply. Becausea solution could be found to the LP model by manually relaxingthe energy constraint by only 0.2%, we avoided using this morelaborious method.
In the present study, adjustments to the formulation (phase Cin Fig. 1) were not needed. However, in another context, a sen-sitivity analysis could been used to guide the analyst on howmuchindividual DV coefficients or constraints could be varied withoutrequiring a change in the values of the DV or other constraints.
Our findings support the use of LP as a valuable tool to ensurethat products meet nutritional design requirements while mini-mizing the cost of manufacture. According to UNICEF (40), 68%of Plumpy’nut’s final overall price, excluding manufacturing andtransport costs, consists of food ingredients. In Kenya in March2008, 1 kg of Plumpy’nut cost ~$5.00 (personal communication,Malik Allouna, MSF/France, Kenya mission). This suggests thatthe indicative price for the Plumpy’nut food ingredients compo-nent was $3.40/kg. Therefore, the ingredient costs for the LP-derived RUTF prototype formulation (~$0.70/kg) is likely to besubstantially cheaper, even after the addition of the micronutrientpremix. Importantly, the lower transport and importation costsare also likely to result in a price advantage for locally producedRUTF. The regional agriculture economy may also benefit due tolocal purchase of the ingredients. However, more robust methodsfor economic assessment of RUF formulations are needed tosupport decision makers.
Future standard protocols for RUF design should address theseeconomic aspects, including validatedmethods to obtain food pricedata in low-income countries for use in the LP model. In our study,it was challenging to find price data for ingredients that reliablyrepresented seasonal fluctuations at national or regional levels.Briend et al. (25) estimated the economic impact and efficacy ofnovel nutrient-dense formulations against other current products,but such analysis goes beyond the goal of our current study.
Some constraints were highlighted in applying LP to designfood formulations of this kind. The accuracy of the novel RUFwas highly dependent on the quality of the available FCD. Sincethe 1970s, researchers have realized that most foods exhibitvariations in composition and that a single table value cannotfully represent any particular food (38). Nutrient figures musttherefore be considered as estimates (38). Improvements in FCDdata collection and management have been proposed. Forexample, the INFOODS (33) and Codex Alimentarius Web pages(41) report information on standardized nutrient analyses, andrecent international protocols and software (42) try to harmonizefood names. Despite these initiatives, no FCD source, used for thisLP exercise, reported coefficients of variation or SD figures despitetheir use being internationally recommended (38). WithinWFDAS, the same item descriptors were sometimes reportedmore than once or did not specify the variety (e.g., in case ofsorghum, white or red varieties), emphasizing the importance ofthe database item code for avoiding data selection errors.
In our study, lysine and tryptophan in soybean data from anAmerican database (36) were higher than inmerged non-Americandatabases (35). This might have overestimated the final RUTFprotein quality. However, the Kenyan manufacturer reported thatU.S. soybeans were often present on the local market and so maybe used in products manufactured in East Africa.
The oil descriptor used, palm oil, was different from theactual commodity used, which was palm olein oil. Palm olein isan industrially prepared fraction of palm oil. Therefore, it can be
speculated that its nutrient composition, mainly in terms of (n-3)and (n-6) fatty acids, are different. Unfortunately, the laboratoryused in this study, and probably most industrial laboratories inAfrica, was not equipped to confirm the (n-3) and (n-6) fatty acidLP estimates. Rancidity of these nutrients is a major risk for thestability of food products with a high fat content. Therefore,close monitoring of its shelf life is important. At the time ofwriting this paper, the results from the RUTF shelf life studywere not yet available.
In conclusion, this paper describes a widely applicable methodfor the rational design of therapeutic food products at minimumcost. The study provided a prototype formulation, which met allthe predefined requirements, except for one relaxed by 0.2%, andalso suggested, as a lesson learnt, the need for improved methodsto determine the ingredient prices to use in the model. The RUTFcost (based only on food ingredients) was approximately 4- to 5-fold cheaper than the current standard product (food ingredientsand premix). Using the methods described here, public health nu-tritionists and food technologists could apply these steps to designother RUF formulations, such as ready-to-use supplementary orcomplementary foods. However, the macronutrient contents ofLP prototypes always need to be confirmed by food compositionanalysis and the finalized products trialed under field conditionsbefore they can be recommended for general use (39,43).
Acknowledgments
F.D. conceptualized the study, compiled the food compositionand price database and the RUTF nutritional and technologicalrequirements, ran the LP, and wrote the draft manuscript;E.H.I.D. contributed to the discussion on the LP method; S.C.provided overall support to the research programme as a whole;and A.S. provided research supervision and contributed torevisions of this manuscript, whose final version all authors readand approved. We thank Insta Products EPZ Ltd, whichmanufactured the RUTF product for the laboratory analysis.
Literature Cited
1. WHO. WFP, UN/SCN, UNICEF. Community-based management ofsevere acute malnutrition. Geneva: WHO; 2007.
2. Koethe JR, Chi BH, Megazzini KM, Heimburger DC, Stringer JS.Macronutrient supplementation for malnourished HIV-infected adults:a review of the evidence in resource-adequate and resource-constrainedsettings. Clin Infect Dis. 2009;49:787–98.
3. Golden MH. Evolution of nutritional management of acute malnutri-tion. Indian Pediatr. 2010;47:667–78.
4. WFP, DSM. Ten minutes to learn about nutrition programming. Sightand Life. 2008;3:1–43.
5. Nutriset. Plumpy’nut; 2010 [cited 2011 July 2]. Available from: http://www.nutriset.fr/en/product-range/produit-par-produit/plumpynut-ready-to-use-therapeutic-food-rutf.html.
6. Diop el HI, Dossou NI, Ndour MM, Briend A, Wade S. Comparison ofthe efficacy of a solid ready-to-use food and a liquid, milk-based diet forthe rehabilitation of severely malnourished children: a randomized trial.Am J Clin Nutr. 2003;78:302–7.
7. Kapil U, Sachdev HPS. Management of children with severe acutemalnutrition: a national priority. Indian Pediatr. 2010;47:651–3.
8. Beesabathuni KN, Natchu UCM. Production and distribution of atherapeutic nutritional product for severe acute malnutrition in India:opportunities and challenges. Indian Pediatr. 2010;47:702–6.
9. Gupta A. Commercialising young child feeding in the globalised world:time to call for an end! Stuttgart: Brot fuer die Welt; 2009.
10. Black RE, Allen LH, Bhutta ZA, Caulfield LE, de Onis M, Ezzati M,Mathers C, Rivera J. Maternal and child undernutrition: global andregional exposures and health consequences. Lancet. 2008;371:243–60.
11. United Nations. A road map for Scaling-Up Nutrition (SUN); 2010 [cited2011 July 2]. Available from: http://un-foodsecurity.org/node/768.
960 Dibari et al.
at UN
IV C
OLLE
GE
LON
DO
N on N
ovember 16, 2012
jn.nutrition.orgD
ownloaded from

12. Waterlow JC. Protein energy malnutrition. 1st ed. London: EdwardArnold; 1992.
13. Khanum S, Ashworth A, Huttly SR. Controlled trial of three approachesto the treatment of severe malnutrition. Lancet. 1994;344:1728–32.
14. Greco L, Balungi J, Amono K, Iriso R, Corrado B. Effect of a low-costfood on the recovery and death rate of malnourished children. J PediatrGastroenterol Nutr. 2006;43:512–7.
15. Ashraf H, Ahmed T, Hossain MI, Alam NH, Mahmud R, Kamal SM,Salam MA, Fuchs GJ. Day-care management of children with severemalnutrition in an urban health clinic in Dhaka, Bangladesh. J TropPediatr. 2007;53:171–8.
16. Ferguson EL, Briend A, Darmon N. Can optimal combinations of localfoods achieve the nutrient density of the F100 catch-up diet for severemalnutrition? J Pediatr Gastroenterol Nutr. 2008;46:447–52.
17. Dibari F, Bahwere P, Le Gall I, Guerrero S, Mwaniki D, Seal A. Aqualitative investigation of adherence to nutritional therapy in malnour-ished adult AIDS patients in Kenya. Public Health Nutr. 2012;15:316–23.
18. Ferguson EL, Darmon N, Briend A, Premachandra IM. Food-baseddietary guidelines can be developed and tested using linear program-ming analysis. J Nutr. 2004;134:951–7.
19. Smith VE. Linear programming models for the determination ofpalatable human diets. J Farm Econ. 1959;31:272–83.
20. Anderson AM, Earle MD. Diet planning in the third world by linear andgoal programming. J Oper Res Soc. 1983;34:9–16.
21. Briend A, Darmon N, Ferguson E, Erhardt JG. Linear programming: amathematical tool for analyzing and optimizing children’s diets duringthe complementary feeding period. J Pediatr Gastroenterol Nutr.2003;36:12–22.
22. Darmon N, Ferguson E, Briend A. Linear and nonlinear programmingto optimize the nutrient density of a population’s diet: an example basedon diets of preschool children in rural Malawi. Am J Clin Nutr.2002;75:245–53.
23. Darmon N, Ferguson EL, Briend A. A cost constraint alone has adverseeffects on food selection and nutrient density: an analysis of human dietsby linear programming. J Nutr. 2002;132:3764–71.
24. Rambeloson ZJ, Darmon N, Ferguson EL. Linear programming canhelp identify practical solutions to improve the nutritional quality offood aid. Public Health Nutr. 2008;11:395–404.
25. Briend A, Ferguson E, Darmon N. Local food price analysis by linearprogramming: a new approach to assess the economic value of fortifiedfood supplements. Food Nutr Bull. 2001;22:184–9.
26. Ferguson EL, Darmon N, Fahmida U, Fitriyanti S, Harper TB,Premachandra IM. Design of optimal food-based complementary feedingrecommendations and identification of key "problem nutrients" usinggoal programming. J Nutr. 2006;136:2399–404.
27. Westrich BJ, Altmann MA, Potthoff SJ. Minnesota’s nutrition coordi-nating center uses mathematical optimization to estimate food nutrientvalues. Interfaces. 1998;28:86–89.
28. Schaafsma G. The protein digestibility-corrected amino acid score.J Nutr. 2000;130:S1865–7.
29. South Africa Department of Health. True protein digestibility values;2002 [cited 2010 Oct 8]. Available from: http://www.doh.gov.za/docs/regulations/2002/reg1055annex.html.
30. Singh S, Gamlath S, Wakeling L. Nutritional aspects of food extrusion:a review. Int J Food Sci Technol. 2007;42:916–29.
31. Manary MJ. Local production and provision of ready-to-use therapeuticfood for the treatment of severe childhood malnutrition. Food NutrBull. 2006;27:S83–9.
32. United Nations University. Formulations for fortified complementaryfoods and supplements: review of successful products for improving thenutritional status of infants and young children. Food Nutr Bull.2009;30:S239–55.
33. FAO. INFOODS; 2007 [cited 2010 July 20]. Available from: http://www.fao.org/infoods/index_en.stm.
34. Nutrisurvey. Nutrition surveys and calculations. Guidelines, softwareand additional Information; 2007 [cited 2007 Oct 10]. Available from:http://www.nutrisurvey.de.
35. World Food Dietary Assessment System [computer program]. Version 2.Berkeley (CA): University of California; 1998.
36. USDA National Nutrient Database for Standard Reference. Release 20[computer program] [cited 2008 Oct 12]. Available from: http://www.ars.usda.gov/main/docs.htm?docid=15869.
37. Microdiet; 2010 [cited 2010 Aug 18]. Available from: http://www.microdiet.co.uk//index.php.
38. Greenfield H, Southgate DAT. Food composition data. Production,management and use. 2nd ed. Rome: FAO; 2003.
39. Santika O, Fahmida U, Ferguson EL. Development of food-basedcomplementary feeding recommendations for 9- to 11-month-old peri-urban Indonesian infants using linear programming. J Nutr. 2009;139:135–41.
40. Duke University. A supply chain analysis of ready-to-use therapeutic foods forthe horn of Africa: the nutrition articulation project. A study commissioned byUNICEF, [cited 2010Oct 10]. Available from: http://sanford.duke.edu/centers/ghta/documents/RUTFSupplyChainProject-UNICEF_DUKE-UNC_May09.pdf.
41. FAO/WHO. Codex Alimentarius; 2007 [cited 2010 Aug 15]. Availablefrom: www.codexalimentarius.net/.
42. Ireland JD, Moeller A. LanguaL 2009. The LanguaL thesaurus.EuroFIR Technical Report D1.8.43. Norwich (UK): EuroFIR; 2009.
43. Oakley E, Reinking J, Sandige H, Trehan I, Kennedy G, Maleta K,Manary M. A ready-to-use therapeutic food containing 10% milk is lesseffective than one with 25% milk in the treatment of severelymalnourished children. J Nutr. 2010;140:2248–52.
44. Report of a meeting on supplementary feeding programmes withparticular reference to refugee populations. Eur J Clin Nutr. 1995;49:137–45.
Ready-to-use therapeutic foods and linear programming 961
at UN
IV C
OLLE
GE
LON
DO
N on N
ovember 16, 2012
jn.nutrition.orgD
ownloaded from

lable at ScienceDirect
Nutrition xxx (2012) 1–6
Contents lists avai
Nutrition
journal homepage: www.nutr i t ionjrnl .com
Applied nutritional investigation
Development of a cross-over randomized trial method to determinethe acceptability and safety of novel ready-to-use therapeutic foods
Filippo Dibari M.Sc. a,b,*, Paluku Bahwere Ph.D., M.D. a, Helena Huerga Ph.D., M.D. c,Abel Hailu Irena M.D. a, Victor Owino Ph.D. d, Steve Collins Ph.D., M.D. a,d,Andrew Seal Ph.D., M.Sc. b
aValid International, 35 Leopold Street, Oxford, OX4 1TW, United KingdombUCL Centre for International Health and Development, Institute of Child Health, 30 Guilford Street, London, WC1N 1EH, United KingdomcMSF-France/Kenya, ABC Place, Wayaki Way, Nairobi, KenyadValid Nutrition, Cuib�ın Farm, Derry Duff, Bantry, Co. Cork, Ireland
a r t i c l e i n f o
Article history:Received 21 December 2011Accepted 2 April 2012
Keywords:Ready to use therapeutic foodAcceptabilityRandomized trialPreferenceSafetyCrossover
* Corresponding author. Tel./fax: þ31 (0) 685 639 8E-mail address: [email protected] (F. D
0899-9007/$ - see front matter � 2012 Elsevier Inc. Adoi:10.1016/j.nut.2012.04.016
Please cite this article in press as: Dibari F,and..., Nutrition (2012), doi:10.1016/j.nut.20
a b s t r a c t
Objective: To develop a method for determining the acceptability and safety of ready-to-usetherapeutic foods (RUTF) before clinical trialing. Acceptability was defined using a combinationof three consumption, nine safety, and six preference criteria. These were used to compare a soy/maize/sorghum RUTF (SMS-RUTFh), designed for the rehabilitation of human immunodeficiencyvirus/tuberculosis (HIV/TB) wasted adults, with a peanut-butter/milk-powder paste (P-RUTF;brand: Plumpy’nut) designed for pediatric treatment.Methods: A cross-over, randomized, controlled trial was conducted in Kenya. Ten days of repeatedmeasures of product intake by 41 HIV/TB patients, >18 y old, body mass index (BMI) 18-24 kg$m�2,250 g were offered daily under direct observation as a replacement lunch meal. Consumption,comorbidity, and preferences were recorded.Results: The study arms had similar age, sex, marital status, initial BMI, and middle upper-armcircumference. No carryover effect or serious adverse events were found. SMS-RUTFh energyintake was not statistically different from the control, when adjusted for BMI on day 1, and thepresence of throat sores. General preference, taste, and sweetness scores were higher forSMS-RUTFh compared to the control (P < 0.05). Most consumption, safety, and preference criteriafor SMS-RUTFh were satisfied except for the average number of days of nausea (0.16 versus 0.09 d)and vomiting (0.04 versus 0.02 d), which occurred with a higher frequency (P < 0.05).Conclusion: SMS-RUTFh appears to be acceptable and can be safely clinically trialed, if closemonitoring of vomiting and nausea is included. The method reported here is a useful and feasibleapproach for testing the acceptability of ready-to-use foods in low income countries.
� 2012 Elsevier Inc. All rights reserved.
Introduction
Ready-to-use therapeutic foods (RUTF) are high-energy,nutrient-dense products in which the powdered ingredientsare usually suspended in fat. They do not require any preparationor the addition of water before ingestion [1] and can be storedfor long periods without refrigeration. They can be individuallypackaged and can therefore be used effectively in situations withnon-optimal hygiene conditions [1]. RUTFs are popular infeeding programs [2], including human immunodeficiency
59.ibari).
ll rights reserved.
et al., Development of a cr12.04.016
virus/tuberculosis (HIV/TB) interventions [1,3], because their usehas been associated with an increase in successful treatmentrates for severe acute malnutrition (SAM) when compared toother conventional treatments [4]. However, at present, the highprice of RUTFs and their low regional availability hamperswidespread use [5].
RUTF were initially developed for pediatric nutritional reha-bilitation and the United Nations currently recommends [2,6]their use, at the community level, to help eradicate the onemillion child deaths that occur every year due to SAM [6]. Inthe next few years, $US2.6 billionwill be spent on SAM treatment[4,7], and therefore, novel, cheaper, culturally acceptable, effi-cacious, and regionally manufactured products are already in
oss-over randomized trial method to determine the acceptability

F. Dibari et al. / Nutrition xxx (2012) 1–62
demand for this patient group [2]. RUTF have also been used infeeding programs for HIV and TB patients and evidence fromlow-resource settings [8–14] shows that HIV/TB wasting inadults is still a public health issue in Sub-Saharan Africa, despitethe increasing access to antiretroviral therapy.
In such countries, HIV programs aiming for nutritional reha-bilitation and/or nutrition support tend to use a few specifictypes of food [10], usually either fortified blended foods [15] orRUTFs [16]. The most common commercial brand of RUTF isPlumpy’nut [17], which was designed for pediatric use and is theonly one that has been clinically tested in several differentstudies [3,18–22]. In wasted adults, a number of factors havebeen shown to reduce compliance with Plumpy’nut includingthe taste of this pediatric formulation [23]. Moreover, themicronutrient densities in Plumpy’nut might not be appropriatefor the needs of wasted adults with HIV/TB. For these reasons,there is demand for the development of a novel RUTF for thispatient group.
Changes to the formulation of RUTF should be based onclinical evidence derived from randomized controlled trials(RCT) [24] but these are costly to implement. Therefore, robustdata on product acceptability are required before implementa-tion of a RCT, and determining adequate consumption, safety,and preference is a crucial early step in successful productdevelopment. However, at present there is no internationallyendorsed protocol to assess the acceptability of products ofthis kind.
Here, we present a method for testing the acceptability ofnovel RUTF. To our knowledge, this is the first trial in a devel-oping country that tests the acceptability of this type of productinwasted adults. The results of this randomized control study arepresented according to recommended guidelines for cross-overtrials [25].
Materials and methods
Trial and control products
The control product (Plumpy’nut; Nutriset, Malaunay, France [17]) containspeanut butter, milk powder, and a premix of vitamins and minerals and isreferred to here as P-RUTF. The trial RUTF (Valid Nutrition, Derry Duff, Ireland, atInsta Ltd., Nairobi, Kenya) contained soybeans, maize, and sorghum, no micro-nutrients premix, and is referred to here as SMS-RUTFh (“h” standing for adultHIV/TB). Both products contained sugar (28 and 15 100 g�1, respectively, forP-RUTF and SMS-RUTFh) and their macronutrients (energy, protein, lipids)closely met the United Nations requirements for RUTF (Table 1). Both theirconsistencies were pastelike, but their tastes and colors were different. The
Table 1Comparison of macronutrients in the two RUTFs
SMS-RUTFh
Ingredients: Soy beans, maize, sorghum, sugar, and oil
Source: International food compositiondatabases
Laborator
Reference number [36,37]
Energy, kJ$kg�1 20 900 22 350Protein, g$kg�1 120 153Protein/energy ratio, % 10 11Lipid, g$kg�1 310 336Lipid/Energy ratio, % 56 56(u-6) Fatty acids/energy ratio, % 9 n.a.(u-3) Fatty acids/energy ratio, % 0.8 n.a.Protein digestibility-corrected
amino-acid score, %82 n.a.
Please cite this article in press as: Dibari F, et al., Development of a crand..., Nutrition (2012), doi:10.1016/j.nut.2012.04.016
detailed formulation and clinical efficacy of SMS-RUTFh will be reported inanother article (in preparation).
Study population, recruitment, and setting
The study was carried out in two locations, 2 km from each other, in HomaBay, Kenya. The participants, enrolled after written informed consent, werepatients recruited from the District hospital, supported by the Ministry of Health(MoH) and M�edecins Sans Fronti�eres-France (MSF). The patients from the twostudy groupsmet each other only at enrollment (day 1), and/or incidentally in theroutine medical hospital visits. The participants, HIV and/or TB infected, wereconsidered eligible if receiving antiretroviral therapy and/or TB treatment; age�18 y; and BMI between 18 and 24 kg$m�2 (Table 2). The exclusion criteriaconsisted of previous enrollment in a nutritional therapeutic program; oralproblems that prevented adequate swallowing (typical AIDS oral thrush was notan exclusion criteria); and any specific food intolerance (e.g., peanut allergy).Patients missing more than 3 d were considered defaulters.
Study design
The study design was a two-arm cross-over randomized control trial. Atenrollment, the patients were given a number from 1 to 2, randomly generatedusing an Excel spreadsheet (RAND function), that corresponded to one of the trialgroups. Each group received one of the two products during each phase (AB/BAsequence). Under direct observation, during 2 wk (10 working days), water adlibitum and 250 g of one of the two products were offered to the patients asa replacement of the midday meal, with the message “please, eat as much as youwish.” An extra 50 g was available on request. A maximum of 2 h was allowed toconsume the product, and no leftovers could be taken away. After 2 wk (phase 1),the study was interrupted for 7 d (washout period) and then resumed for twomore weeks (phase 2).
The professional background of the research staff included nursing, nutrition,and counseling. No one worked for the MoH or MSF, and the staff worked ina different study group each day, interviewing randomly assigned patients (ratioof staff members and patients: 1:3). In-depth questionnaires and focus groupguidelines were provided in both English and the local language (Dholuo), afterbeing anonymously back-translated. The packaging concealed the productidentification.
Study procedure and outcomes
To consider RUTFh acceptable and safe, it had to fulfill the following criteriaand subcriteria for consumption, safety, and preference (Tables 3–5).
Criterion 1: ConsumptionThe consumption criterion consisted of three subcriteria. The subcriteria
“average consumption”was satisfied if average SMS-RUTFh intakewasmore than75% (187.5 g) of the offered amount within 1 h (criterion 1.1; Table 3), whereasSMS-RUTFh “daily consumption”was met if its intake was higher than 75% of theoffered food for more than 75% of the days on the trial (criterion 1.2). Finally, the“comparative energy intake” criterion (1.3) was satisfied if the average energyintake per kilogram of body weight was significantly higher than 75% of theenergy intake from the P-RUTF.
P-RUTF References
Peanut butter, milk powder,sugar and oil, vitamin andmineral premix
n.a.
y results Diop et al.(2003) UN reference for pediatricRUTF (2007)
[19] [6]
22 810 21 740-22 990136 n.a.n.a. 10-12357 n.a.n.a. 45-60n.a. 3-10n.a. 0.3-2.5n.a. n.a.
oss-over randomized trial method to determine the acceptability

Table 2Characteristics of the participants at the start of the study (day 1), unless spec-ified otherwise
Group
1 (n ¼ 20) 2 (n ¼ 21)
Females, n (%) 17 (85.0) 15 (71.4)Age,* y 34 (29; 42) 30 (27; 35)Marital status, n (%)Currently married 10 (50.0) 12 (57.1)Never been married 1 (5.0) 3 (14.3)Previously married andnow widower
9 (45.0) 6 (28.6)
BMI at enrollment,* kg$m�2 20.3 (18.9; 22.1) 19.9 (19.1; 21.8)MUAC at enrollment,* mm 260 (229; 274) 266 (248; 280)Diet Diversity Scorey 7.5 (6.9; 8.2) 7.3 (6.7; 7.9)Participants who had tasted P-RUTF at
least once before the trial, n (%)20 (100) 21 (100)
* Median and inter-quartile range (IQR).y Medians and IQR of four measures over 2 wk, two consecutive days per week
(phase 2 of the trial).
F. Dibari et al. / Nutrition xxx (2012) 1–6 3
Criterion 2: SafetySMS-RUTFh was considered acceptable from the safety point of view if
participants did not report any of five comorbidity eventsmore frequently than inthe control product (criteria 2.1-2.5; Table 4). This parameter was expressed asthe mean number of days in which morbidity events occurred during productconsumption (10 d or less). Before the acceptability trial, microbiologic testing ofSMS-RUTFh was performed. The results were in conformity with the UnitedNations specifications for such products [6].
Criterion 3: PreferenceA product was considered preferred if its score was higher than the alter-
native in the following aspects: general preference, color, taste, sweetness, andtexture (criteria 3.1-3.5; Table 5). At the end of the trial, each participant wasasked to select the most preferred product (criterion 3.6), and two focus groupswere held to investigate participants’ experiences and perceptions that othermethods may not have captured.
Data collectionQuantitative data were collected daily and included body weight, height, and
middle upper-arm circumference (MUAC), weight of RUTF intake (Salter scaleM021, max 500 � 5 g), 24-h recall of nine clinical events, and individual eatingduration. Body weight, MUAC, and height were collected daily, weekly, and atbaseline, respectively. Individual interviews of all participants used a five-pointLikert scale (with lower scores representing greater liking of a RUTF) [26], heldto evaluate the preference for each product. Focus groups (30 to 40 min long)used preselected lists of discussion themes and the facilitators followed awrittenmanual. Discussions undertaken in the local language were digitally recordedand transcribed into English, and twice a week, a diet diversity score (DDS)questionnaire (0-12 items type [27]) recorded the foods consumed at home.
Management of adverse eventsPatients reporting any of the five clinical events for more than three
consecutive days would have been immediately referred to the local clinic andwithdrawn from the study if the cause was considered to be related to RUTFintake.
Table 3Product consumption in the two combined groups (n1 ¼ 20; n2 ¼ 21)
RUTF consump
SMS-RUTFh (n
A
Average consumption, g$d�1 (95%CI) 232.5 (218.9; 2Daily consumption,k % (95%CI) 86.1 (78.8; 93Comparative energy intake kJ intake$kg body wt�1$d�1 (95%CI) 94.9 (81.5; 10
* Least-square means and 95% confidence intervals.y P value between SMS-RUTFh and threshold.z P value between P-RUTF and threshold.x The threshold is 0.75 times the 250 g initially provided.k Percentage of days with consumption higher than 75% of the provided amount (2{ The thresholds are 0.75 times the P-RUTF figures.
Please cite this article in press as: Dibari F, et al., Development of a crand..., Nutrition (2012), doi:10.1016/j.nut.2012.04.016
Sample size
A pediatric acceptability cross-over trial on RUTF [28] involved a sample sizeof 31 children, during 2 d of RUTF feeding, to detect a significant difference witha and b errors of 0.05 and 0.95. Its power calculation, based on of RUTF dailyintake, considered 1 SD an acceptable difference to be detected. However,because previous research on RUTF acceptability was not available in adults,the nature of our study was exploratory. For this reason, when compared to theIndian pediatric study, the sample size (n ¼ 50 including dropouts) and thenumber of feeding days (10 repeated measures/RUTF/individual) were bothincreased, but limited by the available budget.
Statistical methods
Student’s t test and regression models were used to test for differencesbetween continuous data. TheWilcoxon rank-sum (Mann-Whitney) test and signtest were used for non-normally distributed, unpaired, continuous data, whereasthe Wilcoxon matched-pairs signed-rank test was used for non-normallydistributed, paired continuous data, including the Likert scale five-item score.The double-sided Fisher exact test was used to compare categorical data, andodds ratios and confidence intervals were calculated. A linear regression modelcompared the energy intake of the two products after adjusting for potentialconfounders, including clinical events, socioeconomic data, and anthropometryat enrollment. Logistic regression models explored if the preference for a productcould be influenced by group membership. Analysis of ordinal score for prefer-ence criteria was based on logistic (not ordinal) regression, after regrouping thedata into two categories (scores 1 and score 2, 3, 4, or 5 of 5). This was because ofthe instability of themodel, due to too fewcases when cross-tabulating outcomesand predictors. When applicable, regression models benefitted from the robuststandard error approach [29], so that the participant’s series of repeatedmeasurements were considered as individual clusters. Absence of a carryovereffect was checked before treatment-effect analysis, following a methoddescribed elsewhere [30]. Statistical comparisons were two-tailed, and all testingwas conducted at a ¼ 0.05, on per protocol data. EpiData version 3.1 software(Copenhagen, Denmark) was used for data entry and data analysis was under-taken using Stata IC v.10.
Ethical issues
This acceptability and safety trial was embedded into a larger researchprogram that had ethical approval granted by the Kenyan Medical ResearchInstitute and National Ethical Review Committee (SSC No.1414) to test the clinicaleffectiveness of SMS-RUTFh.
Results
Characteristics of the participants
On June 30, 2008, the study staff enrolled 51 patients (Fig. 1)into a 5-wk trial. Two patients were excluded because they livedtoo far. Twenty-four and 25 participants were randomly allo-cated into groups 1 and 2, respectively. During the first phase ofthe trial, eight patients defaulted for more than 3 d and wereexcluded. Two of them stopped coming after the second day ofthe trial for unknown reasons and could not be traced. Six
tion* P Valuey P Valuez
¼ 381) P-RUTF (n ¼ 398) Threshold
B
46.1) 243.0 (230.9; 255.0) 187.5x <0.001 <0.001.4) 87.7 (81.4; 94.0) 75.0 <0.001 <0.0018.3) 102.4 (96.0; 108.7) 76.8 (72.0; 81.4){ <0.001 <0.001
50 g).
oss-over randomized trial method to determine the acceptability

Table 4Safety criteria using 24-h morbidity recall in combined groups (n1 ¼ 20; n2 ¼ 21)
Criteria Number of days* during which morbidityevents occurred
P value
SMS-RUTFh (n ¼ 381) P-RUTF (n ¼ 398)
A B
C2.1: Nausea 0.16 (0.05; 0.47) 0.09 (0.05; 0.14) 0.04C2.2: Vomiting 0.04 (0.01; 0.19) 0.02 (0.01; 0.04) 0.03C2.3: Stomach pain 0.14 (0.05; 0.38) 0.16 (0.10; 0.25) NSC2.4: Flatulence 0.13 (0.05; 0.36) 0.16 (0.09; 0.26) NSC2.5: Diarrhea 0.36 (0.03; 0.70) 0.31 (0.13; 0.49) NS
NS, non-significant* Least-square mean and 95% confidence interval.
F. Dibari et al. / Nutrition xxx (2012) 1–64
patients dropped out because of reasons not associated withproduct intake (transfer, other commitments). Forty-onepatients successfully completed the study.
At admission, gender, marital status, BMI, and MUAC (Table 2)in the two groups were statistically similar. The DDS did nothighlight any statistical significant difference in terms of kinds offood intake at household level, between the two groups. Nodifference was detected between the 2 wk DDS, nor within thesameweek for the same patients (Table 6). No carryover regardingamount and daily energy intake was reported (P > 0.05).
Measurement of acceptability
Measurement of consumptionBoth average and daily consumptionmeasurementswere above
the threshold (P < 0.001; Table 3) for SMS-TUTFh, confirming thatall the patients consumed more than 75% of SMS-RUTFh within anhour (criterion 1.1); that acceptable consumption occurred onmorethan 75% of the trial days (criterion 1.2); and that its energy intakewas higher than 75% of the P-RUTF intake in the two groupscombined (P < 0.001) (criterion 1.3).
A linear regression model (robust standard error, 40-clusteranalysis; R2 ¼ 0.11; P¼ 0.01; N¼ 779) showed that the differencebetween the energy intakes of the two products (SMS-RUTFh andP-RUTF) was not statistically significant (P¼ 0.06) when adjustedfor confounders identified by a stepwise analysis (initial BMI,negatively correlated with energy intake, P ¼ 0.002; presence ofthroat sores, negatively correlated, P ¼ 0.13). Other potentialconfounders, which showed no or very small influence in theexplored model and were not included, were age, and days of
Table 5Criteria for food preference (Likert score type*; five items) in the two groups(n1 ¼ 20; n2 ¼ 21), expressed on the last days of phase 1 and 2 of the trial
Criteria SMS-RUTFh (n ¼ 39) P-RUTF (n ¼ 41) P value
C3.1: General preferenceMedian (IQR) 1 (1; 2) 2 (2; 3) <0.001Mean (95%CI) 1.4 (1.2; 1.5) 2.4 (2.1; 2.8)
C3.2: ColorMedian (IQR) 2 (1; 3) 2 (1; 3) NSMean (95%CI) 2.0 (1.6; 2.4) 2.1 (1.7; 2.4)
C3.3: TasteMedian (IQR) 1 (1; 2) 3 (2; 4) <0.001Mean (95%CI) 1.5 (1.3; 1.8) 2.7 (2.3; 3.1)
C3.4: SweetnessMedian (IQR) 1 (1; 2) 3 (2; 4) <0.001Mean (95%CI) 1.7 (1.3; 2.0) 2.3 (2.5; 3.3)
C3.5: TextureMedian (IQR) 2 (1; 4) 2 (1; 2) 0.02Mean (95%CI) 2.3 (1.8; 2.7) 1.7 (1.4; 1.9)
NS, non-significant* The scores range from 1 (very good) to 5 (very bad).
Please cite this article in press as: Dibari F, et al., Development of a crand..., Nutrition (2012), doi:10.1016/j.nut.2012.04.016
diarrhea, nausea, and flatulence. However, the statistical powerof the available sample size was likely to be relatively small.
Evaluation of possible morbidity effectsMost types of morbidity did not differ according to product
consumption (Table 4). Also, the average number of days withreported nausea and vomiting in participants consuming SMS-RUTFh was low (0.16 and 0.04 d of illness; 381 repeated dailymeasures). However, when applying robust standard erroranalysis, the data showed that these morbidities were signifi-cantly more frequent than when subjects were consumingP-RUTF (0.09 and 0.02; 398 repeated measures; P ¼ 0.04 and0.03). Nausea or vomiting never occurred for more than threeconsecutive days.
Measurement of patient’s preferenceResults from the fortnight interviews indicated higher scores
for general preference, taste, and sweetness for SMS-RUTFh (crite-rion 3.1, 3.3, and 3.4; P< 0.001; Table 5), whereas no product waspreferred in termsof color (criterion 3.2). SMS-RUTFh texturewasless preferred than the control (criterion 3.5; P ¼ 0.02).
On the last day of the trial, thewhole sample (n¼ 41) failed toidentify a final preference (criterion 3.6) for a specific product(P ¼ 0.8). SMS-RUTFh and P-RUTF were preferred, respectively,by 52% (95%CI: 36; 69) and 48% (32; 64) of the participants.However for most patients, the preferred product was the oneallocated to them in the first phase of the trial. For participantsstarting phase 1 with product A, the odds to prefer product Awere 5.4 times (95% CI, 1.4-20.4) higher than for participantsstarting product A in phase 2 (P ¼ 0.02).
The two focus groups organized on the last day supported thefindings from the quantitative data and also suggested that“SMS-RUTFh texture needed to be refined,” whereas “P-RUTFtasted salty” and “provoked more cases of flatulence.” Moreoverthe patients were “not happy about changing the product fromphase 1 to 2, once they had got accustomed to the first providedproduct” and felt that “the products were increasing weight” andphysical “strength,” “reducing hunger feelings.” No morbidityevent was mentioned during the focus groups.
Discussion
The present study demonstrated that most prestated criteriafor acceptability of a novel RUF were satisfied, confirmed theutility of the proposed method and, at the same time, illustratedlessons that will contribute to improving future trials of a similarkind.
The acceptability of SMS-RUTFh
The findings of this study suggest that, in this participantgroup, SMS-RUTFh intake was adequate, and it was preferred insome regard to the current standard product. The patients couldconsume most of the trial product provided throughout thestudy, exceeding the selected threshold for adequate energyintake based on the control RUTF. Despite the higher (8%) energydensity of P-RUTF, the energy intakes of the two products werestatistically similar when adjusted for possible confounders, butthe study might be underpowered to highlight a difference.Among the identified confounders, it can be speculated thatthroat sores reduce the swallowing capacity of the patients. Aqualitative study on the compliance of the use of P-RUTF ach-ieved a similar conclusion [23]. In SAM patients, cases of swal-lowing difficulty need to be detected early by medical staff and
oss-over randomized trial method to determine the acceptability

Contacted and assessed for eligibility(n=51)
Drop-out:- transfer (n=4)
Drop-out:- unknown reasons (n=2)- transfer (n=2)
Analyzed (n=41)
Excluded from analysis (n=0)
GROUP 1
Allocated toP-RUTF(n=24)
Crossed over toSMS-RUTFH
(n=20)
Randomized(n=49)
Excluded because living too far to comedaily to the trial site
(n=2)
Allocated toSMS-RUTFH
(n=25)
Crossed over toP-RUTF(n=21)
one week one week
Pha
se 1
Pha
se 2
Dat
aA
naly
sis
GROUP 2
Fig. 1. Flow chart of the participants through the trial.
F. Dibari et al. / Nutrition xxx (2012) 1–6 5
ideally addressed with appropriate in-patient care using thera-peutic milk formulas (F75 and F100) [31]. As soon as the swal-lowing capacity is restored, generally in a few days, RUTF-basednutrition can be started and home-based care established.
The regression analysis found no evidence of increasedmorbidity associated with SMS-RUTFh consumption for mostparameters. Although the frequencies of nausea and vomitingwere higher in SMS-RUTFh than in the control product, theynever affected participants for a prolonged period, and days ofillness appeared to be scattered randomly along the time courseof the trial. The regression models showed that the two comor-bidities were not associated with a decreased energy intake. Thissuggests that the cause(s) might be due to chance or unknownfactors, and that these and other events need close monitoringduring the clinical trial.
The score for general preference was higher for SMS-RUTFhand its taste and sweetness were also preferred. However, itstexture was less liked than P-RUTF, and this suggested the need
Table 6Diet diversity score* in phase 2 of the trial
Week 1 2
Tuesday Thursday Tuesday Thursday
Group 1 (n ¼ 19) 7.4 (6.5; 8.2) 7.7 (6.9; 8.5) 7.4 (6.5; 8.3) 7.6 (7.0; 8.2)Group 2 (n ¼ 21) 7.8 (7.1; 8.5) 6.7 (5.9; 7.6) 7.7 (6.8; 8.6) 6.9 (6.7; 7.7)Groups combined 7.6 (7.1; 8.1) 7.2 (6.6; 7.8) 7.6 (6.9; 8.2) 7.2 (6.7; 7.7)
* Mean (95% confidence intervals).
Please cite this article in press as: Dibari F, et al., Development of a crand..., Nutrition (2012), doi:10.1016/j.nut.2012.04.016
for improved industrial processing to enhance the SMS-RUTFhconsistency.
The order the RUTFs were offered to the participants wasimportant. SMS-RUTFh consumption increased or decreased,according to whether it was provided as the first or secondproduct. That might be because it was difficult for participants toadapt to a novel product once they are accustomed to theprevious one.
Some constraints were highlighted. The participants of thetrial were enrolled in the MoH/MSF HIV program and had allbeen exposed to P-RUTF. Information of this kind, acquiredbefore direct experience, could have shaped the food consump-tion and preferences as suggested elsewhere [32].
Lesson learned about the method
This study highlighted important aspects in the application ofmethods to assess RUF acceptability. Among these, the resultsconfirmed that a combination of both quantitative and qualita-tive measures is needed to capture the complex of factors influ-encing acceptability. The carryover effect analysis, recommendedin cross-over studies [25], showed that the washout period(1 wk) was adequate and might be reduced for future trials.
The sample size (n ¼ 41) compares favorably with an Indianstudy, whose sample size was powered for a difference of at least1 SD. Determining the equivalence or non-inferiority of SMS-RUTFhto the current standard product, rather than its statistical superi-ority to prestated thresholds, represents an alternative study designused to validate robustly a novel therapy [33] but requires a large
oss-over randomized trial method to determine the acceptability

F. Dibari et al. / Nutrition xxx (2012) 1–66
sample size [34]. Other randomized trials [3,18,28], comparingRUTF with alternative food-based therapies, did not apply thesemethods. It is also important to note that the method describedhere is designed to be used in conducting an acceptability trial thatprecedes a RCT of clinical efficacy.
The study had some constraints. Ten days of RUTF intake, ineachphase of our study,might havebeen too short to simulate thenutrition rehabilitation therapy in wasted adults (3 mo; MSF/Kenya, personal communication, 2008). ThemainuseofRUTF is inoutpatient and exclusive feeding programs. The study patients,instead, had access to the RUTF during only one daily meal, farfrom their households, while theywere observed by the researchstaff.
For reasons explained elsewhere35, the SMS-RUTF did notcontain the micronutrients premix, which might alter the finaltaste of the product and the findings of the trial. A tastecomparison between RUTF with and without premix thereforemust be carried out to confirm these acceptability results.
Conclusion
Despite constraints, this exploratory study demonstrated theutility of this method and the acceptability of a novel, locallyproduced, RUTF. Its safety, mainly from the points of view ofnausea and vomiting, should be monitored carefully. Lessonsabout the method were learned from the implementation of thestudy and should contribute to improving future trials.
Acknowledgments
We thank P. Pomito, E. Severi, M. Wagah, N. Weldon, A. Wade,E. Koutoumanou, the study team, and the participants for theirsupport of the study.
References
[1] Koethe JR, Chi BH, Megazzini KM, Heimburger DC, Stringer JS. Macronu-trient supplementation for malnourished HIV-infected adults: a review ofthe evidence in resource-adequate and resource-constrained settings. ClinInfect Dis 2009;49:787–98.
[2] EnserinkM.Nutritionscience.Thepeanutbutterdebate. Science2008;322:555.[3] NdekhaMJ, vanOosterhout JJG, Zijlstra EE,ManaryM, SaloojeeH,ManaryMJ.
Supplementary feedingwith either ready-to-use fortified spread or corn-soyblend in wasted adults starting antiretroviral therapy in Malawi: rando-mised, investigator blinded, controlled trial. BMJ 2009;338:b1867.
[4] Horton S, Shekar M, McDonald C, Mahal A, Brooks JK. Scaling-up nutrition.What will it cost? Washington, DC: The World Bank; 2010.
[5] UNICEF, Valid International. Global CMAM mapping UNICEF supportedcountries. Field Exchange 2011;41:10–3.
[6] WHO, WFP, UN/SCN, UNICEF. Community-Based Management of SevereAcute Malnutrition. Geneva: WHO; 2007.
[7] United Nations. A road map for Scaling-Up Nutrition (SUN) 2010. Availableat: http://un-foodsecurity.org/node/768. Accessed July 02, 2011.
[8] Uthman OA. Prevalence and pattern of HIV-related malnutrition amongwomen in sub-Saharan Africa: a meta-analysis of demographic healthsurveys. BMC Public Health 2008;8:226–30.
[9] Koethe JR, Lukusa A, Giganti MJ, Chi BH, Nyirenda CK, Limbada MI, et al.Association between weight gain and clinical outcomes amongmalnourished adults initiating antiretroviral therapy in Lusaka, Zambia. JAcquir Immune Defic Syndr 2010;53:507–13.
[10] Greenaway K. Food by Prescription: A Landscape Paper. Geneva: GAIN;2009.
Please cite this article in press as: Dibari F, et al., Development of a crand..., Nutrition (2012), doi:10.1016/j.nut.2012.04.016
[11] Paton NI, Sangeetha S, Earnest A, Bellamy R. The impact of malnutrition onsurvival and the CD4 count response in HIV-infected patients startingantiretroviral therapy. HIV Med 2006;7:323–30.
[12] Johannessen A, Naman E, Ngowi BJ, Sandvik L, Matee MI, Aglen HE, et al.Predictors of mortality in HIV-infected patients starting antiretroviraltherapy in a rural hospital in Tanzania. BMC Infect Dis 2008;8:52.
[13] Stringer JS, Zulu I, Levy J, Stringer EM, Mwango A, Chi BH, et al. Rapid scale-up of antiretroviral therapy at primary care sites in Zambia: feasibility andearly outcomes. JAMA 2006;296:782–93.
[14] Zachariah R, Fitzgerald M, Massaquoi M, Pasulani O, Arnould L, Makombe S,et al. Risk factors for high early mortality in patients on antiretroviraltreatment in a rural district of Malawi. AIDS 2006;20:2355–60.
[15] WFP. Food and nutrition handbook. Rome: WFP; 2000.[16] Valid International, Concern Worldwide. Community-based Therapeutic
Care (CTC): A Field Manual. Oxford: Valid International; 2006.[17] Nutriset. Plumpy’nut�. Available at: http://www.nutriset.fr/en/product-
range/produit-par-produit/plumpynut-ready-to-use-therapeutic-food-rutf.html. Accessed July 02, 2010.
[18] Diop el HI, Dossou NI, Ndour MM, Briend A, Wade S. Comparison of theefficacy of a solid ready-to-use food and a liquid, milk-based diet for therehabilitation of severely malnourished children: a randomized trial. Am JClin Nutr 2003;78:302–7.
[19] Manary MJ, Ndkeha MJ, Ashorn P, Maleta K, Briend A. Home based therapyfor severe malnutrition with ready-to-use food. Arch Dis Childhood2004;89:557–61.
[20] Sandige H, Ndekha MJ, Briend A, Ashorn P, Manary MJ. Home-basedtreatment of malnourished Malawian children with locally producedor imported ready-to-use food. J Pediatr Gastroenterol Nutr 2004;39:141–6.
[21] Bahwere P, Piwoz E, Joshua MC, Sadler K, Grobler-Tanner CH, Guerrero S,et al. Uptake of HIV testing and outcomes within a Community-basedTherapeutic Care (CTC) programme to treat severe acute malnutrition inMalawi: a descriptive study. BMC Infect Dis 2008;8:106.
[22] Fergusson P, Tomkins A. HIV prevalence and mortality among childrenundergoing treatment for severe acute malnutrition in sub-Saharan Africa:a systematic review and meta-analysis. Trans R Soc Trop Med Hyg2009;103:541–8.
[23] Dibari F, Bahwere P, Le Gall I, Guerrero S, Mwaniki D, Seal A. A qualitativeinvestigation of adherence to nutritional therapy in malnourished adultAIDS patients in Kenya. Public Health Nutr 2012;15:316–23.
[24] Oakley E, Reinking J, Sandige H, Trehan I, Kennedy G, Maleta K, et al. Aready-to-use therapeutic food containing 10% milk is less effective thanone with 25% milk in the treatment of severely malnourished children.J Nutr 2010;140:2248–52.
[25] Mills EJ, Chan AW, Wu P, Vail A, Guyatt GH, Altman DG. Design, analysis,and presentation of crossover trials. Trials 2009;10:27.
[26] Ling AM, Horwath C. Self-efficacy and consumption of fruit and vegetables:validation of a summated scale. Am J Health Promot 1999;13:290–8.
[27] FANTA. Dietary Diversity as a Household Food Security Indicator. Wash-ington DC: Fanta; 2002.
[28] Dube B, Rongsen T, Mazumder S, Taneja S, Rafiqui F, Bhandari N, et al.Comparison of ready-to-use therapeutic food with cereal legume-basedkhichri among malnourished children. Indian Pediatr 2009;46:383–8.
[29] Kirkwood B, Sterne J. Essential medical statistics. Oxford: Wiley-Blackwell;2003.
[30] Jones B, Kenward MG. Design and analysis of cross-over trials. London:Chapman and Hall; 2003.
[31] WHO. Management of severe malnutrition: a manual for physicians andother senior health workers. Geneva: WHO; 1999.
[32] Costell E, Tarrega A, Bayarri S. Food Acceptance: The Role of ConsumerPerception and Attitudes. Chemosensory Perception 2010;3:42–50.
[33] Chadwick D. Safety and efficacy of vigabatrin and carbamazepine in newlydiagnosed epilepsy: a multicentre randomised double-blind study. Lancet1999;354:13–9.
[34] Piaggio G, Elbourne DR, Altman DG, Pocock SJ, Evans SJW. Reporting ofnoninferiority and equivalence randomized trials: an extension of theCONSORT statement. JAMA 2006;295:1152–60.
[35] Dibari F, Diop EHI, Collins S, Seal A. Low-Cost, Ready-to-Use TherapeuticFoods Can Be Designed Using Locally Available Commodities with the Aidof Linear Programming. J Nutr 2012;142:955–61.
[36] University of California. World Food Dietary Assessment System. Version 2.Berkeley: University of California; 1998.
[37] Nutrisurvey. Nutrition Surveys and Calculations. Guidelines, Software andadditional Information 2007. Available at: http://www.nutrisurvey.de.Accessed October 10, 2007.
oss-over randomized trial method to determine the acceptability