design of low drag-to-power ratio hydrokinetic …
TRANSCRIPT

Marine RenewablesDesign of Low Drag-to-Power Ratio Hydro-kinetic TurbineA. Shiri, J. Hallander and B. Bergqvist
VIII International Conference on Computational Methods in Marine Engineering MARINE 2019
R. Bensow and J. Ringsberg (Eds)
DESIGN OF LOW DRAG-TO-POWER RATIO HYDROKINETIC TURBINE
MARINE 2019
ABOLFAZL SHIRI*, JAN HALLANDER* AND BJÖRN BERGQVIST†
* SSPA Sweden AB Chalmers Tvärgata 10, Göteborg, Sweden
email: [email protected], www.sspa.se
† Minesto AB Vita gavelns väg 6, Göteborg, Sweden
email: [email protected], www.minesto.com
Key words: Computational Fluid Dynamics, Tidal Turbine, Ocean Energy, Horizontal Axis Hydrokinetic Turbine, Deep Green.
Abstract. The abundant power in tidal current is a reliable source of renewable energy for electricity production in coastal areas. With Deep Green technology, Minesto has presented a cost-effective unique approach to extract energy even from low speed water currents and increase the potential of ocean energy extraction. In PowerKite project, funded by EU Horizon 2020, we designed and tested a special type of horizontal axis hydrokinetic turbine for Minesto’s tidal kite. The operational condition for this turbine is very different from stationary hydrokinetic turbines due to correlation between the kite’s maneuvering speed, turbine drag and power production. In this paper, we present the procedure of turbine blade design for reducing drag forces while producing maximum torque. We used OpenProp, a lifting line method open-source code, combined with CAESES modeler to establish the design space. To select the suitable design parameters with regard to cavitation and viscous effect, we also used RANS CFD solver OpenFOAM and improved the turbine performance. Computational studies as well as experimental test in cavitation tunnel are presented and the result is compared with a baseline turbine performance. The new design is currently being evaluated in sea-trial with a quarter-scale kite. 1 INTRODUCTION
With the advancement of renewable energy technologies in the world, the electricity production is becoming diverse and decentralized. In future, communities will prefer to exploit the local renewable resources at their disposal. Wind and solar energies, despite their low capacity factor, are gaining momentum in this “green market”. Historically hydroelectricity dominated the renewable energy production but it was limited to certain geographical area near big rivers and required excessive infrastructure investment. Hydrokinetic ocean energy would expand the global energy potential and open up a reliable local resource for coastal area.
Tidal power as an abundant and predictable form of hydrokinetic energy has traditionally suffered from high utilization cost. Laws and Epps [14] offer an in-depth comparison of different hydrokinetic energy conversion (HEC) technologies and the challenges faced by
441

Shiri A., Hallander J. and Laughlin N.
2
conventional techniques. The main problem is limited suitable sites for installation and low tidal water speed. Deep Green technology, invented and developed by Minesto, aims to address these issues by mounting the turbine on an underwater kite, which can operate in depth of up to 120 meters.
The tidal kite is capable of sweeping through low velocity tidal stream (1.2–2.4 m/s) with the speed several times higher than current due to hydrodynamic lift forces acting on the wings. The turbine is located in front of the kite and extracts kinetic energy from the motion of kite in the tidal stream. Figure 1 shows an artistic illustration of the subsea tidal kite with the turbine positioned in front of the electrical generator in the nacelle. The nacelle is connected under the buoyant wing and kite is connected by tether to the bottom joint on seabed.
Figure 1 - The Deep Green subsea tidal kite. In conventional stationary hydrokinetic turbine, the structural support counteracts the drag
forces on the turbine. In tidal kite, excessive drag caused by higher loading of turbine blades prohibits the kite to reach design speed. Since the produced power is proportional to cube of water velocity entering the turbine, a lower drag is desirable to increase the kite speed. Therefore, conventional turbine design approach was not suitable for this project.
The Powerkite project developed a new power take-off system (PTO) for Deep Green tidal kite. The overall objective of the Powerkite project was to enhance the performance of the PTO for the next generation kite and to ensure high survivability, reliability, low environmental impact and competitive cost of energy in future commercial phases. As a part of PTO system, a special type of horizontal axis hydrokinetic turbine was designed starting from scratch with the goal of minimizing the drag-to-power ratio.
For the overall concept of turbine, we chose the open-blade design since the total weight and excessive drag from a shroud had adverse effect on kite performance. Shahsavarifard et.al. [17] argues that by extending blade length we can achieve the same power enhancement as by using a shroud. Moreover, to reduce the overall weight of the kite, the turbine design was limited to open blade version (without duct).
442

Shiri A., Hallander J. and Laughlin N.
3
We started the turbine development procedure by defining the design parameters based on the operational conditions of the tidal kite in open sea. A matrix of design space was created based on these parameters using low fidelity numerical code. For further improvement, we selected a series of designs with highest drag to power coefficient ratio and desired output power of range. For those selections, we performed detailed simulations using viscous CFD solver to determine blade section properties and type of hydrofoil with highest performance without risk of cavitation inception. In the next step, the structural stiffness and the total weight of the blades were the criteria to consider for the final design.
With the selected blade geometry, series of model test were carried out in SSPA cavitation tunnel in different cavitation numbers and tip speed ratios. The model test resulted in minor improvement of the blade shape and the final new design was used to build a quarter of scale prototype for open sea test. The quarter-scale sea trial is currently underway in Minesto’s test site in Strangford Lough, UK, using a 3-meter wing prototype of tidal kite.
2 HYDRODYNAMICS OF MARINE TURBINE Many of the theoretical foundation of marine hydrokinetic turbine are similar to wind turbine
blade design [5]. Considering that water is about 800 times denser, we expect that a small size hydro-turbine produce same power as a larger wind turbine. To describe the turbine performance, we define power coefficient as non-dimension parameter:
𝐶𝐶𝑝𝑝 = 𝑃𝑃12 𝜌𝜌 𝐴𝐴 𝑉𝑉3
(1)
where P is shaft power, A is turbine’s projected area, ρ is the density of water and V is the water flow speed. Similarly, the drag coefficient (or thrust as in propellers) can be expressed as:
𝐶𝐶𝑇𝑇 = 𝑇𝑇12 𝜌𝜌 𝐴𝐴 𝑉𝑉2
(2)
where T is the drag force due to blade rotation. Maximum theoretical limit of power coefficient CP is 0.593, calculated by Betz’s law[4]. CP
is also a function of Tip Speed Ratio (TSR or λ) which is a non-dimensional rotational speed of the turbine in relation to the passing water speed. It is expressed as:
𝜆𝜆 = 𝜔𝜔 𝑅𝑅𝑉𝑉 (3)
where 𝜔𝜔 = 2𝜋𝜋. 𝑛𝑛 is rotational speed of the turbine in radians per second, n is revolution per second, R is the turbine radius and V is the passing flow speed. Power output of the turbine can also be expressed as generated torque multiplied by rotational speed:
𝑃𝑃 = 𝑄𝑄. 𝜔𝜔 (3)
Normally for turbines, CP is considered the most important parameter and the drag (thrust) force would to be handled by the support structure. The Minesto turbine however, is mounted on a flying wing and their combined performance finds a different maximum operating point, somewhere between high vehicle speed and high turbine power extraction. In horizontal axis
443

Shiri A., Hallander J. and Laughlin N.
4
turbines, higher power production is achieved through loading the blades. For such condition the thrust (drag) force is also increased which in return reduces kite speed. Hence, the ratio of CP/CT, which is a measure of the efficiency, is more important than the CP.
𝐶𝐶𝑝𝑝𝐶𝐶𝑇𝑇
= 𝑄𝑄 . 𝜔𝜔𝑇𝑇. 𝑉𝑉
(4)
Unlike wind turbine, the cavitation corrosion can occur on hydrokinetic turbine blades. The parameter to define this critical condition is cavitation number
𝐶𝐶𝑎𝑎 = 𝑝𝑝 − 𝑝𝑝𝑣𝑣12 𝜌𝜌 𝑉𝑉2
(5)
where p is local pressure, pv is the vapor pressure of the fluid. As a design criterion, we preferred to avoid excessive low-pressure region on the suction side of the blade and selected hydrofoil profiles for the blade sections that minimize cavitation inception in the normal operational condition.
3 DESIGN CRITERIA The full-scale kite is designed so that in a tidal stream with the speed between 1.2-2.4m/s, it
would maintain the water velocity into the turbine at an average of 10m/s. The blade design for turbine considered this velocity as the initial design parameter along with some other limitations dictated by kite specifications. The turbine output power is proportional to the area swept by the blades. Increase in the rotor diameter is preferable but the size is limited by cost, weight and dynamics of kite. In addition, for the same reason, we did not consider pitch control mechanism for the blades.
The turbine diameter was limited to 2m and the desired mechanical power output was 0.5MW. The rotational speed was also set to a range suitable for the electrical generator in power take-off unit. To avoid cavitation at high speed, we selected a lower range of tip speed ratio λ for the turbine compared to values usually used in wind turbine. Lower rotational speed reduces the performance of electrical generator therefore the shaft RPM would be converted to a suitable speed using a gearbox in full-scale kite.
For design-space, the emphasis is on important operational parameters to maximizing the power to drag ratio. We should also include the turbine blade specifications, such as number of blades, solidity, blade profile, chord-length profile, thickness, pitch angle, camber profile, skew and rake into the list.
In our approach, the limiting factor is a suitable range of TSR for avoiding cavitation, especially on the tip section of the blade. Considering a constant inflow speed, there are combination of turbine radius and RPM to provide the desired TSR. The range of 350 to 500 rpm is suitable for low TSR values (3 < TSR < 4) and inflow speed of 10 m/s.
Diameter
Rotational SpeedBlade Nr.
TSR
Figure 2 – Design space’s initial parameters.
444

Shiri A., Hallander J. and Laughlin N.
5
Next variable in the list of design parameters is the number of blades. For a given turbine diameter with a constant working speed, the increase in number of blades (if designed properly) increases both power (torque) and drag. Also, if the number of blades increases for a certain design, we can decrease the loading of each individual blade in favor of delaying cavitation inception. The solidity of the turbine is based on the number of blades and suggests the optimum chord-length and pitch for each blade. Therefore, it is important to have the number of blades also in the list of initial parameters for the selection procedure. The combination of these parameters gave us the design space. We performed numerical simulations for the cases in design space and selected those with the maximum CP/CT ratio. The design space produced a range of different power outputs within the selected range of acceptable TSR. Further numerical and experimental studies were carried out on the preferred designs to choose the best based on strength, weight and actual power output.
During several simulation iterations, we included different blade profiles in our investigation. Other studies on conventional hydrokinetic turbines have suggested a high lift NACA638-xx family as their choice of hydrofoils ([12],[10],[1]). This proved to be problematic as certain regions of the blade became prone to cavitation inception due to very low pressure on suction surface of blade. For most marine applications, the safe choice for the blade profile is the foil with smaller camber and less prominent low-pressure areas on suction side. Therefore, the family of NACA66a08-xx was used in this project.
4 COMPUTATIONAL MODEL Different numerical tools are available for designing turbine blades. RANS codes calculate
both pressure and viscous forces accurate but the high cost of simulation makes them suitable only for fine adjustments at the final stage of the design. Semi-empirical methods like blade element momentum (BEM) theory are used widely in turbine blade design [11]. Da Silva et.al. [9] presents a design methodology for blade optimization considering cavitation inception on blades using (BEM) theory. This method uses 2-D blade profile’s lift and drag values and calculate the chord and twist angle of sections along the radius of blade. Gue et al. [12] attempted to combine BEM with RANS code and simulate a rotor in high Tip Speed Ratio.
4.1 Lifting Line Method Lifting Line method is mainly used in propeller design but recent attempts by Kinnas [13],
Menendez [15] and Epps [8] provided different approach for using this method in turbine design. While Kinnas et al. [13] utilized lifting line code LLOPT in combination with unsteady wake alignment code MPUF-3A, Epps et al. [6] developed a “unified lifting line” method suitable for the axial flow turbines.
To evaluate the cases included in the design space, we used software “OpenProp”. OpenProp is an open-source code developed for the design and analysis of marine propellers and horizontal-axis turbines and uses Lifting Line optimization method [7]. By using this code, we calculated blade chord, twist angle and blade thickness and estimated turbine performance.
The input values given to the code are number of blades, RPM, rotor diameter, inflow speed, chord length distribution and hydrofoil type. The output of this potential flow code is the main parameters such hydrofoil chord and twist angle. In order to have a complete geometry of the blades from these basic parameters, we have to use a blade generator program that creates
445

Shiri A., Hallander J. and Laughlin N.
6
complete CAD geometry of the design. CAESES software contains a blade generator engine that seamlessly converts the main parameters into a CAD output and couples the CFD solver for optimization purpose. We used CAESES to generate the geometry for both model production and CFD simulation.
4.2 RANS Simulation To investigate the viscous force effect on the selected cases generated by OpenProp, we used
Reynolds-Averaged Navier-Stokes (RANS) solver. Different RANS codes have been used in studies of marine tidal turbines. Gharraee et al.[10] used ReFRESCO to simulate Horizontal Axis Tidal Turbines (HATT) developed by Southampton university. For our study, we used open-source solver OpenFOAM for investigating viscous effect and cavitation inception on the blades. We performed simulations using k-ω SST turbulence model with steady-state solver. Even though the steady state solver does not simulate the full rotational effect of the turbine, it is accurate for calculating the force and momentum on the blades. To simulate the effect of rotating blades, we chose the Single Rotating Reference Frame (SRF) method, which converts the rotational momentum to a body force and applies the effect to the entire domain. Since the simulation does not include the stationary part of the turbine, SRF offers an accurate measure of the flow. The reason for excluding the stationary sections of the turbine and nacelle was to narrow down the focus of the simulation result to the blade design and minimize the complexity of the blade-nacelle interaction.
The cylindrical domain of simulation had a size of 4D in length and 6D in diameter where D is the turbine diameter. All the geometries were created using CAESES blade generator and unstructured meshes were generated by snappyHexMesh tool. 3D meshes contained hexahedra and split-hexahedra from triangulated surface geometries. The hexahedral mesh snaps on the curved surfaces and at the final stage a prism layer is added between the mesh and solid surfaces to resolve the mesh size to the suitable y+ < 5. The total number of cells for the model-scale simulation was approximately 8.6 million. Figure 3 presents the mesh created for this study.
Figure 3 - SRF mesh created by snappyHexMesh. Four series of simulations were performed for different scales of the turbine. These scales
were model scale, used in cavitation tunnel test, design scale, quarter scale for using in
446
Shiri A., Hallander J. and Laughlin N.
7
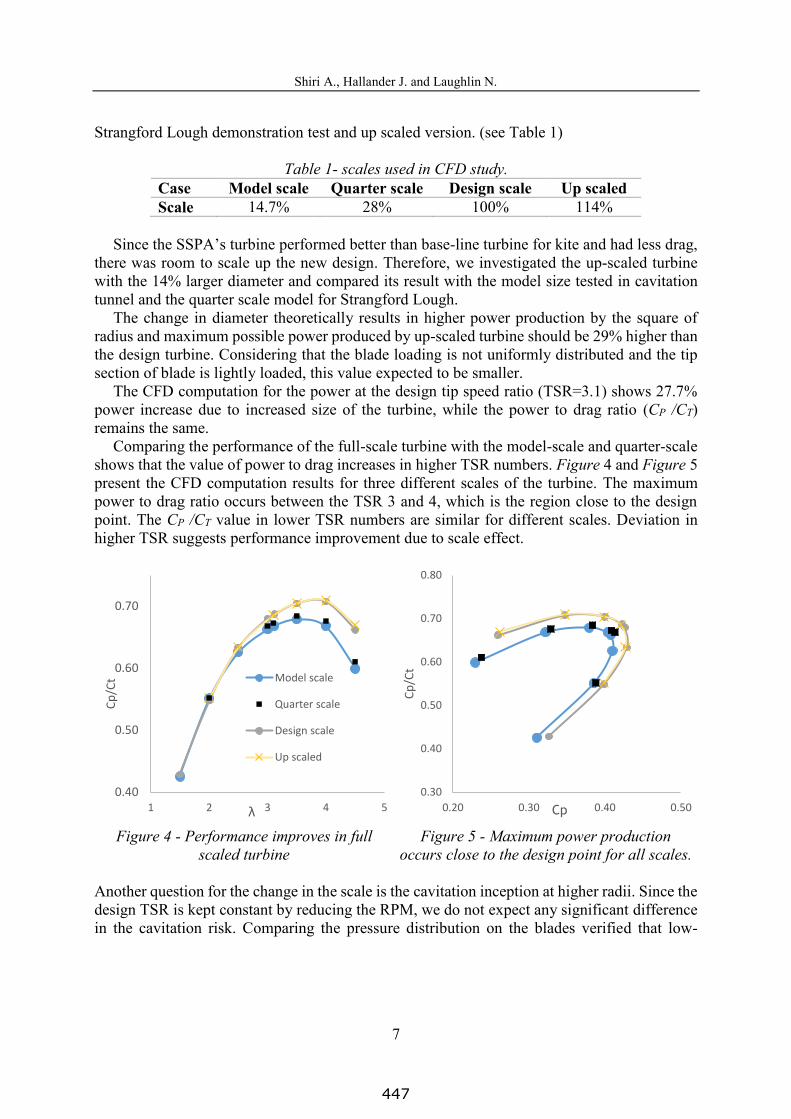
Strangford Lough demonstration test and up scaled version. (see Table 1)
Table 1- scales used in CFD study. Case Model scale Quarter scale Design scale Up scaled Scale 14.7% 28% 100% 114%
Since the SSPA’s turbine performed better than base-line turbine for kite and had less drag,
there was room to scale up the new design. Therefore, we investigated the up-scaled turbine with the 14% larger diameter and compared its result with the model size tested in cavitation tunnel and the quarter scale model for Strangford Lough.
The change in diameter theoretically results in higher power production by the square of radius and maximum possible power produced by up-scaled turbine should be 29% higher than the design turbine. Considering that the blade loading is not uniformly distributed and the tip section of blade is lightly loaded, this value expected to be smaller.
The CFD computation for the power at the design tip speed ratio (TSR=3.1) shows 27.7% power increase due to increased size of the turbine, while the power to drag ratio (CP /CT) remains the same.
Comparing the performance of the full-scale turbine with the model-scale and quarter-scale shows that the value of power to drag increases in higher TSR numbers. Figure 4 and Figure 5 present the CFD computation results for three different scales of the turbine. The maximum power to drag ratio occurs between the TSR 3 and 4, which is the region close to the design point. The CP /CT value in lower TSR numbers are similar for different scales. Deviation in higher TSR suggests performance improvement due to scale effect.
Figure 4 - Performance improves in full
scaled turbine
Figure 5 - Maximum power production
occurs close to the design point for all scales.
Another question for the change in the scale is the cavitation inception at higher radii. Since the design TSR is kept constant by reducing the RPM, we do not expect any significant difference in the cavitation risk. Comparing the pressure distribution on the blades verified that low-
0.40
0.50
0.60
0.70
1 2 3 4 5
Cp/C
t
λ
Model scale
Quarter scale
Design scale
Up scaled
0.30
0.40
0.50
0.60
0.70
0.80
0.20 0.30 0.40 0.50
Cp/C
t
Cp
447

Shiri A., Hallander J. and Laughlin N.
8
pressure area is not much different; therefore, we do not expect the cavitation inception to differ in the up-scaled model.
To have a better understanding of the turbine performance in real operational condition, we simulated the quarter scale turbine with the inflow angle of 5 and 10 degree. The turbine was operating at design point (Tip Speed Ratio = 3.1) and the free-stream flow speed was constant. Figure 6 – Free-stream flow enters the turbine at 10 degree angle.Figure 6 illustrates the free stream flow entering turbine at 10 degree angle.
Figure 6 – Free-stream flow enters the turbine
at 10 degree angle.
Figure 7- Structured mesh created by
ICEM-CFD and used in simulation using ANSYS-FLUENT.
The result showed between 1% to 6% power reductions when the inflow was inclined 5
and 10 degree respectively. To study the mesh and solver dependency of simulations, the simulation was repeated at the design point (TSR = 3.1) using ANSYS-FLUENT solver using structured mesh created by ICEM-CFD. The original mesh was an unstructured cut-cell mesh created by SnappyHexMesh (Figure 3) and had approximately 8.6 million cells including prism layer. The new mesh (Figure 7) was a structured hexahedral mesh created by ICEM-CFD and y+ < 3. Total number of cells for this mesh was 13 million and power production in two simulations differs only by 0.5%.
5 EXPERIMENTAL TEST Most of the available experimental studies on marine turbines are performed on the models
suitable for low water velocity and high tip speed ratio. Model test in towing tank and cavitation tunnel by Bahaj [2][3] and Batten [1] are examples of horizontal hydrokinetic turbine developed for these conditions with the design approach similar to wind turbine.
We carried out two rounds of model scale test in the SSPA cavitation tunnel with the turbines developed by SSPA. After first round of test, the initial design was improved by fine adjustment of blade thickness, pitch angle and blade’s tip profile. The results discussed in this paper is for the final design after improvement. During test, turbine performance in terms of thrust, power, efficiency and cavitation were investigated.
448

Shiri A., Hallander J. and Laughlin N.
9
5.1 Test Facilities At the cavitation test, the turbine was mounted on a Kempf & Remmers H33 Open Water
dynamometer in cavitation tunnel test section #1 (cross section diameter 1 m, see Figure 8). As shown in Figure 9, the turbine was mounted upstream of dynamometer, and equipped with a hubcaps. Fairings were mounted between the turbine hub and the dynamometer.
Figure 8 - The SSPA cavitation tunnel. Measurement section #1 to the right.
Figure 9 - Cavitation observation in SSPA
testing facility.
5.2 Model Turbine, Test Arrangement and Test Results
Before test, the blades were painted with a special paint to obtain a certain roughness on the blade surfaces for cavitation stimulation. The radii 0.6R, 0.7R, 0.8R, 0.9R and generator line were marked on all blades. The cavitation number is based on the static pressure at the shaft centerline. The static pressure in the cavitation tunnel is adjusted to achieve the preferred cavitation number at the given flow speed.
Turbine force measurement at the atmospheric condition was performed in order to determine the effective velocity of advance. Further measurements carried out at different cavitation numbers to determine the effect of cavitation thrust breakdown. In the turbine force measurements, the shaft rate varied to cover the loading range of interest. Measurement points are taken at both decreasing and increasing shaft speed in order to check for hysteresis effects.
The turbine design surpassed the expected efficiency by 17 to 23 % and sufficient cavitation performance compared to the baseline for kite operation and fulfilled the design goal of CP/CT ≥ 0.6 at a Tip Speed Ratio of λ = 3. The cavitation on the turbine blade was studied at different loading conditions and the extension and character of the cavitation at different blade positions were documented by video recording. All observations are made with the turbine illuminated by stroboscope synchronized to the shaft rate frequency. During an incipient cavitation test the shaft rate and thus the tip speed ratio is varied at several constant static pressure levels until the different types of cavitation could be observed.
449

Shiri A., Hallander J. and Laughlin N.
10
Figure 10 - Power coefficient of model test
for different cavitation number
Figure 11 - Power coefficient comparison between CFD simulation and model test.
Figure 12 - Power to drag ratio
comparison between CFD and model test.
Figure 13 – Thrust (drag) coefficient
comparison between CFD and model test. Figure 10 presents the test result for different cavitation numbers σ. For cavitation numbers
higher than 3, power coefficients in different TSR are similar. Since we did not simulate the turbine performance with the cavitation model, the comparison between test result and CFD are with the cases that cavitation does not contribute in power loss. The turbine was designed to operate at TSR = 3.1 but tests were performed also in off-design conditions between TSR = 1 to 6.
Figure 11 shows power coefficients in different tip speed ratios and Figure 13 compares turbine thrust (drag) coefficient with the CFD result. CFD simulation over-predicts the power but is more accurate in predicting thrust. CFD simulation seems to predict both power and thrust trends correctly. The higher torque predicted in CFD simulation might be due to deficiency of
0
0.1
0.2
0.3
0.4
1 2 3 4 5
C P
6.6 5.6 3.9
2.9 2.2 1.7
(-)
0
0.1
0.2
0.3
0.4
0.5
1 2 3 4 5 6
C P
Model test
CFD model scale
0
0.1
0.2
0.3
0.4
0.5
0.6
0.7
0.8
1 3 5
C P/C
T
Model test
CFD model scale
0
0.1
0.2
0.3
0.4
0.5
0.6
0.7
0.8
0.9
1 2 3 4 5 6
C T
Model testCFD model scale
450

Shiri A., Hallander J. and Laughlin N.
11
the simulation as the results were not corrected for blockage effect in the test section. The performance of the turbine in Figure 12 is plotted as ratio of power to drag coefficient vs. different TSR.
The cavitation tests showed that the design point (σ=3.14, σ=5.8) was located inside the cavitation bucket, thus there is no cavitation at this point. If the cavitation number or TSR decreases, tip vortex cavitation (TVC) will occur first and then suction side sheet cavitation (SS SC). There is a large margin against pressure side cavitation and bubble cavitation. There are no signs of erosive cavitation. In summary, the new turbine design has very good performance from cavitation point of view.
6 SUMMARY AND CONCLUSION We presented the design process and CFD simulations of a new turbine designed for
Powerkite project. At kite speed of 10 m/s and TSR≈3, estimated power produced by the full-scale turbine reached the expected value of 0.5 MW. We also investigated the possibility of scaling up the turbine size by 14%.
The Powerkite turbine had a maximum CP/CT > 0.6 at design TSR, which satisfies the operational condition of the kite. Cavitation tunnel tests were performed using model scale of the turbine and results were used to further improve the performance. Test results were also compared with CFD simulation. Power coefficient was over-predicted in CFD computation by less than 10% and thrust coefficient was very similar to test result.
The full-scale turbine with the larger diameter and quarter of scale model were simulated using CFD software. The result showed an improvement in the performance of the larger scale turbine because of the Reynolds scaling. The power to drag ratio for full-scale turbine did not change in lower TSR value but increased in larger TSR which is very good overall performance of the scaled-up turbine. The simulation did not show any sign of cavitation risk on the full-scale and quarter-scale turbine blade.
The simulation for the inclined inflow presented less than 6% power production decrease while the kite manoeuvres in its track (10 degrees drift angle). We also investigated the mesh and solver dependency of CFD simulations and results were similar with difference of less than 1%.
ACKNOWLEDGEMENTS This project has received funding from the European Union’s Horizon 2020 research and innovation programme under grant agreement number 654438. The authors also would like to thank the Region of Västra Götaland for their support.
451

Shiri A., Hallander J. and Laughlin N.
12
REFERENCES [1] Batten W.M.J., Bahaj A.S., Molland A.F. and Chaplin J.R. Hydrodynamics of marine
current turbines. Journal of Renewable Energy, vol. 31, no. 2 (2006) pp249-256 [2] Bahaj A.S., Batten W.M.J. and McCann G. Experimental verifications of numerical
predictions for the hydrodynamic performance of horizontal axis marine current turbines. Journal of Renewable Energy, vol. 32, no. 15 (2007) pp2479-2490
[3] Bahaj A.S., Molland A.F., Chaplin J.R. and Batten W.M.J. Power and thrust measurements of marine current turbines under various hydrodynamic flow conditions in a cavitation tunnel and a towing tank. Journal of Renewable Energy, vol. 32, no. 3 (2007) pp407-426
[4] Carlton J.S., Marine Propellers and Propulsion, Third Edition, Elsevier. [5] Chica E., Perez F., Rubio-Clemente A. and Agudelo S. Design of a hydrokinetic turbine.
Energy and Sustainability VI. WIT Press (2015), pp.137-147 [6] Epps B.P. On the rotor lifting line wake model. Journal of Ship Production and Design
(2016) vol. 32, no. 3, pp.1-15. [7] Epps B.P. and Kimball R.W. OpenProp v3: Open-source software for the design and
analysis of marine propellers and horizontal-axis turbines. (2013) URL: http://engineering.dartmouth.edu/epps/openprop
[8] Epps B.P. and Kimball R.W. Unified Rotor Lifting Line Theory. Journal of Ship Research, (2013) vol. 57, no. 4, pp. 1-21.
[9] Freitas da Silva P.A.S., Shinomiya L.D., Felamingo de Oliveira T., Vaz J.R.P., Amarante Mesquita A.L. and Pinho Brasil A.C. Design of Hydrokinetic Turbine Blades Considering Cavitation. Journal of Energy Procedia (2015), vol.75, pp.277-282.
[10] Gharraee, B., Eskilsson, C., Bensow, R. and Vaz, G. Numerical Simulation of Cavitation on a Horizontal Axis Tidal Turbine. ISOPE 26th International Ocean and Polar Engineering Conference, Rhodes, Greece. June (2016)
[11] Goundar J.N. and Ahmed M.R. Design of Horizontal Axis Tidal Current Turbine. Journal of Applied Energy, (2013) vol.111, pp.161-174.
[12] Guo Q., Zhou L. and Wang Z. Comparison of BEM-CFD and full rotor geometry simulations for the performance and flow field of a marine current turbine. Journal of Renewable Energy (2015), vol.75, pp.640-648.
[13] Kinnas A.S., Xu Wei, Yu Yi-Hsiang and He Lei. Computational Methods for the Design and Prediction of Performance of Tidal Turbines. Journal of Offshore Mechanics and Arctic Engineering. (2012) vol.134, 011101.
[14] Laws N.D. and Epps B.P. Hydrokinetic energy conversion: Technology, research, and outlook. Journal of Renewable and Sustainable Energy Reviews (2016), vol.57, pp1245-1259.
[15] Menéndez Arán D.H. and Kinnas S.A. Hydrodynamic optimization of marine current turbines. Proceedings of the 17th Offshore Symposium- SNAME (2012) Texas D15-D21.
[16] Schubel P.J. and Crossley R.J. Wind Turbine Blade Design. Energies (2012). ISSN 1996-1073, vol.5, pp 3425-3449.
[17] Shahsavarifard M., Louis Bibeau, E.L. and Vijay C. Effect of shroud on the performance of horizontal axis hydrokinetic turbines. Journal of Ocean Engineering (2015) vol.96, pp215-225.
452