design of medical radiometer front-end for … · of the dicke switch to reduce system noise...
TRANSCRIPT

Progress In Electromagnetics Research B, Vol. 27, 289–306, 2011
DESIGN OF MEDICAL RADIOMETER FRONT-ENDFOR IMPROVED PERFORMANCE
Ø. Klemetsen, Y. Birkelund, and S. K. Jacobsen
Department of Physics and TechnologyUniversity of Tromsø, NO-9037 Tromsø, Norway
P. F. Maccarini and P. R. Stauffer
Duke University Medical Center2301 Erwin Road, Durham, NC 27710, USA
Abstract—We have investigated the possibility of building asingleband Dicke radiometer that is inexpensive, small-sized, stable,highly sensitive, and which consists of readily available microwavecomponents. The selected frequency band is at 3.25–3.75 GHz whichprovides a reasonable compromise between spatial resolution (antennasize) and sensing depth for radiometry applications in lossy tissue.Foreseen applications of the instrument are non-invasive temperaturemonitoring for breast cancer detection and temperature monitoringduring heating. We have found off-the-shelf microwave componentsthat are sufficiently small (< 5mm×5mm) and which offer satisfactoryoverall sensitivity. Two different Dicke radiometers have been realized:one is a conventional design with the Dicke switch at the front-end toselect either the antenna or noise reference channels for amplification.The second design places a matched pair of low noise amplifiers in frontof the Dicke switch to reduce system noise figure.
Numerical simulations were performed to test the design conceptsbefore building prototype PCB front-end layouts of the radiometer.Both designs provide an overall power gain of approximately 50 dBover a 500 MHz bandwidth centered at 3.5 GHz. No stability problemswere observed despite using triple-cascaded amplifier configurations toboost the thermal signals. The prototypes were tested for sensitivityafter calibration in two different water baths. Experiments showedsuperior sensitivity (36% higher) when implementing the low noiseamplifier before the Dicke switch (close to the antenna) compared to the
Received 12 October 2010, Accepted 6 December 2010, Scheduled 15 December 2010Corresponding author: Øystein Klemetsen ([email protected]).

290 Klemetsen et al.
other design with the Dicke switch in front. Radiometer performancewas also tested in a multilayered phantom during alternating heatingand radiometric reading. Empirical tests showed that for theconfiguration with Dicke switch first, the switch had to be lockedin the reference position during application of microwave heating toavoid damage to the active components (amplifiers and power meter).For the configuration with a low noise amplifier up front, damagewould occur to the active components of the radiometer if used inpresence of the microwave heating antenna. Nevertheless, this designshowed significantly improved sensitivity of measured temperaturesand merits further investigation to determine methods of protectingthe radiometer for amplifier first front ends.
1. INTRODUCTION
It is well known that microwave radiometry can be used for noninvasivetemperature measurements of superficial tissue in the human body. Asopposed to other active methods that stimulate the body with somekind of excitation signal, radiometry is passive and thus completelyharmless. Over the past four decades, research within the fieldof microwave radiometry has been conducted for use in medicalapplications [1]. Modalities under investigation include detection ofbreast cancer [2], thermal monitoring of hyperthermia, and detectionof inflammation [3]. In medical treatment involving microwave heatingof the body, there is a need for temperature observation of theheated tissue. While conventional microwave-immune probes (e.g.,fiberoptics) may be placed on the skin surface and/or implantedinto tissue through catheters to monitor temperature, an accurateand convenient method for non-invasive temperature monitoring ispreferred.
Russian scientists have developed a radiometer for the detectionof breast cancer which is manufactured under the name of RTM-01†. The technical details of this radiometer are not known, and aretherefore difficult to evaluate. However, the detection procedure is tomake corresponding point measurements of both breasts and assessasymmetries in measured brightness temperatures.
Vesicoureteral reflux (VUR) is an abnormal movement of urinefrom the bladder into the ureters and kidneys, and is a significanthealth problem. Younger children are more prone to VUR because ofthe relative shortness of the submucosal ureters. This susceptibilitydecreases with age as the length of the ureters increases. In childrenunder the age of 1 year with a urinary tract infection, more than† http://www.resltd.ru/eng/rtm/.

Progress In Electromagnetics Research B, Vol. 27, 2011 291
the half will suffer from VUR‡. Current methods of imaging refluxrely on X-ray fluoroscopy of the kidneys after injection of radioactivecontrast agent into the bladder via Foley catheter. X-ray exposureand use of invasive catheters are preferably avoided in children. Analternative procedure has been proposed in which the reflux of urinecan be detected by warming the bladder with microwave radiationto a fever temperature and measuring kidney temperatures witha microwave radiometer to detect temperature rise in the kidneyafter reflux [4]. In addition to monitoring the kidneys for reflux, amicrowave radiometer could also be used to passively monitor bladdertemperature during microwave heating. This study investigatesthe construction of a miniature radiometer to read volume-averagedtemperature of superficial tissue.
Microwave radiometers can be assembled in different ways. Thetwo most common variants are total power radiometer and Dickeradiometer [5]. A total power radiometer consists of a medium gainlow noise amplifier (LNA), followed by a booster amplifier and a powermeter or a square law detector as well as an integrator. This radiometeris very sensitive to amplifier drift. A Dicke radiometer uses a switch infront of the LNA to select between the sensing antenna and a knownnoise reference, as shown in Fig. 1. When switching faster than thegain variations, these unwanted drift effects are mostly canceled out [6].
BoosterBP
~~~
LNA
Dicke switch
1
2
Antenna
Noise Reference
Detector LFADC
Front-end
Power- meter
PC
Output
Figure 1. Block diagram of Dicke radiometer.
The goal of the present design is to determine whether it is possibleto create an inexpensive and small sized front stage of a radiometerusing available commercial surface mount device (SMD) componentswhile meeting the design requirements of useful medical radiometry.Pertinent design requirements are stability against oscillations andadequate sensitivity for radiometric detection of 3−−5C temperaturerise at a depth of at least 30 mm in tissue. It has previously beenshown that active antennas with LNA before the Dicke switch improvethe overall thermal sensitivity of the radiometer [7]. Presently, we‡ http://kidney.niddk.nih.gov/statistics/uda/.

292 Klemetsen et al.
investigate a generalization of this concept by implementing LNAsbefore the Dicke switch for both the antenna input and the referencesignal. In this way we get a more balanced Dicke radiometer withfurther improvement in accuracy of observed brightness temperature.
2. THEORETICAL BACKGROUND
A microwave radiometer is an instrument that can measuretemperatures inside the human body. The measuring principle is toquantify the thermally emitted power over a given frequency band.Blackbody spectral radiance at temperature T is for all frequenciesgiven by Planck’s radiation law. Planck’s law can be approximated byRayleigh-Jean’s law in the microwave band, and from which the noisepower P over a frequency band ∆f can be written [6]:
P = kT∆f, (1)
where k is Boltzmann’s constant.Relating this principle to practical multi-stage radiometric
systems, the theoretical noise temperature Te of a cascaded systemis given by:
Te = Te1 +Te2
G1+
Te3
G1G2+ . . . +
TeN
G1G2 . . . GN−1(2)
where Te,i, Gi are the noise temperature and gain of the individualstages, respectively. From Eq. (2) the noise performance ofthe first stage is critical. This inherent property is oftenutilized in measurement systems through implementation of low-noisepreamplifiers close to the sensor element. The theoretical sensitivityof an ideal total-power radiometer with no gain fluctuations is [6]:
∆T =Ta + Te√
∆fτ, (3)
where ∆T is the minimum detectable change in the radiometricantenna temperature Ta and τ is the integration time in the low passfilter (integrator). For a Dicke radiometer (Fig. 1), the theoreticalsensitivity is given by:
∆Tmin =2(Ta + Te)√
∆fτ. (4)
Since the integration time τ has to be divided between the referenceand the antenna, the Dicke radiometer provides a degradation of ∆T(factor 2) compared to the total power radiometer.
A conventional digital Dicke radiometer front-end consists of anantenna, a noise reference, a Dicke switch, a low noise amplifier, a

Progress In Electromagnetics Research B, Vol. 27, 2011 293
bandpass filter (BP), and a booster amplifier. Other parts are a squarelaw detector, a low frequency (LF) amplifier, an analog to digitalconverter (ADC) and a controller PC. Alternatively, a power metercan be connected to the front-end. With the Dicke switch attachedpermanently to the antenna, the radiometer can be reconfigured to atotal power radiometer.
A stable amplifier cascade configuration is important in order toavoid internal oscillations that might interfere with the extremely lowradiated power received by the antenna. The stability of a system canbe evaluated using the Edward-Sinsky stability factor defined as [8]:
µ =1− |S11|2
|S22 − S∗11 ·∆|+ |S12 · S21| > 1 (5)
where Sij and ∆ are elements and the determinant of the systemparameter matrix S, respectively. The system is unconditionally stableif µ > 1.
While the commonly used standard deviation provides a measureof overall signal variations, it does not distinguish random noise fromother typical signal drift types. On the other hand, the Allan deviationmethod has potential to differentiate between white noise, flicker noise(1/f-noise), random-walk drift as well as systematic long term signaldrift [9]. Land et al. [10] used the Allan deviation to analyze the signalbehavior of two different types of microwave radiometers.
The Allan deviation seeks to quantify temporal measurementvariations within a time series and is defined as [11]:
σT (τ) =
√〈(T k+1 − T k)2〉
2(6)
where T k = (1/τ)∫ tk+τtk
T (t)dt and tk+1 = tk + τ for k = 0, 1, . . . , τ .Different spectral noise components appear with separate spectral
density power laws in a log-log plot of the Allan deviation versus thesampling period τ . Hence, different types of noise can be distinguisedby the slope of the plot in various time regions. For microwaveradiometry, pertinent types of signal variations are [10]: i) Gaussiannoise (slope of −0.5), ii) Flicker (1/f-) noise (slope of 0), iii) Random-walk noise (slope of 0.5), and iv) long term steady drift (slope of 1).
3. RADIOMETER DESIGN
Equation (1) shows that the noise power P depends primarily on thetemperature T and bandwidth ∆f . For human body temperatures,and for a practical bandwidth of say 500 MHz, the noise power over

294 Klemetsen et al.
that bandwidth is very low (−86.7 dBm). To detect this low power,it is crucial to have a sensitive instrument like a radiometer. Fromprevious work [7], we have found that the frequency band around3.5GHz is a quiet band less disturbed by EMI compared to other low-GHz frequency communication bands. This frequency range providessmaller penetration depth in the human body compared to lowerfrequencies. However, the band has been shown as an adequate choicefor detecting superficial breast cancer [12].
One challenge in the design phase is to find an LNA balancingthe trade offs between lowest possible noise, highest possible gain, lowpower consumption and low cost. Several LNAs were considered withthe best option from Hittite Microwave Corporation§. In order toisolate the front-end from other competing signal sources, we useda bandpass filter which is a combination of low pass (LP) and highpass (HP) filters from Mini-Circuits‖. The configuration gave anappropriate 500 MHz bandwidth. The steep slopes of the frequencycutoff at the edges of the pass band filter were enhanced by the useof two pairs of consecutive filters of the same type. Another designchallenge was to identify a Dicke switch with lowest possible insertionloss, high isolation, 3.25–3.75GHz bandwidth, small sized, and withsingle supply voltage. Our choice was a switch from Mini-Circuits¶.The switch requires a DC block capacitor of 47 pF before and after.Presently a capacitor from Murata Manufacturing Co., Ltd+ was used.
Table 1. Specifications of SMD components.
Device Name G [dB] NF [dB] Te [K] f [GHz]
LNA HMC593LP3E 19 1.2 92.3 3.3–3.8
BP (LP part) LFCN-3400+ −1.03 1.03 77.6 0–3.4
BP (HP-part) HFCN-3100+ −1.01 1.01 75.9 3.4–9.9
Dicke switch CSWA2-63DR+ −1.2 1.2 92.3 0.5–6
Capacitor GQM1885C1H470JB01 −0.014 0.014 0.94 3.5
A single LNA does not provide enough gain to get the power intothe required range for any power detector. Based on the componentspecifications listed in Table 1 for the LNA, filters and switch, wefound that a configuration of three cascaded LNAs (3×19 dB) and fourfilters (4×−1 dB insertion loss) should give a suitable amplification inthe selected frequency range. The bandpass filters give a theoreticalbandwidth of ∆f = 500 MHz.§ http://www.hittite.com/.‖ http://www.minicircuits.com/.¶ http://www.minicircuits.com/.+ http://www.murata.com/.
Progress In Electromagnetics Research B, Vol. 27, 2011 295
3.1. Design Options
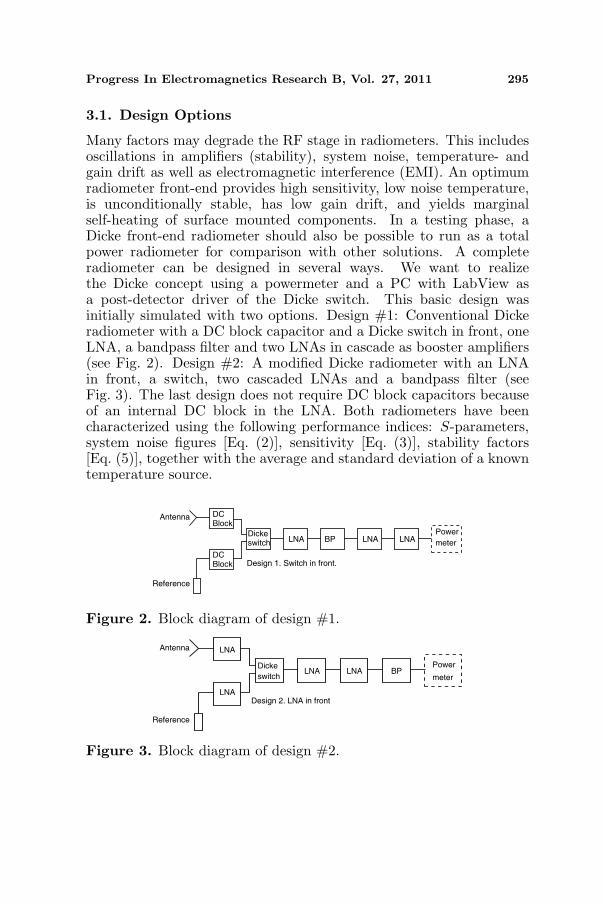
Many factors may degrade the RF stage in radiometers. This includesoscillations in amplifiers (stability), system noise, temperature- andgain drift as well as electromagnetic interference (EMI). An optimumradiometer front-end provides high sensitivity, low noise temperature,is unconditionally stable, has low gain drift, and yields marginalself-heating of surface mounted components. In a testing phase, aDicke front-end radiometer should also be possible to run as a totalpower radiometer for comparison with other solutions. A completeradiometer can be designed in several ways. We want to realizethe Dicke concept using a powermeter and a PC with LabView asa post-detector driver of the Dicke switch. This basic design wasinitially simulated with two options. Design #1: Conventional Dickeradiometer with a DC block capacitor and a Dicke switch in front, oneLNA, a bandpass filter and two LNAs in cascade as booster amplifiers(see Fig. 2). Design #2: A modified Dicke radiometer with an LNAin front, a switch, two cascaded LNAs and a bandpass filter (seeFig. 3). The last design does not require DC block capacitors becauseof an internal DC block in the LNA. Both radiometers have beencharacterized using the following performance indices: S-parameters,system noise figures [Eq. (2)], sensitivity [Eq. (3)], stability factors[Eq. (5)], together with the average and standard deviation of a knowntemperature source.
PowerLNA
Dickeswitch BP LNA LNA
DC
DC
Block
Block
Antenna
Reference
Design 1. Switch in front.
meter
Figure 2. Block diagram of design #1.
Design 2. LNA in front
LNA
LNA
LNA LNADicke
switchBP
Antenna
Reference
Power
meter
Figure 3. Block diagram of design #2.

296 Klemetsen et al.
Table 2. Performance indices of radiometric designs. Integration time:τ = 2.0 s for theoretical sensitivity. τ = 2.77 s for measured sensitivity.
Parameter design #1 design #2
Theoretical system
noise temperatureTe 217.2K 95.1K
Simulated noise power
from S-parametersPs −34.25 dBm −34.01 dBm
From measured
S-parametersPsm −35.26 dBm −33.40 dBm
Measured noise
powerPm −33.50 dBm −32.80 dBm
Theoretical sensitivity,
total power radiometer∆T 0.016K 0.012K
Theoretical sensitivity,
Dicke radiometer∆Tmin 0.032K 0.024K
Measured sensitivity,
total power radiometer∆T 0.064K 0.046K
Measured sensitivity,
Dicke radiometer∆T 0.098K 0.062K
4. RESULTS
4.1. Simulations
In the simulations based on CST Design Studio∗, S-parameters weregiven by touchstone files from the component manufacturer’s websites. Numerical simulations were performed by importing individualtouchstone files for every single block in the design, and generatingthe overall S-parameters of the circuit in the frequency range from1 to 6 GHz. Te for each design was derived from the theoreticalnoise temperature of a cascaded system given by Eq. (2) combinedwith parameters in Table 1. The expected output power from thesystem when using an antenna temperature Ta = 290 K was determinedby integrating over frequencies in the simulated system |S21|2 andmultiplying by k(Ta + Te), given by Eq. (1). The simulated power indBW is thus: Ps = 10 log[
∑ |S21|2k(Ta + Te)]. The theoretical noisetemperatures using Eq. (2), expected output power, and sensitivityusing Eqs. (3) and (4) are listed in Table 2.∗ http://www.cst.com.

Progress In Electromagnetics Research B, Vol. 27, 2011 297
Figure 4. Picture of PCB design with LNA in front.
4.2. Prototype Testing
The prototype design was realized with a printed circuit board (PCB)RO4350B, (Rogers Corp., USA)] of 0.254 mm thickness and a copperlayer of 35 microns (see Fig. 4) for the design with the LNA in front.The system was tested by an Agilent E5071C network analyzer andan Agilent E4419B power meter containing an E4412A sensor. TheDicke switch is controlled by a USB-3114 device from MeasurementComputing, USA††. The measurements were undertaken with thefront-end blocks as shown in Fig. 1 and shown in detail in Figs. 2and 3. Experimental values were generated for touchstone files from thenetwork analyzer and thereafter the stability factor µ and the expectedoutput power Psm were calculated.
Time-series measurements were conducted with a 50Ω load as athermal source of temperature Ta = 290 K. The system performancewas monitored over time by logging power Pm together with othersystem parameters. The results are listed in Table 2. The simulatedand measured forward transmission S21 and stability factor µ aredepicted in Fig. 5 for the two designs. The input reflection coefficientS11 and output reflection coefficient S22 are shown in Fig. 6.
Sensitivity of the radiometer design was found by calibrating theradiometers with two different and known temperatures, Th, Tc, in awater bath. The calibration parameter s = Ph−Pc
Th−Tcis the slope of the
output power Ph and Pc as a function of temperatures Th and Tc.The sensitivity could then be determined from ∆T = σPo
s . σPo isthe measured standard deviation to the measured output power Po.Numerical values are given in Table 2. The Dicke concept was also] http://www.rogerscorp.com/.†† http://www.mccdaq.com.

298 Klemetsen et al.
(c)
(b)
(d)
(a)
f [GHz] f [GHz]
f [GHz] f [GHz]
S21
[dB
]S
21
[dB
]
50
0
-50
-100
50
0
-50
-100
10
8
6
4
2
01 2 3 4 5 6
1 2 3 4 5 6
10
8
6
4
2
0
µ (
f)µ
(f)
2 4 6
2 4 6
Figure 5. S21 and µ for design #1, (upper panels) and design #2(lower panels). Solid line: Simulated values. Dotted line: Measuredvalues. (a) Design #1, S21. (b) Design #1, µ. (c) Design #2, S21.(d) Design #2, µ.
tested for gain variations caused by temperature changes of the chassisusing a Peltier element for heating and by changing the supply voltage(see Fig. 7).
Finally, the noise statistics were analyzed for the radiometer usingthe Allan deviation defined in Eq. (6). Fig. 8 depicts a typical timeseries of more than two hours of radiometric data. From visualinspection we observe in Fig. 8(a) a slow decrease of average powervalue over time. The corresponding Allan deviation estimate is shownin Fig. 8(b) and further discussed in the next section.
4.3. Experimental Testing of Radiometer Performance
The radiometers were further tested with a fully automated systemfor interspersed heating and radiometric reading on a layered solidphantom (see Fig. 9). The stacked phantom consisted of a 5mmfat layer on top, a 28 mm muscle phantom in the middle and a

Progress In Electromagnetics Research B, Vol. 27, 2011 299
(c)
(a)
f [GHz] f [GHz]
f [GHz] f [GHz]
(d)
(b)
S [dB
]11
S [dB
]11
S [dB
]22
S [dB
]22
1 2 3 4 5 6 1 2 3 4 5 6
1 2 3 4 5 61 2 3 4 5 6
0
-10
-20
-30
0
-10
-20
-30
0
-10
-20
-30
10
0
-10
-20
-30
10
Figure 6. S11 and S22. Solid line: Simulated values. Dotted line:Measured values. (a) Design #1, S11. (b) Design #1, S22. (c) Design#2, S11. (d) Design #2, S22.
(a) (b)
50
40
30
20
10
0
0 500 1000 1500 2000 2500 3000
T (
t) [
C
]o
t [s]
50
40
30
20
10T (
t) [
C
]o
0 500 1000 1500 2000 2500 3000t [s]
0
Figure 7. Stability analysis of Dicke concept for design #2 with anintegration time τ = 3.1 s. (a) The first part between 0 to 2300 s is thechassis temperature change with a Peltier element of the radiometer.The last part between 2300 to 3100 s is a power supply change of+/− 2%. (b) The calibrated Dicke difference output.

300 Klemetsen et al.
0 2000 4000 6000 8000 -2
-1.5
-1
-0.5
0
0.5
1
1.5
MEASUREMENT TIME [sec]
BR
IGH
TN
ES
S T
EM
P [
o C]
10-2
100
102
104
10-2
10-1
100
Allan Deviation
τ [sec]
(a) (b)
0 [ C
]o
Figure 8. Signal noise and drift variations analyzed by the Allandeviation. Slopes of solid lines in b) are −0.5 and 1.0. (a) Low driftradiometric data. 454 Hz sampling rate and post-processing integrationtime of 0.1 secs. (b) Allan deviation vs integration time.
Luxtron sensor 1
Pump
Temperature
controlled
water
Water bolus
Muscle phantom
Fat layer
Shielded radiometer antenna
Fat layer
DCC antenna
MeterPower-
PC
Heating control
Radiometer3.5 GHz
Dicke switch control
Heating amplifier915 MHz
Optional front switch
Reference
Luxtron sensor 3
Luxtron sensor 2
Figure 9. Experimental microwave heat and radiometric reading.
5mm fatlayer at the bottom. Heating was done with a single DualConcentric Conductor (DCC) antenna [13, 14] at 915 MHz through abolus of circulating water. The input power to the top antenna wasapproximately 20 W at 915 MHz. Radiometric readings (see Fig. 10)with design #1 were obtained on the bottom surface with a shielded [4]elliptical antenna [15]. The temperature within the muscle phantomwas also monitored with Luxtron (LumaSense Technologies) fiberoptic

Progress In Electromagnetics Research B, Vol. 27, 2011 301
50 100 150 200 250 300 35020
21
22
23
24
25
Radiometric reading
Heating
T(t
) [
C]
o
t [s]
Figure 10. Radiometric reading with design #1 during protocol withinterspersed 20 s heating with 915 MHz DCC antenna at 20 Wand 10 sreading with power off. Integration time τ = 3 s. Standard deviation,σ = 0.15C before heating. Red dots are the mean value of theradiometric reading.
probes. The heating protocol was heating for 20 s with 20 W andreading for 10 s with heating turned off. After six heating cycles,the spatial temperature distribution inside the phantom was generatedwith an infrared camera (see Fig. 12).
5. DISCUSSION
Two distinct designs of a small sized (45×90mm2) frontend radiometerare demonstrated. The proposed designs gave the expected gain overthe selected frequency band (3.25–3.75 GHz). Both designs were stableas the stability factor µ > 1 for all frequencies for both simulated andmeasured data. The input reflection coefficient S11 is in the expectedrange (Fig. 6). The output reflection coefficient S22 for design #1 hasa peak at the center frequency 3.5GHz, and care must be taken inthe following stage, usually a square law detector, in order to avoidsignal instabilities. The noise temperature Te was better for design#2 compared to design #1. This was anticipated as a consequence oflower overall noise figure, since the first LNA in design #2 has a gainof 19 dB and a noise factor of only 1.2 dB.
The selected thickness of the PCB is a challenge, because solderedconnectors are easily broken apart from the PCB. Future designsrequire a multi-layer PCB for better mechanical stability. Althoughthe design is chosen for minimum power consumption, it requires aheat sink to minimize influence from ambient temperature changesthat may induce temperature variations on the PCB and thus gain

302 Klemetsen et al.
drift. In the design where LNAs precede the reference and antennainput, it is important that these components are well matched anddrift synchronously, as the Dicke concept is not valid for this dualamplifier design.
Sensitivity of the prototype was worse than expected and isprobably due to manual soldering of SMD components with more solderflux than in a professional soldering process. However, the design withthe low noise amplifier before the Dicke switch for both antenna andreference input, produced 36% better sensitivity than the design wherethe Dicke switch is in front. From Fig. 7, we conclude that the Dickeconcept is working as expected but care must be taken to maintainconstant power supply values and chassis temperature. The outputfrom the Dicke radiometer remains more stable when either changingthe temperature of the radiometer or the supply voltage than thetotalpower radiometer output. The correlation coefficient between thetwo totalpower radiometer output channels was measured to 0.9904.The radiometer was calibrated at a stable operating voltage of 5 V. Bychanging the operating voltage, calibration will not be valid since thereoperation conditions have been altered for the system. Nevertheless,this gives an indication of how sensitive the radiometer is for changesin operating voltage.
Allan deviation can provide differentiation between various typesof noise-like and coherent signals embedded in the radiometricresponse. From the log-log plot in Fig. 8(b), the followinginterpretation can be made in three time regions: (i) Between 0.25 to10 s the white noise (uniform spectral density) is dominant followingthe predicted −0.5 slope, (ii) the roll-off below 0.1 s is the convolutionof the post-detector integration filter (cut-off frequency of 10Hz) withthe raw radiometric data sampled at 454 Hz, (iii) above 200 s theAllan deviation follows a slope of 1.0 indicating a systematic driftduring the measurement time. This is confirmed through a linear fitin Fig. 8(a) which gives mean drift rate over the acquisition time of87µKs−1. Flicker noise is a type of electronic noise with a 1/f (pinkspectrum) spectral response that is present in almost all electronicdevices. Presently, these devices include amplifying and detectingcomponents. If significant, this form of noise contribution should showup as a constant plateau (slope of 0) in a given time region. Basedon Fig. 8(b), we conclude that this type of noise is negligible (notdetectable) compared to the other two types discussed above. Finally,random-walk noise originating from short-term temperature changesinducing variable losses and amplifier gains was neither identified (slopeof 0.5) in the Allan deviation plot.
During the heating sequence (Fig. 9), the Dicke switch has to be

Progress In Electromagnetics Research B, Vol. 27, 2011 303
locked in the reference position to avoid damage of radiometer andpower meter. Dicke design #1 can thus be used during heating sincethe switch provides isolation of the front end. Furthermore, Dickedesign #2 shows better sensitivity, but goes into saturation duringheating. To avoid saturation of the first LNA, one can try to operateit in bypass mode during heating in future designs.
The possibility to read temperatures non-invasively inside anobject during heating was also demonstrated. Results in Fig. 10 ofradiometer design #1 show that the sensitivity in the experimentalverification is worse than observed in the prototype testing (Table 2).The difference is likely due to the fact that the experimental test wasdone with a real sensor, an antenna, and not an ideal 50 Ω load. Withan antenna as a load, EMI can be significant as no shielding roomwas used during the experiment. Another plausible explanation isnoise produced in the cable between antenna and radiometer. Fig. 11shows the true temperature at depth with the radiometric reading forcomparison, and this is verified by the infrared images in Fig. 12. Thetemperature change during heating is not given by the same amountin the radiometer temperature reading (Fig. 10). This is because ofphantom attenuation and the limited penetration ability for the higherfrequencies at 3.5 GHz. Hence the microwave radiometer measures asingle brightness temperature that is proportionate to the volumetrictemperature distribution. To find the temperature at depth, theinverse problem has to be solved [16].
50 100 150 200 250 300 35022
24
26
28
30
32Sensor 1, depth=5 mm
Sensor 2, depth=19 mm
Sensor 3,depth=33 mm
T(t
) [
C]
o
t [s]
Figure 11. Temperature reading with Luxtron probes 1, 2 and3 during heating. Depth is from the radiometric antenna. Theradiometric reading is also plotted for comparison with the Luxtrontemperature reading.

304 Klemetsen et al.
24
25
26
27
28
29
30
31
32
24
25
26
27
28
29
30
31
32
24
25
26
27
28
29
30
31
32
24
25
26
27
28
29
30
31
32
(a) (b)
(c) (d)
Figure 12. Infrared images after heating. Depth is from theradiometric antenna. (a) Depth 5 mm. Tmax = 24.7C. (b) Depth19mm. Tmax = 31.1C. (c) Depth 33 mm. Tmax = 32.3C. (d) Depth38mm. Tmax = 26.1C.
6. CONCLUSION
Two variants of a small sized (45 × 90mm2 chassis dimensions)radiometer frontend were investigated for medical applications. Bothdesigns were shown to be stable as the stability factor µ > 1 for allfrequencies. The design with an LNA before the switch showed 36%higher sensitivity than the design with the Dicke switch in front. Thedesign with an LNA before the switch can not be used during heatingbecause of saturation problems during operation. The possibility toread temperature non-invasively at depth during interspersed heatingand radiometric monitoring were also demonstrated in a phantomexperiment.
ACKNOWLEDGMENT
Øystein Klemetsen is grateful to have had the opportunity to spendthe academic year 2009-2010 at Duke University Medical Center inDurham, NC, USA. He also acknowledges the opportunity to enter

Progress In Electromagnetics Research B, Vol. 27, 2011 305
into an ongoing project between Duke University Medical Center andThermImage in Salt Lake City.
REFERENCES
1. Mizushina, S., H. Ohba, K. Abe, S. Mizoshira, and T. Sugiura,“Recent trends in medical microwave radiometry,” IEICE Trans.Commun., Vol. E78-B, No. 6, 789–798, 1995.
2. Bardati, F. and S. Iudicello, “Modeling the visibility of breastmalignancy by a microwave radiometer,” IEEE Transactions onBiomedical Engineering, Vol. 55, No. 1, 214–221, Jan. 2008.
3. Arunachalam, K., P. R. Stauffer, P. F. Maccarini, S. Jacobsen,and F. Sterzer, “Characterization of a digital microwave radiome-try system for noninvasive thermometry using a temperaturecon-trolled homogeneous test load,” Physics in Medicine and Biology,Vol. 53, No. 14, 2008.
4. Arunachalam, K., P. F. Maccarini, V. D. Luca, F. Bardati,B. W. Snow, and P. R. Stauffer, “Modeling the detectabilityof vesicoureteral reflux using microwave radiometry,” Physics inMedicine and Biology, Vol. 55, No. 18, 5417, 2010.
5. Aitken, G. J. M., “A new correlation radiometer,” IEEETransactions on Antennas and Propagation, Vol. 16, No. 2,Mar. 1968.
6. Ulaby, F., R. Moore, and A. Fung, Microwave Remote SensingFundamentals and Radiometry, 1st Edition, Vol. 1, Artech House,685 Canton Street, Norwood, MA 02062, USA, 1981.
7. Jacobsen, S. and O. Klemetsen, “Improved detectability inmedical microwave radio-thermometers as obtained by activeantennas,” IEEE Transactions on Biomedical Engineering,Vol. 55, No. 12, 2778–2785, Dec. 2008.
8. Edwards, M. and J. Sinsky, “A new criterion for linear 2-port stability using a single geometrically derived parameter,”IEEE Trans. Microw. Theory Tech., Vol. 40, No. 12, 2303–2311,Dec. 1992.
9. Allan, D. W., “Should classical variance be used as a basic measurein standards metrology?” IEEE Trans. Instrum. Measurements,Vol. 36, No. 2, 646–654, 1987.
10. Land, D. V., A. P. Levick, and J. W. Hand, “The use of the allandeviation for the measurement of the noise and drift performanceof microwave radioemters,” Measurement Science Technology,Vol. 18, No. 7, 1917–1928, 2007.

306 Klemetsen et al.
11. Barnes, J. A., A. R. Chi, L. S. Cutler, D. J. Healey, D. B. Leeson,T. E. McGunical, J. A. Mullen, W. L. Smith, R. L. Sydnor,R. F. C. Vessot, and G. M. R. Winkler, “Characterizationof frequency stability,” IEEE Trans. Instrum. Measurements,Vol. 20, No. 2, 105–120, 1971.
12. Bocquet, B., J. C. van de Velde, A. Mamouni, Y. Leroy, G. Giaux,J. Delannoy, and D. Delvalee, “Microwave radiometric imaging at3GHz for the exploration of breast tumors,” IEEE Trans. Microw.Theory Tech., Vol. 38, No. 6, 791–793, Jun. 1990.
13. Stauffer, P., F. Rossetto, M. Leencini, and G. Gentilli, “Radiationpatterns of dual concentric conductor microstrip antennas forsuperficial hyperthermia,” IEEE Transactions on BiomedicalEngineering, Vol. 45, No. 5, 605–613, May 1998.
14. Maccarini, P., K. Arunachalam, T. Juang, V. De Luca,S. Rangarao, D. Neumann, C. Martins, O. Craciunescu, andP. Stauffer, “Shaping and resizing of multifed slot radiators used inconformal microwave antenna arrays for hyperthermia treatmentof large superficial diseases,” 746–749, Sep. 2009.
15. Brelum, S. H., “A numerical study of planar elliptical antennasapplied to ultrawideband (UWB) imaging of breast tissue,” LAPLAMBERT Academic Publishing, 2010.
16. Jacobsen, S. and P. Stauffer, “Nonparametric 1-D temperaturerestoration in lossy media using tikonov regularization in sparseradiometry data,” IEEE Transactions on Biomedical Engineering,Vol. 50, No. 2, 178–188, Feb. 2003.