design of protective dolphins in demanding … of protective dolphins in demanding geotechnical...
TRANSCRIPT

NGM 2016 Reykjavik
Proceedings of the 17th
Nordic Geotechnical Meeting
Challenges in Nordic Geotechnic 25th
– 28th
of May
IGS 787 NGM 2016 Proceedings
Design of protective dolphins in demanding geotechnical
conditions
A. Krivokapic
Ramboll, Denmark, [email protected]
H. Sjöstedt
Ramboll, Denmark
ABSTRACT
Many existing bridges are faced with urgency to increase safety due to vessel collision. A number
of different approaches are possible depending on the set of constraints which are almost unique
for a given project.
This paper describes the design of independent protective dolphins for the Sallingsund Bridge in
Denmark. Two concrete structures, supported by tubular steel piles were designed to resist impact
of vessels of up to 6000 deadweight tonnage (DWT) and prevent collision with the bridge piers.
The design of the dolphins was preceded by risk analysis based on monitoring of the ship traffic
through the channel and a concept study which narrowed down the choice of structural system.
The final solution was greatly influenced by the 15m water-depth and presence of a 15m thick
layer of gyttja found immediately beneath the seabed, providing very little geotechnical resistance
against lateral loads. The solution also had to fit many other constraints such as a limitation of the
size of the structures, proximity of existing raked piles below the bridge pier, restrictive budget,
etc.
Structural verification was done using state-of-art calculation methods, which took into account
time history of the collision event, plastic behaviour of all structural elements (including the
vessel) and second order effects for piles and pile - group effect. Furthermore, the design was
streamlined to maximize the dolphins overall energy dissipation capacity and is optimized with
regards to the constructability in the near-shore environment.
Keywords: vessel collision, protection dolphin, gyttja

Geotechnical structures and infrastructure
NGM 2016 Proceedings 788 IGS
1 INTRODUCTION
Ship impact to a bridge from a larger vessel
is a rare hazard which may have catastrophic
consequences. A number of existing bridges
do not have sufficient capacity required to
resist the collapse of superstructure in the
event of critical collision.
For any such bridge, a design of additional
provisions is required in order to reduce the
risk level below the requirements given by
the society and applicable codes.
In recent years, Vejdirektoratet (Danish Road
Directorate who is the authority and main
owner of roads and bridges in Denmark) has
initiated assessments of 4 large marine
bridges having unacceptably low safety
against ship collision. Ramboll and COWI
worked together with Vejdirektoratet on
establishing the appropriate acceptance
criteria to be met by protective measures
following the principles of Eurocode system.
Figure 1 Limfjord (Sallingsund marked with red)
The largest of the analyzed bridges is
Sallingsund bridge, which was opened in
1978 in order to improve the traffic
connection between the island of Mors and
the Salling peninsula on the Danish mainland
(Jutland). The total length of the bridge is
about 1700 metres, the span length is 93
metres between the piers and the maximum
vertical clearance to the sea is 26 metres.
The bridge is constructed of reinforced and
pre-stressed concrete. The bridge deck is
carried by 18 concrete piers, founded on
driven tubular piles.
Figure 2 Sallingsund bridge
1.1 Risk analysis
The design was preceded by a comprehensive
risk assessment which included a cost-benefit
analysis in order to choose the right solution
for the task at a given budget.
The assessment included analysis of vessel
traffic through Sallingsund by collecting of
Automatic Identification System (AIS) data
and incorporated mathematical models of
vessel deflection upon the impact with a
protection structure.
Figure 3 Overview of AIS data monitoring of the
passing ships (red – southbound; green –
northbound)
The overall findings were that acceptable
level of protection would be achieved by
placing two independent protection structures
south of piers 8 and 9 in order to protect

Design of protective dolphins in demanding geotechnical conditions
IGS 789 NGM 2016 Proceedings
Figure 4 Placement of dolphin in relationship to the pier, overview (left) and detail (right)
these two piers against ship impact from
northbound ships.
The design vessel was adopted to represent
the largest ship that can enter the Limfjord
taking into account planned deepening of the
entrance channel from the North sea.
Table 1 Design vessel characteristics
Vessel type Ship
Displacement (partly loaded) 6000 t
Width 16 m
Length 97 m
Bow depth 16 m
Draft (partly loaded) 4.7 m
Rake length of bow 4 m
The design speed of the ship was determined
based on the AIS data and adopted as 4.8
m/s.
The dolphins were designed to absorb the
kinetic energy from the moving ship and
prevent it from hitting the pier.
2 SITE CONDITIONS
2.1 - Geotechnical conditions
The water depth at the location of the
dolphins is around 15 m. The topsoil consists
of a layer of gyttja reaching 15m below the
seabed.
The gyttja is followed by a sand layer (17-
30m in vicinity of piers 8 and 9) under which
there is a layer of mica clay - see Figure 5.
The gyttja layer is very porous and with
almost negligible strength and stiffness.
Therefore scour was not considered as an
issue that affects the design assumptions. The
depth of the sand layer varies between pier
number 8 and pier number 9. Preliminary
design determined that the tip of the piles at
the dolphin near pier 8 will end in sand with
sufficient depth to clay to insure the full tip
bearing capacity. The reduced thickness of
the sand layer near pier 9 (in comparison to
thickens at pier 8) meant that piles had to be
extended into the clay layer making them
considerably longer, much like those of the
bridge.
Figure 5 Overview of geotechnical layers which
govern the foundation of the bridge
2.2 Existing piers and their piles
The bridge piers are founded on circularly
distributed groups of driven piles in two rows
fanning out with 9% and 32% inclination
outwards. The piles are constructed as driven
steel pipes with outer diameter of 711.2 mm
and maximal bearing capacity of 6000kN in
compression.
Geotechnical structures and infrastructure
NGM 2016 Proceedings 790 IGS
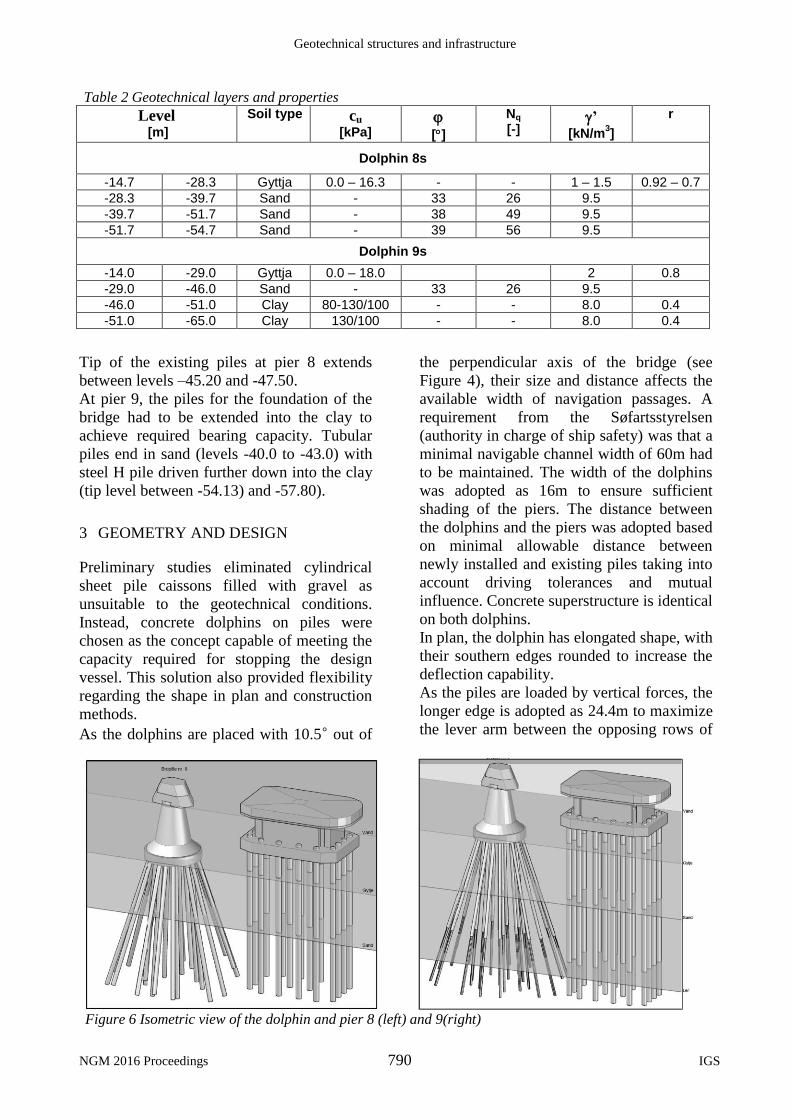
Table 2 Geotechnical layers and properties
Level [m]
Soil type cu [kPa]
[]
Nq [-]
’ [kN/m
3]
r
Dolphin 8s
-14.7 -28.3 Gyttja 0.0 – 16.3 - - 1 – 1.5 0.92 – 0.7
-28.3 -39.7 Sand - 33 26 9.5
-39.7 -51.7 Sand - 38 49 9.5
-51.7 -54.7 Sand - 39 56 9.5
Dolphin 9s
-14.0 -29.0 Gyttja 0.0 – 18.0 2 0.8
-29.0 -46.0 Sand - 33 26 9.5
-46.0 -51.0 Clay 80-130/100 - - 8.0 0.4
-51.0 -65.0 Clay 130/100 - - 8.0 0.4
Figure 6 Isometric view of the dolphin and pier 8 (left) and 9(right)
Tip of the existing piles at pier 8 extends
between levels –45.20 and -47.50.
At pier 9, the piles for the foundation of the
bridge had to be extended into the clay to
achieve required bearing capacity. Tubular
piles end in sand (levels -40.0 to -43.0) with
steel H pile driven further down into the clay
(tip level between -54.13) and -57.80).
3 GEOMETRY AND DESIGN
Preliminary studies eliminated cylindrical
sheet pile caissons filled with gravel as
unsuitable to the geotechnical conditions.
Instead, concrete dolphins on piles were
chosen as the concept capable of meeting the
capacity required for stopping the design
vessel. This solution also provided flexibility
regarding the shape in plan and construction
methods.
As the dolphins are placed with 10.5° out of
the perpendicular axis of the bridge (see
Figure 4), their size and distance affects the
available width of navigation passages. A
requirement from the Søfartsstyrelsen
(authority in charge of ship safety) was that a
minimal navigable channel width of 60m had
to be maintained. The width of the dolphins
was adopted as 16m to ensure sufficient
shading of the piers. The distance between
the dolphins and the piers was adopted based
on minimal allowable distance between
newly installed and existing piles taking into
account driving tolerances and mutual
influence. Concrete superstructure is identical
on both dolphins.
In plan, the dolphin has elongated shape, with
their southern edges rounded to increase the
deflection capability.
As the piles are loaded by vertical forces, the
longer edge is adopted as 24.4m to maximize
the lever arm between the opposing rows of

Design of protective dolphins in demanding geotechnical conditions
IGS 791 NGM 2016 Proceedings
piles. The concrete cap is a box-like
structure, which consists of a concrete base
slab, four walls and a top slab. Each dolphin
is founded on 18 steel piles, 1200mm in
diameter.
From the beginning, the design included
active consideration of the available
construction methods. For example, maximal
sizes of floating cranes and other
construction vessels which can enter the
Limfjord were taken into account when the
size of prefabricated sections of
superstructure was decided.
Piles were adopted as driven tubular steel
piles with diameter of 1.2 metres. Bored piles
were also considered in the preliminary
design but discounted due to estimated higher
price of execution and less availability of the
necessary construction equipment.
Driven piles offered the added benefit that
the driving log allows for a precise estimate
of the bearing capacity without additional
testing.
One other important feature of the chosen
pile system is that the largest part of pile’s
vertical/axial capacity originates from the
skin friction (both inside and outside), which
is governed by ductile post-yield behaviour.
As shown later in this paper, this is an
important feature in the system which allows
for vertical yielding of piles (plastic portion
of the diagram) during the collision. Increase
of the pile tip area by under-reaming and
filling with concrete was excluded as the
larger tip resistance obtained in such way is
hard to verify and produces more brittle post-
yield behaviour.
As the combined depth from water surface to
load bearing soil layers is around 30m due to
presence of gyttja, design with a pinned
connection between piles and superstructure
with chosen diameter of the piles would
require too large deformations in order to
stop the colliding vessel.
This challenge was met by designing a cap
with extended height to shorten the free
length of the piles, and by providing a fixed
connection between piles and bottom slab.
By incorporation of the vertical resistance of
the piles through the lever arm between the
rows in tension and compression, the overall
stiffness of the structure was increased.
The ability of the piles to retain maximal
moment in the post-yield stage was addressed
by designing the wall thickness to satisfy
requirements for compact cross-section class
(class 1). The required thickness wall of
40mm is reduced below the fixation level in
the sand where piles are subjected only to
normal forces.
4 MODELLING AND ANALYSIS
The general approach to the design of
independent protective structures is to
demonstrate that the kinetic energy of the
ship can be dissipated through plastic work
and acceleration of the mass.
The working curve of the dolphin was
obtained by creating a full static model of the
structure in the FE-program LUSAS. In the
FE-model, several nonlinear effects were
taken into account: horizontal and vertical
response of the soil, nonlinear behaviour of
the steel in the piles and second order effects
(geometric nonlinearities).
4.1 Modelling of geotechnical conditions
The horizontal response of the surrounding
soil was modelled by use of PY-curves. The
PY-curves describe the dependency between
reaction force, P, in the soil and lateral
deformation, Y, of the pile. Group effect was
taken into the consideration by reduction of
the P-values of the PY-curves for given
deformation. Different reduction factors were
used depending on the geometric position of
the piles. Typically the reduction factors have
values between 0,6 and 0.95. The PY-curves
also vary with type and strength of soil and
depth beneath the sea bed.
The gyttja provides negligible resistance
against lateral load compared to the sand
layer below which ensures shallow depth to
the fixation with its relatively high strength
and stiffness. The lateral resistance in the
clay layer (which is found beneath the sand

Geotechnical structures and infrastructure
NGM 2016 Proceedings 792 IGS
Figure 8 Components of the pile vertical capacity at piers 8 and 9
layer) is irrelevant. Still, it is included in the
FEM model.
The vertical resistance of the piles is a
combination of skin friction and tip
resistance. For a plugged pile, the skin
friction acts on the outer circumference of the
piles, whereas the tip resistance acts on the
cross sectional area of the piles and the area
of the enveloped soil. For an unplugged pile,
the skin friction acts on the inner and outer
circumference of the piles and the tip
resistance acts on the cross sectional area of
the piles. However, to simplify the modelling
of the dolphins, the sum of both skin
frictional resistance and tip resistance was
applied at the tip of the piles, by use of a
piecewise linear spring, a “tzQz-curve”.
Figure 7 Examples of PY-curves used for piles at
pier 9.
A typical example of such a spring is shown
in Figure 8. The group effect was
investigated for vertical loading of the piles
and it was found that it had no influence due
to sufficient spacing between the piles.
The lateral response of the soil (PY-curves)
was implemented in the FE-model through
use of multi-linear springs (as shown in
Figure 7) applied to the embedded part of the
piles. The vertical response of the soil (tzQz-
curves) was implemented in the FE-model
through use of multi-linear springs (as shown
in Figure 8) applied to the tip of the piles.
4.2 Modelling of structural elements
The static model of the dolphin is in essence
a sway frame with piles fixed to the concrete
super structure and fixation developed in the
sand layer. Yield hinges are expected to
develop in the piles at the zones of maximal
moment.
The global overturning moment caused by
the impact load acting over the vertical
distance between the top slab and the level of
fixation, augmented by the second order
effects, is resisted in two ways: - 1) through
compression / tension action of the opposing
pile rows and 2) through moment in each
individual pile at the fixation level. The load-
deformation diagram of the structure has a
steep linear shape until the two front and rear
rows of piles yield in compression / tension
and yield hinges have developed in all of the
piles. This point marks the peak load factor
that the structure is able to resist. Afterwards
, the deflection continues to increase and the
global overturning moment is kept constant.
Since the influence of second order effects

Design of protective dolphins in demanding geotechnical conditions
IGS 793 NGM 2016 Proceedings
increases with deflection gain, the load factor
will decrease simultaneously so that the
global overturning moment is kept constant.
The steel piles are modelled as beam
elements with perfect elasto-plastic
behaviour. This means that bending moment
can only increase in the pile until the von
Mises yield criterion is reached. Thereafter,
the moment is kept constant (or decreases if
the normal force increases) with increasing
rotation and a yield hinge is
formed.Geometric imperfections were taken
into acount through applying horizontal
loading to the beam elements.
All concrete parts were modelled as shell
elements with linear material properties. The
concrete structural elements were designed to
transfer the loads from the ship impact
without considerable plastic deformations to
appear in the concrete.
Figure 9 Static system
A horizontal point load of 1000 kN was
applied at the top slab (level +1,5), as shown
in Figure 9. The load was multiplied by a
load factor, which was gradually increased.
Based on the horizontal deflection of the top
slab and the load factor, a working curve of
the dolphin was found. This working curve
was used to determine the required deflection
in order to dissipate the energy from the
collision and the capacity of the structure was
verified for the relevant load factor.
4.3 Energy exchange and dissipation
concept
Apart from plastic work of the dolphin,
during the collision, energy is absorbed in
several other ways. Formost is the crushing
of the ship’s bow, which is described with
non-linear curves in both AASHTO and
Eurocode. Determination of this dependency
based on the physical experimetns (Woisin
and Meir-Dornberg). Simplified curves and
maximal values of quasi-static impact forces
show considerable disparity. This is
discussed in AASHTO and there is
awareness that this is an area of ongoing
research.
In this project, energy exchange between
vessel and the dolphin was assessed using
time series analysis based on the
conservation of momentum at the moment of
impact and conservation of energy for motion
after the impact. The model is described as
two-degrees-of-freedom system connected by
piecewise linear longitudional springs.
The ship’s bow force-deformation curve is
addopted from Eurocode.
Figure 10 Simplified model for collision analysis

Geotechnical structures and infrastructure
NGM 2016 Proceedings 794 IGS
Self-weight LI 1 / LF 1 LI6 / LF 10 LI 14 / LF 25 LI 38 / LF 23.95
Figure 12 Successive deformed configurations of the dolphin (LI – load increment, LF – load factor)
5 RESULTS
5.1 Dolphin capacity
Iterative elasto-plastic analysis of the FE-
model was performed with increase of the
load factor in each step. Deformed
configuration of dolphin 9S is shown on
Figure 12.
Displacement of the impact point on the top
slab is plotted against the applied force to
form a “work curve” for the entire structure
shown on Figure 11. The area beneath the
diagram is equal to the dissipated energy of
the system through plastic work.
Figure 11 Load-displacement curve of the
dolphin 8(red) and 9 (blue)
Point 1 marks the peak load value for the
dolphin. Outermost two rows of piles, both at
the front and at the back have reached their
vertical capacity.
Prior to reaching the peak value, the curve
drops in angle from the previous linear load-
deformation response of the dolphin. At this
point (marked with “a”), front piles have
almost exausted their normal bearing
capacity in skin friction which has a steeper
T-z curve compared with the tip.
Point 2 represents the deformation at which is
the required kinetic energy of the colliding
vessel dissipated by the plastic work of the
system. Displacement of the top slab is
around 2.9m for both dolphins.
The corresponding values of the normal
forces in piles are shown Figure 13.
Figure 13 Overview of the development of normal
forces in the piles compared to the load factor
(each coloured bar corresponds to one row of
piles and positive values represent compression)
1 2
a

Design of protective dolphins in demanding geotechnical conditions
IGS 795 NGM 2016 Proceedings
The working curve shows that dolphin is
capable of deforming further which could
indicate that the design is conservative.
However, the overall stiff behaviour of the
dolphin ensures stopping of the vessel on safe
distance from the pier. Also, in the marine
environment susceptible to ice loads, stiff
structure is less susceptible of inducing
unintended damage.
Apart from the results shown for head-on
collision, oblique impact was analysed with a
deviation angle of 30° to insure sufficient
lateral stiffness of the dolphin. This issue,
together with their results are the subject of a
future publication.
5.2 Energy exchange
The interaction between the ship and dolphin
is simulated using time series analysis
peformed with in-house developed program.
The working curve of the ship’s bow was
adopted from annex C4.4 of EN 1991-1-7.
Due to relatively large mass of the concrete
superstructure compared to the displacement
of the vessel, it was assessed that up to 60%
of the collision energy could be dissipated by
deformation of the bow. However, the
assumptions regarding the ship’s bow
behaviour incorporate substantial
uncertainities. Furthermore, recent studies
based on detailed FEM models of ship’s bow,
indicate lower yield load. Collision with
deformable structure could limit the
deformation of the bow, thereby reducing the
amount of energy dissipated in this way.
For this reason, dolphin’s pile system, is
verified without relying on this mechanism of
collision energy dissipation.
Figure 14 Speed of ship and dolphin over the
time
Figure 15 Force in ship’s bow and dolphin
5.3 Concrete super structure
Concrete super-structure is dimensioned for
the difference between maximal forces in the
bow and dolphin shown on Figure 15. The
assumption of the peak quasi static force to
act on the concrete structure is in this case a
conservative assumption. As the peak force is
larger than maximal force that can be taken
in the pile system, separate model was made
where the piles were given unyielding
vertical support. In this way, it is ensured that
impact load can be transferred by the
superstructure and distributed on the pile
group as assumed.

Geotechnical structures and infrastructure
NGM 2016 Proceedings 796 IGS
6 CONCLUSION
The presented solution successfully meets
multiple-constrained design requirements
through integration of all available structural
and geotechnical energy dissipating
components.
The presence of a thick layer of weak organic
soil excludes a number of solutions and poses
execution and design challenges. With
limitation on pile diameter and construction
method, the required response of the structure
is achieved by an extended concrete
superstructure and moment-coupling
connection to the piles.
This was facilitated by a concurrent
geotechnical and structural design process
which verified ductile post-yield behaviour of
all elements.
Further possibilities for optimization of
future similar structures can be explored
through more advanced modelling of energy
transfer between the ship and the dolphin.
7 REFERENCES
AASHTO (2007), Guide Specifications and
Commentary for Vessel Collision Design of Highway
Bridges, 2nd edition
Eurocode (2007), DS/EN 1991-1-7:2006 General
Actions – Accidental Loads (including DK NA:2007),
2nd edition