design of supercapacitor electrodes using molecular ... · pdf filereview design of...
TRANSCRIPT

REVIEW
Design of Supercapacitor Electrodes Using Molecular DynamicsSimulations
Zheng Bo1 . Changwen Li1 . Huachao Yang1 . Kostya Ostrikov2,3 . Jianhua Yan1 . Kefa Cen1
Received: 4 November 2017 / Accepted: 21 December 2017 / Published online: 15 January 2018
� The Author(s) 2018. This article is an open access publication
Highlights
• Capacitive behaviors of electric double-layer capacitors (EDLCs) are strongly related to electrode geometry and
electrode modification.
• Molecular dynamics (MD) studies on EDLCs’ performances of electrode materials from porous to nanostructures are
summarized.
• MD could provide guidelines for the optimum design and fabrication of active materials.
Abstract Electric double-layer capacitors (EDLCs) are
advanced electrochemical devices for energy storage and
have attracted strong interest due to their outstanding
properties. Rational optimization of electrode–electrolyte
interactions is of vital importance to enhance device per-
formance for practical applications. Molecular dynamics
(MD) simulations could provide theoretical guidelines for
the optimal design of electrodes and the improvement of
capacitive performances, e.g., energy density and power
density. Here we discuss recent MD simulation studies on
energy storage performance of electrode materials con-
taining porous to nanostructures. The energy storage
properties are related to the electrode structures, including
electrode geometry and electrode modifications. Altering electrode geometry, i.e., pore size and surface topography,
can influence EDL capacitance. We critically examine
different types of electrode modifications, such as altering
the arrangement of carbon atoms, doping heteroatoms and
defects, which can change the quantum capacitance. The
enhancement of power density can be achieved by the
intensified ion dynamics and shortened ion pathway.
Rational control of the electrode morphology helps
improve the ion dynamics by decreasing the ion diffusion
pathway. Tuning the surface properties (e.g., the affinity
between the electrode and the ions) can affect the ion-
packing phenomena. Our critical analysis helps enhance
the energy and power densities of EDLCs by modulating
Moleculardynamics
101001100101001100101110011001001100111
ion arrangement
ion dynamics
Size
Edges
Current collectorelectrode
Electrodegeometry
Electrodemodification
& Zheng Bo
1 State Key Laboratory of Clean Energy Utilization, College of
Energy Engineering, Zhejiang University,
Hangzhou 310027, Zhejiang Province, People’s Republic of
China
2 School of Chemistry, Physics and Mechanical Engineering,
Queensland University of Technology, Brisbane, QLD 4000,
Australia
3 Joint CSIRO-QUT Sustainable Processes and Devices
Laboratory, Lindfield, NSW 2070, Australia
123
Nano-Micro Lett. (2018) 10:33
https://doi.org/10.1007/s40820-018-0188-2
the corresponding electrode structures and surface
properties.
Keywords Electric double-layer capacitors � Molecular
dynamics � Porous structure � Nanostructure
1 Introduction
Electric double-layer capacitors (EDLCs) are capacitive or
non-faradaic energy storage devices, featuring high power
delivery and rapid charge–discharge cycles [1, 2]. They
occupy an intermediate position between dielectric capac-
itors and batteries and are versatile enough as energy
storage systems, stand-alone or combined with batteries
[3]. Owing to higher power density and longer cycle life
than those of batteries, as well as superior energy density
than that of dielectric capacitors [4, 5], EDLCs are best
suitable for occasions when fast charge/discharge rates and
reliability are needed, such as energy recovery devices [6],
uninterruptible power systems [7], buffers for power grid
[8], high-performance filter capacitors [9]. The perfor-
mances of EDLCs are characterized by the energy density,
power density, rate performance, cycle stability, leakage
current, open circuit voltage, safety and cost [10].
EDLCs are comprised of two oppositely charged elec-
trodes separated by electrolyte. The electrostatic interaction
between the electrified electrode and electrolyte ions leads to
the physical adsorption of counterions and desorption of co-
ions at the electrode/electrolyte interfaces [10]. This process
leads to the ion separation and charge accumulation, thus
causing the capacitive effect [1]. For industrial and large-scale
application of EDLCs, rational optimization of electrode–
electrolyte interactions is of vital importance to enhance
device performances. One of the effective methods is cus-
tomizing the electrode materials, e.g., engineering pore
geometry/size and doping defects/functional groups [11, 12].
The suitable materials should be abundant and cheap, having
large specific surface areas and excellent conductivity, non-
toxic and environment-friendly, and easily processable
[13, 14]. This is why carbon materials are among the most
promising electrode materials [3, 13].
The choice of electrode materials is closely related to
EDL structure. Surface topography and modification of
electrodes affect ion accumulation at the electrode/elec-
trolyte interface. For example, a higher surface curvature of
carbon nanotubes is beneficial for a greater population of
ions at the interface [15]. Within the carbon nanotube
micropores, a single-file distribution is recognized near the
high curvature surface [16]. The sharp edges of graphene
nanostructures tend to aggregate more electrons, obviously
boosting the separation of counterions and co-ions within
the EDL-dominant area [17, 18]. The EDL structure has
been studied since 1879 [19], in which an original but
crude Helmholtz model was proposed. This theoretical
model of Helmholtz was used to elucidate the separation of
two layers with the opposite charges and the formation of
EDL at the interface of solid/liquid [19], similar to those in
conventional dielectric capacitors. Subsequently, the
Helmholtz model was further improved by Gouy in 1910
[20] and Chapman in 1913 [21]. These models incorpo-
rated the continuous distribution and motion of electrolyte
ions. This improved model is referred to as Gouy–Chap-
man model, where the potential in EDL decreases expo-
nentially with distance to the electrode surface [22]. With
the combination of the Helmholtz model and the Gouy–
Chapman model, Stern recognized two areas featuring
distinct ion distributions, namely the inner and outer layers
[10, 23]. The accumulation of densely packed ions occur-
red in the inner layer (also called compact layer or Stern
layer), while the hydrodynamic motion of ions exists in the
outer layer (diffuse layer) [22]. Nowadays, these traditional
theories could serve as a guideline for optimization of
EDLCs, especially suitable for mesoporous materials.
As new nanomaterials are developed, new challenges
emerge. New effects, closely correlated with the nanomate-
rials, include anomalous increase in capacitance [11, 24–28],
desolvation [25, 29–31], surface roughness [32–34], doping
effect [35–39] and edge effect [17, 18, 40]. The anomalous
increase in capacitance and desolvation effect are intrinsic for
sub-nanometer pores. Owing to these new effects, the
arrangement of ions at the interface is heterogeneous, obvi-
ously different with that predicted by EDL theoretical models.
Therefore, the solutions for these challenges should be based
on experimental methods and numerical simulations.
On the one hand, electrolyte structuring in nanocon-
finement is measured by some experimental techniques,
including nuclear magnetic resonance (NMR) [41, 42] and
electrochemical quartz crystal microbalance (EQCM)
[43, 44]. NMR acquires the information about dynamic
behavior of ions at nanoscale, including the distribution
and dynamics of electrolyte ions [45]. EQCM is a sensitive
tool based on in situ gravimetric detection to investigate
the ion transport from the bulk to the pores in electro-
chemical systems. The principle is to measure the variation
of its resonance frequency, which is converted into mass
variation when imposing an alternating electric field [46].
Both of these techniques have been employed to study the
adsorption mechanism of ions inside traditional porous
structures, such as activated carbon [42, 43, 47] and car-
bide-derived carbon [46, 48]. Importantly, the use of these
techniques is extended to novel nanomaterials. Recently, Li
et al. [45] employed solid-state NMR to investigate the
adsorption of BF4- ions inside a graphene film, a typical
123
33 Page 2 of 23 Nano-Micro Lett. (2018) 10:33
2D nanomaterial. In addition, net change of mass in zeo-
lite-templated carbon has been experimentally monitored
using EQCM [49]. Employing the NMR techniques, Zhang
et al. [50] confirmed the existence of various oxygen-
contained functional groups and two kinds of water
molecules within the graphene oxide films. Using the
EQCM tests, Barisci et al. [51] successfully monitored the
mass change of different electrolytes within the single-
walled carbon nanotube films.
On the other hand, numerical simulation has been one of
the most powerful tools for investigating the physical and
chemical phenomena. Different simulation methods have
been employed to characterize the capacitive behaviors of
EDLCs, such as density functional theory (DFT), finite
element method (FEM) and molecular dynamics (MD)
simulation. DFT calculations are hard to be extended to a
realistic representation of the porous electrodes or complex
ion structures owing to the huge computational costs.
Besides, FEM calculations, generally described by a con-
tinuum model (e.g., Nernst–Plank equations), commonly fail
to capture the capacitive behaviors of nanoporous electrodes
with densely packed electrolytes (e.g., ionic liquids). In
particular, MD is an effective simulation method to describe
the interaction between particles and reproducing their
dynamical behaviors in nanoscale physical phenomena. In
the MD system, physical motions of atoms and molecules
are characterized by solving Newton’s equations of motion
with the help of numerical solutions, e.g., Verlet method.
The forces imposed on the particles are calculated according
to the specified interatomic potentials or force fields. Itera-
tions between calculating the force and obtaining the motion
of particles reveal the detailed information about their
motions and trajectories for the entire process. By tracing the
trajectories of particles, MD simulations can deliver the
whole picture for dynamic evolution, obtaining the macro-
scopic characteristics for the simulation system. For EDLCs,
through specifying the interactions between ions and ion
pathways, one can obtain the distributions and motions of
electrolyte ions, reflecting their energy storage and dynamics
behavior, respectively. Due to its principle, MD simulation
provides the insights at atomic level into the mechanisms of
charge storage and ion transport, advancing our under-
standing and helping enhance the electrocapacitive perfor-
mances of EDLCs based on nanomaterials. MD is a precise
method to investigate complex phenomena and challenges
existing in nanomaterials. Besides, MD modeling can also
be applicable to many new materials (e.g., MoS2) [52–54].
However, MD simulations are still challenging to capture
the reaction or conversion process of pseudocapacitance,
owing to the lack of accurate reactive force field potentials.
This review aims at revealing the mechanisms of energy
storage and ion dynamics with the aid of MD simulations
and to critically examine the dynamics of energy storage
inside electrode materials with various structures and mor-
phology ranging from porous to nanostructures.
2 Molecular Dynamics Investigations of PorousMaterials
Porous carbons, typically activated carbon (AC) and carbide-
derived carbon (CDC), are carbon matrixes or frames con-
taining polyhedral voids, also known as ‘foam’ materials.
Their typical features are porosity as well as the existence of
numerous corrugated and curved pores. Due to the large
specific surface areas, broad ranges of operating temperature
and earth abundance, these materials have attracted attention
for utilization in EDLCs [55]. Porous carbons contain a large
fraction of amorphous carbons characterized by diverse pore
size distributions, shapes and structures.
2.1 Activated Carbon
AC exhibits a broad pore size distribution, categorized into
micropores (\ 2 nm), mesopores (2–50 nm) and macrop-
ores ([ 50 nm), with a large number of interconnected
pores [10, 56, 57]. AC is synthesized through physical or
chemical processing of carbonaceous precursors, resulting
in opening additional pores and increased porosity [58]. By
altering carbonaceous precursors and synthesis conditions,
their structures can be controlled to a certain extent, e.g.,
porosity, distribution of pore size and amount of inter-
connected pores [3, 22]. Recently, AC has been one of the
most widely used porous materials in commercial appli-
cations as electrodes of supercapacitors, due to its moderate
cost and specific surface area of 3000 m2 g-1 [10]. How-
ever, few MD simulation investigations on AC have been
carried out. The reason is that it is hard to construct a
representative numerical model for AC, attributed to its
complex structure. Coconut shell AC (CSAC) is a special
case and most of the pores are micropores, which is a
suitable range of pore size for MD simulations. To con-
struct a numerical model with random structure of CSAC, a
suitable method for numerical generation should be chosen
when considering its feasibility. Direct construction of
numerical models can only produce some regular struc-
tures, which is far from reality. Quenched MD can simulate
the process of thermal quenching to obtain an amorphous
carbon structure, but its initial approximate structure
should be known. Reverse Monte Carlo (RMC) protocol,
proposed by Mcgreevy et al. [59], can directly produce the
amorphous structure according to its experimental struc-
tural data, e.g., radial distribution function and diffraction
data, without considering its initial state. The realistic
model of CSAC was built by Pikunic et al. with the help of
RMC protocol [60]. This model is applied to generate
123
Nano-Micro Lett. (2018) 10:33 Page 3 of 23 33
several microporous carbon models featuring atom con-
figuration that are almost identical to the experimental
structural data [60]. The RMC protocol is carried out in the
following sequence: (1) Initial configuration. Randomly
create a three-dimensional array whose density is equal to
the target one. (2) Random and tiny movement of a single
particle to minimize the deviation between the obtained
structural data and the expected one. (3) Repeat the process
until the deviation oscillates around the equilibrium and the
expected structure is obtained.
The obtained structure is then used to construct a
numerical electrode/electrolyte model for MD simulations.
Through investigating the motions of molecules and ions
inside the electrode/electrolyte model, the obtained results
could reveal the effect of structural characteristics on
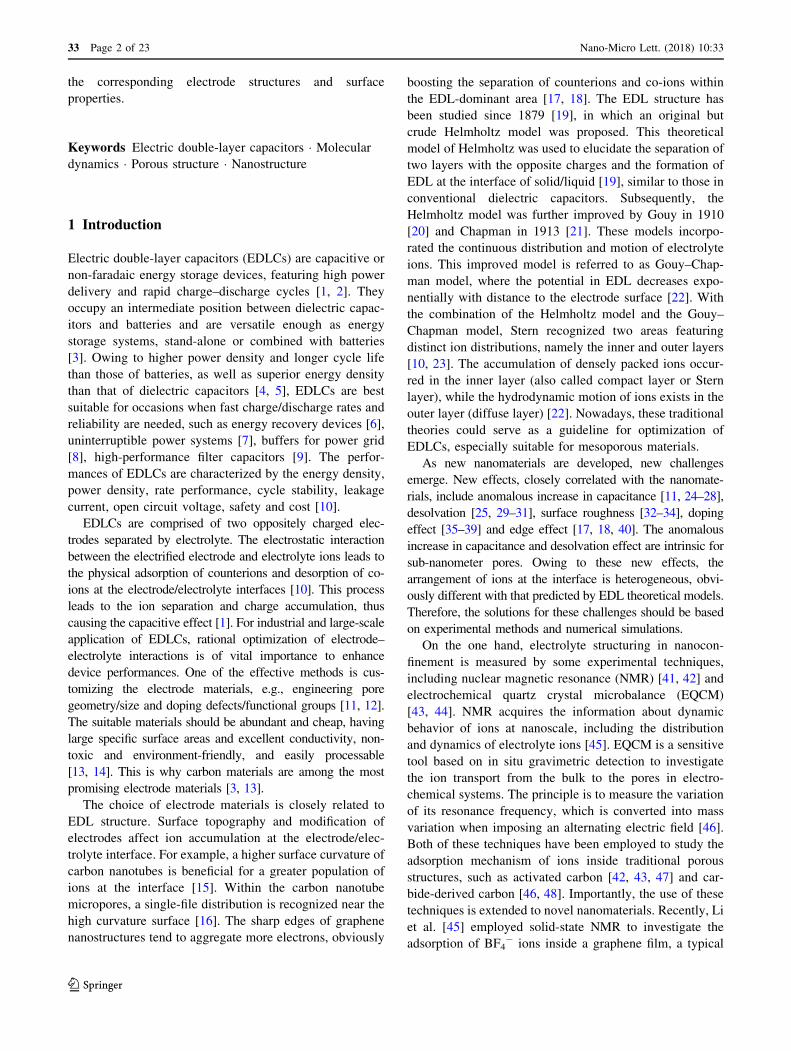
device performance. Rajput et al. [61] employed the RMC
protocol to construct a CSAC numerical model and to
compare this model with the electrode material with
homogeneous pore size. This approach helped elucidate the
key role of the heterogeneous pore size and shape, as well
as the complex morphology. The obtained CSAC model is
shown in Fig. 1a, and the pore size distributions for the two
kinds of average pore size are shown in Fig. 1b, c,
respectively. They found that the heterogeneity of pore size
distribution and existence of interconnected pores could
weaken the confinement effect originating from pore walls.
In this case, the behavior of ions inside the CSAC model is
similar to the behavior in a bulk electrolyte, in terms of the
distribution and dynamics.
2.2 Carbide-Derived Carbon
In contrast to AC, CDC is a product derived from diverse
carbides removing their atoms except carbon, which pos-
sesses a narrow and controllable pore size distribution [62].
By tuning chlorination temperature and carbide precursors,
the average pore size of CDC could reach several
nanometers, or even several Angstroms [62–64]. Using
CDC as an active electrode material, Chmiola et al. [11] in
2006 found the anomalous change of capacitance as its
average pore size became less than 1 nm. This anomalous
phenomenon challenges the traditional view that pores
whose sizes are less than the diameter of solvated elec-
trolyte ions, cannot contribute to energy storage. This
amazing finding caused the widespread concern of
researchers, as well as led to enormous studies on the
interfacial structure of EDL and the charge storage
dynamics in CDC [27, 31, 65, 66]. Since Palmer et al. [65]
employed quenched molecular dynamics to construct a
realistic model of CDC in 2010, the simulation work on
CDC has intensified, mainly focusing on energy storage
and charging rates [27, 31, 66, 67].
On the one hand, sub-nanometer pores in CDC could
enhance its capacitance. Since the discovery of the
anomalous increase in capacitance, it should be noticed
that a higher capacitance not only is ascribed to a larger
specific surface area, but also is due to the presence of sub-
nanometer pores. The introduction of sub-nanometer pores
could improve the efficiency of charge storage, mainly
ascribed to two structural factors (i.e., pore size and
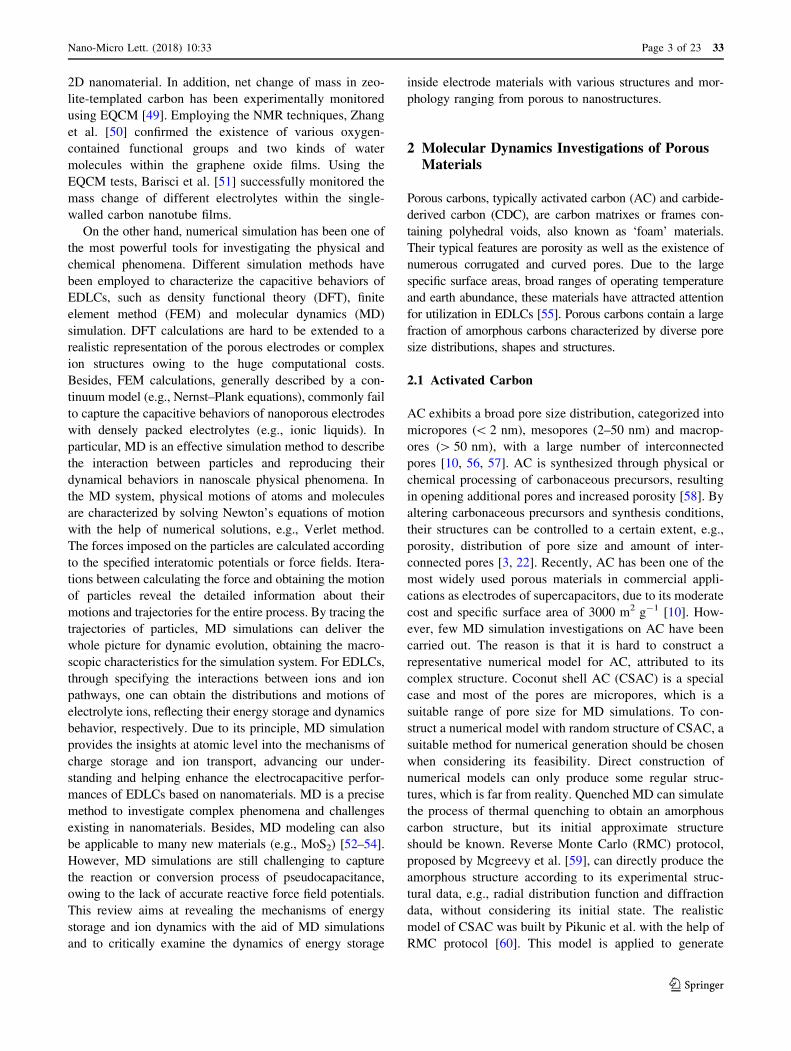
microstructure). To explain the high capacitance for CDC,
Merlet et al. [27] were first to quantitatively describe the
phenomenon of room-temperature ionic liquid (RTIL) ions
located in a numerically constructed CDC structure with
the help of MD simulations, as shown in Fig. 2a. The
capacitance value obtained from their simulation work
(125 F g-1) is coincident with the experimental results and
is higher compared to simple planar structures. They
attributed the low capacitance for planar graphite to the
emergence of several adsorbed layers with damped oscil-
lations and called this observation an overscreening effect.
The charge accumulated in the first adsorbed layer is larger
than the electrode charge, but is counterbalanced by the
next layer, leading to a relatively small fraction of adsorbed
ions utilized for energy storage [27, 68]. In contrast, the
high capacitance for CDC is due to the reduced over-
screening, as shown in Fig. 2b. There is only one adsorbed
layer, whose charge balances exactly with the electrode
charge, leading to the high storage efficiency. The
enhancement in capacitance is also reflected by the distri-
bution of charge on carbon atoms in their work, as shown
in Fig. 2c. The calculated average value of capacitance for
CDC is higher compared to graphite.
The microstructure of sub-nanometer pores can affect
the dynamics of energy storage. Merlet et al. [31] studied
the confinement effect for four types of adsorption loca-
tions on the edge, planar, hollow and pocket sites, as shown
in Fig. 2d. They found an increase in desolvation and
stored charge with the increasing degree of confinement
(DoC). The solvated ions must be partially stripped of their
hydration shells to enter the narrow pores in CDCs,
inducing more charges accommodated inside highly con-
fined pores. The charge could be more effectively stored at
the sites with higher confinement, according to Fig. 2e
[31]. However, most of the ions reside in the edge and
plane sites, while some are adsorbed into the hollow and
pocket sites, as shown in Fig. 2f. Therefore, it is important
to develop some feasible methods to drive more ions to
enter the sites with strong confinement, for example by
imposing charge on the electrode and by removing sol-
vents. The typical structures of sub-nanometer pores are
categorized into convex and concave structures, with the
higher influence of radius on capacitance for convex
structure [69]. To characterize the structure of nanoporous
carbon, Pak et al. [70] introduced the pore shape factor
123
33 Page 4 of 23 Nano-Micro Lett. (2018) 10:33
(PSF) and studied the variation of capacitance with PSF,
which agrees well with the experimental results.
On the other hand, the size and heterogeneous structure
of sub-nanometer pores in CDC exert a tremendous influ-
ence on the ion dynamics and charging rate. According to
the analysis from Ragone plot, the high energy density,
achieved when sub-nanometer pores are present, is always
accompanied with the low power density. The power
density of the systems has a close relationship with ion
transport inside the pores. Therefore, addressing the
dynamic aspects should be focused on investigating the
motion of electrolyte ions in EDLCs in the process of
charge/discharge. The relation between the ion transport
and charging rate at a macroscale could be established by
using a transmission line model and the equivalent circuit
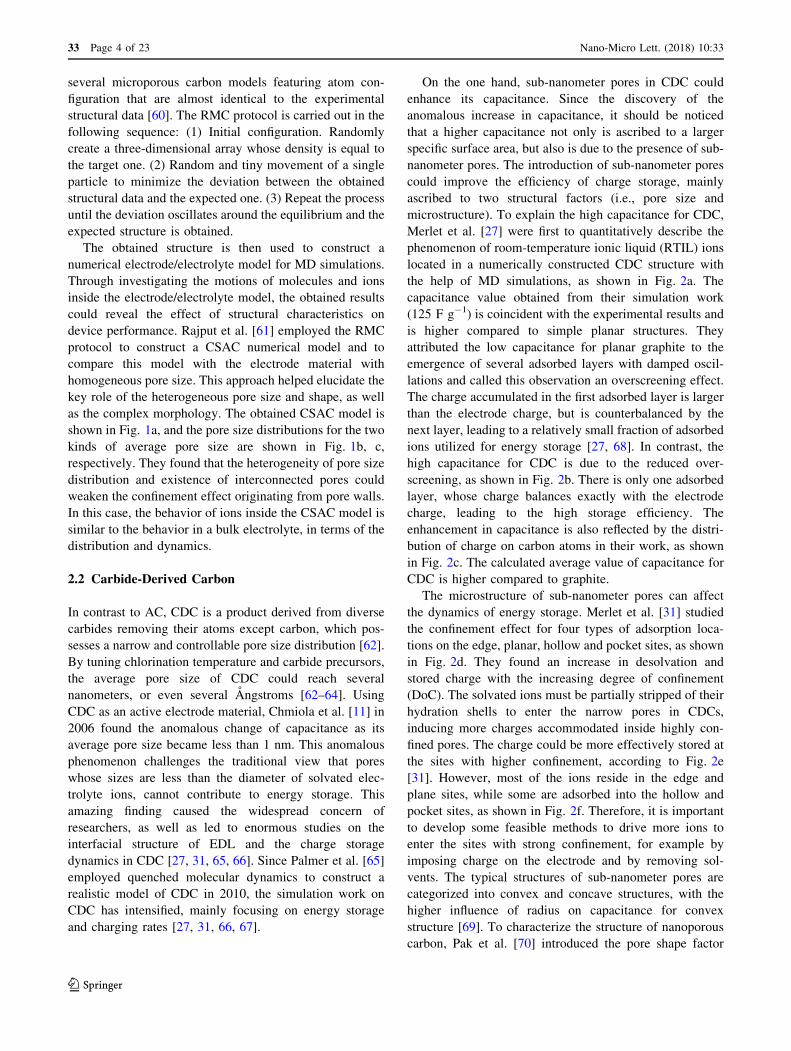
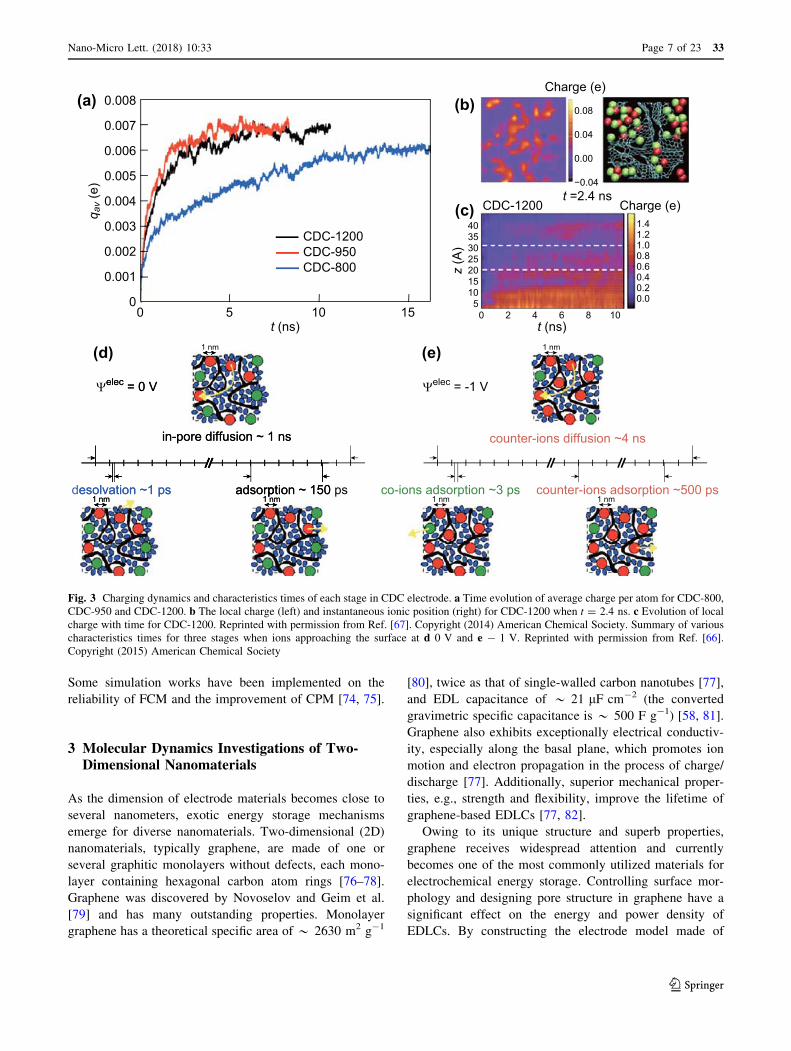
model. Based on these methods, Pean et al. [67] compared
the dynamic charging processes for three kinds of CDC
microstructures with different average pore sizes. Their
work showed that charging time decreases with the
increase in the average pore size (Fig. 3a), despite the
differences in the pore structure and connectivity. More-
over, the heterogeneous structure of CDC leads to hetero-
geneous charging. Figure 3b depicts the instantaneous and
heterogeneous distribution of charge on a local region at
2.4 ns [67]. The evolution of charge with time (Fig. 3c)
indicates the distinct charging dynamics for different layers
of CDC.
The comparison of characteristic times for different
stages is crucial for further enhancement of the power
density. In the process of ion transport into electrified
nanopores from the bulk, there could be three typical
stages, including desolvation, diffusion and electrosorp-
tion. Pean et al. [66] investigated the time hierarchy for the
three stages when the electrode potentials are 0 and -1 V.
For the case of a neutral electrode (Fig. 3d), their results
indicated that the time for desolvation is much shorter than
the time for the adsorption. On the other hand, the time for
adsorption is much shorter than the time for in-pore dif-
fusion. Comparing the hierarchies for the neutral electrode
(Fig. 3d) and the electrified electrode (Fig. 3e), all three
characteristic times for the neutral electrode appear to be
shorter than the case of electrified electrode.
Another CDC numerical model is platelet model con-
sisted by numerous carbon platelets with a random distri-
bution [71]. It has a high computational efficiency, but is
less realistic compared to quenched MD. One-electrode
model can help minimize the computational cost, with few
differences with two-electrode model in simulation results
[72]. To validate the methodology, Merlet et al. [73]
compared two different methods for mimicking the polar-
ization of electrode, i.e., fixed charge method (FCM) and
constant potential method (CPM), with the latter being a
more realistic method. This confirms the important role of
CPM, although the cost of computational resources is high.
2
1.5
1
0.5
0
(b)
(a)
0.50Pore size (nm)
Arb
itrar
y un
its
1 1.5 2
2
1.5
1
0.5
0
(c)
0.50Pore size (nm)
Arb
itrar
y un
its1 1.5 2
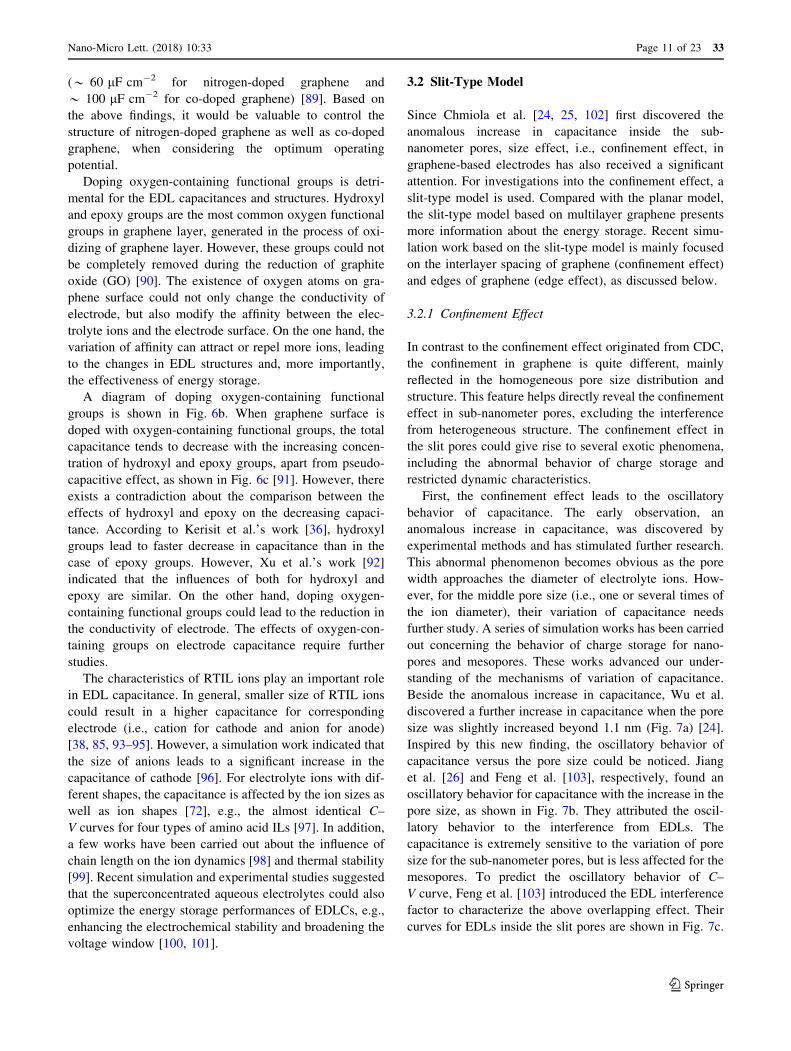
Fig. 1 a CSAC model and the pore size distributions for average pore size of b 0.75 nm and c 1.23 nm (gray: carbon atoms, red: cations and
green: anions). Reprinted with permission from Ref. [61]. Copyright (2014) American Chemical Society. (Color figure online)
123
Nano-Micro Lett. (2018) 10:33 Page 5 of 23 33

1.6
0.8
0.0
-0.8
-1.6
(e)
15
Edge Plane
ACN-(BMI)(PF6) =0.0 VΔΨ
Hollow Pocket
0Degree of confinement (%)
Cou
nter
-cha
rge
per i
on
30 45 75 9060
Around PF6-
Around BMI+
2.0
1.5
1.0
0.5
0
(c)
0-0.02Capacitance per atom (eV-1)
0.02
0.0040.011
0.04
CDC-1200CDC-950Graphite
5
4
3
2
1
0
(f)
15
Edge Plane
(BMI)(PF6) =0.0 VΔΨ
N+= 82N- = 82
N+= 66N- = 115
N+= 104N- = 55
Hollow Pocket
edge
(d)
(a)
tekcopwollohenalp
0Degree of confinement (%)
Frac
tion
of io
ns (%
)
Frac
tion
of c
arbo
n at
oms
(%)
30 45 75 9060
PF6-
BMI+
0.016
=0 VΨ =0.5 VΨ=-0.5 VΨ
3
2
1
0
(b)
0.600.56Distance to the surface (nm)
0.64 0.68 0.72 0.76 0.80 0.84
CDC-1200Graphite
()
(u)/
du0z
q∫
σρ
+0.5 V-0.5 V
-0.5 V+0.5 V
Fig. 2 The energy storage inside CDC electrode. a The snapshot of CDC model and quantitative picture of ions adsorbed into the model under
different potentials (blue: carbon atoms, red: BMI? ions and green: PF�6 ions). b Integral of charge density over the distance to surface for CDC-
1200 and graphite. c The distributions of capacitance per atom for three kinds of carbon material, and the average value is indicated by the arrow.
Reprinted with permission from Ref. [27]. Copyright (2012) Nature Publishing Group. d Four typical structures of adsorption location (edge,
plane, hollow and pocket) with the different DoC. The variation of e fraction of ions and f countercharge per ion with DoC. Reprinted with
permission from Ref. [31]. Copyright (2013) Nature Publishing Group. (Color figure online)
123
33 Page 6 of 23 Nano-Micro Lett. (2018) 10:33
Some simulation works have been implemented on the
reliability of FCM and the improvement of CPM [74, 75].
3 Molecular Dynamics Investigations of Two-Dimensional Nanomaterials
As the dimension of electrode materials becomes close to
several nanometers, exotic energy storage mechanisms
emerge for diverse nanomaterials. Two-dimensional (2D)
nanomaterials, typically graphene, are made of one or
several graphitic monolayers without defects, each mono-
layer containing hexagonal carbon atom rings [76–78].
Graphene was discovered by Novoselov and Geim et al.
[79] and has many outstanding properties. Monolayer
graphene has a theoretical specific area of * 2630 m2 g-1
[80], twice as that of single-walled carbon nanotubes [77],
and EDL capacitance of * 21 lF cm-2 (the converted
gravimetric specific capacitance is * 500 F g-1) [58, 81].
Graphene also exhibits exceptionally electrical conductiv-
ity, especially along the basal plane, which promotes ion
motion and electron propagation in the process of charge/
discharge [77]. Additionally, superior mechanical proper-
ties, e.g., strength and flexibility, improve the lifetime of
graphene-based EDLCs [77, 82].
Owing to its unique structure and superb properties,
graphene receives widespread attention and currently
becomes one of the most commonly utilized materials for
electrochemical energy storage. Controlling surface mor-
phology and designing pore structure in graphene have a
significant effect on the energy and power density of
EDLCs. By constructing the electrode model made of
adsorption ~ 150 ps co-ions adsorption ~3 ps counter-ions adsorption ~500 ps
counter-ions diffusion ~4 nsin-pore diffusion ~ 1 ns
(a) (b)
(c)
elec = 0 V
CDC-1200
CDC-1200 Charge (e)
Charge (e)
0 5 10t (ns)
40353025201510
50 2 4 6 8 10
1.41.21.00.80.60.40.20.0
0.08
0.04
0.00
−0.04t =2.4 ns
z (A
)
t (ns)
q av (
e)
15
0.008
0.007
0.006
0.005
0.004
0.003
0.002
0.001
0
Ψelec = -1 V
(e)
1 nmdesolvation ~1 ps
1 nm
1 nm 1 nm
1 nm 1 nm
CDC-950CDC-800
adsorption ~ 150
in-pore diffusion ~ 1 ns
(d)
Ψelec = 0 V
nmesolvation ~1 ps
1 1 nmp
Fig. 3 Charging dynamics and characteristics times of each stage in CDC electrode. a Time evolution of average charge per atom for CDC-800,
CDC-950 and CDC-1200. b The local charge (left) and instantaneous ionic position (right) for CDC-1200 when t = 2.4 ns. c Evolution of local
charge with time for CDC-1200. Reprinted with permission from Ref. [67]. Copyright (2014) American Chemical Society. Summary of various
characteristics times for three stages when ions approaching the surface at d 0 V and e - 1 V. Reprinted with permission from Ref. [66].
Copyright (2015) American Chemical Society
123
Nano-Micro Lett. (2018) 10:33 Page 7 of 23 33
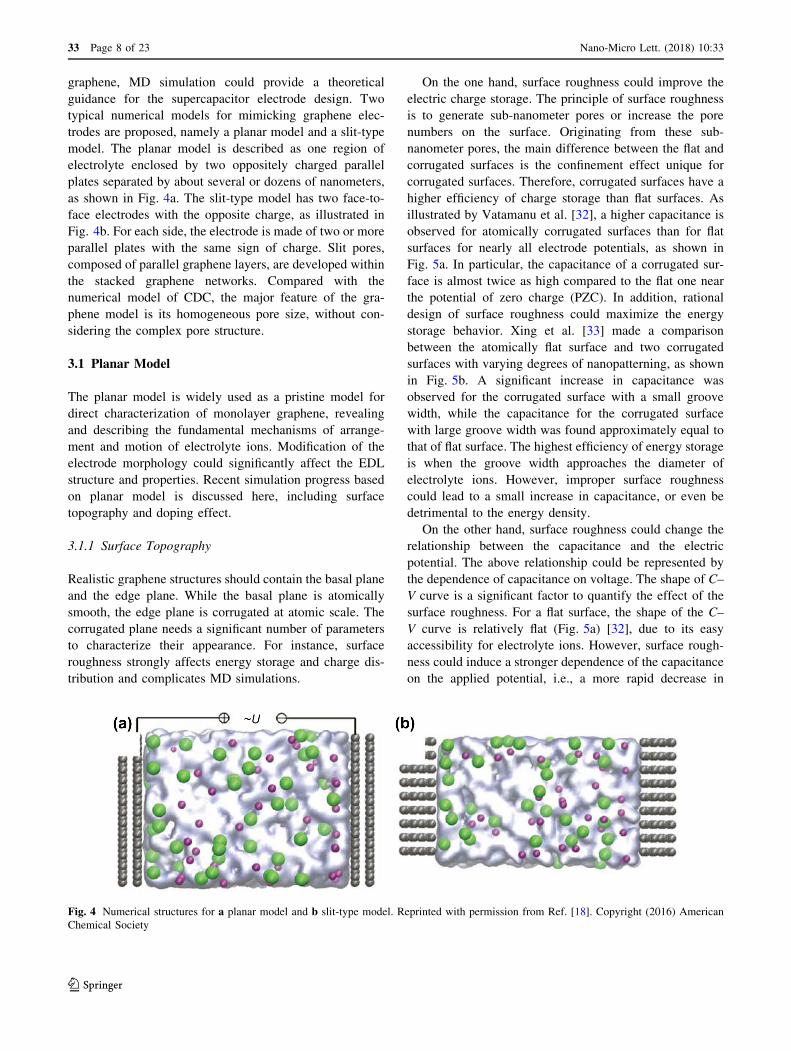
graphene, MD simulation could provide a theoretical
guidance for the supercapacitor electrode design. Two
typical numerical models for mimicking graphene elec-
trodes are proposed, namely a planar model and a slit-type
model. The planar model is described as one region of
electrolyte enclosed by two oppositely charged parallel
plates separated by about several or dozens of nanometers,
as shown in Fig. 4a. The slit-type model has two face-to-
face electrodes with the opposite charge, as illustrated in
Fig. 4b. For each side, the electrode is made of two or more
parallel plates with the same sign of charge. Slit pores,
composed of parallel graphene layers, are developed within
the stacked graphene networks. Compared with the
numerical model of CDC, the major feature of the gra-
phene model is its homogeneous pore size, without con-
sidering the complex pore structure.
3.1 Planar Model
The planar model is widely used as a pristine model for
direct characterization of monolayer graphene, revealing
and describing the fundamental mechanisms of arrange-
ment and motion of electrolyte ions. Modification of the
electrode morphology could significantly affect the EDL
structure and properties. Recent simulation progress based
on planar model is discussed here, including surface
topography and doping effect.
3.1.1 Surface Topography
Realistic graphene structures should contain the basal plane
and the edge plane. While the basal plane is atomically
smooth, the edge plane is corrugated at atomic scale. The
corrugated plane needs a significant number of parameters
to characterize their appearance. For instance, surface
roughness strongly affects energy storage and charge dis-
tribution and complicates MD simulations.
On the one hand, surface roughness could improve the
electric charge storage. The principle of surface roughness
is to generate sub-nanometer pores or increase the pore
numbers on the surface. Originating from these sub-
nanometer pores, the main difference between the flat and
corrugated surfaces is the confinement effect unique for
corrugated surfaces. Therefore, corrugated surfaces have a
higher efficiency of charge storage than flat surfaces. As
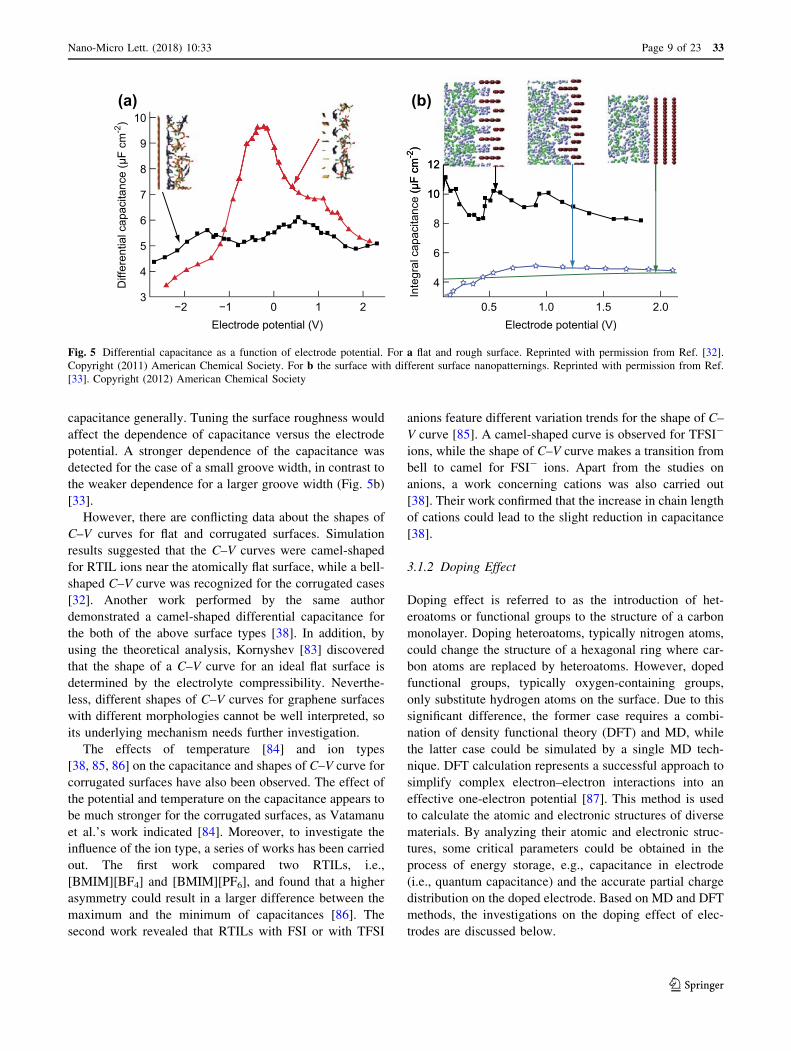
illustrated by Vatamanu et al. [32], a higher capacitance is
observed for atomically corrugated surfaces than for flat
surfaces for nearly all electrode potentials, as shown in
Fig. 5a. In particular, the capacitance of a corrugated sur-
face is almost twice as high compared to the flat one near
the potential of zero charge (PZC). In addition, rational
design of surface roughness could maximize the energy
storage behavior. Xing et al. [33] made a comparison
between the atomically flat surface and two corrugated
surfaces with varying degrees of nanopatterning, as shown
in Fig. 5b. A significant increase in capacitance was
observed for the corrugated surface with a small groove
width, while the capacitance for the corrugated surface
with large groove width was found approximately equal to
that of flat surface. The highest efficiency of energy storage
is when the groove width approaches the diameter of
electrolyte ions. However, improper surface roughness
could lead to a small increase in capacitance, or even be
detrimental to the energy density.
On the other hand, surface roughness could change the
relationship between the capacitance and the electric
potential. The above relationship could be represented by
the dependence of capacitance on voltage. The shape of C–
V curve is a significant factor to quantify the effect of the
surface roughness. For a flat surface, the shape of the C–
V curve is relatively flat (Fig. 5a) [32], due to its easy
accessibility for electrolyte ions. However, surface rough-
ness could induce a stronger dependence of the capacitance
on the applied potential, i.e., a more rapid decrease in
Fig. 4 Numerical structures for a planar model and b slit-type model. Reprinted with permission from Ref. [18]. Copyright (2016) American
Chemical Society
123
33 Page 8 of 23 Nano-Micro Lett. (2018) 10:33
capacitance generally. Tuning the surface roughness would
affect the dependence of capacitance versus the electrode
potential. A stronger dependence of the capacitance was
detected for the case of a small groove width, in contrast to
the weaker dependence for a larger groove width (Fig. 5b)
[33].
However, there are conflicting data about the shapes of
C–V curves for flat and corrugated surfaces. Simulation
results suggested that the C–V curves were camel-shaped
for RTIL ions near the atomically flat surface, while a bell-
shaped C–V curve was recognized for the corrugated cases
[32]. Another work performed by the same author
demonstrated a camel-shaped differential capacitance for
the both of the above surface types [38]. In addition, by
using the theoretical analysis, Kornyshev [83] discovered
that the shape of a C–V curve for an ideal flat surface is
determined by the electrolyte compressibility. Neverthe-
less, different shapes of C–V curves for graphene surfaces
with different morphologies cannot be well interpreted, so
its underlying mechanism needs further investigation.
The effects of temperature [84] and ion types
[38, 85, 86] on the capacitance and shapes of C–V curve for
corrugated surfaces have also been observed. The effect of
the potential and temperature on the capacitance appears to
be much stronger for the corrugated surfaces, as Vatamanu
et al.’s work indicated [84]. Moreover, to investigate the
influence of the ion type, a series of works has been carried
out. The first work compared two RTILs, i.e.,
[BMIM][BF4] and [BMIM][PF6], and found that a higher
asymmetry could result in a larger difference between the
maximum and the minimum of capacitances [86]. The
second work revealed that RTILs with FSI or with TFSI
anions feature different variation trends for the shape of C–
V curve [85]. A camel-shaped curve is observed for TFSI-
ions, while the shape of C–V curve makes a transition from
bell to camel for FSI- ions. Apart from the studies on
anions, a work concerning cations was also carried out
[38]. Their work confirmed that the increase in chain length
of cations could lead to the slight reduction in capacitance
[38].
3.1.2 Doping Effect
Doping effect is referred to as the introduction of het-
eroatoms or functional groups to the structure of a carbon
monolayer. Doping heteroatoms, typically nitrogen atoms,
could change the structure of a hexagonal ring where car-
bon atoms are replaced by heteroatoms. However, doped
functional groups, typically oxygen-containing groups,
only substitute hydrogen atoms on the surface. Due to this
significant difference, the former case requires a combi-
nation of density functional theory (DFT) and MD, while
the latter case could be simulated by a single MD tech-
nique. DFT calculation represents a successful approach to
simplify complex electron–electron interactions into an
effective one-electron potential [87]. This method is used
to calculate the atomic and electronic structures of diverse
materials. By analyzing their atomic and electronic struc-
tures, some critical parameters could be obtained in the
process of energy storage, e.g., capacitance in electrode
(i.e., quantum capacitance) and the accurate partial charge
distribution on the doped electrode. Based on MD and DFT
methods, the investigations on the doping effect of elec-
trodes are discussed below.
Electrode potential (V)
Diff
eren
tial c
apac
itanc
e (μ
F cm
-2)
−2
(a)
−1 0 1 2
10
9
8
7
6
5
4
3
Electrode potential (V)
Inte
gral
cap
acita
nce
(μF
cm-2
)
0.5
(b)
1.0 1.5 2.0
12
10
8
6
4
(μF
cm-2
)
12
10
Fig. 5 Differential capacitance as a function of electrode potential. For a flat and rough surface. Reprinted with permission from Ref. [32].
Copyright (2011) American Chemical Society. For b the surface with different surface nanopatternings. Reprinted with permission from Ref.
[33]. Copyright (2012) American Chemical Society
123
Nano-Micro Lett. (2018) 10:33 Page 9 of 23 33
Doping nitrogen atoms could increase the quantum
capacitance and overcome the limitations of total capaci-
tance at PZC. For the pristine graphene, its quantum
capacitance is nearly zero at PZC, leading to the extremely
low value of total capacitance, according to the series
connection of EDL capacitance and quantum capacitance.
To avoid this limitation, one of the feasible methods is
doping with nitrogen atoms. This method can increase the
quantum capacitance, by changing the electrode structure.
The experimental result shows a substantial increase in
capacitance for nitrogen-doped graphene, whose specific
capacitance is about 280 F g-1 (* 70 F g-1 for pristine
graphene) [39].
For the sake of analyzing the effect of doping nitrogen
atoms at atomic scale, a hybrid method mentioned in the
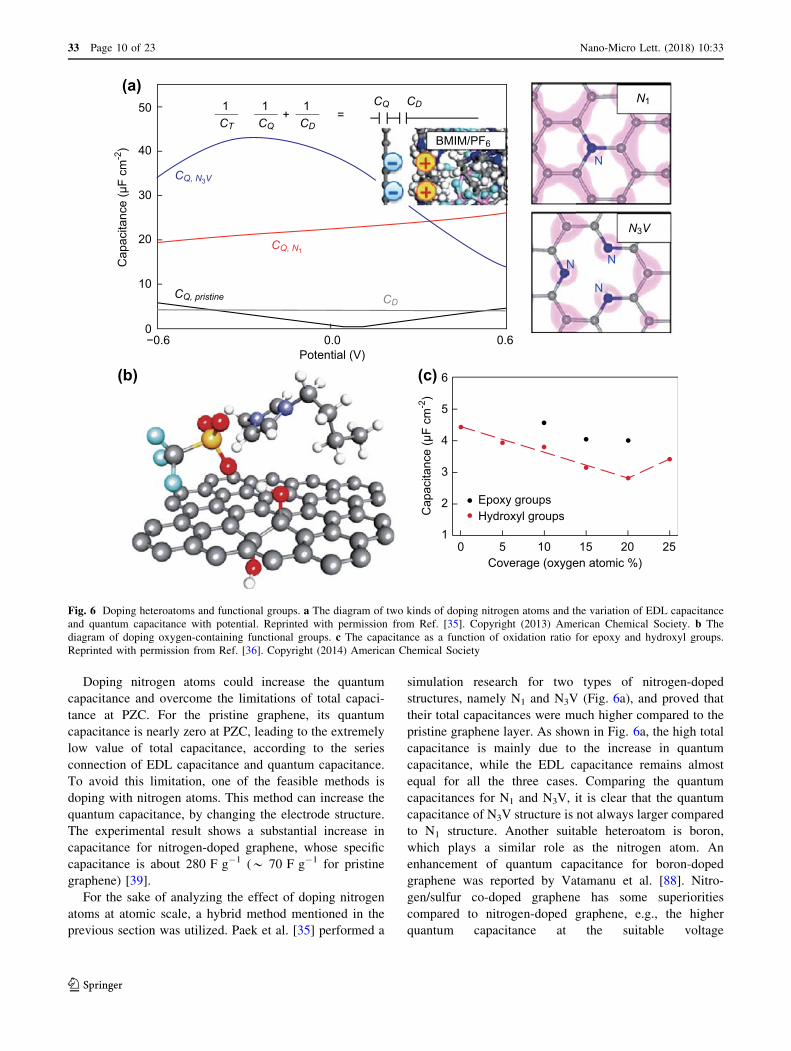
previous section was utilized. Paek et al. [35] performed a
simulation research for two types of nitrogen-doped
structures, namely N1 and N3V (Fig. 6a), and proved that
their total capacitances were much higher compared to the
pristine graphene layer. As shown in Fig. 6a, the high total
capacitance is mainly due to the increase in quantum
capacitance, while the EDL capacitance remains almost
equal for all the three cases. Comparing the quantum
capacitances for N1 and N3V, it is clear that the quantum
capacitance of N3V structure is not always larger compared
to N1 structure. Another suitable heteroatom is boron,
which plays a similar role as the nitrogen atom. An
enhancement of quantum capacitance for boron-doped
graphene was reported by Vatamanu et al. [88]. Nitro-
gen/sulfur co-doped graphene has some superiorities
compared to nitrogen-doped graphene, e.g., the higher
quantum capacitance at the suitable voltage
Potential (V)
BMIM/PF6
N3V
N1CD
CD
CQ
CQ, N1
CQ, N3V
N
NN
NCQ, pristine
Coverage (oxygen atomic %)0 5 10 15 20 25
Epoxy groups
(c)
(a)
6
5
4
3
2
1Hydroxyl groupsC
apac
itanc
e (μ
F cm
-2)
−0.6 0.0
50
40
30
20
10
00.6
Cap
acita
nce
(μF
cm-2
)1
+ =CD
1CQ
1CT
(b)
Fig. 6 Doping heteroatoms and functional groups. a The diagram of two kinds of doping nitrogen atoms and the variation of EDL capacitance
and quantum capacitance with potential. Reprinted with permission from Ref. [35]. Copyright (2013) American Chemical Society. b The
diagram of doping oxygen-containing functional groups. c The capacitance as a function of oxidation ratio for epoxy and hydroxyl groups.
Reprinted with permission from Ref. [36]. Copyright (2014) American Chemical Society
123
33 Page 10 of 23 Nano-Micro Lett. (2018) 10:33
(* 60 lF cm-2 for nitrogen-doped graphene and
* 100 lF cm-2 for co-doped graphene) [89]. Based on
the above findings, it would be valuable to control the
structure of nitrogen-doped graphene as well as co-doped
graphene, when considering the optimum operating
potential.
Doping oxygen-containing functional groups is detri-
mental for the EDL capacitances and structures. Hydroxyl
and epoxy groups are the most common oxygen functional
groups in graphene layer, generated in the process of oxi-
dizing of graphene layer. However, these groups could not
be completely removed during the reduction of graphite
oxide (GO) [90]. The existence of oxygen atoms on gra-
phene surface could not only change the conductivity of
electrode, but also modify the affinity between the elec-
trolyte ions and the electrode surface. On the one hand, the
variation of affinity can attract or repel more ions, leading
to the changes in EDL structures and, more importantly,
the effectiveness of energy storage.
A diagram of doping oxygen-containing functional
groups is shown in Fig. 6b. When graphene surface is
doped with oxygen-containing functional groups, the total
capacitance tends to decrease with the increasing concen-
tration of hydroxyl and epoxy groups, apart from pseudo-
capacitive effect, as shown in Fig. 6c [91]. However, there
exists a contradiction about the comparison between the
effects of hydroxyl and epoxy on the decreasing capaci-
tance. According to Kerisit et al.’s work [36], hydroxyl
groups lead to faster decrease in capacitance than in the
case of epoxy groups. However, Xu et al.’s work [92]
indicated that the influences of both for hydroxyl and
epoxy are similar. On the other hand, doping oxygen-
containing functional groups could lead to the reduction in
the conductivity of electrode. The effects of oxygen-con-
taining groups on electrode capacitance require further
studies.
The characteristics of RTIL ions play an important role
in EDL capacitance. In general, smaller size of RTIL ions
could result in a higher capacitance for corresponding
electrode (i.e., cation for cathode and anion for anode)
[38, 85, 93–95]. However, a simulation work indicated that
the size of anions leads to a significant increase in the
capacitance of cathode [96]. For electrolyte ions with dif-
ferent shapes, the capacitance is affected by the ion sizes as
well as ion shapes [72], e.g., the almost identical C–
V curves for four types of amino acid ILs [97]. In addition,
a few works have been carried out about the influence of
chain length on the ion dynamics [98] and thermal stability
[99]. Recent simulation and experimental studies suggested
that the superconcentrated aqueous electrolytes could also
optimize the energy storage performances of EDLCs, e.g.,
enhancing the electrochemical stability and broadening the
voltage window [100, 101].
3.2 Slit-Type Model
Since Chmiola et al. [24, 25, 102] first discovered the
anomalous increase in capacitance inside the sub-
nanometer pores, size effect, i.e., confinement effect, in
graphene-based electrodes has also received a significant
attention. For investigations into the confinement effect, a
slit-type model is used. Compared with the planar model,
the slit-type model based on multilayer graphene presents
more information about the energy storage. Recent simu-
lation work based on the slit-type model is mainly focused
on the interlayer spacing of graphene (confinement effect)
and edges of graphene (edge effect), as discussed below.
3.2.1 Confinement Effect
In contrast to the confinement effect originated from CDC,
the confinement in graphene is quite different, mainly
reflected in the homogeneous pore size distribution and
structure. This feature helps directly reveal the confinement
effect in sub-nanometer pores, excluding the interference
from heterogeneous structure. The confinement effect in
the slit pores could give rise to several exotic phenomena,
including the abnormal behavior of charge storage and
restricted dynamic characteristics.
First, the confinement effect leads to the oscillatory
behavior of capacitance. The early observation, an
anomalous increase in capacitance, was discovered by
experimental methods and has stimulated further research.
This abnormal phenomenon becomes obvious as the pore
width approaches the diameter of electrolyte ions. How-
ever, for the middle pore size (i.e., one or several times of
the ion diameter), their variation of capacitance needs
further study. A series of simulation works has been carried
out concerning the behavior of charge storage for nano-
pores and mesopores. These works advanced our under-
standing of the mechanisms of variation of capacitance.
Beside the anomalous increase in capacitance, Wu et al.
discovered a further increase in capacitance when the pore
size was slightly increased beyond 1.1 nm (Fig. 7a) [24].
Inspired by this new finding, the oscillatory behavior of
capacitance versus the pore size could be noticed. Jiang
et al. [26] and Feng et al. [103], respectively, found an
oscillatory behavior for capacitance with the increase in the
pore size, as shown in Fig. 7b. They attributed the oscil-
latory behavior to the interference from EDLs. The
capacitance is extremely sensitive to the variation of pore
size for the sub-nanometer pores, but is less affected for the
mesopores. To predict the oscillatory behavior of C–
V curve, Feng et al. [103] introduced the EDL interference
factor to characterize the above overlapping effect. Their
curves for EDLs inside the slit pores are shown in Fig. 7c.
123
Nano-Micro Lett. (2018) 10:33 Page 11 of 23 33
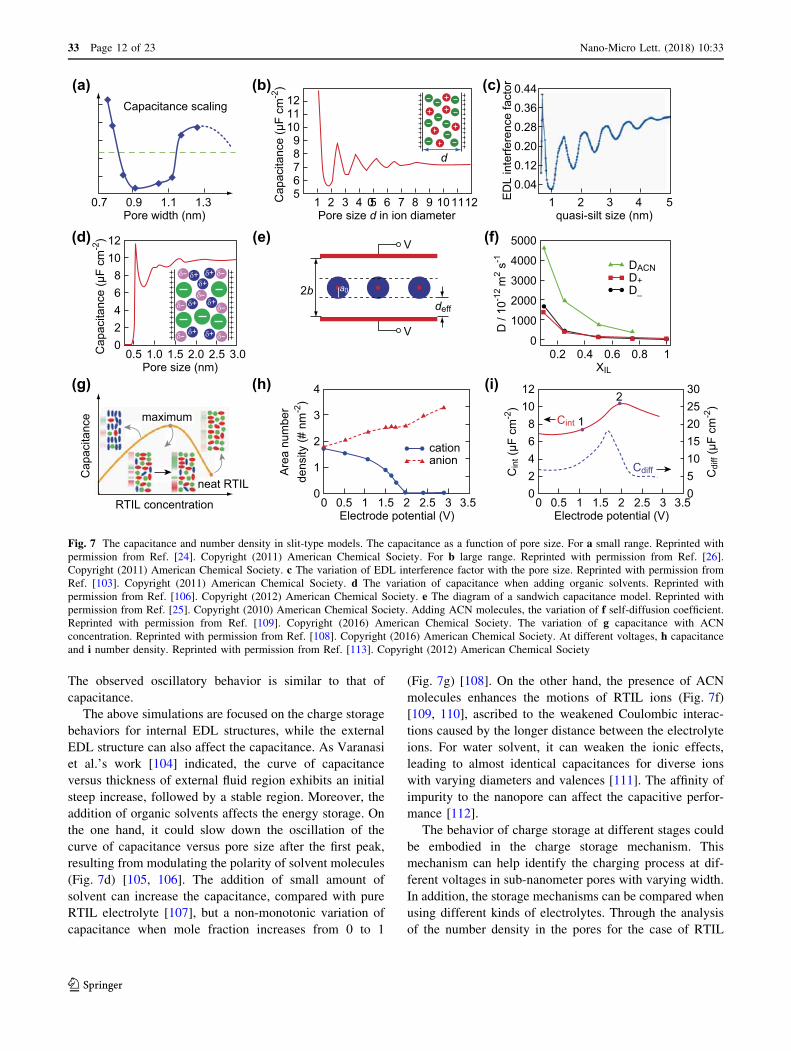
The observed oscillatory behavior is similar to that of
capacitance.
The above simulations are focused on the charge storage
behaviors for internal EDL structures, while the external
EDL structure can also affect the capacitance. As Varanasi
et al.’s work [104] indicated, the curve of capacitance
versus thickness of external fluid region exhibits an initial
steep increase, followed by a stable region. Moreover, the
addition of organic solvents affects the energy storage. On
the one hand, it could slow down the oscillation of the
curve of capacitance versus pore size after the first peak,
resulting from modulating the polarity of solvent molecules
(Fig. 7d) [105, 106]. The addition of small amount of
solvent can increase the capacitance, compared with pure
RTIL electrolyte [107], but a non-monotonic variation of
capacitance when mole fraction increases from 0 to 1
(Fig. 7g) [108]. On the other hand, the presence of ACN
molecules enhances the motions of RTIL ions (Fig. 7f)
[109, 110], ascribed to the weakened Coulombic interac-
tions caused by the longer distance between the electrolyte
ions. For water solvent, it can weaken the ionic effects,
leading to almost identical capacitances for diverse ions
with varying diameters and valences [111]. The affinity of
impurity to the nanopore can affect the capacitive perfor-
mance [112].
The behavior of charge storage at different stages could
be embodied in the charge storage mechanism. This
mechanism can help identify the charging process at dif-
ferent voltages in sub-nanometer pores with varying width.
In addition, the storage mechanisms can be compared when
using different kinds of electrolytes. Through the analysis
of the number density in the pores for the case of RTIL
(c)
quasi-silt size (nm)
ED
L in
terfe
renc
e fa
ctor
1
0.440.360.280.200.120.04
2 3 4 5
(i)
Electrode potential (V)0 5.0
121086420
302520151050
1 1.5 2 2.5 3 3.5
1
2
(a)
Pore width (nm)0.7 0.9 1.1 1.3
(b)
Pore size d in ion diameter
Cap
acita
nce
(μF
cm-2
)
Capacitance scaling
2 0
121110
98765
4 6 8 10
d
111 3 5 7 9 12
(d) (e)
Pore size (nm)
Cap
acita
nce
(μF
cm-2
)
Cin
t (μF
cm
-2)
Cdi
ff (μ
F cm
-2)
Cdiff
Cint
121086420
0.5 1.0 1.5 2.0 2.5 3.0
(g)
RTIL concentration
neat RTIL
maximum
Cap
acita
nce
δ+ δ+δ+
δ+ δ+
δ+ δ+
δ-
δ-δ-
δ-
δ- δ-
δ-
(f)
XIL
D /
10-1
2 m
2 s-1
5000
4000
3000
2000
1000
00.2 0.4 0.6 0.8 1
V
V
deff
2b a0D+D_
DACN
(h)
Electrode potential (V)0 5.0
4
3
2
1
01 1.5 2 2.5 3
cationanion
3.5
Are
a nu
mbe
rde
nsity
(# n
m-2
)
Fig. 7 The capacitance and number density in slit-type models. The capacitance as a function of pore size. For a small range. Reprinted with
permission from Ref. [24]. Copyright (2011) American Chemical Society. For b large range. Reprinted with permission from Ref. [26].
Copyright (2011) American Chemical Society. c The variation of EDL interference factor with the pore size. Reprinted with permission from
Ref. [103]. Copyright (2011) American Chemical Society. d The variation of capacitance when adding organic solvents. Reprinted with
permission from Ref. [106]. Copyright (2012) American Chemical Society. e The diagram of a sandwich capacitance model. Reprinted with
permission from Ref. [25]. Copyright (2010) American Chemical Society. Adding ACN molecules, the variation of f self-diffusion coefficient.
Reprinted with permission from Ref. [109]. Copyright (2016) American Chemical Society. The variation of g capacitance with ACN
concentration. Reprinted with permission from Ref. [108]. Copyright (2016) American Chemical Society. At different voltages, h capacitance
and i number density. Reprinted with permission from Ref. [113]. Copyright (2012) American Chemical Society
123
33 Page 12 of 23 Nano-Micro Lett. (2018) 10:33

(Fig. 7h), Wu et al. [113] found three distinct charging
stages, i.e., ion exchange for low voltage, co-ion exclusion
for medium voltage and counterion adsorption for high
voltage. By analyzing the capacitance curve, the damping
of capacitance at high voltages is detected (Fig. 7i). This
damping could be ascribed to the saturation of ions in the
sub-nanometer pores [114].
With MD investigations advancing our knowledge into
the EDL microstructures and mechanism of energy storage,
new theoretical models are proposed for sub-nanometer
pores. Feng et al. found that the ions could be located at the
center of pores and form a single monolayer when the pore
sizes range from 10 to 14.7 A [25]. A new theoretical
model was developed to describe the charge storage
behavior for sub-nanometer pores, which agrees well with
the experimental results. According to its principle, the slit-
type model with single monolayer of ions can be consid-
ered as two dielectric capacitors in parallel, as illustrated in
Fig. 7e.
Second, the confinement effect can promote desolvation
of hydrated ions. When the solvated ions enter sub-
nanometer pores, their hydration shells are partially or
completely stripped, reducing their effective diameter and
inducing more charges accommodated inside a single
highly confined pore with a fixed volume. Therefore, the
desolvation of solvated ions has a close relationship with
the anomalous increase in capacitance and can be greatly
enhanced by the confinement. The desolvation phe-
nomenon can be quantified by two factors, namely its
hydration number and hydration structure. Analyzing the
total hydration number, Kalluri et al. [115] discovered that
narrowing the pore could induce a lower hydration number
when the pore sizes range from 0.9 to 1.6 nm. Addition-
ally, local hydration number characterizes the local degree
of partial desolvation. For the ions with different distances
to the electrode surface, the confinement effect caused by
the walls is quite different, and the ions in the pore center
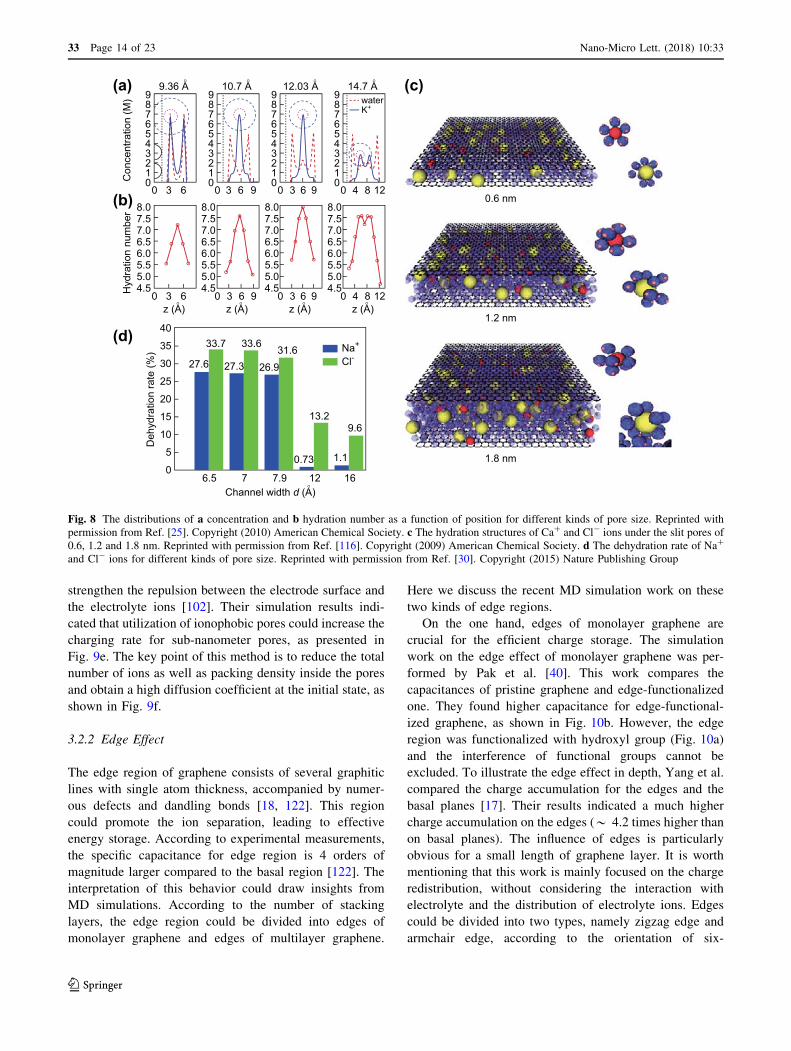
are less affected. Feng et al.’s work [25] demonstrated that
the hydration number of K? ions reaches a maximum at the
position of pore center and decreases monotonously when
the hydrated ions approach the electrode surface, when the
pore sizes vary from 9.36 to 14.7 A (Fig. 8b). According to
these results, it is reasonable to infer that a larger pore is
accompanied by a larger region with fully hydrated ions.
The hydration structure of partially dehydrated ions
becomes planar inside the sub-nanometer pore. Ohba et al.
[116] found a pentagonal hydration structure for Ca? ions
under the nanoconfinement, as shown in Fig. 8c. In addi-
tion to the planarization of hydrated ions, we can also
observe the reduction in hydration numbers. Within the
sub-nanometer pores, partial hydration shells of ions are
stripped owing to the confinement and strong electric
fields. Meanwhile, the limit of desolvation could be noted.
In other words, the water molecules surrounding the ions
cannot be fully removed. The planarized water molecules
along the surface are free from confinement. This phe-
nomenon can be confirmed by the constant dehydration
rate of * 33.7%, as presented in Fig. 8d [30]. The value is
precisely equal to the confined degrees of freedom divided
by the total degrees.
Third, the confinement effect could weaken the dynamic
characteristics of electrolyte ions. The ions in different
layers suffer from different degrees of confinement, leading
to distinct local dynamical behaviors with the varying
distance from the ions to the wall. The dynamics of RTIL
ions are weakened as they approach the walls of slit pores
[117]. To demonstrate the effect of confinement on the ion
dynamics, the overall dynamical behavior is introduced and
compared for slit pores with different pore widths. The ions
are restricted under the confinement, which can be
explained by the local dynamics in different areas. With the
decrease in the pore size, the region with strong local
dynamics disappears preferentially, which is detrimental to
the overall dynamics. A simulation work indicates that the
overall dynamics of confined ions become much weakened
when the confinement effect is strengthened (Fig. 9a)
[117]. This observation is consistent with Salemi et al.’s
work [118]. However, one simulation work indicated
intensified ion dynamics with the decreasing pore size for
aqueous solution [119]. It is probably attributed to some
differences between the aqueous solution and the ionic
liquid, including viscosity, compactness of ions, the pres-
ence of solvent molecules. Moreover, higher temperature is
beneficial for the improvement in the dynamical behavior
of the cations and anions inside the slit pores [119–121].
Weaker dynamics of ions could lead to a lower charging
rate and longer charging time for slit pores. Kondrat et al.
[102] made a comparison between a wider pore (0.66 nm)
and a narrower pore (0.53 nm) and found that charging of
the wider pore is faster than the narrower pore, as presented
in Fig. 9b. The distinct charging rates for the wider and
narrower pores are due to the different charging modes. For
a narrower pore, more ions are adsorbed, while there are
very few pathways for co-ions leaving the pore (mainly the
process of counterion adsorption), leading to the overfilling
phenomenon, as shown in Fig. 9c. The overfilling makes it
easier for counterions and co-ions to leave the pore, as
shown in Fig. 9d. However, the charging behavior is
entirely different for a wider pore, where the major process
is ion exchange, evidenced by no changes in the occu-
pancy. The above result demonstrates that decreasing the
pore size could lower the charging rate. This reduces the
efficiency of EDLCs to a certain extent, despite a larger
supercapacitance for narrower pores. To achieve the high
energy density accompanied with a high power density
inside sub-nanometer pores, Kondrat et al. attempted to
123
Nano-Micro Lett. (2018) 10:33 Page 13 of 23 33
strengthen the repulsion between the electrode surface and
the electrolyte ions [102]. Their simulation results indi-
cated that utilization of ionophobic pores could increase the
charging rate for sub-nanometer pores, as presented in
Fig. 9e. The key point of this method is to reduce the total
number of ions as well as packing density inside the pores
and obtain a high diffusion coefficient at the initial state, as
shown in Fig. 9f.
3.2.2 Edge Effect
The edge region of graphene consists of several graphitic
lines with single atom thickness, accompanied by numer-
ous defects and dandling bonds [18, 122]. This region
could promote the ion separation, leading to effective
energy storage. According to experimental measurements,
the specific capacitance for edge region is 4 orders of
magnitude larger compared to the basal region [122]. The
interpretation of this behavior could draw insights from
MD simulations. According to the number of stacking
layers, the edge region could be divided into edges of
monolayer graphene and edges of multilayer graphene.
Here we discuss the recent MD simulation work on these
two kinds of edge regions.
On the one hand, edges of monolayer graphene are
crucial for the efficient charge storage. The simulation
work on the edge effect of monolayer graphene was per-
formed by Pak et al. [40]. This work compares the
capacitances of pristine graphene and edge-functionalized
one. They found higher capacitance for edge-functional-
ized graphene, as shown in Fig. 10b. However, the edge
region was functionalized with hydroxyl group (Fig. 10a)
and the interference of functional groups cannot be
excluded. To illustrate the edge effect in depth, Yang et al.
compared the charge accumulation for the edges and the
basal planes [17]. Their results indicated a much higher
charge accumulation on the edges (* 4.2 times higher than
on basal planes). The influence of edges is particularly
obvious for a small length of graphene layer. It is worth
mentioning that this work is mainly focused on the charge
redistribution, without considering the interaction with
electrolyte and the distribution of electrolyte ions. Edges
could be divided into two types, namely zigzag edge and
armchair edge, according to the orientation of six-
(d)
(a)
(b)
(c)
Channel width d (A)6.5
40
35
30
25
20
15
10
5
07
Deh
ydra
tion
rate
(%)
Hyd
ratio
n nu
mbe
rC
once
ntra
tion
(M)
z (A)40 128
14.7 A
7.9 12
13.2
31.633.633.7
27.6 27.3 26.9
9.6
1.10.73
Na+
Cl-
16
1.8 nm
1.2 nm
0.6 nm40
9876543210
12
waterK+
8
z (A)30 96
12.03 A
30
9876543210
963 96
z (A)30 96
10.7 A
0
9876543210
z (A)30
8.07.57.06.56.05.55.04.5
8.07.57.06.56.05.55.04.5
8.07.57.06.56.05.55.04.5
8.07.57.06.56.05.55.04.5
6
9.36 A
30
9876543210
6
Fig. 8 The distributions of a concentration and b hydration number as a function of position for different kinds of pore size. Reprinted with
permission from Ref. [25]. Copyright (2010) American Chemical Society. c The hydration structures of Ca? and Cl- ions under the slit pores of
0.6, 1.2 and 1.8 nm. Reprinted with permission from Ref. [116]. Copyright (2009) American Chemical Society. d The dehydration rate of Na?
and Cl- ions for different kinds of pore size. Reprinted with permission from Ref. [30]. Copyright (2015) Nature Publishing Group
123
33 Page 14 of 23 Nano-Micro Lett. (2018) 10:33

membered rings. Zhan et al. utilized MD as well as DFT to
clarify which type of edge is better for charge storage
[123]. Their results found that the zigzag edge has a higher
capacitance compared to the armchair edge, due to its very
large quantum capacitance.
On the other hand, the stacks of edges are beneficial for
the capacitance. Compared with monolayer graphene,
stacks of graphene layers could lead to the decrease in its
specific surface area, as well as capacitance. However, the
stacks of edges can improve the efficiency of charge stor-
age, even for the interlayer spacing of 0.34 nm (ap-
proaching that of graphite). Yang et al. [18] compared the
capacitive performance between the planar electrode and
multilayer graphene edges with different interlayer spac-
ings, as shown in Fig. 10c. Their work showed a higher
capacitance for the multilayer graphene edges than for the
planar electrode (* two fold increase at 5.0 A). For the
narrow spacing, the enhancement in capacitance is not so
obvious, which could be ascribed to the poor accessibility
of the interlayer by electrolyte ions. Therefore, rational
control of the interval and percentage of edges could help
achieve a further improvement in the energy density.
4 Molecular Dynamics Investigations of 1DNanomaterials
Carbon nanotube (CNT), a typical representative of 1D
carbon material, is described as one or multiple graphitic
sheets rolling up into cylindrical tubes, generally exhibiting
(a)
Time (ps)100000
10
8
6
4
2
020000
Cation,BulkAnion,Bulk
30000
MS
D (n
m2 ) Cation,5.2 nm
Anion,5.2 nmCation,2.5 nmAnion,2.5 nmCation,1.9 nmAnion,1.9 nm
(e)
Time (ns)
Lonophilic
Cations
Anions LonophobicWith defects
1 0
1.0
0.5
02 3
Cha
rge,
Q(t )
/Qre
d
(d)
Time (ns)2 0
4
3
2
1
04 5
Ave
rage
den
sity
(num
ber n
m-2
)
(f)
Cation density (number nm-2)
Bulk diffusion
Knudsen diffusion
2
10-7
10-8
10-9
4
Diff
usio
n co
effic
ient
(m2
s-1)
(b)
Time (ns)0.1
1.0
0.1Cha
rge,
Q(t )
/Qre
d
Q- t0.48
Q- t0.49
1.0
(c)
Time (ns)
0.53 nm
Square-rootregime
0.66 nm
0.53 nm0.66 nm
2 0
180
160
140
120
1004 6
Occ
upan
cy,
per c
enta
ge o
f fin
al
Fig. 9 Charging dynamics and ion accumulation in slit pores. aMSDs of cations and anions for the slit pores with different pore sizes and bulks.
Reprinted with permission from Ref. [117]. Copyright (2012) American Chemical Society. b The charge accumulation inside slit pores with 0.53
and 0.66 nm. When a voltage of 3 V is imposed at t = 0, the evolutions of c total pore occupancy and d average density of cations and anions are
obtained. e The charge accumulation in ionophilic and ionophoboic slit pores. f The diffusion coefficient as a function of cation density.
Reprinted with permission from Ref. [102]. Copyright (2014) Nature Publishing Group
CD
1/CT = 1/CD + 1/CQ12
10
8
6
4
2
(c)(b)(a)
500
400
300
200
100
0
Cap
acita
nce
(F g
-1)
Spe
cific
cap
acita
nce
(μF
cm-2
)
+80.4 C g-1
PristineEdge-Functionalized
planarelectrode edge electrode
CQ CT
CcathodeCanode
C+
Ctotal
d=3.4 A
d
d=4.5 A d=5.0 A
+95.4%
+103.4%
+84.4%
+56.4%+25.4%
+0.0%
+0.0%
+0.0%+25.7%
+24.8%+62.5%
+48.8%
Fig. 10 The diagrams and capacitive performances of edge. a The diagram of edge on graphene. b The capacitances of pristine and edge-
functionalized graphene. Reprinted with permission from Ref. [40]. Copyright (2014) American Chemical Society. c The diagram of multilayer
graphene and its capacitances for different intervals. Reprinted with permission from Ref. [18]. Copyright (2016) American Chemical Society
123
Nano-Micro Lett. (2018) 10:33 Page 15 of 23 33

a high length/diameter ratio [63, 124, 125]. It is known as a
typical tubular morphology with the combination of
excellent transport characteristics and good accessibility
for its surface, making it a prominent choice for high-
power systems [10, 76]. CNTs are also regarded as a
suitable electrode material for flexible EDLCs. Despite
these superior characteristics, its specific surface area is
generally smaller than 500 m2 g-1, which restricts their
broad application as high-capacitance electrodes [10].
CNTs with different numbers of rolled up graphitic sheets
exhibit different efficiencies of charge storage. According
to the number of graphitic sheets, CNT could be classified
into single-walled carbon nanotube (SWCNT) and multi-
walled carbon nanotube (MWCNT) [126]. Due to the
stacks of sheets, the energy density of MWCNT is much
lower than that of SWCNT. The interlayer spacing of
MWCNT is approximately 0.34 nm [125], and electrolyte
ions are prevented from entering the MWCNT interlayer.
Therefore, the active areas for energy storage are the inner
surface and the outer surface of MWCNTs, which is the
same as SWCNT.
The surfaces of CNTs could be categorized into outer
surface (Fig. 11a) and inner surface (Fig. 11b). The typical
characteristics of the outer surface are the surface directly
exposed to the bulk electrolyte. In this case, the confine-
ment is much weakened or even disappears. However, a
notable feature of the inner surface is that electrolyte ions
can contact the surface only when the ions can access the
inner region of the CNT. The major difference between the
outer surface and the inner surface is the existence of
confinement for the inner surface, thus leading to the
numerous differences between the two types of surfaces.
The first difference is the variation of capacitance with
the radius of CNT. For the outer surface of a CNT, a
monotonous increase in capacitance is observed with
decreasing radius. This special behavior of charge storage
is mainly ascribed to the two factors. First, when a flat
plane is bent into the cylindrical surface, its outer effective
area increases, so does the number of adsorbed ions. Sec-
ond, without the confinement effect, the outer surface could
be fully utilized. Therefore, the effective area for energy
storage increases monotonously with the decrease in
radius. Detailed information and further investigations
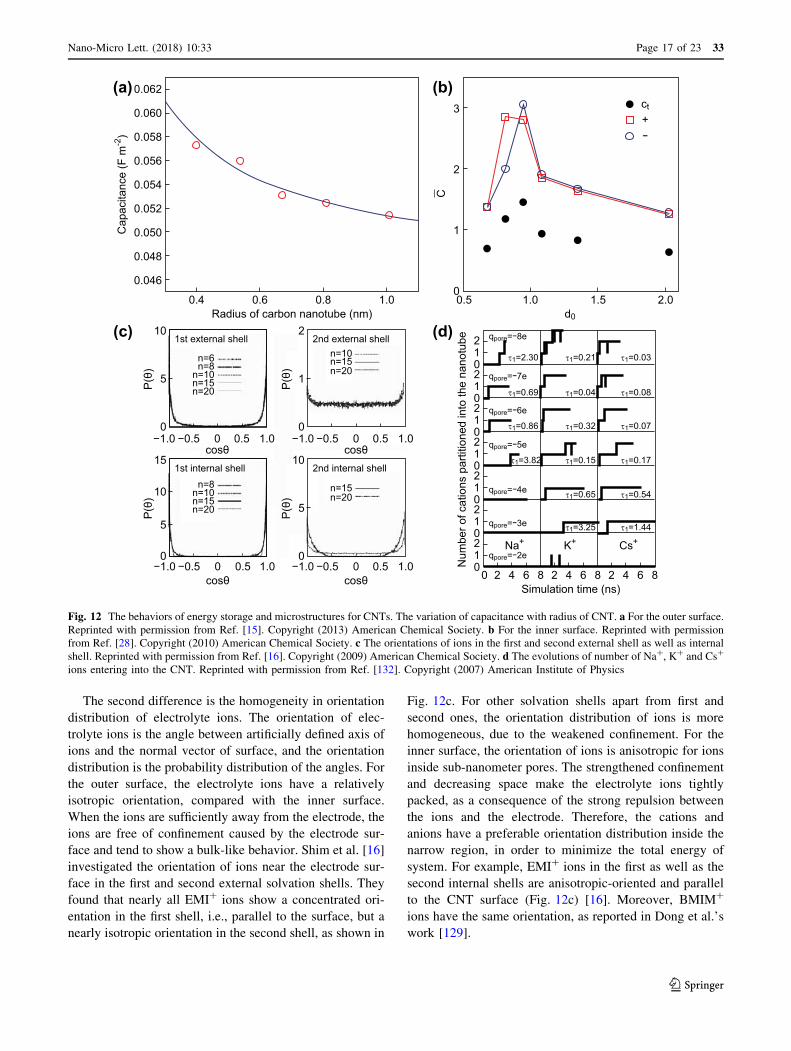
should rely on MD simulations. Feng et al. [15] investi-
gated the capacitance for a closed CNT and found that the
capacitance increases continuously as the radius decreases
from 1 nm to 0.4 nm (Fig. 12a). For CNT forests, a similar
trend for capacitance is also observed [127]. This conclu-
sion is confirmed for the radius larger than 1 nm, but the
variation of capacitance is still unknown at sub-nanometer
scale. As predicted, the variation of capacitance should
qualitatively agree with Feng et al.’s results, due to the
sufficient distance between the adjacent nanotubes. The
inner surface is responsible for a non-monotonous increase
in capacitance versus radius inside the sub-nanometer
pores. Compared with the outer surface, the narrow region
of the inner surface leads to the reduction in capacitance
with the decrease in radius at sub-nanometer scale. This
phenomenon is due to the decreasing accessibility of the
inner region for electrolyte ions, leading to the reduction in
the number of adsorbed ions and effective active surface
area.
Shim et al. [28] employed the MD technique to study the
double-layer capacitive effect for electrified CNTs with
different diameters, as shown in Fig. 12b. The obtained
curve of capacitance versus diameter is consistent with the
experimental results [11]. For the CNT forest, the simula-
tion work of Dive and Banerjee indicated the highest
efficiency of charge storage for the interval spacing of
1.6 nm, compared to those of 1.2 and 2.0 nm [128].
Fig. 11 Two surfaces of CNTs. a The outer surface of CNTs. Reprinted with permission from Ref. [15]. Copyright (2013) American Chemical
Society. b The inner surface of CNTs. Reprinted with permission from Ref. [28]. Copyright (2010) American Chemical Society
123
33 Page 16 of 23 Nano-Micro Lett. (2018) 10:33
The second difference is the homogeneity in orientation
distribution of electrolyte ions. The orientation of elec-
trolyte ions is the angle between artificially defined axis of
ions and the normal vector of surface, and the orientation
distribution is the probability distribution of the angles. For
the outer surface, the electrolyte ions have a relatively
isotropic orientation, compared with the inner surface.
When the ions are sufficiently away from the electrode, the
ions are free of confinement caused by the electrode sur-
face and tend to show a bulk-like behavior. Shim et al. [16]
investigated the orientation of ions near the electrode sur-
face in the first and second external solvation shells. They
found that nearly all EMI? ions show a concentrated ori-
entation in the first shell, i.e., parallel to the surface, but a
nearly isotropic orientation in the second shell, as shown in
Fig. 12c. For other solvation shells apart from first and
second ones, the orientation distribution of ions is more
homogeneous, due to the weakened confinement. For the
inner surface, the orientation of ions is anisotropic for ions
inside sub-nanometer pores. The strengthened confinement
and decreasing space make the electrolyte ions tightly
packed, as a consequence of the strong repulsion between
the ions and the electrode. Therefore, the cations and
anions have a preferable orientation distribution inside the
narrow region, in order to minimize the total energy of
system. For example, EMI? ions in the first as well as the
second internal shells are anisotropic-oriented and parallel
to the CNT surface (Fig. 12c) [16]. Moreover, BMIM?
ions have the same orientation, as reported in Dong et al.’s
work [129].
(b)
(d)(c)d0
ct+-
C
0.5
3
2
1
01.5
Cap
acita
nce
(F m
-2)
1.0 2.0
Simulation time (ns)
Na+
qpore=-2e
qpore=-3e
qpore=-4e
qpore=-5e
qpore=-6e
qpore=-7e
qpore=-8e
τ1=3.25 τ1=1.44
τ1=0.65 τ1=0.54
τ1=0.15τ1=3.82 τ1=0.17
τ1=0.32τ1=0.86 τ1=0.07
τ1=0.04τ1=0.69 τ1=0.08
τ1=0.21τ1=2.30 τ1=0.03
K+ Cs+
Num
ber o
f cat
ions
par
titio
ned
into
the
nano
tube
0−1.0
10
5
0−0.5 0
2nd internal shell
n=15n=20
cosθ
P(θ
)
0.5 1.0
−1.0 −0.5 0cosθ
0.5 1.0−1.0 −0.5 0cosθ
0.5 1.0
−1.0 −0.5 0cosθ
0.5 1.0
210
210
210
210
210
210
210
2 4 6 8 2 4 6 8 2 4 6 8
(a)
Radius of carbon nanotube (nm)
0.062
0.060
0.058
0.056
0.054
0.052
0.050
0.048
0.046
0.4 0.6 0.8 1.0
15
5
0
1st internal shell
n=15n=20
n=8n=10
P(θ
) 10
2
1
0
2nd external shell
n=15n=10
n=20
P(θ
)
10
5
0
1st external shell
n=15n=20
n=8n=6
n=10
P(θ
)
Fig. 12 The behaviors of energy storage and microstructures for CNTs. The variation of capacitance with radius of CNT. a For the outer surface.Reprinted with permission from Ref. [15]. Copyright (2013) American Chemical Society. b For the inner surface. Reprinted with permission
from Ref. [28]. Copyright (2010) American Chemical Society. c The orientations of ions in the first and second external shell as well as internal
shell. Reprinted with permission from Ref. [16]. Copyright (2009) American Chemical Society. d The evolutions of number of Na?, K? and Cs?
ions entering into the CNT. Reprinted with permission from Ref. [132]. Copyright (2007) American Institute of Physics
123
Nano-Micro Lett. (2018) 10:33 Page 17 of 23 33
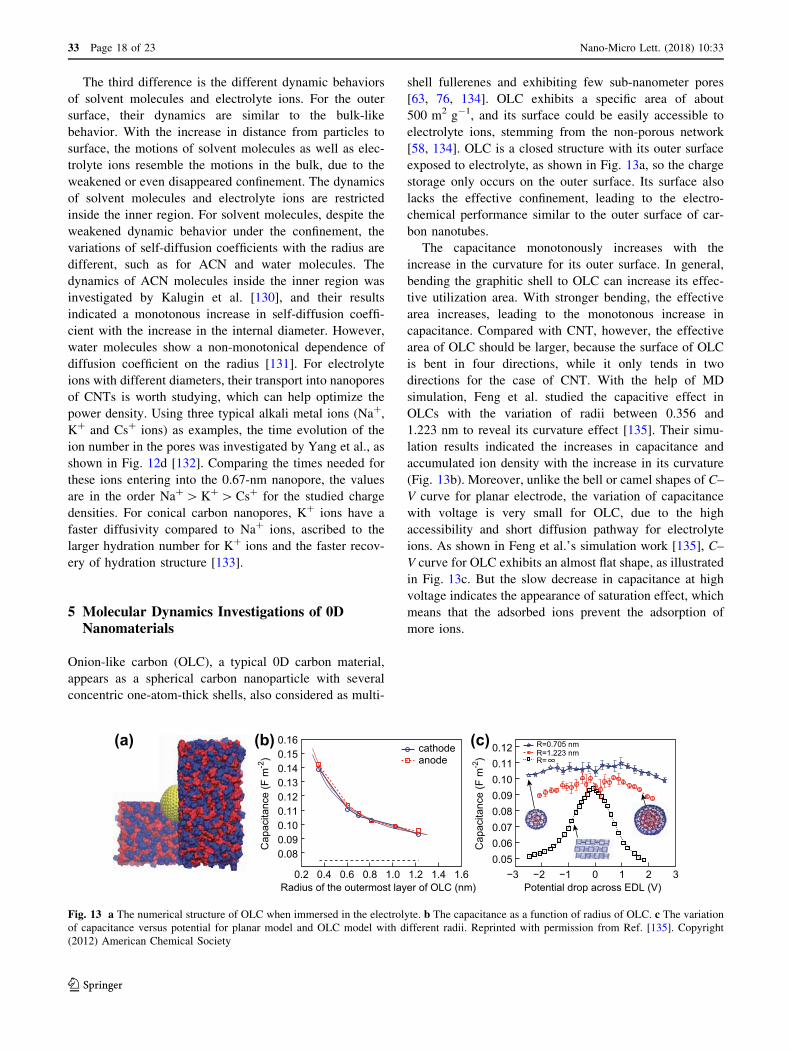
The third difference is the different dynamic behaviors
of solvent molecules and electrolyte ions. For the outer
surface, their dynamics are similar to the bulk-like
behavior. With the increase in distance from particles to
surface, the motions of solvent molecules as well as elec-
trolyte ions resemble the motions in the bulk, due to the
weakened or even disappeared confinement. The dynamics
of solvent molecules and electrolyte ions are restricted
inside the inner region. For solvent molecules, despite the
weakened dynamic behavior under the confinement, the
variations of self-diffusion coefficients with the radius are
different, such as for ACN and water molecules. The
dynamics of ACN molecules inside the inner region was
investigated by Kalugin et al. [130], and their results
indicated a monotonous increase in self-diffusion coeffi-
cient with the increase in the internal diameter. However,
water molecules show a non-monotonical dependence of
diffusion coefficient on the radius [131]. For electrolyte
ions with different diameters, their transport into nanopores
of CNTs is worth studying, which can help optimize the
power density. Using three typical alkali metal ions (Na?,
K? and Cs? ions) as examples, the time evolution of the
ion number in the pores was investigated by Yang et al., as
shown in Fig. 12d [132]. Comparing the times needed for
these ions entering into the 0.67-nm nanopore, the values
are in the order Na?[K?[Cs? for the studied charge
densities. For conical carbon nanopores, K? ions have a
faster diffusivity compared to Na? ions, ascribed to the
larger hydration number for K? ions and the faster recov-
ery of hydration structure [133].
5 Molecular Dynamics Investigations of 0DNanomaterials
Onion-like carbon (OLC), a typical 0D carbon material,
appears as a spherical carbon nanoparticle with several
concentric one-atom-thick shells, also considered as multi-
shell fullerenes and exhibiting few sub-nanometer pores
[63, 76, 134]. OLC exhibits a specific area of about
500 m2 g-1, and its surface could be easily accessible to
electrolyte ions, stemming from the non-porous network
[58, 134]. OLC is a closed structure with its outer surface
exposed to electrolyte, as shown in Fig. 13a, so the charge
storage only occurs on the outer surface. Its surface also
lacks the effective confinement, leading to the electro-
chemical performance similar to the outer surface of car-
bon nanotubes.
The capacitance monotonously increases with the
increase in the curvature for its outer surface. In general,
bending the graphitic shell to OLC can increase its effec-
tive utilization area. With stronger bending, the effective
area increases, leading to the monotonous increase in
capacitance. Compared with CNT, however, the effective
area of OLC should be larger, because the surface of OLC
is bent in four directions, while it only tends in two
directions for the case of CNT. With the help of MD
simulation, Feng et al. studied the capacitive effect in
OLCs with the variation of radii between 0.356 and
1.223 nm to reveal its curvature effect [135]. Their simu-
lation results indicated the increases in capacitance and
accumulated ion density with the increase in its curvature
(Fig. 13b). Moreover, unlike the bell or camel shapes of C–
V curve for planar electrode, the variation of capacitance
with voltage is very small for OLC, due to the high
accessibility and short diffusion pathway for electrolyte
ions. As shown in Feng et al.’s simulation work [135], C–
V curve for OLC exhibits an almost flat shape, as illustrated
in Fig. 13c. But the slow decrease in capacitance at high
voltage indicates the appearance of saturation effect, which
means that the adsorbed ions prevent the adsorption of
more ions.
Cap
acita
nce
(F m
-2)
(a) (b) (c)
Radius of the outermost layer of OLC (nm)
0.160.150.140.130.120.110.100.090.08
2.0 4.0 0.6 0.8 1.0 1.2
cathodeanode
1.4 1.6
Cap
acita
nce
(F m
-2)
Potential drop across EDL (V)
0.120.110.100.090.080.070.060.05
3− 2− −1 0 1 2 3
R=0.705 nmR=1.223 nmR=
Fig. 13 a The numerical structure of OLC when immersed in the electrolyte. b The capacitance as a function of radius of OLC. c The variationof capacitance versus potential for planar model and OLC model with different radii. Reprinted with permission from Ref. [135]. Copyright
(2012) American Chemical Society
123
33 Page 18 of 23 Nano-Micro Lett. (2018) 10:33
6 Conclusion
This review examines the recent MD simulation investiga-
tions of energy storage behaviors inside the electrode
materials with the structure ranging from porous to nanos-
tructures. Few MD studies have been carried out on the AC
electrodes, owing to their typical features including porosity,
broad pore size distribution and the existence of numerous
corrugated and curved pores. By contrast, for CDCs with
relatively narrow pore size distribution, substantial MD
investigations have been implemented to interpret the
anomalous increase in capacitance in structures with
nanoscale confinement. The typical features of porous
materials enable the long diffusion pathway and relatively
low power density. When the dimension of electrode mate-
rials becomes close to several nanometers, some exotic
electrochemical behaviors emerge for diverse nanomateri-
als. Their nanoconfined space leads to their complex
charging mode with the combination of ion exchange,
counterion adsorption and co-ion desorption. For 2D nano-
materials, a variety of approaches have been developed to
change the electrode structures and optimize the energy
density, e.g., surface roughness and doping. Moreover, the
nanoconfinement model based on multilayer graphene pre-
sents more details about the dynamics of energy storage. For
1D nanomaterials, their surfaces could be categorized into
the inner and outer surfaces. These two surfaces have dif-
ferent charge storage behaviors and ion dynamics, due to the
confinement effect for the inner surface. The capacitance has
a monotonous increase with decreasing radius for the outer
region, but the inner region leads to the reduction in capac-
itance with radius at sub-nanometer scale. 0D nanomaterials
are the closed structures with the outer surfaces exposed to
the bulk electrolyte, which lack the confinement effect,
leading to the monotonous increase in capacitance.
MD simulation results could provide the guidelines for
the optimization of energy density inside carbon electrodes
at atomic level. The methods to enhance the capacitance
could be considered from two aspects. First, the EDL
capacitance can be enhanced by changing the electrode
geometry. On the one hand, it is possible to rationally
regulate the pore width of electrode materials to match the
ion diameter with the pore width. On the other hand, one
can tune the surface topography of electrode to separate
cations and anions efficiently. Second, it is possible to
improve quantum capacitance by electrode modification
(e.g., dopant of heteroatoms and defects). Electrode mod-
ification can be used to optimize the electronic structure of
the electrode materials and, consequently, the specific
charge storage characteristics. To achieve high energy
density for EDLCs, it is crucial to optimize the EDL
capacitance and quantum capacitance simultaneously.
The methods of improving the power density of EDLCs
by MD simulations can be categorized into two aspects,
i.e., intensifying the ion dynamics and shortening the ion
pathway. The narrow pore will restrict the dynamic char-
acteristics of ions due to their strong adsorption on the
material surface. Reduced surface affinity for ions can
effectively repel the ions from the pore, leading to the
strong dynamics for electrolyte ions. The morphology of
electrode materials can determine the diffusion path for
electrolyte ions under the charging process. To obtain the
EDLCs with high power densities, one can achieve the
intense ion dynamics and shorten the ion pathway by
regulating the electrode structures and surface properties.
Future research on enhancing the performances of EDLCs
can benefit from the recommended electrode structures and
surface properties provided by the MD simulations.
Acknowledgements This work is supported by the National Natural
Science Foundation of China (No. 51722604) and Zhejiang Provincial
Natural Science Foundation of China (No. LR17E060002).
Open Access This article is distributed under the terms of the
Creative Commons Attribution 4.0 International License (http://crea
tivecommons.org/licenses/by/4.0/), which permits unrestricted use,
distribution, and reproduction in any medium, provided you give
appropriate credit to the original author(s) and the source, provide a
link to the Creative Commons license, and indicate if changes were
made.
References
1. P. Simon, Y. Gogotsi, Materials for electrochemical capacitors.
Nat. Mater. 7(11), 845–854 (2008). https://doi.org/10.1038/
nmat2297
2. V. Jenel, V. Mihaela, B. Oleg, B. Dmitry, A comparative study
of room temperature ionic liquids and their organic solvent
mixtures near charged electrodes. J. Phys-Condens. Matter
28(46), 464002 (2016). https://doi.org/10.1088/0953-8984/28/
46/464002
3. A.G. Pandolfo, A.F. Hollenkamp, Carbon properties and their
role in supercapacitors. J. Power Sources 157(1), 11–27 (2006).
https://doi.org/10.1016/j.jpowsour.2006.02.065
4. M. Salanne, B. Rotenberg, K. Naoi, K. Kaneko, P.L. Taberna,
C.P. Grey, B. Dunn, P. Simon, Efficient storage mechanisms for
building better supercapacitors. Nat. Energy 1, 16070 (2016).
https://doi.org/10.1038/nenergy.2016.70
5. X. Zhang, X. Sun, H. Zhang, C. Li, Y. Ma, Comparative per-
formance of birnessite-type MnO2 nanoplates and octahedral
molecular sieve (OMS-5) nanobelts of manganese dioxide as
electrode materials for supercapacitor application. Electrochim.
Acta 132, 315–322 (2014). https://doi.org/10.1016/j.electacta.
2014.03.176
6. E. Faggioli, P. Rena, V. Danel, X. Andrieu, R. Mallant, H.
Kahlen, Supercapacitors for the energy management of electric
vehicles. J. Power Sources 84(2), 261–269 (1999). https://doi.
org/10.1016/s0378-7753(99)00326-2
7. J.R. Miller, P. Simon, Materials science—electrochemical
capacitors for energy management. Science 321(5889), 651–652(2008). https://doi.org/10.1126/science.1158736
123
Nano-Micro Lett. (2018) 10:33 Page 19 of 23 33
8. B. Dunn, H. Kamath, J.M. Tarascon, Electrical energy storage
for the grid: a battery of choices. Science 334(6058), 928–935(2011). https://doi.org/10.1126/science.1212741
9. J.R. Miller, R.A. Outlaw, B.C. Holloway, Graphene double-
layer capacitor with ac line-filtering performance. Science
329(5999), 1637–1639 (2010). https://doi.org/10.1126/science.
1194372
10. L.L. Zhang, X.S. Zhao, Carbon-based materials as supercapac-
itor electrodes. Chem. Soc. Rev. 38(9), 2520–2531 (2009).
https://doi.org/10.1039/b813846j
11. J. Chmiola, G. Yushin, Y. Gogotsi, C. Portet, P. Simon, P.L.
Taberna, Anomalous increase in carbon capacitance at pore
sizes less than 1 nm. Science 313(5794), 1760–1763 (2006).
https://doi.org/10.1126/science.1132195
12. S.Y. Lee, C.H. Choi, M.W. Chung, J.H. Chung, S.I. Woo,
Dimensional tailoring of nitrogen-doped graphene for high
performance supercapacitors. RSC Adv. 6(60), 55577–55583
(2016). https://doi.org/10.1039/c6ra07825g
13. G. Wang, L. Zhang, J. Zhang, A review of electrode materials
for electrochemical supercapacitors. Chem. Soc. Rev. 41(2),797–828 (2012). https://doi.org/10.1039/c1cs15060j
14. Y. Zhang, H. Feng, X. Wu, L. Wang, A. Zhang, T. Xia, H.
Dong, X. Li, L. Zhang, Progress of electrochemical capacitor
electrode materials: a review. Int. J. Hydrog. Energy 34(11),4889–4899 (2009). https://doi.org/10.1016/j.ijhydene.2009.04.
005
15. G. Feng, S. Li, J.S. Atchison, V. Presser, P.T. Cummings,
Molecular insights into carbon nanotube supercapacitors:
capacitance independent of voltage and temperature. J. Phys.
Chem. C 117(18), 9178–9186 (2013). https://doi.org/10.1021/
jp403547k
16. Y. Shim, H.J. Kim, Solvation of carbon nanotubes in a room-
temperature ionic liquid. ACS Nano 3(7), 1693–1702 (2009).
https://doi.org/10.1021/nn900195b
17. H. Yang, J. Yang, Z. Bo, S. Zhang, J. Yan, K. Cen, Edge effects
in vertically-oriented graphene based electric double-layer
capacitors. J. Power Sources 324, 309–316 (2016). https://doi.
org/10.1016/j.jpowsour.2016.05.072
18. H. Yang, X. Zhang, J. Yang, Z. Bo, M. Hu, J. Yan, K. Cen,
Molecular origin of electric double-layer capacitance at multi-
layer graphene edges. J. Phys. Chem. Lett. 8(1), 153–160
(2016). https://doi.org/10.1021/acs.jpclett.6b02659
19. H.V. Helmholtz, Studien uber electrische grenzschichten. Ann.
Phys. 243(7), 337–382 (1879). https://doi.org/10.1002/andp.
18792430702
20. M. Gouy, Sur la constitution de la charge electrique a la surface
d’un electrolyte. J. Phys. Theor. Appl. 9(1), 457–468 (1910).
https://doi.org/10.1051/jphystap:019100090045700
21. D.L. Chapman, A contribution to the theory of electrocapillarity.
Philos. Mag. 25(148), 475–481 (1913). https://doi.org/10.1080/
14786440408634187
22. E. Frackowiak, Q. Abbas, F. Beguin, Carbon/carbon superca-
pacitors. J. Energy Chem. 22(2), 226–240 (2013). https://doi.
org/10.1016/S2095-4956(13)60028-5
23. O. Stern, The theory of the electrolytic double shift. Z. Elek-
trochem. Angew. Physik. Chem. 30, 508–516 (1924)
24. P. Wu, J. Huang, V. Meunier, B.G. Sumpter, R. Qiao, Complex
capacitance scaling in ionic liquids-filled nanopores. ACS Nano
5(11), 9044–9051 (2011). https://doi.org/10.1021/nn203260w
25. G. Feng, R. Qiao, J. Huang, B.G. Sumpter, V. Meunier, Ion
distribution in electrified micropores and its role in the anoma-
lous enhancement of capacitance. ACS Nano 4(4), 2382–2390(2010). https://doi.org/10.1021/nn100126w
26. D.-E. Jiang, Z. Jin, J. Wu, Oscillation of capacitance inside
nanopores. Nano Lett. 11(12), 5373–5377 (2011). https://doi.
org/10.1021/nl202952d
27. C. Merlet, B. Rotenberg, P.A. Madden, P.-L. Taberna, P. Simon,
Y. Gogotsi, M. Salanne, On the molecular origin of superca-
pacitance in nanoporous carbon electrodes. Nat. Mater. 11(4),306–310 (2012). https://doi.org/10.1038/nmat3260
28. Y. Shim, H.J. Kim, Nanoporous carbon supercapacitors in an
ionic liquid: a computer simulation study. ACS Nano 4(4),2345–2355 (2010). https://doi.org/10.1021/nn901916m
29. C. Largeot, C. Portet, J. Chmiola, P.L. Taberna, Y. Gogotsi, P.
Simon, Relation between the ion size and pore size for an
electric double-layer capacitor. J. Am. Chem. Soc. 130(9),2730–2731 (2008). https://doi.org/10.1021/ja7106178
30. Z. Bo, H. Yang, S. Zhang, J. Yang, J. Yan, K. Cen, Molecular
insights into aqueous NaCl electrolytes confined within verti-
cally-oriented graphenes. Sci. Rep. 5, 14652 (2015). https://doi.
org/10.1038/srep14652
31. C. Merlet, C. Pean, B. Rotenberg, P.A. Madden, B. Daffos, P.L.
Taberna, P. Simon, M. Salanne, Highly confined ions store
charge more efficiently in supercapacitors. Nat. Commun. 4,2701 (2013). https://doi.org/10.1038/ncomms3701
32. J. Vatamanu, L. Cao, O. Borodin, D. Bedrov, G.D. Smith, On
the influence of surface topography on the electric double layer
structure and differential capacitance of graphite/ionic liquid
interfaces. J. Phys. Chem. Lett. 2(17), 2267–2272 (2011).
https://doi.org/10.1021/jz200879a
33. L. Xing, J. Vatamanu, G.D. Smith, D. Bedrov, Nanopatterning
of electrode surfaces as a potential route to improve the energy
density of electric double-layer capacitors: insight from molec-
ular simulations. J. Phys. Chem. Lett. 3(9), 1124–1129 (2012).
https://doi.org/10.1021/jz300253p
34. J. Vatamanu, M. Vatamanu, D. Bedrov, Non-faradaic energy
storage by room temperature ionic liquids in nanoporous elec-
trodes. ACS Nano 9(6), 5999–6017 (2015). https://doi.org/10.
1021/acsnano.5b00945
35. E. Paek, A.J. Pak, K.E. Kweon, G.S. Hwang, On the origin of
the enhanced supercapacitor performance of nitrogen-doped
graphene. J. Phys. Chem. C 117(11), 5610–5616 (2013). https://
doi.org/10.1021/jp312490q
36. S. Kerisit, B. Schwenzer, M. Vijayakumar, Effects of oxygen-
containing functional groups on supercapacitor performance.
J. Phys. Chem. Lett. 5(13), 650–653 (2014). https://doi.org/10.
1021/jz500900t
37. S.-W. Park, A.D. DeYoung, N.R. Dhumal, Y. Shim, H.J. Kim, Y.
Jung, Computer simulation study of graphene oxide supercapac-
itors: charge screening mechanism. J. Phys. Chem. Lett. 7(7),1180–1186 (2016). https://doi.org/10.1021/acs.jpclett.6b00202
38. J. Vatamanu, O. Borodin, D. Bedrov, G.D. Smith, Molecular
dynamics simulation study of the interfacial structure and dif-
ferential capacitance of alkylimidazolium bis(trifluoromethane-
sulfonyl)imide [CNMIM][TFSI] ionic liquids at graphite
electrodes. J. Phys. Chem. C 116(14), 7940–7951 (2012).
https://doi.org/10.1021/jp301399b
39. H.M. Jeong, J.W. Lee, W.H. Shin, Y.J. Choi, H.J. Shin, J.K.
Kang, J.W. Choi, Nitrogen-doped graphene for high-perfor-
mance ultracapacitors and the importance of nitrogen-doped
sites at basal planes. Nano Lett. 11(6), 2472–2477 (2011).
https://doi.org/10.1021/nl2009058
40. A.J. Pak, E. Paek, G.S. Hwang, Impact of graphene edges on
enhancing the performance of electrochemical double layer
capacitors. J. Phys. Chem. C 118(38), 21770–21777 (2014).
https://doi.org/10.1021/jp504458z
41. A.C. Forse, C. Merlet, J.M. Griffin, C.P. Grey, New perspectives
on the charging mechanisms of supercapacitors. J. Am. Chem.
Soc. 138(18), 5731–5744 (2016). https://doi.org/10.1021/jacs.
6b02115
42. H. Wang, T.K.J. Koester, N.M. Trease, J. Segalini, P.-L.
Taberna, P. Simon, Y. Gogotsi, C.P. Grey, Real-time NMR
123
33 Page 20 of 23 Nano-Micro Lett. (2018) 10:33
studies of electrochemical double-layer capacitors. J. Am.
Chem. Soc. 133(48), 19270–19273 (2011). https://doi.org/10.
1021/ja2072115
43. M.D. Levi, G. Salitra, N. Levy, D. Aurbach, J. Maier, Appli-
cation of a quartz-crystal microbalance to measure ionic fluxes
in microporous carbons for energy storage. Nat. Mater. 8(11),872–875 (2009). https://doi.org/10.1038/nmat2559
44. M.D. Levi, N. Levy, S. Sigalov, G. Salitra, D. Aurbach, J.
Maier, Electrochemical quartz crystal microbalance (EQCM)
studies of ions and solvents insertion into highly porous acti-
vated carbons. J. Am. Chem. Soc. 132(38), 13220–13222
(2010). https://doi.org/10.1021/ja104391g
45. K. Li, Z. Bo, J. Yan, K. Cen, Solid-state NMR study of ion
adsorption and charge storage in graphene film supercapacitor
electrodes. Sci. Rep. 6, 39689 (2016). https://doi.org/10.1038/
srep39689
46. W.-Y. Tsai, P.-L. Taberna, P. Simon, Electrochemical quartz
crystal microbalance (EQCM) study of ion dynamics in nano-
porous carbons. J. Am. Chem. Soc. 136(24), 8722–8728 (2014).
https://doi.org/10.1021/ja503449w
47. J.M. Griffin, A.C. Forse, W.-Y. Tsai, P.-L. Taberna, P. Simon,
C.P. Grey, In situ NMR and electrochemical quartz crystal
microbalance techniques reveal the structure of the electrical
double layer in supercapacitors. Nat. Mater. 14(8), 812–819
(2015). https://doi.org/10.1038/nmat4318
48. A.C. Forse, J.M. Griffin, H. Wang, N.M. Trease, V. Presser, Y.
Gogotsi, P. Simon, C.P. Grey, Nuclear magnetic resonance
study of ion adsorption on microporous carbide-derived carbon.
Phys. Chem. Chem. Phys. 15(20), 7722–7730 (2013). https://
doi.org/10.1039/c3cp51210j
49. S. Leyva-Garcia, K. Nueangnoraj, D. Lozano-Castello, H.
Nishihara, T. Kyotani, E. Marallon, D. Cazorla-Amoros, Char-
acterization of a zeolite-templated carbon by electrochemical
quartz crystal microbalance and in situ Raman spectroscopy.
Carbon 89, 63–73 (2015). https://doi.org/10.1016/j.carbon.2015.
03.016
50. Q. Zhang, K. Scrafford, M. Li, Z. Cao, Z. Xia, P.M. Ajayan, B.
Wei, Anomalous capacitive behaviors of graphene oxide based
solid-state supercapacitors. Nano Lett. 14(4), 1938–1943 (2014).https://doi.org/10.1021/nl4047784
51. J.N. Barisci, G.G. Wallace, R.H. Baughman, Electrochemical
quartz crystal microbalance studies of single-wall carbon nan-
otubes in aqueous and non-aqueous solutions. Electrochim. Acta
46(4), 509–517 (2000). https://doi.org/10.1016/s0013-
4686(00)00634-4
52. B. Peng, H. Zhang, H. Shao, Y. Xu, X. Zhang, H. Zhu, Thermal
conductivity of monolayer MOS2, MOSe2, and WS2: interplay
of mass effect, interatomic bonding and anharmonicity. RSC
Adv. 6(7), 5767–5773 (2016). https://doi.org/10.1039/
c5ra19747c
53. X. Liu, G. Zhang, Q.-X. Pei, Y.-W. Zhang, Phonon thermal
conductivity of monolayer MOS2 sheet and nanoribbons. Appl.
Phys. Lett. 103(13), 133113 (2013). https://doi.org/10.1063/1.
4823509
54. J.-W. Jiang, H.S. Park, T. Rabczuk, Molecular dynamics simu-
lations of single-layer molybdenum disulphide (MOS2): Still-
inger–Weber parametrization, mechanical properties, and
thermal conductivity. J. Appl. Phys. 114(6), 064307 (2013).
https://doi.org/10.1063/1.4818414
55. Y. Zhai, Y. Dou, D. Zhao, P.F. Fulvio, R.T. Mayes, S. Dai,
Carbon materials for chemical capacitive energy storage. Adv.
Mater. 23(42), 4828–4850 (2011). https://doi.org/10.1002/adma.
201100984
56. J. Lee, J. Kim, T. Hyeon, Recent progress in the synthesis of
porous carbon materials. Adv. Mater. 18(16), 2073–2094
(2006). https://doi.org/10.1002/adma.200501576
57. C. Liu, F. Li, L.-P. Ma, H.-M. Cheng, Advanced materials for
energy storage. Adv. Mater. 22(8), E28–E62 (2010). https://doi.
org/10.1002/adma.200903328
58. Z. Yu, L. Tetard, L. Zhai, J. Thomas, Supercapacitor electrode
materials: nanostructures from 0 to 3 dimensions. Energy Env-
iron. Sci. 8(3), 702–730 (2015). https://doi.org/10.1039/
c4ee03229b
59. R.L. McGreevy, L. Pusztai, Reverse Monte Carlo simulation: a
new technique for the determination of disordered structures.
Mol. Simul. 1(6), 359–367 (1988). https://doi.org/10.1080/
08927028808080958
60. C.H. Turner, J. Pikunic, K.E. Gubbins, Influence of chemical
and physical surface heterogeneity on chemical reaction equi-
libria in carbon micropores. Mol. Phys. 99(24), 1991–2001
(2001). https://doi.org/10.1080/00268970110087254
61. N.N. Rajput, J. Monk, F.R. Hung, Ionic liquids confined in a
realistic activated carbon model: a molecular simulation study.
J. Phys. Chem. C 118(3), 1540–1553 (2014). https://doi.org/10.
1021/jp408617j
62. V. Presser, M. Heon, Y. Gogotsi, Carbide-derived carbons—
from porous networks to nanotubes and graphene. Adv. Funct.
Mater. 21(5), 810–833 (2011). https://doi.org/10.1002/adfm.
201002094
63. W.T. Gu, G. Yushin, Review of nanostructured carbon materials
for electrochemical capacitor applications: advantages and
limitations of activated carbon, carbide-derived carbon, zeolite-
templated carbon, carbon aerogels, carbon nanotubes, onion-like
carbon, and graphene. Wiley Interdiscip. Rev. Energy 3(5),424–473 (2014). https://doi.org/10.1002/wene.102
64. D.S. Su, R. Schloegl, Nanostructured carbon and carbon
nanocomposites for electrochemical energy storage applications.
Chemsuschem 3(2), 136–168 (2010). https://doi.org/10.1002/
cssc.200900182
65. J.C. Palmer, A. Llobet, S.H. Yeon, J.E. Fischer, Y. Shi, Y.
Gogotsi, K.E. Gubbins, Modeling the structural evolution of
carbide-derived carbons using quenched molecular dynamics.
Carbon 48(4), 1116–1123 (2010). https://doi.org/10.1016/j.car
bon.2009.11.033
66. C. Pean, B. Daffos, B. Rotenberg, P. Levitz, M. Haefele, P.-L.
Taberna, P. Simon, M. Salanne, Confinement, desolvation, and
electrosorption effects on the diffusion of ions in nanoporous
carbon electrodes. J. Am. Chem. Soc. 137(39), 12627–12632(2015). https://doi.org/10.1021/jacs.5b07416
67. C. Pean, C. Merlet, B. Rotenberg, P.A. Madden, P.-L. Taberna,
B. Daffos, M. Salanne, P. Simon, On the dynamics of charging
in nanoporous carbon-based supercapacitors. ACS Nano 8(2),1576–1583 (2014). https://doi.org/10.1021/nn4058243
68. M.Z. Bazant, B.D. Storey, A.A. Kornyshev, Double layer in
ionic liquids: overscreening versus crowding. Phys. Rev. Lett.
106(4), 046102 (2011). https://doi.org/10.1103/PhysRevLett.
106.046102
69. C. Lian, D.-E. Jiang, H. Liu, J. Wu, A generic model for electric
double layers in porous electrodes. J. Phys. Chem. C 120(16),8704–8710 (2016). https://doi.org/10.1021/acs.jpcc.6b00964
70. A.J. Pak, G.S. Hwang, Molecular insights into the complex
relationship between capacitance and pore morphology in
nanoporous carbon-based supercapacitors. ACS Appl. Mater.
Interfaces 8(50), 34659–34667 (2016). https://doi.org/10.1021/
acsami.6b11192
71. S. Schweizer, R. Meissner, M. Amkreutz, K. Thiel, P. Schiffels,
J. Landwehr, B.J.M. Etzold, J.-R. Hill, Molecular modeling of
microporous structures of carbide-derived carbon-based super-
capacitors. J. Phys. Chem. C 121(13), 7221–7231 (2017).
https://doi.org/10.1021/acs.jpcc.6b12774
72. M. Chen, S. Li, G. Feng, The influence of anion shape on the
electrical double layer microstructure and capacitance of ionic
123
Nano-Micro Lett. (2018) 10:33 Page 21 of 23 33
liquids-based supercapacitors by molecular simulations. Mole-
cules 22(2), 241 (2017). https://doi.org/10.3390/
molecules22020241
73. C. Merlet, C. Pean, B. Rotenberg, P.A. Madden, P. Simon, M.
Salanne, Simulating supercapacitors: can we model electrodes
as constant charge surfaces? J. Phys. Chem. Lett. 4(2), 264–268(2013). https://doi.org/10.1021/jz3019226
74. J. Yang, Z. Bo, H. Yang, H. Qi, J. Kong, J. Yan, K. Cen,
Reliability of constant charge method for molecular dynamics
simulations on EDLCs in nanometer and sub-nanometer spaces.
Chemelectrochem 4(10), 2486–2493 (2017). https://doi.org/10.
1002/celc.201700447
75. J. Vatamanu, D. Bedrov, O. Borodin, On the application of
constant electrode potential simulation techniques in atomistic
modelling of electric double layers. Mol. Simul. 43(10–11),838–849 (2017). https://doi.org/10.1080/08927022.2017.
1279287
76. L.L. Zhang, R. Zhou, X.S. Zhao, Graphene-based materials as
supercapacitor electrodes. J. Mater. Chem. 20(29), 5983–5992(2010). https://doi.org/10.1039/c000417k
77. J. Chen, C. Li, G. Shi, Graphene materials for electrochemical
capacitors. J. Phys. Chem. Lett. 4(8), 1244–1253 (2013). https://
doi.org/10.1021/jz400160k
78. R. Raccichini, A. Varzi, S. Passerini, B. Scrosati, The role of
graphene for electrochemical energy storage. Nat. Mater. 14(3),271–279 (2015). https://doi.org/10.1038/nmat4170
79. K.S. Novoselov, A.K. Geim, S.V. Morozov, D. Jiang, Y. Zhang,
S.V. Dubonos, I.V. Grigorieva, A.A. Firsov, Electric field effect
in atomically thin carbon films. Science 306(5696), 666–669(2004). https://doi.org/10.1126/science.1102896
80. M.D. Stoller, S. Park, Y. Zhu, J. An, R.S. Ruoff, Graphene-
based ultracapacitors. Nano Lett. 8(10), 3498–3502 (2008).
https://doi.org/10.1021/nl802558y
81. J. Xia, F. Chen, J. Li, N. Tao, Measurement of the quantum
capacitance of graphene. Nat. Nanotechnol. 4(8), 505–509
(2009). https://doi.org/10.1038/nnano.2009.177
82. C. Lee, X. Wei, J.W. Kysar, J. Hone, Measurement of the elastic
properties and intrinsic strength of monolayer graphene. Science
321(5887), 385–388 (2008). https://doi.org/10.1126/science.
1157996
83. A.A. Kornyshev, Double-layer in ionic liquids: paradigm
change? J. Phys. Chem. B 111(20), 5545–5557 (2007). https://
doi.org/10.1021/jp067857o
84. J. Vatamanu, L. Xing, W. Li, D. Bedrov, Influence of temper-
ature on the capacitance of ionic liquid electrolytes on charged
surfaces. Phys. Chem. Chem. Phys. 16(11), 5174–5182 (2014).
https://doi.org/10.1039/c3cp54705a
85. Z. Hu, J. Vatamanu, O. Borodin, D. Bedrov, A comparative
study of alkylimidazolium room temperature ionic liquids with
FSI and TFSI anions near charged electrodes. Electrochim. Acta
145, 40–52 (2014). https://doi.org/10.1016/j.electacta.2014.08.
072
86. H. Zongzhi, V. Jenel, B. Oleg, B. Dmitry, A molecular dynamics
simulation study of the electric double layer and capacitance of
[BMIM][PF6] and [BMIM][BF4] room temperature ionic liq-
uids near charged surfaces. Phys. Chem. Chem. Phys. 15(34),14234–14247 (2013). https://doi.org/10.1039/c3cp51218e
87. J. Hafner, Ab-initio simulations of materials using VASP: den-
sity-functional theory and beyond. J. Comput. Chem. 29(13),2044–2078 (2008). https://doi.org/10.1002/jcc.21057
88. J. Vatamanu, X. Ni, F. Liu, D. Bedrov, Tailoring graphene-based
electrodes from semiconducting to metallic to increase the energy
density in supercapacitors. Nanotechnology 26(46), 464001
(2015). https://doi.org/10.1088/0957-4484/26/46/464001
89. L. Chen, X. Li, C. Ma, M. Wang, J. Zhou, Interaction and
quantum capacitance of nitrogen/sulfur co-doped graphene: a
theoretical calculation. J. Phys. Chem. C 121(34), 18344–18350(2017). https://doi.org/10.1021/acs.jpcc.7b04551
90. S. Mao, H. Pu, J. Chen, Graphene oxide and its reduction:
modeling and experimental progress. RSC Adv. 2(7),2643–2662 (2012). https://doi.org/10.1039/C2RA00663D
91. A.D. DeYoung, S.-W. Park, N.R. Dhumal, Y. Shim, Y. Jung,
H.J. Kim, Graphene oxide supercapacitors: a computer simula-
tion study. J. Phys. Chem. C 118(32), 18472–18480 (2014).
https://doi.org/10.1021/jp5072583
92. K. Xu, X. Ji, C. Chen, H. Wan, L. Miao, J. Jiang, Electro-
chemical double layer near polar reduced graphene oxide elec-
trode: insights from molecular dynamic study. Electrochim.
Acta 166, 142–149 (2015). https://doi.org/10.1016/j.electacta.
2015.03.101
93. S. Li, G. Feng, P.T. Cummings, Interfaces of dicationic ionic
liquids and graphene: a molecular dynamics simulation study.
J. Phys-Condens. Matter 26(28), 284106 (2014). https://doi.org/
10.1088/0953-8984/26/28/284106
94. S. Jo, S.-W. Park, Y. Shim, Y. Jung, Effects of alkyl chain
length on interfacial structure and differential capacitance in
graphene supercapacitors: a molecular dynamics simulation
study. Electrochim. Acta 247, 634–645 (2017). https://doi.org/
10.1016/j.electacta.2017.06.169
95. X. Liu, Y. Wang, S. Li, T. Yan, Effects of anion on the electric
double layer of imidazolium-based ionic liquids on graphite
electrode by molecular dynamics simulation. Electrochim. Acta
184, 164–170 (2015). https://doi.org/10.1016/j.electacta.2015.
10.064
96. J. Vatamanu, O. Borodin, G.D. Smith, Molecular simulations of
the electric double layer structure, differential capacitance, and
charging kinetics for n-methyl-n-propylpyrrolidinium bis(fluo-
rosulfonyl)imide at graphite electrodes. J. Phys. Chem. B
115(12), 3073–3084 (2011). https://doi.org/10.1021/jp2001207
97. M. Wu, W. Li, S. Li, G. Feng, Capacitive performance of amino
acid ionic liquid electrolyte-based supercapacitors by molecular
dynamics simulation. RSC Adv. 7(46), 28945–28950 (2017).
https://doi.org/10.1039/c7ra00443e
98. E. Sedghamiz, M. Moosavi, Tricationic ionic liquids: structural
and dynamical properties via molecular dynamics simulations.
J. Phys. Chem. B 121(8), 1877–1892 (2017). https://doi.org/10.
1021/acs.jpcb.6b10766
99. Y.N. Ahn, S.H. Lee, G.S. Lee, H. Kim, Effect of alkyl branches
on the thermal stability of quaternary ammonium cations in
organic electrolytes for electrochemical double layer capacitors.
Phys. Chem. Chem. Phys. 19(30), 19959–19966 (2017). https://
doi.org/10.1039/c7cp03209a
100. J. Vatamanu, O. Borodin, Ramifications of water-in-salt inter-
facial structure at charged electrodes for electrolyte electro-
chemical stability. J. Phys. Chem. Lett. 8(18), 4362–4367
(2017). https://doi.org/10.1021/acs.jpclett.7b01879
101. R.S. Kuhnel, D. Reber, A. Remhof, R. Figi, D. Bleiner, C.
Battaglia, ‘‘Water-in-salt’’ electrolytes enable the use of cost-
effective aluminum current collectors for aqueous high-voltage
batteries. Chem. Commun. 52(68), 10435–10438 (2016). https://
doi.org/10.1039/c6cc03969c
102. S. Kondrat, P. Wu, R. Qiao, A.A. Kornyshev, Accelerating
charging dynamics in subnanometre pores. Nat. Mater. 13(4),387–393 (2014). https://doi.org/10.1038/nmat3916
103. G. Feng, P.T. Cummings, Supercapacitor capacitance exhibits
oscillatory behavior as a function of nanopore size. J. Phys.
Chem. Lett. 2(22), 2859–2864 (2011). https://doi.org/10.1021/
jz201312e
104. S.R. Varanasi, S.K. Bhatia, Capacitance optimization in
nanoscale electrochemical supercapacitors. J. Phys. Chem. C
119(31), 17573–17584 (2015). https://doi.org/10.1021/acs.jpcc.
5b04254
123
33 Page 22 of 23 Nano-Micro Lett. (2018) 10:33
105. D.E. Jiang, J. Wu, Unusual effects of solvent polarity on
capacitance for organic electrolytes in a nanoporous electrode.
Nanoscale 6(10), 5545–5550 (2014). https://doi.org/10.1039/
C4NR00046C
106. D.-E. Jiang, Z. Jin, D. Henderson, J. Wu, Solvent effect on the
pore-size dependence of an organic electrolyte supercapacitor.
J. Phys. Chem. Lett. 3(13), 1727–1731 (2012). https://doi.org/
10.1021/jz3004624
107. R. Burt, K. Breitsprecher, B. Daffos, P.-L. Taberna, P. Simon,
G. Birkett, X.S. Zhao, C. Holm, M. Salanne, Capacitance of
nanoporous carbon-based supercapacitors is a trade-off between
the concentration and the separability of the ions. J. Phys. Chem.
Lett. 7(19), 4015–4021 (2016). https://doi.org/10.1021/acs.
jpclett.6b01787
108. B. Uralcan, I.A. Aksay, P.G. Debenedetti, D.T. Limmer, Con-
centration fluctuations and capacitive response in dense ionic
solutions. J. Phys. Chem. Lett. 7(13), 2333–2338 (2016). https://
doi.org/10.1021/acs.jpclett.6b00859
109. M.H. Kowsari, L. Tohidifar, Tracing dynamics, self-diffusion,
and nanoscale structural heterogeneity of pure and binary mix-
tures of ionic liquid 1-hexyl-2,3-dimethylimidazolium bis(fluo-
rosulfonyl)imide with acetonitrile: insights from molecular
dynamics simulations. J. Phys. Chem. B 120(41), 10824–10838(2016). https://doi.org/10.1021/acs.jpcb.6b08396
110. Q. Zhang, P. Xie, X. Wang, X. Yu, Z. Shi, S. Zhao, Thermo-
dynamic and transport properties of spiro-(1,10)-bipyrrolidiniumtetrafluoroborate and acetonitrile mixtures: a molecular
dynamics study. Chin. Phys. B 25(6), 066102 (2016). https://doi.org/10.1088/1674-1056/25/6/066102
111. H. Yang, J. Yang, Z. Bo, X. Chen, X. Shuai, J. Kong, J. Yan, K.
Cen, Kinetic-dominated charging mechanism within represen-
tative aqueous electrolyte-based electric double-layer capacitors.
J. Phys. Chem. Lett. 8(15), 3703–3710 (2017). https://doi.org/
10.1021/acs.jpclett.7b01525
112. C. Lian, K. Liu, H. Liu, J. Wu, Impurity effects on charging
mechanism and energy storage of nanoporous supercapacitors.
J. Phys. Chem. C 121(26), 14066–14072 (2017). https://doi.org/
10.1021/acs.jpcc.7b04869
113. P. Wu, J. Huang, V. Meunier, B.G. Sumpter, R. Qiao, Voltage
dependent charge storage modes and capacity in subnanometer
pores. J. Phys. Chem. Lett. 3(13), 1732–1737 (2012). https://doi.
org/10.1021/jz300506j
114. J. Vatamanu, O. Borodin, G.D. Smith, Molecular insights into
the potential and temperature dependences of the differential
capacitance of a room-temperature ionic liquid at graphite
electrodes. J. Am. Chem. Soc. 132(42), 14825–14833 (2010).
https://doi.org/10.1021/ja104273r
115. R.K. Kalluri, D. Konatham, A. Striolo, Aqueous NaCl solutions
within charged carbon-slit pores: partition coefficients and
density distributions from molecular dynamics simulations.
J. Phys. Chem. C 115(28), 13786–13795 (2011). https://doi.org/
10.1021/jp203086x
116. T. Ohba, N. Kojima, H. Kanoh, K. Kaneko, Unique hydrogen-
bonded structure of water around Ca ions confined in carbon slit
pores. J. Phys. Chem. C 113(29), 12622–12624 (2009). https://
doi.org/10.1021/jp9030688
117. N.N. Rajput, J. Monk, R. Singh, F.R. Hung, On the influence of
pore size and pore loading on structural and dynamical hetero-
geneities of an ionic liquid confined in a slit nanopore. J. Phys.
Chem. C 116(8), 5169–5181 (2012). https://doi.org/10.1021/
jp212440f
118. S. Salemi, H. Akbarzadeh, S. Abdollahzadeh, Nano-confined
ionic liquid [emim][PF6] between graphite sheets: a molecular
dynamics study. J. Mol. Liq. 215, 512–519 (2016). https://doi.
org/10.1016/j.molliq.2016.01.035
119. J. Kong, Z. Bo, H. Yang, J. Yang, X. Shuai, J. Yan, K. Cen,
Temperature dependence of ion diffusion coefficients in nacl
electrolyte confined within graphene nanochannels. Phys. Chem.
Chem. Phys. 19(11), 7678–7688 (2017). https://doi.org/10.1039/
c6cp08752c
120. S.A. Kislenko, R.H. Amirov, I.S. Samoylov, Influence of tem-
perature on the structure and dynamics of the [BMIM][PF6]
ionic liquid/graphite interface. Phys. Chem. Chem. Phys. 12(37),11245–11250 (2010). https://doi.org/10.1039/c0cp00220h
121. R. Singh, J. Monk, F.R. Hung, Heterogeneity in the dynamics of
the ionic liquid [BMIM?][PF6-] confined in a slit nanopore.
J. Phys. Chem. C 115(33), 16544–16554 (2011). https://doi.org/
10.1021/jp2046118
122. W. Yuan, Y. Zhou, Y. Li, C. Li, H. Peng, J. Zhang, Z. Liu, L.
Dai, G. Shi, The edge- and basal-plane-specific electrochemistry
of a single-layer graphene sheet. Sci. Rep. 3, 2248 (2013).
https://doi.org/10.1038/srep02248
123. C. Zhan, Y. Zhang, P.T. Cummings, D.-E. Jiang, Computational
insight into the capacitive performance of graphene edge planes.
Carbon 116, 278–285 (2017). https://doi.org/10.1016/j.carbon.
2017.01.104
124. V.N. Popov, Carbon nanotubes: properties and application.
Mater. Sci. Eng. R-Rep. 43(3), 61–102 (2004). https://doi.org/
10.1016/j.mser.2003.10.001
125. H.J. Dai, Carbon nanotubes: opportunities and challenges. Surf.
Sci. 500(1–3), 218–241 (2002). https://doi.org/10.1016/s0039-
6028(01)01558-8
126. M. Trojanowicz, Analytical applications of carbon nanotubes: a
review. Trac-trends Anal. Chem. 25(5), 480–489 (2006). https://
doi.org/10.1016/j.trac.2005.11.008
127. L. Yang, B.H. Fishbine, A. Migliori, L.R. Pratt, Molecular
simulation of electric double-layer capacitors based on carbon
nanotube forests. J. Am. Chem. Soc. 131(34), 12373–12376
(2009). https://doi.org/10.1021/ja9044554
128. A. Dive, S. Banerjee, Ion storage in nanoconfined interstices
between vertically aligned nanotubes in electric double-layer
capacitors. J. Electrochem. Energy Convers. 15(1), 011001
(2017). https://doi.org/10.1115/1.4037582
129. K. Dong, G. Zhou, X. Liu, X. Yao, S. Zhang, A. Lyubartsev,
Structural evidence for the ordered crystallites of ionic liquid in
confined carbon nanotubes. J. Phys. Chem. C 113(23),10013–10020 (2009). https://doi.org/10.1021/jp900533k
130. O.N. Kalugin, V.V. Chaban, V.V. Loskutov, O.V. Prezhdo,
Uniform diffusion of acetonitrile inside carbon nanotubes favors
supercapacitor performance. Nano Lett. 8(8), 2126–2130
(2008). https://doi.org/10.1021/nl072976g
131. R.J. Mashl, S. Joseph, N.R. Aluru, E. Jakobsson, Anomalously
immobilized water: a new water phase induced by confinement
in nanotubes. Nano Lett. 3(5), 589–592 (2003). https://doi.org/
10.1021/nl0340226
132. L. Yang, S. Garde, Modeling the selective partitioning of cations
into negatively charged nanopores in water. J. Chem. Phys.
126(8), 084706 (2007). https://doi.org/10.1063/1.2464083
133. T. Ohba, Fast ion transportation associated with recovering
hydration shells in a nanoelectrolyte between conical carbon
nanopores during charging cycles. J. Phys. Chem. C 121(19),10439–10444 (2017). https://doi.org/10.1021/acs.jpcc.7b02326
134. D. Pech, M. Brunet, H. Durou, P. Huang, V. Mochalin, Y.
Gogotsi, P.-L. Taberna, P. Simon, Ultrahigh-power micrometre-
sized supercapacitors based on onion-like carbon. Nat. Nan-
otechnol. 5(9), 651–654 (2010). https://doi.org/10.1038/nnano.
2010.162
135. G. Feng, D.-E. Jiang, P.T. Cummings, Curvature effect on the
capacitance of electric double layers at ionic liquid/onion-like
carbon interfaces. J. Chem. Theory Comput. 8(3), 1058–1063(2012). https://doi.org/10.1021/ct200914j
123
Nano-Micro Lett. (2018) 10:33 Page 23 of 23 33