design of tat twam asi-discrepancy evaluation model based
TRANSCRIPT

Available online at www.ijournalse.org
Emerging Science Journal (ISSN: 2610-9182)
Vol. 5, No. 3, June, 2021
Page | 392
Design of Tat Twam Asi-Discrepancy Evaluation Model Based
on TOPSIS in Determining the Improvement Priority Aspect
Dewa Gede Hendra Divayana 1*, Agus Adiarta 2, P. Wayan Arta Suyasa 3
1 Department of IT Education,Universitas Pendidikan Ganesha, Jl. Udayana No. 11 Singaraja, Bali, 81116, Indonesia
2 Department of Electrical Education,Universitas Pendidikan Ganesha, Jl. Udayana No. 11 Singaraja, Bali, 81116, Indonesia
3 Department of IT Education,Universitas Pendidikan Ganesha, Jl. Udayana No. 11 Singaraja, Bali, 81116, Indonesia
Abstract
This research aimed to provide information about the existence of the new evaluation model in the field of education. The intended evaluation model is called the Tat Twam Asi-Discrepancy
evaluation model based on TOPSIS. This model serves to determine the dominant aspects become
improvement priority, so later it can trigger the effectiveness of blended learning implementation. The method was used in this research was a development method using the Borg and Gall model,
which only focused on the design development stage. Subjects were involved in the initial trials of
the evaluation model design were four experts and 30 respondents to conducted simulation trials of TOPSIS calculation. The tools were used to conducted preliminary trials toward the evaluation
model design and simulation trials of calculations were questionnaires. Analysis of the initial trial
results toward the model design was done by comparing the quality percentage of the test results with the percentage of quality standards that refer to the eleven’s scale. Analysis of the simulation
test results of the TOPSIS calculation was done by comparing the effectiveness percentage of the
test results with the percentage of effectiveness standards that refer to the five’s scale. The results of this research indicate this evaluation model is highly qualified and effective is used to determine the
most dominant evaluation aspect to become an improvement priority to realize the effectiveness of
blended learning implementation.
Keywords:
Evaluation Model;
Tat Twam Asi;
Discrepancy;
TOPSIS;
Blended Learning.
Article History:
Received: 02 February 2021
Revised: 09 May 2021
Accepted: 22 May 2021
Published: 01 June 2021
1- Introduction
The learning process in schools has changed since the appearance of the Industry Revolution 4.0 era. One of those
changes is the change in learning models applied in schools. In general, most senior high schools or vocational schools
in Indonesia have implemented blended learning as a learning model that is used in the learning process [1].
Nevertheless, the facts in the field show that there are still several senior high schools or vocational schools of IT
(especially in Bali) that have not been fully effective in implementing blended learning as a learning model [2]. The
ineffectiveness is caused by several aspects, included: the unpreparedness legality of the blended learning
implementation, the unpreparedness of academic community support in organizing blended learning, the unpreparedness
of budgetary, the unpreparedness of the development team’s ability, the unpreparedness of the users’ capability to
operate the blended learning, the unpreparedness of supporting infrastructures, and so on. From those aspects, it is
necessary to know the dominant aspect as a priority to be improved so that from the beginning can is conducted
optimal efforts to realize the effectiveness of blended learning implementation.
*CONTACT: [email protected]
DOI: http://dx.doi.org/10.28991/esj-2021-01285
© 2021 by the authors. Licensee ESJ, Italy. This is an open access article under the terms and conditions of the Creative Commons Attribution (CC-BY) license (https://creativecommons.org/licenses/by/4.0/).

Emerging Science Journal | Vol. 5, No. 3
Page | 393
Based on those problems, it is necessary to do a holistic evaluation of the blended learning implementation at senior
high schools or vocational schools of IT in Bali. Some of the efforts that had been conducted were evaluation activities
using several general models of educational evaluation, included: CIPP, Countenance, CSE-UCLA, Discrepancy, and
others [3, 4]. However, some of those general models have not been able to holistically and accurately determine the
dominant aspect that is the priority of improvement. Based on that situation, it is necessary to modify those general
models of educational evaluation.
One effort that can be done is to modify the Discrepancy model with the Tat Twam Asi concept and the TOPSIS
method. The Discrepancy model is an educational evaluation model that shows the imbalances or differences that
occur between the evaluation results in the field with established evaluation standards [5]. The Discrepancy model
consists of four evaluation components, included: definition, installation, process, and product [6]. Tat Twam Asi is the
concept of local wisdom in Bali that upholds equality rights in social relationships to maintain harmony in life [7]. Tat
Twam Asi is also often interpreted with the phrase “I am you” or “I and you are the same”. That phrase implies
equality [8].
The TOPSIS (Technique for Order Preference by Similarity to Ideal Solution) method is one of the decision support
system methods that the principle of finding choice alternatives by determining the farthest distance from negative
ideal solutions and the shortest distance from positive ideal solutions. The negative ideal solutions consist of all the
worst values that can be achieved by criteria, while, the positive ideal solutions consist of all the best values that can be
achieved by criteria [9, 10]. Referring to that efforts, so this research question: “how is the design of the Discrepancy
model modified with the Tat Twam Asi concept and the TOPSIS method in determining the dominant aspects, that
need to be improved to trigger the effectiveness of blended learning implementation, especially at IT vocational
schools in Bali?”
This research was base-lined on some studies that had been conducted previously by several researchers regarding
the evaluation of the blended learning implementation or distance education. The research was conducted by Mutawa
(2017) [11] showed that the evaluation of blended learning used the Technology Acceptance Module (TAM), but did
not use an educational evaluation model specifically. The limitation of Mutawa’s research showed there were no
aspects of educational evaluation that were used as a basis for evaluating blended learning in the view of educational
dimensions. The research was conducted by Lippe and Carter (2018) [12] showed an evaluation of the distance
learning model using the CIPP model. The limitation of Lippe and Carter’s research was it had not shown the
dominant aspect become improvement priority, so it was challenging to implement all the recommendations that were
recommended simultaneously at the same time. The research was conducted by Thurab-Nkhosi (2019) [13] showed the
use of the CIPP model to evaluate blended learning that was implemented at the faculty level. The limitation of
Thurab-Nkhosi’s research was it had not shown the complete presentation of evaluation results in each of the
evaluation components of context, input, process, and product. Besides, Thurab-Nkhosi’s research also was it had not
shown the calculation process in determining the dominant aspect, which was prioritized for improvement to realize
the effectiveness of blended learning implementation.
The research was conducted by Martín-Martínez et al. (2020) [14] showed the existence of evaluation activities
toward blended learning. The limitation of Martín-Martínez et al.’s research was that it had not shown the dominant
aspect that becomes improvement priority. The research was conducted by Mantara et al. (2020) [15] showed
evaluation activities toward learning media used in online learning during the Covid-19 pandemic. The limitation of
Mantara et al.’s research was it had not shown the educational evaluation model used in evaluating the learning media
in online learning. The research was conducted by Habib and Ramzan (2020) [16] showed the results of performance
assessment and analysis of blended learning. The limitation of Habib and Ramzan’s research was it had not shown a
specific educational evaluation model to be used as a basis for conducting the assessment. The research was conducted
by Naibaho (2021) [17] showed evaluation activity toward online learning using the CSE-UCLA evaluation model.
The limitation of Naibaho’s research was that it had not shown the dominant aspect that needs to be improved for
enhancing online learning.
2- Material and Methods
This research used a development approach. The development method was used refers to the Borg and Gall
development design, which focuses on the design development stage. At the design development stage, several
attributes were needed, included: evaluation aspects of the Discrepancy model, the percentage of evaluation success
standards, the imbalances values of each evaluation aspect, weights of decision-makers refer to the Tat Twam Asi
concept, and the TOPSIS formula.
The numbers of experts were involved in conducting the initial trials of the evaluation model design were four
experts (two education experts and two informatics experts). In addition to experts, 30 teachers were involved in
conducting a simulation of TOPSIS calculation to determine the dominant aspect that needed to be improved. Those
teachers came from several IT vocational schools in six regencies in Bali, included: Tabanan, Klungkung, Denpasar,
Badung, Buleleng, and Gianyar.

Emerging Science Journal | Vol. 5, No. 3
Page | 394
The tools that were used to collect data of the initial trial results toward the evaluation model design used
questionnaires, each consisting of 10 questions with a choice of answers from each question based on the Likert
measurement scale. The tools were used to collect data of the results of TOPSIS calculation simulation trials used
questionnaires were consisting of 10 questions with the choice of answers to each question, also referring to the Likert
measurement scale.
The data analysis from the initial trial results of the evaluation model design was done by comparing the average of
the quality percentage of the design trial results with the percentage of the design quality standard that refers to the
eleven’s scale. The quality standards of eleven’s scale consist of scores range of 95-100 for the ‘Excellent’ category,
scores of 85-94 for the ‘Good’ category, scores of 75-84 for the ‘Advanced’ category, scores of 65-74 for the
‘Intermediate’ category, scores of 55-64 for the ‘Enough’ category, scores of 45-54 for the ‘Elementary’ category,
scores of 35-44 for the ‘Less’ category, scores of 25-34 for the ‘Very Less’ category, scores of 15-24 for the ‘Bad’
category, scores of 5-14 for the ‘Very Bad’ category, and scores of 0-4 for the ‘Poor’ category [18]. If the quality
standards percentage of the design trial results that have been obtained include in the excellent category, good,
advanced, and intermediate, then there is no need to revise the evaluation model design. If outside the category, then it
needs to conduct a re-trial of the evaluation model design by involving more respondents and have a deeper
perspective on the evaluation model design.
Analysis of the simulation trial results of the TOPSIS calculation was done by comparing the effectiveness
percentage average of the calculation trial results with the standard percentage of calculation effectiveness that refers
to the five’s scale. The effectiveness standards of five’s scale consist of scores range of 90-100 for the ‘Very
Effective’ category, scores of 80-89 for the ‘Effective’ category, scores of 65-79 for the ‘Moderate’ category, scores of
55-64 for the ‘Less Effective’ category, and scores of 0-54 for the ‘Ineffective’ category [19, 20]. If the percentage of
calculation effectiveness standards that have been obtained include in a very effective and effective category, then
there is no need to revise/re-calculate the TOPSIS calculation. If outside the category, then it necessary to re-simulate
the TOPSIS calculation by involving more qualified respondents.
The formula that is used to determine the percentage of quality standards and effectiveness standards [21] can be
seen in Equation 1. The formula for simulation of the TOPSIS calculation consists of several equations, included:
Equation 2 for calculating normalized matrix [22], Equation 3 for determining scores of matrix-Y [23], Equations 4
and 5 for determining the matrix of negative ideal solutions (A-) and matrix of positive ideal solutions (A+) [24],
Equations 6 and 7 to determine the distance between the values of each indicator with the negative ideal solutions (D i-)
and the positive ideal solutions (Di+) [25, 26], and Equation 8 to determine the preference scores of each indicator (Vi)
[27].
P = (f/N) × 100% (1)
where: P: percentage of quality or effectiveness; f: the total scores that have been obtained; and N: the total of
maximum scores.
(2)
where: i = 1,2,3,....m, and j = 1,2,3 ... n; xij: basic matrix; i: the row of the matrix; j: the column of the matrix; and rij:
matrix of normalized results from the basic matrix.
yij = wi*rij (3)
where: yij: Matrix-Y; wi: the weights of the decision-makers (the weights that have been generalized by using the
concept of Tat Twam Asi); and rij: Matrix-R.
(4)
(5)
where:
nyyyA ,,, 21
nyyyA ,,, 21
attributecost is j if;max
attributebenefit is j ;min
iji
iji
j
y
ify
y
attributecost is j if;min
attributebenefit is j ;max
iji
iji
j
y
ify
y
m
i
ij
ij
ij
x
xr
1
2

Emerging Science Journal | Vol. 5, No. 3
Page | 395
(6)
(7)
(8)
3- Results and Discussion
This research had succeeded in obtaining data related to the five essential components that were used as a basis for
designing the Discrepancy evaluation model that modification by the Tat Twam Asi concept and the TOPSIS method.
Those components, included: 1) the evaluation aspects of the Discrepancy model, 2) the percentage of evaluation
success standards, 3) the imbalance values of each evaluation aspect, 4) the weights of the decision-makers that refers
to the Tat Twam Asi concept, and 5) the TOPSIS formula. The evaluation aspects of the Discrepancy model completely
can be seen in Table 1. The percentage of evaluation success standards can be seen in Table 2. The imbalance values of
each evaluation aspect can be seen in Table 3. The weights of the decision-makers that refer to the Tat Twam Asi
concept can be seen in Table 4. The TOPSIS formula has been explained previously in Equations 2 to 8.
Table 1. Evaluation aspects of the Discrepancy model that was used to evaluate the blended learning implementation at IT vocational schools in Bali.
Evaluation Components Evaluation Aspects
Definition
A1 Legal regulations for the implementation of blended learning
A2 Parents’ support
A3 Teachers and students’ support
Installation
A4 Funding Readiness
A5 The readiness of facilities and infrastructures
A6 Management team readiness
A7 The preparedness of users’ ability
Process
A8 Socialization about the use of blended learning
A9 Implementation of learning through blended learning
A10 Funding management
Product
A11 Users’ satisfaction on the tangible dimension
A12 Users’ satisfaction on the reliability dimension
A13 Users’ satisfaction on the responsiveness dimension
A14 Users’ satisfaction on the assurance dimension
A15 Users’ satisfaction on the empathy dimension
Table 2. Percentage of success standards for evaluating the blended learning implementation at IT vocational schools in Bali.
Codes of aspects The percentage of evaluation success standards
A1 > 88 %
A2 > 88 %
A3 > 88 %
A4 > 82 %
A5 > 82 %
A6 > 85 %
A7 > 84 %
A8 > 85 %
A9 > 84 %
A10 > 90 %
A11 > 85 %
A12 > 85 %
A13 > 85 %
A14 > 85 %
A15 > 85 %
n
j
iiji yyD1
2
n
j
ijii yyD1
2
ii
ii
DD
DV

Emerging Science Journal | Vol. 5, No. 3
Page | 396
Table 3. Imbalance values for each aspect of evaluation.
Codes of aspects Percentage of assessment from
30 respondents (%)
Minimum percentage of the
evaluation success standards (%) Imbalance Values (%)
A1 91.333 88.000 3.333
A2 90.667 88.000 2.667
A3 88.667 88.000 0.667
A4 79.333 82.000 -2.667
A5 80.000 82.000 -2.000
A6 87.333 85.000 2.333
A7 88.667 84.000 4.667
A8 88.667 85.000 3.667
A9 88.000 84.000 4.000
A10 76.667 90.000 -13.333
A11 88.000 85.000 3.000
A12 89.333 85.000 4.333
A13 88.667 85.000 3.667
A14 88.667 85.000 3.667
A15 87.333 85.000 2.333
Table 4. The weights of the experts/decision-makers that refers to the Tat Twam Asi concept.
Aspects Weights
Average of
weights
Tat Twam Asi-Based
Weights Expert-1 Expert-2 Expert-3 Expert-4
A1 5 4 5 5 4.750 0.071
A2 4 4 4 4 4.000 0.060
A3 4 4 4 4 4.000 0.060
A4 4 4 3 4 3.750 0.056
A5 4 4 4 3 3.750 0.056
A6 4 5 4 5 4.500 0.067
A7 4 4 5 3 4.000 0.060
A8 4 4 5 5 4.500 0.067
A9 4 5 4 4 4.250 0.063
A10 4 5 5 5 4.750 0.071
A11 4 5 5 4 4.500 0.067
A12 4 5 4 5 4.500 0.067
A13 4 5 4 5 4.500 0.067
A14 5 4 4 5 4.500 0.067
A15 4 5 4 5 4.500 0.067
A16 2 2 2 3 2.250 0.034
∑ 67.000 1.000
Design of Discrepancy evaluation model that modification with the concept of Tat Twam Asi and the TOPSIS
method was able to be made after the attributes of the design completeness were fulfilled. That model design can be
seen in Figure 1.

Emerging Science Journal | Vol. 5, No. 3
Page | 397
Definition Installation Process Product
I-1 I-2 I-3 I-4 I-5 I-6 I-7
Percentage of
Respondents'
Scoring
Percentage of
Evaluation
Standards
Imbalance
(A16)Aspects of Evaluation
Weights from
Experts based on
the Concept of
Tat Twam Asi
TOPSIS Calculation
The Dominant Aspect that Needs to be
Improved to Realize the Effectiveness of
Blended Learning Implementation
Codes of Indicators
Components of
Discrepancy
Evaluation Model
I-8 I-9 I-10 I-11 I-12 I-13 I-14 I-15
A1 A2 A3 A4 A5 A6 A7 A8 A9 A10 A11 A12 A13 A14 A15
Figure 1. Design of Discrepancy evaluation model that modified by the Tat Twam Asi and TOPSIS.
Figure 1 above showed the evaluation model design made from the combination of the Discrepancy model, the Tat
Twam Asi concept, and the TOPSIS method. The Discrepancy model consists of four components, included:
Definition, Installation, Process, and Product. The definition component consists of three indicators that contain
questions related to the definition component. Likewise, the installation component consists of four indicators. The
process component consists of three indicators, and the product component consists of five indicators. The respondents
gave rating scores for those indicators. Respondent’s rating scores for each indicator were converted into percentages
form. The percentage of respondents’ assessment then compared with the minimum percentage of the evaluation
success standards. The results of that comparison showed imbalance values. That imbalance was used as the 16th
aspect (an aspect of imbalance) of a total of 15 aspects of the Discrepancy evaluation model that had existed
previously. That sixteen evaluation aspects were given equal weights from experts who refer to the Tat Twam Asi
concept, and then a TOPSIS calculation was performed. The TOPSIS calculation results were used as a determinant of
the dominant aspect that needs to be improved to realize the effectiveness of blended learning implementation.
Initial trials toward the design of the Tat Twam Asi-Discrepancy evaluation model based on TOPSIS were
conducted to determine the percentage of the design quality. The initial trial results that had been carried out by four
experts on the evaluation model design can be seen in Table 5.
Table 5. Initial trial results toward the design of the Tat Twam Asi-Discrepancy evaluation model based on TOPSIS.
No. Respondents Items-
∑ Quality Percentage (%) 1 2 3 4 5 6 7 8 9 10
1 Education Expert-1 5 4 4 5 4 4 4 5 4 5 44 88.00
2 Education Expert-2 4 4 4 4 5 4 5 4 4 4 42 84.00
3 Informatics Expert-1 5 4 5 4 4 4 4 4 4 5 43 86.00
4 Informatics Expert-2 4 5 4 4 5 4 5 4 5 5 45 90.00
Average 87.00
Notes:
Item-1: Completeness of the evaluation components;
Item-2: Suitable instrument items for each evaluation component;
Item-3: Clarity of the respondent’s assessment component of each instrument item in each evaluation aspect;
Item-4: Clarity of minimum standards for evaluation success;
Item-5: Suitable aspects with the Discrepancy model evaluation;
Item-6: Suitable aspects of imbalance;
Item-7: Completeness of the expert’s weights;
Item-8: Clarity of TOPSIS calculation components;
Item-9: Clarity of the stages to determine the dominant aspects;
Item-10: Appropriate data flow chart in the design.

Emerging Science Journal | Vol. 5, No. 3
Page | 398
Based on the data shown in Table 3, initial data was able to be compiled to determine the normalized matrix needed
in the TOPSIS calculation process. That initial data can be seen in Table 6.
Table 6. Preliminary data for normalized matrix calculations.
Indicators Aspects
A1 A2 A3 A4 A5 A6 A7 A8 A9 A10 A11 A12 A13 A14 A15 A16
I-1 91.333 86.756 86.756 86.756 86.756 86.756 86.756 86.756 86.756 86.756 86.756 86.756 86.756 86.756 86.756 3.333
I-2 86.756 90.667 86.756 86.756 86.756 86.756 86.756 86.756 86.756 86.756 86.756 86.756 86.756 86.756 86.756 2.667
I-3 86.756 86.756 88.667 86.756 86.756 86.756 86.756 86.756 86.756 86.756 86.756 86.756 86.756 86.756 86.756 0.667
I-4 86.756 86.756 86.756 79.333 86.756 86.756 86.756 86.756 86.756 86.756 86.756 86.756 86.756 86.756 86.756 -2.667
I-5 86.756 86.756 86.756 86.756 80.000 86.756 86.756 86.756 86.756 86.756 86.756 86.756 86.756 86.756 86.756 -2.000
I-6 86.756 86.756 86.756 86.756 86.756 87.333 86.756 86.756 86.756 86.756 86.756 86.756 86.756 86.756 86.756 2.333
I-7 86.756 86.756 86.756 86.756 86.756 86.756 88.667 86.756 86.756 86.756 86.756 86.756 86.756 86.756 86.756 4.667
I-8 86.756 86.756 86.756 86.756 86.756 86.756 86.756 88.667 86.756 86.756 86.756 86.756 86.756 86.756 86.756 3.667
I-9 86.756 86.756 86.756 86.756 86.756 86.756 86.756 86.756 88.000 86.756 86.756 86.756 86.756 86.756 86.756 4.000
I-10 86.756 86.756 86.756 86.756 86.756 86.756 86.756 86.756 86.756 76.667 86.756 86.756 86.756 86.756 86.756 -13.333
I-11 86.756 86.756 86.756 86.756 86.756 86.756 86.756 86.756 86.756 86.756 88.000 86.756 86.756 86.756 86.756 3.000
I-12 86.756 86.756 86.756 86.756 86.756 86.756 86.756 86.756 86.756 86.756 86.756 89.333 86.756 86.756 86.756 4.333
I-13 86.756 86.756 86.756 86.756 86.756 86.756 86.756 86.756 86.756 86.756 86.756 86.756 88.667 86.756 86.756 3.667
I-14 86.756 86.756 86.756 86.756 86.756 86.756 86.756 86.756 86.756 86.756 86.756 86.756 86.756 88.667 86.756 3.667
I-15 86.756 86.756 86.756 86.756 86.756 86.756 86.756 86.756 86.756 86.756 86.756 86.756 86.756 86.756 87.333 2.333
Notes:
Orange blocked data were obtained from the assessment percentages of 30 respondents for each aspect that had
been shown previously in Table 3.
Yellow blocked data were obtained from the percentage of imbalance values that had been shown previously in
Table 3.
Unblocked data were obtained from the average of the assessment percentage of 30 respondents that had been
shown previously in Table 3.
Based on the data in Table 6, the normalized matrix calculations were able to be performed used Equation 2. The
calculation results of the normalized matrix can be seen as follows:
r11 = 0.2708 r44 = 0.2374 r77 = 0.2635 r1010 = 0.2299 r1313 = 0.2635
r21 = 0.2573 r54 = 0.2596 r87 = 0.2578 r1110 = 0.2601 r1413 = 0.2578
r31 = 0.2573 r64 = 0.2596 r97 = 0.2578 r1210 = 0.2601 r1513 = 0.2578
r41 = 0.2573 r74 = 0.2596 r107 = 0.2578 r1310 = 0.2601 r114 = 0.2578
r51 = 0.2573 r84 = 0.2596 r117 = 0.2578 r1410 = 0.2601 r214 = 0.2578
r61 = 0.2573 r94 = 0.2596 r127 = 0.2578 r1510 = 0.2601 r314 = 0.2578
r71 = 0.2573 r104 = 0.2596 r137 = 0.2578 r111 = 0.2580 r414 = 0.2578
r81 = 0.2573 r114 = 0.2596 r147 = 0.2578 r211 = 0.2580 r514 = 0.2578
r91 = 0.2573 r124 = 0.2596 r157 = 0.2578 r311 = 0.2580 r614 = 0.2578
r101 = 0.2573 r134 = 0.2596 r18 = 0.2578 r411 = 0.2580 r714 = 0.2578
r111 = 0.2573 r144 = 0.2596 r28 = 0.2578 r511 = 0.2580 r814 = 0.2578
r121 = 0.2573 r154 = 0.2596 r38 = 0.2578 r611 = 0.2580 r914 = 0.2578
r131 = 0.2573 r15 = 0.2595 r48 = 0.2578 r711 = 0.2580 r1014 = 0.2578
r141 = 0.2573 r25 = 0.2595 r58 = 0.2578 r811 = 0.2580 r1114 = 0.2578
r151 = 0.2573 r35 = 0.2595 r68 = 0.2578 r911 = 0.2580 r1214 = 0.2578
r12 = 0.2574 r45 = 0.2595 r78 = 0.2578 r1011 = 0.2580 r1314 = 0.2578
r22 = 0.2690 r55 = 0.2393 r88 = 0.2635 r1111 = 0.2617 r1414 = 0.2635
r32 = 0.2574 r65 = 0.2595 r98 = 0.2578 r1211 = 0.2580 r1514 = 0.2578
r42 = 0.2574 r75 = 0.2595 r108 = 0.2578 r1311 = 0.2580 r115 = 0.2581
r52 = 0.2574 r85 = 0.2595 r118 = 0.2578 r1411 = 0.2580 r215 = 0.2581
r62 = 0.2574 r95 = 0.2595 r128 = 0.2578 r1511 = 0.2580 r315 = 0.2581
r72 = 0.2574 r105 = 0.2595 r138 = 0.2578 r112 = 0.2577 r415 = 0.2581
r82 = 0.2574 r115 = 0.2595 r148 = 0.2578 r212 = 0.2577 r515 = 0.2581
r92 = 0.2574 r125 = 0.2595 r158 = 0.2578 r312 = 0.2577 r615 = 0.2581
r102 = 0.2574 r135 = 0.2595 r19 = 0.2580 r412 = 0.2577 r715 = 0.2581
r112 = 0.2574 r145 = 0.2595 r29 = 0.2580 r512 = 0.2577 r815 = 0.2581
r122 = 0.2574 r155 = 0.2595 r39 = 0.2580 r612 = 0.2577 r915 = 0.2581

Emerging Science Journal | Vol. 5, No. 3
Page | 399
r132 = 0.2574 r16 = 0.2581 r49 = 0.2580 r712 = 0.2577 r1015 = 0.2581
r142 = 0.2574 r26 = 0.2581 r59 = 0.2580 r812 = 0.2577 r1115 = 0.2581
r152 = 0.2574 r36 = 0.2581 r69 = 0.2580 r912 = 0.2577 r1215 = 0.2581
r13 = 0.2578 r46 = 0.2581 r79 = 0.2580 r1012 = 0.2577 r1315 = 0.2581
r23 = 0.2578 r56 = 0.2581 r89 = 0.2580 r1112 = 0.2577 r1415 = 0.2581
r33 = 0.2635 r66 = 0.2598 r99 = 0.2617 r1212 = 0.2653 r1515 = 0.2598
r43 = 0.2578 r76 = 0.2581 r109 = 0.2580 r1312 = 0.2577 r116 = 0.1850
r53 = 0.2578 r86 = 0.2581 r119 = 0.2580 r1412 = 0.2577 r216 = 0.1480
r63 = 0.2578 r96 = 0.2581 r129 = 0.2580 r1512 = 0.2577 r316 = 0.0370
r73 = 0.2578 r106 = 0.2581 r139 = 0.2580 r113 = 0.2578 r416 = -0.1480
r83 = 0.2578 r116 = 0.2581 r149 = 0.2580 r213 = 0.2578 r516 = -0.1110
r93 = 0.2578 r126 = 0.2581 r159 = 0.2580 r313 = 0.2578 r616 = 0.1300
r103 = 0.2578 r136 = 0.2581 r110 = 0.2601 r413 = 0.2578 r716 = 0.2590
r113 = 0.2578 r146 = 0.2581 r210 = 0.2601 r513 = 0.2578 r816 = 0.2040
r123 = 0.2578 r156 = 0.2581 r310 = 0.2601 r613 = 0.2578 r916 = 0.2220
r133 = 0.2578 r17 = 0.2578 r410 = 0.2601 r713 = 0.2578 r1016 = -0.7400
r143 = 0.2578 r27 = 0.2578 r510 = 0.2601 r813 = 0.2578 r1116 = 0.1670
r153 = 0.2578 r37 = 0.2578 r610 = 0.2601 r913 = 0.2578 r1216 = 0.2410
r14 = 0.2596 r47 = 0.2578 r710 = 0.2601 r1013 = 0.2578 r1316 = 0.2040
r24 = 0.2596 r57 = 0.2578 r810 = 0.2601 r1113 = 0.2578 r1416 = 0.2040
r34 = 0.2596 r67 = 0.2578 r910 = 0.2601 r1213 = 0.2578 r1516 = 0.1300
The results of that normalized matrix then were able to be converted into matrix-R. The display of the matrix-R can
be seen in Figure 2.
0.2708 0.2574 0.2578 0.2596 0.2595 0.2581 0.2578 0.2578 0.2580 0.2601 0.2580 0.2577 0.2578 0.2578 0.2581 0.1850
0.2573 0.2690 0.2578 0.2596 0.2595 0.2581 0.2578 0.2578 0.2580 0.2601 0.2580 0.2577 0.2578 0.2578 0.2581 0.1480
0.2573 0.2574 0.2635 0.2596 0.2595 0.2581 0.2578 0.2578 0.2580 0.2601 0.2580 0.2577 0.2578 0.2578 0.2581 0.0370
0.2573 0.2574 0.2578 0.2374 0.2595 0.2581 0.2578 0.2578 0.2580 0.2601 0.2580 0.2577 0.2578 0.2578 0.2581 -0.1480
0.2573 0.2574 0.2578 0.2596 0.2393 0.2581 0.2578 0.2578 0.2580 0.2601 0.2580 0.2577 0.2578 0.2578 0.2581 -0.1110
0.2573 0.2574 0.2578 0.2596 0.2595 0.2598 0.2578 0.2578 0.2580 0.2601 0.2580 0.2577 0.2578 0.2578 0.2581 0.1300
0.2573 0.2574 0.2578 0.2596 0.2595 0.2581 0.2635 0.2578 0.2580 0.2601 0.2580 0.2577 0.2578 0.2578 0.2581 0.2590
R= 0.2573 0.2574 0.2578 0.2596 0.2595 0.2581 0.2578 0.2635 0.2580 0.2601 0.2580 0.2577 0.2578 0.2578 0.2581 0.2040
0.2573 0.2574 0.2578 0.2596 0.2595 0.2581 0.2578 0.2578 0.2617 0.2601 0.2580 0.2577 0.2578 0.2578 0.2581 0.2220
0.2573 0.2574 0.2578 0.2596 0.2595 0.2581 0.2578 0.2578 0.2580 0.2299 0.2580 0.2577 0.2578 0.2578 0.2581 -0.7400
0.2573 0.2574 0.2578 0.2596 0.2595 0.2581 0.2578 0.2578 0.2580 0.2601 0.2617 0.2577 0.2578 0.2578 0.2581 0.1670
0.2573 0.2574 0.2578 0.2596 0.2595 0.2581 0.2578 0.2578 0.2580 0.2601 0.2580 0.2653 0.2578 0.2578 0.2581 0.2410
0.2573 0.2574 0.2578 0.2596 0.2595 0.2581 0.2578 0.2578 0.2580 0.2601 0.2580 0.2577 0.2635 0.2578 0.2581 0.2040
0.2573 0.2574 0.2578 0.2596 0.2595 0.2581 0.2578 0.2578 0.2580 0.2601 0.2580 0.2577 0.2578 0.2635 0.2581 0.2040
0.2573 0.2574 0.2578 0.2596 0.2595 0.2581 0.2578 0.2578 0.2580 0.2601 0.2580 0.2577 0.2578 0.2578 0.2598 0.1300
Figure 2. Matrix-R.
Based on the values of matrix-R and Equation 3, then the calculations were able to be performed to determine the
matrix-Y. The display of matrix-Y can be seen in Figure 3.
0.0192 0.0154 0.0155 0.0145 0.0145 0.0173 0.0155 0.0173 0.0163 0.0185 0.0173 0.0173 0.0173 0.0173 0.0173 0.0063
0.0183 0.0161 0.0155 0.0145 0.0145 0.0173 0.0155 0.0173 0.0163 0.0185 0.0173 0.0173 0.0173 0.0173 0.0173 0.0050
0.0183 0.0154 0.0158 0.0145 0.0145 0.0173 0.0155 0.0173 0.0163 0.0185 0.0173 0.0173 0.0173 0.0173 0.0173 0.0013
0.0183 0.0154 0.0155 0.0133 0.0145 0.0173 0.0155 0.0173 0.0163 0.0185 0.0173 0.0173 0.0173 0.0173 0.0173 -0.0050
0.0183 0.0154 0.0155 0.0145 0.0134 0.0173 0.0155 0.0173 0.0163 0.0185 0.0173 0.0173 0.0173 0.0173 0.0173 -0.0038
0.0183 0.0154 0.0155 0.0145 0.0145 0.0174 0.0155 0.0173 0.0163 0.0185 0.0173 0.0173 0.0173 0.0173 0.0173 0.0044
0.0183 0.0154 0.0155 0.0145 0.0145 0.0173 0.0158 0.0173 0.0163 0.0185 0.0173 0.0173 0.0173 0.0173 0.0173 0.0088
Y= 0.0183 0.0154 0.0155 0.0145 0.0145 0.0173 0.0155 0.0177 0.0163 0.0185 0.0173 0.0173 0.0173 0.0173 0.0173 0.0069
0.0183 0.0154 0.0155 0.0145 0.0145 0.0173 0.0155 0.0173 0.0165 0.0185 0.0173 0.0173 0.0173 0.0173 0.0173 0.0075
0.0183 0.0154 0.0155 0.0145 0.0145 0.0173 0.0155 0.0173 0.0163 0.0163 0.0173 0.0173 0.0173 0.0173 0.0173 -0.0252
0.0183 0.0154 0.0155 0.0145 0.0145 0.0173 0.0155 0.0173 0.0163 0.0185 0.0175 0.0173 0.0173 0.0173 0.0173 0.0057
0.0183 0.0154 0.0155 0.0145 0.0145 0.0173 0.0155 0.0173 0.0163 0.0185 0.0173 0.0178 0.0173 0.0173 0.0173 0.0082
0.0183 0.0154 0.0155 0.0145 0.0145 0.0173 0.0155 0.0173 0.0163 0.0185 0.0173 0.0173 0.0177 0.0173 0.0173 0.0069
0.0183 0.0154 0.0155 0.0145 0.0145 0.0173 0.0155 0.0173 0.0163 0.0185 0.0173 0.0173 0.0173 0.0177 0.0173 0.0069
0.0183 0.0154 0.0155 0.0145 0.0145 0.0173 0.0155 0.0173 0.0163 0.0185 0.0173 0.0173 0.0173 0.0173 0.0174 0.0044
Figure 3. Matrix-Y.
After the matrix-Y was obtained, so the matrix of negative ideal solutions was able to be calculated used Equation
4, and the matrix of positive ideal solutions used Equation 5 with assuming all evaluation aspects were included in the
‘profit attribute’. The calculation results of the positive and negative ideal solution matrixes can be seen as follows.

Emerging Science Journal | Vol. 5, No. 3
Page | 400
a) matrix of negative ideal solutions
A- = {0.0183; 0.0154; 0.0155; 0.0133; 0.0134; 0.0173; 0.0155; 0.0173; 0.0163; 0.0163; 0.0173; 0.0173; 0.0173;
0.0173; 0.0173; -0.0252}
b) matrix of positive ideal solutions
A+ = {0.0192; 0.0161; 0.0158; 0.0145; 0.0145; 0.0174; 0.0158; 0.0177; 0.0165; 0.0185; 0.0175; 0.0178; 0.0177;
0.0177; 0.0174; 0.0088}
After the matrix value of the negative ideal solutions and positive ideal solutions were obtained, then the distance
between the values of each indicator was calculated with the negative ideal solutions that used Equation 6 and positive
ideal solutions that used Equation 7. The calculation results intended can be seen as follows.
a) Calculation results of the distance between the values of each indicator with the negative ideal solutions matrix;
D1- = 0.0316; D2
- = 0.0303; D3- = 0.0266; D4
- = 0.0203; D5- = 0.0215; D6
- = 0.0297; D7- = 0.0341; D8
- = 0.0322;
D9- = 0.0328; D10
- = 0.0017; D11- = 0.0310; D12
- = 0.0335; D13- = 0.0322; D14
- = 0.0322; D15- = 0.0297.
b) Calculation results of the distance between the values of each indicator with the positive ideal solutions matrix;
D1+ = 0.0028; D2
+ = 0.0040; D3+ = 0.0077; D4
+ = 0.0140; D5+ = 0.0127; D6
+ = 0.0047; D7+ = 0.0015; D8
+ = 0.0024;
D9+ = 0.0020; D10
+ = 0.0341; D11+ = 0.0035; D12
+ = 0.0016; D13+ = 0.0024; D14
+ = 0.0024; D15+ = 0.0047.
After the calculation results of the negative and positive ideal solutions matrix were obtained, so was able to be
performed the calculations of preference scores for each indicator. The calculation results intended can be seen as
follows.
V1 = 0.918; V2 = 0.883; V3 = 0.775; V4 = 0.592; V5 = 0.628; V6 = 0.864; V7 = 0.957; V8 = 0.930; V9 = 0.943; V10 =
0.047; V11 = 0.899; V12 = 0.954; V13 = 0.930; V14 = 0.930; V15 = 0.864.
The preference scores for each indicator were recapitulated entirely in the form of bar charts. The display of bar
charts intended can be seen in Figure 4.
Figure 4. Recapitulation of preference scores for each evaluation indicator.
Based on the diagram shown in Figure 4, it was able to be stated that the aspect that becomes the priority of
improvement to realize the effectiveness of blended learning implementation was the aspect of “fund management”.
0.9180.883
0.775
0.5920.628
0.864
0.9570.930
0.943
0.047
0.899
0.9540.930 0.930
0.864
0
0.1
0.2
0.3
0.4
0.5
0.6
0.7
0.8
0.9
1
V1 V2 V3 V4 V5 V6 V7 V8 V9 V10 V11 V12 V13 V14 V15
Pre
fere
nce
sco
res
Indicators
Emerging Science Journal | Vol. 5, No. 3
Page | 401
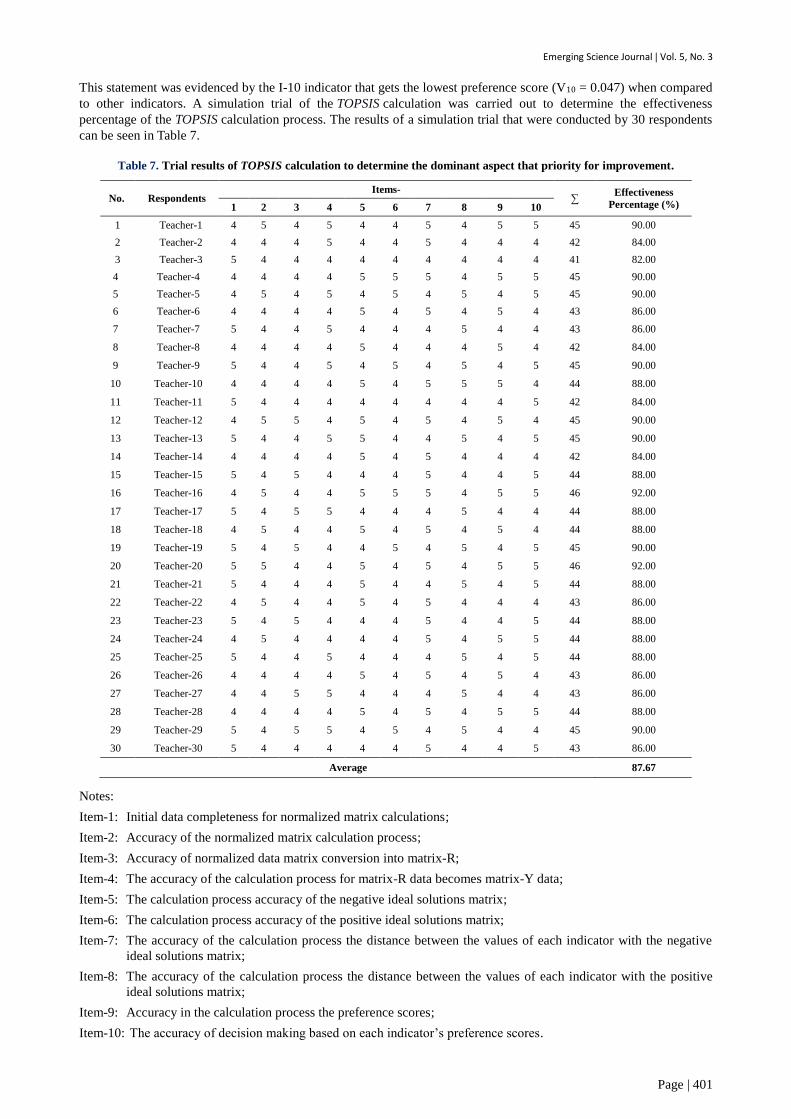
This statement was evidenced by the I-10 indicator that gets the lowest preference score (V10 = 0.047) when compared
to other indicators. A simulation trial of the TOPSIS calculation was carried out to determine the effectiveness
percentage of the TOPSIS calculation process. The results of a simulation trial that were conducted by 30 respondents
can be seen in Table 7.
Table 7. Trial results of TOPSIS calculation to determine the dominant aspect that priority for improvement.
No. Respondents Items-
∑ Effectiveness
Percentage (%) 1 2 3 4 5 6 7 8 9 10
1 Teacher-1 4 5 4 5 4 4 5 4 5 5 45 90.00
2 Teacher-2 4 4 4 5 4 4 5 4 4 4 42 84.00
3 Teacher-3 5 4 4 4 4 4 4 4 4 4 41 82.00
4 Teacher-4 4 4 4 4 5 5 5 4 5 5 45 90.00
5 Teacher-5 4 5 4 5 4 5 4 5 4 5 45 90.00
6 Teacher-6 4 4 4 4 5 4 5 4 5 4 43 86.00
7 Teacher-7 5 4 4 5 4 4 4 5 4 4 43 86.00
8 Teacher-8 4 4 4 4 5 4 4 4 5 4 42 84.00
9 Teacher-9 5 4 4 5 4 5 4 5 4 5 45 90.00
10 Teacher-10 4 4 4 4 5 4 5 5 5 4 44 88.00
11 Teacher-11 5 4 4 4 4 4 4 4 4 5 42 84.00
12 Teacher-12 4 5 5 4 5 4 5 4 5 4 45 90.00
13 Teacher-13 5 4 4 5 5 4 4 5 4 5 45 90.00
14 Teacher-14 4 4 4 4 5 4 5 4 4 4 42 84.00
15 Teacher-15 5 4 5 4 4 4 5 4 4 5 44 88.00
16 Teacher-16 4 5 4 4 5 5 5 4 5 5 46 92.00
17 Teacher-17 5 4 5 5 4 4 4 5 4 4 44 88.00
18 Teacher-18 4 5 4 4 5 4 5 4 5 4 44 88.00
19 Teacher-19 5 4 5 4 4 5 4 5 4 5 45 90.00
20 Teacher-20 5 5 4 4 5 4 5 4 5 5 46 92.00
21 Teacher-21 5 4 4 4 5 4 4 5 4 5 44 88.00
22 Teacher-22 4 5 4 4 5 4 5 4 4 4 43 86.00
23 Teacher-23 5 4 5 4 4 4 5 4 4 5 44 88.00
24 Teacher-24 4 5 4 4 4 4 5 4 5 5 44 88.00
25 Teacher-25 5 4 4 5 4 4 4 5 4 5 44 88.00
26 Teacher-26 4 4 4 4 5 4 5 4 5 4 43 86.00
27 Teacher-27 4 4 5 5 4 4 4 5 4 4 43 86.00
28 Teacher-28 4 4 4 4 5 4 5 4 5 5 44 88.00
29 Teacher-29 5 4 5 5 4 5 4 5 4 4 45 90.00
30 Teacher-30 5 4 4 4 4 4 5 4 4 5 43 86.00
Average 87.67
Notes:
Item-1: Initial data completeness for normalized matrix calculations;
Item-2: Accuracy of the normalized matrix calculation process;
Item-3: Accuracy of normalized data matrix conversion into matrix-R;
Item-4: The accuracy of the calculation process for matrix-R data becomes matrix-Y data;
Item-5: The calculation process accuracy of the negative ideal solutions matrix;
Item-6: The calculation process accuracy of the positive ideal solutions matrix;
Item-7: The accuracy of the calculation process the distance between the values of each indicator with the negative
ideal solutions matrix;
Item-8: The accuracy of the calculation process the distance between the values of each indicator with the positive
ideal solutions matrix;
Item-9: Accuracy in the calculation process the preference scores;
Item-10: The accuracy of decision making based on each indicator’s preference scores.

Emerging Science Journal | Vol. 5, No. 3
Page | 402
Based on the initial trial results on the Tat Twam Asi-Discrepancy evaluation model based on TOPSIS previously
shown in Table 5, it was able to be stated that the evaluation model design was categorized as good quality. This was
supported by the results of the test that showed a quality percentage was 87.00%. If viewed from the design quality
standards that refer to the eleven’s scale, then the quality percentage was 87.00%, so included in a good category with
scores range of 85-94%. Therefore, there is no need to make major revisions to the design of the evaluation model, and
the design is ready to be used for the next development stage.
Based on the trial results of a TOPSIS calculation simulation that had shown previously in Table 7, it was able to be
stated that the TOPSIS calculation had been effectively was used to determine the dominant aspect that needs to be
improved. This was evidenced by the simulation trial results, which showed the effectiveness percentage was 87.67%.
If viewed from the calculation effectiveness standards that refer to the five’s scale, then the quality percentage was
87.67%, so included in an effective category with scores range of 80-89%. Therefore, there is no need to retest the
TOPSIS calculation simulation. TOPSIS method is accurate and ready to be applied at the next development stage.
This research had been able to answer the problems found in previous studies. The limitations of Mutawa (2017),
Mantara et al. (2021), and Habib and Ramzan (2020) [11, 15, 16] had been answered through this research by showing
that there were aspects of Discrepancy evaluation were used as a reference for evaluating the blended learning
implementation at IT vocational schools in Bali. Limitations of Lippe and Carter (2018), Martín-Martínez et al.
(2020), Naibaho (2021) [12, 14, 17] had been answered through this research by showing the TOPSIS calculation
process in determining the dominant aspects that must be improved. The limitation of Thurab-Nkhosi (2019) [13] had
been answered through this research by presenting the results of a complete and comprehensive evaluation of the
defining, installation, process, and product components. That presentation of the evaluation results can be seen in
Table 3 in the column section of “Percentage of Assessment from 30 Respondents”. Besides those advantages, this
research also had an obstacle. The obstacle was the TOPSIS calculation was still done manually and was not applied to
a computer application, so the speed of the calculation results was not optimal.
4- Conclusion
The results of the combination of the Discrepancy evaluation model, the Tat Twam Asi concept, and the TOPSIS
method had presented innovations in the field of educational evaluation in the form of a design of the Tat Twam Asi-
Discrepancy evaluation model based on TOPSIS. That evaluation model design had been successfully made and had
passed a series of trials in this research. Based on a series of trial results that was conducted on the evaluation model
design, it was stated that the design of the Tat Twam Asi-Discrepancy evaluation model based on TOPSIS was feasible
to be used to determine the dominant aspects that needed to be improved to realize the effectiveness of blended
learning implementation (especially at IT vocational schools in Bali). The feasibility of using the evaluation model
design was evidenced by the quality percentage average was 87.00% obtained from the preliminary trials toward the
design of the Tat Twam Asi-Discrepancy evaluation model based on TOPSIS. That percentage indicates the evaluation
model design was very good quality if viewed from quality standards of eleven’s scale. In addition, the feasibility of
using the evaluation model design was also evidenced from the effectiveness percentage average was 87.67% obtained
from the trials of TOPSIS calculation simulation to determine the dominant aspects which were improvement priority.
This percentage also indicates that the evaluation model was included in the effective category based on the
effectiveness standards of the five’s scale. The results of this research have a positive impact on the field of
educational evaluation because this research shows innovations in determining the most dominant aspects for
improvement so that the evaluation recommendations will be more precise. The contribution of the results of this
research shows the design of an evaluation model that can be integrated with other evaluation models to make it easier
to determine the most dominant aspects for improvement so the program being evaluated becomes more enhance.
Future work to be done is to develop this evaluation model towards desktop-based or web-based applications so that
access and process of evaluation calculation can be carried out quickly and accurately.
5- Declarations
5-1- Author Contributions
Conceptualization, D.G.H.D.; methodology, D.G.H.D.; formal analysis, D.G.H.D., A.A., and P.W.A.S.;
investigation, D.G.H.D.; data curation, D.G.H.D., A.A., and P.W.A.S.; writing—original draft preparation, D.G.H.D.;
writing—review and editing, D.G.H.D. All authors have read and agreed to the published version of the manuscript.
5-2- Data Availability Statement
The data presented in this study are available in article.
5-3- Funding
The authors received financial support from the Directorate General of Research and Development, Ministry of
Education, Culture, Research and Technology of the Republic of Indonesia for the research, authorship, and/or
publication of this article.

Emerging Science Journal | Vol. 5, No. 3
Page | 403
5-4- Acknowledgements
The authors also express their gratitude to the Chancellor and Chair of the Research and Community Service
Institute, Universitas Pendidikan Ganesha, who give permission and opportunity to the authors for carrying out this
research.
5-5- Conflicts of Interest
The authors declare that there is no conflict of interests regarding the publication of this manuscript. In addition,
the ethical issues, including plagiarism, informed consent, misconduct, data fabrication and/or falsification, double
publication and/or submission, and redundancies have been completely observed by the authors.
6- References
[1] Irawan, Vincentius Tjandra, Eddy Sutadji, and Widiyanti. “Blended Learning Based on Schoology: Effort of Improvement
Learning Outcome and Practicum Chance in Vocational High School.” Edited by Hau Fai Edmond Law. Cogent Education 4,
no. 1 (January 1, 2017): 1–10. doi:10.1080/2331186x.2017.1282031.
[2] Suyasa, P Wayan Arta, Putu Sukma Kurniawan, I Putu Wisna Ariawan, Wayan Sugandini, Ni Desak Made Sri Adnyawati,
I Dewa Ayu Made Budhyani, and Dewa Gede Hendra Divayana. “Empowerment of CSE-UCLA Model Based on Glickman
Quadrant Aided by Visual Application to Evaluate the Blended Learning Program on SMA Negeri 1 Ubud.” Journal of
Theoretical and Applied Information Technology 96, no. 18 (2018), 6203–6219.
[3] Savoie-Roskos, Mateja R., Stacy Bevan, Rebecca Charlton, and Marlene Israelsen Graf. “Approaches to Evaluating Blended
Courses.” Journal on Empowering Teaching Excellence 2, no. 1 (2018): 3–11. doi:10.26077/jg9k-5e05.
[4] Pima, John Marco, Michael Odetayo, Rahat Iqbal, and Eliamani Sedoyeka. “A Thematic Review of Blended Learning in Higher
Education.” International Journal of Mobile and Blended Learning 10, no. 1 (January 2018): 1–11.
doi:10.4018/ijmbl.2018010101.
[5] Jayanta, I Nyoman Laba, Kadek Dewi Suryantari, and Made Sumantri. “An Analysis of Discrepancy between the Lesson Plan
and the Implementation of Curriculum 2013 in Teaching and Learning Process in SD Negeri 4 Kaliuntu.” Journal of Education
Research and Evaluation 1, no. 2 (May 2, 2017): 73–81. doi:10.23887/jere.v1i2.9839.
[6] Said, Meldasari, R. Madhakomala, and Fahmi Idris. “Discrepancy Evaluation Model for Human Resources Health Placement
Evaluation at the Puskesmas.” Journal of Environmental Treatment Techniques 7, no. 4 (2019): 588–594.
[7] Sanjaya, Dewa Bagus. “Reconstructing Local Wisdom Based Character Education for Sekaa Teruna Teruni in Desa Pakraman
Ubud Bali.” International Research Journal of Management, IT & Social Sciences 4, no. 2 (2017): 190–197.
[8] Perbowosari, Heny. “The Local Wisdom Value of Mandhasiya Tradition (Study of Hindu Education).” Vidyottama Sanatana:
International Journal of Hindu Science and Religious Studies 3, no. 1 (May 1, 2019): 1–12. doi:10.25078/ijhsrs.v3i1.790.
[9] Krohling, Renato A., and André G.C. Pacheco. “A-TOPSIS – An Approach Based on TOPSIS for Ranking Evolutionary
Algorithms.” Procedia Computer Science 55 (2015): 308–317. doi:10.1016/j.procs.2015.07.054.
[10] Song, Jing, and Junhui Zheng. “The Application of Grey-TOPSIS Method on Teaching Quality Evaluation of the Higher
Education.” International Journal of Emerging Technologies in Learning (IJET) 10, no. 8 (December 14, 2015): 42–45.
doi:10.3991/ijet.v10i8.5219.
[11] Mutawa, A.M. “Evaluation of Blended Learning in Higher Education: A Case Study.” PEOPLE: International Journal of
Social Sciences 3, no. 1 (January 1, 2017): 881–889. doi:10.20319/pijss.2017.s31.881889.
[12] Lippe, Megan, and Patricia Carter. “Using the CIPP Model to Assess Nursing Education Program Quality and Merit.”
Teaching and Learning in Nursing 13, no. 1 (January 2018): 9–13. doi:10.1016/j.teln.2017.09.008.
[13] Thurab-Nkhosi, D. “The Evaluation of a Blended Faculty Development Course Using the CIPP Framework.” International
Journal of Education and Development using Information and Communication Technology 15, no. 1, (2019): 245–254.
[14] Martín-Martínez, Laura, Vanesa Sainz, and Fidel Rodríguez-Legendre. “Evaluation of a Blended Learning Model for Pre-
Service Teachers.” Knowledge Management & E-Learning 12, no. 2, (June 2020): 147–164. doi:10.34105/j.kmel.2020.12.008.
[15] Mantara, Angga Yuni, Endang Prastuti, and Titis Setyo Wahyudi. “Student’s Evaluation on the Use of Learning Media during
Pandemic.” KnE Social Sciences (January 5, 2021): 446–453. doi:10.18502/kss.v4i15.8232.
[16] Habib, Mohamed, and Muhammad Ramzan. “Performance Assessment and Analysis of Blended Learning in IT Education: A
Longitudinal Study in Saudi Electronic University.” International Journal of Advanced Computer Science and Applications
11, no. 6 (2020): 446–453. doi:10.14569/ijacsa.2020.0110610.
[17] Naibaho, Lamhot. “Online Learning Evaluation during Covid-19 Using CSE-UCLA Evaluation Model at English Education
Department Universitas Kristen Indonesia.” Budapest International Research and Critics Institute (BIRCI-Journal):
Humanities and Social Sciences 4, no. 2 (April 28, 2021): 1987–1997. doi:10.33258/birci.v4i2.1887.

Emerging Science Journal | Vol. 5, No. 3
Page | 404
[18] Agung, Anak Agung Gede, I Gusti Putu Sudiarta, and Dewa Gede Hendra Divayana. “The Quality Evaluation of School
Management Model Based on Balinese Local Wisdom Using Weighted Product Calculation.” Journal of Theoretical and
Applied Information Technology 96, no. 19, (2018), 6570–6579.
[19] Sugiharni, Gusti Ayu Dessy. “The Development of Interactive Instructional Media Oriented to Creative Problem Solving
Model on Function Graphic Subject.” Journal of Education Research and Evaluation 2, no. 4 (February 4, 2019): 183–189.
doi:10.23887/jere.v2i4.16694.
[20] Fikri, H., Madona, A.S., and Morelent, Y. “The Practicality and Effectiveness of Interactive Multimedia in Indonesian
Language Learning at the 5th Grade of Elementary School.” The Journal of Social Sciences Research no. SPI 2 (November 15,
2018): 531–539. doi:10.32861/jssr.spi2.531.539.
[21] Maryansyah, Yupika. “An Analysis on Readability of English Reading Texts for Grade IX Students at MTsN 2 Kota
Bengkulu.” Premise Journal 5, no. 1 (April 30, 2016): 69–88. doi:10.24127/pj.v5i1.416.
[22] Panda, Monalisa, and Alok Kumar Jagadev. “TOPSIS in Multi-Criteria Decision Making: A Survey.” 2018 2nd International
Conference on Data Science and Business Analytics (ICDSBA) (September 2018): 51–54. doi:10.1109/icdsba.2018.00017.
[23] Kaur, Simarpreet, Sumeet Kaur Sehra, and Sukhijt Singh Sehra. “A Framework for Software Quality Model Selection Using
TOPSIS.” 2016 IEEE International Conference on Recent Trends in Electronics, Information & Communication Technology
(RTEICT) (May 2016): 736–739. doi:10.1109/rteict.2016.7807922.
[24] Bandyopadhyay, Susmita. “Application of Fuzzy Probabilistic TOPSIS on a Multi-Criteria Decision Making Problem.” 2017
Second International Conference on Electrical, Computer and Communication Technologies (ICECCT) (February 2017): 1–3.
doi:10.1109/icecct.2017.8118038.
[25] Zhang, Ling, Yan Xu, Chung-Hsing Yeh, Le He, and De-Qun Zhou. “Bi-TOPSIS: A New Multi-criteria Decision Making
Method for Interrelated Criteria with Bipolar Measurement.” IEEE Transactions on Systems, Man, and Cybernetics: Systems
47, no. 12 (December 2017): 3272–3283. doi:10.1109/tsmc.2016.2573582.
[26] Baylan, Emin Başar. “A Novel Project Risk Assessment Method Development via AHP-TOPSIS Hybrid Algorithm.”
Emerging Science Journal 4, no. 5 (October 1, 2020): 390–410. doi:10.28991/esj-2020-01239.
[27] Zheng, Feng, and Yang-Cheng Lin. “A Fuzzy TOPSIS Expert System Based on Neural Networks for New Product Design.”
2017 International Conference on Applied System Innovation (ICASI), Sapporo, Japan (May 2017): 598–601.
doi:10.1109/icasi.2017.7988494.