design of user interface for heating, ventilation and air ...772402/fulltext01.pdf · design of...
TRANSCRIPT

Design of user interface for heating, ventilation and air conditioning systems
Design av användargränssnitt till värme-, ventilations- och luftkonditioneringssystem
Viktor Karlsson Ejwertz
Faculty of Health, Science and Technology
Degree Project for Degree of Bachelor of Science in Innovation and Design Engineering
22.5 ECTS credits
Supervisor: Lennart Wihk
Examiner: Professor Leo de Vin
December 2014, Karlstad


Abstract The project was carried out at Karlstad University during the spring of 2014 as a degree project for a Degree of Bachelor of Science in Innovation and Design Engineering and consists of 22.5 ECTS. The supervisor was lecturer Lennart Wihk from Karlstad University. The examiner was professor Leo de Vin. The project was conducted for Swegon AB and dealt with developing a user interface for systems regulating climate parameters in indoor environments, such as hotel rooms or office environments. The area of focus has been on developing the user interface with regard to end users, giving it the right functions and making it easy to understand. Suggestions about how user interfaces of this type could look was to be delivered to Swegon. The project started with creating a foundation. This was done through literature studies, benchmarking and interviews. The information gained here was used to put together a list of requirements which was later used as a guide when developing and evaluating concepts. Idea generation-methods were used to generate concepts and the concepts were developed further to later be voted on by employees at Swegon. The votes were evaluated and two concepts were developed, based on the the voting outcome. The concepts are inspired by wishes from the end users (expressed in the interviews) and are developed with regard to principles of design. The concepts were made into prototypes, in the form of 3D-printed models. The results of the project, in short: • Two image boards. One with thoughts about functions of existing climate related user interfaces written on it, and one with thoughts of different ways of illustrating air-temperature written on it. • Explanations of and reflections about functions of four different types of user interfaces for heating, ventilation and air conditioning (HVAC) systems. • Four product semantic analyses (PSA). Three of existing user interfaces for Swegon HVAC systems and one of a concept for a user interface for HVAC systems. • Interviews with six potential end users, written down to a large extent. • A compilation of the six interviews, written down in English. • An interview with an employee at Swegon service, regarding installation of user interfaces for HVAC systems, written down to a large extent. • A functional analysis, which in this project works as a requirements specification. • 10 ideas of concepts. • Two voting-systems which are developed for use when voting for several elements which can be combined to make up a holistic concept. The voting-systems are inspired by the "morphological analysis" described by Johannesson et al. (2009). • Two final concepts of user interfaces for HVAC systems with thorough descriptions in a table in this report. The concepts are developed with respect to end users and design principles. • Simplified versions of each of the two final concepts as CAD-models and as 3D-prints.

Sammanfattning Projektet har gjorts vid Karlstads universitet under våren 2014 i kursen Examensarbete för högskoleingenjörsexamen i innovationsteknik och design och består av 22,5 hp. Handledaren var universitetsadjunkt Lennart Wihk från Karlstads universitet. Examinatorn var professor Leo de Vin. Projektet gjordes för Swegon AB och handlade om att utveckla ett användargränssnitt för system som reglerar klimatparametrar i inomhusmiljöer, såsom hotellrum eller kontorsmiljöer. Fokus har legat på att utveckla användargränssnittet med hänsyn till slutanvändarna. Detta i form av att ge gränssnittet rätt funktioner och att göra det lättförståeligt. Förslag om hur användargränssnitt av denna typ kan se ut skulle levereras till Swegon. Projektet började med att skapa en grund att stå på. Detta gjordes genom litteraturstudier, benchmarking och intervjuer. Informationen som kom av detta användes för att sätta ihop en kravspecifikation, som senare användes som guide för att utveckla och utvärdera koncept. Idégenereringsmetoder användes för att ta fram koncept och koncepten utvecklades vidare för att senare röstas på av anställda på Swegon. Rösterna utvärderades och två koncept togs fram baserade på resultatet av röstningen. Koncepten är inspirerade av slutanvändarönskemål (uttryckta i intervjuerna) och är utvecklade med designprinciper i åtanke. Koncepten gjordes prototyper av, i form av 3D-utskrivna modeller. Resultaten av projektet är, kortfattat: • Två image boards. En med tankar om olika funktioner på befintliga klimatrelaterade användargränssnitt nedskrivna på och en med tankar om olika sätt att illustrera lufttemperatur på nedskrivna på. • Förklaringar av och reflektioner kring funktioner på fyra stycken olika modeller av börvärdesomställare (användargränssnitt till HVAC-system). • Fyra semantiska analyser. Tre på befintliga börvärdesomställare till Swegonprodukter och en på ett koncept på en börvärdesomställare. • Intervjuer med sex potentiella slutanvändare, nedskrivna i stor utsträckning. • En sammanfattning av de sex intervjuerna, nedskriven på engelska. • En intervju med en anställd på Swegon service, angående installation av börvärdesomställare, nedskriven i stor utsträckning. • En funktionsanalys som i projektet fungerar som kravspecifikation. • 10 konceptidéer. • Två röstningssystem som är utvecklade för att kunna användas vid röstning på flera element som kan sättas ihop till helhetskoncept. Röstningssystemen är inspirerade av den "morfoligiska analysen" som beskrivs av Johannesson et al. (2009). • Två slutkoncept på börvärdesomställare med utförliga beskrivningar, i en tabell i denna rapport. Koncepten är utvecklade med hänsyn till slutanvändare och designprinciper. • Förenklade utföranden av de två slutkoncepten som modeller i CAD och som 3D-utskrifter.

Table of Contents Abstract ................................................................................................................................................................. 3 Sammanfattning ................................................................................................................................................. 4
Appendices .......................................................................................................................................................... 8
1. Introduction .................................................................................................................................................... 7 1.1 Background ............................................................................................................................................................. 7 1.2 Problem questions ................................................................................................................................................ 8 1.3 Purpose ..................................................................................................................................................................... 8 1.4 Goal ............................................................................................................................................................................. 8 1.5 Delimitations ........................................................................................................................................................... 8
2. Method .............................................................................................................................................................. 9 2.1 Project planning ..................................................................................................................................................... 9 2.2 Research ................................................................................................................................................................ 10
2.2.1 Gathering information ................................................................................................................................................... 10 2.2.2 Benchmarking .................................................................................................................................................................. 11 2.2.3 Product semantic analyses (PSA) ......................................................................................................................... 11 2.2.4 Target audience .............................................................................................................................................................. 12 2.2.5 Interviews ............................................................................................................................................................................ 12
2.3 Requirements specification ........................................................................................................................... 13 2.4 Idea generations ................................................................................................................................................. 14 2.5 Early concept evaluation – trimming of ideas ........................................................................................ 17 2.6 Further work with ideas - generating concepts ..................................................................................... 18 2.7 Presentation to supervisor at Swegon ...................................................................................................... 18 2.8 Breaking down concepts ................................................................................................................................ 18 2.9 Presentation to project group at Swegon, followed by voting ........................................................ 19 2.10 Evaluation of votes ......................................................................................................................................... 19 2.11 Development of final concepts .................................................................................................................. 19
3. Results ........................................................................................................................................................... 21 3.1 Project planning .................................................................................................................................................. 21 3.2 Research ................................................................................................................................................................ 21
3.2.1 Gathering information ................................................................................................................................................... 21 3.2.3 Product semantic analyses (PSA) ......................................................................................................................... 30 3.2.4 Target audience .............................................................................................................................................................. 34 3.2.5 Interviews ............................................................................................................................................................................ 36
3.3 Requirements specification ........................................................................................................................... 36 3.4 Idea generations ................................................................................................................................................. 36 3.5 Early concept evaluation – trimming of ideas ........................................................................................ 36 3.6 Further work with ideas – generating concepts .................................................................................... 36 3.7 Presentation to supervisor at Swegon ...................................................................................................... 38 3.9 Presentation to project group at Swegon, followed by voting ........................................................ 46 3.10 Evaluation of votes ......................................................................................................................................... 46 3.11 Development of final concepts .................................................................................................................. 47
4. Discussion ..................................................................................................................................................... 58
5. Conclusions .................................................................................................................................................. 62 Recommendations for future work .......................................................................................................... 63
List of words ..................................................................................................................................................... 64
Thanks ................................................................................................................................................................ 65 References ........................................................................................................................................................ 66

Appendices Appendix 1 - Project plan Appendix 2 - Interview guide - end users, ver. 1 Appendix 3 - Interview guide - end users, ver. 2 Appendix 4 - Interview answers Appendix 5 - Interview compilation Appendix 6 - Interview regarding installation of user interfaces Appendix 7 - Requirements specification Appendix 8 - Pictures of the 10 concepts

7
1. Introduction This is a project made in the course Degree Project for Degree of Bachelor of Science in Innovation and Design Engineering (MSGC12), at Karlstad University within the faculty of health, science and technology. The project was done during the spring of 2014 and consisted of 22.5 ECTS credits and 600 work hours. 400 for doing the work and 200 for writing the report. The project was done for the company Swegon AB. The supervisors were Lennart Wihk from Karlstad University and Kristian Pettersson and Lina Nygren from Swegon AB. The examiner was Leo de Vin.
1.1 Background Swegon AB is part of the Latour group and is one of the leading suppliers of air handling units, water- and airborne climate systems, flow control, acoustics and residential ventilation products. Swegon is based in Sweden, but their products exist in many parts of the world. Swegon has six production facilities, three of which are located in Sweden; in Arvika, Tomelilla and Kvänum. Swegon offers solutions for indoor climate that are supposed to be discrete. With their components and system solutions, they try to contribute to energy savings and create indoor climates where people feel good. Swegon was founded in 2005 through the merging of the two companies PM-LUFT and Stifab Farex. Stifab and Farex was originally two separate companies. Stifab was located in Tomelilla and Farex was located in Arvika. At Swegon in Tomelilla, the focus lies on air diffusers, while in Arvika, the focus is put on induction units distributing air, heating, cooling and combines air with waterborne systems. In September of 2012 Swegon founded the group “Room Unit”. The purpose of the Room Unit group is to work with the parts of Swegon's systems that are visible to the end user. Since these products are about the only ones visible to Swegon's end users, they can be seen as the face of Swegon. Part of the units that the Room Unit-group is working with is user interfaces used to set climate parameters in an environment. These are often found mounted on the wall in, for example, hotel rooms. Some of Swegon's currently used user interfaces for heating, ventilation and air conditioning (HVAC) systems are shown in figures 1, 2 and 3. Swegon now wishes that an investigation is made about how to optimize the user interface for their HVAC systems to give value to their end users or to Swegon.
Figure 1. For adapt parasol. Figure 2. Luna. Figure 3. Conductor R.

8
1.2 Problem questions What functions do end users want in a user interface for HVAC systems? How can a user interface for an HVAC system be interacted with in a user-friendly way?
1.3 Purpose To help Swegon get a clearer picture of what their end users want out of an HVAC system, and how they want to control one. This is to be done using the design-process and other knowledge gained during the study programme Innovation and Design Engineering in a practical project.
1.4 Goal To present two concepts in the form of CAD-models and 3D-printed models, suggesting how a usable user interface for an HVAC system could look. The concepts should be developed with regard to studied theory and interviews made during the project. The concepts should also be combined with the project of another student, developing capsulation for the interface. To present interviews that can be of help, trying to understand end user-aspects while developing new user interfaces for HVAC systems. To deliver a report, describing the results of the project and the working process behind it. The report should be written in English, since it is Swegon's internal language. The project should be presented and the results should be displayed at a showcase at Karlstad University on the 21st of May 2014.
1.5 Delimitations • Delimitations have been made to not make any deep-going research as to the age of the target audience. • The user interfaced that is to be developed cannot use a touch screen, because of the cost. This is a demand from Swegon. • The project is not to look at the physical attributes of the capsulation as a whole. Neither should mounting aspects be focused on. • The project caters to end users. It does not address the needs and wants of the installer of the product. • The project does not thoroughly investigate other countries symbols and colors for showing climate-related things. • The project does not investigate the cost of developing the winning concepts.
9
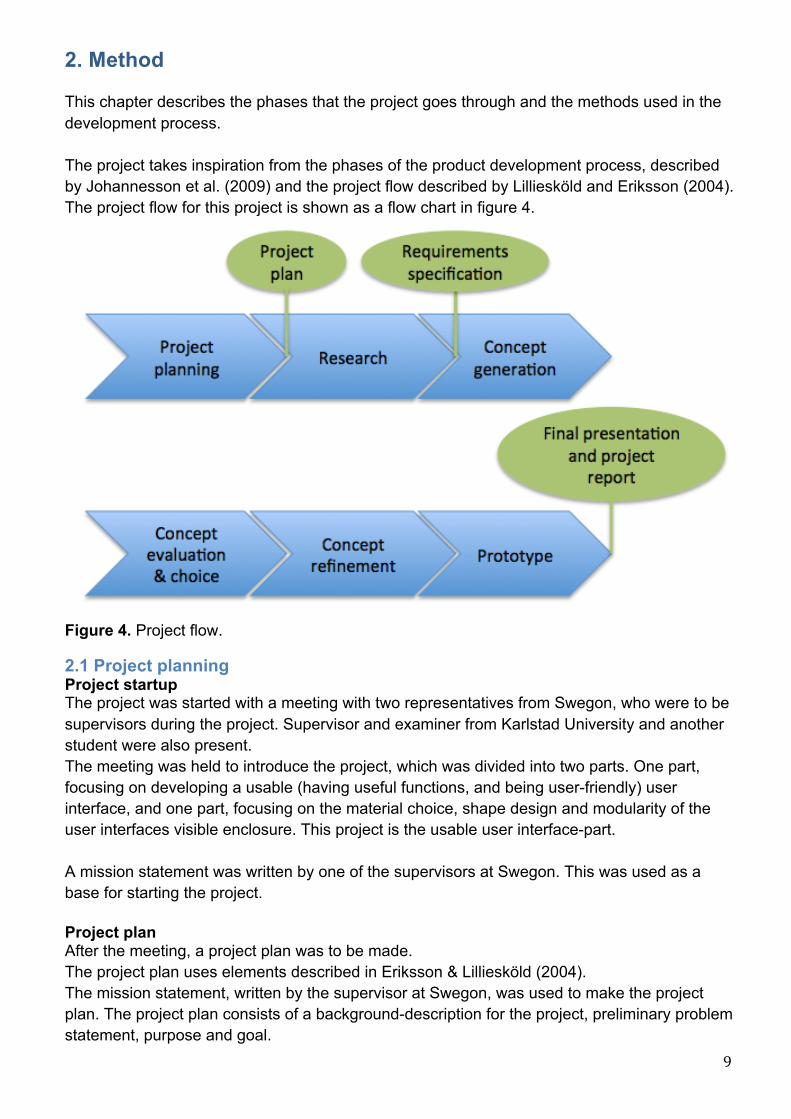
2. Method This chapter describes the phases that the project goes through and the methods used in the development process. The project takes inspiration from the phases of the product development process, described by Johannesson et al. (2009) and the project flow described by Lilliesköld and Eriksson (2004). The project flow for this project is shown as a flow chart in figure 4.
Figure 4. Project flow.
2.1 Project planning Project startup The project was started with a meeting with two representatives from Swegon, who were to be supervisors during the project. Supervisor and examiner from Karlstad University and another student were also present. The meeting was held to introduce the project, which was divided into two parts. One part, focusing on developing a usable (having useful functions, and being user-friendly) user interface, and one part, focusing on the material choice, shape design and modularity of the user interfaces visible enclosure. This project is the usable user interface-part. A mission statement was written by one of the supervisors at Swegon. This was used as a base for starting the project. Project plan After the meeting, a project plan was to be made. The project plan uses elements described in Eriksson & Lilliesköld (2004). The mission statement, written by the supervisor at Swegon, was used to make the project plan. The project plan consists of a background-description for the project, preliminary problem statement, purpose and goal.
10
It also contains: • A work breakdown structure (WBS), which was made to get an overview of what steps were to be done in the project, described by Eriksson & Lilliesköld (2004). • A Gantt-chart, which was made to get a perspicuous timeline of in what order phases in the project was thought to come, described by Johannesson (2009). Although the first Gantt-chart made in a project rarely resembles the reality of the project to great detail, it helps to get a rough approximation of how much time the phases of the project can use. • A brief risk assessment was made in the form of some risks pointed out. • An overview of the organization in the project with contact information to key-people for the project. The project plan was presented to the supervisor from the university, examiner and class-mates. Feedback was received, which lead to things being edited. The Gantt-chart was changed to more resemble the reality of a projects working process. Weekly status-checks A decision about keeping a weekly status-check in the beginning of each week, inspired by pulse-meetings (Pettersson et al. 2009), was made. The weekly status-checks were held to keep track of where the project stood and what was to be done during the coming week. It was written down in a document. Problem analysis The problem questions were redefined as the understanding of the project grew. When formulating them, keeping them open and not locking was kept in mind. For example, nothing in the problem questions indicate that the user interface which should be developed should be mounted on a wall or interacted with through use of hands, etc.
2.2 Research Research was done to collect information regarding what has been done earlier in the area, what exists on the market, guidelines for designing user interfaces and to get a picture of what end users think should be kept in mind regarding functions available and ways to set values when designing a new user interface. "The feasibility study should result in a first requirements specification, which mainly sets the functional requirements, WHAT the product should perform." (Johannesson et al. 2009) Later on, during the development process, HOW the product should meet the requirements is decided. (Johannesson et al. 2009)
2.2.1 Gathering information Literature studies and internet searching In the beginning of the project, focus was put on literature studies and internet searching. This was also done on and off during the project to find methods to use in the process, to gain knowledge about how to create a good interview guide, and to gain knowledge about human-machine interaction, etc.

11
Theory regarding Swegon's systems A supervisor from Swegon explained the theory about setpoints when setting a temperature with a user interface for HVAC systems. A figure was made to conclude some of what the supervisor said and drew, to make it easier to understand.
2.2.2 Benchmarking Image boards The internet was searched for images of icons used to display heat and cold, and also for varieties of looks of user interfaces for HVAC systems and other similar user interfaces or displays of different sorts. The images found during the internet-search-part of the benchmarking were put together in two image boards, inspired by moodboards which are described by Kenneth Österlin (2010), though modified with comments added to the images which were found, making the boards more like summaries of the material found during the benchmarking. Through this modification, thoughts that occurred in the making of the image boards, about good and not as good things about different solutions could be saved in a way that was perspicuous. This was used as a method to get an overview of previous ways of controlling climate parameters and showing heat and cold with symbols, so these options could be kept in mind while developing concepts. The image boards were also used as places to look for inspiration. Nordbygg fair-visit A visit was paid to the Nordbygg building fair, held in Stockholm. People from different companies were talked to about their companies user interfaces and what their take on which temperatures (of current temperature and the two setpoints explained by one of the supervisors from Swegon) should be shown was. User interface-products from different companies were tested. Photos of user interface-products were taken and use of products was filmed to use for inspiration and as topics of discussion with supervisor from Swegon when later visiting Swegon's production facility in Kvänum.
2.2.3 Product semantic analyses (PSA) Product semantic analyses, described by Monö (1997), were made on three of Swegon's existing user interfaces and also on a user interface-concept developed in a prior project (Fritzon et al. 2014). The method is used to examine what a product describes, expresses, exhorts to and identifies with through its visual design. The product semantic analyses were made to draw inspiration to the coming development-part of the project through detecting what are good and bad characteristics of a user interface. The analyses were made together with the student having the project focused on the capsulation design. Since both participants in the analysis-session had been part of the group that designed one of the user interfaces that were up for a product semantic analysis, help was brought in from a person not related to that development process, to get more objective (but still subjective) views on that particular user interface. The product semantic analyses were documented in excel documents.

12
The products that were analyzed are shown in figures 1 to 3. The concept from the earlier project (Fritzon et al. 2014) is shown in figure 5.
Figure 5. Concept developed in earlier project.
2.2.4 Target audience Employees at Swegon were asked for previous surveys defining their end user target audience. They did not seem to have anything that could be of use, defining their end users. Statistics Sweden Statistics Sweden was contacted to see if they had some sort of statistics of most common ages of people staying in hotel rooms or working in office-/school-environments. This was thought to be used to get a better idea of which people to interview, by narrowing the group down a bit, through age. They did not have any hotel- or office-statistics where age was a parameter. They did, however, have accommodation statistics for Sweden, with percent stays in Swedish accommodations from different countries. These were studied to see if any target audience-pattern could be found. Target audience assumption Because Swegon did not seem to have any research regarding target group, an assumption about the target audience was made, based on a mission statement from Swegon and to some extent inspired by the information gained from Statistics Sweden.
2.2.5 Interviews Color interviews: A hypothesis that blue and red are the colors that most people think represent heat and cold best, was made. To see if the hypothesis could be confirmed, a simple interview question regarding what colors people thought represents/symbolizes heat and cold best on technical devices was used. Six people were asked the question. Semi-structured interviews Interviews with end users were made to get an understanding of what they wished for and if they had any demands regarding semantic and technical functions in an HVAC user interface. The interviews were also made to see if the end users had any viewpoints of how one could set climate parameters in other ways than the ones that are common today. The interviews were chosen to be of the semi-structured type (Osvalder et al. 2010), since it gives room for both qualitative and quantitative answers. Semi-structured interviews mean that an interview guide has been made prior to doing the interviews, with areas to cover in the interview, without limiting the interviewer from asking follow-up questions. Quantitative answers can be good to generate statistics on peoples takes on certain questions.

13
Qualitative answers are more open and can give inspiration in ways that quantitative answers might not give. Both these qualities of answers seemed valuable to this project. Prior to, and in the making of the interview guide, a compendium called "Brukarbeteende" compiled and handed out by Lennart Wihk1 during a lecture in interviewing techniques, was studied in order to gain some information about how to create a guide that would help make the interviews provide relevant information to the work. The compendium contains some pages from a book on interviewing techniques, called "Som man frågar får man svar" (Andersson, 2001) and some other sources of information regarding the subject. Six people were interviewed. Three of them were people who had user interfaces for HVAC systems in their offices. Three of them were people who just occasionally ran in to user interfaces of this type. The idea of interviewing both these groups was to cover a broader segment of the end user-group, even though the interviews were not conducted on a large scale. When doing the interviews, the answers were written down on printed interview guides. Four of the interviews were also recorded. The answers from the recordings and the printed interview guides were then written into a document on the computer (appendix 4). A compilation of the interviews with interesting quotes and statistics on the answers was later written and is attached as appendix 5. After the first two interviews, the interview guide was slightly edited, since some questions seemed too alike judging by the answers they generated. Some questions were formulated in other ways, some questions were removed and some others were added. Interview regarding installation of user interfaces A Swegon employee who works at their service department was interviewed to get input on aspects regarding user interfaces for HVAC systems, that could be of importance for the people installing the user interfaces. This interview was also semi-structured, but leaning more towards an unstructured interview than the semi-structured interviews mentioned earlier.
2.3 Requirements specification Before the solving process began, a requirements specification was made to be used as a guide in the concept development and the concept choice-process (Johannesson et al. 2009). A functional analysis was used as a requirements specification, since it seemed like an appropriate way of showing the requirements and wants in a perspicuous way. The idea of the functional analysis is described by Landkvist (2001) as a method to think and express ourselves in terms of functions and not in completed solutions, and also to think first and act later. A modification of the functional analysis was made, so that the idea of the weighting of wishes, from Olsson's criteria matrix (Johannesson, 2009), was combined with the base of a functional analysis (Landkvist, 2001), because the weighting of the wishes felt like a good way to know what to prioritize during the coming concept development process. The functional analysis was based on interviews with end users, talking with employees at Swegon, mission statements from Swegon and theory on human-machine interaction from
1 Lennart Wihk, lecture in interview techniques, 2012.

14
"The design of everyday things" (Norman 2013). Main function of the user interface was noted with "MF". Necessary functions, requirements, were noted with an "N". If six out of six people would answer they wanted something, it was put down as a requirement. If five out of six people would answer they wanted something, it was put down as a wish, weighted five (W, 5), if four people would answer they wanted something, it was weighted four (W, 4) and so on. When talking to employees at Swegon, a wish about the interface to show if heating or cooling came up. This was weighted a 4 (W, 4), since the employees opinions coming from experience were seen as worth regarding.
2.4 Idea generations Three idea generation-sessions were made to generate a mass of ideas that could inspire concepts to be worked further with. The methods "random word-association", "slip-writing" and "6-3-5" were used. During all the idea generation-sessions, the group was told to leave all criticism out, since it hampers the creative process, according to Michanek & Breiler (2004).
2.4.1 Random word-association The first idea generation-session consisted of the random word-association method. It was made with a group of four people of the end user-party, including the author of this report. The method is described by Michanek & Breiler (2004) and the basics of it are that a list of random words is generated. Questions are then presented and the participants are asked to generate ideas while thinking of one of the random words. The thought of it is that thinking of random words while generating ideas can inspire ideas that would otherwise not have been thought of. At first, questions about areas to treat during the random word-association-session were formulated. Thought was put into formulating the questions in ways that would not lock the thoughts of the participants too much. For example, none of the questions indicate that the concepts that were to be developed had to be mounted on a wall. First, one person was told to say the first word he or she thought of, then the next person said the first word he or she thought of and so on. The words were written down as they came up. This went on for about 5 minutes. After a chain of words had been created, the questions were presented, in accordance with what is described by Michanek & Breiler (2004). The questions are not presented until the random word-list is done, so that the words that are generated do not revolve around the questions that are going to be treated. The questions presented were: 1. “How could one interact with an HVAC system?” (Meaning of HVAC system was explained to the group) 2. “How could the function adjustment of temperature be conveyed?” 3. “How could the function adjustment of air-flow be conveyed?” 4. “How could the function increase of air-flow during a certain amount of time be conveyed?” The question about increased air-flow during a certain amount of time was asked since

15
Swegon want their user interface to have this option; in the form of a function they call AirBoost. Each participant was given a bunch of post-it-notes to draw or write down ideas on. The questions were then presented in the order one to four and to each question; words that were meant to inspire ideas were called out from the random word-list. The participants were asked how the question presented could be answered in relation to the random word that was called out. If an idea was thought of, the person who thought of it was asked to explain and develop the idea, so that it would get more substance. After the idea was presented, it was drawn or written down on a post it-note. As soon as the group seemed to run out of ideas when thinking of a certain word, a new word was presented. Figure 6 below shows the collected ideas sorted by question, the list of random words, the book, which was used as a guide through the method, and a paper with the questions on.
Figure 6. The book "Idéagenten", questions, random-word-list and post-it notes with ideas generated during the session.
2.4.2. Slip-writing Since the random word-association method felt like it sometimes tied the ideas to the word in an un-wished for way, instead of just being inspiring, and a larger base of ideas was wanted, another idea generation method was conducted. Slip-writing was tried, because it seemed like a good way to get out ideas with no restrictions at all. The slip-writing session was conducted by two people, and a third one who joined for the last

16
question. Four new questions were formulated, putting a greater focus on the looks of the functions of a user interface-device, to generate ideas regarding how signifiers for different functions could look. The questions presented were: 1. “How can a user interface for an HVAC system, with the functions increase and decrease temperature, and increase and decrease air-flow look?” 2. “How can it look if a function increasing air flow for a certain amount of time is added?” 3. “How can it look if the user interface shows the current room temperature?” 4. “How can a user interface look, having all the functions described above, having no screen?” A bunch of post-it-notes were handed out. The questions were then presented one by one and ideas were scribbled down for five minutes per question. After each question had its five minutes of idea generation, the participants presented their ideas and made them understandable, so that the result would not just be a bunch of post-it-notes that are really hard to make any sense of.
2.4.3. 6-3-5 Since the two previous idea generation methods had given lots of small ideas on post-it-notes that were really far from worked through, the 6-3-5-method was used (Michanek & Breiler 2004). The method is built on that every person in a group of six people is given an A3-paper, and is asked to draw a matrix consisting of six rows (one for each person in the group) and three columns (one for each idea, enabling three ideas per time period). Then the question is presented to the group. When the question has been presented, the participants get five minutes to draw or write down three ideas. After five minutes, each person sends their paper to the next person, who gets five minutes to draw or write down three new ideas inspired by the three ideas above, or just three new ideas. This is repeated until the papers have gone one lap. (Michanek & Breiler 2004) This method was thought to generate more worked through ideas than the ideas that came from the slip-writing and random word-association methods. The questions used in this method were almost the same as the ones for the slip-writing-session, though two were slightly changed. The 6-3-5-session was conducted as described above. The questions presented were: 1. “How can a user interface for an HVAC system, with the functions increase and decrease temperature, and increase and decrease air-flow look?” 2. “How can it look if a function for increasing air flow during a certain amount of time, "airboost", is added?” 3. “How can it look if the user interface shows the current room temperature and the setpoint-temperature/temperatures?” 4. “How can a user interface look, having all the functions described above, having no screen?”

17
Two five-minute turns were given to the first question, because it felt like it could bring more ideas. One five-minute turn was given to the second question. Two five-minute turns were given to the third question. One five-minute turn was given to the fourth question. Figure 7 shows a picture from the 6-3-5-session.
Figure 7. Picture from the 6-3-5-session.
2.5 Early concept evaluation – trimming of ideas A mass of 190 notes with ideas had been generated from the idea generations. Trimming of ideas was done to get a more manageable number of ideas to work on with. Since there were so many ideas, and not enough time to work further with all of them, the first four steps of a method called the “Idea-method”, described in Michanek & Breiler (2004), was used. To decide how many of the ideas were to be taken forward in the development process, a percentage number was decided through an assumption based on the time left in the project. Then it was basically a subjective picking out of the ideas which seemed good, with the percentage number as a cap of how many ideas could be taken further. The post it-notes were put up on display, so that they were clearly visible and overviewable. Percentage number of ideas to be taken further was chosen. Since there were so many notes with ideas at the moment, trimming the ideas down quite a lot was needed. Far from all of these ideas would be able to be worked further with due to lack of time in the project. About 35% of the notes from the random word-association, 65% of the slip-writing-notes and just above 35% of the 6-3-5-session ideas were taken forward, meaning that a little more than
18
40% of the total amount of ideas were taken forward. After this method was used, there were 82 notes with ideas left. Step four of the idea-method was to find the central judging criteria to use when developing the product (Michanek & Breiler 2004). One of the supervisors from Swegon was asked to define the five or six highest prioritized judging criteria. The two criteria prioritized highest were put as wishes weighted 5 (highest weight) in the requirements specification. The three criteria prioritized next were put as wishes with weights 4 in the requirements specification.
2.6 Further work with ideas - generating concepts At this stage, the ideas were scribbled or drawn on small notes, and needed to be concretized, combined and developed in different ways to get more tangible concepts. For this, a modified version of the “Konkretiseringsverktyg #1 - enkel”, a simple concretizing-guide, described in Michanek & Breiler (2004) was used. A guide was made for writing comments next to ideas in the form of a working name for the idea, a short description of the idea and some advantages and disadvantages of the idea. Next to the comment section was an area for sketching the concept. When sketching down concepts, the 82 notes with ideas on that remained from the trimming earlier were used as inspiration and were also combined in different ways to make concepts. The requirements specification made the guidelines for which functions were used in the concepts sketched. This lead to 10 concepts sketched down in the concretizing guides.
2.7 Presentation to supervisor at Swegon A phone meeting was held with one of the supervisors at Swegon, presenting the 10 concepts via a PDF that was sent to the supervisor. When the concepts were presented, an opinion about splitting up elements of the ideas was expressed, so that the voters would not have to vote on a "package" of ideas and lose good elements, like symbols, from other ideas.
2.8 Breaking down concepts The phone meeting lead to breaking down elements of the concepts into separate parts. It also lead to the development of two voting systems which allowed the different elements to be combined by the voter, to enable them to vote on their own idea of good combinations of elements. The different symbols from the 10 concepts were sketched separately. Internet picture searches like "flame", "heat symbol", "cold symbol", "temperature symbol", "temperature", "thermometer", "cold", "istapp" and "ice" were used to inspire new symbols when sketching. The image-board with the symbols created earlier was used for inspiration as well. Different ways of making settings and displaying settings shown in the 10 concepts were sketched down. When the concepts had been broken down into separate elements, they needed to be able to be voted on in a good way. Discussions with the student who made the thesis work focused on the capsulation lead to the idea of using some kind of matrix, to be able to vote on separate elements and combine different elements when voting. Two voting systems were developed, which were inspired by the morphological analysis; a way of combining partial solutions to a problem into more complete solutions, described by Johannesson et al. (2009).

19
2.9 Presentation to project group at Swegon, followed by voting A presentation of the voting material generated was held to seven people from Swegon, who were part of the project group. The 10 concepts which were broken down into pieces (elements) were presented holistically first, to give the group a sense of what could be done with the different elements they were broken into, and that they got to vote on. This was thought to inspire ideas for the project group, which they could put together when voting through the matrixes. The matrixes, which were the voting systems developed earlier, were then presented and the voting method was explained. The participants were given some time to vote spontaneously if they had anything that they believed was a good combination of elements, so that the spontaneous ideas would not get lost. But if they thought they needed time, they were encouraged to take their time to vote. A supervisor from Swegon encouraged the author of this report to weigh in own preference when choosing what to go forward with.
2.10 Evaluation of votes When evaluating the votes, the elements that got the most votes were taken forward to be developed into final concepts. If two elements had the same amount of votes, the one with the most squares won. The winning symbols were to be combined with the winning displays and settings.
2.11 Development of final concepts A notification came about which visual capsulation concept had won in the project that developed the capsulation. This allowed the alternatives that won in this project to be applied to the winning capsulation. In the development of the final concepts, sketching, CAD and 3D-printing was used. "The value of sketching in engineering design has been widely documented.", Schmidt et al. (2012) writes in the article "Research on encouraging sketching in engineering design". Sketching, in this project, was used as the first stage in the stages of the final concept development, as a fast way of getting ideas from the head to be able to be viewed on a paper. This goes hand in hand with the statement "Sketching is a critical tool to give physical representation to and provide an external recording of ideas that exist only in the mind of a designer or design team." made by Schmidt et al. (2012). In an article that investigates the roles of CAD and sketching, it is mentioned that ”… conceptual design requires more of the human centered tasks while detail design depends largely on the computer driven tasks.”, seemingly including sketching in the human centered tasks (Veisz et al. 2012). This is how sketching and CAD was used in this project. To create rough versions of the final conceptual designs, sketches were made. The ideas that seemed good were then designed with greater detail through CAD, to get the measurements that fit the capsulation design in a good way. The CAD-models were then 3D-printed to be able to mount together with the capsulation in a prototype of the combined concept.

20
Sketching When designing the layout of the elements that won in the voting, the seven design principles of Don Norman, from the requirements specification were kept in mind: 1. Discoverability 2. Feedback 3. Conceptual model 4. Affordances 5. Signifiers 6. Mappings 7. Constraints Norman (2013) Other elements from the requirements specification were also guiding in this process, like the wish about showing if heating or cooling. The sketch of the front of the capsulation-concept that had won the voting in the project focused on the capsulation design was used to sketch the user interface-concepts onto, to get a good view of how the layouts would look combined with that capsulation design. When sketches were made, compromises of the design were made to fit the ideas that the visual capsulation meant. CAD After sketches of the layouts had been made, CAD-models were made from the sketches, so that the symbols were proportionate to the capsulation, and so that the disk that the symbols were applied on fitted the capsulation. Prototyping 3D-printing The CAD-models were 3D-printed and combined with 3D-printed CAD-models of the capsulation by the other student. Mounting LEDs A disk with LEDs mounted on it was made to fit behind the symbols of one of the 3D-printed models.

21
3. Results In this chapter, results from the work described in the method-chapter are presented.
3.1 Project planning Project startup The meeting resulted in a mission statement written by one of the supervisors. Project plan The project plan with a background, preliminary problem question, purpose and goal, WBS, Gantt-chart and risk analysis is attached as appendix 1. Weekly status-checks The weekly status checks generated rough planning for a week ahead written down in a document. Problem analysis The problem evolved from being formulated “How can the use interface for an HVAC system be designed to be user friendly?” into taking shape as two questions, touching both functionality and user friendliness: “What functions do end users want in a user interface for HVAC systems?” and “How can a user interface for an HVAC system be interacted with in a user-friendly way?”
3.2 Research This chapter presents the result from the literature studies and internet searching and the explanation of Swegon's systems by the supervisor from Swegon.
3.2.1 Gathering information
The design of everyday things -‐ Don Norman Reading this book has given insights regarding the design of user interfaces. Information found in it has been inspirational and has been kept in mind when designing the user interface. According to Don Norman (2013), discoverability and understanding are two of the most important characteristics of good design. Discoverability, meaning that it should be easy to perceive what actions are available and how they are performed. Understanding, meaning it should be easy to know what the product means with its symbols, etc., and also that it should be easy to know how the product is supposed to be used and to know what the different controls and settings mean. These aspects have been considered in the development of the final concepts of this project. Norman writes that interaction design's goal is to "enhance people's understanding of what can be done, what is happening, and what has just occurred." (Norman 2013). Norman (2013) thinks that in good design, "what actions are possible, what is happening, and what is about to happen" should be communicated from machine to person. The user of a product should always be able to determine the answers to the questions below, Norman (2013) sais. Figure 8, from the book, helps to visualize the sequence.
The seven stages of action. 1. What do I want to accomplish? 2. What are the alternative action sequences? 3. What action can I do now?

22
4. How do I do it? 5. What happened? 6. What does it mean? 7. Is this okay? Have I accomplished my goal? (Norman 2013, p. 71)
Figure 8. Visualization of the seven stages of action. Norman (2013) also writes about seven fundamental principles of design, coming from the seven stages of action:
1. Discoverability. it is possible to determine what actions are possible and the current state of the device.
2. Feedback. There is full and continuous information about the results of actions and the current state of the product or service. After an action has been executed, it is easy to determine the new state.
3. Conceptual model. The design projects all the information needed to create a good conceptual model of the system, leading to understanding and a feeling of control. The conceptual model enhances both discoverability and evaluation of results.

23
4. Affordances. The proper affordances exist to make the desired actions possible. 5. Signifiers. Effective use of signifiers ensures discoverability and that the feedback is well
communicated and intelligible. 6. Mappings. The relationship between controls and their actions follows the principles of
good mapping, enhanced as much as possible through spatial layout and temporal contiguity.
7. Constraints. Providing physical, logical, semantic, and cultural constraints guides actions and eases interpretation.
(Norman 2013, pp. 72-73) Norman (2013) describes the term affordance in the following way: "An affordance is a relationship between the properties of an object and the capabilities of the agent that determine just how the object could possibly be used", the "agent" being a person or something else that interacts with the object. "Affordances determine what actions are possible." Norman (2013) also writes that a "signifier" is something that communicates where the action should take place. "Constraints are powerful clues, limiting the set of possible actions." (Norman 2013). Norman gives an example of a physical constraint: "... a large peg cannot fit into a small hole.". Constraints can be used to limit users of a product to use it in the way it is thought to be used. Mappings are "the relationship between the elements of two sets of things." (Norman 2013). Norman describes it like this: "Suppose there are many lights in the ceiling of a classroom or auditorium and a row of light switches on the wall at the front of the room. The mapping of switches to lights specifies which switch controls which light.". He sais that spatial correspondence between the controller and the controlled device can make it easier to know how to use them. In the case of the light switches, spatial correspondence would mean that if there is a row of lights from left to right, and a row of switches from left to right, the left switch controls the left light, the right switch controls the right light, and so on. "A conceptual model is an explanation, usually highly simplified, of how something works." (Norman 2013). Norman writes that files and folders on computer screens are part of the elements that allow people to create a "conceptual model of documents and folders inside the computer...". There are actually no folders in the computer, he writes - they are just "conceptualizations designed to make them easier to use.". The terms "feedforward" and "feedback" are also described by Norman (2013). Feedforward, he describes as "The information that helps answer questions of execution (doing)...". Feedforward is conveyed through the use of signifiers, constraints and mappings. "The conceptual model plays an important role" he writes. Norman (2013) describes feedback as "The information that aids in understanding what has happened...". He writes that the conceptual model plays an important role for the feedback as well. Feedback is held up as something important by Norman (2013) when it comes to design. The importance of feedback is also acknowledged by Blair-Early & Zender (2008) in the article "User Interface Design Principles for Interaction Design". They claim that "Immediate feedback is necessary to keep users informed that their actions are having an effect. Apt feedback can be a form of reward for the user."

24
Information about HVAC systems from supervisor from Swegon This has its base in how things work in Swegon's HVAC systems. It could be believed that when a temperature is set, and for instance, the user interface shows that 22°C is being set, that the one temperature 22°C is what the system is being set to. Though, what is actually happening is that an interval with a "heating setpoint" and a "cooling setpoint" that has been preset by an installer of the product is being set. The interval is individually set for each application. So if one for example would set 22°C, there are actually two temperatures being set, which could be an interval of 22°C as the lowest temperature (heating setpoint), and 24°C as the highest temperature (cooling setpoint). At the heating setpoint, the system starts heating and at the cooling setpoints it starts cooling. Having this interval allows the temperature to sway between the setpoints. When someone opens a window or more people enter a room, causing the temperature to sway, the system will not need to use energy to try and keep the temperature at an exact value. Figure 9 is made, based on the explanation by the supervisor, Pettersson2 from Swegon, to explain this visually. After getting this explained, this has been looked at as problematic throughout the project, since often times only one setpoint is shown on user interfaces for HVAC systems. At the educational visit at Kvänum, pictures and film-clips of different solutions for showing setpoint/setpoints were shown to supervisor and these were discussed.
Figure 9. Figure made to explain setpoints. Presence or absence modes Sometimes the systems use sensors for detecting presence. When noone is present, the distance between the heating setpoint and the cooling setpoint increases, so that the system does not use as much energy.
2 Kristian Pettersson, Swegon employee, explanation of HVAC systems, spring 2014.

25
Semester-mode The systems sometimes have semester modes they can be set to, so that they increase the distance between the setpoints even more. Adjustable setpoint shown One way of doing it is to show the setpoint that it will start regulating towards if changed. For example, if the current room temperature is 18°C, and the interface's cooling and heating setpoints are currently set to 19°C and 17°C (the setpoint-span is 3°C), and the user sets the temperature towards warmer temperature, it shows the heating setpoint, going up above 18°C, to for example 19°C. Then the new span is between 19°C and 21°C. If the user were to change from 18°C to 17°C, the cooling setpoint would be shown, decreasing to 17°C. The span would now be 15°C to 17°C.
Tips for making an interview guide A compendium which consists of a couple of pages from the book "Som man frågar får man svar" (2001) and various other texts on interviewing, compiled by Wihk3 and used in an earlier course in the Innovation and design engineering programme, was a source of inspiration and provided guidelines when making the interview guides used for the semi-structured interviews. Guidelines which were considered, named in the compendium, were: • Use understandable language • Be consistent in the use of language • Ask one question at a time • Give all the answering options the same chance • Do not ask leading questions • Avoid asking hypothetical questions • Avoid using emotive words • Avoid asking sensitive questions
3 Lennart Wihk, lecture in interview techniques, 2012.

26
3.2.2 Benchmarking Image boards The benchmarking resulted in two image boards. One, showing some user interfaces related to climate and one showing some icons that could represent temperature. Thoughts about the user interfaces and icons are written down on the image boards. Nordbygg fair-visit During the visit at the Nordbygg fair, observations regarding the functions of different user interfaces for HVAC systems were made. Here, some of the observations are written down together with pictures of the user interfaces, to ease understanding. On this Siemens QAW910 (figure 10 & 11), the current room temperature is shown on the display when not altered (figure 10). When readjusting the temperature setpoint, using the wheel, the display shows a dislocation that ranges between -3°C and +3°C from the current room temperature (figure 11). When the temperature has been readjusted, the display goes back to showing the current room temperature.
Figure 10. Siemens QAW910, showing current temperature.

27
Figure 11. Siemens QAW910, showing temperature increased by one degree Celsius. On this one, from Regin (figure 12), both the air-flow- and the temperature-settings are analog. The air flow setting is signified through a fan-symbol on a slider. To the left, there are signifiers indicating what happens if you move the slider. The temperature setting is signified through a wheel with a thermometer symbol next to it. The plus- and minus-symbols signify which way to turn the wheel to increase or decrease the temperature. The user interface also has an on- and off-button in the upper right corner of the interface-area, signified by a commonly used on- and off-symbol.

28
Figure 12. Regin, both air flow- and temperature settings are analogue. On this one from Schneider Electric (figure 13), the current room temperature is shown at first, on a screen, which is a touch-screen. Temperature is increased and decreased using buttons with arrow-symbols on them. Beneath the heating button (arrow pointing up), there is a blue line with a text under it, in this case showing the number "20.0" and above the cooling button (arrow pointing down), there is a red line with a text over it, in this case showing the number "18.5". These seem to be the two setpoints (cooling- and heating-), explained earlier in this report under "3.2.1 Gathering information"; the cooling-setpoint seeming to be the one at the blue line and the heating-setpoint seeming to be the one at the red line. When the temperature setpoints are changed, both these values change into new ones, with the same interval between them. The device also has a Fahrenheit-/Celsius-switch, to toggle between showing the temperatures in Fahrenheit or Celsius.

29
Figure 13. Schneider Electric, seemingly showing both heating and cooling setpoints. Has a Fahrenheit-/Celsius-switch. This one, from Regin (figure 14), is another example of red and blue being used to represent warm and cold. In combination with the colors, it uses arrows (up- and down-) to show the functions of increasing and decreasing temperature (figure 14).
Figure 14. Regin, using red and blue to symbolize heating and cooling.
30
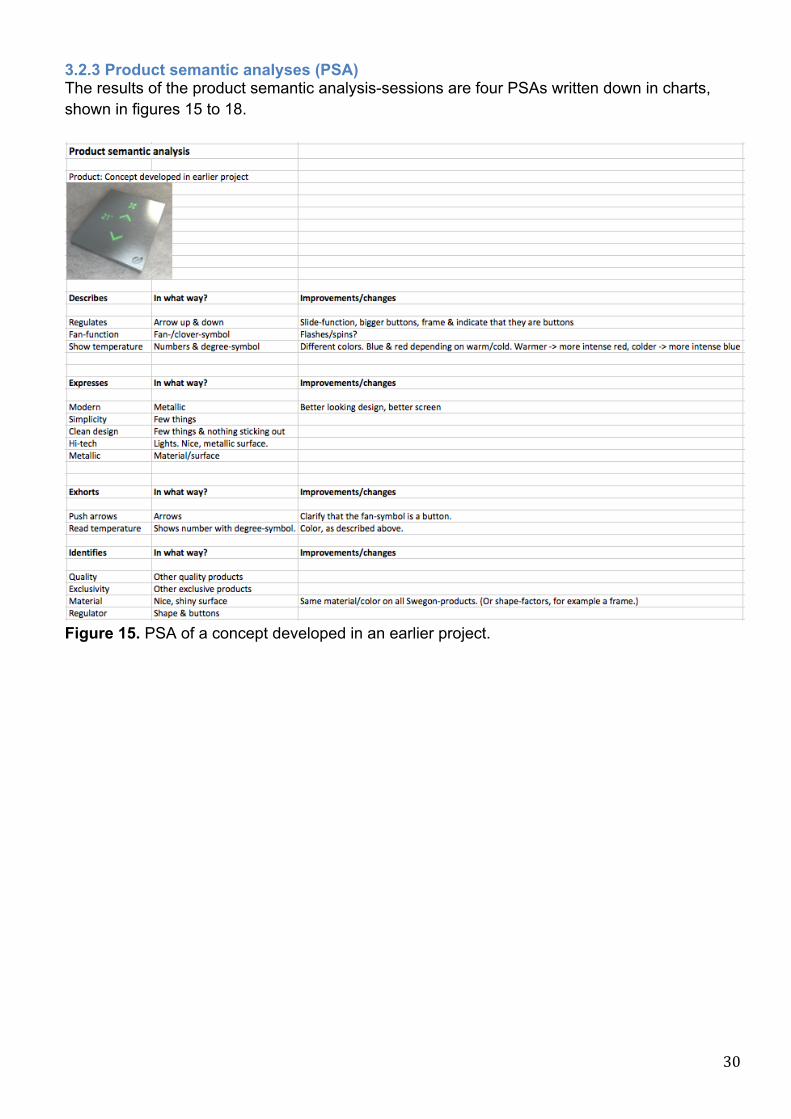
3.2.3 Product semantic analyses (PSA) The results of the product semantic analysis-sessions are four PSAs written down in charts, shown in figures 15 to 18.
Figure 15. PSA of a concept developed in an earlier project.

31
Figure 16. PSA of Swegon's TUNE Control.

32
Figure 17. PSA of Swegon's Luna.

33
Figure 18. PSA of Swegon's sensor/user interface for their ADAPT Parasol-system.

34
3.2.4 Target audience In these accommodation-statistics for 2012 (figure 19) made by the Swedish central bureau of statistics (Statistics Sweden [SCB] 2013), it is declared that 75.8 % of the people staying in accommodations (hotels, cottage villages, hostels, camping sites and private cottages & apartments) in Sweden through this year were Swedish, leaving 24.2 % coming from other countries. In short, these statistics show that many of the accommodation stays in Sweden are made by people from other countries, meaning that many users of Swegon's user interfaces in Sweden will probably not understand Swedish. On top of this, Swegon is a company which also has its systems installed in other parts of the world. Reading these statistics (figure 19) gave a greater understanding for the need of an internationally understood user interface, even if the case would have been that it was to be sold and used only in Sweden.

35
Figure 19. Picture from the accommodation-report from SCB. Target audience assumption: The target audience is people not having much time to get to know the device, who do not use the device very often. The target audience is international and therefore requires internationally understood symbols.
36
3.2.5 Interviews Color interview The result of the interviews about colors resulted in everyone answering red for warmth and blue for cold. Semi-structured interviews The results related to the semi-structured interviews are two interview guides, attached as appendices 2 (the first version) and 3 (the second version), six interviews written down to a large extent in Swedish (see appendix 4), and also a summary of the interviews, translated into English (see appendix 5). Interview regarding installation of user interfaces The interview with the Swegon service-employee regarding installation of user interfaces, written down to a large extent in Swedish, is attached as appendix 6.
3.3 Requirements specification The requirements specification (which also is the functional analysis) is attached as appendix 7.
3.4 Idea generations
3.4.1 Random word-association The random word association generated many wild ideas and gave a number of 60 post-it-notes with ideas scribbled down and or drawn on them.
3.4.2. Slip-writing The slip-writing generated 40 post-it-notes with ideas scribbled down and or drawn on them.
3.4.3. 6-3-5 The 6-3-5-method generated 90 fields of ideas that were a little bit more worked through than the ideas that came from the other two idea generation-sessions.
3.5 Early concept evaluation – trimming of ideas The result of the first trimming of the ideas from the random word-association-session was 22 notes (out of 60 from the start), the result of the trimming of the slip-writing-ideas was 26 notes (out of 40 from the start) and the result of trimming of the 6-3-5-session ideas was 34 notes of ideas (out of 90 from the start). One of the supervisors from Swegon was asked to prioritize five or six relevant judging criteria. The highest prioritized ones were customer value and realizability. The three which were prioritized next were simplicity, innovativity and cost efficiency.
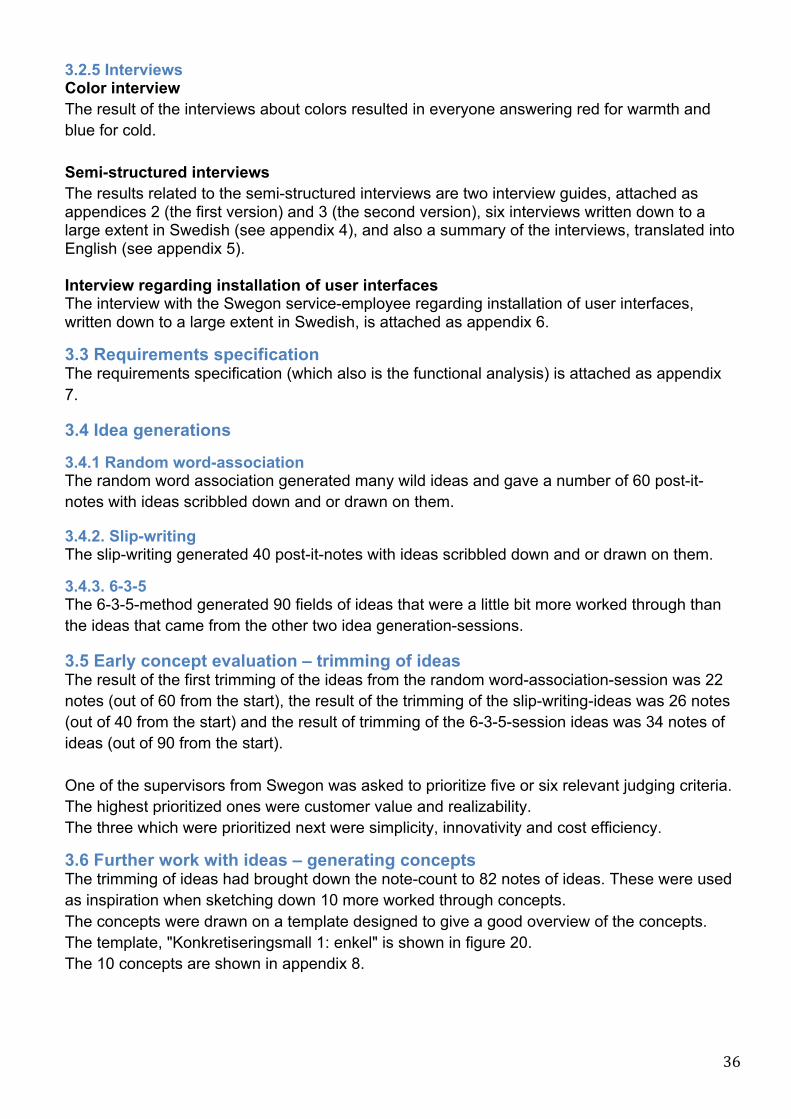
3.6 Further work with ideas – generating concepts The trimming of ideas had brought down the note-count to 82 notes of ideas. These were used as inspiration when sketching down 10 more worked through concepts. The concepts were drawn on a template designed to give a good overview of the concepts. The template, "Konkretiseringsmall 1: enkel" is shown in figure 20. The 10 concepts are shown in appendix 8.
37
Figure 20. Konkretiseringsmall 1: Enkel.

38
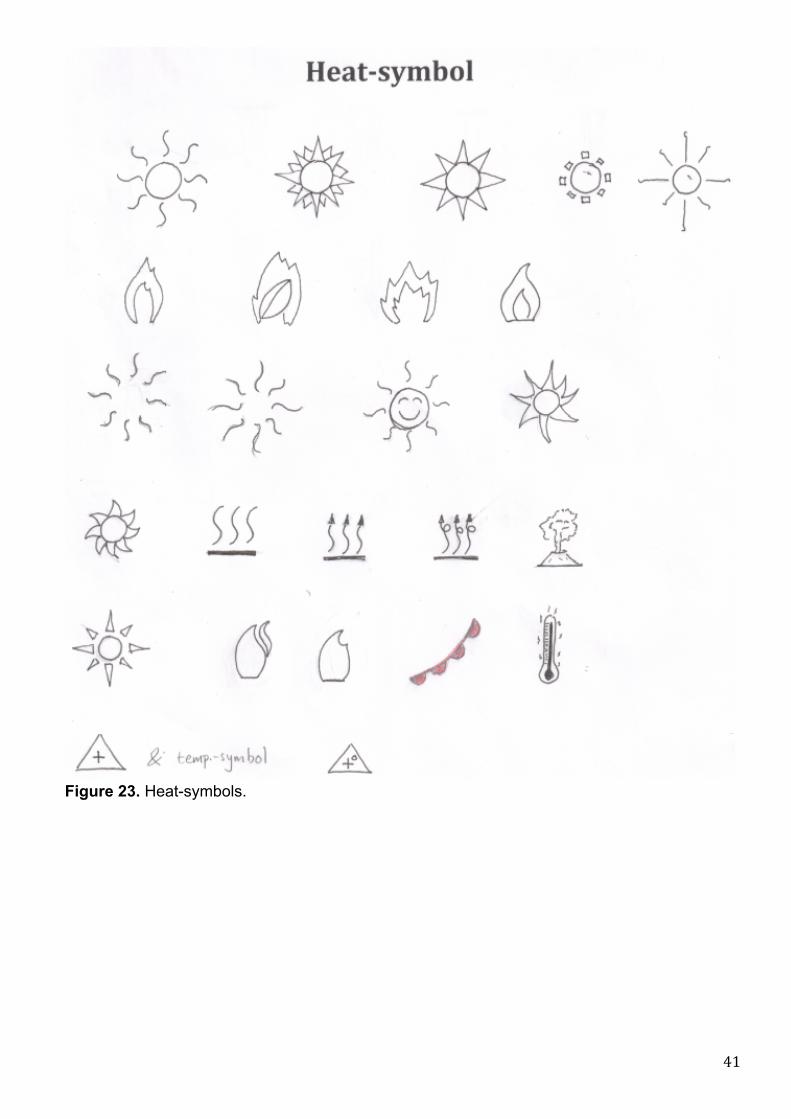
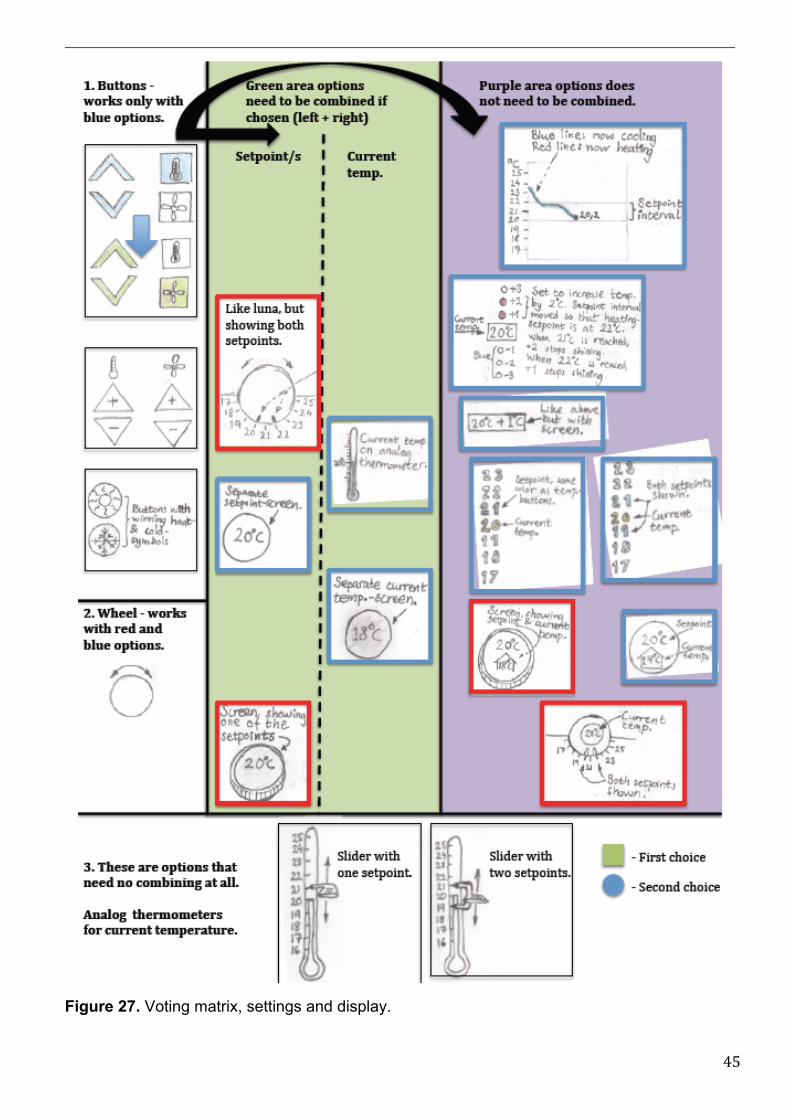
3.7 Presentation to supervisor at Swegon The result from presenting the 10 concepts was a decision to break them down into smaller pieces. 3.8 Breaking down concepts The breaking down of the 10 concepts resulted in the elements shown in figures 21 to 27. The voting systems which were developed, shown in figures 25 to 27, are matrixes, which enabled the voters to combine the elements from the 10 earlier concepts into what they thought were the best combinations. One might like some elements of one idea, and other elements of other ideas. The voters got matrixes which they got to draw lines on, combining different elements. Their first choice was to be marked with green lines combining the chosen elements and have squares drawn next to the elements chosen. Their second choice was to be marked with blue lines combining the chosen elements and have circles drawn next to the elements chosen. In figure 21, one of the matrixes is shown together with an example of how the voting should look. The voting system used for voting on settings and displays (the matrix shown in figure 27) is slightly different from the one used for voting on air-flow related (figure 25) and temperature related (figure 26) elements. The differences from the two other matrixes are described in the settings and display matrix (figure 27).

39
Figure 21. Voting-matrix for air flow-related elements, with an example of how voting could look.
!
"!First!choice!!"!Second!choice!
Air$flow)symbol$ Air)flow)setting$ AirBoost)function$

40
Figure 22. Temperature-symbols.
41
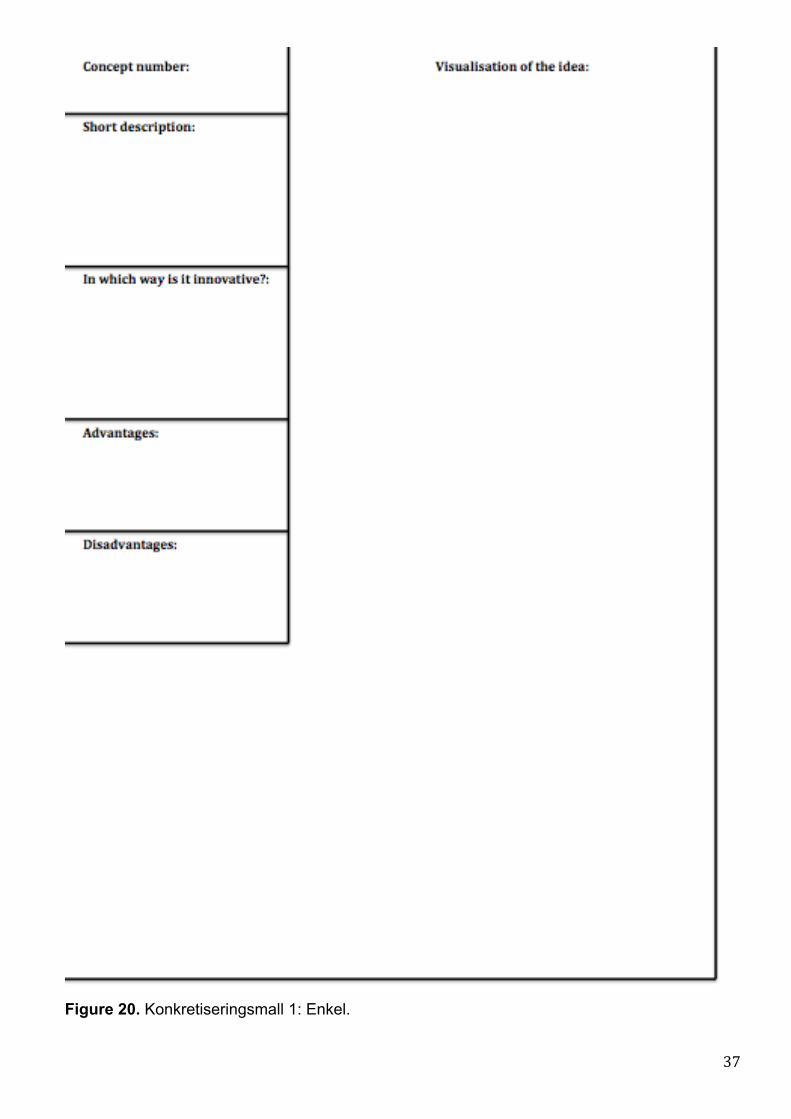
Figure 23. Heat-symbols.

42
Figure 24. Cold-symbols.

43
Figure 25. Voting-matrix, air flow.

44
Figure 26. Voting-matrix, temperature.
45
Figure 27. Voting matrix, settings and display.

46
3.9 Presentation to project group at Swegon, followed by voting The presentation was held 13/5 - 2014. Votes on which elements should be taken further in the development-process were acquired.
3.10 Evaluation of votes In figure 28 below, the winning symbols, settings and display types from the voting are shown.
Figure 28. Winning symbols, settings and display types.

47
3.11 Development of final concepts In this chapter, the results of the stages of the final concept development are presented. These include sketches, CAD-models and two physical prototypes. Pictures of the sketches, CAD-models and physical prototypes are shown in this chapter. This chapter also includes descriptions of the two final concepts, which are given in a table (table 1). Sketches The sketches in figures 29 & 30 are sketches of the two final concepts and are sketched onto the winning capsulation-design from the other project. These sketches were the foundation for the CAD-modeling that followed.
Figure 29. Final concept 1.
Figure 30. Final concept 2.

48
CAD-models Below are pictures of the CAD-models (figures 31-34), modeled from the sketches of the final concepts. The interfaces are in these models adjusted to work with the capsulation design from the other project.
Figure 31. CAD-model of final concept 1.
Figure 32. CAD-model of final concept 1, from the back.

49
Figure 33. CAD-model of final concept 2.
Figure 34. CAD-model of final concept 2, from the back. Prototypes In the figures below (figures 35-39) are pictures of the 3D-printed prototypes, printed from the CAD-models shown above. Figures 38 & 39 show the 3D-printed prototypes mounted together with the entirety of the capsulation-prototype from the other project.

50
Figure 35. Final concept 1, 3D-printed and mounted in capsulation.
Figure 36. Final concept 2, 3D-printed and mounted in capsulation.

51
Figure 37. Final concept 2. Demonstration of shine-through making button-symbols visible. Showing plus- & minus-buttons and symbols for fan- & temp.-settings. Also showing the watch symbol around 3 shining bars with fan-blades surrounding, altogether symbolizing the airboost-function.
Figure 38. Demonstration of symbol shining through wood.

52
Figure 39. Demonstration of symbols shining through wood. Explanation of concepts The table (table 1) explains which functions the interfaces have and how those functions are meant to be used. It also contains comments on the designs and thoughts behind them. In this case, the interfaces are made with touch-buttons and displays that are visible through shine-through-material, but the buttons could just as well be sticking out from a surface, adding a tactile dimension to the buttons, and the scale could just as well be a screen, enabling easy toggling between showing the temperature as Celsius or Fahrenheit if a button working as a Fahrenheit-Celsius-switch would be added.

53
Table 1: Explanation of final concepts. C1 stands for concept 1, C2 stands for concept 2 Functions How does it work? Comments Increase or decrease temperature
C1: Press button with rising air- or snowflake-symbol.
Aiming to use generally understood symbols.
C2: Press temperature button (with thermometer symbol) between arrows, then use arrow buttons.
Easy toggling between temperature- and air-flow-settings. Interact in the same way when altering temperature as when altering air-flow.
Show current temperature and temperature alteration
C1: A temperature scale is shown on the left side of the interface. Shining a "white" light (not colored) for the current room temperature. If temperature-setpoints are moved to warmer (through use of the button with the rising air-symbol), a light shines red for the temperature wished for. If moved to colder (through use of the button with the snowflake-symbol), a light shines blue for the temperature wished for. For both of these cases, the current temperature is still shown as usual. When the temperature reaches the temperature wished for, the red or blue light is replaced with the "white" light (showing current temperature).
Makes use of red and blue color on the setpoints to show if the system is now heating or cooling. Red represents heating and blue represents cooling. A "white" light, aiming to be neutral, represents the current room-temperature. The scale shows both the current room-temperature and the temperature that the system is working to achieve at the same time. Color-coding is used to distinguish the two from one another.

54
C2: A temperature scale is shown on the left side of the interface like in C1, and basically, it works in the same way as in C1. The way they differ from one another is that when pressing the temperature-button (which then starts shining light green), between the arrow-buttons on C2, the setpoint-value turns light green, to signal that it is being controlled by the arrow-buttons, which then will also be light green. When temp.-setpoints have been altered, and the buttons are no longer being touched it shows red or blue in the same way as in C1 (a few seconds after it has stopped being altered).
Same as in C1, and also light and dark shades of green are being used as color-coding to visually connect the buttons that act together to each other, and to visually connect those buttons to the values they alter. The light and dark shades of green being used are supposed to be of the same shades as the ones on the leaf in Swegon's logotype, and thereby, in a subtle way, make the interface identify with the Swegon brand. Using the shades of green avoids collision with the color coding for heating and cooling. The scale is placed on the left side of the interface and the button that decides that the arrow-buttons will alter temperature is placed to the left between the arrow-buttons. This layout is thought to ease peoples understanding of the connection between the temperature scale and the button the button just mentioned.
Increase & decrease air-flow. C1: Press the fan-blades, which are buttons and are "filled in" with a dark green light if pressed when not shining, and stops shining if pressed when shining.
Interact directly with the fan symbol which consists of buttons.

55
C2: Press the button with a fan-symbol on it, located between the arrows. The button starts shining dark green and the arrow buttons also start shining dark green to signal that they now control the air flow. As the air-flow is altered (using the arrow-buttons), the bars to the right react. If air-flow is increased, more of them shine dark green. If the air flow is decreased, fewer of them shine dark green.
Easy toggling between air-flow- and temperature-settings. Interact in the same way when altering air-flow as when altering temperature.
Show airflow C1: Number of fan-blades shining dark green. Increased air-flow is shown by more fan-blades shining.
Placed in direct connection with the buttons (they even are the buttons). The idea of this is to make it easy to understand the connection between the buttons and what they alter.
C2: Number of bars shining dark green. Increased air-flow is shown by more bars shining.
The bars are placed to the right of the buttons that alter them (the arrow-buttons), with the air-flow-button as the right one of the two buttons which decide what the arrow-buttons alter (located between the arrow-buttons); closest to the bars. This, as in C1, is layout thought to make it easy to understand the connection between the buttons and what they alter.
Airboost function C1: Press the round button with an hour glass-symbol, placed between the fan buttons (in the center). All fan-blades start shining (or slowly blinking?) when pressed.
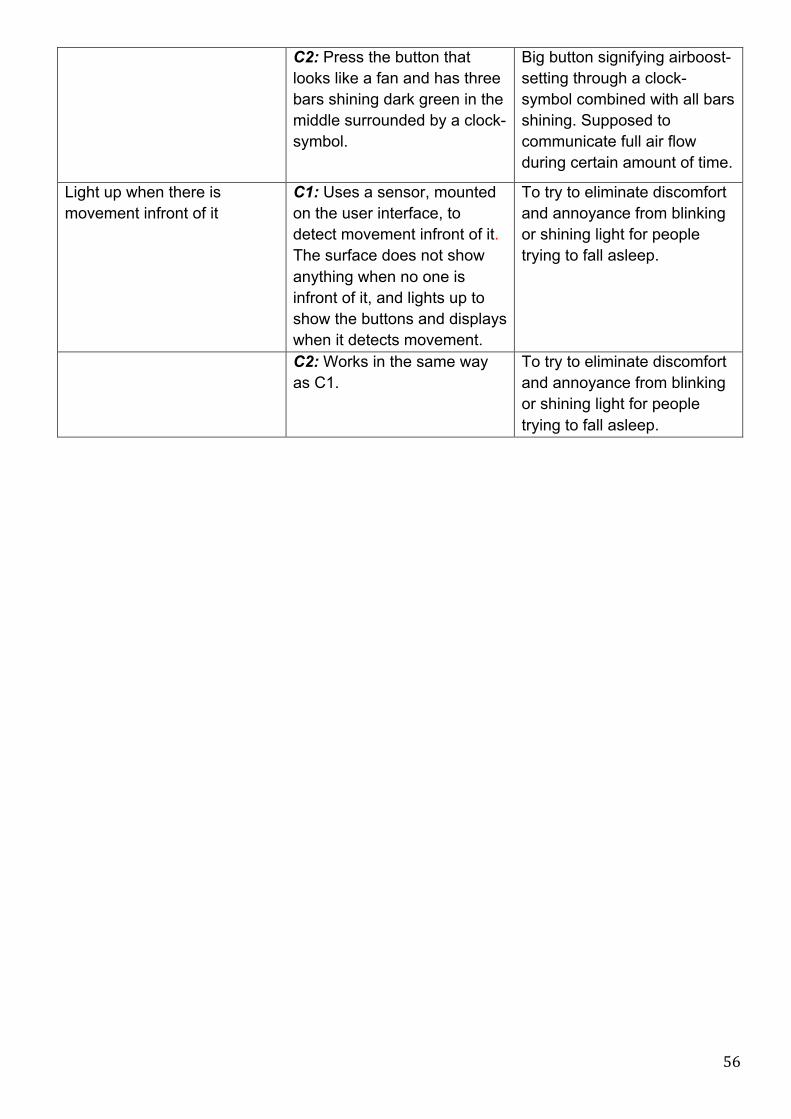
Interact in the same area for airboost settings as for air-flow settings. Signifying airboost-setting through hourglass-symbol combined with all fan-blades shining (or slowly blinking?) when pressed. Supposed to communicate full air flow during certain amount of time.
56
C2: Press the button that looks like a fan and has three bars shining dark green in the middle surrounded by a clock-symbol.
Big button signifying airboost-setting through a clock-symbol combined with all bars shining. Supposed to communicate full air flow during certain amount of time.
Light up when there is movement infront of it
C1: Uses a sensor, mounted on the user interface, to detect movement infront of it. The surface does not show anything when no one is infront of it, and lights up to show the buttons and displays when it detects movement.
To try to eliminate discomfort and annoyance from blinking or shining light for people trying to fall asleep.
C2: Works in the same way as C1.
To try to eliminate discomfort and annoyance from blinking or shining light for people trying to fall asleep.

57

58
4. Discussion Target audience Since no research to define the target audience of user interfaces for HVAC systems was found, I decided to make assumptions about the target audience, based on the belief that people, at least those staying in hotel rooms, do not have much time to put on learning the device. Having this user audience and the want from Swegon to have a "simple" user interface developed meant that complex settings did not get prioritized at all, but focus was put on understanding the necessities. I was thinking of doing some interviews trying to define the target audience, before doing the other interviews, but it seemed like it would be very time consuming and therefore better suited for a larger project. An attempt of making at least the age of the target audience clear was made, contacting the Swedish central bureau of statistics, trying to find the average age of people staying in hotels or people working in office environments. They did not have statistic based on the age of people staying in hotels, nor did they have any on people working in offices. They did however have statistics on how many people staying in Swedish accomodations were from other countries. These statistics made it clearer that the target audience was broad, and also that the semantics of the concepts being developed should be understood by people not only from Sweden. On top of this, Swegon is a company delivering their products to big parts of the world, making the importance of universal understanding of their user interfaces even more clear. Interviews The interviews made were of the semi-structured type, giving both qualitative and quantitative answers. The interviews took about half an hour on average and took a very long time to write down in documents on the computer. If I would have done this project again, I would not have put as much time on documenting the interviews, focusing more on the answers that felt most important to the project and less on others. Recording interviews was good, since there is an issue with steering the interviewed peoples answers. I heard myself doing this at least once when listening to the recordings and could thereby rethink writing down that answer as something that came from the interviewed person. As people in general do not seem to have much experience of user interfaces for ventilation systems, I could have made an interview based on other setting devices/user interfaces, which are alike. Before the interview regarding installation of user interfaces with the guy working at Swegon service, it would have been nice to know more about the subject. Since my knowledge on the area was thin, the interview guide that I had made proved to be of lesser use than the interview guides made for the end user-interviews. The interview was not as structured as the ones with the end users and this made it harder to write down. I could have made a new interview-guide after doing the interview and contacted someone else from Swegon service for another interview, being better prepared. Joker An idea of a bigger hotel solution came up during the project. This is something that was not worked on so much, but could have been something fun to show among the results as some sort of wild card. Random word-association During this session, focus was probably put too much on generating ideas around the random

59
words, instead of letting the random words make people come up with new ideas when their inspiration was low. This might have locked the idea generation-process to some extent. Maybe, I should have, as described by Michanek & Breiler (2004), let the participants write down their ideas before the idea generation started on this one. They did not get the questions before the idea generation started, though, but maybe they should have gotten a little time to write something down before a word was connected to the idea-spawning. The words probably did inspire lots of ideas that would not have been thought of if they were not used, though. Slip-writing This method was a good way of letting me get my own ideas down on paper in a fast way and for the participants to be able to think freely without the problem mentioned about the random word-association-session affecting them. Installer of the product At first, my plan was to regard the installer of the product in the development-process. That plan had to be let go due to lack of time. This was thought of very late in the process. An interview with an installer had already been made, but did not come to use in the development-process. Setpoints Since how much of a relevant question the question of setpoints was to this work was not fully understood until relatively late in the project, interviews which could have been good to make was not done. I would have liked to check what people really think about the idea of showing both the setpoints in a good way, to not lie to the end users and to give them a better conceptual model of what they are actually setting. Image boards The modification of moodboards allowed for a good way of saving thoughts that occurred in the making of the image boards about problems with, and good things about different devices and ways of showing warm and cold. Though, having real moodboards could have been nice at the idea generation-sessions and when sketching down ideas at other times. Two setpoints To understand the problematic situation which follows with using two setpoints, end users of the product and facility owners must both be taken into account. The wants of the end user does not always seem to match the wants of the facility owner. End user vs. facility owner Facility owners probably want to push down the electrical bill, making them want to have a big distance between the two setpoints. The end users, on the other hand, probably want the distance between the setpoints to be as small as possible, so that the temperature sways less around their requested temperature. When trying to make a user interface that meets both the wants of end users and facility owners (electrical bill payers) the difference in wants is a problem. Some (most) people want to see current room temperature on the user interface (based on the interviews with end users). When having a distance between the two setpoints, the end user will be able to see that the system can not deliver the temperature that they set, if the temperature setpoint shown to them consists of only one value, telling them that they have set a certain temperature. They get a wrongful conceptual model of the system, telling them that the system is always trying to reach one certain temperature, when the system is actually

60
satisfied staying within an interval of two temperatures. This makes some companies unwilling to show current room temperature on their user interfaces. One way to attack this is like Schneider Electric seem to have done (figure 15). The user interface shows the current room temperature and what seems to be the two setpoints, at the same time. Personally, I think this interface is confusing, though. Showing these values, I think has its advantages, though on this interface I do not think it is clear enough what the values that seem to represent the setpoints are. The current indoor temperature feels like one could understand what it is, since it has the text "Indoor °C" over it. What seems to be the two setpoints (heating- and cooling-setpoint) explain what they are through the lower setpoint (heating-setpoint) being placed at the decrease-temperature-button (down-arrow) and the higher setpoint (cooling-setpoint) being placed at the increase-temperature-button (up-arrow). In addition to this, the heating-setpoint has a red line under it, and the cooling-setpoint has a blue line over it. From this information, it seems people are supposed to understand that the system has two setpoints, being the numbers at the two arrows, and that one is the setpoint where the system starts to heat, since there is a red line at it (and red is a common color to represent heat), and that one is the setpoint where the system starts to cool, since there is a blue line at it (and blue is a common color to represent cold). I think that this can be understood quite easily by people who know the concept of the setpoint-interval already, but that it may be hard to understand by someone who does not. During the interviews, the setpoints were explained to one person, who initially thought it would not be satisfying if the temperature varied a bit from the set value, but when the concept of having two setpoints was explained, the tolerance for a varying temperature increased. Interviews focusing on peoples opinions on this would be nice to have conducted. Maybe there is a better way of explaining the situation of the two setpoints through the user interface. If that could be done, I think it could grant a competitive advantage, if the increased tolerance for a varying temperature that revealed itself in the interview just mentioned actually applies to many people. Fahrenheit/Celsius If the concepts are designed to fit the capsulation that these CAD-models and prototypes are designed to fit; another disk with different temperature-values needs to be made if the user interface would be sold to a country that uses Fahrenheit. If the concept would be applied to a capsulation that uses a screen, a toggle-button could be applied to switch the values between Fahrenheit and Celsius. Symbols On the concept with symbols for heating and cooling, which uses a snowflake for symbolizing cold and rising air for symbolizing heating, the one for heating is something that Swegon voted for, and I think that maybe a sun could be easier to understand. Though, I think that people will understand what the rising air-symbol means, since it is shown together with an opposite one with a snowflake on it. LEDs The disc with LEDs, which was made to shine through the holes that made the symbols, did not work as planned. The LEDs were too close to the symbols to give a good shine-through. Smaller LEDs could maybe fix this problem, making the distance bigger. Constructing some sort of reflector that could be placed around the LEDs to spread the light better could perhaps be another solution. Choosing light-colors for concept two (C2) The colors that are chosen to separate setting temperature from setting air-flow are chosen because I did not want them to be the same colors as the ones for showing heating, cooling or

61
current temperature, to try to avoid confusion. This meant neither of them could be "white", which is the color used to show current room temperature, or the same shade of red or blue as the ones for showing heating and cooling. Since I needed other shades of these colors or different colors altogether, I chose to use the two shades of green that are used in the leaf in Swegon's logotype. These colors are intended to work as factors of identification between the product and the company.

62
5. Conclusions Two main questions have been touched: What functions do end users want in a user interface for HVAC systems? How can a user interface for an HVAC system be interacted with in a user-friendly way? The interviews lead to a better understanding of what functions the end user group wants. According to the interviews conducted, the end users all want to be able to set temperature. Most of them want to be able to regulate air flow. Half of them want to be able to regulate humidity (though, this was not touched in this project, since the system is not able to deliver humidity change). Almost everyone wanted it to show current temperature. Most of them wanted to see which temperature they set. The part of the purpose formulated: "To help Swegon get a clearer picture of what their end users want out of an HVAC system, and how they want to control one." has been fulfilled through handing Swegon the interviews and interview compilation through this report, which hopefully gives them valuable input. Concepts, having the functions which were most common that the end users wanted, and also the air-boost function (increase in air-flow for a preset amount of time) that Swegon wanted, have been developed. The report now presents two concepts of user interfaces for HVAC systems, focused on usability of the user interface. One of the concepts uses symbols displaying heating and cooling aiming to be understood in large parts of the world. The one for heating is something that Swegon voted for, and I think that maybe a sun could be easier to understand. Though, I think that people will understand what that one does, as it is put together with an opposite one, with a snowflake on it. The other concept uses arrows with a plus and a minus sign. This is a very common way of showing an increase or decrease, and aims to be understood in large parts of the world. The scale, used in both concepts, uses Celsius temperature indication in the form of numbers that in the CADed and 3D-printed versions of the concepts have been moulded into the product. This could make for problems if trying to sell the product in countries using Fahrenheit. If the concepts are made with a screen instead, without shine-through, they could come with a Fahrenheit-Celsius-switch.

63
Recommendations for future work The concepts now show one setpoint-temperature and the current room temperature. They could have been showing both the setpoints, though, to make a decision about what temperatures should be shown and in what way, I think that some sort of large scale interviewing or testing with end users should be conducted. The decision to only show one setpoint is based on the voting conducted. For future work, I would recommend that Swegon looks into what people think of the setpoints and if maybe both of them should be shown in some way, because to me it is unclear if any other company in this field has done this. This could maybe grant Swegon a competitive advantage. I think that if further work is done investigating what installers want out of a user interface for HVAC systems, the information gained could perhaps be used to design a user interface that in some way makes it easy to make the settings needed to be made directly using the user interface, instead of using a computer (if it sounds interesting to many installers), which was my impression from the interview regarding installation of user interfaces is the most common way of making the settings today. I would recommend conducting a larger study on whether end users want air-flow-settings on the devices, since the interviews conducted in this project indicate that it is wished for. I would argue that a larger study is needed if wanting to base decisions on it. In the study, I think it would be appropriate to also investigate what people really want out of the air-flow-setting, if the majority wants it. A thought on having an on-off-switch for the system emerged in one of the interviews as a demand, and I think that it may be interesting to investigate if this is something that end users in general want. I think that it could be rewarding to create interactive digital prototypes of the two user interface-concepts developed and let potential end users try them, to see their reactions and to get some feedback on what are good characteristics in the concepts and what could be added or changed to make the concepts better.
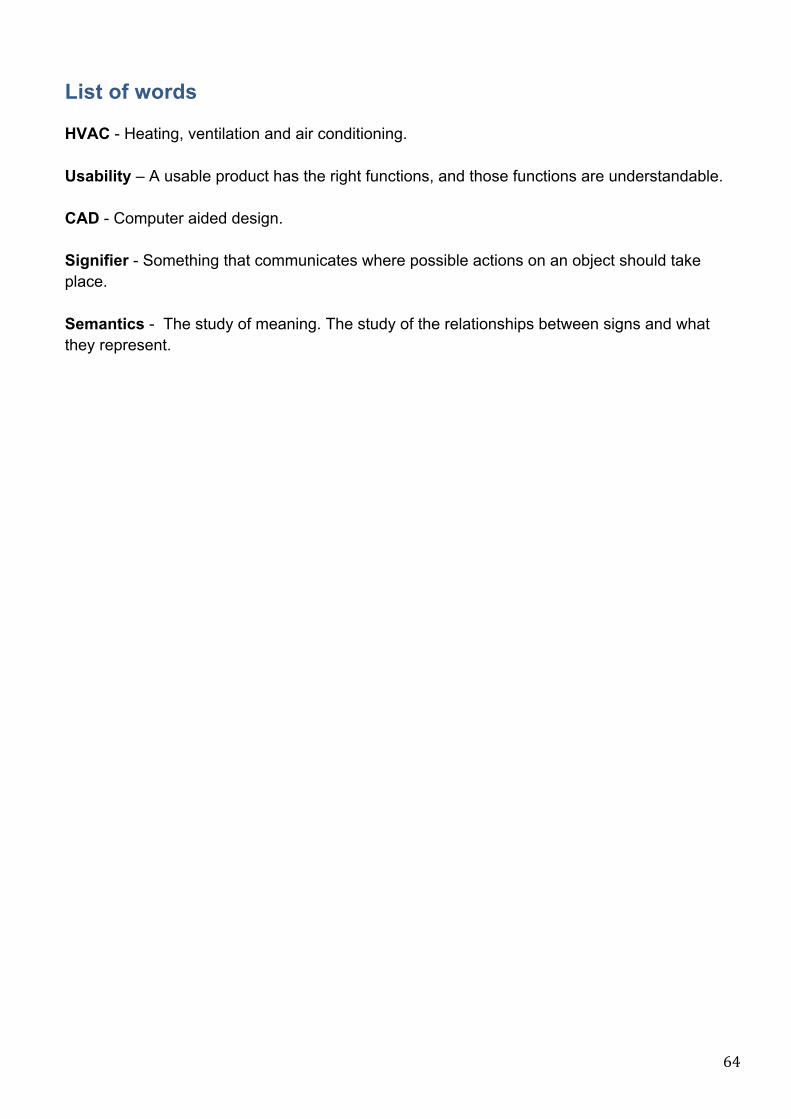
64
List of words HVAC - Heating, ventilation and air conditioning. Usability – A usable product has the right functions, and those functions are understandable. CAD - Computer aided design. Signifier - Something that communicates where possible actions on an object should take place. Semantics - The study of meaning. The study of the relationships between signs and what they represent.

65
Thanks Thanks to Kristian Pettersson and Lina Nygren at Swegon for the support during the project. Thanks to Lars Wellner at Swegon, for the presentation of the UI interface project and material from it. Thanks to Lennart Wihk, lecturer at Karlstad University for the support during the project. Thanks to the people who participated in the end user-interviews. Thanks to Anders Jakobsson from Swegon Service for participating in the interview regarding installation of user interfaces. Thanks to Mikael Åsberg, lecturer at Karlstad University for helping with the 3D-printing of the prototypes. Thanks to Anders Samsson, student at Karlstad University, for being a discussion partner throughout the project and for the collaboration in delivering the final concepts to Swegon.

66
References Andersson, B-E. (2001) Som man frågar får man svar. Göteborg: Elanders Digitaltryck. Blair-Early, A. & Zender, M. (2008). User Interface Design Principles for Interaction Design. Design issues, 24 (3), pp.85-107. Eriksson, M. & Lilliesköld, J. (2004). Handbok för mindre projekt. Stockholm: Liber Fritzon, I., Karlsson Ejwertz, V., Samsson, A. & Åkerman Markgren, M. (2014). Uniform Room Control Level 2. Karlstad: Fakulteten för hälsa, natur- och teknikvetenskap, Karlstads universitet. Johannesson, H., Persson, J-G. & Pettersson, D. (2009) Produktutveckling - effektiva metoder för konstruktion och design. Stockholm: Liber Landqvist, J. (2001) Vilda idéer och djuplodande analys: Om designmetodikens grunder. Stockholm: Carlsson Michanek, J. & Breiler, A. (2004) Idéagenten - en handbok i att leda kreativa processer. Malmö: Brain Books AB Monö, R. (1997) Design for product understanding. Stockholm: Liber Norman, D. (2013). The design of everyday things. New York: Basic Books Osvalder, A-L., Rose, L. & Karlsson, S. (2010). Metoder. I Bohgard, M., Karlsson, S., Lovén, E., Mikaelsson, L-Å., Mårtensson, L., Osvalder, A-L., Rose, L. & Ulfvengren, P (red.) Arbete och teknik på människans villkor. Stockholm: Prevent Pettersson, P., Johansson, O., Broman, M., Blücher, D. & Alsterman, H. (2009) Lean: gör avvikelser till framgång. Stockholm: Part Development. Schmidt, L.C., Vargas Hernandez, N. & Ruocco, A.L. (2012). Research on encouraging sketching in engineering design. Artificial Intelligence for Engineering Design, Analysis and Manufacturing, 26 (03), pp.303-315 Statistiska centralbyrån (2013). Inkvarteringsstatistik för Sverige 2012 - Totalundersökning av Sveriges hotell, stugbyar, vandrarhem, campingplatser och förmedlade privata stugor och lägenheter - Accommodation statistics 2012, Sweden. Stockholm: Statistiska centralbyrån. Veisz, D., Namouz, E.Z., Joshi, S. & Summers J.D. (2012). Computer-aided design versus sketching: An exploratory case study. Artificial Intelligence for Engineering Design, Analysis and Manufacturing, 26 (03), pp.317-335. Österling, K. (2010) Design i fokus - för produktutveckling. Malmö: Liber

67
Appendices
Appendix 1: Project plan
Projektplan
DC0075 - Uniform Room Control Unit 2: delprojekt - kognitiv ergonomi hos börvärdesomställare
1. Introduktion Detta är projektplanen för ett projekt som görs som examensarbete för högskoleingenjörsexamen i innovationsteknik och design på Karlstads universitet. Här beskrivs bland annat projektets problemställning, syfte och mål. Dessa kan komma att omformuleras eller ändras under projektets gång, exempelvis på grund av tidsbrist eller nya insikter.
2. Bakgrund Företaget Swegon AB är en del av Latour-koncernen och är en av de marknadsledande företagen inom energieffektiva ventilations- och inneklimatsystem. Swegon är baserat i Sverige men deras produkter finns över stora delar i världen. Swegon har sex produktionsanläggningar varav tre av dem i Sverige; i Arvika, Tomelilla och Kvänum. Swegon erbjuder lösningar för inomhusklimat som är tänkta att inte märkas av. De försöker med hjälp av deras komponenter och systemlösningar bidra med energibesparing och skapa inomhusklimat där människor kan må bra. Swegon bildades 2005 genom en förening av de två företagen PM-LUFT och Stifab Farex. Stifab Farex var stationerat i Tomelilla medan PM-LUFT befann sig i Arvika. I Tomelilla har man fokus på luftdon medan man i Arvika fokuserar på induktionsapparater som distribuerar luft, värme och kyla samt kombinerar luft med vattenburna system. I september 2012 bildade Swegon gruppen Room Unit. Syftet med Room Unit är att arbeta med de delar av Swegons system som finns i slutanvändarens miljö. Enheterna som Room Unit jobbar med är hårt draget de enda produkterna som är synliga för Swegons slutanvändare och kan därför tolkas som Swegons ansikte utåt. En del av enheterna som Room Unit-gruppen arbetar med är så kallade "börvärdesomställare", som används för att reglera klimat. Dessa sitter ofta på väggen i exempelvis hotellrum. Swegon önskar nu att det utförs en undersökning om hur man kan optimera användargränssnittet till börvärdesomställare för att ge mervärde för slutkund eller Swegon.
68
3. Problemformulering Hur kan man utforma användargränssnittet på en börvärdesomställare för att främja användarvänlighet?
4. Syfte I projektet skall en undersökning av kognitiv ergonomi hos börvärdesomställare utföras. Det skall tittas på om denna kan optimeras. Syftet med att optimera den kognitiva ergonomin är att ge ett mervärde till Swegons produkter och förhoppningsvis göra Swegons slutkunder nöjdare. Arbetsprocessen skall bygga på designprocessen och skall presenteras i en akademisk rapport. Syftet med detta är att i ett skarpt projekt öva på och visa prov på den kunskap som har förvärvats under utbildningens gång.
5. Mål Att presentera konceptförslag på hur kognitiv ergonomi kan optimeras för börvärdesomställare, alltså ge förslag på olika sätt att underlätta slutanvändarens förståelse för börvärdesomställares funktioner och få denne att våga använda dem. I dessa koncept skall hänsyn till vilka egenskaper som är särskilt viktiga för en börvärdesomställare vara tagen. Koncepten kommer att presenteras genom illustrationer, exempelvis som skisser och färglagda bilder med förklaring av funktionalitet. Hur användargränssnittet kan se ut på en börvärdesomställare kommer att illustreras med hjälp av renderade CAD-modeller. En studie som beskriver vilka symboler, färger och eventuellt grupperingar av funktioner som bör användas och motivering till varför förslagen är lämpliga skall presenteras i form av text och bilder i ett dokument som bifogas i rapporten. I studien skall även ingå en analys av vilka egenskaper som för slutkunder och intressenter på Swegon är särskilt vilktiga hos en börvärdesomställare. En akademisk rapport skall skrivas. Denna skall beskriva arbetsprocessen, som skall bygga på designprocessen. Rapporten skall vara skriven på engelska, på önskemål av Swegon. I rapporten skall också en grov uppskattning om realiserbarhet och kostnad presenteras. En delredovisning av projektet skall ske den 20:e mars. Projektet är tänkt att vara färdigt för slutpresentation den 21:a maj 2014. Resultatet skall även visas upp på en examensarbetsutställning. Examensarbetet skall läsas och opponeras på av annan student. I examensarbetet ingår även att läsa och opponera på annan students examensarbete. Opponeringen sker den 27:e maj.
6. Arbetsplanering
6.1. Gantt-‐schema Tidsplanering i form av ett Gantt-schema är gjort och finns bifogat som bilaga 1.
6.2. WBS Arbetsmoment i projektet är illustrerade i en WBS som finns bifogad som bilaga 2.
7. Riskbedömning

69
Sjukdom: Jag eller någon av handledarna på Swegon eller någon handledare på skolan skulle kunna bli sjuk, vilket kan kompromissa tidplanen för projektet och möjligtvis projektets resultat. Lösningsfokus: Jag kan bli fokuserad på lösningar för tidigt och på så vis låsa mig vid någonting tidigt, vilket kan leda till att jag missar andra möjliga lösningar som kanske är bättre. Research: Jag skulle kunna lägga för lite tid på researchen eller missa viktig information och därmed ha en tunnare bas än lämpligt att stå på när jag börjar min konceptgenerering. Intervjuer: Utformningen av intervjufrågor kanske inte tillåter svar som verkligen är relevanta för projektet Tidplan: I min tidplan som den ser ut idag kanske fördelningen av tid mellan research och lösningsfas inte är lämplig, vilket eventuellt kan leda till tunn research eller dåligt genomarbetade koncept. Patent-, mönster-, uphovsrätts- eller varumärkesskydd: Jag skulle kunna stöta på patent-, mönster-, upphovsrätts- eller varumärkesskydd som hindrar mig från att gå vidare med lösningar som jag tycker är bra.
8. Organisation Viktor Karlsson Ejwertz Telefon: 0763 - 497 495 E-post: [email protected] Lennart Wihk Handledare, Karlstads Universitet E-post: [email protected] Leo de Vin Examinator, Karlstads Universitet E-post: [email protected] Lina Nygren Kontaktperson på Swegon E-post: [email protected] Kristian Pettersson Kontaktperson på Swegon E-post: [email protected]
9. Dokumenthantering Google Drive kommer att användas för att samla dokument i projektet på ett gemensamt ställe.

70
Bilaga 1: Gantt-schema

71
Bilaga 2: WBS

72
Appendix 2: Interview guide - end users, ver. 1
Intervjumall för intervjuer med slutkunder, ver. 1. Syftet med denna intervju är att få fram underlag som kan hjälpa till att lista önskade funktioner och egenskaper hos börvärdesomställare, samt att identifiera vad som gör en börvärdesomställare enkel respektive svår att förstå sig på och vad som får en börvärdesomställare att bjuda in till användning eller avskräcka från att användas.
Introduktion av mig själv och presentation av intervjun: (Denna introduktion används som riktlinje då den intervjuade ej känner till vem jag är eller vad syftet med intervjun är.) Jag väljer att inte berätta direkt att intervjun handlar om BVO, då jag tror att detta kan påverka folks svar på de tidiga frågorna som berör teknik i allmänhet, snarare än BVO. Hej! Jag heter Viktor och pluggar på Karlstads universitet. Jag håller på att göra mitt examensarbete, som handlar om utveckling av användargränssnitt hos en teknisk pryl. Skulle du kunna tänka dig att svara på några frågor? Det finns inga svar som är fel och du kommer att vara anonym. Det är okej att hoppa över frågor om du inte kan komma på ett svar eller av någon anledning inte känner för att svara på frågan. Intervjun tar cirka X minuter och innehåller 18 frågor. Får jag spela in intervjun?
Intervjufrågor Ålder: Kön: 1. Har du någon teknisk pryl eller apparat som du tycker är lätt att använda? • Vad gör den lätt att använda? 2. Har du någon teknisk pryl eller apparat som du tycker är svår att använda? • Vad gör den svår att använda? 3. Vad vill du kunna ändra för klimatparametrar i ett rum? 4. Vilken av klimatparametrarna känns viktigast att kunna ändra?
73
5. Har du någon gång sett en börvärdesomställare? (ev. en sån här eller motsvarande: visa bild på BVO) + fråga vad kan man göra med en sådan?) 6. Har du någon gång använt en börvärdesomställare? • Varför? • Varför inte? 7. Vad gjorde den lätt/svår att använda? 8. Hur upplever du det att använda en BVO? Vad tror du gör att det är så? 9. Vilken funktion använder du dig av oftast? 10. Finner du alla funktioner nödvändiga? • Använder du dig av luftflödesfunktionen om den finns? 11. Behövs det andra funktioner? • Vilka i så fall? 12. Vill du att den skall visa nuvarande rumstemperatur? 13. Vill du veta vilken temperatur du reglerar mot eller räcker det med varmare och kallare som indikation när du reglerar? (ev. Räcker det att veta att du ställer in en varmare temperatur?) 14. Störs du av ljus från tekniska apparater när du ska sova? 15. Har du några direkta krav på en BVO? 16. Har du några önskemål om en BVOs funktioner? 17. Vad säger du om jag säger återkoppling? (Ev. när är återkoppling viktigast? Vid inställning? Vid uppnådd temperatur?)
74
18. Hur hade du allra helst reglerat temperaturen i ett rum? (Ev. säg ett önskescenario om hur du skulle vilja ställa om klimatparametrar i ett rum.)

75
Appendix 3: Interview guide - end users, ver. 2
Intervjumall för intervjuer med slutkunder, ver. 2. Syftet med denna intervju är att få fram underlag som kan hjälpa till att lista önskade funktioner och egenskaper hos börvärdesomställare, samt att identifiera vad som gör en börvärdesomställare enkel respektive svår att förstå sig på och vad som får en börvärdesomställare att bjuda in till användning eller avskräcka från att användas.
Introduktion av mig själv och presentation av intervjun: (Denna introduktion används som riktlinje då den intervjuade ej känner till vem jag är eller vad syftet med intervjun är.) Jag väljer att inte berätta direkt att intervjun handlar om BVO, då jag tror att detta kan påverka folks svar på de tidiga frågorna som berör teknik i allmänhet, snarare än BVO. Hej! Jag heter Viktor och pluggar på Karlstads universitet. Jag håller på att göra mitt examensarbete, som handlar om utveckling av användargränssnitt hos en teknisk pryl. Skulle du kunna tänka dig att svara på några frågor? Det finns inga svar som är fel och du kommer att vara anonym. Det är okej att hoppa över frågor om du inte kan komma på ett svar eller av någon anledning inte känner för att svara på frågan. Intervjun tar cirka X minuter och innehåller 22 frågor. Får jag spela in intervjun?

76
Intervjufrågor Ålder: Kön: 1. Vet du om eller har du någon teknisk pryl eller apparat som du tycker är lätt att använda? • Vad gör den lätt att använda, tror du? 2. Vet du om eller har du någon teknisk pryl eller apparat som du tycker är svår att använda? • Vad gör den svår att använda, tror du? 3. Vad vill du kunna ändra för klimatparametrar i ett rum? 4. Vilken av klimatparametrarna känns viktigast att kunna ändra? 5. Har du någon gång sett en börvärdesomställare? Förklaring av BVO: De brukar vara någon form av dosa som sitter på väggen i exempelvis hotellrum, kontorsmiljöer eller skolmiljöer och används för att ställa in olika klimatparametrar, som exempelvis luftflöde och lufttemperatur. 6. Har du någon gång använt en börvärdesomställare? • Av vilken anledning? (Vad gjorde den avskräckande/enkel/svår) 7. Hur upplever du att det är att använda en BVO? • Vad tror du gör att det är så? 8. Vilken funktion använder du oftast? 9. Känns någon funktion överflödig? 10. Önskar du andra funktioner? • Vilka i så fall?

77
11. Har du några direkta krav på en BVOs funktioner? (Vilka som skall finnas/hur de skall fungera, etc.) 12. Vill du att den skall visa nuvarande rumstemperatur? 13. Tycker du att det räcker att veta att du reglerar mot varmare eller kallare temperatur, eller vill du veta ungefär vilken temperatur du reglerar mot? • Hur kommer det sig? 14. Störs du av ljus från tekniska apparater när du ska sova? • Är blinkande eller konstant ljus värst? 15. Tycker du att det är viktigt med återkoppling när temperatur är uppnådd? 16. Tycker du att det är viktigt med återkoppling när du reglerat ett värde? 17. Vill du kunna justera luftflödet på något sätt? Hur då? 18. Om du tänker dig ditt önske-‐/drömscenario, hur hade du då reglerat klimatparametrar i ett rum? 19. Vilket tror du är det bästa sättet att visa höjning & sänkning av temperatur? 20. Vad tror du är det bästa sättet att visa luftflödeshastighet på? 21. Vad tror du är det bästa sättet att visa funktionen temporärt ökat luftflöde tills önskad temperatur är uppnådd på? 22. Vad tror du är det bästa sättet att visa funktionen temporärt ökat luftflöde under viss tid på?

78
Appendix 4: Interview answers Intervjufrågor Person 1 Ålder: 57 Kön: Kvinna 1. Vet du om eller har du någon teknisk pryl eller apparat som du tycker är lätt att använda? Ja. iPhone & dator. • Vad gör den lätt att använda, tror du? Används frekvent 2. Vet du om eller har du någon teknisk pryl eller apparat som du tycker är svår att använda? Ibland, tvättmaskinen. Diskmaskinen på jobbet. • Vad gör den svår att använda, tror du? Tvättmaskin -‐ många olika inställningar. Diskmaskin -‐ massa olika program. Måste hålla in vissa sekunder för att göra vissa inställningar. Kör den bara någon gång ibland. 3. Vad vill du kunna ändra för klimatparametrar i ett rum? Temperatur. Vill inte att den skall blåsa om ej tropiskt klimat. 4. Vilken av klimatparametrarna känns viktigast att kunna ändra? Temperatur. 5. Har du någon gång sett en börvärdesomställare? Ja. Förklaring av BVO: De brukar vara någon form av dosa som sitter på väggen i exempelvis hotellrum, kontorsmiljöer eller skolmiljöer och används för att ställa in olika klimatparametrar, som exempelvis luftflöde och lufttemperatur. 6. Har du någon gång använt en börvärdesomställare?

79
Ja. • Av vilken anledning? Ville ha det varmare. 7. Hur upplever du att det är att använda en BVO? Att det var lite svårt. • Vad tror du gör att det är så? Det var 18 grader, så tryckte jag till 20 grader och sen när jag hade slutat trycka så lyste 18 grader igen och så tänkte jag "nämen, vad konstigt, ställde jag inte in den nyss?". Jag visste inte om jag hade lyckats eller inte. Fanns inget: Ja! Ny har du ställt in 20 grader. Nu jobbar den för fullt för att ge dig det du vill ha. Tryckte till 20, sen när man släppte så bara stod det 18. Och då visste man inte om det skulle bli 20 sen. 8. Vilken funktion använder du oftast? Temperatur. 9. Känns någon funktion överflödig? Ja. Fanns nog någon timer på något ställe. Att det stod timer. Ytterligare ett moment att förstå. Skapade osäkerhet: Har jag ändrat på tiden nu? Eller har jag lyckats höja värmen? Stängs den av inom en viss tid eller ändrat vilken tidpunkt den skulle börja eller sluta? 10. Önskar du andra funktioner? (Borde stå: Har du några önskemål angående funktionerna?) Ja. • Vilka i så fall? Skulle kunna vara en fjärrkontroll som kan styra fler saker i rummet. Skulle kunna styra TV:n, kan använda sig av TV:n som skärm. Visa temperaturen på TV:n: Nu har du ställt in 20 grader. Sen kan man trycka på 1:an, så får man TV:n. Fara med många funktioner dock. 11. Har du några direkta krav på en BVOs funktioner? (Vilka som skall finnas/hur de skall

80
fungera, etc.) Ändra temperatur. Det skall visas tydligt att jag har gjort någonting. Bekräftelse: "Du har tryckt på knappen. Jag jobbar nu." (kanske annan färg på en siffra eller att en lampa börjar lysa, t.ex. rött -‐ så jobbar den, gult -‐ på väg, grönt -‐ klart.) 12. Vill du att den skall visa nuvarande rumstemperatur? När man kommer in i rummet kan den göra det. Problemet för mig var att den hela tiden fortsatte att visa samma rumstemperatur. På ett sätt är det skönt att veta temperatur i rummet, men man behöver ju också se att man faktiskt har sagt till den och att man vet att den kommer att öka en grad om man hade önskat det. 13. Tycker du att det räcker att veta att du reglerar mot varmare eller kallare temperatur, eller vill du veta ungefär vilken temperatur du reglerar mot? Vill kunna se att jag trycker in 20, och att den jobbar mot 20. Vill gärna veta när den är klar. Inte nödvändigt att jag ser hela tiden att den jobbar mot 20. Huvudsaken är att jag ser att den jobbar. • Hur kommer det sig? 14. Störs du av ljus från tekniska apparater när du ska sova? Ja. • Är blinkande eller konstant ljus värst? Blinkande. 15. Tycker du att det är viktigt med återkoppling när temperatur är uppnådd? Kanske kan slockna när den är klar. Kan gå fram och kolla att det är uppnådd temperatur. Kanske tänds upp när man rör vid den. 16. Tycker du att det är viktigt med återkoppling när du reglerat ett värde? Ja. 17. Vill du kunna justera luftflödet på något sätt? Kanske inte så viktigt i Sverige. Om man är i varmare klimat. Hur då?

81
18. Om du tänker dig ditt önske-‐/drömscenario, hur hade du då reglerat klimatparametrar i ett rum? Bara sagt 20 grader. Eller sagt till i receptionen. Inte velat bekymra mig över det. Helst skall det bara vara rätt. Om man skall behöva ändra något så skall det vara så enkelt som det bara går. 19. Vilket tror du är det bästa sättet att visa höjning & sänkning av temperatur? Antingen från rött -‐ varmt till grönt -‐ kallt (via gult för att veta att den är påväg.). Eller + till -‐. Streck längs en termometerskala. Rött till blått hade också fungerat. 20. Vad tror du är det bästa sättet att visa luftflödeshastighet på? Nog pilar. En, två eller flera pilar. Bredvid varandra. (Meterologkarta -‐ pilar för vindar.) 21. Vad tror du är det bästa sättet att visa funktionen temporärt ökat luftflöde tills önskad temperatur är uppnådd på? Mha. färg. En färg som slår över i en annan, när det är klart. 22. Vad tror du är det bästa sättet att visa funktionen temporärt ökat luftflöde under viss tid på? Om det är display -‐ vandrar någonting. Snurrar hjul som i PC. Pilar som går över skärmen. Kan vara enerverande dock.

82
Intervjufrågor Person 2 Ålder: 22 Kön: Kvinna 1. Vet du om eller har du någon teknisk pryl eller apparat som du tycker är lätt att använda? Ja. iPhone. • Vad gör den lätt att använda, tror du?
Apparna visar väldigt bra med bilder vad det är som man kan gå in på. Texten också. 2. Vet du om eller har du någon teknisk pryl eller apparat som du tycker är svår att använda? Ja. Vissa tvättmaskiner/torktumlare. • Vad gör den svår att använda, tror du? För många alternativ. 3. Vad vill du kunna ändra för klimatparametrar i ett rum?
• Temperatur. (Ska vara enkelt. Vill kunna trycka på nånting, så att det inte behöver vara varmt idag, när jag ska till skolan. Så kan jag bara vrida på värmen sen igen.)
• Luftflöde. (Dålig luft typ i klassrum) • Luftfuktighet. (Det är väl inte bra för lägenheten om det blir för mycket fukt. Kan väl bli
mögel då?) Vill nog kunna justera allt, faktiskt. 4. Vilken av klimatparametrarna känns viktigast att kunna ändra? Luftflödet (ren luft känns viktigast). 5. Har du någon gång sett en börvärdesomställare? Ja. Förklaring av BVO: De brukar vara någon form av dosa som sitter på väggen i exempelvis hotellrum, kontorsmiljöer eller skolmiljöer och används för att ställa in olika klimatparametrar, som exempelvis luftflöde och lufttemperatur. 6. Har du någon gång använt en börvärdesomställare?
Ja.

83
• Av vilken anledning? För att byta temperatur. 7. Hur upplever du att det är att använda en BVO?
Den jag använde var lätt. Hade dock inget som visade vilken temperatur det var i rummet. Det stod inte 22, så nu vet jag att jag höjer till 23, utan det var bara såhär: Det är lite svalt här inne, då höjer jag, men jag hade ingen aning om hur varmt det var. Hade velat ha det. Förra gången tog jag till 22 grader, då vet jag det till denna gången också.
• Vad tror du gör att det är så?
Stod ju plus och minus. Bara att vrida, liksom. Det hade nog vem som helst fattat. 8. Vilken funktion använder du oftast? Byta temperatur. 9. Känns någon funktion överflödig?
Nej. Bara saknade det att man vet vad det är för grad från början. Och att den ska se lite roligare ut, tycker jag.
10. Behövs det eller önskar du andra funktioner? Ja. • Vilka i så fall? Saknade nuvarande temperatur. Se lite roligare ut. Saknade vilken temperatur man ställde in mot. 11. Vill du att den skall visa nuvarande rumstemperatur? Ja. 12. Tycker du att det räcker att veta att du reglerar mot varmare eller kallare temperatur, eller vill du veta ungefär vilken temperatur du reglerar mot? Vill veta vilken temperatur jag reglerar mot. • Hur kommer det sig?

84
För att då vet man till nästa gång att det här var en behaglig värme i just den här lokalen. Då skulle man kunna skriva upp det i något bokningssystem. Vi säger att nån bokar en konferens. Så skriver man in det samtidigt i bokningssystemet att bekväm värme är typ 22 grader. T.ex. senast så tyckte gästerna att det var 22 grader. De som möblerar i konferensrummen, de är ju de som justerar värmen och så innan konferensgästerna kommer. Då tror jag att det kan vara bra för dem att veta bekväm temperatur.
13. Störs du av ljus från tekniska apparater när du ska sova? Nej. • Är blinkande eller konstant ljus värst? Tror konstant ljus är mest störande. 14. Har du några direkta krav på en BVO? Kunna ändra temperatur och luftflöde. 15. Har du några önskemål om en BVOs funktioner? Alla från ung ålder till gammal ålder skall förstå den.
Att det inte ska vara krångel och oförståeligt. Att man blir irriterad som man kan bli på vissa tekniska saker. Vill kunna se nuvarande temperatur.
Vill kunna se vilken temperatur man ställer in mot. Se lite roligare ut.
Smälta in med inredningen, tycker jag. Man kunde få designa sin egen. Om man vet att man ska ha beiga tapeter i hallen, då kanske man vill ha en beige sån. Den blir diskret. Om man köper en till sitt hus kunde detta kanske varit kul. Kanske inte fungerar till ett hotell med en massa rum.
16. Tycker du att det är viktigt med återkoppling när temperatur är uppnådd? Ja. Det tycker jag. Som med en ugn. 17. Tycker du att det är viktigt med återkoppling när du reglerat ett värde?
Ja. Det är bra för att man ska förstå apparaten. Viktigt med någon signal om att man gör rätt. En micro. Du har ju inte gjort rätt förrän den startas. Man kan vrida och vända jättemånga gånger, men om man inte har gjort rätt, så startas den ju inte. En micro visar på ett bra sätt att den är igång. Tid börjar startas. Den börjar lysa. Börjar låta och snurra.

85
18. Om du tänker dig ditt önskescenario, hur hade du då reglerat klimatparametrar i ett rum?
En grej som är på väggen. Som en iPhone. Touch grej som symboliserar värme, så kommer det upp så att man kan höja eller sänka, så att man bara kan trycka. Så visar den hur många grader det är från början. Den visar att den går ner till 20, men visar fortfarande ärvärdet också. Om man vill gå tillbaka sen, så kan man gå in på den igen och så visar den om det har lyckats gå ner till 20. (ärvärdet visar om den har lyckats)
Personen ville gärna ha den temperaturen som hon hade ställt in. När hon fick förklarat för sig hur det fungerar med kyl-‐ och värmebörvärde, så var hon mer tolerant mot att temperaturen kan svaja lite. ”Då vill jag inte bli besviken, för jag tänker på miljön.” ”Denhär kan inte göra så, men det fick inte jag reda på.”

86
(Från skolan) Person 3 Ålder: 47 Kön: Kvinna 1. Vet du om eller har du någon teknisk pryl eller apparat som du tycker är lätt att använda? Mobiltelefon (iPhone) • Vad gör den lätt att använda, tror du? Inte så många val. 2. Vet du om eller har du någon teknisk pryl eller apparat som du tycker är svår att använda? TV-‐apparater. • Vad gör den svår att använda, tror du? Inställningar – olika varianter överallt. Manualen varje gång. 3. Vad vill du kunna ändra för klimatparametrar i ett rum? Temperaturen. 4. Vilken av klimatparametrarna känns viktigast att kunna ändra? Temperaturen. Enda gången jag gör det. 5. Har du någon gång sett en börvärdesomställare? Ja. Förklaring av BVO: De brukar vara någon form av dosa som sitter på väggen i exempelvis hotellrum, kontorsmiljöer eller skolmiljöer och används för att ställa in olika klimatparametrar, som exempelvis luftflöde och lufttemperatur. 6. Har du någon gång använt en börvärdesomställare? Ja. • Av vilken anledning? 7. Hur upplever du att det är att använda en BVO? Fungerar bra. Relativt användarvänligt. • Vad tror du gör att det är så?

87
Lågt, högt & skruva. Man behöver inte ta ställning till olika beslut. 8. Vilken funktion använder du oftast? Temperatur. 9. Känns någon funktion överflödig? När det har varit flera rattar. Får testa sig fram på hotellrum. 10. Önskar du andra funktioner? • Vilka i så fall? Lättare att använda, med display. 11. Har du några direkta krav på en BVOs funktioner? (Vilka som skall finnas/hur de skall fungera, etc.) Display. I bilen är det enkelt. Temperatur. 12. Vill du att den skall visa nuvarande rumstemperatur? Ja. Det vore väl önskvärt. 13. Tycker du att det räcker att veta att du reglerar mot varmare eller kallare temperatur, eller vill du veta ungefär vilken temperatur du reglerar mot?
Spelar ingen roll här (var i ett arbetsrum på en arbetsplats). Har högre krav hemma. • Hur kommer det sig? Jobbar bara här. Hemma vill man styra kostnaderna. 14. Störs du av ljus från tekniska apparater när du ska sova? Ja. • Är blinkande eller konstant ljus värst? Blinkande är värst. Det är mer irriterande. 15. Tycker du att det är viktigt med återkoppling när temperatur är uppnådd? Nej. Kan ju gå och titta på BVO:n.

88
16. Tycker du att det är viktigt med återkoppling när du reglerat ett värde? Nej. 17. Vill du kunna justera luftflödet på något sätt? Ja. Hur då? Kanske om man vill ha kyla. 18. Om du tänker dig ditt önske-‐/drömscenario, hur hade du då reglerat klimatparametrar i ett rum? Trådlöst med en display. Kopplad till hela huset. 19. Vilket tror du är det bästa sättet att visa höjning & sänkning av temperatur? Touch-‐skärm. Visa gradertecken. Använd vedertagna symboler. 20. Vad tror du är det bästa sättet att visa luftflödeshastighet på? Någon fläktsymbol. Pilar. Uppåt & nedåt, lodrätt. Visa kubikmeter eller liter. 21. Vad tror du är det bästa sättet att visa funktionen temporärt ökat luftflöde tills önskad temperatur är uppnådd på? Med en färg, kanske. Grön när den har nått dit, röd från början. 22. Vad tror du är det bästa sättet att visa funktionen temporärt ökat luftflöde under viss tid på? Visa antal minuter eller timmar. I kombination med fläktsymbol.

89
(Från skolan) Person 4 Ålder: 37 Kön: Kvinna 1. Vet du om eller har du någon teknisk pryl eller apparat som du tycker är lätt att använda? iPhone • Vad gör den lätt att använda, tror du? Går snabbt. Bara trycka en gång eller två gånger för att komma dit man vill. 2. Vet du om eller har du någon teknisk pryl eller apparat som du tycker är svår att använda? Få IP-‐telefoni att fungera. • Vad gör den svår att använda, tror du? Måste vara senast uppdaterat. Ringa support. 3. Vad vill du kunna ändra för klimatparametrar i ett rum? Temperatur & luftfuktighet. Luftflödet ska vara bra automatiskt. 4. Vilken av klimatparametrarna känns viktigast att kunna ändra? Bra ventilation. 5. Har du någon gång sett en börvärdesomställare? Ja. Förklaring av BVO: De brukar vara någon form av dosa som sitter på väggen i exempelvis hotellrum, kontorsmiljöer eller skolmiljöer och används för att ställa in olika klimatparametrar, som exempelvis luftflöde och lufttemperatur. 6. Har du någon gång använt en börvärdesomställare? Ja. • Av vilken anledning? 7. Hur upplever du att det är att använda en BVO? Fungerar inte sådär jättebra.
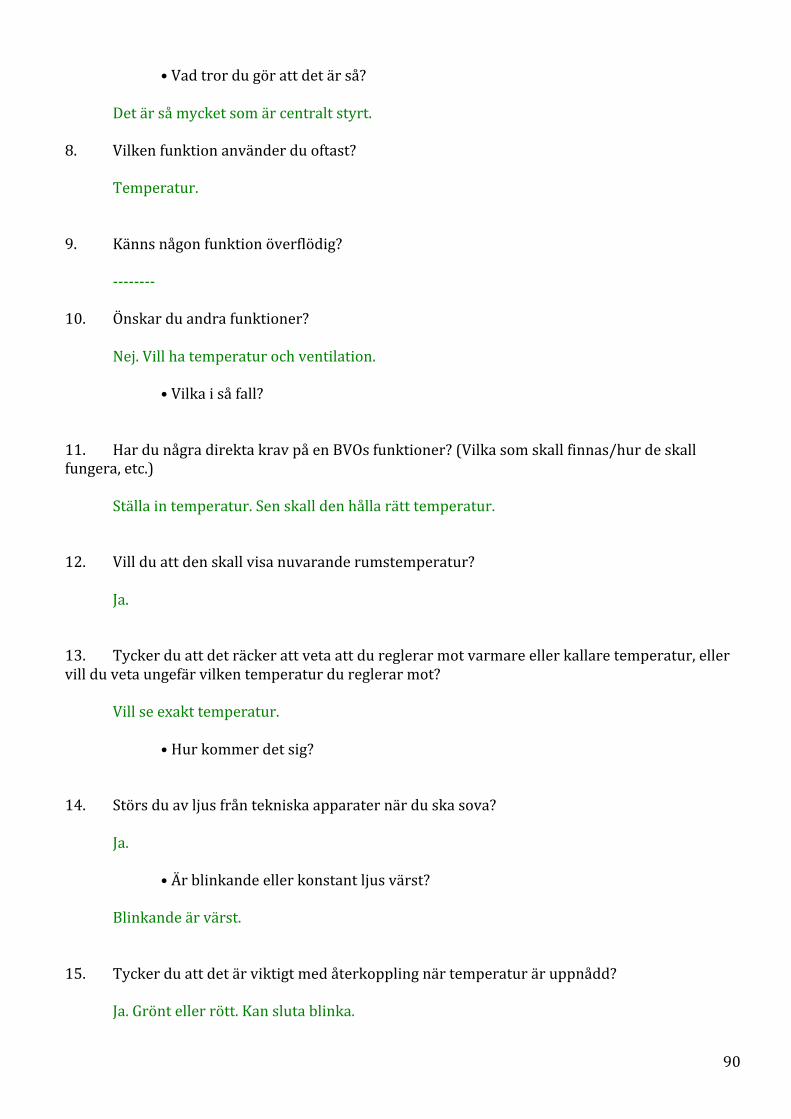
90
• Vad tror du gör att det är så? Det är så mycket som är centralt styrt. 8. Vilken funktion använder du oftast? Temperatur. 9. Känns någon funktion överflödig? -‐-‐-‐-‐-‐-‐-‐-‐ 10. Önskar du andra funktioner? Nej. Vill ha temperatur och ventilation. • Vilka i så fall? 11. Har du några direkta krav på en BVOs funktioner? (Vilka som skall finnas/hur de skall fungera, etc.) Ställa in temperatur. Sen skall den hålla rätt temperatur. 12. Vill du att den skall visa nuvarande rumstemperatur? Ja. 13. Tycker du att det räcker att veta att du reglerar mot varmare eller kallare temperatur, eller vill du veta ungefär vilken temperatur du reglerar mot?
Vill se exakt temperatur. • Hur kommer det sig? 14. Störs du av ljus från tekniska apparater när du ska sova? Ja. • Är blinkande eller konstant ljus värst? Blinkande är värst. 15. Tycker du att det är viktigt med återkoppling när temperatur är uppnådd? Ja. Grönt eller rött. Kan sluta blinka.

91
16. Tycker du att det är viktigt med återkoppling när du reglerat ett värde? Ja. 17. Vill du kunna justera luftflödet på något sätt? Ja. Hur då? Vill gärna kunna rikta luften. Öka på eller minska luftflödet. 18. Om du tänker dig ditt önske-‐/drömscenario, hur hade du då reglerat klimatparametrar i ett rum? Att det inte blåste men att det höll temperaturen. Gjort det av sig självt. 19. Vilket tror du är det bästa sättet att visa höjning & sänkning av temperatur?
Snöflinga för kallt och sol för varmt. Rött är varmt och blått är kallt. Gradantal, kanske. Men det känns inte lika internationellt.
20. Vad tror du är det bästa sättet att visa luftflödeshastighet på?
Fläktsymbol. Större eller mindre fläkt (beroende på mer eller mindre luftflöde. Större för mer, mindre för mindre).
21. Vad tror du är det bästa sättet att visa funktionen temporärt ökat luftflöde tills önskad temperatur är uppnådd på? Visar inte det, kanske. 22. Vad tror du är det bästa sättet att visa funktionen temporärt ökat luftflöde under viss tid på? Fläktsymbol med en klocka bredvid. Svartmarkerat med en kvart på klockan om man ställt in en kvart.

92
(Från skolan) Person 5 Ålder: 49 Kön: Man 1. Vet du om eller har du någon teknisk pryl eller apparat som du tycker är lätt att använda? iPhone • Vad gör den lätt att använda, tror du? Utgår från mig som användare och inte från tekniken. 2. Vet du om eller har du någon teknisk pryl eller apparat som du tycker är svår att använda?
Svårt är väl att kanske ta i, men många andra tekniska prylar utgår ju från den tekniska lösningen. Många gånger är användningen utformad av tekniker. Apple produkter är utformade väldigt mycket från oss som ”dumma användare”. Motpolen mot apple-‐produkter, kan man säga. Kanske inte svåra, men det finns en skillnad där i alla fall.
• Vad gör den svår att använda, tror du? -‐-‐-‐-‐-‐-‐-‐-‐ 3. Vad vill du kunna ändra för klimatparametrar i ett rum?
Framförallt temperaturen. (Luftfuktigheten) Inte jag personligen, men jag vet att en del skulle vilja ändra luftfuktighetsinställningar också. Sommartid kanske man skulle vilja öka upp tempot på fläkten och inte vara styrt utav någon centralfläkt. Speciellt sommartid: Fläktarna går ner i tempo på kvällarna och då blir väldigt varmt här (på arbetsplats).
4. Vilken av klimatparametrarna känns viktigast att kunna ändra? Temperaturen. 5. Har du någon gång sett en börvärdesomställare? Ja. Förklaring av BVO: De brukar vara någon form av dosa som sitter på väggen i exempelvis hotellrum, kontorsmiljöer eller skolmiljöer och används för att ställa in olika klimatparametrar, som exempelvis luftflöde och lufttemperatur.
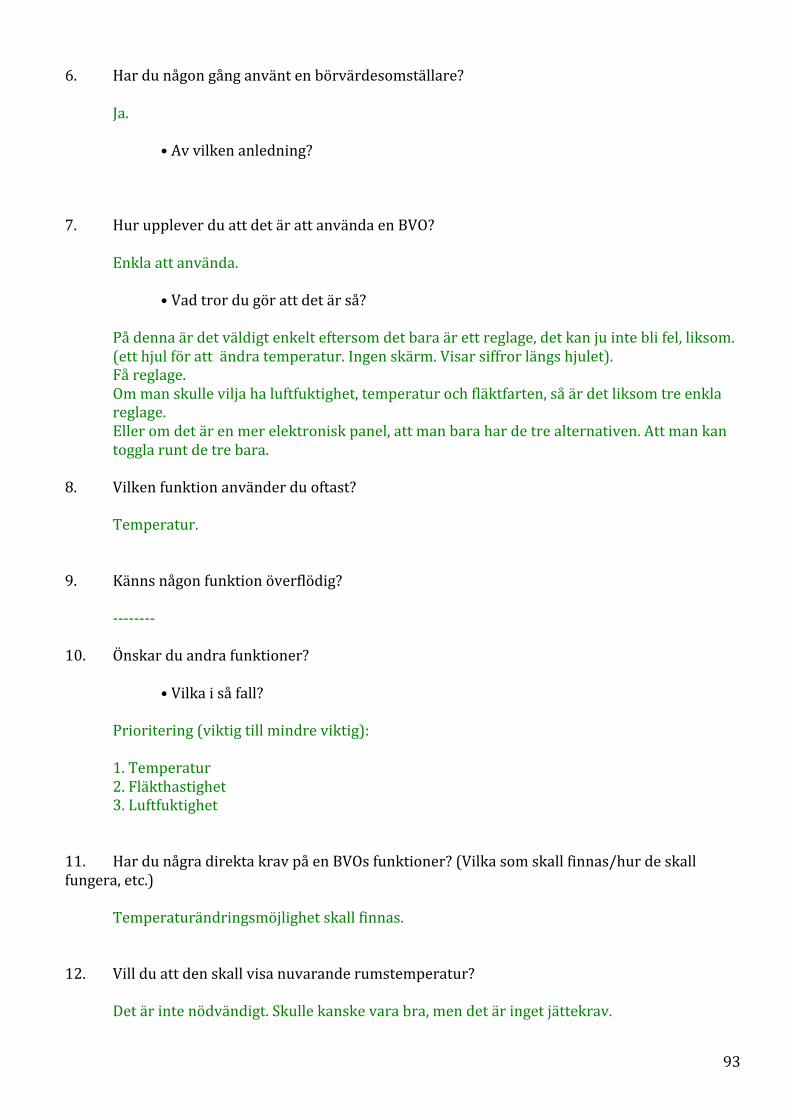
93
6. Har du någon gång använt en börvärdesomställare? Ja. • Av vilken anledning? 7. Hur upplever du att det är att använda en BVO? Enkla att använda. • Vad tror du gör att det är så?
På denna är det väldigt enkelt eftersom det bara är ett reglage, det kan ju inte bli fel, liksom. (ett hjul för att ändra temperatur. Ingen skärm. Visar siffror längs hjulet). Få reglage. Om man skulle vilja ha luftfuktighet, temperatur och fläktfarten, så är det liksom tre enkla reglage. Eller om det är en mer elektronisk panel, att man bara har de tre alternativen. Att man kan toggla runt de tre bara.
8. Vilken funktion använder du oftast? Temperatur. 9. Känns någon funktion överflödig? -‐-‐-‐-‐-‐-‐-‐-‐ 10. Önskar du andra funktioner? • Vilka i så fall? Prioritering (viktig till mindre viktig): 1. Temperatur 2. Fläkthastighet 3. Luftfuktighet 11. Har du några direkta krav på en BVOs funktioner? (Vilka som skall finnas/hur de skall fungera, etc.) Temperaturändringsmöjlighet skall finnas. 12. Vill du att den skall visa nuvarande rumstemperatur? Det är inte nödvändigt. Skulle kanske vara bra, men det är inget jättekrav.

94
13. Tycker du att det räcker att veta att du reglerar mot varmare eller kallare temperatur, eller vill du veta ungefär vilken temperatur du reglerar mot?
Att veta att det blir varmare eller kallare räcker. • Hur kommer det sig? 14. Störs du av ljus från tekniska apparater när du ska sova? Nej. • Är blinkande eller konstant ljus värst? 15. Tycker du att det är viktigt med återkoppling när temperatur är uppnådd? Nej. 16. Tycker du att det är viktigt med återkoppling när du reglerat ett värde? Inte i denna miljön. (På arbetsplatsen) 17. Vill du kunna justera luftflödet på något sätt? Andra prioritet (efter temperaturändring). Hur då? 18. Om du tänker dig ditt önske-‐/drömscenario, hur hade du då reglerat klimatparametrar i ett rum?
Hemma kanske man kunde ha en smart app. Kan styras bortifrån, så man kommer hem till ett varmt hus. Främst hemma.
19. Vilket tror du är det bästa sättet att visa höjning & sänkning av temperatur?
Dendär är ju enkel (den som satt på väggen i arbetsrummet). Så enkelt som möjligt. Snöflinga och termometer-‐symbol. (Hjul med siffror runt fanns också på den han hade.)
20. Vad tror du är det bästa sättet att visa luftflödeshastighet på?
Fläktsymbol. Den är väl vedertagen. Fler fläktblad, så att det ser ut som att den går snabbare (när man ökar på hastigheten). (Kanske fläktblad med några extra, dimmade (faded) fläktblad in emellan.)

95
21. Vad tror du är det bästa sättet att visa funktionen temporärt ökat luftflöde tills önskad temperatur är uppnådd på? 22. Vad tror du är det bästa sättet att visa funktionen temporärt ökat luftflöde under viss tid på? Kanske skulle vara med en motsvarande grej (svaret på fråga 20) och en klocka.

96
Person 6 Ålder: 23 Kön: Man 1. Vet du om eller har du någon teknisk pryl eller apparat som du tycker är lätt att använda? Ja. iPad. • Vad gör den lätt att använda, tror du?
Den har bara två knappar. Eller ja. Den har ju en touch också. Den är användarvänlig för att när jag skaffade den så ha den bara dehär standardgrejerna som man behöver och vill jag ha något mer så går det att hämta hem. Kan modifiera den.
2. Vet du om eller har du någon teknisk pryl eller apparat som du tycker är svår att använda? Ja. En telefon. En samsung experia. • Vad gör den svår att använda, tror du?
Den är fruktansvärt långsam. Menyerna makes no sense. Det är väl en vanesak i och för sig. Den känns inte så sjysst, bara.
3. Vad vill du kunna ändra för klimatparametrar i ett rum?
Temperaturen. Ju mer val man har, desto bättre är det ju. Det räckte ju bara med ventilation, så går det ju faktiskt att klä sig efter temperatur. Så temperatur spelar ju faktiskt ingen roll. Det är ju luftflöde då som är lite mer viktigt att ha, så att man får frisk luft. (Pratade om en semester på Bali, där det är väldigt, väldigt varmt hela tiden.)
Luftflödet är typ ett måste, men resten är lyxvara. 4. Vilken av klimatparametrarna känns viktigast att kunna ändra? Luftflöde. 5. Har du någon gång sett en börvärdesomställare? Ja. Förklaring av BVO: De brukar vara någon form av dosa som sitter på väggen i exempelvis hotellrum, kontorsmiljöer eller skolmiljöer och används för att ställa in olika klimatparametrar, som exempelvis luftflöde och lufttemperatur. 6. Har du någon gång använt en börvärdesomställare?
Använt en AC.

97
• Av vilken anledning?
För att ändra förhållandena i rummet. Om jag satt i t-‐shirt och det var lite kallt, så drog jag kanske på värmen, eller var det tvärtom så drog jag på kylan.
7. Hur upplever du att det är att använda en BVO?
Om den funkar så fungerar det bra. Men ibland så står det på kinesiska på knapparna, så då vet man inte vad man ska trycka på.
• Vad tror du gör att det är så?
Annars så är det ju ganska logiskt. + temperatur, då blir det ju varmare, minus blir kallare, så det brukar funka rätt så bra.
Det finns en funktion fördelar luften. De AC-‐grejerna jag har använt med fjärrkontroll ser ut som en telefon typ. Den har ju hundra knappar. En massa funktioner, vilket kan göra det väldigt krångligt.
8. Vilken funktion använder du oftast? Det måste väl vara temperatur + och -‐. (Extrasnack) Det är väldigt bra att ha en funktion för att styra luftflödet, för att, skulle fläkten skulle sitta i taket, mitt i ett rum, säg att sängen står lite vid sidan av, om du ligger i sängen då kanske du känner att det kommer en fläkt då och då. Helst skulle man ju kunna rikta den och stanna den på vilka lägen man vill. Det är ju det bästa (11:41). Göra ett eget mönster (för luftspridning). Skulle kunna ställa in den så att den rör sig långsammare också. Ju fler val desto bättre, men sen beror det ju på också. Min mormor kanske inte vill ha 100 olika val. Jag kanske vill ha det, men min mormor kanske vill kunna trycka på en knapp, on, och så funkar det bara. Man kanske kan få ett val i början, om man vill vara advanced user eller basic user. 9. Känns någon funktion överflödig?
Nej. Ju fler val och funktioner som finns desto bättre, tycker jag. 10. Behövs det eller önskar du andra funktioner? Ja. • Vilka i så fall? Kunna stoppa luftriktningen i vissa lägen.
Kanske kunde koppla upp den till sin smartphone och kunna ändra temperaturen via den. Säg att man kanske har bakelser, du har satt en deg i köket och den skall stå och jäsa i 5 timmar, och så går du till jobbet i 8 timmar, och de fem timmarna kanske du vill ha en hög temperatur i rummet, och efter det så kanske du inte vill ha lika hög temperatur längre, och

98
då kanske det är bra att kunna ändra det när du inte är hemma. Kanske väldigt överflödigt. Tänk typ att en sån kanske sitter i ett bageri eller nånting. Om den sitter i ett hotellrum, eller i konferensrum eller kontorsmiljö eller nåt sånt: då ska den vara tyst.
11. Vill du att den skall visa nuvarande rumstemperatur? Ja. 12. Tycker du att det räcker att veta att du reglerar mot varmare eller kallare temperatur, eller vill du veta ungefär vilken temperatur du reglerar mot?
Jag vill ha exakta gradtal. Helst med decimaler. Vissa är ju pedanta av sig. Control freaks får man ju ta hänsyn till. Men det räcker ju att ha vilken temperatur det är, utan decimaler.
Sen tänker jag också att du får valet att du är advanced eller basic, sen vill jag kunna ställa in saker som om den skall vara ljudlös, eller om den skall pipa varje gång du trycker på en knapp. För det kan vara irriterande, för jag gillar inte när saker piper när man trycker på dem. Men du tycker inte att det ger återkoppling på att det händer någonting nu, liksom? Fast om det syns på displayen att det händer någonting, då händer det ju. Pipet blir bara en störande faktor. Tänk till exempel en konferenssal, så sitter det någon och ska ändra temperaturen, då blir ju det en störningsfaktor. Men alternativet (med pip) skall finnas, för det finns ju blinda människor. Det var någonting använde som det verkligen inte gick att ta bort pipetljudet på, och jag blev så irriterad, för att jag ville verkligen göra det. • Hur kommer det sig? 13. Störs du av ljus från tekniska apparater när du ska sova?
Oerhört. Jag har hellre ingen AC än AC med ljus på. Det är skitstörande. Jag kan inte sova när det är ljus i rummet.
• Är blinkande eller konstant ljus värst? Blinkande är värst.
Om det skall vara något ljus så skall det vara något som verkligen inte syns om du inte kollar på det eller letar efter det.
14. Har du några direkta krav på en BVO? On & off-‐knapp. Inte stand by. Bryta all ström. Varför vill man ha det då?
För att man vill spara ström. Kunna stänga av den och veta att den inte drar någonting.

99
Om du är på ett hotell då, och inte bryr dig om hur mycket ström de förbrukar, finns det någon anledning att ha en off-‐knapp då?
Ja, för tänk om värmeelementet i maskinen går sönder, så blåser den bara kalluft hela tiden och så skall någon ligga där inne och sova, och så finns det ingen off-‐knapp. Vill kunna stänga av hela systemet om så önskas. Det är ett krav. Man måste kunna stänga av den.
15. Har du några önskemål om en BVOs funktioner? Röststyrd om det är till en blind person.
16. Tycker du att det är viktigt med återkoppling när temperatur är uppnådd?
Inga pipljud. Absolut inte. Inga lampor heller. Den skall inte finnas. Du skall välja temperatur och så skall du lita på att det funkar, helt enkelt.
17. Tycker du att det är viktigt med återkoppling när du reglerat ett värde?
Till viss del. Då får det ju vara en liten display där du ser att det händer någonting när du trycker. Men ta bort alla pipljud och alla blinkningar och sådana grejer.
18. Om du tänker dig ditt önskescenario, hur hade du då reglerat klimatparametrar i ett rum?
Den skall vara röststyrd. Det hade varit bra om den hade haft inbyggd brandvarnare. Den skall kunna upptäcka giftiga gaser i rummet. Om den sitter i en verkstad och det blir en gasläcka. Då kan den hålla på med pipljud och grejer. Bara i nödsituationer, så att man verkligen uppmärksammas. Eller om dammhalten i luften är så hög att det finns flammrisk. Eller om det är för mycket styren i luften, plastgaser. Helst skall den kunna vara lätt att återvinna. Eller gjord på återvunnet material. Produceras nära. Och så ska den inte dra mycket energi.

100
Appendix 5: Interview compilation
Interview compilation 1. 5 out of 6 people answered iPhone, one answered iPad when they were asked to name a technical product that they thought was easy to use. When asked why, the answers were: • Because it is used frequently. • The apps are self descriptive, using pictures and text. • There are not so many choices. • It goes fast to get where you want to go inside the phone. You only need to click once or twice to get where you want to go. • It has its focus on me as a user and not on the technology. • Only had the standard stuff when I got it, and if I want something more I can download it. 2. When asked werther they had or knew of any technical product that was difficult to use, the answers were: • Washing machines When asked why: -‐ Many different settings available. -‐ Too many options. • Dryers • Dishwashers -‐ Lots of different programs. -‐ Hold down button a certain amount of time to make certain settings. -‐ Not used frequently. (Dishwasher at work) • TVs -‐ Settings are hard to understand. Different on different TVs. Need manual every time. • Voice over IP -‐ Need latest update. Need to call support. • Samsung Experia. -‐ Really slow -‐ Just does not feel right 3. When asked which climate parameters the interviewed wished to be able to control in a room, the answers were: • Temperature (Most frequent answer. 6 out of 6) • Air flow (Second most frequent answer. 4 out of 6. One of which only requested it if it was in a tropical climate.) • Humidity (Least frequent answer. 3 out of 6.)

101
-‐ The more choices you have, the better. Only ventilation is enough, then you can dress after the temperature. 4. When asked what climate parameter felt the most important to be able to adjust, the answers were: • Temperature (3 out of 6.) • Air flow (3 out of 6.) 7. When asked how their experience using user interfaces for HVAC systems was, the answers were: • It was a little difficult. When asked why the person thought it was that way, the answer was: I did not know if i had succeeded in changing the temperature or not. There was no indication that said that the system had started working after i set it. Changed to a temperature, and then it started showing the current room temperature again. • It was easy. Although the feeling was that it had been easy, the interviewed person commented that a want for current room temperature to be shown existed. The want was based on that the person wanted to be able to learn what temperature that was nice in that room, so that the same temperature could be set the next time. • Works well. Relatively user-‐friendly. When asked why the person thought it was that way, the answer was: You do not need to take a stand on different decisions. • Not very well. When asked why the person thought it was that way, the answer was: So much is centrally controlled. • Easy to use. When asked why the person thought it was that way, the answer was: On this device it is very simple, since there is only one thing to set. (One wheel, no screen, numbers shown along the wheel.) If you would want more options, you could toggle between the three. • If it works, it works well. -‐ sometimes it has chinese signs on the buttons and then you don't know where to push. When asked why the person thought it was that way, the answer was: Otherwise it is pretty logical. Plus temperature makes it warmer, minus makes it colder. Lots of functions can make it difficult.

102
8. When asked which function that they used most often, six out of six answered that it was changing the temperature. 9. When asked if any of the functions that they have encountered felt redundant, the answers were: • Yes. -‐ There was a timer function somewhere. Another thing to understand. This created uncertainty. -‐ When there has been several wheels. Trial and error on hotel rooms. • No. -‐ The more functions available, the better. 10. Do you wish for other functions? • Yes. -‐ Could be a remote control, controling more things in the room. Could control TV and use TV as screen. -‐ More easy to use. With a display. -‐ Priority (of one of the interviewed) 1. Temperature 2. Air flow-‐speed 3. Humidity • No. -‐ Want temperature and ventilation-‐settings. (Are more functions needed or do you wish for other functions?) • Yes. -‐ Current temperature was missing. -‐ Could look more fun. -‐ The temperature that it was regulating towards was missing. -‐ Be able to stop airflow-‐angle in certain positions. -‐ Maybe connect it to smartphone and change temperature through it. 11. Do you have any direct requirements on a user interface for HVAC systems? • Set temperature. (5 out of 6) • Show clearly that I have done something. Feedback. • Keep set temperature. • Display. (1 out of 6)

103
• Air flow (1 out of 6) • On & off-‐button. Not stand by. Cut all power. (1 out of 6) 12. Do you want it to show current room temperature? • Yes. [5 out of 6] One added: If it does not stop showing the temperature I've set after I've set it. • Could be good, but it is not required. [1 out of 5] 13. Do you think it is enough to know that you are setting a warmer or colder temperature, or du you want to know which temperature you are regulating towards? • Would like to know which temperature I'm regulating towards. [4 out of 6] • Does not matter at workplace. Higher demands at home. [1 out of 6] • Warmer or colder is enough. [1 out of 6] Extra comments: • Would also like to know when it is done. Mainly I want to see that it is working. • Would like to know which temperature I'm regulating towards, because then you know what is a comfortable temperature a certain room. 14. Are you bothered by light from technical products when going to sleep? • Yes [4 out of 6] Which is worse, blinking or constant light? • Blinking light is worse. [4 out of 4] -‐ if there should be light, it should be something that really isn't visible if you aren't looking for it. 15. Do you think it is important with feedback when set temperature is reached? • Yes. [2 out of 6] •No. [2 out of 6] Comments: -‐ Could be as on a stove. -‐ Maybe it can turn off its lights when it's done. Can go to it and check that temperature is reached. -‐ Can go check on the user interface. -‐ Green or red (green -‐ temperature reached, red -‐ working) -‐ Could stop blinking. -‐ No beeping noises. No lights either. Choose temperature and trust that it works.

104
16. Do you think it's important with feedback when you have changed a value? • Yes (4 out of 6) Comments: -‐ Important with some signal showing that you have done right. -‐ One commented: A little display where you see that somethings happening when you push. But remove all beeping noises and all blinks and stuff like that. • No Comment: -‐ Not in this environment (on workplace) 17. Do you want to be able to adjust air flow in some way? • Not so important in Sweden. If you are in warmer climates, yes. • Yes. • Second priority, after temperature. How? • Maybe if you want it cooler. • Set angle of air flow. • Increase or decrease air flow. 18. What is your dream-‐scenario of handling climate parameters in a room? • Voice controlled. Say 20 degrees and it changes it. Wouldn't want to worry about it. It should just be right. • A thing on the wall. Like an iPhone. Touch-‐thing symbolizing heat. Showing temperature regulated towards, and also shows current room temperature. • Wireless, with a display. Connected to all the house. • No wind, but still good temperature. Done automatically. • At home, maybe a smart app. Could be controlled while away, so that you can come home to a warm house. • Voice controlled. Built in fire-‐alarm. Detect poisonous gases in the room. 19. What do you think is the best way of showing regulation of temperature? (4 out of 6 got this question) • Either from red (warm) to green (cold), through yellow, to know that it is working. Or + and -‐. Lines along a thermometer-‐scale. • Touch-‐screen. Show degree-‐symbol. Use established symbols. • Snowflake-‐symbol for cold and sun-‐symbol for warm.

105
Red for warm and blue for cold. Degree-‐symbol, maybe. Does not feel as international, though. • Snowflake-‐symbol for cold and thermometer-‐symbol for warm. 20. What do you think is the best way of showing air flow speed? • Probably arrows. One, two or more arrows next to each other for more speed. (Weather-‐charts -‐ arrows showing winds.) • Fan-‐symbol. Arrows up and down. Show cubic meters or litres. • Fan-‐symbol. Smaller or bigger fan, depending on more or less air-‐flow. • Fan-‐symbol. More fan-‐blades, so that it looks like it spins faster, when increasing air flow. 21. What do you think is the best way of showing the function: temporarily increased air flow until set temperature is reached? • With color. A color changing into another when it's done. • With color. Green when it has reached it, red from the start. 22. What do you think is the best way of showing the function: temporarily increased air flow during a certain amount of time? • If it is a display: Wheel turning, like in a computer. Arrows moving over the screen. Could be irritating, though. • Show number of minutes or hours in combination with a fan-‐symbol. • Fan-‐symbol with a watch next to it. Quarter of an hour marked with black if you've set 15 minutes. • Fan-‐symol (with more blades when running faster) in combination with a watch.

106
Appendix 6: Interview regarding installation of user interfaces
Intervju med Anders Jakobsson (Swegon service) angående installatörers synpunkter och önskemål kring börvärdesomställare. 1. Vad är dina (installatörens) önskemål om börvärdesomställare, rent funktionsmässigt? Fördel är ju att det är förstansade hål. Hål i botten så att man kommer in med kabeln i botten. Utan att behöva hålla på med distanser. Både mot infälld dosa och med kabel. 2. Frågade om han ställer in värme och kylbörvärde på själva börvärdesomställarna och tog börvärdesomställaren till adapt parasol som exempel, som man kan ställa in värme och kylbörvärde på genom att trycka på speciella sätt på knapparna. Aldrig ställt in börvärden och sådant via den. Kört via handdatorn. Mot en websida i SuperWISEn. När det gäller just den enheten så har han inte installerat någon anläggning utan SuperWISEn. Då jobbar han från datorn. "Men hade vi inte haft någon SuperWise då, så då hade man ju fått jobba med tryckknappen där då." 3. Vad är viktigast att kunna ställa in på en börvärdesomställare vid installation? Till börvärdesomställare: Värme & kylbörvärde. Det är väl det man ställer in. När det skall börja värma och när det skall börja kyla. Conductoranläggningar: Till våra conductoranläggningar -‐ Alla inställningar. Temperatur, närvaro, alla parametrar. Det är ju en helt annan dosa då. Om man har skärm: Istället för att ha, som till WISE, en extern temp.givare, extern CO2-‐givare. Man får ju sätta upp två sånahär givare bredvid varandra och grejer. Hade man haft en givare med en display i och där i kunde man haft flera funktioner. Både temp. och börvärde och CO2, det ser ju lite proffsigare ut. Då kan man ju från den displayen då göra både temp.inställningar och ppm-‐inställningar. (ppm -‐ CO2, luftkvalitet). 4. Hur är det att ställa in i mjukvaran för installatören, brukar det vara krångligt? Jobbar alltid på vår handdator. Enda handdosan som man jobbar med egentligen är ju den vi har till conductorn då. Den jobbar man ifrån. Har man inte tagit i den förut så kan den ju säkert upplevas som lite krånglig. Hur tror du att den skulle kunna göras bättre då, så att den inte upplevs som så krånglig? Det är väl med en display på och så ha börvärdena där på. Bara klicka på börvärdet så får man upp inställning och plussa/minska.

107
Touch. 5. Känner du att det vore bra om man kunde göra inställningarna direkt i börvärdesomställaren om det fungerade bra där eller finns det fördelar med att man kan göra det över internet? Fördelarna är ju om man driftsätter och man har flera anläggningar i flera rum, då gör du ju inställningarna från datorn, så slipper man gå runt i en massa rum. Men man måste ju även tänka på att det inte alltid är vi som driftsätter och det är inte vi som skall sköta det sen utan det är oftast en fastighetsskötare eller något och de kanske inte har handdatorn med sig jämt. 7. Vilken av Swegons nuvarande börvärdesomställare fungerar bäst vid installation? Den vi har till conductor. Den kan man ju även köra trådlöst. 8. Vilken av Swegons nuvarande börvärdesomställare fungerar sämst vid installation? Svårt att säga. De andra är ju enkla i sitt utförande. Så att de fyller ju sin funktion genom att vara enkla. Känns det bättre att ha inställningarna direkt i börvärdesomställarna, säg att de skulle vara kopplade till internet och att man skulle kunna ställa in alla från en sådan? Om du inte behöver ha med dig någon handdator utan att om du använder dig av en sådan där och ställer in resten av börvärdesomställarna med den också. Det är så vi kan göra med den vi har till conductorn. Okej. Tycker du det är smidigare än att använda hemsidan eller tycker du att hemsidan är bättre? Hemsidan är ju smidigare, men har man ingen åtgång till hemsidan eller inte har någon SuperWISE, då är ju den handdosan (conductorn) helt okej. 9. Vad brukar du göra när du använder en sådan conductor, vad börjar man med och hur ser arbetsgången ut? Det är helt olika. Är grejerna konfigurerade från fabrik då. Då är det mest gå in bara och ställa in börvärdet enligt kundens önskemål då. Om det är defaultläge, då får man ju gå in och ställa både applikationer och parametrar och modbus ID, m.m. Okej. Så det är flera steg då, om den är default-‐inställd. Ja. Det är lite fler inställningar. Vilka steg är det man går igenom om den är default-‐inställd? Arbetsgång om den är defaultinställd: 1. Ställa in modbus ID. Efter det så kan man ju då komma åt den. Går man ett varv och ställer in alla dem så kommer man

108
ju åt dem med en handdator sen. 2. Ställa in vad det är för produkt. Om det är en tilluftsprodukt eller frånluftsprodukt, vattenbaserad eller luftbaserad. Okej. Man berättar för rumsenheten vad den skall reglera för typ av produkt då? Ja. 3. Ställa in alla börvärden. -‐ Temperaturer -‐ Luftflöde -‐ Luftkvalitet (Mäts i ppm. Är det förorenad luft så stiger ppm:en och då får man forcera in så att det blir rätt luft.) -‐ Luftfuktighet Alla produkter har fabriksinställda börvärden så i princip så behöver du inte röra de börvärdena, men alla beställare har ju ofta sina egna önskemål. Då får man ju gå in och göra de ändringarna då, men har du fått ställt in vad den har för funktion och sådant då, då behöver man ju inte egentligen ändra ett börvärde. Okej. Om det inte finns andra önskemål? Ja. 10. Förslag presenterat för Anders: Det kanske kunde finnas någon form av knapp med bara börvärdesändringar som kan användas när kunden har andra önskemål. Man trycker på den knappen och så stegar den sig igenom alla börvärden som man kan tänkas vilja ställa in, så kan man bara trycka på vidare om det är något som man vill lämna och trycka på ställ in om det är något som den kommer till som man vill ställa in. Alltså en knapp som kan guida en igenom det, så att man inte behöver stega sig in i en massa undermenyer och hålla på och gå tillbaka och sådant. Det låter jättevettigt.
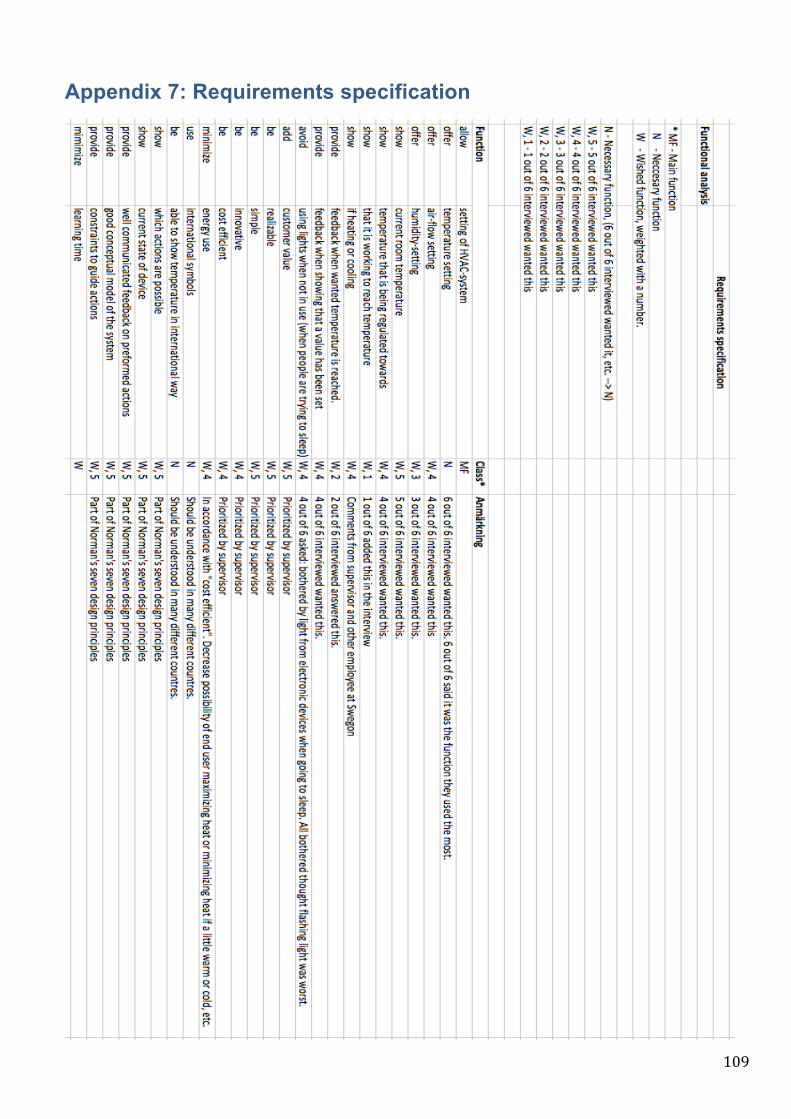
109
Appendix 7: Requirements specification

110
Appendix 8: Pictures of the 10 concepts

111

112

113

114

115

116

117

118

119