design optimization of army radar frame (arf) for …
TRANSCRIPT
667
Int. J. Mech. Eng. & Rob. Res. 2014 Bikesh Kumar and Damodar Reddy, 2014
DESIGN OPTIMIZATION OF ARMY RADAR FRAME(ARF) FOR THERMAL AND STRUCTURAL
CONDITIONSBikesh Kumar1* and Damodar Reddy1
*Corresponding Author: Bikesh Kumar,[email protected]
Sensitive electronic equipment operating in harsh environment depend upon the vibrationprotection of the equipment. General methodology that is followed is to optimize the design forvibration for random loads by using damping and stiffness of mounts and is mostly stressed onoptimizing the dynamic response of internal components. But the vibration protection of theequipment depends and on the dynamic response of the external structure which is very oftenneglected.In this project total emphasis is laid on to make a optimal design and improve thedesign stiffness of the external structure. In the present paper an Army Radar frame has beendesigned and optimized for vibration control and temperatures using Ansys. Army Radar Frame(ARF) is a structural frame used to mount the communication antennas and the supportingelectronic equipment for the system.
Keywords: Army RADAR frame, Vibration control, ANSYS, FEA, PSD
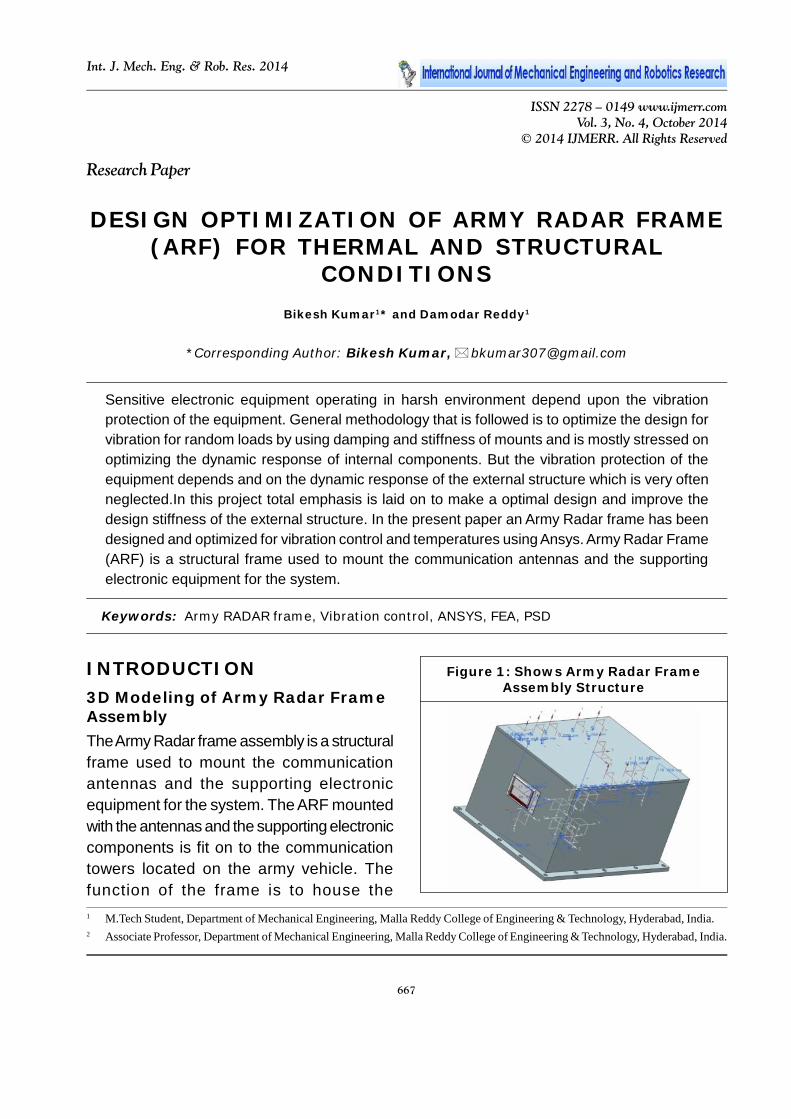
INTRODUCTION3D Modeling of Army Radar FrameAssemblyThe Army Radar frame assembly is a structuralframe used to mount the communicationantennas and the supporting electronicequipment for the system. The ARF mountedwith the antennas and the supporting electroniccomponents is fit on to the communicationtowers located on the army vehicle. Thefunction of the frame is to house the
ISSN 2278 – 0149 www.ijmerr.comVol. 3, No. 4, October 2014
© 2014 IJMERR. All Rights Reserved
Int. J. Mech. Eng. & Rob. Res. 2014
1 M.Tech Student, Department of Mechanical Engineering, Malla Reddy College of Engineering & Technology, Hyderabad, India.2 Associate Professor, Department of Mechanical Engineering, Malla Reddy College of Engineering & Technology, Hyderabad, India.
Research Paper
Figure 1: Shows Army Radar FrameAssembly Structure

668
Int. J. Mech. Eng. & Rob. Res. 2014 Bikesh Kumar and Damodar Reddy, 2014
communication antennas and the supportingelectronic equipment. The 3D model of theRadar Frame assembly is created usingUNIGRAPHICS NX software from the 2ddrawings.
FINITE ELEMENT ANALYSISOF ARMY RADAR FRAMEASSEMBLYFinite Element Modeling3D model of the Army Radar frame assemblywas developed in UNIGRAPHICS from the 2ddrawings. The model was then converted intoa parasolid to import into ANSYS. A FiniteElement model was developed with shell andmass elements. The elements that are used foridealizing the ARF Assembly were describedbelow. A detailed Finite Element model was builtwith shell and mass elements to idealize all thecomponents of the Army radar frame assembly.Modal analysis was carried in the frequencyrange of 0-300 Hz to capture the naturalfrequencies and their mass participations. AResponse Spectrum Analysis (RSA) wassimulated in the same range to evaluatecombined response of the system under givenslope in X, Y and Z direction. A PSD analysiswas performed on the Army Radar frame in therange of 0 -1000 Hz in X, Y and Z directions tosimulate its behavior due to random excitations.
MATERIAL PROPERTIESAll the components of the Army Radar FrameAssembly are made using Aluminium HE 30
material. All the components of the Army RadarFrame Assembly are assigned as per thebelow material properties. The total weight ofthe base line model of the Army Radar FrameAssembly for Finite Element simulation is 32Kgs.
METHODOLOGYA detailed Finite Element model was built withshell and mass elements to idealize all thecomponents of the Army Radar Frameassembly. Modal analysis was carried tocapture the natural frequencies and their massparticipations.
A Response Spectrum Analysis (RSA) wassimulated to evaluate response of the systemunder given conditions along horizontal X, Yand vertical Z direction and the square root ofthe sum of the squares (SRSS) method wasused to combine the total response in each
Figure 2: Shows the Finite Element Modelof the Army Radar Frame (ARF) Assembly
Material Properties
Material Young’s Modulus (N/mm2) Poisson’s Ratio Density (kg/mm3) Yield Stress (N/mm2)
Aluminium (HE 30) 7.0E+04 0.3 2700 160
Table 1: Material Properties

669
Int. J. Mech. Eng. & Rob. Res. 2014 Bikesh Kumar and Damodar Reddy, 2014
direction. The stresses in the structuralmembers were calculated and comparedagainst the allowable stresses of the material.A PSD analysis was performed on the ArmyRadar frame Assembly in the range of 0-1000Hz in X, Y and Z directions to simulate itsbehavior due to random excitations.
Finite element analysis was carried in thefollowing steps:
• Create 3D model of the base line model ofthe ARF using UNIGRAPHICS NX and saveas parasolid.
• Import parasolid into Ansys to perform thestructural analysis.
• Perform Modal analysis to find naturalfrequencies on the base line model of theARF.
• Optimize the baseline model (iterativemethod) to shift the natural frequenciesabove the operating frequency of ARF bychanging design stiffness and by restrictingthe weight below 35 kgs.
• Perform Power Spectral Density analysis(PSD) on the optimized model to find theeffect of all the frequencies present belowthe operating frequency range of ARF in X,Y and Z direction.
• Perform thermal analysis on the baselinemodel to find the temperature distribution.
• Perform thermal analysis on the optimizedmodel to find the temperature distribution.
MODAL ANALYSIS OF THEBASE LINE MODELModal analysis is used to determine thevibration characteristics (natural frequenciesand mode shapes) of a structure or a machinecomponent while it is being designed. It canalso serve as a starting point for another, moredetailed, dynamic analysis, such as a transientdynamic analysis, a harmonic responseanalysis, or a seismic analysis.
Mode Shapes: 11 Natural frequenciesobserved in the frequency range of 0-300 Hzout of 11 frequencies 2 natural frequencies at
1 126.655 9.11E-03 2.01E-02 –2.54E-03 8.29E-05 4.03E-04 6.45E-06
2 138.756 1.69E-03 4.90E-02 2.58E-03 2.87E-06 2.40E-03 6.65E-06
3 144.342 8.42E-02 –8.98E-03 –2.27E-03 7.08E-03 8.06E-05 5.16E-06
4 153.107 4.04E-02 1.88E-02 –2.47E-04 1.63E-03 3.54E-04 6.11E-08
5 175.97 4.23E-03 4.79E-02 2.09E-02 1.79E-05 2.30E-03 4.36E-04
6 186.385 –1.94E-03 5.65E-02 –3.47E-02 3.76E-06 3.20E-03 1.21E-03
7 200.286 5.22E-03 –4.45E-04 –3.05E-02 2.72E-05 1.98E-07 9.33E-04
8 205.864 1.58E-03 –2.18E-03 0.13287 2.49E-06 4.75E-06 1.77E-02
9 230.055 –1.30E-02 1.47E-03 –1.43E-03 1.68E-04 2.16E-06 2.05E-06
10 239.016 –3.75E-04 1.24E-02 2.74E-03 1.41E-07 1.54E-04 7.51E-06
11 243.33 1.16E-03 3.02E-02 4.54E-03 1.36E-06 9.10E-04 2.06E-05
Table 2: Frequencies and Mass Participation
Participation Factor Effective Mass (Tonnes)
X-dir Y-dir Z-dir X-dir Y-dir Z-dirFrequencyMode

670
Int. J. Mech. Eng. & Rob. Res. 2014 Bikesh Kumar and Damodar Reddy, 2014
144 Hz and 205 Hz are observed to be criticalfrequencies. They are critical because thefrequency at 144 Hz is having a massparticipation of 7Kgs in X-direction which is22% of the total weight and the frequency at205 Hz is having 17.6 kgs in Z-direction whichis 55% of the total weight of the assembly. Themode shapes of critical frequencies are plottedbelow.
frequencies above the operating range of 0-300 Hz to protect the (ARF) Army RadarFrame assembly structure from vibrations.
THERMAL ANALYSIS OF THEBASE LINE MODELThermal analysis is performed on the Baseline model of Army Radar Frame (ARF)assembly structure to find the temperaturedistribution due to the power dissipation ofelectronic components. Thermal analysis isdone for the ambient temperature of 55 °C withand without radiation effect. Solid 70 Elementis used to capture the thermal conductivity fromthe homodynes to the bottom plate.
Figure 3: Shows the 3rd Mode Shape@144 Hz
Figure 4: Shows the 8th Mode Shape@205 Hz
From the above modal analysis it isobserved that there exists 2 critical naturalfrequencies in the operation frequency rangeof 0-300 Hz.It is necessary to shift these natural
Figure 5: Shows the Thermal BoundaryConditions Applied for Thermal Analysis
Figure 6: Shows the TemperatureDistribution on the ARF Assembly
Results Without Radiation
671
Int. J. Mech. Eng. & Rob. Res. 2014 Bikesh Kumar and Damodar Reddy, 2014
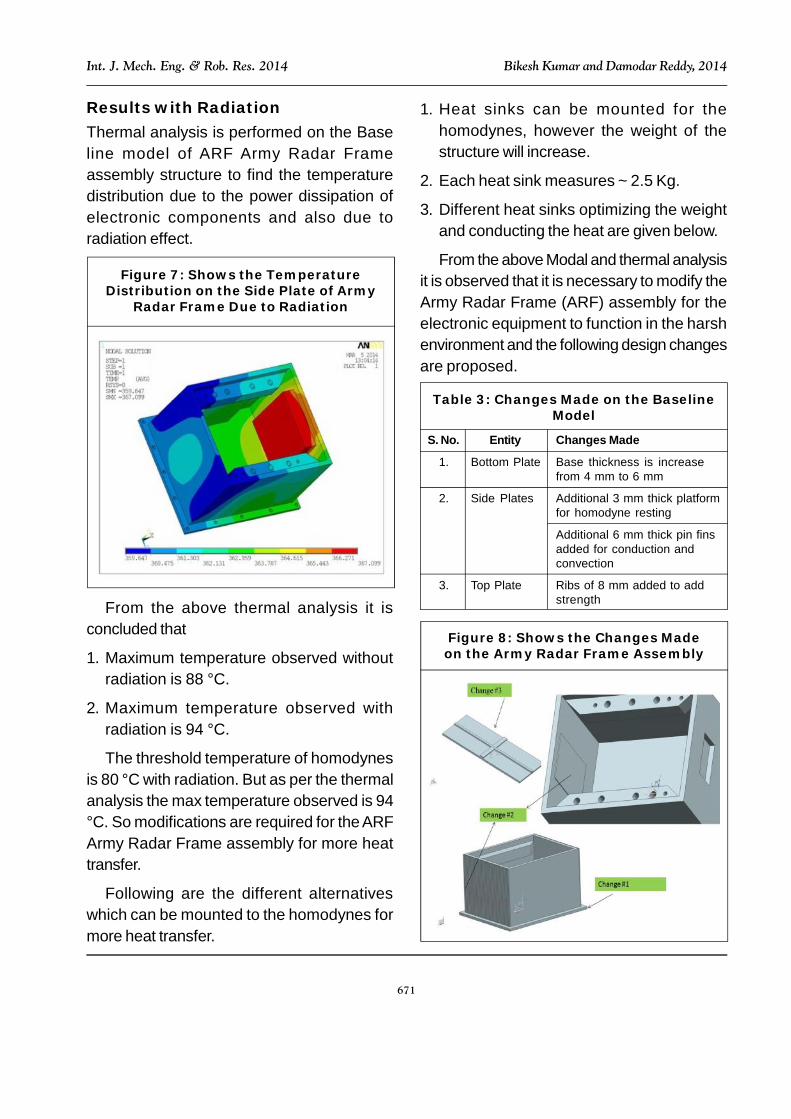
Results with RadiationThermal analysis is performed on the Baseline model of ARF Army Radar Frameassembly structure to find the temperaturedistribution due to the power dissipation ofelectronic components and also due toradiation effect.
1. Heat sinks can be mounted for thehomodynes, however the weight of thestructure will increase.
2. Each heat sink measures ~ 2.5 Kg.
3. Different heat sinks optimizing the weightand conducting the heat are given below.
From the above Modal and thermal analysisit is observed that it is necessary to modify theArmy Radar Frame (ARF) assembly for theelectronic equipment to function in the harshenvironment and the following design changesare proposed.
Figure 7: Shows the TemperatureDistribution on the Side Plate of Army
Radar Frame Due to Radiation
From the above thermal analysis it isconcluded that
1. Maximum temperature observed withoutradiation is 88 °C.
2. Maximum temperature observed withradiation is 94 °C.
The threshold temperature of homodynesis 80 °C with radiation. But as per the thermalanalysis the max temperature observed is 94°C. So modifications are required for the ARFArmy Radar Frame assembly for more heattransfer.
Following are the different alternativeswhich can be mounted to the homodynes formore heat transfer.
S. No. Entity Changes Made
1. Bottom Plate Base thickness is increasefrom 4 mm to 6 mm
2. Side Plates Additional 3 mm thick platformfor homodyne resting
Additional 6 mm thick pin finsadded for conduction andconvection
3. Top Plate Ribs of 8 mm added to addstrength
Table 3: Changes Made on the BaselineModel
Figure 8: Shows the Changes Madeon the Army Radar Frame Assembly

672
Int. J. Mech. Eng. & Rob. Res. 2014 Bikesh Kumar and Damodar Reddy, 2014
Modal Analysis on the ModifiedModelModal analysis is carried out on the modifiedmodel. The mode numbers and participationfactors are shown in the below table.
Power Spectrum Density (PSD)AnalysisPSD Analysis Along X-DirectionPSD analysis is carried out on modified modelwith base excitation in X, Y and Z direction from0-1000 Hz.
Boundary Conditions:
Functional vibration levels: PSD
1 207.453 –2.32E-04 4.17E-02 5.79E-06 5.40E-08 1.74E-03 3.35E-11
2 240.983 –4.29E-07 –9.57E-05 8.98E-03 1.84E-13 9.15E-09 8.07E-05
3 241.069 8.66E-05 –9.74E-05 7.65E-03 7.50E-09 9.48E-09 5.85E-05
4 299.061 2.80E-04 3.05E-04 –7.73E-02 7.83E-08 9.33E-08 5.97E-03
Table 4: Frequencies and Mass Participation
Participation Factor Effective Mass
X-dir Y-dir Z-dir X-dir Y-dir Z-dirFrequencyMode
Random g2/Hz
20 0.003
50 0.02
450 0.02
1000 0.001
Table 5: Shows the Spectral Values vsFrequency for PSD Analysis
Figure 9: Shows the Boundary Condition Applied for PSD in X-Dir
Results: Total Deflection:
The maximum 1 sigma deflection observedis 0.012 mm.
The maximum 3 sigma deflection observedis 0.036 mm.
673
Int. J. Mech. Eng. & Rob. Res. 2014 Bikesh Kumar and Damodar Reddy, 2014
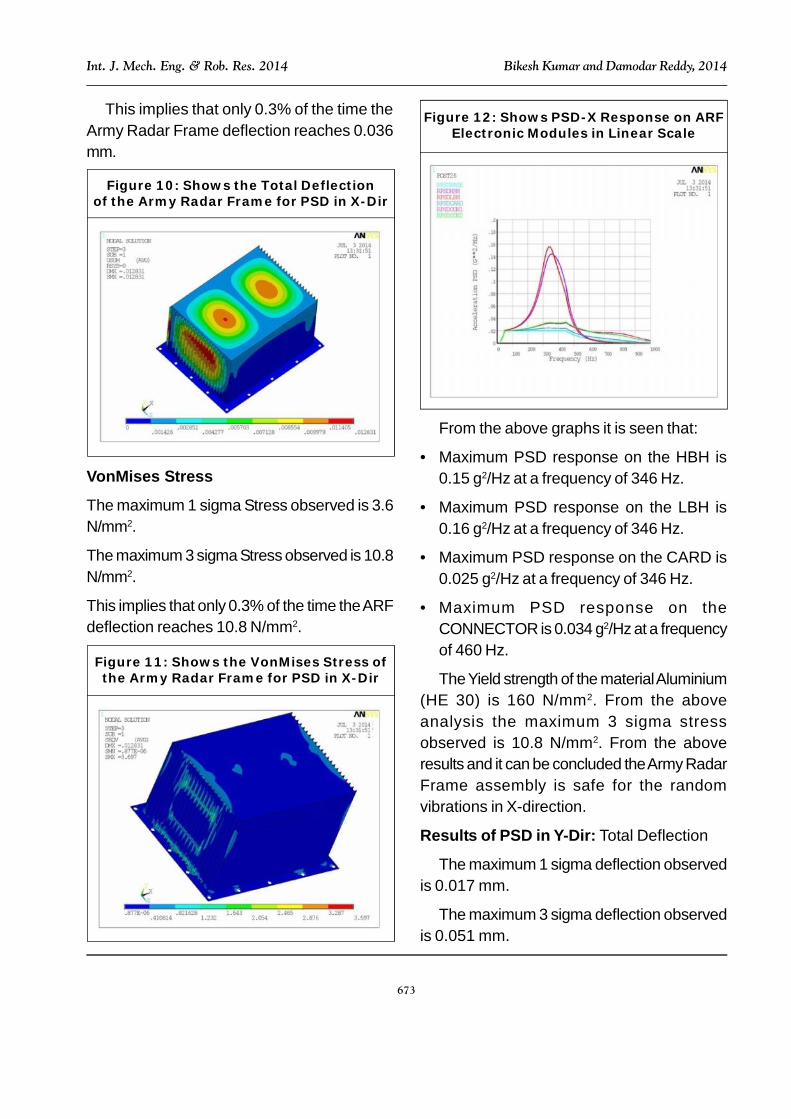
This implies that only 0.3% of the time theArmy Radar Frame deflection reaches 0.036mm.
From the above graphs it is seen that:
• Maximum PSD response on the HBH is0.15 g2/Hz at a frequency of 346 Hz.
• Maximum PSD response on the LBH is0.16 g2/Hz at a frequency of 346 Hz.
• Maximum PSD response on the CARD is0.025 g2/Hz at a frequency of 346 Hz.
• Maximum PSD response on theCONNECTOR is 0.034 g2/Hz at a frequencyof 460 Hz.
The Yield strength of the material Aluminium(HE 30) is 160 N/mm2. From the aboveanalysis the maximum 3 sigma stressobserved is 10.8 N/mm2. From the aboveresults and it can be concluded the Army RadarFrame assembly is safe for the randomvibrations in X-direction.
Results of PSD in Y-Dir: Total Deflection
The maximum 1 sigma deflection observedis 0.017 mm.
The maximum 3 sigma deflection observedis 0.051 mm.
Figure 10: Shows the Total Deflectionof the Army Radar Frame for PSD in X-Dir
VonMises Stress
The maximum 1 sigma Stress observed is 3.6N/mm2.
The maximum 3 sigma Stress observed is 10.8N/mm2.
This implies that only 0.3% of the time the ARFdeflection reaches 10.8 N/mm2.
Figure 11: Shows the VonMises Stress ofthe Army Radar Frame for PSD in X-Dir
Figure 12: Shows PSD-X Response on ARFElectronic Modules in Linear Scale

674
Int. J. Mech. Eng. & Rob. Res. 2014 Bikesh Kumar and Damodar Reddy, 2014
This implies that only 0.3% of the time theArmy Radar Frame deflection reaches 0.051mm.
VonMises Stress
The maximum 1 sigma Stress observed is1.2 N/mm2.
The maximum 3 sigma Stress observed is3.6 N/mm2.
This implies that only 0.3% of the time theARF reaches 3.6 N/mm2.
From the above graphs it is seen that
• Maximum PSD response on the HBH is0.0035 g2/Hz at a frequency of 430 Hz.
• Maximum PSD response on the LBH is0.006 g2/Hz at a frequency of 417 Hz.
• Maximum PSD response on the CARD is0.005 g2/Hz at a frequency of 417 Hz.
• Maximum PSD response on theCONNECTOR is 0.016 g2/Hz at a frequencyof 299 Hz.
The Yield strength of the material Aluminium(HE 30) is 160 N/mm2. From the aboveanalysis the maximum 3 sigma stressobserved is 3.6 N/mm2. From the above resultsand it can be concluded the Army Radar Frameassembly is safe for the random vibrations inY-direction.
Results: PSD in Z-dir
Total Deflection:
The maximum 1 sigma deflection observedis 0.09 mm.
The maximum 3 sigma deflection observedis 0.27 mm.
Figure 13: Shows the Total Deflectionof the Army Radar Frame for PSD in Y-Dir
Figure 14: Shows the VonMises Stressof the Army Radar Frame for PSD in Y-Dir
Figure 15: Shows PSD-Y Response on ARFElectronic Modules in Linear and
Logarithmic Scale

675
Int. J. Mech. Eng. & Rob. Res. 2014 Bikesh Kumar and Damodar Reddy, 2014
This implies that only 0.3% of the time theArmy Radar Frame deflection reaches 0.27mm.
VonMises Stress
The maximum 1 sigma Stress observed is15.7 N/mm2.
The maximum 3 sigma Stress observed is47.1 N/mm2.
This implies that only 0.3% of the time theboard deflection reaches 47.1 N/mm2.
Figure 16: Shows the Total Deflection ofthe Army Radar Frame for PSD in Z-Dir
From the above graphs it is seen that
• Maximum PSD response on the HBH is 2.8g2/Hz at a frequency of 552 Hz.
• Maximum PSD response on the LBH is0.32 g2/Hz at a frequency of 638 Hz.
• Maximum PSD response on the CARD is6.2 g2/Hz at a frequency of 299 Hz.
• Maximum PSD response on theCONNECTOR is 21 g2/Hz at a frequencyof 316 Hz.
The Yield strength of the material Aluminium(HE 30) is 160 N/mm2. From the aboveanalysis the maximum 3 sigma stressobserved is 47.1 N/mm2. From the aboveresults and it can be concluded the Army RadarFrame assembly is safe for the randomvibrations in Z-direction.
THERMAL ANALYSIS OF THEMODIFIED MODELResults Without Radiation
Figure 17: Shows the VonMises Stressof the Army Radar Frame for PSD in Z-Dir
Figure 18: Shows PSD-Z Response on ARFElectronic Modules in Linear and
Logarithmic Scale

676
Int. J. Mech. Eng. & Rob. Res. 2014 Bikesh Kumar and Damodar Reddy, 2014
Figure 19: Shows the TemperatureDistribution on the Modified ARF Army
Radar Frame Assembly
Figure 20: Shows the TemperatureDistribution on the Side Plate of Modified
Army Radar Frame Due to Radiation
Results with Radiation
From the above thermal analysis it isconcluded that
1. Maximum temperature observed withoutradiation is 67 °C.
2. Maximum temperature observed withradiation is 71 °C.
3. The modified ARF model is safe for thethermal conditions.
CONCLUSIONIn the present paper a Army Radar Frame(ARF) has been designed and optimized forvibration control and temperatures.
Army Radar frame (ARF) was studied for 3different cases for baseline and modifiedmodel:
• Modal Analysis.
• Power Spectrum Density Analysis.
• Thermal Analysis with and without radiation.
From the above analysis it is concluded thatthat the critical natural frequencies in theoperation frequency range of 0-300 Hz wereshifted to above 300 Hz due to the changesimplemented as shown in the report.
From the above thermal analysis it isconcluded that the temperatures are below thethreshold temperature of homodynes, i.e.,80 °C with radiation.
Therefore it concluded that the modifiedArmy Radar Frame (ARF) is safe under thegiven operating conditions.
REFERENCES1. Aglietti G S and Schwingshackl C (2004),
“Analysis of Enclosures and Anti VibrationDevices for Electronic Equipment forSpace Applications”, School ofEngineering Sciences, Aeronautics andAstronautics, University of Southampton,UK.
2. Gregory L Davis and Rebekah L Tanimoto(2006), Mechanical Development ofAntenna Systems, Chapter 8,Spaceborne Antennas for PlanetaryExploration.

677
Int. J. Mech. Eng. & Rob. Res. 2014 Bikesh Kumar and Damodar Reddy, 2014
3. Michael Yovanovich M and RichardCulham (2006), “Modeling of NaturalConvection in Electronic Enclosures”,Microelectronics Heat TransferLaboratory, Department of MechanicalEngineering.
4. Veprik A M (2003), “Vibration Protectionof Critical Components of ElectronicEquipment in Harsh EnvironmentalConditions”, Wolfson School ofMechanical and ManufacturingEngineering, Loughborough University.
5. Wenjun Lu and Libiao Tong (2012),“Design of Broadband Receiver inBattlefield Electromagnetic SpectrumMonitoring System”, New Star ResearchInstitute of Applied Technology, Hefei230031, China.
6. Yun-Xin Wu (1999), “Sensitivity-BasedFinite Element Model Updating Methodswith Application to ElectronicEquipments”.