design principles for high transition metal capacity in
TRANSCRIPT

Design principles for high transition metalcapacity in disordered rocksalt Li-ion cathodes
The MIT Faculty has made this article openly available. Please share how this access benefits you. Your story matters.
Citation Kitchaev, Daniil A., Zhengyan Lun, William D. Richards, Huiwen Ji,Raphaële J. Clément, Mahalingam Balasubramanian, Deok-HwangKwon, et al. “Design Principles for High Transition Metal Capacityin Disordered Rocksalt Li-Ion Cathodes.” Energy & EnvironmentalScience (2018).
As Published http://dx.doi.org/10.1039/C8EE00816G
Publisher Royal Society of Chemistry (RSC)
Version Final published version
Citable link http://hdl.handle.net/1721.1/116929
Terms of Use Creative Commons Attribution-NonCommercial 3.0 Unported
Detailed Terms https://creativecommons.org/licenses/by-nc/3.0/

This journal is©The Royal Society of Chemistry 2018 Energy Environ. Sci.
Cite this:DOI: 10.1039/c8ee00816g
Design principles for high transition metalcapacity in disordered rocksalt Li-ion cathodes†
Daniil A. Kitchaev, ‡*a Zhengyan Lun, ‡bc William D. Richards,a Huiwen Ji,bc
Raphaele J. Clement, c Mahalingam Balasubramanian, d Deok-Hwang Kwon,b
Kehua Dai,e Joseph K. Papp,f Teng Lei,g Bryan D. McCloskey,fh Wanli Yang, e
Jinhyuk Leec and Gerbrand Ceder*abc
The discovery of facile Li transport in disordered, Li-excess rocksalt materials has opened a vast new
chemical space for the development of high energy density, low cost Li-ion cathodes. We develop a
strategy for obtaining optimized compositions within this class of materials, exhibiting high capacity and
energy density as well as good reversibility, by using a combination of low-valence transition metal
redox and a high-valence redox active charge compensator, as well as fluorine substitution for oxygen.
Furthermore, we identify a new constraint on high-performance compositions by demonstrating the
necessity of excess Li capacity as a means of counteracting high-voltage tetrahedral Li formation,
Li-binding by fluorine and the associated irreversibility. Specifically, we demonstrate that 10–12% of Li
capacity is lost due to tetrahedral Li formation, and 0.4–0.8 Li per F dopant is made inaccessible at
moderate voltages due to Li–F binding. We demonstrate the success of this strategy by realizing a series
of high-performance disordered oxyfluoride cathode materials based on Mn2+/4+ and V4+/5+ redox.
Broader contextElectrochemical energy storage is a key component of modern energy systems, providing portable power to devices ranging from personal electronics to electricvehicles, and enabling grid-scale mitigation of the fluctuating availability of renewable energy sources. The central role of energy storage systems motivates thesearch for, and optimization of, low-cost, environmentally-benign materials which can reversibly provide high energy density. Cathode materials, which arepresently the performance-limiting components in state-of-the-art Li-ion batteries, have been traditionally limited to Ni and Co-based layered oxides. The recentdiscovery of Li-percolation in disordered rocksalts has expanded the structural space of materials which may serve as a Li-ion electrode, while thedemonstration of Mn2+/4+ cathode electrochemistry and disordered rocksalt fluorination has opened to door to the use of cheap, environmentally-friendlychemistries. Here, we build on these demonstrations to derive optimization rules for designing disordered rocksalt oxyfluoride cathodes and provide anexample of an optimized series of cathode materials.
Introduction
The development of high-energy density cathode materialsremains a bottleneck in the design of advanced Li-ion batteries.While the traditional space of layered oxides has been dominatedby oxides of Ni, Mn, and Co,1 the discovery of facile Li transport inLi-excess disordered rocksalt materials2,3 has vastly expanded thechemical space for cathode design. Some of the advantages ofLi-excess disordered rocksalts are now clear; by removing thedemand that the cathode material remains layered, a much widerrange of transition metals can be used as a redox reservoir,especially when d0 species are present to accommodate local strainand allow for facile disorder.4 Furthermore, recent theoretical5 andexperimental6 work indicates that, unlike in layered materials,fluorine can be partially substituted for oxygen in disordered
a Department of Materials Science and Engineering, MIT, Cambridge, MA, 02139,
USA. E-mail: [email protected] Materials Science Division, LBNL, Berkeley, CA, 94720, USAc Department of Materials Science and Engineering, UC Berkeley, Berkeley, CA,
94720, USA. E-mail: [email protected] X-ray Science Division, Advanced Photon Source, Argonne National Laboratory,
Argonne, Illinois 60439, USAe Advanced Light Source, Lawrence Berkeley National Laboratory, Berkeley,
CA 94720, USAf Department of Chemical and Biomolecular Engineering, UC Berkeley, Berkeley,
CA, 94720, USAg Department of Chemistry, UC Berkeley, Berkeley, CA, 94720, USAh Energy Storage and Distributed Resources Division, LBNL, Berkeley, CA, 94720,
USA
† Electronic supplementary information (ESI) available. See DOI: 10.1039/c8ee00816g‡ These authors contributed equally.
Received 19th March 2018,Accepted 24th May 2018
DOI: 10.1039/c8ee00816g
rsc.li/ees
Energy &EnvironmentalScience
PAPER
Ope
n A
cces
s A
rtic
le. P
ublis
hed
on 2
4 M
ay 2
018.
Dow
nloa
ded
on 7
/11/
2018
4:5
5:06
PM
. T
his
artic
le is
lice
nsed
und
er a
Cre
ativ
e C
omm
ons
Attr
ibut
ion-
Non
Com
mer
cial
3.0
Unp
orte
d L
icen
ce.
View Article OnlineView Journal
Energy Environ. Sci. This journal is©The Royal Society of Chemistry 2018
rocksalts. Fluorine substitution lowers the average anionvalence, allowing Li-excess compositions to be combined withlower valence metals and reducing oxygen loss during cycling.
A large number of high-performance cathodes have alreadybeen reported among Li-excess disordered rocksalts. To ensurethat the composition is charge balanced, these materials haveeither relied on high-valence transition metals as the redox-activecenter, such as in Li3V2
3.5+O5,7 or used a combination of a trivalentredox-active transition metal oxide (LiM3+O2) mixed with a high-valence charge compensator, such as Li4MoO5,2,8,9 Li3NbO4,10–14
Li3SbO4,15 or Li2TiO3,8,16,17 where the metal is electrochemicallyinactive. Fluorination as a supplementary source of chargecompensation has been used in Li2V3+O2F,18 Li2Cr3+O2F,19 andLi2Mo3+O2F20 compounds. Through a combination of thesestrategies, cathodes have also been reported based on high-voltage divalent transition metal centers, such as Li1.15Ni0.45
2+-
Ti0.3Mo0.1O1.85F0.15,6 Li2Mn2/32+Nb1/3O2F, and Li2Mn1/2
2+Ti1/2O2F.21
Despite the numerous reported compounds however, the questionof which composition is optimal for high reversible capacity andenergy density remains open.
The design of a disordered rocksalt cathode material essentiallyconsists of choosing one or more active redox centers, the Li-excesscontent and F/O ratio on the anion site, while ensuring that thedesired combination of oxidation states is stable and that thecompound is synthetically accessible. High-valence multi-electroncouples spanning the average oxidation states of V3+/5+, Mo3+/6+ andCr3+/5+ have been successfully realized but suffer from a low averagevoltage.2,7,14,18–20 Higher voltage trivalent couples such as Mn3+/4+,Fe3+/4+ and Co3+/4+ in turn offer too little capacity on their own, andtypically require additional anion redox for high energy density,which is accompanied by irreversibility due to oxygen loss andsurface densification.9,11,16,22,23 Finally, while the high-voltage Ni2+/4+
couple promises high theoretical energy density, its practicalrealization has been to date hampered by overlap with oxygenredox at moderate levels of charge.6,8,11 The recently realizedMn2+/4+ couple avoids this limitation while providing highcapacity at a high average voltage.21 However, as the low-valenceof the discharged Mn2+ requires a source of charge compensation,previous reports have mixed the active Mn with redox-inactiveelements, as well as fluorine. It is thus possible to obtain highertransition-metal capacity by using a redox-active charge com-pensator instead. Two examples of such high-valence compensatorsare V4+, providing relatively high-voltage V4+/5+ capacity, or Mo5+,providing Mo5+/6+ capacity. The combination of high-voltage Mn2+/4+
and a redox active high-valence charge compensator presents anopportunity to achieve high capacity based only on relatively high-voltage transition metal couples, minimizing anion redox and theassociated oxygen loss and degradation processes.
Here, we investigate a series of novel cathode materialsbased on the proposed combination of Mn2+/4+ and V4+/5+ couples.We present a computational approach for evaluating syntheticaccessibility in this space, which allows for the identification ofoptimal synthesizable compositions. We proceed to evaluate themixed Mn/V redox mechanism through a combination of first-principles calculations and spectroscopy. Based on these results,as well as our computational models, we trace the sub-theoretical
performance of our initial compositions to the presence of high-voltage Li sites associated with fluorine doping and the formationof tetrahedrally-coordinated Li. By considering the chemical andstructural features, we derive an accurate model for the practicalcapacity of a disordered rocksalt. Based on these novel designcriteria, we report a series of disordered rocksalt oxyfluoride cathodeswhich rely predominantly on transition metal redox and providehigh capacity and energy density with good reversibility.
MethodologyComputational methods
In order to evaluate the Li+–Mn2+–V4+–O2�–F� phase diagramand obtain representative structures of fully lithiated Li+–Mn2+–V4+–O2�–F� materials, we constructed a cluster-expansionHamiltonian of the LiF–MnO–Li2/3V1/3O system on a dense-rocksalt lattice following the same methodology we describedin a previous report.5 To summarize, we computed approximately600 orderings on the rocksalt lattice, iteratively chosen as low-energy states from Monte Carlo simulations across the LiF–MnO–Li2/3V1/3O space. We then fitted a cluster expansion consisting ofpair interactions up to 7.1 Å, triplet interactions up to 4.0 Å, andquadruplet interactions up to 4.0 Å based on a primitive rocksaltunit cell with a = 3 Å, where the interactions were taken as anoffset from a baseline of formal charge electrostatics with afitted dielectric constant.24 The effective cluster interactions anddielectric constant were obtained from a L1-regularized least-squares regression, with the regularization parameter chosen tominimize cross-validation error.25 The root-mean-squared errorobtained by this procedure was below 5 meV per atom. Finally,we evaluated the internal energy of the system as a function ofcomposition and temperature using canonical Monte Carlosimulations, and obtained the Gibbs free energy from heatcapacity integration.5
To parameterize the LiF–MnO–Li2/3V1/3O cluster expansion,we relied on energies obtained from density functional theory(DFT) using the Vienna ab-initio simulation package (VASP)26
and the projector-augmented wave (PAW) method.27 Thesecalculations were performed using a reciprocal space discretizationof 25 �1, and converged to 10�6 eV for total energy and 0.02 eV �1
for interatomic forces. We relied on the PBE exchange–correlationfunctional28 with the rotationally-averaged Hubbard U correction,where the U value was chosen based on a previously reportedcalibration to oxide formation energies (3.1 eV for V and 3.9 eV forMn),29 which has been shown to be broadly reliable for determiningthe formation enthalpies of similar compounds.30
To simulate the delithition behavior of disordered-rocksaltLi–Mn–V–O–F, we first obtained a set of representative structuresof the lithiated compound from a Monte Carlo simulation at thebinodal temperature of the composition of interest. We thenobtained low-energy Li-vacancy orderings within these structuresby first enumerating all possible Li-vacancy orderings in a sampleof small unit cells, and then parametrizing a Li-vacancy clusterexpansion to obtain Li orderings in larger cells. To obtain therelative energies of possible Li-vacancy orderings at a fixed
Paper Energy & Environmental Science
Ope
n A
cces
s A
rtic
le. P
ublis
hed
on 2
4 M
ay 2
018.
Dow
nloa
ded
on 7
/11/
2018
4:5
5:06
PM
. T
his
artic
le is
lice
nsed
und
er a
Cre
ativ
e C
omm
ons
Attr
ibut
ion-
Non
Com
mer
cial
3.0
Unp
orte
d L
icen
ce.
View Article Online

This journal is©The Royal Society of Chemistry 2018 Energy Environ. Sci.
composition, we relied on the SCAN meta-GGA exchange–correlation functional31 as it yields reliable structure selectionand lattice geometries.32,33 For computational efficiency, theseinitial calculations were performed using fixed unit cellsobtained from the lithiated structure. The restriction that theunit cell shape remains constant is consistent with our experi-mental observation that delithiation preserves the rocksaltlattice. However, by fixing the unit cell volume during thisinitial enumeration we assume that the favored arrangement ofLi and vacancies is not significantly affected by lattice contractionduring delithiation. All other computational parameters were thesame as those used for parametrizing the dense rocksalt clusterexpansion. As the Li-vacancy cluster expansion was once againtaken as an offset from a baseline of formal charge electrostatics,the various oxidation states of Mn, V and O were taken asdistinct species, and identified in DFT calculations based ontheir magnetic moments. The final root-mean-square error ofthis cluster expansion was below 5 meV per atom.
Finally, to obtain reliable oxidation potentials for eachsampled Li–Mn–V–O–F cell, we fully relaxed the most stableLi-vacancy ordering at each delithiation step using the hybridHSE functional34 with an exact-exchange fraction of 0.30. Weset the exact-exchange fraction to reproduce the band gaps ofMnO, a-Mn3O4, and d-MnO2 obtained from experiment orsingle-shot G0W0 calculations, following the method proposedby Seo et al.35 To keep computational expense within reasonablebounds, we reduced the reciprocal space discretization in thesesimulations to 10 Å�1. We then constructed the total Li voltagecurve for a given composition of the Li–Mn–V–O–F disorderedrocksalt by taking a grand-canonical ensemble of Li potentialswithin each of the sampled unit cells. This voltage curve alsoyields a large set of representative structures for all stages ofdelithiation. All structure analysis and post-processing weredone using the pymatgen software package.36
Synthesis
All Li–Mn–V–O/Li–Mn–V–O–F compounds were synthesizedby mechanochemical ball-milling. For Li1.143Mn0.286V0.572O2
(ST-LMVO) and Li1.2Mn0.2V0.6O2 (LR-LMVO), Li2O (Alfa Aesar,ACS, 99% min), MnO (Sigma-Aldrich, 99.99%), and VO2 (Sigma-Aldrich, 99.9%) were used as precursors and mixed in astoichiometric ratio, with the exception of Li2O, which wasadded in 10% excess, in order to compensate for potential Li2Oloss during synthesis as suggested by previous work on similarmaterials.18,21 Precursors were mixed with a Retsch PM 200planetary ball mill at a rate of 300 rpm for 12 hours. The mixedprecursors were ball-milled for 40 hours in argon-filled stain-less steel ball-mill jars, using a Retsch PM 200 planetary ballmill at 500 rpm. For Li1.171Mn0.343V0.486O1.8F0.2 (ST-LMVF20),Li1.133Mn0.400V0.467O1.8F0.2 (MR-LMVF20) and Li1.23Mn0.255-V0.515O1.8F0.2 (LR-LMVF20), Li2O (Alfa Aesar, ACS, 99% min),MnO (Sigma-Aldrich, 99.99%), VO2 (Sigma-Aldrich, 99.9%) andLiF (Alfa Aesar, 99.99%) precursors were stoichiometricallymixed, adding 10% excess Li2O, for 12 hours at 300 rpm andthen ball-milled for 50 hours at 500 rpm, using a Retsch PM200 planetary ball mill. The total amount of precursors was 1 g.
The ball-milling process rested for 5 minutes after every hour.All syntheses used five 10 mm (diameter) stainless balls and ten5 mm (diameter) balls as the grinding media.
Electrochemistry
The cathode films were composed of active materials, carbonblack (Timcal, SUPER C65), and polytetrafluoroethylene (PTFE,DuPont, Teflon 8A) with a weight ratio of 7 : 2 : 1. The componentswere manually mixed for 40 minutes using a mortar and pestleand then rolled into a thin film inside an argon-filled glovebox.1 M LiPF6 in ethylene carbonate (EC) and dimethyl carbonate(DMC) solution (volume ratio 1 : 1) was used as electrolyte. Glassmicrofiber filters (Whatman) were used as the separator and Limetal foil (FMC) was used as the anode material. Coin cells wereassembled inside an argon-filled glovebox and tested on a Maccor2200 or Arbin battery test work station at room temperature inthe galvanostatic mode unless otherwise specified. The loadingdensity of the film was B5 mg cm�2 based on active materials.The specific capacity was calculated based on the weight of activematerials (70%) in the cathode films.
Characterization
X-ray diffraction (XRD) patterns for the as-synthesized compoundswere collected using a Rigaku MiniFlex diffractometer (Cu source)in a 2y range of 51–851. Rietveld refinement was done usingPANalytical X’pert HighScore Plus software. Elemental analysiswas performed by Luvak Inc. with direct current plasma emissionspectroscopy (ASTM E 1079-12) for lithium, manganese, vanadiumand with an ion selective electrode (ASTM D 1179-10) for fluorine.Scanning electron microscopy (SEM) images were collected using aJEOL JSM-6340F field emission scanning electron microscope.Scanning transmission electron microscopy (STEM)/energy dis-persive spectroscopy (EDS) measurements were acquired from apart of the particles using a JEM-2010F with an X-max EDSdetector in the Molecular Foundry at LBNL.
Solid-state nuclear magnetic resonance (NMR) spectroscopy19F NMR data were acquired for the as-synthesized ST-, MR- andLR-LMVF20 powder samples at room temperature using a BrukerAvance500 WB spectrometer (11.7 T), at a Larmor frequency of�470.7 MHz. The data were obtained under 60 kHz magic anglespinning (MAS) using a 1.3 mm double-resonance probe, andchemical shifts were referenced against lithium fluoride powder(LiF, diso(19F) = �204 ppm).
Because the resonant frequency range of the 19F nuclei inthe as-synthesized cathodes is larger than the excitation band-width of the radio frequency (RF) pulse used in the NMRexperiment, seven spin echo spectra were collected for eachsample, with the irradiation frequency varied in steps equal tothe excitation bandwidth of the RF pulse (330 ppm or 155 kHz)from�1230 to 750 ppm. The individual sub-spectra were processedusing a zero order phase correction so that the on-resonance signalwas in the absorption mode. The seven sub-spectra were then addedto give an overall sum spectrum with no further phase correctionrequired. This method, termed ‘spin echo mapping’,37 ‘frequencystepping’38,39 or ‘VOCS’ (Variable Offset Cumulative Spectrum),40
Energy & Environmental Science Paper
Ope
n A
cces
s A
rtic
le. P
ublis
hed
on 2
4 M
ay 2
018.
Dow
nloa
ded
on 7
/11/
2018
4:5
5:06
PM
. T
his
artic
le is
lice
nsed
und
er a
Cre
ativ
e C
omm
ons
Attr
ibut
ion-
Non
Com
mer
cial
3.0
Unp
orte
d L
icen
ce.
View Article Online

Energy Environ. Sci. This journal is©The Royal Society of Chemistry 2018
is required to provide a large excitation bandwidth and uniformlyexcite the broad F signals. Individual 19F spin echo spectra werecollected using a 901 RF excitation pulse of 1.6 ms and a 1801 RFpulse of 3.2 ms at 76.3 W (or 156 kHz), with a recycle delay of0.05 s. For comparison, a spin echo spectrum was collected forLiF using similar RF pulses but a longer recycle delay of 60 s. A19F probe background spin echo spectrum, acquired under thesame conditions as the individual LMVF20 spin echo spectra butwith an empty rotor, revealed the presence of a low intensitybackground signal.
Ex situ hard X-ray absorption spectroscopy
Ex situ hard XAS measurements were performed in transmissionmode using beamline 20BM at the Advanced Photon Source. Theincident energy was selected using a Si(111) monochromator. Theenergy calibration was performed by simultaneously measuringthe spectra of the appropriate metal foil. Harmonic rejection wasaccomplished using a Rh-coated mirror. All ex situ samples wereelectrode films, composed of active materials, carbon blackand PTFE with a weight ratio of 7 : 2 : 1 and a loading density ofB5 mg cm�2 based on active materials. Ex situ charged sampleswere assembled as coin cells, charged to designated capacities ata rate of 10 mA g�1, then disassembled and washed with DMC for5 minutes in an argon-filled glovebox. Kapton film was used tocover both sides of the samples. The pristine sample was notwashed, but directly covered with Kapton film after being rolledinto a thin film. Spectra of reference standards were also acquiredto facilitate interpretation. Raw data was normalized and calibratedusing Athena software.41
Ex situ soft X-ray absorption spectroscopy
O K-edge spectra were acquired from soft XAS measurements,performed in the iRIXS endstation at beamline 8.0.1 of theAdvanced Light Source (ALS) at Lawrence Berkeley National Lab(LBNL).42 The experimental energy resolution is better than0.15 eV without considering core–hole lifetime broadening.Experiments were performed at room temperature and withthe linear polarization of the incident beam at 451 from theelectrode surfaces. All spectra were normalized to the beam fluxmeasured by the upstream gold mesh and calibrated based on aTiO2 (anatase) standard. All ex situ samples were electrodefilms, composed of active materials, carbon black and PTFE witha weight ratio of 7 : 2 : 1, and a loading density of B4 mg cm�2
based on active materials. The pristine sample did not gothrough other treatments (e.g. washing) after being rolled intoa thin film. The ex situ charged samples were marked front sideand back side, assembled into coin cells with the front sidefacing the separator, charged to designated capacities at10 mA g�1, and finally disassembled and washed with DMCin an argon-filled glovebox for 5 minutes, in order to wash awaysurface species deposited during charge and increase the signalquality. All samples were loaded into an in-house manufacturedsample transfer kit in a glovebox, which was then directlymounted onto the ultra-high vacuum XAS characterizationchamber to avoid any air exposure.43 XAS spectra were collectedsimultaneously through both TEY mode and TFY mode with
the excitation X-ray beam hitting the same spot on the frontside of the films.
Differential electrochemical mass spectrometery (DEMS)
The custom-built DEMS and the cell geometry used here aredescribed in previous publications.44–46 The electrochemicalcells used with the DEMS device were prepared in an argon-filled glove box using a modified Swagelok design. The cathodefilm was composed of active materials, carbon black and PTFEwith a weight ratio of 7 : 2 : 1 and a loading density of B6 mg cm�2
based on active materials. A static head of positive argon pressure(B1.2 bar) was applied to the assembled cells during chargingat 20 mA g�1, and argon gas pulses periodically swept theaccumulated gases to a mass spectrometer. The mass spectro-meter absolute sensitivity was calibrated for the determinationof the partial pressures of CO2 and O2. The amount of CO2 andO2 evolved was quantified using the partial pressures and theknown volume of gas swept to the mass spectrometer per pulse.
Results and discussionSynthetic accessibility
In order to identify synthetically accessible compositions ofdisordered rocksalt consisting of a mixture of Li+, Mn2+, V4+,O2� and F�, we compute a phase diagram of the MnO/Li2VO3/LiF system. As the mixing of the transition metals and incorporationof fluorine into the structure depend on a delicate balance ofentropy and enthalpy arising from the coupling between the cationand anion sublattices, a finite-temperature analysis is necessary toidentify compositions exhibiting sufficiently low enthalpy and highentropy at experimentally-relevant temperatures to be synthesizable.For this analysis, we evaluate the thermodynamics of this systemusing configurational Monte Carlo simulations, based on a clusterexpansion Hamiltonian parametrized on the basis of first-principlesdensity functional theory (DFT) calculations.5,24,25
The phase diagram of the disordered rocksalt system, shownin Fig. 1a, gives the extent of the binodal region starting fromthe MnO and Li2/3V1/3O (Li2VO3) endpoints as a function oftemperature, illustrating the range of mixed compositionswhich are thermodynamically stable at the given temperature.For example, the contour labeled 1250 1C indicates that at1250 1C, the Li2/3V1/3O phase can accommodate up to 18% MnOor 30% LiF, while the MnO phase can accommodate 25%Li2/3V1/3O and 3% LiF. Similarly, the 1500 1C contour indicatesthat at this temperature, Li2/3V1/3O and MnO are fully miscible,but still have a limited solubility for LiF that increases with theLi2/3V1/3O fraction. As our goal is evaluating the relative stabilityof competing rocksalt-type phases, we neglect high-temperaturegas evolution and melting, which limits the general applicabilityof this phase diagram. An important further assumption in theconstruction of this phase diagram is the metastability of theLi2V4+O3 (Li2/3V1/3O) endpoint phase, which has been previouslyreported to form as a disordered-rocksalt upon electrochemicalcycling.47 While we find this phase to be globally metastableagainst phase separation into LiV3+O2 and Li3V5+O4, the formation
Paper Energy & Environmental Science
Ope
n A
cces
s A
rtic
le. P
ublis
hed
on 2
4 M
ay 2
018.
Dow
nloa
ded
on 7
/11/
2018
4:5
5:06
PM
. T
his
artic
le is
lice
nsed
und
er a
Cre
ativ
e C
omm
ons
Attr
ibut
ion-
Non
Com
mer
cial
3.0
Unp
orte
d L
icen
ce.
View Article Online

This journal is©The Royal Society of Chemistry 2018 Energy Environ. Sci.
of Li3V5+O4 requires the formation of a wurtzite-type lattice. Weassume this transformation to be suppressed by ball-millinginduced disorder in the otherwise rocksalt-type lattice, byanalogy to the stabilization of V4+ in the disordered-rocksaltLi3V2
3+,4+O5 compound.7
The finite temperature stability given by the phase diagramin Fig. 1a is informative for identifying compositions accessibleby both high-temperature solid-state synthesis, and by high-energy ball-milling. In the case of high-temperature annealing,the synthesis proceeds at near-thermodynamic conditions,suggesting that any composition stable at the annealingtemperature could be formed and then quenched to obtain adisordered metastable product.48 For example, firing at 1250 1Ccould yield Li2/3V1/3O doped with up to 18% MnO and 10% LiF,yielding a Li1.16Mn0.36V0.48O1.8F0.2 disordered rocksalt. In thecase of high-energy ball-milling, the relationship between thephase diagram and synthetic accessibility is less clear. Whilesome arguments have been made that mechanochemical synthesisproceeds due to local heating or shear-induced reactions,49,50 nodefinitive mechanism is known for predicting such synthesisoutcomes from thermodynamic quantities. In the absence of arigorous mechanism to evaluate, we determined the 1750 1Cbinodal as a heuristic boundary for synthetic accessibility byhigh-energy ball-milling, where the 1750 1C temperature is
based on calibration to reported synthesis successes in similarMn2+-containing disordered rocksalt oxyfluorides,21 as shown inESI,† Fig. S1.
Electrochemical design and performance
To evaluate the approximate electrochemical performance of thissystem, we plot the theoretical capacity of possible compositionsin this chemical space, given as a color-coded overlay in Fig. 1a.The given theoretical capacity assumes that the Mn2+/4+ and V4+/5+
redox couples are fully accessible, unless limited by the Li contentin the structure. We do not include possible oxygen redox dueto the reported difficulties in achieving reversible cathode per-formance when oxygen oxidation is activated.8,22,23 Within theseassumptions, compositions that perfectly balance transitionmetal and Li capacity are optimal, with higher fluorination levelsproviding the greatest specific capacity, as can be observed inFig. 1. Among the synthetically-accessible oxyfluorides, and evenin the mixed-metal oxide without F, the theoretical capacity isabove 360 mA h g�1 due to the high content of light, redox-activetransition metals, motivating an in-depth study of these compoundsand their realizable electrochemical performance.
To investigate whether the high capacity of these materials can beexperimentally realized, we synthesize Li1.143Mn0.286V0.572O2 (ST-LMVO) and Li1.171Mn0.343V0.486O1.8F0.2 (ST-LMVF20) as representative
Fig. 1 Thermodynamic stability and synthesis of mixed Mn2+/V4+ disordered rocksalt oxyfluorides. (a) Computed phase diagram of the MnO/Li2VO3/LiFalloy space. The temperature-marked contours denote the extent of the binodal, starting from the MnO and Li2VO3 endpoints, at the given temperature.The color-coded overlay plots the theoretical gravimetric capacity of compositions across the phase diagram based on Li and transition metal redoxcontent. The percolation threshold marks compositions exceeding the 10% Li-excess requirement.2 The inset illustrates the region of the phase diagramwe focus on to synthesize the stoichiometric, transition metal-rich, and Li-rich compositions. (b) XRD profiles and refined lattice parameters of thesynthesized disordered rocksalt compounds.
Energy & Environmental Science Paper
Ope
n A
cces
s A
rtic
le. P
ublis
hed
on 2
4 M
ay 2
018.
Dow
nloa
ded
on 7
/11/
2018
4:5
5:06
PM
. T
his
artic
le is
lice
nsed
und
er a
Cre
ativ
e C
omm
ons
Attr
ibut
ion-
Non
Com
mer
cial
3.0
Unp
orte
d L
icen
ce.
View Article Online
Energy Environ. Sci. This journal is©The Royal Society of Chemistry 2018
compounds stoichiometrically balancing Li and transition metalcapacity, as well as Li1.133Mn0.400V0.467O1.8F0.2 (MR-LMVF20) andLi1.23Mn0.255V0.515O1.8F0.2 (LR-LMVF20) metal-rich and Li-richvariants, respectively. We choose to focus on these relativelylow-fluorine content compositions as they are predicted to bemore likely synthesizable than their highly-fluorinated counter-parts, while providing only slightly lower theoretical capacitiesas is clear from Fig. 1a. We successfully synthesize all fourcompounds by high-energy ball-milling in an argon atmosphere.We confirm their disordered rocksalt structure by X-ray diffraction(XRD) as shown in Fig. 1b, and their composition by inductivelycoupled plasma optical emission spectrometry (ICP-OES) (see ESI,†Table S1). The secondary particle size of the as-synthesizedcompounds is 100–200 nm and the primary particle size is20–50 nm as indicated by scanning electron microscopy (SEM)and transmission electron microscopy (TEM), respectively.Detailed XRD refinement, as well as SEM and TEM characterizationdata are available in ESI,† Fig. S2 and S3.
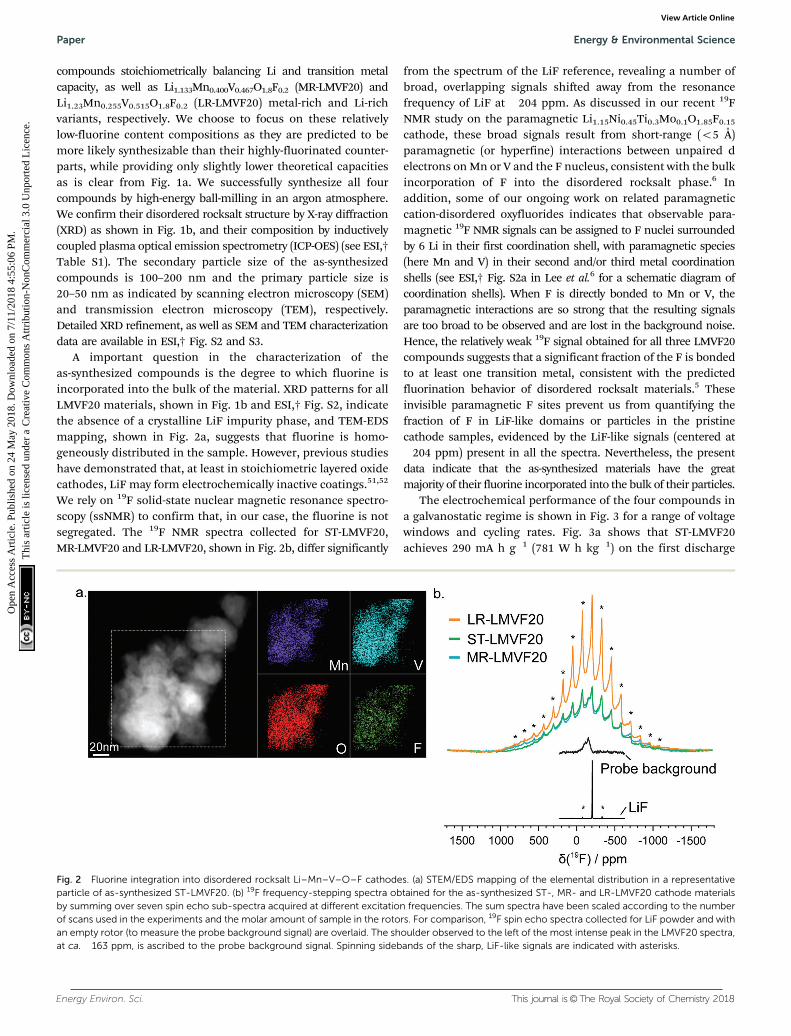
A important question in the characterization of theas-synthesized compounds is the degree to which fluorine isincorporated into the bulk of the material. XRD patterns for allLMVF20 materials, shown in Fig. 1b and ESI,† Fig. S2, indicatethe absence of a crystalline LiF impurity phase, and TEM-EDSmapping, shown in Fig. 2a, suggests that fluorine is homo-geneously distributed in the sample. However, previous studieshave demonstrated that, at least in stoichiometric layered oxidecathodes, LiF may form electrochemically inactive coatings.51,52
We rely on 19F solid-state nuclear magnetic resonance spectro-scopy (ssNMR) to confirm that, in our case, the fluorine is notsegregated. The 19F NMR spectra collected for ST-LMVF20,MR-LMVF20 and LR-LMVF20, shown in Fig. 2b, differ significantly
from the spectrum of the LiF reference, revealing a number ofbroad, overlapping signals shifted away from the resonancefrequency of LiF at �204 ppm. As discussed in our recent 19FNMR study on the paramagnetic Li1.15Ni0.45Ti0.3Mo0.1O1.85F0.15
cathode, these broad signals result from short-range (o5 Å)paramagnetic (or hyperfine) interactions between unpaired delectrons on Mn or V and the F nucleus, consistent with the bulkincorporation of F into the disordered rocksalt phase.6 Inaddition, some of our ongoing work on related paramagneticcation-disordered oxyfluorides indicates that observable para-magnetic 19F NMR signals can be assigned to F nuclei surroundedby 6 Li in their first coordination shell, with paramagnetic species(here Mn and V) in their second and/or third metal coordinationshells (see ESI,† Fig. S2a in Lee et al.6 for a schematic diagram ofcoordination shells). When F is directly bonded to Mn or V, theparamagnetic interactions are so strong that the resulting signalsare too broad to be observed and are lost in the background noise.Hence, the relatively weak 19F signal obtained for all three LMVF20compounds suggests that a significant fraction of the F is bondedto at least one transition metal, consistent with the predictedfluorination behavior of disordered rocksalt materials.5 Theseinvisible paramagnetic F sites prevent us from quantifying thefraction of F in LiF-like domains or particles in the pristinecathode samples, evidenced by the LiF-like signals (centered at�204 ppm) present in all the spectra. Nevertheless, the presentdata indicate that the as-synthesized materials have the greatmajority of their fluorine incorporated into the bulk of their particles.
The electrochemical performance of the four compounds ina galvanostatic regime is shown in Fig. 3 for a range of voltagewindows and cycling rates. Fig. 3a shows that ST-LMVF20achieves 290 mA h g�1 (781 W h kg�1) on the first discharge
Fig. 2 Fluorine integration into disordered rocksalt Li–Mn–V–O–F cathodes. (a) STEM/EDS mapping of the elemental distribution in a representativeparticle of as-synthesized ST-LMVF20. (b) 19F frequency-stepping spectra obtained for the as-synthesized ST-, MR- and LR-LMVF20 cathode materialsby summing over seven spin echo sub-spectra acquired at different excitation frequencies. The sum spectra have been scaled according to the numberof scans used in the experiments and the molar amount of sample in the rotors. For comparison, 19F spin echo spectra collected for LiF powder and withan empty rotor (to measure the probe background signal) are overlaid. The shoulder observed to the left of the most intense peak in the LMVF20 spectra,at ca. �163 ppm, is ascribed to the probe background signal. Spinning sidebands of the sharp, LiF-like signals are indicated with asterisks.
Paper Energy & Environmental Science
Ope
n A
cces
s A
rtic
le. P
ublis
hed
on 2
4 M
ay 2
018.
Dow
nloa
ded
on 7
/11/
2018
4:5
5:06
PM
. T
his
artic
le is
lice
nsed
und
er a
Cre
ativ
e C
omm
ons
Attr
ibut
ion-
Non
Com
mer
cial
3.0
Unp
orte
d L
icen
ce.
View Article Online

This journal is©The Royal Society of Chemistry 2018 Energy Environ. Sci.
within a voltage window of 1.5–4.6 V, and 317 mA h g�1
(862 W h kg�1) within 1.5–4.8 V, with good rate performanceas evidenced in Fig. 3b. The capacity retention shown in Fig. 3cfor ST-LMVF20 cycled between 1.5 V and 4.2 V, 4.6 V, or 4.8 Vreveals generally reversible performance, especially when thecharge is limited to 4.2 V. Analogous to the performanceof previously-reported Mn2+/4+-based compounds,21 the secondcharge voltage curve is similar to subsequent charges, withminimal changes to the voltage profile after the first discharge,indicating highly reversible performance. The three remainingcompounds perform similarly, with the first-cycle dischargefrom 4.6 V yielding 303 mA h g�1 (799 W h kg�1) for ST-LMVO,284 mA h g�1 (746 W h kg�1) for MR-LMVF20, and 296 mA h g�1
(786 W h kg�1) for LR-LMVF20. The four compounds also havesimilar voltage profiles, as shown in Fig. 3d, despite variationsin the composition and theoretical capacity (see ESI,† Fig. S4for complete electrochemical data). Nonetheless, while all fourcompounds yield high reversible capacity and energy density,their capacities are somewhat below theoretical.
The difference between the observed and theoretical capacitiesof the four compounds, tabulated in Fig. 3e, lends insight to someof the mechanisms limiting performance. In this analysis, theLi theoretical capacity is based on the Li content of eachcomposition, while the transition metal (TM) theoretical capacityis based on the total capacity of the Mn2+/4+ and V4+/5+ couples.While the first-charge Coulombic efficiency is similar in allfour cases, the fraction of theoretical capacity achieved on thefirst-charge depends strongly on the Li content and the fluorination
level. Fluorination increases both Li and transition metal theoreticalcapacity from ST-LMVO to ST-LMVF20, but a smaller fraction ofthis capacity can be obtained on the first-charge. Increasing thetransition metal content in ST-LMVF20 to obtain MR-LMVF20lowers the theoretical capacity and leaves the fraction oftheoretical capacity obtained unchanged, suggesting thatthe capacity is not limited by the accessibility of transitionmetal redox couples. High-temperature galvanostatic cycling ofST-LMVF20 within the same 1.5–4.6 V voltage window, shownin ESI,† Fig. S5, does not yield an increase in long-termreversible capacity or a decrease in polarization, suggestingthat the performance is not limited by Li transport kinetics.However, moving to the LR-LMVF20 Li-rich composition bringsthe observed capacity much closer to the theoretical value. Puttogether, these trends indicate that the limit on the performance ofthese compounds is not related to the accessibility of transitionmetal redox or kinetic features, leaving the distribution of Li siteenergies in the disordered compounds as the most probableexplanation for the observed sub-theoretical capacity.
Redox mechanism
To resolve the oxidation mechanism of ST-LMVF20, we rely on acombination of density functional theory (DFT) and ex situ hardand soft X-ray absorption spectroscopy (XAS). The evolution oftransition metal oxidation states, as computed from DFT, can beseen in Fig. 4a for Li1.166�xMn0.333V0.500O1.833F0.166, a compositionrepresentative of the ST-LMVF20 compound. The calculationssuggest an initial mixed population of Mn2+, Mn3+, V3+ and V4+
Fig. 3 Electrochemical characterization of disordered rocksalt Li–Mn–V–O–F cathodes. (a) Galvanostatic charge/discharge voltage profiles ofST-LMVF20, taken for the first five cycles in a 1.5 V to 4.6 V or 4.8 V voltage window. (b) Rate performance of ST-LMVF20 for charge/discharge cyclesstarting at 10 mA g�1 and increasing to 1000 mA g�1. (c) Capacity retention in ST-LMFV20 over repeated charge/discharge cycles in a 1.5 V to 4.6 V or4.8 V voltage window. (d and e) Comparison of first charge/discharge voltage profiles between ST-LMVF20, ST-LMVO, MR-LMVF20, and LR-LMVF20, andobtained capacity in relation to the theoretical Li and transition metal capacity for each compound as described in the main text.
Energy & Environmental Science Paper
Ope
n A
cces
s A
rtic
le. P
ublis
hed
on 2
4 M
ay 2
018.
Dow
nloa
ded
on 7
/11/
2018
4:5
5:06
PM
. T
his
artic
le is
lice
nsed
und
er a
Cre
ativ
e C
omm
ons
Attr
ibut
ion-
Non
Com
mer
cial
3.0
Unp
orte
d L
icen
ce.
View Article Online

Energy Environ. Sci. This journal is©The Royal Society of Chemistry 2018
due to partial charge transfer from Mn2+ to V4+, achieving asimilar electronic configuration of V as seen in the classicdisordered rocksalt Li3V2O5 compound.7 As Li is extracted fromthe structure from x = 0 to x = 0.166, the population of V3+
decreases rapidly while that of V4+ increases, indicating V3+/4+
oxidation. Between x = 0.166 and x = 0.666 the population of V5+
begins to increase at the expense of V4+, with minor changes inthe Mn oxidation states, indicating that in this region V oxidationto V5+ provides the majority of electronic capacity, with minorcontributions from Mn2+/3+ oxidation. Between x = 0.666 andx = 0.916, the population of Mn3+ rapidly increases at the expenseof Mn2+, indicating the onset of dominant Mn2+/3+ oxidation,while from x = 0.916 to x = 1.08, Mn3+ begins to oxidize to Mn4+.However, the oxidation of Mn to Mn4+ does not go to completion.For 1.08 o x o 1.166 (V 4 4.5 V), oxygen begins to be oxidizedpreferentially to Mn3+, indicating oxygen redox. The very top ofthe charge involves the extraction of Li from environments inwhich F is coordinated only by Li, resulting in a highly unstablecharge configuration and a voltage above 6 V.
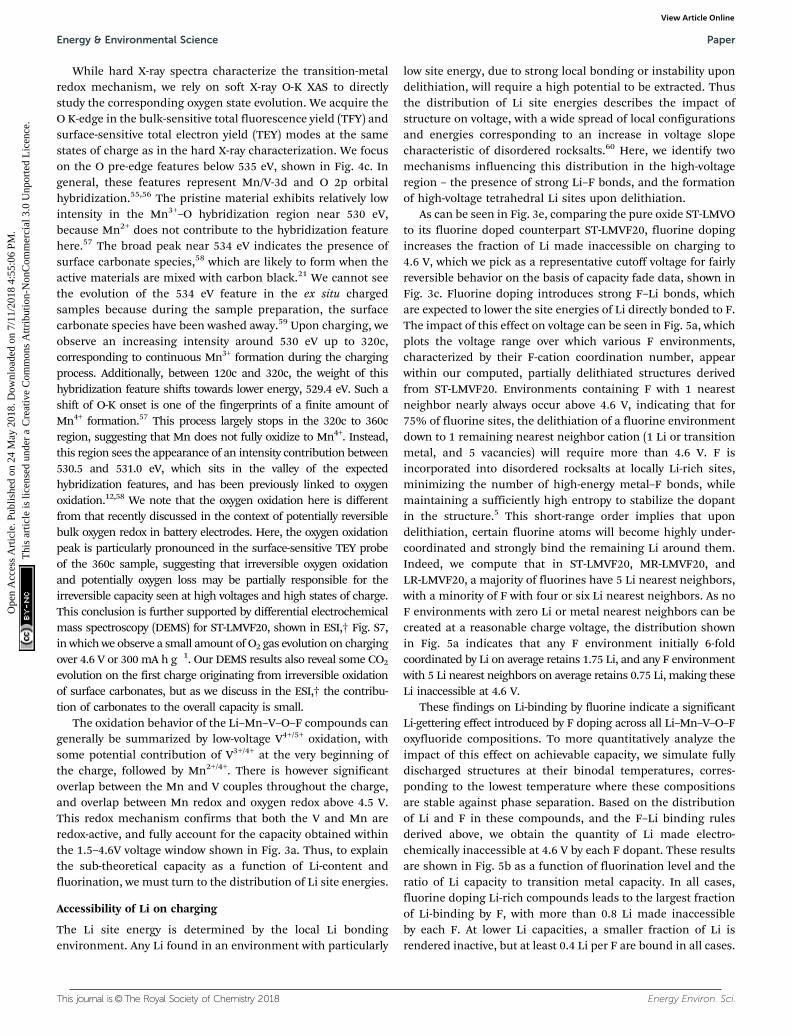
The delithiation behavior of ST-LMVF20 as measured byex situ hard and soft X-ray absorption spectroscopy (XAS)supports the oxidation mechanism obtained from DFT. Weinvestigate the oxidation behavior during the first cycle, bystudying samples obtained upon reaching 120 mA h g�1
(‘‘120c’’), 240 mA h g�1 (‘‘240c’’), 320 mA h g�1 (‘‘320c’’), and360 mA h g�1 (‘‘360c’’) charge capacity at a rate of 10 mA h g�1,as well the as-synthesized material (‘‘pristine’’) as shown inESI,† Fig. S6. Based on the X-ray absorption near edge structure(XANES) at the Mn K-edge and V K-edge shown in Fig. 4b, weconfirm that both Mn and V in this compound are redox activewith significant overlap between the redox couples, as indicatedby their K-edge position in relation to binary standards.53,54 Asthe pristine material is charged to 120c, the V edge shifts from aposition close to that of V4+, to one between V4+ and V5+, whilethe Mn edge moves slightly away from that of Mn2+, indicatingdominant V oxidation with a small amount of Mn activity.Charging from 120c to 320c, corresponding to B4.6 V, the MnK-edge moves beyond the position characteristic for Mn3+ to anintermediate oxidation state between Mn3+ and Mn4+, indicatingthat while Mn redox is activated at high voltage, Mn does notreach Mn4+ even at 4.6 V. In this segment of the charge, based onthe V pre-edge in the 5467–5471 eV region, V continues to oxidizecloser to V5+, consistent with dominant Mn oxidation with minorcontribution from V. Upon further charging to 360c, both Mn andV are further oxidized towards Mn4+ and V5+ respectively, althoughwe cannot quantitatively determine whether or not eithertransition metal reaches its maximal oxidation state in thisgenerally irreversible region of the charge.
Fig. 4 Oxidation mechanism for the stoichiometric Li1.171Mn0.343V0.486O1.8F0.2 (ST-LMVF20) compound. (a) Computed voltage profile and evolution ofMn and V oxidation states computed from DFT, denoting the dominant source of electron capacity at each stage of delithiation, where we useLi1.166Mn0.333V0.5O1.833F0.166 as a representative composition for ST-LMVF20. (b) XANES at the V and Mn K-edge and (c) soft XAS at the O K-edge forST-LMVF20 at various states of charge within the first cycle.
Paper Energy & Environmental Science
Ope
n A
cces
s A
rtic
le. P
ublis
hed
on 2
4 M
ay 2
018.
Dow
nloa
ded
on 7
/11/
2018
4:5
5:06
PM
. T
his
artic
le is
lice
nsed
und
er a
Cre
ativ
e C
omm
ons
Attr
ibut
ion-
Non
Com
mer
cial
3.0
Unp
orte
d L
icen
ce.
View Article Online
This journal is©The Royal Society of Chemistry 2018 Energy Environ. Sci.
While hard X-ray spectra characterize the transition-metalredox mechanism, we rely on soft X-ray O-K XAS to directlystudy the corresponding oxygen state evolution. We acquire theO K-edge in the bulk-sensitive total fluorescence yield (TFY) andsurface-sensitive total electron yield (TEY) modes at the samestates of charge as in the hard X-ray characterization. We focuson the O pre-edge features below 535 eV, shown in Fig. 4c. Ingeneral, these features represent Mn/V-3d and O 2p orbitalhybridization.55,56 The pristine material exhibits relatively lowintensity in the Mn3+–O hybridization region near 530 eV,because Mn2+ does not contribute to the hybridization featurehere.57 The broad peak near 534 eV indicates the presence ofsurface carbonate species,58 which are likely to form when theactive materials are mixed with carbon black.21 We cannot seethe evolution of the 534 eV feature in the ex situ chargedsamples because during the sample preparation, the surfacecarbonate species have been washed away.59 Upon charging, weobserve an increasing intensity around 530 eV up to 320c,corresponding to continuous Mn3+ formation during the chargingprocess. Additionally, between 120c and 320c, the weight of thishybridization feature shifts towards lower energy, 529.4 eV. Such ashift of O-K onset is one of the fingerprints of a finite amount ofMn4+ formation.57 This process largely stops in the 320c to 360cregion, suggesting that Mn does not fully oxidize to Mn4+. Instead,this region sees the appearance of an intensity contribution between530.5 and 531.0 eV, which sits in the valley of the expectedhybridization features, and has been previously linked to oxygenoxidation.12,58 We note that the oxygen oxidation here is differentfrom that recently discussed in the context of potentially reversiblebulk oxygen redox in battery electrodes. Here, the oxygen oxidationpeak is particularly pronounced in the surface-sensitive TEY probeof the 360c sample, suggesting that irreversible oxygen oxidationand potentially oxygen loss may be partially responsible for theirreversible capacity seen at high voltages and high states of charge.This conclusion is further supported by differential electrochemicalmass spectroscopy (DEMS) for ST-LMVF20, shown in ESI,† Fig. S7,in which we observe a small amount of O2 gas evolution on chargingover 4.6 V or 300 mA h g�1. Our DEMS results also reveal some CO2
evolution on the first charge originating from irreversible oxidationof surface carbonates, but as we discuss in the ESI,† the contribu-tion of carbonates to the overall capacity is small.
The oxidation behavior of the Li–Mn–V–O–F compounds cangenerally be summarized by low-voltage V4+/5+ oxidation, withsome potential contribution of V3+/4+ at the very beginning ofthe charge, followed by Mn2+/4+. There is however significantoverlap between the Mn and V couples throughout the charge,and overlap between Mn redox and oxygen redox above 4.5 V.This redox mechanism confirms that both the V and Mn areredox-active, and fully account for the capacity obtained withinthe 1.5–4.6V voltage window shown in Fig. 3a. Thus, to explainthe sub-theoretical capacity as a function of Li-content andfluorination, we must turn to the distribution of Li site energies.
Accessibility of Li on charging
The Li site energy is determined by the local Li bondingenvironment. Any Li found in an environment with particularly
low site energy, due to strong local bonding or instability upondelithiation, will require a high potential to be extracted. Thusthe distribution of Li site energies describes the impact ofstructure on voltage, with a wide spread of local configurationsand energies corresponding to an increase in voltage slopecharacteristic of disordered rocksalts.60 Here, we identify twomechanisms influencing this distribution in the high-voltageregion – the presence of strong Li–F bonds, and the formationof high-voltage tetrahedral Li sites upon delithiation.
As can be seen in Fig. 3e, comparing the pure oxide ST-LMVOto its fluorine doped counterpart ST-LMVF20, fluorine dopingincreases the fraction of Li made inaccessible on charging to4.6 V, which we pick as a representative cutoff voltage for fairlyreversible behavior on the basis of capacity fade data, shown inFig. 3c. Fluorine doping introduces strong F–Li bonds, whichare expected to lower the site energies of Li directly bonded to F.The impact of this effect on voltage can be seen in Fig. 5a, whichplots the voltage range over which various F environments,characterized by their F-cation coordination number, appearwithin our computed, partially delithiated structures derivedfrom ST-LMVF20. Environments containing F with 1 nearestneighbor nearly always occur above 4.6 V, indicating that for75% of fluorine sites, the delithiation of a fluorine environmentdown to 1 remaining nearest neighbor cation (1 Li or transitionmetal, and 5 vacancies) will require more than 4.6 V. F isincorporated into disordered rocksalts at locally Li-rich sites,minimizing the number of high-energy metal–F bonds, whilemaintaining a sufficiently high entropy to stabilize the dopantin the structure.5 This short-range order implies that upondelithiation, certain fluorine atoms will become highly under-coordinated and strongly bind the remaining Li around them.Indeed, we compute that in ST-LMVF20, MR-LMVF20, andLR-LMVF20, a majority of fluorines have 5 Li nearest neighbors,with a minority of F with four or six Li nearest neighbors. As noF environments with zero Li or metal nearest neighbors can becreated at a reasonable charge voltage, the distribution shownin Fig. 5a indicates that any F environment initially 6-foldcoordinated by Li on average retains 1.75 Li, and any F environmentwith 5 Li nearest neighbors on average retains 0.75 Li, making theseLi inaccessible at 4.6 V.
These findings on Li-binding by fluorine indicate a significantLi-gettering effect introduced by F doping across all Li–Mn–V–O–Foxyfluoride compositions. To more quantitatively analyze theimpact of this effect on achievable capacity, we simulate fullydischarged structures at their binodal temperatures, corres-ponding to the lowest temperature where these compositionsare stable against phase separation. Based on the distributionof Li and F in these compounds, and the F–Li binding rulesderived above, we obtain the quantity of Li made electro-chemically inaccessible at 4.6 V by each F dopant. These resultsare shown in Fig. 5b as a function of fluorination level and theratio of Li capacity to transition metal capacity. In all cases,fluorine doping Li-rich compounds leads to the largest fractionof Li-binding by F, with more than 0.8 Li made inaccessibleby each F. At lower Li capacities, a smaller fraction of Li isrendered inactive, but at least 0.4 Li per F are bound in all cases.
Energy & Environmental Science Paper
Ope
n A
cces
s A
rtic
le. P
ublis
hed
on 2
4 M
ay 2
018.
Dow
nloa
ded
on 7
/11/
2018
4:5
5:06
PM
. T
his
artic
le is
lice
nsed
und
er a
Cre
ativ
e C
omm
ons
Attr
ibut
ion-
Non
Com
mer
cial
3.0
Unp
orte
d L
icen
ce.
View Article Online

Energy Environ. Sci. This journal is©The Royal Society of Chemistry 2018
This trend is consistent with the relatively stronger 19F-NMRsignal obtained for the Li-rich compound, indicating a greaterfraction of F with 6 nearest-neighbor Li in LR-LMVF20, ascompared to ST- and MR-LMVF20. The increase in Li-getteringby F at higher Li-excess levels indicates that fluorine doping maynot increase Li capacity within a given voltage window even inthe case where fluorine incorporates into the bulk lattice, eventhough fluorination is beneficial for other properties such asstability on cycling and obtainable metal-redox capacity.5,6,21
Thus, in broad terms, in a disordered rocksalt oxyfluoride material,one may expect a reduction in accessible Li capacity equal to 0.4–0.8Li per F in the discharged cathode material.
While the effect of F in limiting delithiation explains thetrend in accessible capacity between ST-LMVO and ST-LMVF20,it cannot explain the sub-theoretical capacity of ST-LMVO,where no F is present, or LR-LMVF20, where there is sufficientLi-excess even accounting for F–Li binding. One additionaldescription of the Li site energy distribution is the Li-anioncoordination number, shown in Fig. 5c as a function of voltagefor computed structures obtained from the delithiation ofST-LMVF20. The distribution of Li-anion coordination numbersreveals a significant population of tetrahedral Li environmentsforming above 4 V, with nearly all Li remaining in the structure
above 4.5 V existing in a tetrahedral environment. The formationof tetrahedral Li is a structural relaxation which necessarily lowersthe Li site energy. Indeed, tetrahedral Li has been previouslycorrelated to a significant increase in extraction voltage.61,62 Directlyassessing the voltage of tetrahedral Li from the data shown in Fig. 5cis not straightforward, as it is the extraction potential of tetrahedralLi that is of interest, rather than the voltage at which it initiallyforms. Nonetheless, the consistent increase in tetrahedral Li as afraction of total Li remaining in the material up to 4.5 V indicatesthat tetrahedral Li is the least likely to be extracted, meaning it hasthe lowest Li site energy and highest extraction potential.
We compute the population of tetrahedral Li expected toform during charge for a range of Li–Mn–V–O–F compositions,shown in Fig. 5d. In this analysis, we assume that tetrahedral Liforms from an adjacent octahedral Li during delithiation whenthe tetrahedral site is surrounded by 3 cation vacancies. Thus,any Li-conductive ‘‘0-TM’’ channel may create a single tetrahedralLi upon charge.60 Based on the distribution shown in Fig. 5d,16% of the Li in ST-LMVO could be expected to move to atetrahedral site. As shown in Fig. 3e, 10% of Li in ST-LMVO isinaccessible up to 4.6 V, suggesting that approximately 60% oftetrahedral Li lies at a potential exceeding 4.6 V. Furthermore, asfluorine content increases, the total fraction of Li expected to
Fig. 5 Electrochemical accessibility of Li in disordered rocksalt Li–Mn–V–O–F cathodes. (a and c) Distribution of F-cation and Li-anion environments bycoordination number, among simulated partially charged structures derived from ST-LMVF20, according to the voltage at which they appear. (b) Averageamount of Li made inaccessible up to 4.6 V by high-voltage F-binding as a function of fluorination level and Li capacity with respect to transition metalcapacity. Here, ‘‘stoichiometric’’ means Li capacity (x) equals transition metal capacity (2a + b), while 20% Li-rich and TM-rich refer to compositions withexcess Li or TM capacity (x = 1.2(2a + b) and x = 0.8(2a + b) respectively). (d) Expected fraction of Li to move to a tetrahedral site during charge.(e) Predicted first-charge capacity among low-F mixed Mn/V oxyfluorides, accounting for Li made inaccessible by F binding and tetrahedral Li formation,showing good agreement with observed performance and a new high-capacity composition, LR-LMVO. (f) Galvanostatic voltage profile of the LR-LMVOcompound over five charge/discharge cycles.
Paper Energy & Environmental Science
Ope
n A
cces
s A
rtic
le. P
ublis
hed
on 2
4 M
ay 2
018.
Dow
nloa
ded
on 7
/11/
2018
4:5
5:06
PM
. T
his
artic
le is
lice
nsed
und
er a
Cre
ativ
e C
omm
ons
Attr
ibut
ion-
Non
Com
mer
cial
3.0
Unp
orte
d L
icen
ce.
View Article Online

This journal is©The Royal Society of Chemistry 2018 Energy Environ. Sci.
move to a tetrahedral site increases, exacerbating the capacityloss due to tetrahedral Li. The origin of this trend is two-fold.First, fluorine-induced segregation of Li into Li-rich environ-ments increases the population of ‘‘0-TM’’ channels susceptibleto the tetrahedral transformation. Second, in the compositionsmapped in Fig. 5b, higher fluorine content necessarily corre-sponds to a higher overall fraction of Li on the cation sublattice,further increasing the population of ‘‘0-TM’’ environments. Thus,as both Li-excess and LiF incorporation increase the fraction oftetrahedral Li, the limit on accessible Li capacity due to theformation of tetrahedral Li presents an important constraint forcomposition optimization. In broad terms, one may expect thatthe formation of tetrahedral Li will result in a 10–12% reductionin accessible Li capacity with respect to the total Li content of thedischarged cathode.
The combined effects of F–Li-gettering and tetrahedral Liformation yield a new map of accessible charge capacities inthe Li–Mn–V–O–F space, shown in Fig. 5e by analogy to Fig. 1a.The computed first-charge capacities for ST-LMVO, ST-LMVF20,MR-LMVF20, and LR-LMVF20 match closely to those observedexperimentally. The phase diagram shown in Fig. 5e suggeststhat a new composition, Li1.2Mn0.2V0.6O2 (LR-LMVO), mayexhibit high first-cycle capacity and fully realize its theoreticaltransition metal capacity. Synthesizing and electrochemicallycharacterizing this compound, we confirm that LR-LMVO achieves312 mA h g�1 (824 W h kg�1) within a 1.5–4.6 V voltage windowwith good reversibility similar to that of the other compoundsdescribed here, as can be seen in Fig. 5f in comparison to itstheoretical transition metal capacity (327 mA h g�1). Detailedcharacterization and electrochemical data for this compound areavailable in the ESI.†
The mechanisms governing accessible Li capacity in theLi–Mn–V–O–F space derived here suggest general rules for theoptimization of oxyfluoride disordered rocksalt cathodes.Fluorination is an efficient route for introducing Li-excess, whichis necessary for both Li percolation in disordered rocksalts, andhigh Li capacity. Fluorine doping has also been reported to reduceoxygen loss, improve capacity retention,6 and increase transitionmetal oxidation potential through the inductive effect.21 As shownhere, fluorine also increases the extraction voltage of Li by stronglybinding some of the Li directly bonded to F. This trend rationalizesthe behavior of previously reported oxyfluorides, with between0.2 and 0.4 Li reported to be inaccessible at moderate voltagesin Li2VO2F, even when starting from an as-synthesized VO2Fendpoint.18,63 The formation of tetrahedral Li upon delithiationfurther affects the voltage profile of a disordered rocksalt byincreasing the extraction potential of Li at high states of charge.The impact of fluorine and tetrahedral Li on the voltage profileare linked but can still be controlled independently, yieldingseveral handles which can be used to engineer the energydensity of a disordered rocksalt cathode.
Conclusion
In this work, we have introduced a set of design principles forhigh-capacity disordered rocksalt cathodes relying on only
reversible transition-metal redox. By combining the active Mn2+/4+
and V4+/5+ couples, as well as fluorination, we have removed allredox-inactive metal species, maximizing the specific energy densitygranted by transition metal redox. We demonstrated the selection ofoptimized, synthetically-accessible compositions based on acomputed, finite-temperature phase diagram of the oxyfluoridealloy system. Next, we solved the oxidation mechanism of themixed Mn2+/V4+ system, confirming the compatibility and acces-sibility of these redox couples. Finally, we identified fundamen-tal mechanisms determining the observable Li capacity within agiven voltage window based on a gettering effect of fluorinedopants, and the formation of high-voltage tetrahedral Li fromthe delithiation of ‘‘0-TM’’ environments. From these mechanisms,we conclude that in a disordered rocksalt cathode material, 10–12%of the total Li present is inaccessible at moderate voltages due to theformation of tetrahedral Li, and in oxyfluorides, 0.4–0.8 Li per F isinaccessible due to strong Li–F binding. The design rules identifiedhere for maximizing electronic and Li capacity provide novelconstraints on high-performing disordered rocksalt compositionsand enable a more targeted design and optimization of these typesof cathodes.
Author contributions
D. A. K., W. D. R. and G. C. planned the project. D. A. K. designedthe proposed compounds and performed computational analysiswith help from W. D. R., Z. L. synthesized, characterized (XRD),and electrochemically tested the proposed compounds with helpfrom H. J. and J. L. R. J. C. acquired and analyzed NMR data. M. B.acquired and analyzed hard XAS data. D.-H. K. acquired andanalyzed TEM data. K. D. and W. Y. performed soft-XAS measure-ments and analyzed data with D. A. K. and Z. L., J. K. P. and B. D.M. acquired and analyzed DEMS data. T. L. acquired SEM data. G.C. supervised all aspects of the research. The manuscript waswritten by D. A. K. and revised by Z. L., R. J. C. and G. C. with thehelp of all other authors. All authors contributed to the discussion.
Conflicts of interest
There are no conflicts of interest to declare.
Acknowledgements
This work was supported by the NSF Software Infrastructure forSustained Innovation (SI2-SSI) Collaborative Research programof the National Science Foundation under Award No. OCI-1147503,the Robert Bosch Corporation and Umicore Specialty Oxides andChemicals, and the Assistant Secretary for Energy Efficiency andRenewable Energy, Office of Vehicle Technologies of the U.S.Department of Energy under Contract No. DE-AC02-05CH11231,Subcontract No. 7056411, under the Advanced Battery MaterialsResearch (BMR) Program. The computational analysis wasperformed using computational resources sponsored by theDepartment of Energy’s Office of Energy Efficiency and RenewableEnergy and located at the National Renewable Energy Laboratory,
Energy & Environmental Science Paper
Ope
n A
cces
s A
rtic
le. P
ublis
hed
on 2
4 M
ay 2
018.
Dow
nloa
ded
on 7
/11/
2018
4:5
5:06
PM
. T
his
artic
le is
lice
nsed
und
er a
Cre
ativ
e C
omm
ons
Attr
ibut
ion-
Non
Com
mer
cial
3.0
Unp
orte
d L
icen
ce.
View Article Online

Energy Environ. Sci. This journal is©The Royal Society of Chemistry 2018
as well computational resources provided by Extreme Science andEngineering Discovery Environment (XSEDE), which was sup-ported by National Science Foundation grant number ACI-1053575. The authors would like to acknowledge Dr JerryHu and the California NanoSystems Institute (CNSI) at theUniversity of California Santa Barbara (UCSB) for experimentaltime on the 500 MHz NMR spectrometer. The NMR experi-mental work reported here made use of the shared facilities ofthe UCSB MRSEC (NSF DMR 1720256), a member of the MaterialResearch Facilities Network. This research used resources of theAdvanced Photon Source, an Office of Science User Facility operatedfor the U.S. Department of Energy (DOE) Office of Science byArgonne National Laboratory, and was supported by the U.S. DOEunder Contract No. DE-AC02-06CH11357. This research also usedresources of the Advanced Light Source, which is a DOE Office ofScience User Facility under contract no. DE-AC02-05CH11231.
References
1 S. M. Whittingham, Chem. Rev., 2004, 104, 4271–4302.2 J. Lee, A. Urban, X. Li, D. Su, G. Hautier and G. Ceder,
Science, 2014, 343, 519–522.3 A. Urban, J. Lee and G. Ceder, Adv. Energy Mater., 2014,
4, 1400478.4 A. Urban, A. Abdellahi, S. Dacek, N. Artrith and G. Ceder,
Phys. Rev. Lett., 2017, 119, 176402.5 W. D. Richards, S. T. Dacek, D. A. Kitchaev and G. Ceder,
Adv. Energy Mater., 2018, 8, 1701533.6 J. Lee, J. K. Papp, R. J. Clement, S. Sallis, D.-H. Kwon, T. Shi,
W. Yang, B. D. McCloskey and G. Ceder, Nat. Commun.,2017, 8, 981.
7 C. Delmas, S. Brethes and M. Menetrier, J. Power Sources,1991, 34, 113–118.
8 J. Lee, D.-H. Seo, M. Balasubramanian, N. Twu, X. Li andG. Ceder, Energy Environ. Sci., 2015, 8, 3255–3265.
9 T. Matsuhara, Y. Tsuchiya, K. Yamanaka, K. Mitsuhara,T. Ohta and N. Yabuuchi, Electrochemistry, 2016, 84, 797–801.
10 R. Wang, X. Li, L. Liu, J. Lee, D.-H. Seo, S.-H. Bo, A. Urbanand G. Ceder, Electrochem. Commun., 2015, 60, 70–73.
11 N. Yabuuchi, M. Takeuchi, M. Nakayama, H. Shiiba, M. Ogawa,K. Nakayama, T. Ohta, D. Endo, T. Ozaki, T. Inamasu, K. Satoand S. Komaba, Proc. Natl. Acad. Sci. U. S. A., 2015, 112,7650–7655.
12 N. Yabuuchi, M. Nakayama, M. Takeuchi, S. Komaba,Y. Hashimoto, T. Mukai, H. Shiiba, K. Sato, Y. Kobayashi,A. Nakao, M. Yonemura, K. Yamanaka, K. Mitsuhara andT. Ohta, Nat. Commun., 2016, 7, 13814.
13 S. Hoshino, A. M. Glushenkov, S. Ichikawa, T. Ozaki, T. Inamasuand N. Yabuuchi, ACS Energy Lett., 2017, 2, 733–738.
14 M. Nakajima and N. Yabuuchi, Chem. Mater., 2017, 29,6927–6935.
15 N. Twu, X. Li, A. Urban, M. Balasubramanian, J. Lee, L. Liuand G. Ceder, Nano Lett., 2014, 15, 596–602.
16 S. L. Glazier, J. Li, J. Zhou, T. Bond and J. R. Dahn, Chem.Mater., 2015, 27, 7751–7756.
17 A. Kitajou, K. Tanaka, H. Miki, H. Koga, T. Okajima andS. Okada, Electrochemistry, 2016, 84, 597–600.
18 R. Chen, S. Ren, M. Knapp, D. Wang, R. Witter, M. Fichtnerand H. Hahn, Adv. Energy Mater., 2015, 5, 1401814.
19 R. Chen, S. Ren, X. Mu, E. Maawad, S. Zander, R. Hempelmannand H. Hahn, ChemElectroChem, 2016, 3, 892–895.
20 N. Takeda, S. Hoshino, L. Xie, S. Chen, I. Ikeuchi, R. Natsui,K. Nakura and N. Yabuuchi, J. Power Sources, 2017, 367, 122–129.
21 J. Lee, D. A. Kitchaev, D.-H. Kwon, C.-W. Lee, J. K. Papp,Y.-S. Liu, Z. Lun, R. J. Clement, T. Shi, B. D. McCloskey, J. Guo,M. Balasubramanian and G. Ceder, Nature, 2018, 556, 185.
22 A. R. Armstrong, M. Holzapfel, P. Novak, C. S. Johnson,S.-H. Kang, M. M. Thackeray and P. G. Bruce, J. Am. Chem.Soc., 2006, 128, 8694–8698.
23 S. Hy, H. Liu, M. Zhang, D. Qian, B.-J. Hwang andY. S. Meng, Energy Environ. Sci., 2016, 9, 1931–1954.
24 W. D. Richards, Y. Wang, L. J. Miara, J. C. Kim and G. Ceder,Energy Environ. Sci., 2016, 9, 3272–3278.
25 L. J. Nelson, G. L. W. Hart, F. Zhou and V. Ozolins, Phys. Rev.B: Condens. Matter Mater. Phys., 2013, 87, 035125.
26 G. Kresse and J. Furthmuller, Comput. Mater. Sci., 1996, 6, 15–50.27 G. Kresse and D. Joubert, Phys. Rev. B: Condens. Matter
Mater. Phys., 1999, 59, 1758–1775.28 J. P. Perdew, K. Burke and M. Ernzerhof, Phys. Rev. Lett.,
1996, 77, 3865–3868.29 L. Wang, T. Maxisch and G. Ceder, Phys. Rev. B: Condens.
Matter Mater. Phys., 2006, 73, 195107.30 A. Jain, G. Hautier, S. P. Ong, C. J. Moore, C. C. Fischer,
K. A. Persson and G. Ceder, Phys. Rev. B: Condens. MatterMater. Phys., 2011, 84, 045115.
31 J. Sun, A. Ruzsinszky and J. P. Perdew, Phys. Rev. Lett., 2015,115, 036402.
32 D. A. Kitchaev, H. Peng, Y. Liu, J. Sun, J. P. Perdew andG. Ceder, Phys. Rev. B, 2016, 93, 045132.
33 Y. Zhang, D. A. Kitchaev, J. Yang, T. Chen, S. T. Dacek,R. A. Sarmiento-Perez, M. A. Marques, H. Peng, G. Ceder,J. P. Perdew and J. Sun, npj Comput. Mater., 2018, 4, 9.
34 J. Heyd, G. E. Scuseria and M. Ernzerhof, J. Chem. Phys.,2003, 118, 8207–8215.
35 D.-H. Seo, A. Urban and G. Ceder, Phys. Rev. B: Condens.Matter Mater. Phys., 2015, 92, 115118.
36 S. P. Ong, W. D. Richards, A. Jain, G. Hautier, M. Kocher,S. Cholia, D. Gunter, V. L. Chevrier, K. A. Persson andG. Ceder, Comput. Mater. Sci., 2013, 68, 314–319.
37 M. T. Sananes, A. Tuel, J. C. Volta and G. J. Hutchings,J. Catal., 1994, 148, 395–398.
38 L. A. O’Dell, A. J. Rossini and R. W. Schurko, Chem. Phys.Lett., 2009, 468, 330–335.
39 A. J. Pell, R. J. Clement, C. P. Grey, L. Emsley and G. Pintacuda,J. Chem. Phys., 2013, 138, 114201.
40 D. Massiot, I. Farnan, N. Gautier, D. Trumeau, A. Trokinerand J. P. Coutures, Solid State Nucl. Magn. Reson., 1995, 4,241–248.
41 B. Ravel and M. Newville, J. Synchrotron Radiat., 2005, 12,537–541.
42 R. Qiao, et al., Rev. Sci. Instrum., 2017, 88, 033106.
Paper Energy & Environmental Science
Ope
n A
cces
s A
rtic
le. P
ublis
hed
on 2
4 M
ay 2
018.
Dow
nloa
ded
on 7
/11/
2018
4:5
5:06
PM
. T
his
artic
le is
lice
nsed
und
er a
Cre
ativ
e C
omm
ons
Attr
ibut
ion-
Non
Com
mer
cial
3.0
Unp
orte
d L
icen
ce.
View Article Online

This journal is©The Royal Society of Chemistry 2018 Energy Environ. Sci.
43 W. Yang, X. Liu, R. Qiao, P. Olalde-Velasco, J. D. Spear,L. Roseguo, J. X. Pepper, J. D. Denlinger and Z. Hussain,J. Electron Spectrosc. Relat. Phenom., 2013, 190, 64–74.
44 B. D. McCloskey, D. S. Bethune, R. M. Shelby, G. Girishkumarand A. C. Luntz, J. Phys. Chem. Lett., 2011, 2, 1161–1166.
45 B. D. McCloskey, R. Scheffler, A. Speidel, D. S. Bethune,R. M. Shelby and A. C. Luntz, J. Am. Chem. Soc., 2011, 133,18038–18041.
46 B. D. McCloskey, A. Speidel, R. Scheffler, D. C. Miller,V. Viswanathan, J. S. Hummelshøj, J. K. Nørskov and A. C.Luntz, J. Phys. Chem. Lett., 2012, 3, 997–1001.
47 V. Pralong, V. Gopal, V. Caignaert, V. Duffort and B. Raveau,Chem. Mater., 2011, 24, 12–14.
48 D. A. Kitchaev and G. Ceder, Nat. Commun., 2016, 7, 13799.49 H. J. Fecht, E. Hellstern, Z. Fu and W. L. Johnson, Metall.
Mater. Trans. A, 1990, 21, 2333–2337.50 J.-J. Kim, Y. Choi, S. Suresh and A. Argon, Science, 2002, 295,
654–657.51 M. Menetrier, J. Bains, L. Croguennec, A. Flambard,
E. Bekaert, C. Jordy, P. Biensan and C. Delmas, J. Solid StateChem., 2008, 181, 3303–3307.
52 L. Croguennec, J. Bains, M. Menetrier, A. Flambard, E. Bekaert,C. Jordy, P. Biensan and C. Delmas, J. Electrochem. Soc., 2009,156, A349–A355.
53 J. Wong, F. W. Lytle, R. P. Messmer and D. H. Maylotte,Phys. Rev. B: Condens. Matter Mater. Phys., 1984, 30, 5596.
54 A. Manceau, M. A. Marcus and S. Grangeon, Am. Mineral.,2012, 97, 816–827.
55 F. M. F. De Groot, M. Grioni, J. C. Fuggle, J. Ghijsen,G. A. Sawatzky and H. Petersen, Phys. Rev. B: Condens. MatterMater. Phys., 1989, 40, 5715.
56 H. Kurata, E. Lefevre, C. Colliex and R. Brydson, Phys. Rev. B:Condens. Matter Mater. Phys., 1993, 47, 13763.
57 R. Qiao, T. Chin, S. J. Harris, S. Yan and W. Yang, Curr. Appl.Phys., 2013, 13, 544–548.
58 R. Qiao, Y.-D. Chuang, S. Yan and W. Yang, PLoS One, 2012,7, e49182.
59 S. E. Renfrew and B. D. McCloskey, J. Am. Chem. Soc., 2017,139, 17853–17860.
60 A. Abdellahi, A. Urban, S. Dacek and G. Ceder, Chem. Mater.,2016, 28, 5373–5383.
61 J. Breger, Y. S. Meng, Y. Hinuma, S. Kumar, K. Kang, Y. Shao-Horn, G. Ceder and C. P. Grey, Chem. Mater., 2006, 18,4768–4781.
62 L. Croguennec and M. R. Palacin, J. Am. Chem. Soc., 2015,137, 3140–3156.
63 R. Chen, E. Maawad, M. Knapp, S. Ren, P. Beran, R. Witterand R. Hempelmann, RSC Adv., 2016, 6, 65112–65118.
Energy & Environmental Science Paper
Ope
n A
cces
s A
rtic
le. P
ublis
hed
on 2
4 M
ay 2
018.
Dow
nloa
ded
on 7
/11/
2018
4:5
5:06
PM
. T
his
artic
le is
lice
nsed
und
er a
Cre
ativ
e C
omm
ons
Attr
ibut
ion-
Non
Com
mer
cial
3.0
Unp
orte
d L
icen
ce.
View Article Online