design that’s easy on the brain
TRANSCRIPT
Design that’s easyon the brainRyan Coleman
FITC Spotlight UX/UI
March 7, 2015

Lead Technology Experience Strategist
Employee Technology Experience @ BMO

TECHNOLOGY
EXPERIENCE
DESIGN
VISUAL THINKING
Me.

White& Gold?
Black& Blue?

We see what our brain shows us.

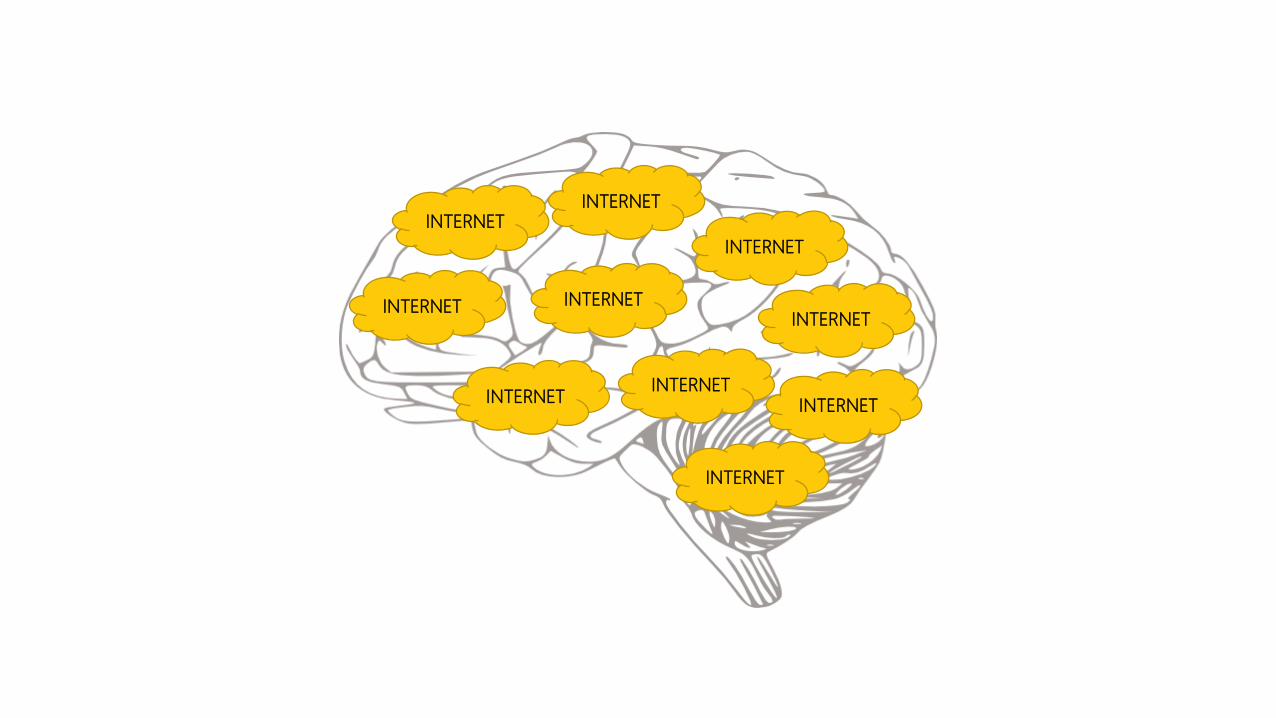
INTERNETINTERNET
INTERNET
INTERNET INTERNETINTERNET
INTERNETINTERNET
INTERNET
INTERNET


>


Design that’s easy on the brain?

... the goal of information design must be to
design displays so that visual queries are
processed both rapidly and correctly for
every important cognitive task the display is
intended to support.
Colin WareVisual Thinking for Design

... the goal of information design must be to
design displays so that visual queries are
processed both rapidly and correctly for
every important cognitive task the display is
intended to support.
Colin WareVisual Thinking for Design

Design for visual efficiency.

How We See

Photo: VictoriaPeckham (Flickr)

Let’s Try Something…


Approximate size of what’s in
focus at any given time.

Represents
about 5% of our
visual field…

Represents
about 5% of our
visual field…
… but uses HALF
of our visual
processing
power.


incurable_hippie (flickr)
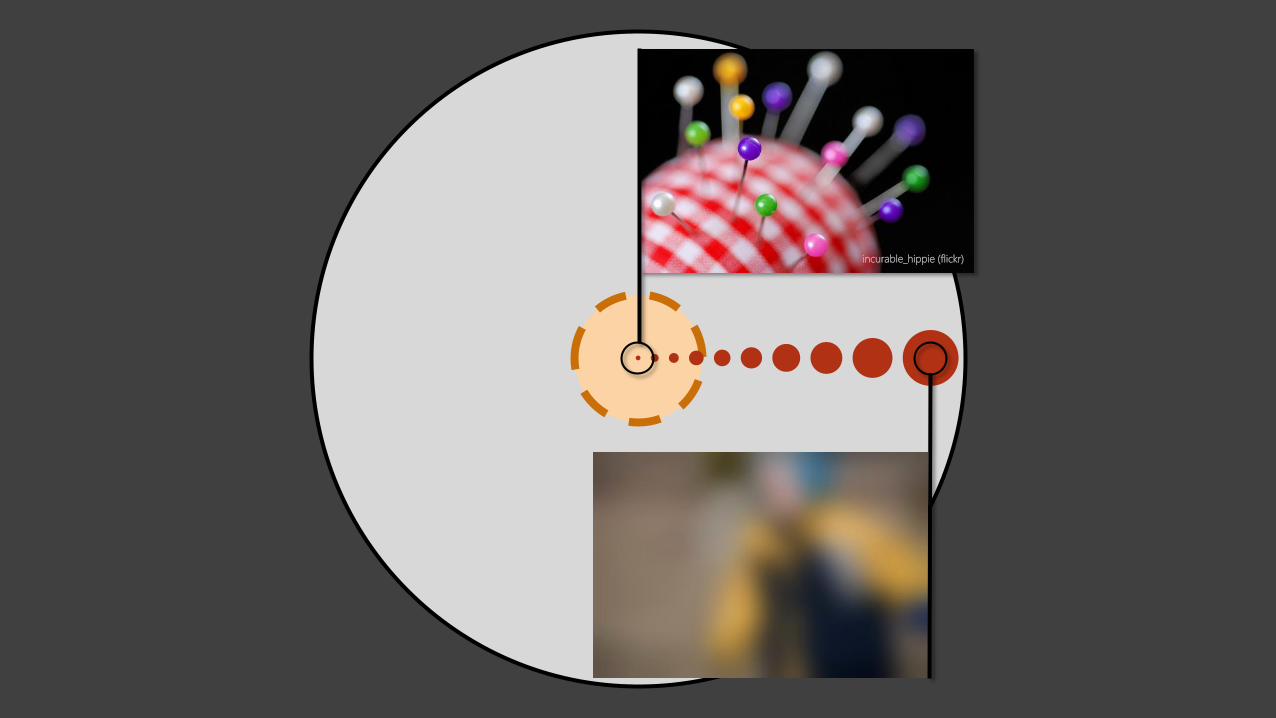
incurable_hippie (flickr)

Photo: VictoriaPeckham (Flickr)

We ‘see’ through visual queries

Dis
cove
ry
WHAT Atte
ntio
n
WHERE

Dis
cove
ry
WHAT
Processing
Visuals

Watch carefully…


?


?


?


Problem
Solving
Eye
Movements
Pattern
Testing
Based on illustration by Colin Ware, Visual Thinking for Design

We’re capable of rapidly
accessing complex patterns

We’re capable of rapidly
accessing complex patterns
but to comprehend them we
need to process them deeper.

Dis
cove
ry
WHAT Atte
ntio
n
WHERE

Atte
ntio
n
WHERE
Visual
Searching


Based on illustration by Colin Ware, Visual Thinking for Design
Pattern
Testing
Eye
Movement
Move and
Scan

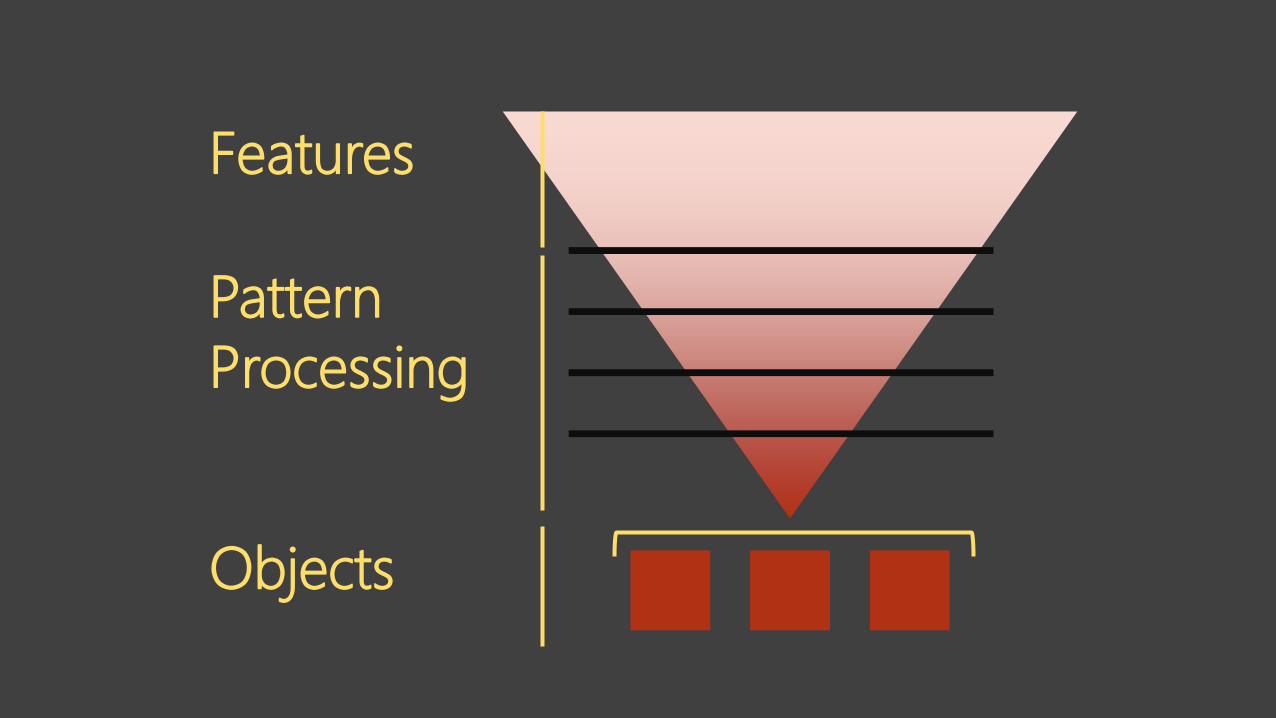
Features
Pattern
Processing
Objects

Colour
Orientation
Shape
Motion
Neurons are
tuned for
specific features


“Face”


Terminator 2 (1991)
Features
Pattern
Processing
Objects

Visual Working
Memory

Visual Working
Memory

Visual Working
Memory

Scott McCloudUnderstanding Comics

Photo: Gaetan Lee, Clip_Works, BaylorBear78, Chidorian, (Flickr)

Source: http://www.opticalillusion.net/
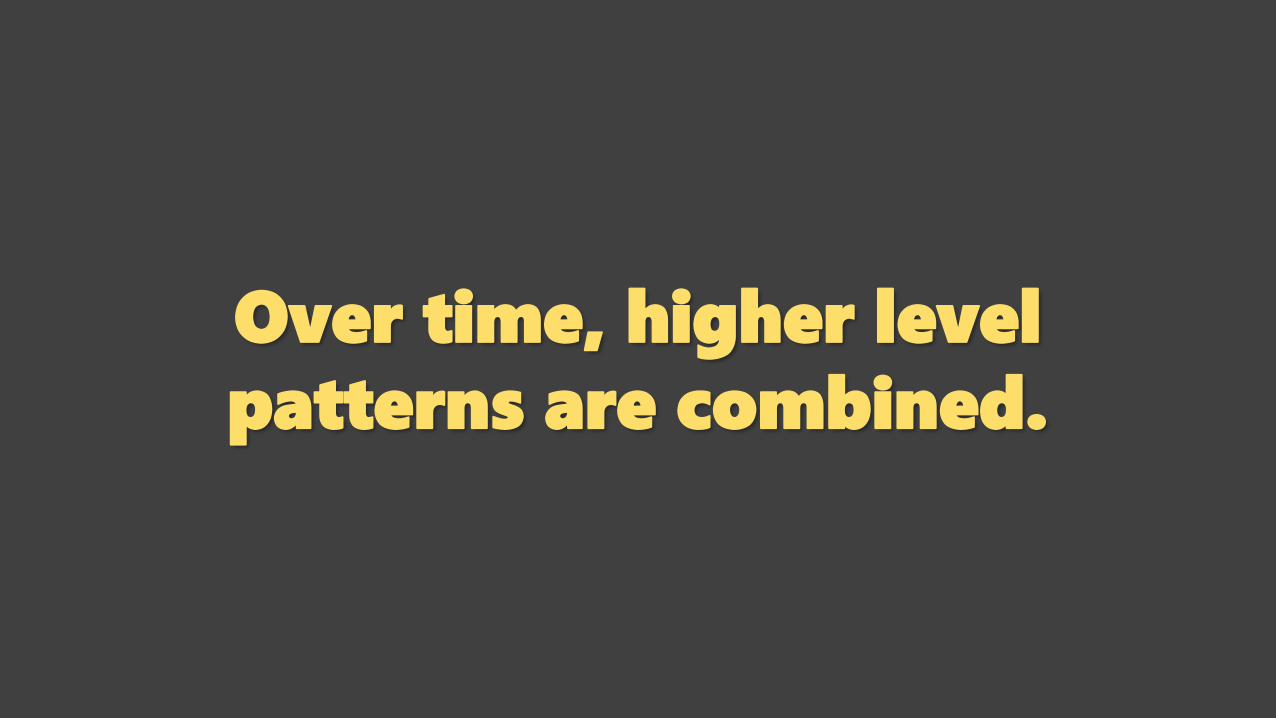
Over time, higher level
patterns are combined.

EYE FACE TIGER

Photo: thetruthabout, wootang01, dno1967, sylvar (Flickr)

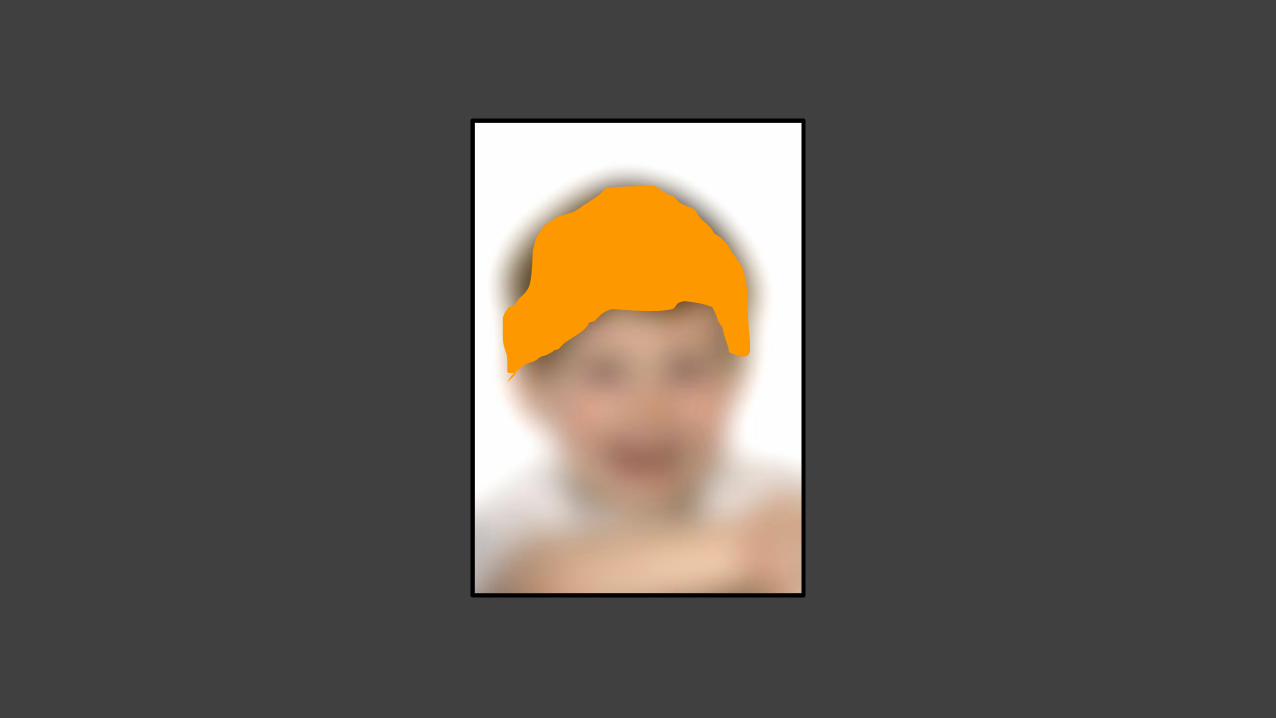
Oliver
Face
Kid
Person


Visual Efficiency
=

Visual Efficiency
=
Reducing Visual Searches

Cognitive Effort
vs.
“At-a-Glance”

Where’s Waldo
Example(Cognitively Difficult)


Great. Now what?

Make your designs POP.

Colour
Orientation
Shape
Motion
Neurons are
tuned for
specific features

Colour Proximity
MotionShape
4 Pop-out
Channels

Colour Proximity
MotionShape
4 Pop-out
Channels

Colour
HUE LIGHTNESS

Colour
HUE LIGHTNESS

Photo: Woodlywonderworks (Flickr)

Photo: Woodlywonderworks (Flickr)


A B C D E F G H I J K L M N O P Q R S T U V W X Y Z
A B C D E F G H I J K L M N O P Q R S T U V W X Y Z
A B C D E F G H I J K L M N O P Q R S T U V W X Y Z
A B C D E F G H I J K L M N O P Q R S T U V W X Y Z
A B C D E F G H I J K L M N O P Q R S T U V W X Y Z
A B C D E F G H I J K L M N O P Q R S T U V W X Y Z
Luminance Contrast

Ensure highest
contrast goes to the
emphasized elements

Ensure highest
contrast goes to the
emphasized elements

Colour Proximity
MotionShape
4 Pop-out
Channels

Shape
SIZEORIENTATION DISTORTION

Colour Proximity
MotionShape
4 Pop-out
Channels
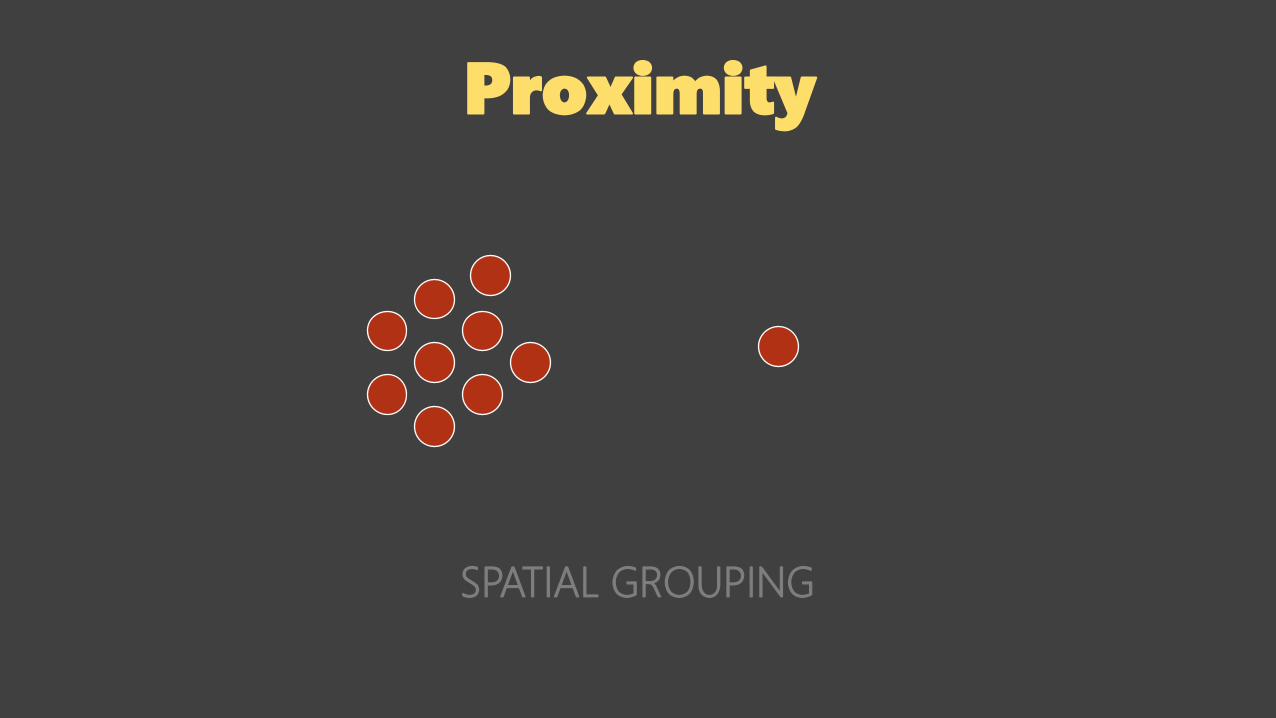
Proximity
SPATIAL GROUPING

SPATIAL GROUPING
Proximity

SPATIAL GROUPING
Proximity

Colour Proximity
MotionShape
4 Pop-out
Channels

Motion

Some advice:

Don’t Cross
the Streams!
Ghostbusters (1984)


Don’t be
subtle.

Avoid visual interference.

Word
Word
Word
Word
Word
WordImage: Pink Sherbet Photography (Flickr)
Word
Word
Word

Avoid multi-chunk queries.

0
1
2
3
4
5
6
Series 1
Series 2
Series 3
Series 4
Series 5

0
1
2
3
4
5
6
Series 1
Series 2
Series 3
Series 4
Series 5

Only show what you need to.

Dogs Cats Birds Horses
Percent of households owning 37.20% 32.40% 3.90% 1.80%
Number of households owning 43,021,000 37,460,000 4,453,000 2,087,000
Average number owned per household
1.7 2.2 2.5 3.5
Total number in United States 72,114,000 81,721,00011,199,00
07,295,000
Veterinary visits per household per year (mean)
2.6 1.7 0.3 2.2
Veterinary expenditure per household per year (mean)
$356 $190 $25 $360
Veterinary expenditure per animal (mean)
$200 $81 $9 $92
U.S. Pet Ownership
Source: American Veterinary Medical Association

0
5
10
15
20
25
30
35
40
Dogs Cats Birds Horses
Dogs Cats Birds Horses
Percent of households owning 37.20% 32.40% 3.90% 1.80%
Number of households owning 43,021,000 37,460,000 4,453,000 2,087,000
Average number owned per household
1.7 2.2 2.5 3.5
Total number in United States 72,114,000 81,721,00011,199,00
07,295,000
Veterinary visits per household per year (mean)
2.6 1.7 0.3 2.2
Veterinary expenditure per household per year (mean)
$356 $190 $25 $360
Veterinary expenditure per animal (mean)
$200 $81 $9 $92
U.S. Pet Ownership
(2007)
% o
f H
ouse
s O
wnin
g

0
5
10
15
20
25
30
35
40
Dogs Cats Birds Horses
U.S. Pet Ownership
% o
f H
ouse
s O
wnin
g

0
5
10
15
20
25
30
35
40
Dogs Cats Birds Horses
U.S. Pet Ownership
% o
f H
ouse
s O
wnin
g

0
5
10
15
20
25
30
35
40
Dogs
% of U.S. Houses With Dogs
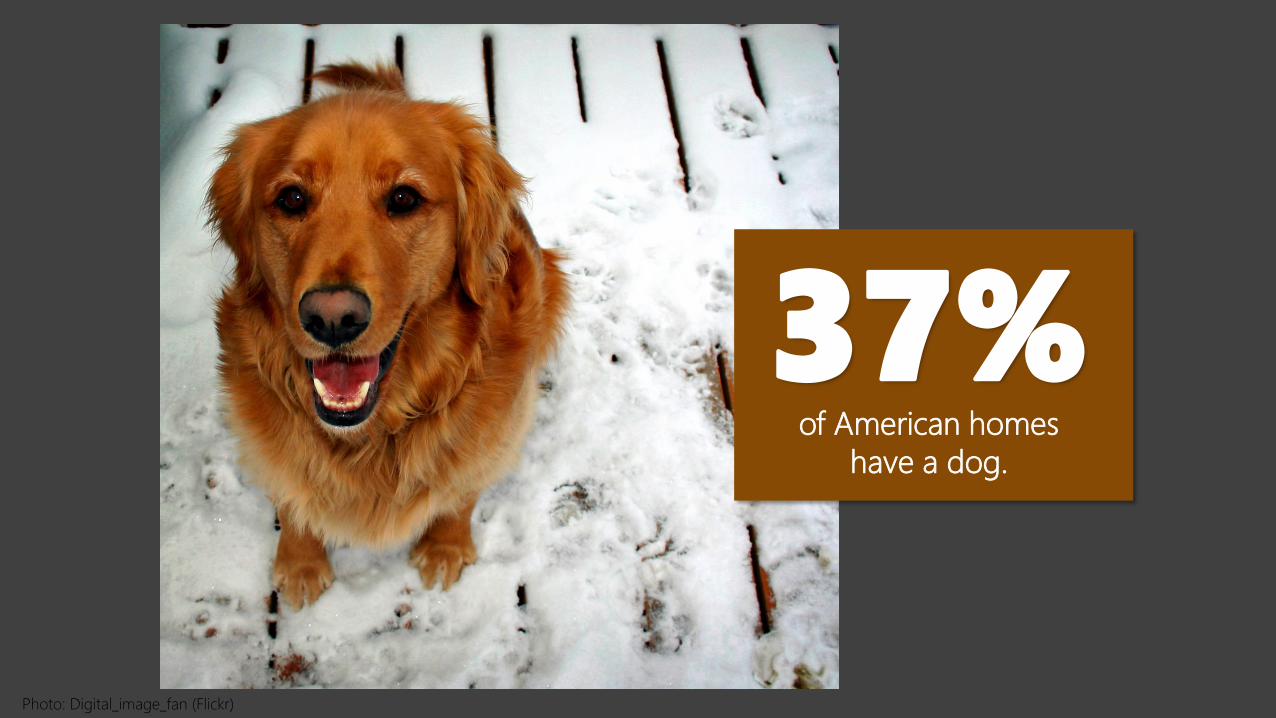
37%of American homes
have a dog.
Photo: Digital_image_fan (Flickr)

Visual search can
be primed / tuned.
Be consistent!

Don’t trust YOUR eyes.Photo: ndanger (Flickr)

In Summary:

Consider your
user’s visual
queries…

… design to satisfy
those queries as
efficiently as
possible.

Colour
Orientation
Shape
Motion
Use features
wisely to
Make it Pop!

Further Reading

Thank you.http://ryancoleman.ca
@ryancoleman