designing electrochemical energy storage microdevices: li
TRANSCRIPT

Designing Electrochemical Energy Storage Microdevices:
Li-Ion Batteries and Flexible Supercapacitors
von der Fakultät für Naturwissenschaften der Technischen Universität Chemnitz
genehmigte zur Erlangung des akademischen Grades
doctor rerum naturalium
(Dr. rer. nat.)
vorgelegt von: M.Eng. Wenping Si 司文平
geboren am: August 16, 1986 in Shandong, China
eingereicht am: October 27, 2014
Gutachter: Prof. Dr. Prof. h.c. Oliver G. Schmidt
Prof. Dr. Yongfeng Mei
Tag der Verteidigung: 22 Januar, 2015
Die Dissertation wurde in der Zeit von Oktober 2010 bis September 2014 am IFW Dresden
gefördert durch den International Reseach Training Group (IRTG) und IFW angefertigt.


Bibliographische Beschreibung
Wenping Si
Designing Electrochemical Energy Storage Micro-devices: Li-Ion Batteries and Flexible Supercapacitors
Dissertation (in englischer Sprache)
104 Seiten, 43 Abbildungen, 3 Tabellen, 172 Literaturverweise
Referat
Die Menschheit steht vor der großen Herausforderung der Energieversorgung des 21. Jahrhundert.
Nirgendwo ist diese noch dringlicher geworden als im Bereich der Energiespeicherung und Umwandlung.
Konventionelle Energie kommt hauptsächlich aus fossilen Brennstoffen, die auf der Erde nur begrenzt
vorhanden sind, und hat zu einer starken Belastung der Umwelt geführt. Zusätzlich nimmt der
Energieverbrauch weiter zu, insbesondere durch die rasante Verbreitung von Fahrzeugen und
verschiedener Kundenelektronik wie PCs und Mobiltelefone. Alternative Energiequellen sollten vor einer
Energiekrise entwickelt werden. Die Gewinnung erneuerbarer Energie aus Sonne und Wind sind auf
jeden Fall sehr wichtig, aber diese Energien sind oft nicht gleichmäßig und andauernd vorhanden.
Energiespeichervorrichtungen sind daher von großer Bedeutung, weil sie für eine Stabilisierung der
umgewandelten Energie sorgen. Darüber hinaus ist es eine enttäuschende Tatsache, dass der Akku eines
Smartphones jeglichen Herstellers heute gerade einen Tag lang ausreicht, und die Nutzer einen
zusätzlichen Akku zur Hand haben müssen. Die tragbare Elektronik benötigt dringend
Hochleistungsenergiespeicher mit höherer Energiedichte.
Der erste Teil der vorliegenden Arbeit beinhaltet Lithium-Ionen-Batterien unter Verwendung von
einzelnen aufgerollten Siliziumstrukturen als Anoden, die durch nanotechnologische Methoden hergestellt
werden. Eine Lab-on-Chip-Plattform wird für die Untersuchung der elektrochemischen Kinetik, der
elektrischen Eigenschaften und die von dem Lithium verursachten strukturellen Veränderungen von
einzelnen Siliziumrohrchen als Anoden in einer Lithium-Ionen-Batterie vorgestellt. In dem zweiten Teil
wird ein neues Design und die Herstellung von flexiblen on-Chip, Festkörper Mikrosuperkondensatoren
auf Basis von MnOx/Au-Multischichten vorgestellt, die mit aktueller Mikroelektronik kompatibel sind.
Der Mikrosuperkondensator erzielt eine maximale Energiedichte von 1,75 mW h cm3
und eine maximale
Leistungsdichte von 3,44 W cm3
. Weiterhin wird ein flexibler und faserartig verwebter
Superkondensator mit einem Cu-Draht als Substrat vorgestellt.
Diese Dissertation wurde im Rahmen des Forschungsprojekts GRK 1215 “Rolled-up Nanotechnologie
für on-Chip Energiespeicherung” 2010-2013, finanziell unterstützt von der International Research
Training Group (IRTG), und dem PAKT Projekt “Elektrochemische Energiespeicherung in autonomen
Systemen, no. 49004401” 2013-2014, angefertigt. Das Ziel der Projekte war die Entwicklung von
fortschrittlichen Energiespeichermaterialien für die nächste Generation von Akkus und von flexiblen
Superkondensatoren, um das Problem der Energiespeicherung zu addressieren. Hier bedanke ich mich
sehr, dass IRTG mir die Möglichkeit angebotet hat, die Forschung in Deutschland stattzufinden.
Keywords: Electrochemical energy storage, micro-devices, lithium-ion battery, strain-engineering,
single-rolled up tubes, Si anode, lab-on-chip device, supercapacitor, flexible electronics, solid-state
energy storage


Abstract
Human beings are facing the grand energy challenge in the 21st century. Nowhere has this become more
urgent than in the area of energy storage and conversion. Conventional energy is based on fossil fuels
which are limited on the earth, and has caused extensive environmental pollutions. Additionally, the
consumptions of energy are still increasing, especially with the rapid proliferation of vehicles and various
consumer electronics like PCs and cell phones. We cannot rely on the earth’s limited legacy forever.
Alternative energy resources should be developed before an energy crisis. The developments of
renewable conversion energy from solar and wind are very important but these energies are often not even
and continuous. Therefore, energy storage devices are of significant importance since they are the one
stabilizing the converted energy. In addition, it is a disappointing fact that nowadays a smart phone, no
matter of which brand, runs out of power in one day, and users have to carry an extra mobile power pack.
Portable electronics demands urgently high-performance energy storage devices with higher energy
density.
The first part of this work involves lithium-ion micro-batteries utilizing single silicon rolled-up tubes
as anodes, which are fabricated by the rolled-up nanotechnology approach. A lab-on-chip electrochemical
device platform is presented for probing the electrochemical kinetics, electrical properties and lithium-
driven structural changes of a single silicon rolled-up tube as an anode in lithium ion batteries. The
second part introduces the new design and fabrication of on chip, all solid-state and flexible micro-
supercapacitors based on MnOx/Au multilayers, which are compatible with current microelectronics. The
micro-supercapacitor exhibits a maximum energy density of 1.75 mW h cm-3
and a maximum power
density of 3.44 W cm-3
. Furthermore, a flexible and weavable fiber-like supercapacitor is also
demonstrated using Cu wire as substrate.
This dissertation was written based on the research project supported by the International Research
Training Group (IRTG) GRK 1215 “Rolled-up nanotech for on-chip energy storage” from the year 2010
to 2013 and PAKT project “Electrochemical energy storage in autonomous systems, no. 49004401” from
2013 to 2014. The aim of the projects was to design advanced energy storage materials for next-
generation rechargeable batteries and flexible supercapacitors in order to address the energy issue. Here, I
am deeply indebted to IRTG for giving me an opportunity to carry out the research project in Germany.
September 2014, IFW Dresden, Germany
Wenping Si


Table of contents
1 Background .............................................................................................................................. 1
1.1 Motivation: the energy challenge in the 21st century ................................................... 1
1.2 Aim and structure of this thesis .................................................................................... 3
1.2.1 Single silicon rolled-up tube as anode for micro-batteries ................................ 3
1.2.2 All solid-state and flexible micro-supercapacitors ............................................ 4
2 Introduction to electrochemical energy storage ....................................................................... 5
2.1 Li-ion batteries .............................................................................................................. 6
2.1.1 Introduction to Li-ion batteries .......................................................................... 6
2.1.2 Anode materials for LIBs .................................................................................. 8
2.1.3 Cathode materials for LIBs.............................................................................. 14
2.1.4 Micro/nano-batteries with a single unit of active materials as electrode ........ 16
2.2 Flexible micro-supercapacitors ................................................................................... 18
2.2.1 Introduction to supercapacitors ....................................................................... 18
2.2.2 Fundamentals of electrochemical double layer capacitance and
pseudocapacitance .......................................................................................................... 19
2.2.3 Electrode materials .......................................................................................... 25
2.2.4 Flexible micro-supercapacitors ........................................................................ 29
2.3 Similarities and differences between LIBS and supercapacitors for electrochemical
energy storage ........................................................................................................................ 31
3 Experimental methods ........................................................................................................... 32
3.1 Deposition methods .................................................................................................... 32
3.1.1 Lithography ..................................................................................................... 32
3.1.2 Electron beam evaporation .............................................................................. 33
3.2. Rolled-up nanotechnology .......................................................................................... 34

3.3 Electrochemical measurements .................................................................................. 35
3.3.1 Cyclic voltammetry ......................................................................................... 35
3.3.2 Galvanostatic charge/discharge ....................................................................... 36
3.3.3 Potential step chronoamperometry .................................................................. 36
3.3.4 Electrochemical impedance spectroscopy ....................................................... 37
3.4 Characterization methods ........................................................................................... 38
3.4.1 Scanning electron microscopy ......................................................................... 38
3.4.2 X-ray diffraction .............................................................................................. 39
3.4.3 X-ray photoelectron spectroscopy ................................................................... 39
3.4.4 Atomic force microscopy ................................................................................ 40
3.4.5 Raman spectroscopy ........................................................................................ 40
4. A single rolled-up Si tube micro-battery ............................................................................... 42
4.1 Introduction ................................................................................................................ 42
4.2 Fabrication of a LIB with a single Si rolled-up tube as anode ................................... 44
4.2.1 A single rolled-up Si tube ................................................................................ 44
4.2.2 Assembly of a micro-battery ........................................................................... 45
4.3 Results and discussion ................................................................................................ 46
4.3.1 Characterization of rolled-up Si tube ............................................................... 46
4.3.2 Electrochemical properties of a single rolled-up Si tube ................................. 47
4.3.3 Chemical diffusion and electrical conductivity of a single rolled-up Si tube . 49
4.3.4 Structural observation of Si tube before/after cycling ..................................... 53
4.4 Conclusion .................................................................................................................. 54
5. On chip, all solid-state and flexible micro-supercapacitors based on MnOx/Au multilayers 55
5.1 Introduction ................................................................................................................ 55
5.2 Fabrication of solid-state micro-supercapacitors ........................................................ 57

5.3 Results and discussion ................................................................................................ 58
5.3.1 Schematics of the micro-supercapacitors ........................................................ 58
5.3.2 Oxidation state of Mn ions .............................................................................. 59
5.3.3 Electrochemical performance: CV and EIS ..................................................... 61
5.3.4 Long-term stability, Ragone plot and mechanical flexibility .......................... 66
5.4 Conclusion .................................................................................................................. 68
6. Fiber-shaped supercapacitors based on Cu wire .................................................................... 70
7. Conclusion and Outlook ........................................................................................................ 72
Bibliography ................................................................................................................................. 74
List of Figures and Tables............................................................................................................. 82
Versicherung ................................................................................................................................. 84
Acknowledgements ....................................................................................................................... 85
Publications (Peer-Review) .......................................................................................................... 86
Curriculum Vitae .......................................................................................................................... 88


Acronyms and Abbreviations LIBs Li-ion Batteries
2D Two-Dimensional
EVs Electric Vehicles
HEVs Hybrid Electric Vehicles
EDLC Electrochemical Double Layer Capacitance
EC Ethylene Carbonate
DMC Dimethyl Carbonate
DEC Diethyl Carbonate
PC Propylene Carbonate
CNTs Carbon Nanotubes
SEI Solid Electrolyte Interphase
c-Si/a-Si crystalline Si/amorphous Si
CV Cyclic Voltammetry
TEM Transmission Electron Microscope
ACs Activated Carbon
CNFs Carbon Fibers
OMCs Ordered Mesoporous Carbons
PANI Polyaniline
PPy Polypyrrole
PTh Polythiophene
ILs Ionic Liquids
TEMABF4 Triethylmethylammonium Tetrafluroroborate
PVA Polyvinyl Alcohol
PEO Polyethylene Oxide
PVDF Polyvinylidene Difluoride
PDMS Poly-Demethylsiloxane
PET Polyethylene Terephthalate
PSCA Potential Step Chronoamperometry
EIS Electrochemical Impedance Spectroscopy
SEM Scanning Electron Microscopy
XRD X-Ray Diffraction
XPS X-Ray Photoelectron Spectroscopy
AFM Atomic Force Microscopy
PVD Physical Vapour Deposition
MA 56 Mask Aligner, Version 5.6
QCM Quartz Crystal Microbalance
CPD Critical Point Dryer
ESR Equivalent Series Resistance
SEs Secondary Electrons
BSEs Back-Scattered Electrons
ICDD International Center for Diffraction Data


Symbols and Chemical Formulas D diffusion coefficient
Li/ Li+ lithium/lithium ions
MnOx manganese oxides
Au gold
M molar mass
specific gravity
LixMO2 lithium metal oxides (M=Co, Ni or Mn)
C carbon
Li4Ti5O12 lithium titanium oxides
TiO2 titanium dioxides
Si silicon
Sn tin
e electron
LiPF6 lithium hexafluorophosphate
LiClO4 lithium perchlorate
LiC6 most lithiated graphite
MOx transitional metal oxides (M=Fe, Co, Mo, Cr, Ni, Mo, etc.)
Li2O lithium oxide
Fe2O3, Fe3O4 iron oxides
Co3O4, CoO cobalt oxides
MoO3, MoO2 molybdenum oxides
CuO, Cu2O copper oxides (II, I)
Cr2O3 chromium oxides
NiO nickel oxides
RuO2 ruthenium oxides
Ir2O3 iridium oxide
V2O5 vanadium oxide
PbO2 lead dioxide
NiOOH nickel hydroxide
Ge germanium
Pb lead
Sb antimony
Bi bismuth
Li22Si5, Li15Si4, a-Li3.75Si most lithiated silicon at 415 °C, room temperature, amorphous alloy
LiTiS2 lithium titanium disulfide
LiNi1-yCoyO2 lithium nickel cobalt dioxide
LiNiyMnyCo1-2yO2 lithium nickel manganese cobalt dioxide
LiFePO4 lithium iron phosphate
B boron
Mg magnesium
Al aluminum

Fe iron
Co cobalt
Ni nickel
Zn zinc
SnO2 tin dioxide
ε dielectric constant
A area of electrode surface
C capacitance
π circular constant
d thickness of double layer
Cp, Cn capacitance of positive and negative electrodes
E maximum energy
P maximum power
V operation potential
R total series resistance
H2SO4 sulfuric acid
KOH potassium hydroxide
Na2SO4 sodium sulfate
NH4Cl ammonium chloride
ppm parts per million
RF Faradaic resistance
Cdl double layer capacitance
W Warburg impedance
RE electrolyte resistance
ZF Faradaic impedance
F Faradaic constant
CO2 carbon dioxide
NH3 ammonia
MnO2 manganese dioxide
O2
oxygen ions
OH hydroxyl
K+ potassium cation
Na+ sodium cation
Ag/AgCl silver/silver chloride
GeO2 germanium dioxide
SiOx/SiOy silicon oxide with different oxidation states
Q integrated total charge from CV curve
U potential window of CV scanning
m mass
V volume
m micrometer
cm centimeter
mA milliampere
F Faradaic constant

k0 standard heterophase rate constant
Co, CR concentration of oxidant, reductant
OC bulk concentration of oxidant in electrolyte
I current
Hz unit of frequency
NaCl sodium chloride
keV unit of energy
Ar argon
H2O water
n electron number
uR uncompensated resistance
duCR cell time constant
0r radius of a microelectrode
0
dC capacitance per area
electrolyte conductivity
S cm1
unit of conductivity
ω small sinusoidal pulsation
LiCl lithium chloride
mWh cm3
unit of energy density
W cm3
unit of power density


Chapter 1. Background 1
1 Background
1.1 Motivation: the energy challenge in the 21st century
Energy ranges among the most important topics in the 21st century. Optimistic predictions
forecast that a peak production of oil, coal, and natural gas will happen in 2020s or 2030s and
alternative energy resources should be developed before a crisis. It is human being’s challenge in
this century to be independent from the earth’s legacy and to build renewable clean energy
resources to enable the sustainable development of our economy and society, making sure that
our descendent can live in peace. Solar and wind energy as representative renewable energy have
attracted unprecedented interest since they provide electricity without giving rise to any carbon
dioxide emission. However, the production of solar and wind energies is not even and continuous
due to their intermittent nature, i.e., significant dependence on natural conditions (day time, night
time, wind, etc.). In order to utilize electricity from such kinds of energy, some corresponding
energy storage approaches, such as thermal, mechanical, electromagnetic, hydrogen, and
electrochemical energy storage, are necessary to store the energy and to stabilize the electricity
grid connected. As an intermediate step towards the utilization of renewable clean energies,
energy storage systems are crucial supporting facilities. On the other hand, the increasing
popularization of consumer electronics and electric vehicles also greatly promotes the
development of energy storage devices. Among all the energy storage approaches,
electrochemical energy storage devices play an important role due to their high energy/power
density, versatility, and flexibility. However, energy storage cannot keep pace with the progress
in the microelectronic industry (Moore’s law predicts a doubling of memory capacity every two
years) and it has been the bottleneck for the further reduction of the size of microelectronic
devices.
Electrochemical energy storage/release is realized by electron and ion charge/discharge. Two
typical electrochemical energy storage devices are rechargeable batteries[1] and electrochemical
capacitors (also named supercapacitors).[2] The advantage of electrochemical energy is
described in the Ragone plot (Figure 1. 1), where typical energy storage and conversion devices

2 Chapter 1. Background
are presented in terms of their specific energy and specific power densities. Batteries and
electrochemical capacitors bridge the gap between fuel cells and conventional capacitors.
Furthermore, batteries usually exhibit higher energy density while supercapacitors have higher
power density. Thus, the main focus in this thesis includes Li-ion batteries (LIBs, specifically on
the anode materials) and supercapacitors.
Figure 1. 1. Sketch of Ragone plot shows specific power against specific energy for various electrical energy
storage devices. The specific power indicates how fast it can be charged/discharged, and the specific energy
indicates how much energy it supplies on a single charge. Cited from Ref. [3].
Strain engineering offers an advanced strategy to deterministically rearrange 2D (two-
dimensional) nanofilms into 3D micro-/nanostructures including tubes, helices, rings, wrinkles
and other advanced micro-architectures. In our group, we have reported rolled-up microtubes as
electrodes in Li-ion batteries and supercapacitors, all of which have shown high performance
(e.g., capacity and life time).[4-9] The next section gives an insight into the aim of the first part
in this work utilizing the rolled-up nanotechnology approach to fabricate single silicon rolled-up
tubes as anodes for micro-batteries.
The recent rapid advance and eagerness of miniaturized, portable consumer electronics
stimulate the development of micro-scale power sources with high power density, towards the

Chapter 1. Background 3
trend of being small, thin, lightweight, flexible, and even wearable, to meet the growing demands
of modern society.[10-13] Introducing small solid state energy storage devices has stimulated
significant research interest, which enables circuit designers to integrate energy storage devices
directly with other functional components or even on clothing. However, it is still a challenge to
realize flexible energy storage devices with high performance because they are highly dependent
on the electrical and mechanical properties of electrode materials. The next section explains the
aim of the second part in this thesis to fabricate all solid-state, flexible supercapacitors, and the
structure of this thesis.
1.2 Aim and structure of this thesis
1.2.1 Single silicon rolled-up tube as anode for micro-batteries
It is well known that once a two-dimensional nanofilm is rolled up into a microtube, both the
upper and lower surfaces will be exposed to electrolyte, and the interior space of microtubes
could work as advanced ionic transport channels. A particular method based on rolled-up
nanotechnology has been recently developed in the IIN institute. With this method it is possible
to fabricate tubular structures with various sizes which enable the integration of lab-on-a-chip
electrochemical devices.
A comprehensive understanding of the correlation between the electrodes’ tubular structure,
electrical/ionic conductivity and the electrochemical kinetics as well as the performance is
needed to be explored. Ionic conduction through the electrodes and electrolyte is essential to
complete the electrochemical reaction.[14] An important kinetic characteristic is the chemical
diffusion coefficient (D) of the inserted species (Li), which often determines the total reaction
rate in the kinetic diffusion process. Thus, the determination of D values of Li ion in the solid
phase is a most important issue from a practical as well as fundamental point of view. In addition,
the ease of electron-transfer between anode and cathode can dictate the magnitude of the cell’s
driving force, which is related with electrodes, current collectors and electrical leads. Therefore,
this work will focus on the understanding of the ionic and electrical conduction of the Si single
tubes.
4 Chapter 1. Background
1.2.2 All solid-state and flexible micro-supercapacitors
In comparison with Li-ion batteries, supercapacitors have many unique advantages such as high
power density, long lifetime, easy fabrication, low cost and good safety.[3, 15, 16] With the
rapid development of the multifunctional portable consumer electronics and energy harvesting
devices such as solar cells, energy storage components have become a bottleneck for the
reduction of the size of microelectronic devices. There is high demand to produce miniaturized,
flexible and even weavable supercapacitors. Therefore in this work, a new concept is introduced
to fabricate on chip, all solid-state and flexible micro-supercapacitors based on MnOx/Au
multilayers, which are compatible with current microelectronics. The micro-supercapacitor
exhibits a maximum energy density of 1.75 mW h cm-3
and a maximum power density of 3.44 W
cm-3
. Furthermore, a flexible and weavable fiber-like supercapacitor is demonstrated using Cu
wire as substrate.

Chapter 2. Introduction to electrochemical energy storage 5
2 Introduction to electrochemical energy
storage
Electrochemical energy storage devices, of which the two dominant kinds are rechargeable
batteries and supercapacitors, store and release their energy by electron and ion charge/discharge
in electrochemical processes. An electrochemical energy storage device is usually composed of a
positive (cathode) and a negative electrode (anode), separated by a separator and electrolyte
solution. When connected to an external circuit, during discharging, the electrochemical
reactions occur in series at both the cathode and the anode, generating electrons and enabling the
current to be captured by the user; during charging, an external voltage is applied across the
electrodes, driving the movements of electrons and reactions at the electrodes and realizing the
energy storage.
According to the mechanisms and components of their electrodes, rechargeable batteries can
be further separated into the following categories: lead-acid, zinc-air, nickel-cadmium, nickel-
hydrogen, sodium-sulfur, sodium-nickel-chloride, and LIBs.[1] Rechargable LIBs offer energy
densities 2-3 times and power densities 5-6 times higher than Ni-MH, Ni-Cd, and Pb acid
batteries. Due to the advantages of high voltage, low self-discharge, long cycling life, low
toxicity, and high reliability, LIBs have been one of the most important energy storage system
for a wide variety of applications in the communications, transportation and smart grid, such as
portable electronic devices including cell phones, laptops, and digital cameras, as well as electric
vehicles (EVs) and hybrid electric vehicles (HEVs).[17-19] This explains why they receive the
huge attention at both the fundamental and practical levels.
Supercapacitors, featured with high power capabilities, have also attracted increasing interest
especially for applications in EVs and HEVs, as well as portable electronics. Two principles are
responsible for supercapacitors: electrochemical double layer capacitance (EDLC) and pseudo-
capacitance modes. The former, similar to an electrolytic capacitor, is working by separating
charges at the interface between a solid electrode and an electrolyte; and the latter is a fast
Faradaic process involving electrochemical redox reactions.
The electrode materials play key roles in determining the performance of LIBs and
supercapacitors. Understanding charge storage mechanism and the development of advanced

6 Chapter 2. Introduction to electrochemical energy storage
nanostructured materials, synthesis techniques have promoted notable improvements in the
performance of LIBs and supercapacitors. Herein, detailed overviews of the advanced materials
for LIBs and supercapacitors are presented in 2.1 and 2.2, respectively.
2.1 Li-ion batteries
2.1.1 Introduction to Li-ion batteries
Li is the most electropositive (3.04 V vs. standard hydrogen electrode) and the lightest (molar
mass M=6.94 g mol1
, and specific gravity =0.53 g cm3
) metal, facilitating the development of
batteries with Li metal as anode. In 1970s, the assembly of primary (non-rechargeable) Li cells
firstly demonstrated the advantage of using Li metal.[17, 20]. They emerged soon as power
sources for watches, calculators or for implantable medical devices due to their high energy
capacity and variable discharge rate. Meantime, numerous inorganic compounds were
demonstrated to react with alkali metals reversibly, which were then taken as positive electrode
in primary Li cells. Bell Labs discovered that oxides as intercalation materials were giving
higher capacities and voltages. Goodenough proposed the families of LixMO2 compounds (M is
Co, Ni or Mn) that are still used as cathodes in today’s batteries.[21, 22] But shortcomings soon
occurred since the dendritic Li grew during repeated discharge/charge cycles, which led to
explosion hazards. An effective approach is replacing Li metal with an insertion material. At the
end of the 1980s and early 1990s, Li-ion battery has developed. The change in the presence of Li
from its metallic state to ionic state solved the dendrite problem, making LIBs inherently safer
than Li-metal cells. To compensate for the increase in the potential of the negative electrode,
high-potential insertion compounds are necessary for the positive electrode, and thus the
emphasis shifted from the layered-type transition-metal disulphides to layered or three-
dimensional-type transition metal oxides.[21]
Fundamentally, LIBs’ capacity and lifetime are determined by the intrinsic properties of the
positive and negative electrode materials. Currently researchers aim to find the best-performing
combination of electrode-electrolyte-electrode through selecting of cathodes and anodes as well
as the appropriate electrolytes, meanwhile minimizing detrimental reactions associated with the
electrode-electrolyte interface.
Chapter 2. Introduction to electrochemical energy storage 7
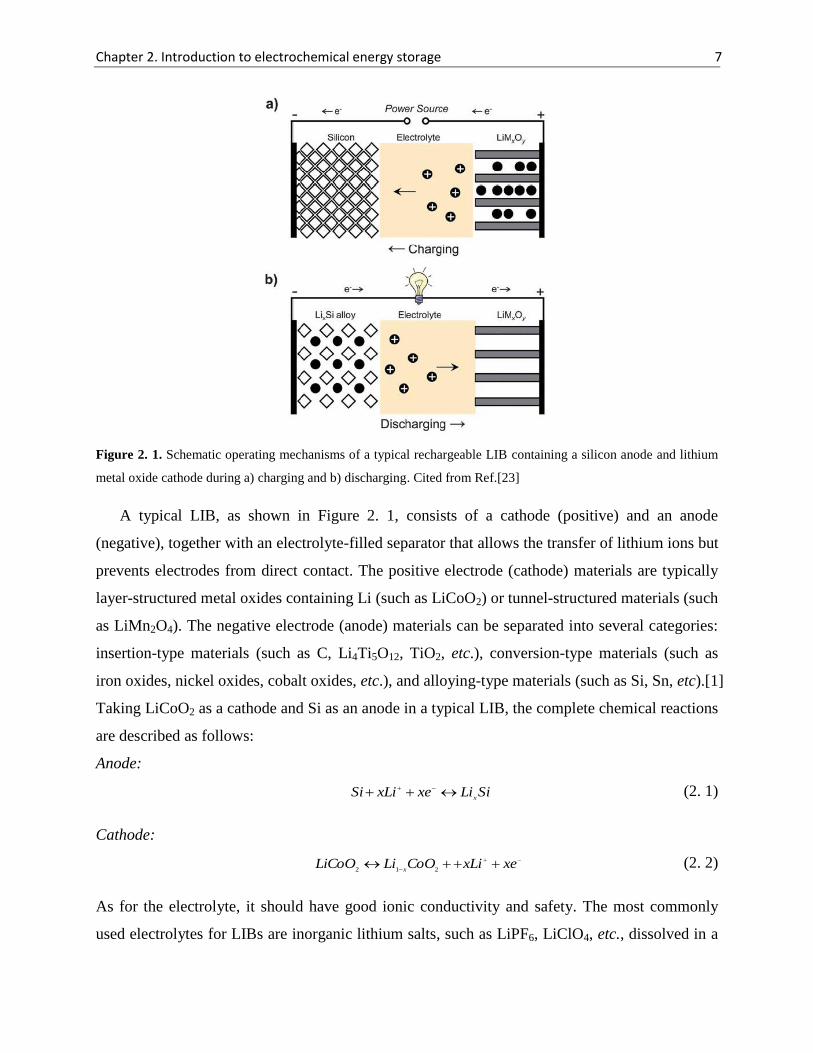
Figure 2. 1. Schematic operating mechanisms of a typical rechargeable LIB containing a silicon anode and lithium
metal oxide cathode during a) charging and b) discharging. Cited from Ref.[23]
A typical LIB, as shown in Figure 2. 1, consists of a cathode (positive) and an anode
(negative), together with an electrolyte-filled separator that allows the transfer of lithium ions but
prevents electrodes from direct contact. The positive electrode (cathode) materials are typically
layer-structured metal oxides containing Li (such as LiCoO2) or tunnel-structured materials (such
as LiMn2O4). The negative electrode (anode) materials can be separated into several categories:
insertion-type materials (such as C, Li4Ti5O12, TiO2, etc.), conversion-type materials (such as
iron oxides, nickel oxides, cobalt oxides, etc.), and alloying-type materials (such as Si, Sn, etc).[1]
Taking LiCoO2 as a cathode and Si as an anode in a typical LIB, the complete chemical reactions
are described as follows:
Anode:
SiLixexLiSix
(2. 1)
Cathode:
xexLiCoOLiLiCoO
x 212 (2. 2)
As for the electrolyte, it should have good ionic conductivity and safety. The most commonly
used electrolytes for LIBs are inorganic lithium salts, such as LiPF6, LiClO4, etc., dissolved in a

8 Chapter 2. Introduction to electrochemical energy storage
mixture of two or more organic solvents (ethylene carbonate (EC), dimethyl carbonate (DMC),
diethyl carbonate (DEC), propylene carbonate (PC), etc.). The separator has two functions: to
prevent short circuiting between the anode and cathode, and to provide abundant channels to
transport Li ions during charging/discharging as well. A typical separator for LIBs is the glass
membrane. By the exchange of Li ions between the anode and cathode, the chemical energy and
electrical energy can be converted reversibly. Thus LIB is also named as rocking-chair battery as
Li ions rock back and forth between the anode and cathode. When the battery is charging, Li
deintercalates from the cathode and intercalates into the anode. Vice versa, Li deintercalates
from the anode and intercalates into the cathode during discharging.
2.1.2 Anode materials for LIBs
Insertion-type materials (C, Li4Ti5O12, TiO2):
The insertion-type materials have advantages such as low cost and nontoxicity. The main
problem is that the number of electrons involved in the insertion reaction is generally less than
one per Li because Li can only be accommodated into interstitial sites of the anode, thus the
capacity is low. Here carbon materials are introduced.
Figure 2. 2. A schematic drawing of graphene. Reproduced from Ref. [24].
Graphite is the most commonly used commercial anode materials for LIBs because of its low
and flat working potential, long cycle life, and low cost. The maximum lithiated compound of
graphite is LiC6, resulting in a limited theoretical charge capacity of 372 mAh g1
. Furthermore,
the Li ion transport rates of graphite anodes are always less than 106
cm2 s1
, leading to a low
power density.[18] Nanostructured carbonaceous anode materials have shown potentials to
increase the energy and power densities of LIBs, including 1D, 2D, and porous carbon-based

Chapter 2. Introduction to electrochemical energy storage 9
anodes, since they possess larger surface area and more open spaces for Li storage.[18] 1D
nanostructured carbon includes carbon nanotubes (CNTs), nanowires, and nanofibers. For
instance, the reversible capacity of anodes made from CNTs can exceed 681 mAh g1
.[25] A
typical 2D nanostructured carbon is graphene (Figure 2. 2), a novel monolayer of carbon lattice,
which has an ultrahigh surface area, intriguing electronic and thermal conductivities, structural
flexibility, unique porous structure, and a broad electrochemical window.[26] It was found that
graphene exhibits a relatively high reversible capacity of 672 mA h g1
and fine cycle
performance.[27] 3D porous carbon materials are also considered as promising anode materials
for LIBs since they have high surface areas and open pore structures. Mainly there are three
categories of them: microporous (pore size < 2 nm), mesoporous (2 nm < pore size < 50 nm) and
macroporous (pore size > 50 nm). The mesoporous carbon exhibits the largest reversible capacity
of 1100 mA h g1
.[18, 28] The electrochemical performances of nanocarbons (1D, 2D and
porous carbons) as anode in LIBs are dependent on the structures and morphologies. The 1D
nanostructured carbons usually have high Coulombic efficiency (the ratio of the charge capacity
to the discharge capacity for each cycle) and good cycling stability. However, they often show
bad rate capability due to the formation of large SEI (solid electrolyte interphase) film and less-
compact structure. 2D structured graphene typically shows good rate capability, but has low
initial Coulombic efficiency and large irreversible capacity. Porous carbons have low volumetric
capacity and large irreversible capacity. Hybridizing nanocarbon materials with other high-
capacity components (alloys and/or metal oxides), could lead to improved electrochemical
performances.
Conversion-type materials
Conversion-type materials have been intensively investigated as potential anode materials for
rechargeable LIBs because these materials can deliver high reversible capacities between 500
and 1000 mAh g1
.[18] Most transitional metal oxides (MOx, M=Fe, Co, Ni, Cu, Mo, Cr, Ru, etc.)
follow the conversion mechanism, which involves the formation and decomposition of lithium
oxide (Li2O), accompanying with the reduction and oxidation of metal nanoparticles, displayed
as follows:[18]
OyLixMyeyLiOMyX 2
22 (2. 3)

10 Chapter 2. Introduction to electrochemical energy storage
After the first lithiation, the metal oxides are converted to a metallic state along with the
formation of Li2O, and reversibly returned back to its initial state after delithiation. However,
they often show low Coulombic efficiency at the first cycle, unstable SEI film formation, large
potential hysteresis, and poor capacity retention. In order to address the issue, nanostructured
porous transitional metal oxides and their composites have been investigated. Table 2. 1
summarizes the most widely studied conversion reaction-based transitional metal oxide anodes.
Table 2. 1. Summarization of conversion reaction-based nanostructured transitional metal oxide anodes. Modified
based on Ref. [18].
Metal oxides Theoretical capacities
(mAh g1
)
Representative nanostructures Common problems and
possible solutions
Iron oxides Fe2O3
Fe3O4
1007[29]
926[30]
Nanostructures and carbon-
based nanocomposites
Common problems:
Low coulombic
efficiency at the first
cycle, unstable SEI
film formation, large
potential hysteresis,
and poor capacity
retention.
Possible solutions:
1. Metal oxide/carbon
composites using
carbon as buffer and
electrode-active
materials.
2. Nanostructured
metal oxides to
provide high surface
area and quantum
confinement effects.
Cobalt oxides Co3O4
CoO
890[31]
715[32]
Nanostructured Co3O4 with or
without carbon
CoO composites
Manganese oxides MnOx 700-1000[33, 34] Nanostructured MnOx/carbon
Molybdenum
oxides
MoO3 1111[35] Doped MoO3
MoO2 830[35] MoO2 nanomaterials
Copper oxides CuO 674[36] Nanostructured CuO
Cu2O 375[37] Cu2O/carbon composites
Chromium oxides Cr2O3 1058[38] Nanostructures, hetero-atom
doping, and carbon-based
nanocomposites
Nickel oxides NiO 718[39] NiO/carbon, porous NiO
Ruthenium oxides RuO2 1130[40] SnO2/RuO2
Alloy-type materials
Other elements such as Si, Ge, Sn, Pb, Sb and Bi and their alloys or oxides, have been examined
as anode for LIBs as they deliver much higher capacity than both insertion- and conversion-type
anodes. Amongst them, silicon based anodes for LIBs have been the focus of intensive research
interests, primarily because silicon exhibits the highest theoretical specific capacity (4200 mAh
g1
for Li22Si5), more than ten times of that of carbon [41] and is among the most promising
candidates that can replace graphite as anodes in rechargeable Li-ion batteries. Crystalline Si is

Chapter 2. Introduction to electrochemical energy storage 11
in the mFd3 space group, the face-centered cubic bravais lattice. It is worth noting that the
Li22Si5 compound is only obtained at a high temperature of 415 °C,[41] while Li15Si4 (or
amorphous phase a-Li3.75Si) is the highest lithiated phase achievable at room temperature for the
lithiation of silicon, corresponding to a capacity of 3579 mAh g1
.[42-46]
Figure 2. 3. Schematic illustration of Si nanowire anode grown directly onto the current collector, reproduced from
Ref. [47].
However, a huge volume change of Si (280%) [44, 48] also accompanies the lithiation-
delithiation process, which leads to the loss of contact or pulverization of the electrodes upon
repeated alloying-dealloying, and eventually limits the use of Si in commercial batteries.
Amorphous Si exhibits much improved cycling performance over crystalline Si due to less
dramatic volume changes.[43] Nanostructured Si as well as their composites with carbon (Si/C)
materials also have shown promising resistance against fracture and exhibited improved cycling
performance, including Si nanoparticles,[49] Si nanowires/nanorods,[47, 50] Si nanotubes[51]
and Si nanospheres.[52] However, these nanomaterials also show some disadvantages, such as
low thermodynamic stability and surface side-reactions, which are related to the small size and
high specific surface area (i.e., excess surface free energy).[53] Therefore kinetically stabilized
nanomaterials should be considered, which can be realized by using nano/micro hierarchical
structures and proper surface coating.
To effectively solve the issue of poor cycle life, it is also of great importance to fully
understand the detailed lithiation/delithiation processes of Si. Researchers have tried various
strategies to determine the complicated electrochemical redox reactions during alloy/dealloy
process of Li and Si. Hatchard et al. used in-situ XRD (X-ray diffraction) to track the reaction of
lithium with amorphous Si.[43] Li et al. have studied the sloping plateaus behaviors (see Figure
12 Chapter 2. Introduction to electrochemical energy storage
2. 4) using Sn-doped a-Si powders.[54] Real-time NMR (nuclear magnetic resonance) technique
was utilized by Key et al[55] to investigate the structural changes in Si during lithiation and
delithiation. Following Huang’s pioneering work of real time observation of the lithiation
process of SnO2 by in-situ TEM (transitional electron microscopy),[56] several powerful
experiments have also been carried out on Si by in-situ observation.[57, 58] For example, a two-
phase electrochemical lithiation process was detected in amorphous Si.[58] However,
controversies on the lithiation/delithiation mechanisms of Si still exist. According to diverse
literatures results,[43-45, 47, 54, 55, 57-71] Zamfir et al. have managed to draw a conclusion as
shown in the following table.[46] Here crystalline Si is simplified as c-Si, and amorphous Si as
a-Si. The first lithiation of c-Si involves a two-phase reaction (c-Si and a-Li3.5Si) and then an
amorphous Li3.75Si or a crystalline Li15Si4 is produced as the fully lithiated phase. The first
delithiation of c-Si includes three steps, firstly a two-phase reaction (the fully lithiated Si and a-
Li2Si), secondly a less lithiated amorphous phase (a-LixSi, 0<x<2), and finally the amorphous Si.
Until now, the originally amorphous Si has been amorphized and the afterwards
lithiation/delithiation processes are identical to those of amorphous Si. There are three steps in
the first lithiation of amorphous Si (also the second lithiation of c-Si). Firstly a two-phase
reaction (a-Si and a-Li2.2Si) occurs, secondly another more complicated amorphous region occurs
(still not clear if it is a two-phase region), and finally Si is fully lithiated to either a-Li3.75Si or c-
Li15Si4. The delithiation process of a-Si is identical to that of c-Si.

Chapter 2. Introduction to electrochemical energy storage 13
Table 2. 2. Summary of the lithiation/delithiation mechanisms for crystalline Si (c-Si) and amorphous Si (a-Si).
Reproduced from Ref. [46].
First full lithiation of c-Si
First delithiation of c-Si
Second full lithiation of c-Si (first lithiation
of a-Si)
Second delithiation of c-Si (first delithiation
of a-Si)
415
753
53Sic-Li
Sia-LiSi a-LiSi cSi c
.
.
100 mV, 2 phases
a-SiSia-LiSia-LiSic-Li
Sia-Li
Sic-Li
Sia-Li
tt
..
202
415
753
415
753
430 mV, 2 phases
415
753
5252SiLic
SiLiaSiLiaSiLiaSiLiaSiaSia
.
w(?)..
1st sloping plateau 2
nd sloping plateau
2 phases 2 phases?
a-SiSia-LiSia-LiSic-Li
Sia-Li
Sic-Li
Sia-Li
tt
..
202
415
753
415
753
430 mV, 2 phases
The typical galvanostatic profiles and cyclic voltammetry (CV) curves of crystalline Si
nanowires are shown in Figure 2. 4. The first lithiation shows one gently sloping plateau
corresponding to the equilibrium between c-Si and a-Li3.5Si. At the end of the first lithiation (0
V), c-Si has been totally transformed into a-Li3.75Si, which is also possibly crystallized into c-
Li15Si4 phase, depending on conductivity and other parameters. The first delithiation starts with a
steep rise in potential, followed by a plateau at ~ 430 mV, corresponding to the equilibrium
between c-Li15Si4 (or a-Li3.75Si) and a-Li2Si. At the end of the delithiation step, Li is totally
extracted from the alloy and Si is left amorphous. The second and third lithiation profiles exhibit
different behaviors with two sloping plateaus, which is typical lithiation feature of amorphous Si.
The delithiation processes of the first three curves are similar. CV shows one sharp peak for the
first lithiation, corresponding to the gently sloping plateau. The second lithiation produces two
peaks, corresponding to the two sloping plateaus in galvanostatic curves. The first and second
delithiation curves are similar, exhibiting two peaks at approximately the same potential.

14 Chapter 2. Introduction to electrochemical energy storage
Figure 2. 4. Galvanostatic and CV curves recorded on crystalline Si nanowires in a half-cell geometry with Li
counter electrode. (a) The first galvanostatic lithiation shows a gently sloping plateau, starting at around 100 mV. (b)
The first three galvanostatic lithiation curves show the difference in lithiation behaviors between the first cycle (c-Si)
and the following ones (a-Si). The inset shows the first two cycles of CV. Reproduced from Ref. [46].
2.1.3 Cathode materials for LIBs
Since anodes of LIBs have no Li, cathodes then must act as a source of Li, thus requiring use of
air-stable Li-based intercalation compounds to facilitate the cell assembly.[17] Cathode materials
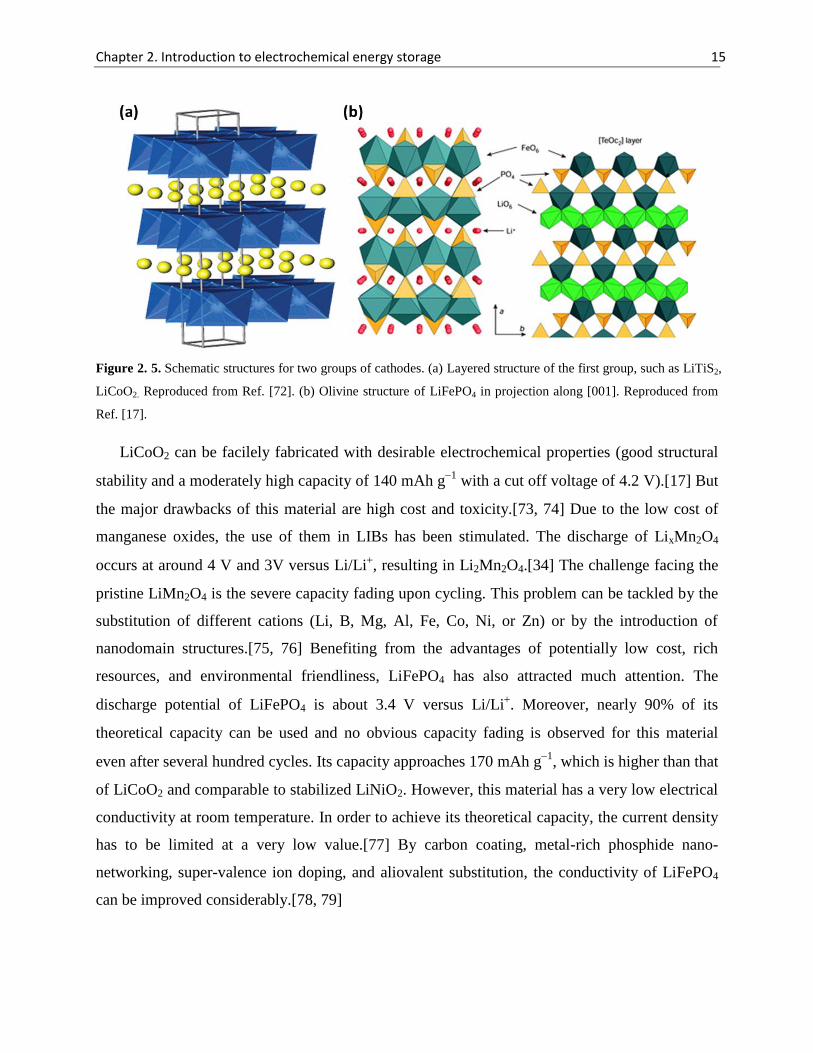
incorporate two main classes of materials.[72] The first group contains layered compounds,
which are made of two types of alternative layers, one of close-packed anions and the other of
the transition metals. Li ions can insert into essentially empty remaining layers, as shown in
Figure 2. 5a. Typical examples of this group are LiTiS2, LiCoO2, LiNi1-yCoyO2, and
LiNiyMnyCo1-2yO2. The second group possesses more open structures, including many vanadium
oxides, the tunnel compounds of manganese dioxides, and transition-metal phosphates, such as
olivine LiFePO4 (see Figure 2. 5b). The first group have higher specific volumetric energy
density due to their more compact lattices, but LiFePO4 in the second group have advantages in
lower cost and higher rate capability.[72] The most widely used cathode materials include
LiCoO2, LiMn2O4, LiFePO4.[1]
Chapter 2. Introduction to electrochemical energy storage 15
Figure 2. 5. Schematic structures for two groups of cathodes. (a) Layered structure of the first group, such as LiTiS2,
LiCoO2. Reproduced from Ref. [72]. (b) Olivine structure of LiFePO4 in projection along [001]. Reproduced from
Ref. [17].
LiCoO2 can be facilely fabricated with desirable electrochemical properties (good structural
stability and a moderately high capacity of 140 mAh g1
with a cut off voltage of 4.2 V).[17] But
the major drawbacks of this material are high cost and toxicity.[73, 74] Due to the low cost of
manganese oxides, the use of them in LIBs has been stimulated. The discharge of LixMn2O4
occurs at around 4 V and 3V versus Li/Li, resulting in Li2Mn2O4.[34] The challenge facing the
pristine LiMn2O4 is the severe capacity fading upon cycling. This problem can be tackled by the
substitution of different cations (Li, B, Mg, Al, Fe, Co, Ni, or Zn) or by the introduction of
nanodomain structures.[75, 76] Benefiting from the advantages of potentially low cost, rich
resources, and environmental friendliness, LiFePO4 has also attracted much attention. The
discharge potential of LiFePO4 is about 3.4 V versus Li/Li. Moreover, nearly 90% of its
theoretical capacity can be used and no obvious capacity fading is observed for this material
even after several hundred cycles. Its capacity approaches 170 mAh g1
, which is higher than that
of LiCoO2 and comparable to stabilized LiNiO2. However, this material has a very low electrical
conductivity at room temperature. In order to achieve its theoretical capacity, the current density
has to be limited at a very low value.[77] By carbon coating, metal-rich phosphide nano-
networking, super-valence ion doping, and aliovalent substitution, the conductivity of LiFePO4
can be improved considerably.[78, 79]

16 Chapter 2. Introduction to electrochemical energy storage
2.1.4 Micro/nano-batteries with a single unit of active materials as
electrode
Bulk batteries are often composite electrodes made by mixing active materials with conductive
carbon additives and polymer binders, which introduce uncertainties into electrochemical kinetic
study. In order to eliminate the interference, the investigation of a single unit of active material
with well-defined geometry should be an attractive approach. In the field of nanoscience, single
nanostructured electronic devices have been extremely useful for investigating electronic
properties of nanomaterials.
Figure 2. 6. Schematic of measuring a single Si nanowire as anode for LIB. Reproduced from Ref. [80].
Since the research objects are very small, realizing the electrical contact to them is challenging.
A schematic of measuring one single Si nanowire is shown in Figure 2. 6. The electrical contact
was realized by Ti metal strips deposited either using e-beam evaporator or sputtering techniques.
With this platform, McDowell et al. succeeded in measuring both the electrochemical properties
and the electrical transport of the single Si nanowire under various lithiation states.[80] Mai and
his co-workers [81] also used the similar platform to study the evolution of single silicon
nanowire, with the ability to in situ record the electrical transport of the single nanowire.

Chapter 2. Introduction to electrochemical energy storage 17
Figure 2. 7. Schematic of measuing a single particle anode in a LIB. Reproduced from Ref. [82].
The electrical contact to a single particle was achieved by a microelectrode connected with a
micromanipulator under optical microscopy (Figure 2. 7). With the similar setup, Uchida’s group
[83, 84] investigated the kinetics of Li+ extraction/insertion at a single particle (graphitized
mesocarbon microbeads and LiMn2O4). This technique enabled studying the current/potential
behavior of the particle itself.
Figure 2. 8. (a) Schematic of the experimental setup of observing the lithiation behaviors of SnO2 nanowires under
TEM. IL means ionic liquid as electrolyte. (b) TEM micrograph of the nanowire containing a reaction front
(dislocation cloud) separating the reacted (amorphous) and nonreacted (single-crystal SnO2) sections. Reproduced
from Ref. [56].
Another way to contact single nanowires was realized by connecting the nanowires with Au
rod by a conductive epoxy as shown in Figure 2. 8a. Huang and co-workers [56] have utilized
such a nanoscale electrochemical device inside a TEM to observe the in-situ lithiation of the tin
dioxide (SnO2) nanowire during electrochemical charging and found that a reaction front
containing a high density of dislocations worked as a structure precursor to electrochemically
driven solid-state amorphization. And Wang et al., [58] further reported a two-phase

18 Chapter 2. Introduction to electrochemical energy storage
electrochemical lithiation at amorphous Si with the similar setup.
In this thesis, a robust Lab-on-chip electrochemical device platform is presented for probing
the electrochemical kinetic, electronic properties and structural changes study of a single silicon
rolled-up microtube as anode in LIBs. This will be discussed in details in Chapter 4.
2.2 Flexible micro-supercapacitors
2.2.1 Introduction to supercapacitors
Supercapacitors, the term of which was coined by B. E. Conway,[2] find versatile applications
due to their high power ability since they store energy using either EDLC or rapid redox reaction
(pseudo-capacitance). Supercapacitors can be fully charged and discharged in seconds and
deliver an energy density of about 5 Wh kg1
(lower than batteries), but a much higher power
density (10 kW kg1
),[2] as shown in Figure 1. 1 in Chapter 1. As macro-supercapacitors, they
are used in hybrid electric vehicles to increase the efficiency. They can complement or replace
batteries in electrical energy storage applications.[16] Since today’s hybrid vehicles turn off the
engine completely when the car comes to a stop, supercapacitors can offer efficient power for a
rapid restart. The use of supercapacitors in emergency doors (16 per plane) on an Airbus A380
also confirms their performance, safety and reliability.[16] As micro-supercapacitors, they can be
integrated as energy storage devices with portable consumer electronics.
Figure 2. 9. Schematic illustration of three types of supercapacitors, based on the electrode materials and their
working principles.

Chapter 2. Introduction to electrochemical energy storage 19
According to the two types of working principles (electrochemical double layer and pseudo-
capacitance), supercapacitors can be divided into three types, as summarized in Figure 2. 9. (a)
Electrochemical double layer capacitors, similar to physical capacitors, work by the separation of
charges at the interface between a solid electrode and an electrolyte, which are non-faradaic
processes. Carbon materials are the most widely used electrodes for this type of supercapacitors,
including activated carbon (ACs), carbon fibers (CNFs), carbon aerogel and carbon nanotubes
(CNTs), ordered mesoporous carbons (OMCs) and newly discovered graphene, carbide-derived
carbon, and carbon onions; (b) Pseudo-capacitors often involve rapid faradaic redox reaction
either on surface or in bulk of the electrodes. Two main kinds of electrode materials following
this mechanism are transition metal oxides such as RuO2, MnO2, NiO, Co3O4, and conducting
polymers including polyaniline (PANI), polypyrrole (PPy), and polythiophene (PTh) and its
derivatives; (c) Hybrid capacitors (supercabattery) combine one battery-like electrode and one
supercapacitor electrode, resulting in improved energy density as well as power density.[16] The
following section will give detailed descriptions about the fundamentals and various electrode
materials of supercapacitors.
2.2.2 Fundamentals of electrochemical double layer capacitance and
pseudocapacitance
Double layer capacitance utilizes delocalized conduction-band electrons of electrodes, while
faradaic processes involve electrons transferred to or from valence-electron states (orbitals) of
electrodes. In certain cases, the faradaically reactive material itself is metallically conducting
(e.g., PbO2, some sulfides, RuO2), or is a well-conducting semiconductor and a proton conductor,
e.g., Ni O OH.[2]
A supercapacitor, with two electrode/electrolyte interfaces, can be considered as two
capacitors connected in series (see Figure 2. 10a). The capacitance of each interface can be
expressed as follows:
d
AC
4 (2. 4)
where A is the area of the electrode surface, which should be the active surface of the electrode
porous layer, ε is the medium (electrolyte) dielectric constant, which will be equal to 1 for a
vacuum and larger than 1 for all other materials, including gases; and d is the effective thickness

20 Chapter 2. Introduction to electrochemical energy storage
of the electrical double layer.[15] The capacitance can be obtained experimentally by CV or
galvanostatic charge/discharge measurements, as described in Chapter 3.3.
When the specifications of a supercapacitor are given, it should be clarified whether the
values correspond to a single electrode measurement or a complete capacitor. If the capacitance
of the positive and negative electrodes can be expressed as Cp and Cn, the overall capacitance can
be expressed as the following equation:[15]
npCCC
111 (2. 5)
If these two electrodes are the same, i.e., symmetric supercapacitor, the overall capacitance
would be half of either one’s capacitance. If two electrodes are different, the electrode with
smaller capacitance determines the overall capacitance (the same for LIBs).
The maximum energy (E) and power (P) stored in such a capacitor is given by
221 CV/E (2. 6)
RVP 4/2 (2. 7)
Here V is the operation potential of the capacitor and R represents the total series resistance.[3]
All these values can be obtained by CV, galvanostatic charge/discharge and electrochemical
impedance spectroscopy measurements, which will be described in Chapter 3.3.
The principle of double layer capacitance
Figure 2. 10a shows a charged EDLC at open circuit, with two potential drops across the
electrode/electrolyte interfaces. For aqueous electrolyte-based EDLC, the highest operating
potential is 1.2 V, and the potential could reach up to 4 V for organic electrolyte-based EDLC.
The double layer is generally referred to a simplified model—the compact Helmholtz layer, with
a thickness of 2-10 Å. Actually the full double layer should include another diffusion layer with
a certain distance to the electrode/electrolyte interface, the so-called Stern model, as shown in
Figure 2. 10b. Because ions on the solution side of the double layer would not remain static in a
compact array, but would be subject to the effects of thermal fluctuation according to Boltzmann
principles.[2] The Helmholtz layer and diffusion layer are conjugate components (in series) of

Chapter 2. Introduction to electrochemical energy storage 21
the overall double layer. The smaller one of the two capacitances determines the overall double
layer capacitance.[2]
Figure 2. 10. Schematic diagrams (a) a single-cell double layer capacitor and the illustration of the potential drop at
the electrode/electrolyte interface. Reproduced from Ref. [3]. (b) Stern model of the double layer for finite ion size
with thermal distribution, combining Helmholtz and diffusion layers. Reproduced from Ref. [2].
The principle of pseudocapacitance
Pseudocapacitance arises at electrode surfaces, where a charge storage mechanism different from
the EDLC applies. Fast and reversible faradaic (redox) reactions take place on the electrode
materials and involve the passage of charges across the double layer, similar to the charging and
discharging processes that occur in batteries.
Figure 2. 11. The working principle of pseudocapacitors. (a) Redox reaction on surface; (b) redox reaction in bulk.
Reproduced from Ref. [1].
Three types of faradaic processes can be distinguished: reversible adsorption (e.g., adsorption
of hydrogen on the surface of platinum or gold), redox reactions of transition metal oxides and
reversible electrochemical doping-dedoping in conducting polymer based electrodes.[2] In other

22 Chapter 2. Introduction to electrochemical energy storage
words, two processes occurring on both surface and bulk are responsible for pseudocapacitance.
Thus pseudocapacitors exhibit a capacitance 10-100 times higher than EDLC.[2] Schematic
illustrations describing the two processes are shown in Figure 2. 11.
For the hybrid supercapacitor, both EDLC and faradaic capacitance mechanisms occur
simultaneously, but one of them determines the overall performance. In both mechanisms, large
surface area, appropriate pore-size distribution, and high conductivity are essential properties of
the electrode materials to achieve large capacitance.
Electrolyte
The electrolyte in a supercapacitor requires the following properties: wide voltage window, high
electrochemical stability, high ionic concentration and low solvated ionic radius, low resistivity,
low viscosity, low volatility, low toxicity, low cost as well as availability at high purity.[15] Four
types of electrolytes can be used in supercapacitors: aqueous electrolytes, organic electrolytes,
ionic liquids (ILs) and solid-state polymer electrolytes.[15]
Aqueous electrolytes like H2SO4, KOH, Na2SO4, and NH4Cl aqueous solutions can provide a
higher ionic concentration and lower resistance. However, the big disadvantage of aqueous
electrolyte is the small voltage window of 1.2 V, much lower than those of organic electrolytes.
Organic electrolytes can provide a high voltage window of 3.5~4 V. Acetonitrile and PC are
the most commonly used organic solvents. Acetonitrile can dissolve larger amounts of salt than
other solvents, but suffers from environmental and toxic problems. PC-based electrolytes are
friendly to the environment and can offer a wide electrochemical window, a wide range of
operating temperature, as well as good conductivity. Besides, organic salts such as
tetraethylammonium tetrafluoroborate, tetraethylphosphonium tetrafluoroborate and
triethylmethylammonium tetrafluroroborate (TEMABF4) have also been used in organic
electrolytes for supercapacitors. Water content has to be kept below 3-5 ppm to ensure the
operating voltage window safe.
ILs can exist in liquid form at desired temperatures, thus they are solvent free. A high voltage
of 5 V can be achieved for ionic-liquid based supercapacitors. ILs mainly include imidazolium,
pyrrolidinium, as well as asymmetric aliphatic quaternary ammonium salts with anions such as
tetra fluoroborate, trifluoromethanesulfonate, bis(trifluoromethanesulfony)imide,
bis(fluorosulfony)imide or hexafluorophosphate.[85-87] Room temperature ILs are usually
quaternary ammonium salts such as tetralkylammonium [R4N]+, and cyclic amines such as

Chapter 2. Introduction to electrochemical energy storage 23
aromatic pyridinium, imidazolium and saturated piperidinium, pyrrolidinium. Low temperature
ILs are based on sulfonium [R2S]+ as well as phosphonium [R4P]
+ cations.[85]
Solid-state polymer electrolytes are fabricated by mixing the electrolyte solution (e.g., acid or
alkalis in water, Li salt in organic solution, and ionic liquid) into a specific polymer matrix (e.g.,
polyvinyl alcohol (PVA), polyethylene oxide (PEO), polyvinylidene difluoride (PVDF)). The
maximum working voltage of solid-state polymer electrolyte is determined by the electrolyte
solution: < 1.2 V for aqueous electrolyte based electrolyte and > 2 V for organic solution or ionic
liquid-based electrolyte. Due to the existence of polymer component, the ionic conductivity of
solid-state polymer electrolyte is lower than its liquid counterpart.[88] There is no leakage issue
and bulky packaging can be eliminated. It can also function as a separator between electrodes
and bind two electrodes together into an integrated unit, which is beneficial in developing
flexible energy storage devices.
Equivalent circuit
The equivalent circuit for most battery-type energy storage systems involves a Faradaic
resistance (RF), which represents the potential dependence of the reciprocal of the rate of the
oxidation and reduction charge transfer process. RF is in parallel with a double layer capacitance
Cdl (here Cdl is the overall capacitance of the device). Some diffusion control may arise under
high-rate discharge or charge, in which case RF is in series with a so-called Warburg C-R
impedance element written as W.[2] For both supercapacitors and batteries, an electrolyte
resistance element RE, in series with the Faradaic impedance ZF, is usually necessary in order to
fully represent the charging or discharging behavior. In fact, RE plays a very important role in the
evaluation and performance of supercapacitors and LIBs for high-rate discharge applications,
and has an important influence on the ac impedance spectrum of the devices.[2] The complete
equivalent circuit model is shown as follows.
Figure 2. 12. Equivalent circuit model for a battery-type energy storage system (e.g., LIBs and supercapacitors).

24 Chapter 2. Introduction to electrochemical energy storage
Bipolar cell design
Most batteries and capacitors have been made with conventional ‘monopolar’ technology that
uses two electrodes per cell and then connects those cells in a series of metallic connectors
outside of the cells, as shown in Figure 2. 13a. This design results in ohmic losses of the
electrodes leading to unsymmetrical distribution of the current density during operation.
Furthermore, these grid and cell connections increase the total weight of the battery. Bipolar and
monoploar designs share the same chemistry, while in bipolar systems as shown in Figure 2. 13b,
the cells are stacked in a sandwich construction so that the negative electrode of one cell
becomes the positive electrode of the next cell, from where the definition of bipolar comes.[89]
The cells are separated from each other by the bipolar electrode, which allows each cell to be
operated in isolation from its neighbor. Stacking these cells next to one another allows the
potential of the battery/capacitor to be increased. Since the cell wall becomes the connection
element between cells, bipolar electrodes have a shorter current path and a larger surface area
compared to monopolar cells. This construction reduces the power loss that is normally caused
by the internal resistance of the cells. At each end of the stack, single electrodes act as the final
anode and cathode. The bipolar construction leads to reduced weight, higher power/energy
density with smaller container than conventional monopolar systems. But bipolar systems require
that the edges of the electrodes should be carefully sealed to the case in order to avoid leakage
current, which has been the challenge for the commercialization of bipolar ones.
Figure 2. 13. Schematic illustrations showing cell designs of (a) monopolar, connected with metallic wires and (b)
bipolar. Reproduced from Ref. [89].

Chapter 2. Introduction to electrochemical energy storage 25
2.2.3 Electrode materials
Carbon materials
Currently, the most widely used electrode materials for double-layer supercapacitors are carbon
based materials. Carbon materials exhibit true capacitive behavior and excellent electrochemical
stability upon repeated cycling but the overall specific capacitance is relatively low compared to
pseudocapacitive materials. As shown in Figure 2. 14, CV curves of carbon materials have good
rectangular shapes, and the galvanostatic charge-discharge profile has triangular symmetrical
shape, indicating good capacitive behaviors. The typical capacitance of carbon materials is 50-
200 F g1
in aqueous electrolytes, 30-100 F g1
in organic electrolytes and 20-70 F g1
in ionic
liquids.[1] Since the working principle depends mainly on double layer capacitance at the
interface between the electrode and electrolyte, the surface area accessible to the electrolyte ions
would determine the whole performance of electrodes. Thus the specific surface area, pore-size
distribution, pore shape and structure, electrical conductivity, and surface functionality are all
playing very important roles.
According to Conway’s work, three requirements should be satisfied for selecting
supercapacitor electrode materials: (1) high specific surface areas, (2) good intra-and
interparticle conductivity in porous matrices, and (3) good electrolyte accessibility to the
intrapore space of carbon materials.[2] High specific surface area carbon materials mainly
include activated carbon, carbon fibers, carbon aerogel, CNTs, graphene, carbide-derived carbon,
and carbon onions. Many methods have been investigated to increase the specific surface area,
including heat treatment, alkaline treatment, steam or CO2 activation, and plasma surface
treatment with NH3,[15] through which micropores and defects on the carbon surface can be
obtained. It is also of significant importance to pay attention to the pore size since not all the
micropores in the electrode are necessarily accessible to electrolyte ions. It is reported that pore
sizes smaller than 0.5 nm were not accessible to hydrated ions,[90, 91] and that even pores under
1 nm might be too small for organic electrolytes since the size of the solvated ions is large than 1
nm.[92]
In addition to high specific surface areas and appropriate pore sizes, surface functionalization
has also been considered as an effective way to improve the specific capacitance of carbon
materials.[15] It is believed that surface functional groups or heteroatoms can adsorb ions, thus

26 Chapter 2. Introduction to electrochemical energy storage
improving the hydrophilicity and leading to enhanced wettability. On the other hand, functional
groups on the surface of carbon materials can introduce Faradaic currents and pseudocapacitance,
and finally leading to a 5-10% increase in the overall capacitance. Commonly used surface
functional groups contain oxygen, nitrogen, boron, sulfur and phosphorus.[1]
Figure 2. 14. (a) Typical CV curves of an activated mesocarbon/CNTs compound electrode; (b) galvanostatic
charge-discharge curves of the mesocarbon/CNTs electrode at a current rate of 0.5 A g1
. Reproduced from Ref. [93],
Copyright 2010, Elsevier.
Transitional metal oxides
Transitional metal oxides such as RuO2, MnO2, Co3O4, NiO, and V2O5 have been extensively
studied in the past decades. Three requirements for transitional metal oxides as electrodes for
supercapacitors are: i, the oxide should be electronically conductive; ii, the metal ions have two
or more oxidation states that coexist over a continuous range with no phase changes involving
irreversible modifications of a 3-dimensional structure, and iii the protons can freely intercalate
into the oxide lattice upon reduction and out of the lattice upon oxidation, allowing facile
interconversion of O2
and OH.[15] The specific pseudocapacitance exceeds the double layer
capacitance of carbon materials, promoting interest in these systems. However, on the other hand,
since redox reactions are involved, pseudo-capacitors often suffer from less stability during
cycling.
Ruthenium oxide is the first studied transitional metal oxide as electrode for supercapacitors
since it has good conductivity and three distinct oxidation states accessible within 1.2 V. It can
be described as a fast, reversible electron transfer together with an electron-adsorption of protons

Chapter 2. Introduction to electrochemical energy storage 27
on the surface of RuO2 materials, according to the following equation where Ru oxidation states
can change from Ru2+
up to Ru4+
:[2, 16]
xx(OH)RuOxexHRuO
22 (2. 8)
here 0x2. The continuous change of x during proton insertion or desertion occurs over a
window of 1.2 V and leads to a capacitive behaviors with ion adsorption following a Frumkin-
type isotherm.[2] Therefore the CV curve of RuO2 also has a rectangular shape with a mirror-
image symmetry, like EDLCs, similar to the behaviors of MnO2 as shown in Figure 2. 15.
Specific capacitance of more than 600 F g1
for RuO2 has been reported, but the high cost has
limited its application.
Less expensive oxides of iron, vanadium, nickel, manganese and cobalt have been tested.
Among all the oxides, manganese oxide shows the highest capacitance (theoretical specific
capacitance of 1370 F g1
). The fast, reversible successive surface redox reactions give rise to a
rectangular CV curve, as shown in Figure 2. 15.
Figure 2. 15. A CV curve of a MnO2 electrode in aqueous electrolyte (0.1 M K2SO4) shows the successive multiple
surface redox reactions leading to the pseudo-capacitive charge storage mechanism. The sequence of consistant
redox reaction between Mn3+
and Mn4+
. Reproduced from Ref.[16], copyright 2008 Nature, Macmillan Publishers
Limited.
28 Chapter 2. Introduction to electrochemical energy storage
The charge storage mechanism of manganese oxide is based on surface adsorption of
electrolyte cations C+ (K
+, Na
+…) as well as proton incorporation according to the following
equation: [16]
yxHMnOOCy)e(xyHxCMnO
2 (2. 9)
Manganese oxides also face several challenges: (i) Dissolution problem. Owing to the partial
dissolution of MnO2 in the electrolyte during cycling, they suffer from capacitance degradation.
The reason is that Mn2O3 or MnOOH can be converted into MnO2 and Mn2+
, the latter can be
dissolved in solution. To solve this problem, new electrolyte salts have been developed to avoid
forming acidic species in the solution. Another way is to coat a protective conducting polymer.
(ii) Low specific surface area and poor electronic/ionic conductivity. To solve these challenges,
effective ways would be developing nanostructured MnO2 materials, and probably introducing
other composite elements into them at the same time.[94] To enhance the electrical conductivity,
doping manganese oxides with ruthenium, gold, nickel, activated carbon, CNTs, graphite and
conducting polymers have been used.[15, 94]
Conducting polymers
Conducting polymers store capacitance through Faradaic redox reactions. They can be positively
or negatively charged with ion insertion (redox reaction) in the polymer matrix to balance the
injected charge.[15] The redox reactions in the conducting polymers occur only on the surface.
Since no structure alterations are involved upon charge/discharge reactions such as phase
changes, the processes are highly reversible.
The redox reactions are also termed as ‘doping’. The positively charged polymers, introduced
by oxidation on the repeating units of polymer chains, are termed as ‘p-doped’, while negatively
charged polymers generated by reduction are termed as ‘n-doped’. The potentials of these doping
processes are determined by the electronic state of π electrons.
The widely utilized conducting polymers for supercapacitors are PANI, PPy, PTh, poly (3,4-
ethylene-dioxythiophene) (PEDOT) and their derivatives.[15] PANI and PPy, which can only be
p-doped, are often used as cathode materials, because their n-doping potentials are much lower
than the reduction potential of common electrolyte solutions. PEDOT has a high stability, which
can be easily deposited as thin films. They can only work within a strict potential window,

Chapter 2. Introduction to electrochemical energy storage 29
otherwise the polymer may be degraded at too positive potentials, and switched to an insulating
state (un-doped state) at too negative potentials.
However, swelling and shrinking of conducting polymers may occur during the
intercalation/deintercalation process, leading to the mechanical degradation and fading
electrochemical performance during cycling. Thus the conducting polymer based supercapacitors
often remarkably degrade under less than a thousand cycles. To mitigate the challenge, many
methods have been investigates. (i) Improving the polymers’ structures and morphologies.
Nanostructured polymers provide a relatively short diffusion length to enhance the utilization of
electrode materials. (ii) Hybridizing supercapacitors. Since polymers in the n-doped state have
poorer stability than those in the p-doped state, replacing an n-doped polymer at the negative
electrode by carbon gives a better performance. (iii) Fabricating composite electrode materials.
Composite conducting polymers can improve the chain structure, conductivity, and mechanical
stability. Incorporating carbon into polymers is considered to be an effective solution to improve
the mechanical and electrochemical properties.[15] A PANI/CNT composite electrode could
even offer a high specific capacitance of 1030 F g1
in 1 M H2SO4 within a potential window of -
0.2~0.7 V at a current density of 5.9 A g1
.[95]
2.2.4 Flexible micro-supercapacitors
The idea of flexible electronics has already appeared for quite a time. Figure 2. 16 gives the
illustrations of various flexible mechanical and electrical devices. Unconventional burgeoning
consumer electronics have opened a new prospect of future wearable electronics such as smart
skins, human friendly implantable sensors, and stretchable circuitries.[96] A smart skin may
potentially provide a solution for on-body sensing that can monitor physiological signals and
healthcare data of human bodies while supporting people in various situations and activities.[97]
Conductive threads can be woven into fabrics, which are so called e-textiles. For example, a
medical-monitoring shirt integrated with light-emitting diodes, which could become
lifesavers,[98] not to mention electronics which can be implanted into human body to attach on
certain organs for special treatment. Wearable electronics has stimulated the developing and
designing of multifunctional electronic components including transistors, displays, and energy
harvesting, conversion and storage devices on a single textile substrate to achieve a fully self-

30 Chapter 2. Introduction to electrochemical energy storage
powered and self-sustaining integrated system. Thus high performance energy storage devices
with features of being small, thin, lightweight, and wearable are in great demand.
Flexible micro-supercapacitors have attracted extensive attention because they are capable of
providing higher power density, easier to be integrated with other components, and safer
compared to other energy storage sources. The challenge is to transform the device configuration
from being rigid and boxy to being flexible and thin while still maintaining good electrochemical
performance, reliability and integration.
Figure 2. 16. The schematic illustrations of various flexible mechanical and electrical sensors: (a) E-skins; (b)
Wearable and skin-attachable sensors; (c) Implantable components for in vivo diagnostics; (d) Advanced sensors
with additional functionalities, reprinted from Ref.[96].
The most commonly seen configuration of such flexible energy storage devices is based on a
solid planar structure, such as carbon cloth,[99] paper,[13, 100] Teflon plate, metal substrate,
poly-demethylsiloxane (PDMS), scotch tape, polyethylene terephthalate (PET).[101] Recently
energy storage devices in the form of fibers,[102-104] yarns[105-107] or wires,[108] which are
feasible to be woven into textiles or other similar structures, have also attracted great interest.

Chapter 2. Introduction to electrochemical energy storage 31
2.3 Similarities and differences between LIBS and
supercapacitors for electrochemical energy storage
A supercapacitor corresponds to an equilibrium situation at all states of charge across the CV or
along the charging curve, demonstrated by its symmetric CV curve in Figure 2. 15. In contrast,
the electrochemical processes in a battery are rarely reversible in the above mentioned sense and
a substantially different range of potentials is required for oxidation of the active material
compared with that for its reduction. The CV curve is asymmetric and no mirror-image
appearance is manifested, as shown in Figure 2. 4b.[2] In comparison with rechargeable batteries,
supercapacitors can endure higher number of cycles, be charged and discharged a hundred times
faster and reach at least 20 years of useful life, and also work at temperatures below 0 °C.[109]
The overall comparisons of LIBs and supercapacitors are listed in the following table.
Table 2. 3 Overall comparison between LIBs and supercapacitors. summarized based on Ref. [2].
LIBs Supercapacitors
1. High energy density
2. Relatively poor power density, depending on kinetics
3. Ideally has single-valued free energies of components
4. Irreversibility is common. Recharge curve is not mirror image of
discharge curve, e.g., in CV. Poor cycle life due to degradation of
active materials
5. Has corresponding single-valued potential or sloped potential
plateau during charge and discharge
6. Response to linear scan of potential gives irreversible I vs. V
profile with nonconstant currents
7. Has significant temperature-dependent activation polarization
8. Electrolyte conductivity can decrease or increase on charging,
depending on chemistry of cell reactions
9. Can be constructed in bipolar configuration
10. Temperature range:0-60 ºC
Limited energy density
High power density
Has continuous variation of free energy with degree
of conversion of materials or extent of charge
Excellent reversibility is common (cycle life > 100,
000). CV curves are symmetric.
Has corresponding continuous variation of potential
during charge and discharge
Response to linear scan of potential roughly gives
constant charging current profile but with some
dependence on materials
Has little or no activation polarization
Electrolyte conductivity can diminish on charging
due to ion adsorption
Can be constructed in bipolar configuration
-20~60 ºC

32 Chapter 3. Experimental methods
3 Experimental methods
This chapter discusses experimental methods and techniques: firstly, the deposition method to
prepare electrodes for LIBs and supercapacitors; secondly, the detailed fabrication process of a
single rolled-up Si battery; thirdly, the detailed fabrication of flexible supercapacitors; fourthly,
the currently used electrochemical measurement techniques including cyclic voltammetry (CV),
galvanostatic charge/discharge, potential step chronoamperometry (PSCA) and the
electrochemical impedance spectroscopy (EIS); and lastly, the characterization method for
materials including scanning electron microscopy (SEM), X-ray diffraction (XRD), X-ray
photoelectron spectroscopy (XPS), atomic force microscopy (AFM) and Raman spectroscopy.
3.1 Deposition methods
3.1.1 Lithography
The purpose of lithography is to transfer patterns from a pre-fabricated photomask to other
photosensitive materials on a substrate. Optical lithography through UV-light exposure is the
most commonly used technique, including contact printing, proximity printing and projection
printing.[110] In addition, X-ray and electron beam lithography are also in use. The
photosensitive materials, named photoresist, consist of polymers whose chemical solubility can
be tuned after a certain light exposure. Generally, photoresists can be separated into positive and
negative ones, which are defined as follows: the exposed area of positive photoresists will be
removed by a chemical developer solution, while the unexposed area of negative ones is
removed. Well-defined structures can be precisely transferred to the substrate by specific
handling of the photosensitive layer and the substrate. Herein, a mask aligner MA 56 (SÜSS
MicroTec AG, Germany) working in contact mode was used.
In this work, a glass substrate was firstly cleaned with acetone and isopropanol, blown dry by
nitrogen, afterwards treated by oxygen plasma for 5 min. AZ-5214E (Microchemicals GmbH,
Germany) is actually a positive photoresist, but it enables the reversal of structures after
changing its solubility by appropriate thermochemical modification, resulting in a sharp undercut
like a high resolution negative resist. Therefore it is used in multistep lift-off procedures to create

Chapter 3. Experimental methods 33
patterns. To enhance the adhesion of the resist on a substrate, another additional adhesive layer
(TI Prime) is necessary before use, specifically on a glass substrate. The processing parameters
are as follows. TI prime: spin-coating at 3500 rpm (revolutions per minute) for 35 s, baking at
120 ºC hotplate for 2 min. AZ-5214E: spin-coating at 4000 rpm for 35 s, baking at 90 ºC hotplate
for 5 min. Then the glass substrate was exposed with UV-light for 2 s through photomask and
once again baked at 120 ºC hotplate for 2 min. The substrate was flood exposed to UV-light for
30 s, developed in an AZ-726 developer for 45 s~1 min, cleaned by deionized water, and finally
blown dry by N2.
3.1.2 Electron beam evaporation
One of the most popular techniques for fabricating thin films is electron beam evaporation,
which enables the deposition of almost all materials. It is a physical vapour deposition (PVD) in
which a source material is bombarded with an electron beam released from a charged tungsten
filament under high vacuum. Atoms from the source material is transformed into gaseous phase
and condensed on the surface of a substrate. Normally no chemical reactions are involved during
depositions, accompanied with a relatively low temperature on the substrate, thus resulting in
stable depositions of source materials. The thickness and deposition rate can be monitored by a
quartz crystal microbalance (QCM). Figure 3.1 shows a process flow example for rolling-up
nanomembranes. The substrate with patterned photoresist is transferred to the chamber of
electron beam evaporator, and deposited with a tilted angle in order to create an edge window for
the subsequent etching of photoresist, which serves as the starting point of the rolling process.
However, it is noteworthy that the resident films exist on the substrate all around the rolled-up
tubes. In order to roll up a single tube, multistep lithography is necessary to remove the resident
films. In this work, an electron beam evaporator BOC Edwards FL400, Germany was used to
deposit thin films. The details of rolling-up a single tube on chip are described in Chapter 4.

34 Chapter 3. Experimental methods
Figure 3. 1. Process flow for positioning rolled-up nanomembranes. a) Top and cross-section view of patterned
photoresist layer on a substrate; b) Schematic diagram of the tilted deposition method exploiting the ballistic shadow
effect; c) SEM image of rolled-up Ti/Au nanomembranes fabricated according to (b). Cited from Ref. [5].
3.2. Rolled-up nanotechnology
Rolled-up nanotechnology (strain engineering) was firstly introduced in 2001 by Schmidt and
Eberl in Nature.[4] By selectively etching a sacrificial layer (either inorganic or organic film), a
thin solid film can be released from a substrate with an internal strain gradient, which enables the
rolling up of the film. A scheme showing the rolling-up procedure is depicted in Figure 3. 2.
Three major parameters are influencing the strain state: (i) difference in the thermal expansion
between sacrificial layers and deposited films controlled by the substrate temperature, (ii)
deposition rate, and (iii) stress evolution during deposition.[5] By choosing appropriate
parameters, these 2D nanofilms can be rearranged into various 3D micro-/nanostructures
including tubes, helices, rings, wrinkles and other advanced micro-architectures with controlled
diameters, which find applications in micro/nano optics,[111] biology,[112-114] and
electronics[115, 116] as well as energy storage.[6, 8, 9, 117-119]
Figure 3. 2. A scheme showing the method to roll-up a tube. Strained layer can potentially be any kind of materials
with thicknesses in nanometer. Typical sacrificial layers can be GeOx, SiO2, photoresist, polyacrylamide, etc., each
of which can be etched with a specific solution.

Chapter 3. Experimental methods 35
Various materials with rolled-up tubular structures for advanced LIB anodes have been
developed, such as RuO2/C,[6] Ge/Ti,[8] Si/C,[9] GeO2,[117] SnO2/Cu,[119] and
SiOx/SiOy,[120] all of which have shown enhanced performance (e.g., capacity and cycling
stability) due to the fast ionic transport and powerful strain accommodation benefiting from the
unique micro/nano-hierarchical structures.
3.3 Electrochemical measurements
3.3.1 Cyclic voltammetry
CV is a widely utilized voltammetric measurement for electrochemical reactions involved
experiments, since it gives evident and intuitive descriptions of redox reactions. In a CV
measurement, the potential of working electrode is scanned at a certain rate to a set potential and
then scanned inversely. At the same time, the current response is recorded and plotted vs. the
applied potential. CV peaks occur because the current increases as the potential reaches the
redox potential of the reactant, but then falls off when the concentration of the reactants is
depleted near the electrode surface. The slower the scan rate, with thinner electrodes and highly
oriented particles, the narrower and better resolved are the peaks. With very thin and highly
oriented electrodes at sufficiently low scan rates, the CV may reflect a behavior that is beyond
diffusion control, approaching the thermodynamic limit.[121] Therefore, CV behaviors are
closely related with the diffusion effects, and helpful to understand electrochemical kinetics.
According to Nernst equation, the reversibility can be determined by the potential difference of
the anodic and cathodic peaks. When the potential difference is < 58 mV, the redox system is
reversible. Reversibilities are very important for electrochemical energy storage systems. The
specific capacitance of the overall capacitor can be calculated from the CV according to the
following equation:[15]
vmU
IdU
mU
v
dUI
mU
Idt
mU
QC
***2**2**2**2
(3. 1)
C (F g1
or F cm3
) denotes the specific capacitance, Q is the total charge integrated from CV
curves. U is the potential window, m is mass (in case of volumetric capacitance, here is the

36 Chapter 3. Experimental methods
volume V), v is the scan rate of CV measurement. In this work, a Zahner IM 6 was used to carry
out CV measurement.
3.3.2 Galvanostatic charge/discharge
Galvanostatic charge/discharge was carried out by inputting a constant current into the energy
storage device, and monitoring the voltage and the capacity. Various current densities could be
input. In this work, Arbin BT2000 system was used to perform the galvanostatic
charge/discharge measurement. Representative discharge-charge voltage profiles of a 2 m Si
film anode at various current densities are shown in Figure 3. 3, where plateaus indicate the
alloy/dealloy process of Si and Li.
Figure 3. 3. Representative discharge-charge voltage profiles of a 2 m Si film anode at various current densities
from 0.15 mA cm2
to 1.05 mA cm2
. Published in Ref. [122].
3.3.3 Potential step chronoamperometry
PSCA is an electrochemical technique in which the potential of the working electrode is stepped
and the resulting current from faradic processes occurring at the electrode (caused by the
potential step) is monitored as a function of time. In this work, small-amplitude of potential
perturbation was applied to the electrochemical system using Zahner IM6 to investigate the
different diffusion behaviors of the Si tube and planar film anode. In general, a PSCA
experiment is carried out for a redox reaction:[123]

Chapter 3. Experimental methods 37
ReOf
b
k
k (3. 2)
can be treated by invoking the current-potential characteristic:[123]
](O,t)eC,t)e([CFAkI )E)f(E(
R
)Ef(E
O
'' 00 10 0 (3. 3)
in conjunction with Fick’s laws, which can give the time-dependent surface concentrations. In
short time region, the current-time response is as follows:[123]
2/12/1
2/1
)(t
CnFADtI OO
(3. 4)
which is known as the Cottrell equation, and independent of geometries of the electrode.
Therefore, the diffusion coefficient of ions can be obtained. The details will be discussed in
Chapter 4.
3.3.4 Electrochemical impedance spectroscopy
EIS is realized by applying a single-frequency voltage or current to an electrochemical system
and measuring the phase shift and amplitude (Bode plot), or real and imaginary parts (Nyquist
plot), of the resulting current at that frequency using either analog circuit or fast Fourier
transform (FFT) analysis.[124] It is a useful and convenient way to detect both the intrinsic
properties and external stimulus, which influence the conductivity of an electrochemical system.
The frequency response to a small-amplitude ac signal in a frequency range of 10-4
and >106 Hz
can be measured and analyzed. Here Zahner IM 6 was used to carry out EIS measurement. A
simplified analog circuit, including resistor and capacitor connected either in parallel or in series,
can be used to analyze a LIB or supercapacitor, such as Figure 2. 12. The following schematic
shows a Nyquist plot of an ideal capacitor and an electrochemical capacitor, both having the
same ESR (equivalent series resistance at 1 kHz). The ideal capacitor exhibits a vertical line,
while the electrochemical capacitor starts with a 45 º impedance line, approaching an almost
vertical line only at low frequencies.[3]

38 Chapter 3. Experimental methods
Figure 3. 4. Schematic representation of the Nyquist impedance plot of an ideal capacitor (vertical thin line) and an
electrochemical capacitor with porous electrodes (thick line). Cited from Ref. [3].
3.4 Characterization methods
3.4.1 Scanning electron microscopy
SEM enables the investigation of materials with micro/nano-structured surfaces. A focused beam
of electrons is scanned over a rectangular raster area onto a sample, and interacts with atoms in
the sample, producing various detectable signals which contain the information about the surface
topography and composition. These signals include secondary electrons (SEs), back-scattered
electrons (BSEs), characteristic X-rays, transmitted electron, and so on. Among them, SEs are
most commonly used to detect the morphology of a sample. A number of electrons at each raster
point can be detected and converted into an intensity map. BSEs are often used in analytical
SEM along with the spectra made from the characteristic X-rays, since the intensity of the
inelastic scattered BSE is strongly related to the atomic number of the element. SEs have lower
energies than BSEs and are given off from the substrate near the sample as a side effect. In this
work, Zeiss DSM982 and NVision40 were employed for SEM characterizations. Prior to the
SEM characterization, a single Si tube was coated with 5 nm of Au by electron beam evaporator
for a good surface conductivity.

Chapter 3. Experimental methods 39
3.4.2 X-ray diffraction
XRD detects the crystal structure, chemical compositions, the average spacing between layers or
rows of atoms, as well as the size, shape and internal stress of a material. X-ray was discovered
in 1895 by Röntgen and XRD was found in crystals in 1912 by Laue. Then the Braggs succeeded
in analyzing the crystal structure of NaCl using XRD. X-ray is a form of electromagnetic
radiation, with a wavelength between 0.01 to 10 nm and energies in the range of 100 eV ~ 100
keV. The principle is based on Thomson scattering (elastic) of X-rays. In an X-ray diffraction
measurement, a material is bombarded with X-rays, producing a diffraction pattern of regularly
spaced spots known as reflections. The 2D images taken at different rotations are converted into
a three-dimensional model of the density of electrons within the crystal using the mathematic
method of Fourier transforms, combined with chemical data known for this sample. In this work,
an X-ray diffraction (PANalyticalX'Pert PRO Diffraction, Co-Ka radiation, reflection geometry)
was used. The indexing of the reflections was carried out using the PDF-4+2010 database of the
International Center for Diffraction Data (ICDD).
Figure 3. 5. Schematic showing the working principle of XRD. Reprinted from [125].
3.4.3 X-ray photoelectron spectroscopy
XPS is used to investigate the surface (maximum ~10 nm) of a material and can be used to
determine the valence state of elements. In this work, SPECS PHOIBOS 100 was used. In XPS,
photons of low energy (~1.5 keV) excite the core electrons above the Fermi level. The energy
spectrum of the emitted photoelectron is determined by means of an electron energy
spectrometer. X-ray irradiates the sample in ultra-high vacuum environment, and atoms near the
sample surface emit electrons (photoelectrons) either from the core-level or the valance band.
The energy of photo-emitted electrons is related to the electronic structure of the atoms or
molecules from which they are excited. The number of characteristic photo-emitted electrons is
proportional to the concentration of the corresponding type of atoms in the material. The

40 Chapter 3. Experimental methods
working principle of XPS is shown in Figure 3. 6. The kinetic energy of electrons emerging from
the surface plus the binding energy of the electrons equals the incident energy of X-ray.
Therefore the binding energy of atoms can be determined by measuring the kinetic energy of
emitted electrons.[126]
Figure 3. 6. A Schematic diagram shows the working principle of XPS. Cited from Ref. [126].
3.4.4 Atomic force microscopy
AFM gives 3D information of a surface in the nanometer scale including the roughness, depth,
and morphology. The working principle is designed on the basis of measuring forces between the
tip and sample.[127] The tip is mounted at the end of a flexible cantilever. The force is measured
by the spring constant of the cantilever and the tip-sample distance, and described by Hook’s law.
If the tip is quite far away from the sample surface, forces hardly exist. When the tip comes
closer to the surface, the attractive Van der Waals force is dominant. Even closer or nearly in
contact with the surface, the repulsive Van der Waals will dominate in the system. In this work, a
Nanoscope III SPM (Digital Instruments) was used.
3.4.5 Raman spectroscopy
In this work, Renishaw with 442 nm wavelength was used to carry out Raman spectroscopy.
Raman effects, observed in practice in 1928 by Sir C. V. Raman, are used to observe vibrational,
rotational, and other low-frequency modes in a system. [128] The working principle is based on
inelastic (Raman) scattering of monochromatic light, usually from a laser in the visible, near
infrared, or near ultraviolet range. An incident laser photon interacts with a molecule (solid,

Chapter 3. Experimental methods 41
liquid or gaseous), resulting in the molecule in a virtual energy state for short time before an
inelastically scattered photon is produced. The inelastically scattered photon can be of higher
(anti-Stokes) or lower (Stokes) energy than the incoming photon. To keep balanced, the
vibrational state of the molecule will be shifted down or up. The shift in energy gives
information about the vibrational modes in the system. Rayleigh scattering is an example of
elastic scattering, which is of the same frequency as the incoming electromagnetic radiation. In a
Raman spectroscopy measurement, elastic Rayleigh scattering is filtered out while the rest of the
collected light is dispersed onto a detector by either a notch filter or a band pass filter. A
schematic depicting the shift of energy states in two kinds of scattering is shown as follows:[129]
Figure 3. 7. A schematic energy-level diagram indicating the states involved in Raman signal. The line thickness is
roughly proportional to the signal strength from the different transitions. Cited from Ref. [129].

42 Chapter 4. A Single Rolled-Up Si Tube Battery
4. A single rolled-up Si tube micro-battery
4.1 Introduction
This chapter is based on the publication of Adv. Mater. 2014 (DOI: 10.1002/adma.201402484),
titled “A Single Rolled-Up Si Tube Battery for Study of Electrochemical Kinetics, Electrical
Conductivity and Structural Integrity”.
Silicon based anodes for LIBs have been the focus of intensive research interests, primarily
because silicon exhibits a very high theoretical specific capacity (4200 mAh g1
for Li22Si5 at
415 °C)[41] and is among the most promising candidates that can replace graphite as anodes in
rechargeable LIBs. At room temperature, Li15Si4 (or a-Li3.75Si) is the highest lithiated phase
achievable or the lithiation of silicon, corresponding to a capacity of 3579 mAh g1
.[42-46] Upon
repeated alloying-dealloying, a huge volume change of Si (280%)[44, 48] also accompanies the
lithiation-delithiation process, which leads to the loss of contact or pulverization of the
electrodes. An effective approach to enhance the cycling performance is to utilize nanostructured
Si and their composites with carbon materials, such as Si nanoparticles,[49] Si
nanowires/nanorods,[47, 50] Si nanotubes[51] and Si nanospheres.[52] Designing and
fabricating micro/nanoscale hybrid materials to take advantage and restrain shortcomings of
them is an important approach to develop high performance LIBs.[1]
Rolled-up nanotechnology[4, 5, 130] offers an advanced strategy to deterministically rearrange
2D nanomembranes into 3D micro/nano-hierarchical tubes, helices, rings, wrinkles and other
advanced architectures for micro/nano optics,[111] biology,[112-114] and electronics[115, 116]
as well as energy storage applications.[6, 8, 9, 117-119] In our group, we have reported on
various materials with rolled-up tubular structures for advanced LIB anodes, such as RuO2,[6]
Ge/Ti,[8] Si/C,[9] GeO2,[117] SnO2/Cu,[119] and SiOx/SiOy,[120] all of which have shown
enhanced performance (e.g., capacity and cycling stability) due to the fast ionic transport and
powerful strain accommodation benefited from the unique hollow micro/nano-hierarchical
structure. Despite this, a comprehensive understanding of the correlation between the electrodes’
tubular structure, electrical/ionic conductivity and the electrochemical kinetics as well as the
performance is still missing. However, it is of a great challenge to carry out these studies with
Chapter 4. A Single Rolled-Up Si Tube Battery 43
bulk batteries, since they are often composed of electrodes mixed with conductive additives and
polymer binders, which introduce significant uncertainties into any quantitative electrochemical
kinetic studies. In order to eliminate these uncertainties, the investigation of a single unit of
active material (herein a single rolled-up tube) should be an attractive approach.
Considerable efforts have been dedicated to developing such platforms using single
micro/nanoscale active materials with well-defined geometry as independent anode or cathode in
LIBs, which enables direct diagnosis of the electrochemical behaviors and
observation/characterization of the structural/compositional changes of active materials.
Uchida’s group[83, 84] investigated the kinetics of Li+ extraction/insertion by measuring the
current/potential behaviors of a single particle (graphite and LiMn2O4), in which a
microelectrode was attached to the particle to realize electrical contact. Mai and co-workers[81]
have developed an electrode platform with the ability to in-situ record the electrical transport and
the structural evolution of single silicon nanowire. Huang and coworkers[56] have reported a
pioneering work using in-situ TEM to observe the lithiation of a single SnO2 nanowire during
electrochemical charging and found that a reaction front containing a high density of dislocations
electrochemically drives the solid-state amorphization of the nanowire. Wang and co-
workers[58] reported a two-phase process of electrochemical lithiation in amorphous Si by using
in-situ TEM, which further leads to a inhomogeneous and discontinuous volume expansion.
MacDowell and Cui[80] have investigated the electronic properties and structural changes in a
single Si nanowire.
In this study, a lab-on-chip electrochemical device platform is presented for probing the
electrochemical kinetics, electrical properties and lithium driven structural changes of a single
silicon rolled-up tube as an anode in LIBs. The chemical diffusion coefficient (D) of the Li into
a Si tube is determined and compared to the case of a planar film. The electrical conductivity of
the single tube at various potentials is also investigated since it is closely related to the
magnitude of the battery’s driving force.[14] The lithium-driven structural changes clearly show
the formation of wrinkles due to strain-induced local deformations during repeated
lithiation/delithiation, confirming that the tubular structure possesses powerful strain
accommodation properties.

44 Chapter 4. A Single Rolled-Up Si Tube Battery
4.2 Fabrication of a LIB with a single Si rolled-up tube as
anode
4.2.1 A single rolled-up Si tube
The detailed fabrication procedures of a single rolled-up Si tube are shown in Figure 4. 1. In
total, three steps of lithographies were carried out. All patterns were fabricated using the lift-off
photoresist AZ-5214E by the photolithography. And all the thin films were deposited vertically
without tilting the substrate.
The first lithography patterned a blank square on a glass substrate utilizing a MA56 mask
aligner in contact mode. A 20 nm-Ge layer was deposited onto the square by electron beam
evaporation, which would work as a sacrificial layer for rolling-up a single tube.
The second lithography gave a patterned photoresist sealing three edges of the Ge layer and the
area around it, which later would offer three opened windows during the tube rolling process and
remove all the residual films around the square. The sample was treated in oxygen plasma (10
min/50 W) and then baked overnight on a hotplate at 60°C to oxidize the Ge layer into GeOx for
easy etching in water. Afterwards, the strained silicon layer (45 nm) was deposited.
The last lithography patterned the structures for the deposition of Ti (200 nm) electrical
contacts of the tube. The sample was immersed into deionized H2O for two hours and a single
silicon tube was rolled up with a diameter of around 30 nm and a length of 480 μm. Finally, the
tube was dried in critical point dryer (CPD) to avoid the collapse of the microtube caused by
surface tension forces during solvent evaporation. At a low temperature of 10 ºC, the initial
solvent (acetone) in the CPD chamber was replaced by liquid CO2 until the chamber pressure
reached up to 50 bar. When the pressure was stable and no acetone was left in the chamber, the
CPD chamber was heated up to 39-40 ºC to volatilize CO2 beyond the supercritical point.

Chapter 4. A Single Rolled-Up Si Tube Battery 45
Figure 4. 1. A schematic depicting procedures for rolling up a single Si tube (1) patterning and deposition of Ge as
sacrificial layer, (2) patterning of 2nd
photoresist and oxidizing Ge layer into GeOx by oxygen plasma treatment, (3)
deposition of Si layer, (4) deposition of Ti contacts, (5) rolling the tube by removing GeOx, (6) a real optical
micrograph of a single rolled-up Si tube.
4.2.2 Assembly of a micro-battery
Then a micro-battery would be assembled using the Si tube as anode, and a strip of lithium foil
were used as counter electrode. The polydimethylsiloxane (PDMS) chamber was used as an
electrolytic cell. A PDMS mixture solution (1 : 10, Sylgard 184 Silicone Elastomer KIT, Dow
Corning, MI, USA) was poured onto a blank Si wafer (three iron cylinders with 5.5 mm in height
and 5 mm in diameter as dies for the chamber formation) and cured for 20 min at 100 ºC. After
peeling off the PDMS from the Si wafer, a pinhole was made in the center of one of the cylinder-
shaped chambers with a cutting needle, for afterwards electrolyte filling and lithium foil
positioning. The glass and PDMS were treated by oxygen plasma for 30 s at 30 W, and these two
components were carefully brought together with the single tube at the center of one pinhole-free
cylinder chamber, ensuring that the distance between the tube and lithium foil is 5mm. Extra
PDMS solution was brushed along the attaching edges and cured to enhance the binding
strength. Then the device was transferred into an Ar-filled glove box (H2O < 0.1 ppm, O2 < 0.1

46 Chapter 4. A Single Rolled-Up Si Tube Battery
ppm, MBraun, Germany). 1 M LiPF6 (EC, DEC and DMC (1:1:1 by weight, Merck)) was then
filled into the device chamber as electrolyte. Li foil was placed through the pinhole as counter
electrode, and afterwards extra PDMS solution was used to seal the pinhole. The schematic of an
encapsulated battery is shown in Figure 4. 2. Li foil has a much larger surface area than the Si
rolled-up tube, and the influence of Li foil during electrochemical test is little. Therefore, the
electrochemical responses are mainly controlled by the rolled-up Si tube.
Figure 4. 2. A schematic illustration of an encapsulated Li-ion battery with a single silicon tube as anode.
4.3 Results and discussion
4.3.1 Characterization of rolled-up Si tube
Figure 4. 3a shows an optical micrograph of the single rolled-up Si tube with a diameter of
around 30 m, to which three Ti contacts are made with one in the middle of the tube and two at
its two ends. The rolled-up Si tube was characterized by Raman spectroscopy with 442 nm
wavelength. The Raman spectrum of the single Si tube (Figure 4. 3b) shows a broad peak at 475
cm1
, which is a characteristic feature of the amorphous silicon vibration modes due to the first
order transverse optical phonon.[131]

Chapter 4. A Single Rolled-Up Si Tube Battery 47
Figure 4. 3. (a) Optical micrograph of a single rolled-up silicon tube contacted with Ti strip lines. (b) Raman
spectrum of a single silicon tube.
4.3.2 Electrochemical properties of a single rolled-up Si tube
CV and PSCA were carried out using a Zahner IM6 electrochemical workstation. The
lithiation/delithiation of the silicon tube was characterized by CV at a scan rate of 100 V s1
for
the first three cycles, as shown in Figure 4. 4a and b.
In the first cycle, three main cathodic peaks (a, b, c) occur at 0.173, 0.089 and 0 V during
discharging, while two main anodic peaks (d, e) occur at 0.267 and 0.450 V during charging. A
small suppressed cathodic peak (indicated by the arrow) at 0.288 V is identified as well, which
corresponds to the irreversible formation of a SEI layer. The first cathodic peak a at 0.173 V is
extremely sharp and well-distinguishable, indicating a two-phase region.[42] Wang et al.
confirmed that the two-phase region includes amorphous Si and an amorphous LixSi (x~2.5)
product.[58] This sharp peak disappears in subsequent cycles and a broad peak emerges at
almost the same potential. The second cathodic peak b at 0.089 V has a broad shape, indicating a
single-phase region. This peak shows a significant negative-shift in the subsequent cycles due to
the kinetic effects.[123] To clarify the third cathodic peak c at 0 V, a control sample with only Ti
contacts on the glass substrate was examined and the corresponding CV results (Figure 4. 4d)
show that this peak does stem from the background current. The two anodic peaks d and e both
have broad shapes, which are typical for delithiation of amorphous Si,[42, 44, 132, 133] and
show positive-shifts in the subsequent cycles.

48 Chapter 4. A Single Rolled-Up Si Tube Battery
As a reference, the CV behaviors of the planar Si film are shown in Figure 4. 4c. During the
first discharging, only one sluggish cathodic peak a’ is observed with a starting potential at 0.212
V and a peak potential at 0.156 V, which is a broad peak of the two overlapped sharp peaks (a
and b in Figure 4. 4b). As mentioned before, the peak b’ at 0 V is mainly contributed by the
background current. The irreversible reaction peak corresponding to the SEI formation occurs at
around 0.310 V (indicated by the arrow). During the first charging, the two broad anodic peaks
(c’ and d’) located at 0.325 and 0.520 V, respectively, are both positively shifted compared to the
tube’s anodic CV peaks d and e.
As already mentioned in Chapter 3, a CV peak occurs because the current increases as the
potential reaches the redox potential of the reactant, but then falls off when the concentration of
the reactants is depleted near the electrode surface. The slower the scan rate, with thinner
electrodes and highly oriented particles, the narrower and better resolved are the peaks. With
very thin and highly oriented electrodes at sufficiently low scan rates, the CV may reflect a
behavior that is beyond diffusion control, approaching the thermodynamic limit.[121] Therefore
the emergence of the sharp, well-resolved peak a reflects that the diffusion of Li ions is fast
enough to maintain the alloying process with the Si tube, and the behavior is reaction controlled;
while the sluggish, overlapped peak a’ indicates the electrode’s behavior is diffusion controlled,
further leading to hysteretic kinetics.
In summary, compared to the planar film and literature results,[132, 134, 135] the current
response of the electrochemical reaction in a single tube is instant, well-distinguishable, and no
overlapping between different reactions occurs due to enhanced ionic conduction (larger
diffusion layer) and less kinetically involved polarization originating from the unique tubular
structure. These features enable the unique tubular structure to be further used as advanced
ultramicroelectrode for other electrochemical applications.

Chapter 4. A Single Rolled-Up Si Tube Battery 49
Figure 4. 4. CV curves of the first three cycles at a scan rate of 100 V s1
between a potential window of 1-0 V for
(a) a single Si rolled-up tube; (b) magnified part of the CV for a single Si rolled-up tube; and (c) an on-chip Si planar
film; (d) background current measured with bare Ti contacts on glass.
4.3.3 Chemical diffusion and electrical conductivity of a single rolled-up Si
tube
Diffusion properties of LIBs determine some of the key performance parameters, including the
charge/discharge rate, reversible capacity and cycling stability. Normally, it is very challenging
to determine D for composite electrodes due to their inhomogeneous potential distributions and
unknown electrode surface area. Therefore, a single rolled-up tube platform is established and
PSCA is performed to gain a better understanding of the different diffusion behaviors of Li ions
in the Si tube and planar film anode. The calculation of D from the PSCA measurements has
been described in detail, previously.[123] Briefly, the potential is stepped and the response
current from faradic processes occurring at the electrode is monitored as a function of time.
Figure 4. 5a shows a typical current response when the potential of the Si tube was stepped from

50 Chapter 4. A Single Rolled-Up Si Tube Battery
0.200 V to 0.180 V vs. Li/Li. A clear short-time current response region can be identified, in
which the current decreases rapidly. This short-time current response can be treated as the semi-
infinite diffusion, and described by the Cottrell equation in Chapter 3.3.3:
2/12/1
2/1
)(t
CnFADtI OO
(3.4)
n denotes the electron number involved in the reaction, F Faradaic constant, A the surface area,
and
OC the bulk concentration of Li
ions. For the ease of calculation, the Cottrell curve was
replotted as I vs. t1/2
in Figure 4. 5b. A straight line was observed between 5 and 27 s, and the
potential-dependent diffusion coefficient D can thus be obtained as shown in Figure 4. 5c.
Figure 4. 5. (a) The current-time response (b) Cottrell plot of the current-time response of a single rolled-up Si tube
after the potential was stepped from 0.200 to 0.180 V vs. Li/Li. (c) .Chemical diffusion coefficient (D) of Li ions in
Si tube and planar film under various potentials during the first discharge.

Chapter 4. A Single Rolled-Up Si Tube Battery 51
A minimum D emerges around 0.4 V caused by the thickened diffusion path after the
formation of the SEI layer. A maximum D occurs around 0.2 V corresponding to the sharp CV
peak a (Figure 4. 4b), which is probably due to the increased contact area between the electrode
and electrolyte because the fast reaction between Li and Si introduces a large volume expansion
as well as the formation of wrinkles and small particles on the surface (see SEM images in
Figure 4. 7c and d). In addition, from the thermodynamic point of view, the diffusion coefficient
is largely affected by the boundaries or interfaces of the materials.[136] The two-phase region
occurs around 0.2 V, resulting in large amounts of defects and interfaces. It is believed that the
generated defects and interfaces would facilitate the diffusion of Li ions, thus a maximum D
occurs around 0.2 V. The maximum diffusion coefficient D of Li+ ions to a tube seems more
evident. But it is worth mentioning that D in a planar film is also increased from the minimum at
around 0.3 V to 0.2 V. Only the increasing amplitude is not as high as for the tube. Again, I
would like to attribute this feature to the three-dimensional structure, which enables the sufficient
contact of the electrolyte and electrode, furthermore the sufficient diffusion of Li ions to the
electrode. This leads directly to the well-resolved CV peaks of the tube. For a planar film, since
the diffusion is sluggish, the current responses, i.e., the CV peaks are therefore sluggish. Similar
features were also reported for amorphous Si films in literature.[137] Various values for the
diffusion coefficient of Li in amorphous Si have been reported both experimentally and
theoretically ranging from 1014
to 109
cm2 s1
with a typical value of 1012
cm2 s1
.[137-142] In
our work, the diffusion coefficient of Li in Si tube is around 10
11 cm
2 s
1, which is several
times higher than that in planar Si films under all potentials except at 0 V. The enhanced
diffusion of Li in a tubular structure as compared to the planar film provides clear explanation
for the well-resolved CV peaks.
Additionally, special attention should be paid to the cell time constant du
CR (u
R for
uncompensated resistance, d
C for double layer capacitance) in microelectrode applications, since
ten times of it gives rise to the minimum time which is needed for a new potential establishment
in potential step experiments. du
CR is proportional to the working electrode’s size, as described
in the following equation:[123]
4
0
0 d
du
CrCR (4. 1)

52 Chapter 4. A Single Rolled-Up Si Tube Battery
0r denotes the radius of a microelectrode, 0
dC the capacitance per area and the electrolyte
conductivity. Here, a typical value of 0
dC =20 F cm
2 is used,[123] a value of =0.003
1 cm
2
responsible for the 1 M LiPF6 electrolyte,[143] and 0
r =480 m is the size of the microelectrode,
resulting in a cell time constant of 14.4 s and a minimum measurement time of 144 s. The
small value indicates that a new potential can be stepped instantly for the microelectrode, which
confirms the applicability of the Cottrell equation to our case.
Figure 4. 6. (a) Typical I-V curves of the single Si tube under various lithiation/delithiation states; (b) electrical
conductivity at various discharge/charge states during the first cycle.
In addition to the ionic conduction, the electrical conductivity of the electrode also plays a key
role in determining the battery’s rate performance. The electrical conductivity was measured
using Ti contacts on the two ends of a fresh tube after each lithiation/delithiation step during
electrochemical charge and discharge cycling. A Keithley series 2612A source meter was used.
Before the measurement, each potential was held at least for one hour. Typical I-V curves at
various lithiation/delithiation states can be found in Figure 4. 6a and the calculated electrical
conductivities are shown in Figure 4. 6b. The lithiation of Si occurs below 0.3 V according to
CV results, while significant changes in electrical conductivity are observed below 0.25 V vs.
Li/Li. The maximum conductivity of 0.56 S cm
1 occurs around 0.12 V, which has been
attributed to the decomposition of the conductive alloy and the formation of the less-conductive
alloy.[135] Although the value is lower than that measured by Pollak et al. for a 100 nm
amorphous Si,[135] it is similar to that obtained by McDowell et al. for a 50 nm amorphous Si
film.[80] In addition, the volume expansion of the Si tube upon the insertion of lithium

Chapter 4. A Single Rolled-Up Si Tube Battery 53
contributes to the increase of the overall conductivity, since the cross section increases during the
expansion of the tube. Overall, the electrical conductivity of the Si tube during discharge is
higher than that during charge.
4.3.4 Structural observation of Si tube before/after cycling
The surface morphology of the tube was characterized by SEM, Zeiss DSM982. Figure 4. 7a-c
show the SEM images of the single Si tube before cycle (30.9 m in diameter, 480 m in
length), revealing a smooth surface. After three cycles, the tube exhibits a highly wrinkled
structure with apparently accommodating large volume strains introduced during electrochemical
processes (Figure 4. 7d and e), while the diameter has expanded to 53.4 m. Iwamura et al.
demonstrated that a wrinkled structure can also be formed on Si nanoparticles at early periods,
and when freezing the structure at the wrinkled state, nano-Si can be stably charged/discharged
for a long period and show excellent rate performance as well.[49] Considering this viewpoint,
the wrinkles introduced in this experiment would also offer the possibility for high power LIBs
with enhanced cyclability.
Figure 4. 7. SEM images of a tube (a-c) before cycling with various magnifications, (d and e) after three cycles of
lithiation/delithiation.

54 Chapter 4. A Single Rolled-Up Si Tube Battery
4.4 Conclusion
In conclusion, a lab-on-chip electrochemical device is demonstrated that allows for the study of
the lithiation and delithiation process of a single rolled-up Si tube, the determination of the
diffusion coefficient and electrical conductivity, as well as the characterization of structural
changes. CV curves of the Si tube exhibit sharp, better resolved peaks compared to that of a
planar Si film due to the enhanced diffusion effect in the unique tubular structure, which makes
the rolled-up tube a promising candidate for an ultramicroelectrode for electrochemical studies.
A maximum electrical conductivity occurs after the lithiation of the Si tube. After three cycles,
the tube exhibits a highly wrinkled structure due to the strain-induced local deformation, which
could be exploited to maintain a stable charge/discharge cycling. The single rolled-up tube
battery described here is promising for the fundamental research of voltammetry and
electrochemical processes and could also be used as local on-chip energy supply or for driving
ultra-compact autonomous microsystems.

Chapter 5. On chip, all solid-state and flexible micro-supercapacitors 55
5. On chip, all solid-state and flexible
micro-supercapacitors based on MnOx/Au
multilayers
5.1 Introduction
This chapter is based on the publication of Energy Environ. Sci. 2013, 6, 3218. titled “On chip,
all solid-state and flexible micro-supercapacitors with high performance based on MnOx/Au
multilayers”.
Energy storage components have become a bottleneck for the reduction of the size of
microelectronic devices. The recent rapid advance and eagerness of miniaturized, portable
consumer electronics stimulate the development of micro-scale power sources with high power
density, towards the trend of being small, thin, lightweight, flexible, and even wearable, to meet
the growing demands of modern society.[10-13] On the other hand, introducing small solid state
energy storage devices has stimulated significant research interest, which enables circuit
designers to place energy storage devices directly on a chip for load powering. However, it is
still a challenge to realize high performance flexible energy storage devices because they are
highly dependent on the electrical and mechanical properties of the electrode materials.
Supercapacitors, also named electrochemical capacitors, bridging the gap between high energy
batteries and high power conventional electrostatic capacitors, have attracted great attention.[2,
3, 144, 145] Two main working principles are established regarding supercapacitors. One is
electrochemical double layer charge storage through which carbon based materials can work.
Another type of principle is pseudo-capacitive charge storage, including rapid redox reactions at
the surface and bulk of the electrodes, which lies at the heart of conducting polymers- and
transition metal oxides-based supercapacitors.[2] MnO2-based pseudocapacitive electrodes have
been demonstrated as a promising solution to various energy applications because of its high
theoretical specific capacitance (1370 F g1
), environmentally friendly nature and low cost of
raw materials. However, it is difficult to achieve high theoretical capacitance with bare MnO2,
primarily limited by the poor electrical conductivity (105
-106
S cm1
)[94, 146-148]. Extensive

56 Chapter 5. On chip, all solid-state and flexible micro-supercapacitors
efforts have been dedicated to improve the capacitance through adjusting crystal forms (e.g.,
amorphous and -, - and -type crystalline MnO2 electrodes),[149-152] defect chemistry (e.g.,
Mn-Me mixed oxides, MnO2-polymer composite electrodes, MnO2-nanostructured carbon
composites),[99, 153-155] morphology (e.g., nanofibers, nanorods, nanosheets)[156-158] and
porosity[154, 159-161] of MnO2.
Moreover, mechanical issues such as low structural stability and flexibility as well as
electrochemical dissolution of active materials are also plaguing for MnO2-based electrodes,
resulting in degraded long-term electrochemical cyclability.[94] It is especially important to
enhance the structural stability and eliminate electrochemical dissolution of MnO2, when
concerned with thin-film electrodes. Intensive explorations have been done on thin-film or MnO2
coated electrodes through varieties of techniques, including sol-gel dip-coating,[162]
anodic/cathodic electrodeposition,[148, 163-165] electrophoresis,[166-168] and sputtering-
electrochemical-oxidation or direct sputtering deposition.[169-171] To the best of our
knowledge, however, no reports have been found for MnO2 thin-film supercapacitors deposited
with electron beam evaporation. Electron beam evaporation is a physical vapor deposition
method to grow thin films, in which certain source materials undergo decomposition in the vapor
phase, offering the opportunity to control the structural and stoichiometry of materials. The thin-
film deposited with electron beam evaporation possesses good adhesion to substrate, ensuring
long-term cycling stability of supercapacitors, which is compatible with the industrial-level
technologies to meet the application demand for advanced materials.
In this work, a new concept is introduced to fabricate on chip, all solid-state and flexible
micro-supercapacitors based on MnOx/Au multilayers, which is compatible with current
microelectronics. The micro-supercapacitor exhibits a maximum energy density of 1.75 mWh
cm3
and a maximum power density of 3.44 W cm3
, which are both much higher than the values
obtained for other solid-state supercapacitors. At a scan rate of 1 V s1
, a volumetric capacitance
of 32.8 F cm3
is obtained for MnOx/Au multilayers electrodes, which is much higher than the
bare MnOx electrode. EIS and the evolution complex capacitance confirm that the electrical
conductivity of MnOx is improved due to incorporation of gold, and a low relaxation time
constant around 5 ms is observed. The MnOx/Au multilayers micro-supercapacitor also shows
good long-term cycling stability, with a capacitance retention rate of 74.1% after a large cycling

Chapter 5. On chip, all solid-state and flexible micro-supercapacitors 57
number of 15 000 times. Compared with other supercapacitors, which are not portable, and
relatively bulky, the device demonstrated here allows fast and reliable applications in a portable
and smart fashion. Furthermore, the nature of the process allows the micro-supercapacitor to be
integrated with other micro-devices, to meet the need for micro-scale energy storage.
5.2 Fabrication of solid-state micro-supercapacitors
A photograph of the on chip, all solid-state and flexible micro-supercapacitors is shown in Figure
5. 1a. The symmetric micro-supercapacitor was equipped with 24 interdigital fingers (twelve
fingers as anodes and cathodes respectively), which were fabricated onto flexible PET substrate
by using lift-off photoresist AZ-5214E patterned by photolithography. A schematic diagram of
the micro-supercapacitor is shown in Figure 5. 1b. Electron beam evaporation is used to deposit
electrical contacts and active materials for electrodes. The electrical contacts were achieved by
depositing Cr/Au (5/50 nm) at a vacuum below 3×10⁶
mbar. Anode and cathode were consist of
with a 50 nm-thick MnOx/Au multilayered film, stacked in the order of
MnOx/Au/MnOx/Au/MnOx (shown in Figure 5. 1b), with a thickness of 15 nm and 2.5 nm for
each MnOx and Au layer, respectively. It is worth mentioning that when MnOx was deposited,
the oxygen flux was kept at 2×10⁴
mbar. To ensure the accuracy of the thickness for the
deposited films, a 200 nm film was first deposited, and the actual thickness was then measured
by the Profilometer Dektak XT (Brucker). Thus a calibrated tooling factor for the deposition of
each material was obtained, which was used in the following deposition processes. The source
material for MnOx deposition is 99.9% manganese (IV) oxides pieces from American elements,
USA.
For the solid electrolyte preparation, 3 mL H2SO4 was dropped into 30 mL deionized water
and then 3 g PVA powder was added. The whole solution was kept at 85 °C under vigorous
stirring until the solution became clear. The gel solution was dropped cast to the surface of the
microelectrodes. After the PVA-H2SO4 gel solidified, the preparation of the micro-
supercapacitor was finished.

58 Chapter 5. On chip, all solid-state and flexible micro-supercapacitors
Figure 5. 1. (a) Photograph of a real, flexible micro-supercapacitor on polyethylene terephthalate (PET) substrate. (b)
Schematic diagram of the symmetric micro-supercapacitor with 24-interdigital fingers, and Schematic of the stacked
multilayers of MnOx and gold deposited with electron beam evaporation.
5.3 Results and discussion
5.3.1 Schematics of the micro-supercapacitors
Figure 5. 1a shows the photograph of a real flexible symmetric micro-supercapacitor, which
consists of 24 interdigital fingers as electrodes. As shown in the schematic diagram of Figure 5.
1b, each finger has a length of 4.8 mm, a width of 100 m, and an inter-electrode-distance of 100
m. The SEM images (Figure 5. 2a and b) also confirm the multilayer was uniformly deposited,
with an average particle size of around 15 nm. An AFM image of the actual film roughness is
shown in Figure 5. 2c, which were taken using a Nanoscope III SPM (Digital Instruments). A
mean root square roughness of 1.25 nm of the deposited electrode film was measured,
demonstrating the good smoothness, which explains the mechanical stability and eliminates the
electrochemical dissolution of MnOx into the electrolyte during long-term cycling application.

Chapter 5. On chip, all solid-state and flexible micro-supercapacitors 59
Figure 5. 2. (a) A low magnification, and (b) high magnification SEM image of MnOx/Au multilayers on PET
substrate, showing the particle size is around 15 nm. (c) AFM image of the MnOx/Au multilayers-electrode showing
film roughness.
5.3.2 Oxidation state of Mn ions
Figure 5. 3. X-ray diffraction pattern of as-prepared MnOx film, which is confirmed to be a mixture of crystalline
MnO2 and Mn3O4.
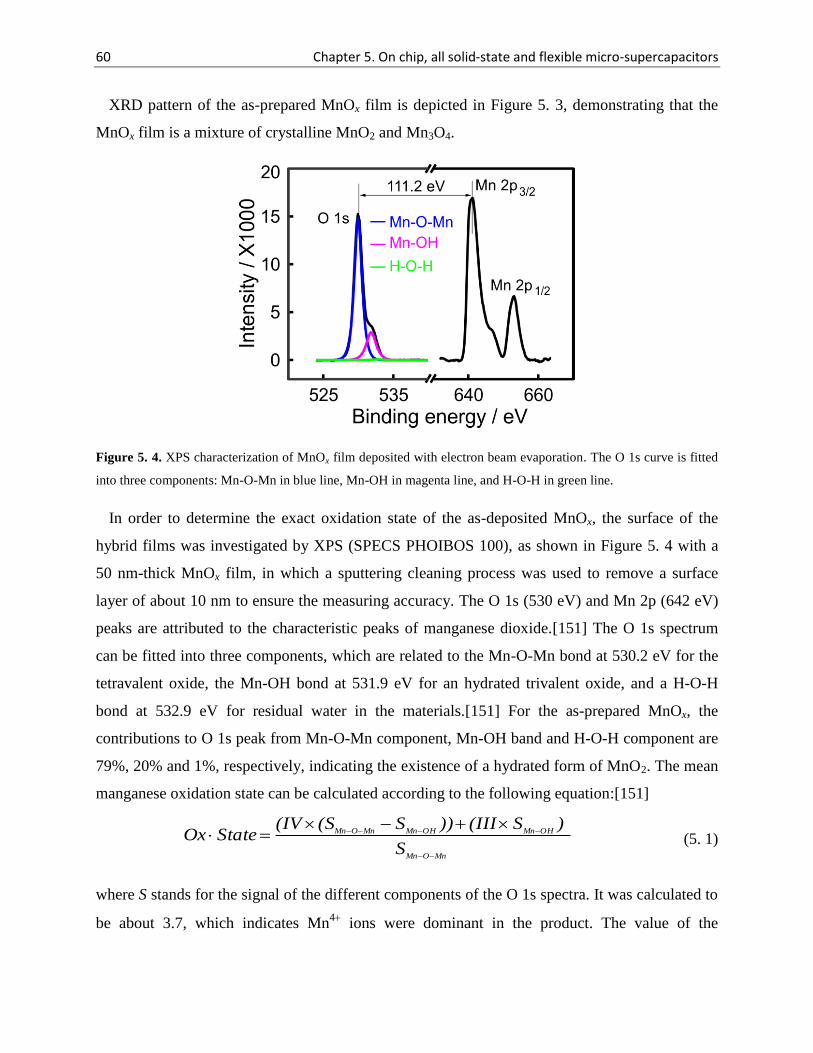
60 Chapter 5. On chip, all solid-state and flexible micro-supercapacitors
XRD pattern of the as-prepared MnOx film is depicted in Figure 5. 3, demonstrating that the
MnOx film is a mixture of crystalline MnO2 and Mn3O4.
Figure 5. 4. XPS characterization of MnOx film deposited with electron beam evaporation. The O 1s curve is fitted
into three components: Mn-O-Mn in blue line, Mn-OH in magenta line, and H-O-H in green line.
In order to determine the exact oxidation state of the as-deposited MnOx, the surface of the
hybrid films was investigated by XPS (SPECS PHOIBOS 100), as shown in Figure 5. 4 with a
50 nm-thick MnOx film, in which a sputtering cleaning process was used to remove a surface
layer of about 10 nm to ensure the measuring accuracy. The O 1s (530 eV) and Mn 2p (642 eV)
peaks are attributed to the characteristic peaks of manganese dioxide.[151] The O 1s spectrum
can be fitted into three components, which are related to the Mn-O-Mn bond at 530.2 eV for the
tetravalent oxide, the Mn-OH bond at 531.9 eV for an hydrated trivalent oxide, and a H-O-H
bond at 532.9 eV for residual water in the materials.[151] For the as-prepared MnOx, the
contributions to O 1s peak from Mn-O-Mn component, Mn-OH band and H-O-H component are
79%, 20% and 1%, respectively, indicating the existence of a hydrated form of MnO2. The mean
manganese oxidation state can be calculated according to the following equation:[151]
Mn OMn
OHMnOHMnMnOMn
S
) S(III))S(S(IVStateOx
(5. 1)
where S stands for the signal of the different components of the O 1s spectra. It was calculated to
be about 3.7, which indicates Mn4
ions were dominant in the product. The value of the

Chapter 5. On chip, all solid-state and flexible micro-supercapacitors 61
manganese oxidation state may facilitate the rapid redox reaction between trivalent and
tetravalent manganese ions due to the mixed valence state in the material, as discussed later.
Furthermore, the Mn 2p core level spectrum has two distinctive peaks at binding energies of
641.4 eV and 653.4 eV corresponding to the spin-orbit doublet of Mn 2p3/2 and Mn 2p1/2,
respectively. The energy separation between O 1s (Mn-O-Mn) and Mn 2p3/2 is 111.2 eV, also
indicating Mn4
ions were dominant in the product.[151] In order to investigate the influence of
gold, a 2 nm MnOx thin film was deposited onto the gold film, and the surface of the MnOx/Au
hybrid thin layer was characterized by XPS. Compared to bare MnOx films, the MnOx/Au hybrid
film exhibits more surface OH oxygen in O 1s (Figure 5. 5), which is probably due to the
influence of gold at the interface.
Figure 5. 5. XPS characterization of bare MnOx film and MnOx/Au film with 2 nm MnOx on top of gold to
investigate the MnOx/Au interface. Compared to bare MnOx film, MnOx/Au film with 2 nm MnOx exhibits more
surface OH oxygen in O 1s (the part circled by blue dashed ellipse), probably due to the gold influence at the
interface.
5.3.3 Electrochemical performance: CV and EIS
Electrochemical properties were characterized by CV and EIS, using Zahner IM 6. Figure 5. 6a
and b show the CV results of MnOx/Au multilayers micro-supercapacitors in the potential
window of 0-0.8 V, with a wide range of scan rates: from 10 mV s1
up to 50 V s1
. Even at the
high scan rate of 50 V s1
, the CV curves retain the symmetric rectangular shape and instant
response upon the reversal of voltage, indicating that the micro-supercapacitor experiences
nearly ideal capacitive behavior. It is therefore concluded that ultrahigh power can be obtained
from this device. The energy storage of MnOx comes from surface adsorption/desorption of

62 Chapter 5. On chip, all solid-state and flexible micro-supercapacitors
electrolyte cations (here: protons) and also a rapid and highly reversible redox reaction between
MnOx and protons, as follows:[151, 162]
MnOOH eHMnO 2 (5. 2)
In this redox reaction, Mn ions vary between the III and IV oxidation states. According to the
calculated mean manganese oxidation state, the as-prepared MnOx film mainly consists of Mn4
ions, while a small portion of Mn3
ions also exists. The co-existence of both Mn4
and Mn3
ions facilitates the fast, reversible redox reaction between them, thus resulting in nearly ideal
capacitive behaviors.
Figure 5. 6. (a) CV curves of the MnOx/Au multilayers micro-supercapacitor at low scan rates from 10 mV s1
to 1
V s1
, and (b) at high scan rates from 5 V s1
to 50 V s1
. (c) Volumetric capacitance calculated from CV curves at
scan rates (10, 50, 100, 200, 500 and 1000 mV s1
) for MnOx/Au multilayers and bare MnOx micro-supercapacitors.
(d) A linear dependence of the discharge current density on the scan rate up to 7 V s1
.
The volumetric specific capacitance C (F cm3
) of the MnOx/Au multilayers-electrode is
determined using the voltammetric charge (Q) integrated from CV curves. Then the total charge

Chapter 5. On chip, all solid-state and flexible micro-supercapacitors 63
Q is divided by the volume (V) of the MnOx/Au multilayers in the electrodes and the potential
window E, shown in the equation as follows:[151]
E)Q/(V*C (5. 3)
The calculated volumetric capacitances of MnOx/Au multilayers-electrode vs. scan rates (10,
50, 100, 200, 500 and 1000 mV s1
) are plotted in Figure 5. 6c, where the rate capability can be
seen. The volumetric capacitance of the MnOx/Au multilayers-electrode is calculated to be 78.6
F cm3
at a scan rate of 10 mV s1
, and 32.8 F cm3
at 1 V s1
, resulting in a capacitance retention
ratio of 41.7%. For comparison, the volumetric capacitances vs. scan rates for the bare MnOx
electrode is calculated to be 37.9 F cm3
at a scan rate of 10 mV s1
. With increasing scan rates,
the volumetric capacitance is decreased to be 19.9 F cm3
at a high scan rate of 1 V s1
.
Therefore, the volumetric capacitance of bare MnOx electrode at 1 V s1
retains 52.5% of the
maximum value. Although the retention ratio for MnOx/Au multilayers-electrode decreases, the
volumetric capacitance is still 1.7 times higher than bare MnOx electrodes. The gold films in the
MnOx/Au/MnOx/Au/MnOx sandwich-like multilayers serve as highly conductive bridges to
support the redox active MnOx, resulting in highly improved electrochemical performance. As
can be observed in Figure 5. 6d, a linear dependence of discharge current density on scan rate is
obtained up to 7 V s1
, demonstrating the high power ability for the MnOx/Au multilayers-
electrode. As mentioned above, the energy storage contributions come from both surface
adsorption/desorption of electrolyte cations (H) onto the surface of MnOx/Au multilayers and
the fast reversible redox reactions by means of intercalation/extraction of protons into/out of
MnOx. A control electrolyte of 1 M Li2SO4 solution with a high ionic mobility was also tested
(Figure 5. 7), revealed that supercapacitor with aqueous electrolyte Li2SO4 shows a higher
capacitance than solid electrolyte supercapacitors.
Thin layers of oxides promote maximum pseudocapacitance as the redox reaction initiates at
the surface layer of the oxide in contact with the electrolyte, and is followed by the diffusion of
the electrolyte ions inside the oxide, which is suppressed by the diffusion limit of the ions. This
limitation prevents ions going deep into the oxide in the case of a thick layer, and thus generates
a dead volume of oxide that does not take part in the redox reaction, thereby decreasing the
capacitance per unit volume. In our case, 50 nm-films were used as electrodes, which enable fast

64 Chapter 5. On chip, all solid-state and flexible micro-supercapacitors
proton diffusion and efficient utilization of active materials, thus leading to the high power
ability.
Figure 5. 7. (a) CV curves of the MnOx/Au multilayers micro-supercapacitor measured in 1 M Li2SO4 at scan rates
from 10 mV s1
to 1 V s1
. (b) Comparison of volumetric capacitance for MnOx/Au multilayers measured in aqueous
(1 M Li2SO4) and gel (H2SO4/PVA) electrolyte at scan rates (10, 50, 100, 200, 500 and 1000 mV s1
).
The enhanced electrochemical performance of the MnOx/Au multilayers micro-supercapacitor
was confirmed by the EIS measurement from 1 MHz to 10 mHz, with a potential amplitude of 5
mV. The intercept of the Nyquist curve with the real axis at high frequencies represents the
equivalent series resistance of the device. As observed in the inset in Figure 5. 8a, due to the
small thickness of the electrodes, the MnOx/Au multilayers micro-supercapacitor shows large
intrinsic resistance of around 240 ohm, which has been reported in previous literature.[101] But
compared to the bare MnOx micro-supercapacitor, the MnOx/Au multilayers micro-
supercapacitor has a lower resistance, which is of great importance since less energy and less
power will be wasted to produce unwanted heat during charge/discharge processes. Figure 5. 8b
compares the Bode plots for bare MnOx and MnOx/Au multilayers micro-supercapacitors. The
capacitor response frequency for both devices at the phase angle of 45º was about 200 Hz.
Therefore, the relaxation time constant 0 was calculated to be 5 ms, showing that a pure
capacitive behavior can be obtained and most of its stored energy is accessible at frequencies
below this frequency. At 10 mHz, the phase angle for both micro-supercapacitors are around
80º, close to 90º for ideal capacitors.

Chapter 5. On chip, all solid-state and flexible micro-supercapacitors 65
Figure 5. 8. (a) Nyquist plots and (b) Bode plots for both bare MnOx and MnOx/Au multilayers micro-
supercapacitors. Inset of (a) shows the magnified high frequency region. (c) Real part and (d) imaginary part of
complex capacitance for both bare MnOx and MnOx/Au multilayers micro-supercapacitors.
To better understand the difference between two micro-supercapacitors, the evolution of the
complex capacitance was conducted. A supercapacitor can be described by using resistance and
capacitance that are functions of the pulsation ω (here with an amplitude of 5 mV), and
indicated as R (ω) and C (ω). C (ω) is defined as follows:[172]
ω''iCω'CωC (5. 4)
The real and imaginary part of the complex capacitance vs. frequency can be obtained
according to Eq. 5:[172]
2
ωZω
ω''Zω'C
2
ωZω
ω'Zω''C (5. 5)
66 Chapter 5. On chip, all solid-state and flexible micro-supercapacitors
The low frequency value of the real part capacitance C’ (ω) corresponds to the capacitance of
the cell measured during constant-current discharge. The imaginary part capacitance C’’ (ω)
corresponds to an energy dissipation by an irreversible process. Figure 5. 8c presents the change
in the real part capacitance C’ (ω) vs. frequency for both bare MnOx and MnOx/Au multilayers
micro-supercapacitors. C’ (ω) sharply increases between 1000 Hz and 100 Hz for both micro-
supercapacitors. A difference occurs starting from 100 Hz. The bare MnOx micro-supercapacitor
tends to be less frequency dependent and the capacitance values at a low frequency of 10 mHz
are 41.4 and 58.3 F cm3
for bare MnOx and MnOx/Au multilayers micro-supercapacitors,
respectively, which are consistent with the results obtained from CV measurements (Figure 5.
6c). Figure 5. 8d shows the evolution of the imaginary part of capacitance C’’(ω) vs. frequency
for the two micro-supercapacitors. The relaxation time constant was found to be very similar for
the two micro-supercapacitors, 4.7 ms for the bare MnOx, 5.9 ms for the MnOx/Au multilayers,
consistent with the results obtained from the Bode plots. This value is much lower compared to
literature results: 26 ms for onion-like carbon-based micro-supercapacitors,[145] 700 ms for AC-
based micro-supercapacitor,[145] 500 ms for carbon nanoparticles/MnO2.[165]
5.3.4 Long-term stability, Ragone plot and mechanical flexibility
The long-term cycling stability of MnOx/Au multilayers electrodes was measured with CV at a
scan rate of 1 V s1
over 15 000 cycles (Figure 5. 9a). A decline occurs in the first three thousand
cycles, after that the curve retains a smooth plateau. The loss of capacitance may come from the
electrochemical dissolution of active materials.[94] However, the capacitance retention rate still
reached 74.1% after 15 000 cycles, which is an impressive stability, considering the small
thickness of the electrodes.

Chapter 5. On chip, all solid-state and flexible micro-supercapacitors 67
Figure 5. 9. (a) The long-term cycling stability of MnOx/Au multilayers micro-supercapacitor, measured at a scan
rate of 1 V s1
. (b) Ragone plot of the micro-supercapacitor, in comparison with other energy storage devices. (c)
Compression setup for strain test. (d) CV curves measured at different bending states, indicated by diameters of
curvature.
The Ragone plot (Figure 5. 9b) compares the volumetric power densities and energy densities
of the MnOx/Au multilayers micro-supercapacitors to the data for other energy storage devices.
The micro-supercapacitor exhibits a maximum volumetric energy density of 1.75 mWh cm3
,
which is two times higher than that reported for commercial activated carbon
supercapacitors,[12] five times higher than that of H-TiO2@MnO2//H-TiO2@C supercapacitors
(PVA/LiCl),[148] two orders of magnitude higher than that of graphene supercapacitors
(PVA/H3PO4),[12] and three orders of magnitude higher than that of aluminum electrolytic
capacitors.[12] The maximum volumetric power density is 3.44 W cm3
, which is five times

68 Chapter 5. On chip, all solid-state and flexible micro-supercapacitors
higher than that of commercial activated carbon supercapacitors, ten times higher than those of
graphene supercapacitors (PVA/H3PO4)[12] and H-TiO2@MnO2//H-TiO2@C supercapacitors
(PVA/LiCl),[148] and three orders of magnitude higher than that for lithium thin film batteries.
For the mechanical flexibility measurement, the micro-supercapacitor was mounted onto a
compression setup (Figure 5. 9c). The setup have two clamps, one of which can be accurately
moved to apply a compressive strain along the measured supercapacitor device. CV
measurements were conducted at a scan rate of 1 V s1
, with capacitors under various bending
states. As shown in Figure 5. 9d, the curvature radius ranges from 4 mm to 0.5 mm. The CV
curves of the micro-supercapacitor measured without strain and at bending states, all show
similar capacitive behavior, with a capacitance change less than 0.09 %. It is worth noting that
the strain measurement was conducted after the long-term cycling test, demonstrating the high
stability of the micro-supercapacitor. After the strain test (Figure 5. 10), the CV behavior still
remains its rectangular shape.
Figure 5. 10. CV curve of MnOx/Au multilayer micro-supercapacitor measured at a scan rate of 1 V s1
after the
strain test.
5.4 Conclusion
In this work, a new concept is introduced to fabricate on chip, all solid-state and flexible micro-
supercapacitors based on MnOx/Au multilayers, which is compatible with current
microelectronics. The micro-supercapacitor exhibits a maximum energy density of 1.75 mWh
cm3
and a maximum power density of 3.44 W cm3
, which are both much higher than the state
of the art supercapacitors. At a scan rate of 1 V s1
, a volumetric capacitance of 32.8 F cm3
is

Chapter 5. On chip, all solid-state and flexible micro-supercapacitors 69
obtained for MnOx/Au multilayers electrodes, which is much higher than the bare MnOx
electrode. EIS and the evolution complex capacitance confirm that the electrical conductivity of
MnOx is improved due to incorporation of gold, and a low relaxation time constant around 5 ms
is observed. The MnOx/Au multilayers micro-supercapacitor also shows good long-term cycling
stability, with a capacitance retention rate of 74.1% after a large cycling number of 15 000 times.
Such an architecture enables effective charge transport and electrode integrity, thus endowing the
electrodes with high volumetric capacitance, high energy and power density. The good long-term
cycling stability and high flexibility of the all solid-state micro-supercapacitor show potential
applications in smart environments and miniaturized electronic devices, which require power
resources with small dimensions and high power density.

70 Chapter 6. Fiber-shaped supercapacitors
6. Fiber-shaped supercapacitors based on
Cu wire
The flexibility of energy storage devices normally originates from flexible substrates, including
carbon cloth, PET, PDMS, Teflon plate, paper, yarn, CNT fiber, graphene fiber, rubber fiber,
metal wires, and so on. Compared to old fashioned 2D energy devices, fiber-shaped energy
devices with 1D wire structures have extraordinary advantages such as excellent flexibility and
small scale, which enable the direct integration of them into flexible electronics. Especially metal
wires, which are commonly used as electrical conductors in modern society, can be used as
substrates to build flexible energy storage devices and conduct electricity at the same time.
It is challenging to homogeneously coat active materials onto 1D wires. For example, with
physical vapor deposition, a shadow effect is inevitable, and it is impossible to get a complete
coating on wires during a single deposition. Chemical methods such as hydrothermal method
(carbonization of glucose directly on wires) can homogeneously coat materials, but it is time-
consuming and needs high temperature, while the coating amount is little. A common method is
to dip-coat the wire with appropriate adhesives, but the resulting coating is inhomogeneous. In
this work, a spray coating method followed by a heating process is adopted. Nafion
(Perfluorinated resin solution, 5wt % in lower aliphatic alcohols and water, Aldrich) was used as
adhesive and dispersing agent for MnO2 and/or carbon, which were mixed together in the ratio of
1:1. A gel electrolyte was prepared in the same way as used for the micro-supercapacitor
introduced in Chapter 5, but here the electrolyte was KOH. The schematic configuration of a
supercapacitor is shown in Figure 6. 1.

Chapter 6. Fiber-shaped supercapacitors 71
Figure 6. 1. A schematic of a coaxial supercapacitor based on a Cu wire. Three layers are coated onto the wire, the
inner MnO2/carbon, and the outer carbon work as two electrodes, and the gel electrolyte works in between them.
As discussed in Chapter 2.2.2, the bipolar construction leads to reduced weight, higher
power/energy density with smaller container than conventional monopolar systems. In this work,
the measurement of supercapacitors were realized by twisting two such mono-supercapacitors
together, i.e., in the mode of bipolar construction. Due to the bipolar design, the voltage window
of the supercapacitor can be extended from 0.8 V to 1.5 V, and the capacitive behavior is still
remained. Figure 6. 2a gives the primary results of the fiber-shaped supercapacitor with a length
of 27 cm, as seen in Figure 6. 2b. Further work will be carried out in future.
Figure 6. 2. (a) CV curves of a bipolar supercapacitor at the scan rate of 500 mV s1
within two voltage windows: 0-
0.8 V and 0-1.5 V. (b) A photograph of the wire supercapacitor.

72 Chapter 7. Conclusion and Outlook
7. Conclusion and Outlook
This doctoral thesis is aimed at designing electrochemical energy storage micro-devices: Li-ion
batteries and supercapacitors, which are compatible with current microelectronic techniques.
Interdisciplinary fields are involved in this work including electrochemistry, materials science,
and microelectronic technique, etc.
The first section in this work utilizes the rolled-up nanotechnology approach to fabricate
single silicon rolled-up tubes as anodes for micro-batteries. A lab-on-chip electrochemical device
has been developed, which allows for the study of the lithiation and delithiation process of a
single rolled-up Si tube, the determination of the diffusion coefficient and electrical conductivity,
as well as the characterization of structural changes. A tubular structured anode demonstrates
enhanced diffusion effect, compared to a planar film. Highly wrinkled surfaces of the tube anode
are obtained after charge/discharge cycling. The single rolled-up tube battery described here is
promising for the fundamental research of voltammetry and electrochemical processes and could
also be used as local on-chip energy supply or for driving ultra-compact autonomous
microsystems.
The second part introduces a new concept to fabricate on chip, all solid-state and flexible
micro-supercapacitors based on MnOx/Au multilayers. The micro-supercapacitor exhibits a
maximum energy density of 1.75 mWh cm3
and a maximum power density of 3.44 W cm3
,
which are both much higher than the state of the art supercapacitors. A low relaxation time
constant around 5 ms is observed. The micro-supercapacitor also shows good long-term cycling
stability, with a capacitance retention of 74.1% after a large cycling number of 15 000 times. The
micro-supercapacitor shows potential applications in smart environments and miniaturized
electronic devices, which require power resources with small dimensions and high power
density.
Further work needs to be carried out to optimize the fiber-shaped supercapacitor, which could
be feasibly integrated with other portable electronics or even woven into textiles.

Chapter 7. Conclusion and Outlook 73

74 Bibliography
Bibliography
[1] C. Liu, F. Li, L.-P. Ma, H.-M. Cheng, Adv. Mater. 22 (2010) E28-E62.
[2] B.E. Conway, Electrochemical Supercapacitors: Scientific, Fundamentals and Technological
Applications, Plenum, New York, 1999.
[3] R. Koetz, M. Carlen, Electrochim. Acta 45 (2000) 2483-2498.
[4] O.G. Schmidt, K. Eberl, Nature 410 (2001) 168.
[5] Y. Mei, G. Huang, A.A. Solovev, E.B. Uren, I. Mönch, F. Ding, T. Reindl, R.K.Y. Fu, P.K. Chu, O.G.
Schmidt, Adv. Mater. 20 (2008) 4085-4090.
[6] H. Ji, X. Wu, L. Fan, C. Krien, I. Fiering, Y. Guo, Y. Mei, O.G. Schmidt, Adv. Mater. 22 (2010) 4591-4595.
[7] H. Ji, Y. Mei, O.G. Schmidt, Chem. Commun. 46 (2010) 3881-3883.
[8] C. Yan, W. Xi, W. Si, J. Deng, O.G. Schmidt, Adv. Mater. 25 (2013) 539-544.
[9] J. Deng, H. Ji, C. Yan, J. Zhang, W. Si, S. Baunack, S. Oswald, Y. Mei, O.G. Schmidt, Angew. Chem. Int.
Ed. 52 (2013) 2326-2330.
[10] B.Y. Ahn, E.B. Duoss, M.J. Motala, X. Guo, S.-I. Park, Y. Xiong, J. Yoon, R.G. Nuzzo, J.A. Rogers, J.A.
Lewis, Science 323 (2009) 1590-1593.
[11] J.J. Boland, Nat. Mater. 9 (2010) 790-792.
[12] M.F. El-Kady, V. Strong, S. Dubin, R.B. Kaner, Science 335 (2012) 1326-1330.
[13] L.Y. Yuan, B. Yao, B. Hu, K.F. Huo, W. Chen, J. Zhou, Energy Environ. Sci. 6 (2013) 470-476.
[14] M. Park, X. Zhang, M. Chung, G.B. Less, A.M. Sastry, J. Power Sources 195 (2010) 7904-7929.
[15] G. Wang, L. Zhang, J. Zhang, Chem. Soc. Rev. 41 (2012) 797-828.
[16] P. Simon, Y. Gogotsi, Nat. Mater. 7 (2008) 845-854.
[17] J.M. Tarascon, M. Armand, Nature 414 (2001) 359-367.
[18] L. Ji, Z. Lin, M. Alcoutlabi, X. Zhang, Energy Environ. Sci. 4 (2011) 2682-2699.
[19] W.-J. Zhang, J. Power Sources 196 (2011) 13-24.
[20] H. Ikeda, T. Saito, H. Tamura, in: A. Kozawa, R.H. Brodd (Eds.) Proc. Manganese Dioxide Symp., IC
sample Office, Cleveland, OH, 1975.
[21] K. Mizushima, P.C. Jones, P.J. Wiseman, J.B. Goodenough, Mat. Res. Bull. 15 (1980) 783-789.
[22] M.M. Thackeray, W.I.F. David, P.G. Bruce, J.B. Goodenough, Mat. Res. Bull. 18 (1983) 461-472.
[23] J.R. Szczech, S. Jin, Energy Environ. Sci. 4 (2011) 56-72.
[24] R.A. Marsh, P.G. Russell, T.B. Reddy, J. Power Sources 65 (1997) 133-141.

Bibliography 75
[25] J.Y. Eom, H.S. Kwon, J. Liu, O. Zhou, Carbon 42 (2004) 2589-2596.
[26] D. Chen, L. Tang, J. Li, Chem. Soc. Rev. 39 (2010) 3157-3180.
[27] P. Guo, H. Song, X. Chen, Electrochem. Commun. 11 (2009) 1320-1324.
[28] H.S. Zhou, S.M. Zhu, M. Hibino, I. Honma, M. Ichihara, Adv. Mater. 15 (2003) 2107-2111.
[29] D. Larcher, C. Masquelier, D. Bonnin, Y. Chabre, V. Masson, J.B. Leriche, J.M. Tarascon, J.
Electrochem. Soc. 150 (2003) A133-A139.
[30] J. Morales, L. Sanchez, F. Martin, F. Berry, X.L. Ren, J. Electrochem. Soc. 152 (2005) A1748-A1754
[31] Z.S. Wu, W.C. Ren, L. Wen, L.B. Gao, J.P. Zhao, Z.P. Chen, G.M. Zhou, F. Li, H.M. Cheng, ACS Nano 4
(2010) 3187–3194.
[32] C.H. Chen, B.J. Hwang, J.S. Do, J.H. Weng, M. Venkateswarlu, M.Y. Cheng, R. Santhanam, K.
Ragavendran, J.F. Lee, J.M. Chen, D.G. Liu, Electrochem. Commun. 12 (2010) 496-498.
[33] K. Zhong, X. Xia, B. Zhang, H. Li, Z. Wang, L. Chen, J. Power Sources 195 (2009) 3300-3308.
[34] M.M. Thackeray, Prog. Solid State Chem. 25 (1997) 1-71.
[35] X.L. Ji, S. Herle, Y.H. Rho, L.F. Nazar, Chem. Mater. 19 (2007) 374-383.
[36] J. Morales, L. Sanchez, F. Martin, J.R. Ramos-Barrado, M. Sanchez, Electrochim. Acta 49 (2004)
4589-4597.
[37] Y.H. Lee, I.C. Leu, S.T. Chang, C.L. Liao, K.Z. Fung, Electrochim. Acta 50 (2004) 553-559.
[38] J. Hu, H. Li, X.J. Huang, Electrochem. Solid-State Lett. 8 (2005) A66-A69.
[39] P. Poizot, S. Laruelle, S. Grugeon, L. Dupont, J. Tarascon, Nature 407 (2000) 496-499.
[40] O. Delmer, P. Balaya, L. Kienle, J. Maier, Adv. Mater. 20 (2008) 501-505.
[41] C.J. Wen, R.A. Huggins, J. Solid State Chem. 37 (1981) 271-278.
[42] M.N. Obrovac, L. Christensen, Electrochem. Solid-State Lett. 7 (2004) A93-A96.
[43] T.D. Hatchard, J.R. Dahn, J. Electrochem. Soc. 151 (2004) A838-A842.
[44] M.N. Obrovac, L.J. Krause, J. Electrochem. Soc. 154 (2007) A103-A108.
[45] J. Li, J.R. Dahn, J. Electrochem. Soc. 154 (2007) A156-A161.
[46] M.R. Zamfir, H.T. Nguyen, E. Moyen, Y.H. Lee, D. Pribat, J. Mater. Chem. A 1 (2013) 9566-9586.
[47] C.K. Chan, H. Peng, G. Liu, K. Mcllwarth, X.F. Zhang, R.A. Huggins, Y. Cui, Nat. Nanotechnol. 3 (2008)
31-35.
[48] S.D. Beattie, D. Larcher, M. Morcrette, B. Simon, J.-M. Tarascon, J. Electrochem. Soc. 155 (2008)
A158-A163.
[49] S. Iwamura, H. Nishihara, T. Kyotani, J. Power Sources 222 (2013) 400-409.
[50] C.K. Chan, R. Ruffo, S.S. Hong, R.A. Huggins, Y. Cui, J. Power Sources 189 (2009) 34-39.

76 Bibliography
[51] M. Kaempgen, C.K. Chan, J. Ma, Y. Cui, G. Gruner, Nano Lett. 9 (2009) 1872-1876.
[52] Y. Yao, M.T. McDowell, I. Ryu, H. Wu, N. Liu, L. Hu, W.D. Nix, Y. Cui, Nano Lett. 11 (2011) 2949-2954.
[53] Y.-G. Guo, J.-S. Hu, L.-J. Wan, Adv. Mater. 20 (2008) 2878-2887.
[54] J. Li, A. Smith, R.J. Sanderson, T.D. Hatchard, R.A. Dunlap, J.R. Dahn, J. Electrochem. Soc. 156 (2009)
A283-A288.
[55] B. Key, R. Bhattacharyya, M. Morcrette, V. Sezne´c, J.-M. Tarascon, C.P. Grey, J. Am. Chem. Soc. 131
(2009) 9239-9249.
[56] J.Y. Huang, L. Zhong, C.M. Wang, J.P. Sullivan, W. Xu, L.Q. Zhang, S.X. Mao, N.S. Hudak, X.H. Liu, A.
Subramanian, H. Fan, L. Qi, A. Kushima, J. Li, Science 330 (2010) 1515-1520.
[57] X.H. Liu, J.W. Wang, S. Huang, F. Fan, X. Huang, Y. Liu, S. Krylyuk, J. Yoo, S.A. Dayeh, A.V. Davydov,
S.X. Mao, S.T. Picraux, S. Zhang, J. Li, T. Zhu, J.Y. Huang, Nat. Nanotechnol. 7 (2012) 749-756.
[58] J.W. Wang, Y. He, F. Fan, X.H. Liu, S. Xia, Y. Liu, C.T. Harris, H. Li, J.Y. Huang, S.X. Mao, T. Zhu, Nano
Lett. 13 (2013) 709-715.
[59] P. Limthongkul, Y.-I. Jang, N.J. Dudney, Y.-M. Chiang, Acta Mater. 51 (2003) 1103-1113.
[60] J. Danet, T. Brousse, K. Rasim, D. Guyomard, P. Moreau, Phys. Chem. Chem. Phys. 12 (2010) 220-
226.
[61] M.J. Chon, V.A. Sethuraman, A. McCormick, V. Srinivasan, P.R. Guduru, Phys. Rev. Lett. 107 (2011)
045503.
[62] V.A. Sethuraman, V. Srinivasan, J. Newman, J. Electrochem. Soc. 160 (2013) A394-A403.
[63] C.M. Wang, W. Xu, J. Liu, D. Choi, B. Arey, L.V. Saraf, J. Zhang, Z. Yang, S. Thevuthasan, D.R. Baer, J.
Mater. Res. 25 (2010) 1541-1547.
[64] X.H. Liu, L. Zhong, S. Huang, S.X. Mao, T. Zhu, J.Y. Huang, ACS Nano 6 (2012) 1522-1531.
[65] X.H. Liu, L.Q. Zhang, L. Zhong, Y. Liu, H. Zheng, J.W. Wang, J.-H. Cho, S.A. Dayeh, S.T. Picraux, J.P.
Sullivan, S.X. Mao, Z.Z. Ye, J.Y. Huang, Nano Lett. 11 (2011) 2251-2258.
[66] M.T. McDowell, I. Ryu, S.W. Lee, C. Wang, W.D. Nix, Y. Cui, Adv. Mater. 24 (2012) 6034-6041.
[67] B. Key, M. Morcrette, J.-M. Tarascon, C.P. Grey, J. Am. Chem. Soc. 133 (2010) 503-512.
[68] H. Kim, C.-Y. Chou, J.G. Ekerdt, G.S. Hwang, J. Phys. Chem. C 115 (2011) 2514-2521.
[69] M.T. McDowell, S. Woo Lee, C. Wang, Y. Cui, Nano Energy 1 (2012) 401-410.
[70] V.L. Chevrier, J.R. Dahn, J. Electrochem. Soc. 156 (2009) A454-A458.
[71] X.H. Liu, Y. Liu, A. Kushima, S. Zhang, T. Zhu, J. Li, J.Y. Huang, Adv. Energy Mater. 2 (2012) 722-741.
[72] M.S. Whittingham, Chem. Rev. 104 (2004) 4271-4301.
[73] K. Mizushima, P.C. Jones, P.J. Wiseman, J.B. Goodenough, Mater. Res. Bull. 15 (1980) 783-789.

Bibliography 77
[74] G.G. Amatucci, J.M. Tarascon, L.C. Klein, J. Electrochem. Soc. 143 (1996) 1114-1123.
[75] P.G. Bruce, B. Scrosati, J.M. Tarascon, Angew. Chem. Int. Ed. 47 (2008) 2930-2946.
[76] F.F.C. Bazito, R.M. Torresi, J. Braz. Chem. Soc. 17 (2006) 627-642.
[77] J.B. Goodenough, J. Power Sources 174 (2007) 996-1000.
[78] C.S. Sun, Z. Zhou, Z.G. Xu, D.G. Wang, J.P. Wei, X.K. Bian, J. Yan, J. Power Sources 193 (2009) 841-
845.
[79] N. Meethong, Y.H. Kao, S.A. Speakman, Y.M. Chiang, Adv. Funct. Mater. 19 (2009) 1060-1070.
[80] M.T. McDowell, Y. Cui, Adv. Energy Mater. 1 (2011) 894-900.
[81] L. Mai, Y. Dong, L. Xu, C. Han, Nano Lett. 10 (2010) 4273-4278.
[82] H. Fukui, N. Nakata, K. Dokko, B. Takemura, H. Ohsuka, T. Hino, K. Kanamura, ACS Appl. Mater.
Interfaces 3 (2011) 2318-2322.
[83] M. Nishizawa, R. Hashitani, T. Itoh, T. Matsue, I. Uchida, Electrochem. Solid-State Lett. 1 (1998) 10-
12.
[84] K. Dokko, M. Mohamedi, M. Umeda, I. Uchida, J. Electrochem. Soc. 150 (2003) A425-A429.
[85] M. Galinski, A. Lewandowski, I. Stepniak, Electrochim. Acta 51 (2006) 5567-5580.
[86] J. Carche, C.K. Dyer, P.T. Moseley, Z. Ogumi, D.A.J. Rand, B. Scrosati, Encyclopedia of
Electrochemical Power Sources, Elsevier B.V., 2009.
[87] A. Lewandowski, M. Galinski, J. Phys. Chem. Solids 64 (2004) 281-286.
[88] C. Meng, Journal of Postdoctoral Research (2013) 16-30.
[89] http://www.alabc.org/publications/bipolar-designs.
[90] H. Shi, Electrochim. Acta 41 (1995) 1633-1639.
[91] D. Qu, J. Power Sources 109 (2002) 403-411.
[92] Y.J. Kim, Y. Horie, S. Ozaki, Y. Matsuzawa, H. Suezaki, C. Kim, N. Miyashita, M. Endo, Cabon 42 (2004)
1491-1500.
[93] Q. Li, Z. Li, L. Lin, X. Wang, Y. Wang, C. Zhang, H. Wang, Chem. Eng. J. 156 (2010) 500-504.
[94] W.F. Wei, X.W. Cui, W.X. Chen, D.G. Ivey, Chem. Soc. Rev. 40 (2011) 1697-1721.
[95] H. Zhang, G. Cao, Z. Wang, Y. Yang, Z. Shi, Z. Gu, Electrochem. Commun. 10 (2008) 1056-1059.
[96] C. Pang, C. Lee, K.-Y. Suh, J. Appl. Polym. Sci. 130 (2013) 1429-1441.
[97] M.D. Lima, S. Fang, X. Lepró, C. Lewis, R. Ovalle-Robles, J. Carretero-González, E. Castillo-Martínez,
M.E. Kozlov, J. Oh, N. Rawat, C.S. Haines, M.H. Haque, V. Aare, S. Stoughton, A.A. Zakhidov, R.H.
Baughman, Science 331 (2011) 51-55.
[98] R.F. Service, Science 301 (2003) 909-911.

78 Bibliography
[99] Y.C. Chen, Y.K. Hsu, Y.G. Lin, Y.K. Lin, Y.Y. Horng, L.C. Chen, K.H. Chen, Electrochim. Acta 56 (2011)
7124-7130.
[100] Z. Weng, Y. Su, D.W. Wang, F. Li, J.H. Du, H.M. Cheng, Adv. Energy Mater. 1 (2011) 917-922.
[101] K. Wang, W.J. Zou, B.G. Quan, A.F. Yu, H.P. Wu, P. Jiang, Z.X. Wei, Adv. Energy Mater. 1 (2011)
1068-1072.
[102] J. Bae, M.K. Song, Y.J. Park, J.M. Kim, M. Liu, Z.L. Wang, Angew. Chem. Int. Edit. 50 (2011) 1683-
1687.
[103] X. Wang, B. Liu, R. Liu, Q. Wang, X. Hou, D. Chen, R. Wang, G. Shen, Angew. Chem. Int. Edit. 53
(2014) 1-6.
[104] Y. Fu, H. Wu, S. Ye, X. Cai, X. Yu, S. Hou, H. Kafafy, D. Zou, Energy Environ. Sci. 6 (2013) 805-812.
[105] J.A. Lee, M.K. Shin, S.H. Kim, H.U. Cho, G.M. Spinks, G.G. Wallace, M.D. Lima, X. Lepró, M.E. Kozlov,
R.H. Baughman, S.J. Kim, Nat. Commun. 4 (2013) 1970.
[106] B.S. Shim, W. Chen, C. Doty, C. Xu, N.A. Kotov, Nano Lett. 8 (2008) 4151-4157.
[107] W. Weng, Q. Sun, Y. Zhang, H. Lin, J. Ren, X. Lu, M. Wang, H. Peng, Nano Lett. 14 (2014) 3432–3438.
[108] D. Harrison, F. Qiu, J. Fyson, Y. Xu, P. Evans, D. Southee, Phys.Chem. Chem. Phys. 15 (2013) 12215-
12219.
[109] http://www.idtechex.com/supercapacitors-europe-14/sc.asp.
[110] S.A. Campbell, The Science and Engineering of Microelectronic Fabrication, Second Edition ed.,
Oxford University Press, 2001.
[111] S. Li, L. Ma, H. Zhen, M.R. Jorgensen, S. Kiravittaya, O.G. Schmidt, Appl. Phys. Lett. 101 (2012)
231106.
[112] V. Magdanz, S. Sanchez, O.G. Schmidt, Adv. Mater. 25 (2013) 6581-6588.
[113] W. Xi, C.K. Schmidt, S. Sanchez, D.H. Gracias, R.E. Carazo-Salas, S.P. Jackson, O.G. Schmidt, Nano
Lett. 14 (2014) 4197–4204.
[114] C.S. Martinez-Cisneros, S. Sanchez, W. Xi, O.G. Schmidt, Nano Lett. 14 (2014) 2219–2224.
[115] D. Grimm, C.C. Bof Bufon, C. Deneke, P. Atkinson, D.J. Thurmer, F. Schäffel, S. Gorantla, A.
Bachmatiuk, O.G. Schmidt, Nano Lett. 13 (2012) 213-218.
[116] C.C. Bof Bufon, J.D. Arias Espinoza, D.J. Thurmer, M. Bauer, C. Deneke, U. Zschieschang, H. Klauk,
O.G. Schmidt, Nano Lett. 11 (2011) 3727-3733.
[117] Y. Chen, C. Yan, O.G. Schmidt, Adv. Energy Mater. 3 (2013) 1269-1274.
[118] X. Sun, C. Yan, Y. Chen, W. Si, J. Deng, S. Oswald, L. Liu, O.G. Schmidt, Adv. Energy Mater. 4 (2014)
1300912.

Bibliography 79
[119] J. Deng, C. Yan, L. Yang, S. Baunack, S. Oswald, H. Wendrock, Y. Mei, O.G. Schmidt, ACS Nano 7
(2013) 6948-6954.
[120] L. Zhang, J. Deng, L. Liu, W. Si, S. Oswald, L. Xi, M. Kundu, G. Ma, T. Gemming, S. Baunack, F. Ding,
C. Yan, O.G. Schmidt, Adv. Mater. 26 (2014) 4527-4532.
[121] D. Aurbach, M.D. Levi, E. Levi, H. Telier, B. Markovsky, G. Salitra, U. Heider, L. Hekier, J.
Electrochem. Soc. 145 (1998) 3024-3034.
[122] W. Si, X. Sun, X. Liu, L. Xi, Y. Jia, C. Yan, O.G. Schmidt, J. Power Sources 267 (2014) 629-634.
[123] A.J. Bard, L.R. Faulkner, Electrochemical Methods: Fundamentals and Applications, John Wiley &
Sons, Inc., New York, 2001.
[124] E. Barsoukov, J.R. Macdonald, Impedance Spectroscopy Theory, Experiment, and Applications,
John Wiley & Sons, Inc., 2005.
[125] http://web.pdx.edu/~pmoeck/phy381/Topic5a-XRD.pdf.
[126] http://mmrc.caltech.edu/SS_XPS/XPS_PPT/XPS_Slides.pdf.
[127] http://en.wikipedia.org/wiki/Atomic_force_microscopy.
[128] D.J. Gardiner, Springer-Verlag ISBN 978-0-387-50254-0. (1989).
[129] http://en.wikipedia.org/wiki/Raman_spectroscopy.
[130] Y. Mei, A.A. Solovev, S. Sanchez, O.G. Schmidt, Chem. Soc. Rev. 40 (2011) 2109-2119.
[131] A.T. Voutsas, M.K. Hatalis, J. Boyce, A. Chiang, J. Appl. Phys. 78 (1995) 6999-7006.
[132] K.-L. Lee, J.-Y. Jung, S.-W. Lee, H.-S. Moon, J.-W. Park, J. Power Sources 129 (2004) 270-274.
[133] Y. Yu, L. Gu, C. Zhu, S. Tsukimoto, P.A. van Aken, J. Maier, Adv. Mater. 22 (2010) 2247-2250.
[134] M. Green, E. Fielder, B. Scrosati, M. Wachtler, J.S. Moreno, Electrochem. Solid-State Lett. 6 (2003)
A75-A79.
[135] E. Pollak, G. Salitra, V. Baranchugov, D. Aurbach, J. Phys. Chem. C 111 (2007) 11437-11444.
[136] H. Mehrer, N.A. Stolwijk, Diffusion Fundamentals 11 (2009) 1-32.
[137] J. Xie, N. Imanishi, T. Zhang, A. Hirano, Y. Takeda, O. Yamamoto, Mater. Chem. Phys. 120 (2010)
421-425.
[138] K. Yoshimura, J. Suzuki, K. Sekine, T. Takamura, J. Power Sources 174 (2007) 653-657.
[139] T. Zhang, H.P. Zhang, L.C. Yang, B. Wang, Y.P. Wu, T. Takamura, Electrochim. Acta 53 (2008) 5660-
5664.
[140] N. Ding, J. Xu, Y.X. Yao, G. Wegner, X. Fang, C.H. Chen, I. Lieberwirth, Solid State Ionics 180 (2009)
222-225.
[141] R. Ruffo, S.S. Hong, C.K. Chan, R.A. Huggins, Y. Cui, J. Phys. Chem. C 113 (2009) 11390-11398.

80 Bibliography
[142] G.A. Tritsaris, K. Zhao, O.U. Okeke, E. Kaxiras, J. Phys. Chem. C 116 (2012) 22212-22216.
[143] G.Y. Gu, R. Laura, K.M. Abraham, Electrochem. Solid-State Lett. 2 (1999) 486-489.
[144] J.R. Miller, P. Simon, Science 321 (2008) 651-652.
[145] D. Pech, M. Brunet, H. Durou, P.H. Huang, V. Mochalin, Y. Gogotsi, P.L. Taberna, P. Simon, Nat.
Nanotechnol. 5 (2010) 651-660.
[146] H.Y. Lee, J.B. Goodenough, J. Solid State Chem. 144 (1999) 220-223.
[147] X. Zhang, W.S. Yang, Y.W. Ma, Electrochem. Solid-State Lett. 12 ( 2009) A95-A98.
[148] X.H. Lu, M.H. Yu, G.M. Wang, T. Zhai, S.L. Xie, Y.C. Ling, Y.X. Tong, Y. Li, Adv. Mater. 25 (2012) 267-
272.
[149] S. Devaraj, N. Munichandraiah, J. Electrochem. Soc. 154 (2007) A80-A88.
[150] M. Toupin, T. Brousse, D. Bélanger, Chem. Mater. 14 (2002) 3946-3952.
[151] M. Toupin, T. Brousse, D. Bélanger, Chem. Mater. 16 (2004) 3184-3190.
[152] T. Brousse, M. Toupin, R. Dugas, L. Athouel, O. Crosnier, D. Bélanger, J. Electrochem. Soc. 153
(2006) A2171-A2180.
[153] Y.S. Chen, C.C. Hu, Electrochem. Solid-State Lett. 6 (2003) A210-A213.
[154] E. Raymundo-Piñero, V. Khomenko, E. Frackowiak, F. Béguina, J. Electrochem. Soc. 152 (2005)
A229-A235.
[155] S.R. Sivakkumar, J.M.K.D.Y. Kim, B.C. Kim, G.G. Wallace, Electrochim. Acta 52 (2007) 7377-7385.
[156] C. Ye, Z.M. Lin, S.Z. Hui, J. Electrochem. Soc. 152 (2005) A1272-A1278.
[157] J.P. Ni, W.C. Lu, L.M. Zhang, B.H. Yue, X.F. Shang, Y. Lv, J. Phys. Chem. C 113 (2009) 54-60.
[158] P. Yu, X. Zhang, Y. Chen, Y.W. Ma, Mater. Lett. 64 (2010) 61-64.
[159] A.E. Fischer, K.A. Pettigrew, D.R. Rolison, R.M. Stroud, J.W. Long, Nano Lett. 7 (2007) 281-286.
[160] V. Subramanian, H.W. Zhu, B.Q. Wei, Electrochem. Commun. 8 (2006) 827-832.
[161] C.Y. Lee, H.M. Tsai, H.J. Chuang, S.Y. Li, P. Lin, T.Y. Tseng, J. Electrochem. Soc. 152 (2005) A716-
A720.
[162] S.C. Pang, M.A. Anderson, T.W. Chapman, J. Electrochem. Soc. 147 (2000) 444-450.
[163] M.W. Xu, D.D. Zhao, S.J. Bao, H.L. Li, J. Solid State Electrochem. 11 (2007) 1101-1107.
[164] N. Nagarajan, H. Humadi, I. Zhitomirsky, Electrochim. Acta 51 (2006) 3039-3045.
[165] L.Y. Yuan, X.H. Lu, X. Xiao, T. Zhai, J.J. Dai, F.C. Zhang, B. Hu, X. Wang, L. Gong, J. Chen, C.G. Hu, Y.X.
Tong, J. Zhou, Z.L. Wang, ACS Nano 6 (2012) 656-661.
[166] Y. Wang, I. Zhitomirsky, Langmuir 25 (2009) 9684-9689.
[167] C.J. Hung, J.H. Hung, P. Lin, T.Y. Tseng, J. Electrochem. Soc. 158 (2011) A942-A947.

Bibliography 81
[168] J. Zhang, Y. Wang, J. Zang, G. Xin, Y. Yuan, X. Qu, Carbon 50 (2012) 5196-5202.
[169] J.N. Broughton, M.J. Brett, Electrochem. Solid-State Lett. 5 (2002) A279-A282.
[170] C.-C. Lin, C.-C. Lee, J. Electrochem. Soc. 157 (2010) A230-A236.
[171] J.N. Broughton, M.J. Brett, Electrochim. Acta 49 (2004) 4439-4446.
[172] P.L. Taberna, P. Simon, J.F. Fauvarque, J. Electrochem. Soc. 150 (2003) A292-A300.

List of Figures and Tables
Figure 1. 1. Sketch of Ragone plot ............................................................................................................... 2
Figure 2. 1. Schematic operating mechanisms of a typical rechargeable LIB ............................................. 7
Figure 2. 2. A schematic drawing of graphene. ........................................................................................... 8
Figure 2. 3. Schematic illustration of Si nanowire anode .......................................................................... 11
Figure 2. 4. Galvanostatic and CV curves recorded on crystalline Si nanowires ..................................... 14
Figure 2. 5. Schematic structures for two groups of cathodes ................................................................... 15
Figure 2. 6. Schematic of measuring a single Si nanowire. ....................................................................... 16
Figure 2. 7. Schematic of contacting a single particle as anode for LIB. .................................................. 17
Figure 2. 8. Schematic of contacting SnO2 nanowires under TEM. ........................................................... 17
Figure 2. 9. Schematic illustration of three types of supercapacitors. ....................................................... 18
Figure 2. 10. Schematic diagrams of double layer capacitor .................................................................... 21
Figure 2. 11. The working principle of pseudocapacitors.. ........................................................................ 21
Figure 2. 12. Equivalent circuit model for a battery-type energy storage system ..................................... 23
Figure 2. 13. Schematic illustrations showing monopolar and bipolar ..................................................... 24
Figure 2. 14. Typical CV curves and galvanostatic charge-discharge curves. .......................................... 26
Figure 2. 15. CV curve of a MnO2 electrode in aqueous electrolyte .......................................................... 27
Figure 2. 16. Various flexible mechanical and electrical sensors ............................................................. 30
Figure 3. 1. Process flow for positioning rolled-up nanomembranes. ....................................................... 34
Figure 3. 2. A scheme showing the method to roll-up a tube ..................................................................... 34
Figure 3. 3. Representative discharge-charge voltage profiles of a 2 m Si film. ..................................... 36
Figure 3. 4. Nyquist impedance plot of an ideal capacitor and an electrochemical capacitor ................. 38
Figure 3. 5. Schematic showing the working principle of XRD ................................................................. 39
Figure 3. 6. Schematic diagrams for the working principle of XPS ........................................................... 40
Figure 3. 7. Schematic energy-level diagram indicating the states involved in Raman signal. ................. 41
Figure 4. 1. A schematic depicting procedures for rolling up a single Si tube .......................................... 45
Figure 4. 2. An encapsulated Li-ion battery with a single silicon tube as anode....................................... 46
Figure 4. 3. Optical micrograph and Raman spectrum of a single rolled-up silicon tube ......................... 47

Figure 4. 4. CV curves of the first three cycles at a scan rate of 100 V s1
.............................................. 49
Figure 4. 5. The current-time response, Cottrell plot and Chemical diffusion coefficient (D).. ................ 50
Figure 4. 6. Typical I-V curves of Si tube and electrical conductivity. ...................................................... 52
Figure 4. 7. SEM images of a tube ............................................................................................................. 53
Figure 5. 1. Photograph and schematic diagram of a flexible micro-supercapacitor. .............................. 58
Figure 5. 2. SEM image and AFM image of MnOx/Au multilayers ............................................................ 59
Figure 5. 3. XRD of as-prepared MnOx film. ............................................................................................. 59
Figure 5. 4. XPS characterization of MnOx ................................................................................................ 60
Figure 5. 5. XPS characterization of bare MnOx film and MnOx/Au film with 2 nm MnOx ....................... 61
Figure 5. 6. CV curves and volumetric capacitance of the micro-supercapacitor. .................................... 62
Figure 5. 7. CV curves of the micro-supercapacitor in 1 M Li2SO4. .......................................................... 64
Figure 5. 8. Impedance plots and complex capacitance for micro-supercapacitors ................................. 65
Figure 5. 9. Long-term stability, Ragone plot and flexibility test ............................................................... 67
Figure 5. 10. CV curve after the strain test. ............................................................................................... 68
Figure 6. 1. A schematic of a coaxial supercapacitor based on a Cu wire ................................................ 71
Figure 6. 2. CV curves and photograph a fiber-shaped supercapacitor. ................................................... 71
Table 2. 1. Summarization of conversion anodes. ...................................................................................... 10
Table 2. 2. Summary of the lithiation/delithiation mechanisms for Si. ....................................................... 13
Table 2. 3 Overall comparison between LIBs and supercapacitors. .......................................................... 31

Versicherung
Hiermit versichere ich, dass ich die vorliegende Arbeit ohne unzulässige Hilfe Dritter und ohne
Benutzung anderer als der angegebenen Hilfsmittel angefertigt habe; die aus fremden Quellen
direkt oder indirekt übernommenen Gedanken sind als solche kenntlich gemacht.
Bei der Auswahl und Auswertung des Materials sowie bei der Herstellung des Manuskripts habe
ich Unterstützungsleistungen von folgenden Personen erhalten:
Prof. Dr. Oliver G. Schmidt
Prof. Dr. Chenglin Yan
Dr. Yao Chen
Xiaolei Sun
Weitere Personen waren an der Abfassung der vorliegenden Arbeit nicht beteiligt. Die Hilfe
eines Promotionsberaters habe ich nicht in Anspruch genommen. Weitere Personen haben von
mir keine geldwerten Leistungen für Arbeiten erhalten, die im Zusammenhang mit dem Inhalt
der vorgelegten Dissertation stehen.
Die Arbeit wurde bisher weder im Inland noch im Ausland in gleicher oder ähnlicher Form einer
anderen Prüfungsbehörde vorgelegt.
........................................... ...............................................
Ort, Datum Unterschrift

Acknowledgements
First and foremost, I would like to acknowledge my family. Especial thanks to my parents for raising me
and being so supportive in every single moment of my life. Thanks to my brother for always being there
for me and encouraging me. No words could properly express what I feel for my family.
I would like to thank the financial support of the International Research Training Group (IRTG) and
PAKT project no. 49004401. I want to sincerely thank all the people who have helped and supported me
during the long way to complete this thesis.
I would like to thank Prof. Dr. Oliver G. Schmidt for giving me the opportunity to pursue my Ph.D. in this
wonderful institute. I also want to thank Prof. Dr. Thomas Geßner for giving me this chance doing my
Ph.D. within the framework of IRTG. And I am very grateful to Prof. Dr. Yongfeng Mei to be a referee of
my doctoral thesis and for introducing me to the scientific research in this institute.
I would like to thank Shilong Li for suggesting I come pursue my Ph.D. in this institute, which was one of
the best decisions I have made in my life. I thank him and Na Zheng for helping me adjust to life here and
their friendship over the years. I would like to greatly thank my group leader Prof. Dr. Chenglin Yan for
his support and advice in scientific research and teaching me to write nice publications. I thank all
colleagues in the energy group for their help and fruitful discussions: Dr. Yao Chen, Dr. Xianghong Liu,
Dr. Lin Zhang, Xiaolei Sun, Junwen Deng, Bo Liu, Xueyi Lu.
And I want to thank Ronny Engelhard, who amazingly can get every machine work. Thanks also to Dr.
Ingolf Mönch, who helped me to overcome the horrible bottleneck at the very beginning of my Ph.D.
Thanks to Gungun Lin, Peixuan Chen and Bezuayehu Teshome for inspiring and saving my research. I
thank all the other colleagues in IIN who are always willing to give me help from all aspects during my
Ph.D. time: Dr. Stefan Baunack, Dr. Daniel Grimm, Dr. Stefan Harazim, Martin Bauer, Sebastian Seifert,
Dr. Luyang Han, Anika Hofmann, Dr. Denys Markarov, Dr. Wang Xi, Britta Koch, Stefan Böttner,
Bianca Höfer, Veronika Magdanz, Abbas Madani, Dr. Fei Ding, Dr. Silvia Giudicatti, Dr. Maria Guix
Noguera, Dr. Yongheng Huo, Dr. Libo Ma, Barbara Eichler, Sandra Nestler, Dr. Dominic Thurmer, Dr.
Lluís Soler Turu, Dr. Honglou Zhen, Dr. Hengxing Ji, Dr. Jianjun Zhang, Jiaxiang Zhang, Dr. Matthew
Jorgensen, Vladimir Bolanos, Dr. Elliot Smith, Dr. Rerngchai Arayanarakool, Daniil Karnaushenko,
Dmitriy Karnaushenko, Dr. Maria Bendova, Dr. Céline Vervacke, Cornelia Krien, Irina Fiering, Michael
Melzer, Robert Streubel, Dr. Samuel Sanchez, Dr. Feng Zhu, Dr. Jianjun Zhang, Eugenio Zallo, Sonja
Maria Marz, Vivienne Meier. Great thanks to Ulrike Steere, Anja Schanze and Grit Rötzer for countless
paper works and caring about me.
I also thank colleagues from IKM who gave me great help with experiments: Dr. Steffen OswaldAndrea
Voß. I also thank the help and friendship from Guozhi Ma, Pan Ma, Lixia Xi, Yandong Jia, Kaikai Song.
I thank the IT people René Pokorny and André Eichler for the support with computers.
I also greatly appreciate the members from IRTG for giving me help and support: Dr. Ramona Ecke, Dr.
Thomas Wächtler, Dr. Knut Schulze, Ms. Katrin Träber. Thanks to my friends from IRTG: Jinji Luo, Dr.
Li Ding, Peng Jiang, Xiao Hu.
I thank all my friends in China and to anyone else who has helped me during the long way. I would never
be able to finish this work without their supports and encouragements.

Publications (Peer-Review)
1. W. Si, C. Yan, Y. Chen, S. Oswald, L. Han, O. G. Schmidt. On chip, all solid-state and flexible
micro-supercapacitors with high performance based on MnOx/Au multilayers. Energy Environ. Sci. 6
(2013) 3218-3223. (back cover)
2. W. Si, X. Sun, X. Liu, L. Xi, Y. Jia, C. Yan, O. G. Schmidt. High areal capacity, micrometer-scale
amorphous Si film anode based on nanostructured Cu foil for Li-ion batteries. J. Power Sources 267
(2014) 629-634.
3. W. Si, I. J. Mönch, C. Yan, J. Deng, S. Li, G. Lin, L. Han, Y. Mei, O. G. Schmidt. A single rolled-up
Si tube battery for study of electrochemical kinetics, electrical conductivity and structural integrity.
Adv. Mater. 26 (2014) 7973-7978.
4. X. Sun, W. Si, X. Liu, J. Deng, L. Xi, L. Liu, C. Yan, O. G. Schmidt. Multifunctional Ni/NiO
hybridized nanomembranes as anode materials for high-rate Li-ion batteries. Nano Energy 9 (2014)
168-175.
5. X. Liu, W. Si, X. Sun, J. Deng, J. Zhang, S. Baunack, S. Oswald, L. Liu, C. Yan, O. G. Schmidt.
Free-standing Fe2O3 nanomembranes as anodes for Li-ion batteries with long cycling life and high
rate capability. Sci. Rep. 4 (2014) 7452.
6. E. Song, W. Si, R. Cao, P. Feng, I. Mönch, G. Huang, Z. Di, O. G. Schmidt, Y. Mei. Schottky contact
on ultra-thin silicon nanomembranes under light illumination. Nanotechnology 25 (2014) 485201.
7. X. Liu, J. Zhang, W. Si, S. Oswald, C. Yan, O. G. Schmidt. High-rate amorphous SnO2
nanomembrane anodes for Li-ion batteries with a long cycling life. Nanoscale 7 (2015) 282-288.
8. C. Yan, W. Xi, W. Si, J. Deng, O. G. Schmidt. Highly conductive and strain-released hybrid
multilayer Ge/Ti nanomembranes with enhanced lithium-ion-storage capability. Adv. Mater. 25
(2013) 539-544.
9. X. Liu, J. Zhang, W. Si, L. Xi, S. Oswald, C. Yan, O. G. Schmidt. High-rate amorphous SnO2
nanomembrane anodes for Li-ion batteries with a long cycling life. Nanoscale 7 (2015) 282.
10. X. Sun, C. Yan, Y. Chen, W. Si, J. Deng, S. Oswald, L. Liu, O. G. Schmidt. Three-dimensionally
“curved”NiO nanomembranes as ultrahigh rate capability anodes for Li-ion batteries with long cycle
lifetimes. Adv. Energy Mater. 4 (2014) 1300912.
11. L. Zhang, J. Deng, L. Liu, W. Si, S. Oswald, L. Xi, M. Kundu, G. Ma, T. Gemming, S. Baunack, F.
Ding, C. Yan, O. G. Schmidt. Hierarchically designed SiOx/SiOy bilayer nanomembranes as stable
anodes for lithium ion batteries. Adv. Mater. 26 (2014) 4527-4532.
12. G. Lin, D. Makarov, M. Melzer, W. Si, C. Yan, O. G.Schmidt. A highly flexible and compact
magnetoresistive analytic device. Lab chip 14 (2014) 4050-4057.
13. J. Deng, H. Ji, C. Yan, J. Zhang, W. Si, S. Baunack, S. Oswald, Y. Mei, O. G. Schmidt. Naturally
rolled-up C/Si/C trilayer nanomembranes as stable anodes for lithium-ion batteries with remarkable
cycling performance. Angew. Chem. Int. Ed. 52 (2013) 2326-2330.

Conferences and scientific presentations
1. W. Si, C. Yan, O. G. Schmidt
Single rolled-up microtube lithium ion batteries and flexible solid-state micro-supercapacitors
International Research Training Group Summer School Shanghai, Shanghai, 24-28 June 2013, oral
2. W. Si, C. Yan, O. G. Schmidt
Flexible, on-chip, all solid state micro-supercapacitors based on MnOx/Au multilayers
IFW winter school, Oberwiesenthal, January 20-23, 2013, poster
3. 5th
International Workshop on Impedance Spectroscopy, Chemnitz, 26-28 September 2012
4. W. Si, C. Yan, O. G. Schmidt
Single rolled-up microtube electrochemical devices
International Research Training Group Summer School Zeuthen, Germany, 22-27 July 2012, oral
5. W. Si, C. Yan, O. G. Schmidt
Electrochemical energy storage micro-devices based on MnOx/Au multilayers
Nano- and Bio-techniques for the packaging of electronic systems, Chemnitz, 2-5 May 2012, poster
6. W. Si, Y. Mei, O. G. Schmidt
Impedance spectroscopy investigation of semiconductor devices based on SOI
International Research Training Group Summer School Shanghai, 5-12 April 2011, Shanghai, oral
Cover pages in journals
1. Energy Environ. Sci. 6, 2013, 3218-3223. (back cover)
2. Adv. Mater., 2014, received invitation, draft ready to submit for consideration. (29.09.2014)
Grants and contributions to research groups
1. Contribution to the DFG research group IRTG Project GDK 1215/2 “Rolled-up nanotech for on-
chip energy storage”.
2. Participation on projects PAKT project “Electrochemical energy storage in autonomous systems,
no. 49004401”.
3. 2014 Chinese Government Award for Outstanding Self-financed Students Abroad, submitted for
consideration.

Curriculum Vitae
Name: Wenping Si Nürnberger Strasse 28g
Date of Birth: 16th August 1986 01187, Dresden
Nationality: Chinese Phone: +49-351-4659-869
Gender: female Email: [email protected]
Education 10/2010 – today Ph.D. student in Leibniz Institute for Solid State and Materials Research Dresden
(IFW), and Chemnitz University of Technology, Germany; 03/2011-06/2011:
guest Ph.D. student in Fudan University, China
09/2008 – 06/2010 Master of Materials Science in Jilin University, China
09/2004 – 06/2008 Bachelor of Materials Science in Jilin University, China
Research Experience 10/2010 – today Ph.D. thesis on “Electrochemical energy storage: lithium-ion batteries and
supercapacitors” in Leibniz Institute for Solid State and Materials Research
Dresden (IFW), and Chemnitz University of Technology, Germany
09/2008 – 06/2010 Graduate Research Program “First-principles study on the elastic property and
electronic structure of Ti5Si3 doped with third element” in Jilin University, China
09/2007 – 02/2008 Undergraduate research “Preparation and modification of Kaolin” in Jilin
University, China
Language Skills Mandarin Chinese native
English fluent
German middle
Korean basic knowledge
Honors 06/2009 The 2
nd class Outstanding Scholarship (Top 13%), Jilin University.
06/2008 The 2nd
class Outstanding Scholarship (Top 13%) & “Excellent Student” of Dept.
of Materials Science and Engineering, Jilin University.
06/2007 The 2nd
class Outstanding Scholarship (Top 13%) & “Excellent Student” of Dept.
of Materials Science and Engineering, Jilin University.
06/2006 The 1st class Outstanding Scholarship (Top 5%) & “Excellent Student” of Jilin
University.
06/2005 The 2nd
class Outstanding Scholarship (Top 13%) & “Excellent Student” of Dept.
of Material Science and Engineering, Jilin University.