designing for speed + ease - solarbuildermag.com · to provide installers with “pre-panelized”...
TRANSCRIPT

solarbuildermag.com july/august 2013
10050 Brecksville rd, Brecksville, OH 44141 electrOnic service requested
designing for
speed + easeManufacturers stepping up their gaMe to encourage systeM price decreases


solarbuildermag.com | 3
cover storyintegrated design Now that modules prices have reached their lowest, the focus to drive down costs in solar has turned to BOS savings through integration. Material cost savings are great, but speeding installation time is really where progress is being made.
16
12
departmentsbalance of system
all control to the modules Module-level power electronics — like power optimizers — have increased their influence in the industry in recent years, essentially giving more control directly to the panel.
mounting and racking
elevated thinking Flat commercial rooftops aren’t exactly flat. There are pipes and vents always interrupting the landscape. Sunmodo manufactures an elevated mounting system to ignore all those obtrusions.
14
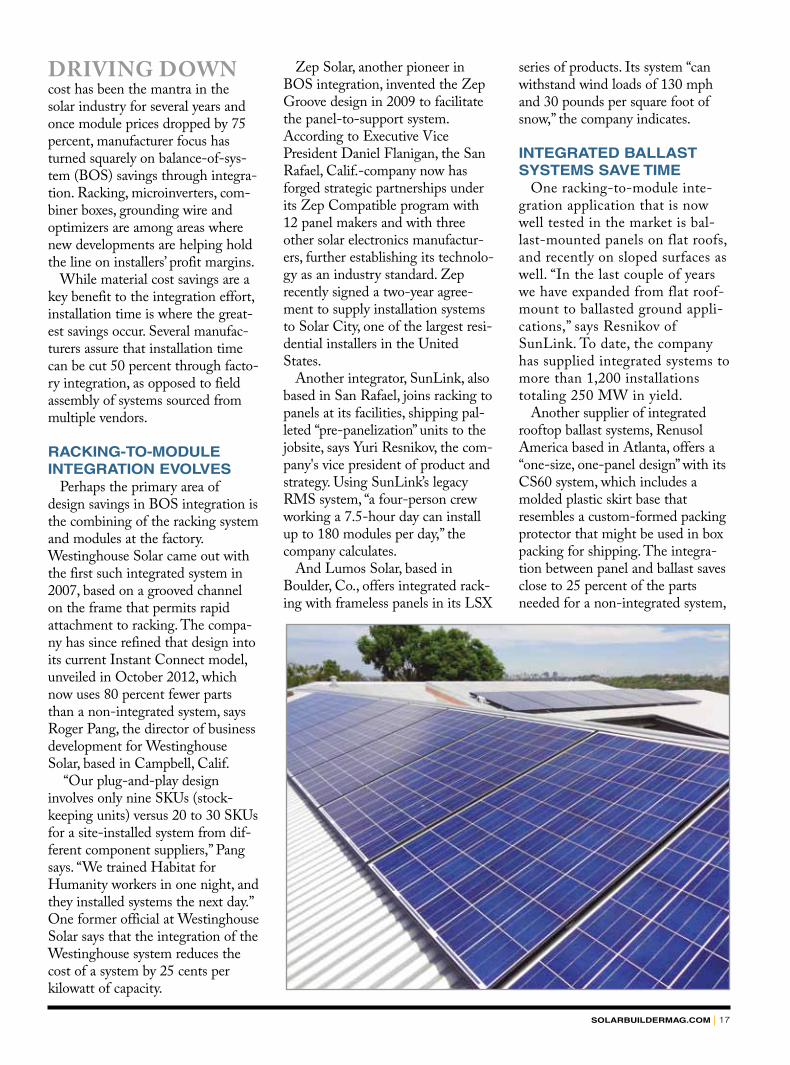
☼ on the coverSunLink combines racking and panels before shipping to provide installers with “pre-panelized” packages, encouraging faster install times among fewer crew members.
TM
SOLARBUILDERMAG.COM JULY/AUGUST 2013
10050 BRECKSVILLE RD, BRECKSVILLE, OH 44141 ELECTRONIC SERVICE REQUESTED
DESIGNING FOR
SPEED + EASEMANUFACTURERS STEPPING UP THEIR GAME TO ENCOURAGE SYSTEM PRICE DECREASES
contents july/august 2013

4 July/august 2013
TM
contents july/august 2013
24
bankability: Who, What, Where, WhyBankability has always been important when evaluating vendors for their overall financial viability, but the importance has recently increased.
20
featuresdirectory listings by specialty Search through our directory for contractors, developers, mounting manufacturers, inverter companies, educational offerings, financiers, insurance providers and more.
24 directory listings alphabetically Each company listed in our directory provided contact information so you’re able to get in touch with questions about product and service offerings.
34
34 20
Advertiser ............................................................ Page # .................................................................. Website
Allsun trackers .................................................... 7 .................................................. www.allsuntrackers.com
Benjamin Media resource center ......................... 19 .............................................. www.benjaminmedia.com
icuee 2013 ......................................................... 27 .............................................................. www.icuee.org
Outback Power systems ....................................... Back cover ................................... www.outbackpower.com
quanta services ................................................... 29 ...............................................www.quantaservices.com
quickscrews ......................................................... 5 .................................................... www.quickscrews.com
solar Builder ........................................................ 55 ............................................ www.solarbuildermag.com
solar Power international ..................................... 23 ..................................www.solarpowerinternational.com
solarbridge .......................................................... 2 ................................................www.solarbridgetech.com
ad
in
de
X
tune in neXt issue for:
solar poWer international product shoWcase
solar farms at indianapolis airport
latest on batteries and energy storage
1
2
3

6 July/august 2013
editor’s message
staying alertSOMETiMES i FEEL LikE a BrOkEN rEcOrd talking about how
awesome solar is right now. There is a lot out there to back up those claims — new numbers just announced Q1 ’13 as the most successful first quarter ever for solar. Nearly 730 MW were introduced in 2013’s first three months, and the residential market has grown 53 percent in the last year. We’re excited to hear those numbers because it proves solar is a thriving industry, and a lot of people can understand that. But maybe too many people see solar as a great place to be right now.
How do you determine if a solar company is trustworthy and bankable? There is never just a handful of mounting or inverter companies to choose from — there are 15 handfuls. We hope the story on page 20 describing bankability and how it works will help you choose the right company to work with.
That also brings us to our first print edition of the Solar Builder directory, start-ing on page 24. We believe this print edition is a handy guide to keep nearby when you’re looking for a bankable company in this large industry. as we continue to grow (GTM research and SEia have increased their estimates for 2013’s total new installations to 4.4 GW), finding the most trustworthy companies will become even more important.
We at Solar Builder are growing our reach, too. On august 1, we will be launch-ing the magazine as an app, available for download in the iTunes store. We hope you’ll check out all the cool new features with us then.
Have a fantastic summer,
Kelly Pickerel, associate Editor
solar builder (issn 2166-5362) is published bimonthly by benjamin Media inc., 10050 brecksville rd., brecksville, oh 44141 usa. copyright 2013. all rights reserved. no part of this publication may be reproduced without written permission from the publisher. one year subscription rates: complimentary in the united states and canada. single copy rate: $10. subscriptions and classified advertising should be addressed to the brecksville office. postmaster: send address changes to solar builder, 10050 brecksville road, brecksville, oh 44141 usacanadian subscriptions: canada post agreement number 7178957. send address change information and blocks of undeliverable copies to canada express; 7686 kimble st., units 21 & 22, Mississauga, on l5s 1e9 canada.
get in touch: Visit solar builder online: WWW.solarbuildermag.com
follow us on twitter: @solar_builder
TM
publisher robert d. krzys [email protected]
editorial Managing editor keith gribbins [email protected]
associate editor kelly pickerel [email protected]
sales+marketing Marketing director kelly dadich [email protected]
regional sales Manager ryan sneltzer [email protected]
regional sales Manager dan sisko [email protected]
regional sales representative renee cardello [email protected]
conferences Manager melanie roddy [email protected]
conferences sales coordinator brittany maurer [email protected]
production+fullfillment production Manager chris slogar [email protected]
graphic artist sarah haughawout [email protected]
web/interactive Manager mark gorman [email protected]
audience development Manager alexis r. White [email protected]
circulation & fullfillment coordinator lillian lopeman [email protected]
reprints Wright’s media (877) 652-5295 • Fax: (281) 419-5712
chief executive officer bernard p. krzys [email protected]
president robert d. krzys [email protected]
controller marianne saykes [email protected]
10050 Brecksville Rd. Brecksville, OH 44141 USA (330) 467-7588 • Fax: (330) 468-2289 [email protected]
CheCk pg.11
for exciting news about upcoming
solar builder conferences!


news
U.S. InStallS 723 MW
of Solar PV In Q1 2013
one of 24 new utility sites the alPIne Solar Project In lancaSter, calIf., becaMe the fIrSt oPeratIonal, large-Scale Solar Project In loS angeleS coUnty In febrUary at 66 MW.
8 JULY/AUgUst 2013

soLArbUiLdermAg.com | 9
GTM ReseaRch and the Solar Energy Industries Association (SEIA) released “U.S. Solar Market Insight: 1st Quarter 2013,” the definitive analysis of solar power markets in the United States, with strategic state-specific data for 28 states and the District of Columbia.
This quarter’s report finds that the United States installed 723 MW in Q1 2013, which account-ed for more than 48 percent of all new electric capacity installed in the United States. Overall, these installations represent the best first quarter of any given year for the industry. In addition, the resi-dential and utility market seg-ments registered first-quarter highs with 164 MW and 318 MW, respectively.
As explored in greater detail in the report, the residential market remains a highlight for U.S. solar with 53 percent year-over-year growth. Unlike the non-residen-tial and utility markets, residen-tial solar has not exhibited sea-sonality and market volatility on a national basis; quarterly growth in the U.S. residential market has ranged from 4 to 21 percent in 12 of the past 13 quarters.
Furthermore, third-party owned (TPO) residential systems continue to be a major storyline in the market. In key states of California and Arizona for exam-ple, TPO systems accounted for 67 and 86 percent, respectively, of all residential PV installed in Q1 2013.
In fact, the California residen-tial market had a record quarter, installing more new PV capacity than ever before and, for the first time, was greater than the non-residential market. This is largely driven by increased “retail rate” parity in major utility territories, where a residential PV system
can provide a discount at retail electricity rates with few or no incentives other than the 30 percent federal investment tax credit.
“We are on the cusp of a new solar revolution in the U.S., driv-en by the rapid expansion of dis-tributed generation,” said Shayle Kann, vice president of research at GTM. “Installations will speed up over the next four years as projects become economically preferable to retail power in more locations. However, chang-es to net metering and electricity rate structures could serve as the market’s primary barrier to adoption.”
Looking at the market on the whole, “U.S. Solar Market Insight: 1st Quarter 2013” fore-casts 4.4 GW of PV to be installed by the end of 2013, growing to nearly 9.2 GW annu-ally in 2016. GTM Research and SEIA have increased each year’s forecast marginally from past edi-tions of the report, due largely to increasingly bullish expectations for the residential market and the near-term opportunity it offers.
Despite the fact that little con-centrating solar power (CSP) capacity came online during Q1 2013, CSP is also expected to make major gains by the end of the year, adding more than 900 MW of capacity. Combined, the United States is expected to add 5.3 GW of solar electric capacity in 2013, enough to power more than 960,000 average American homes.
“The U.S. now has more than 8,500 MW of cumulative installed solar electric capacity, enough to power more than 1.3 million American households,” said Rhone Resch, president and CEO of SEIA. “This sustained growth is enabling the solar
industry to create thousands of good American jobs and to pro-vide clean, affordable energy for more families, businesses, utilities and the military than ever before. This growth simply would not have occurred without consistent, long-term policies that have helped to ensure a stable business environment for our nation’s 5,600 solar companies — many of them small businesses.”
keY report findings
PV installations totaled 723 MW in Q1 2013, up 33 percent over Q1 2012.
Cumulative operating PV capacity in the United States now stands at 7.9 GW.
The residential market grew 53 percent over Q1 2012 and 11 percent over Q4 2012, continuing its streak of consistent incre-mental quarterly growth.
The non-residential mar-ket shrank 20 percent on both a quarterly and annu-al basis, which reflects slow demand across a number of major markets.
The utility market more than doubled year-over-year, with 24 utility PV projects completed in Q1 2013.
The average residential PV system price fell below $5.00 per watt, while the average non-residential system price fell below $4.00 per watt.
soLArbUiLdermAg.com | 9
10 JULY/AUgUst 2013
news top 10
UtiLitY soLAr rAnkings report
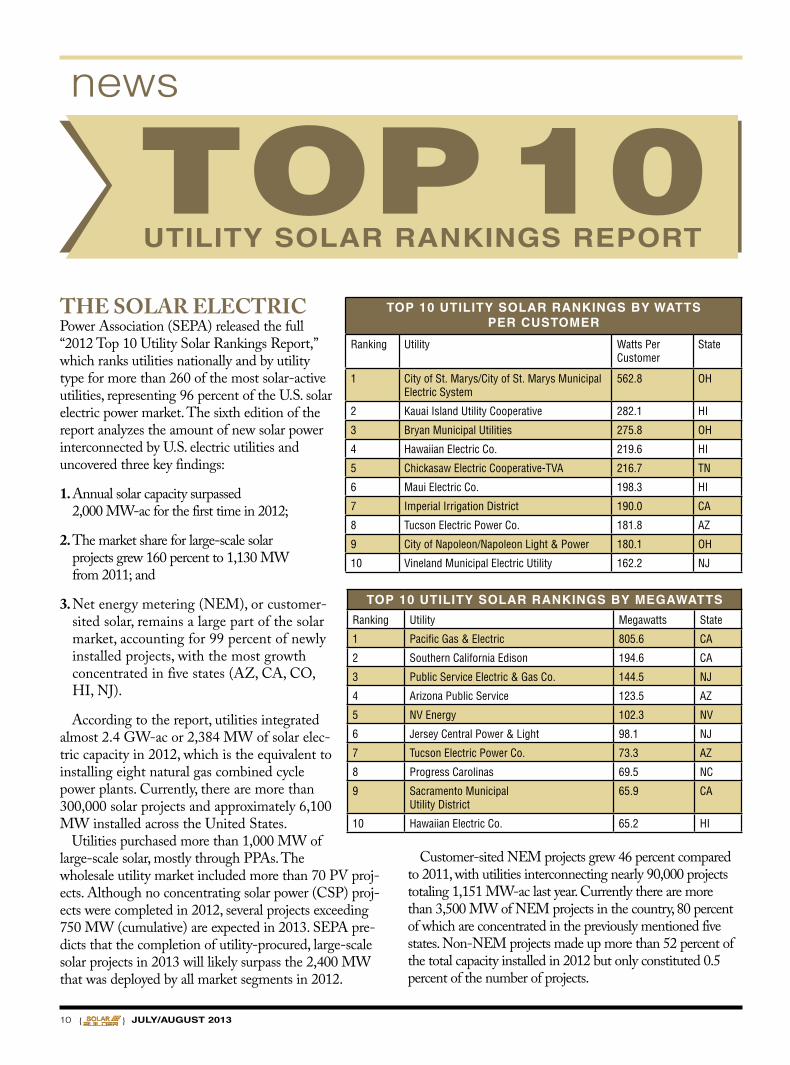
The solaR elecTRic Power Association (SEPA) released the full “2012 Top 10 Utility Solar Rankings Report,” which ranks utilities nationally and by utility type for more than 260 of the most solar-active utilities, representing 96 percent of the U.S. solar electric power market. The sixth edition of the report analyzes the amount of new solar power interconnected by U.S. electric utilities and uncovered three key findings:
1. Annual solar capacity surpassed 2,000 MW-ac for the first time in 2012;
2. The market share for large-scale solar projects grew 160 percent to 1,130 MW from 2011; and
3. Net energy metering (NEM), or customer-sited solar, remains a large part of the solar market, accounting for 99 percent of newly installed projects, with the most growth concentrated in five states (AZ, CA, CO, HI, NJ).
According to the report, utilities integrated almost 2.4 GW-ac or 2,384 MW of solar elec-tric capacity in 2012, which is the equivalent to installing eight natural gas combined cycle power plants. Currently, there are more than 300,000 solar projects and approximately 6,100 MW installed across the United States.
Utilities purchased more than 1,000 MW of large-scale solar, mostly through PPAs. The wholesale utility market included more than 70 PV proj-ects. Although no concentrating solar power (CSP) proj-ects were completed in 2012, several projects exceeding 750 MW (cumulative) are expected in 2013. SEPA pre-dicts that the completion of utility-procured, large-scale solar projects in 2013 will likely surpass the 2,400 MW that was deployed by all market segments in 2012.
Customer-sited NEM projects grew 46 percent compared to 2011, with utilities interconnecting nearly 90,000 projects totaling 1,151 MW-ac last year. Currently there are more than 3,500 MW of NEM projects in the country, 80 percent of which are concentrated in the previously mentioned five states. Non-NEM projects made up more than 52 percent of the total capacity installed in 2012 but only constituted 0.5 percent of the number of projects.
top 10 UtiLitY soLAr rAnkings bY WAtts per cUstomer
Ranking Utility Watts Per Customer
State
1 City of St. Marys/City of St. Marys Municipal Electric System
562.8 OH
2 Kauai Island Utility Cooperative 282.1 HI
3 Bryan Municipal Utilities 275.8 OH
4 Hawaiian Electric Co. 219.6 HI
5 Chickasaw Electric Cooperative-TVA 216.7 TN
6 Maui Electric Co. 198.3 HI
7 Imperial Irrigation District 190.0 CA
8 Tucson Electric Power Co. 181.8 AZ
9 City of Napoleon/Napoleon Light & Power 180.1 OH
10 Vineland Municipal Electric Utility 162.2 NJ
top 10 UtiLitY soLAr rAnkings bY megAWAtts
Ranking Utility Megawatts State
1 Pacific Gas & Electric 805.6 CA
2 Southern California Edison 194.6 CA
3 Public Service Electric & Gas Co. 144.5 NJ
4 Arizona Public Service 123.5 AZ
5 NV Energy 102.3 NV
6 Jersey Central Power & Light 98.1 NJ
7 Tucson Electric Power Co. 73.3 AZ
8 Progress Carolinas 69.5 NC
9 Sacramento Municipal Utility District
65.9 CA
10 Hawaiian Electric Co. 65.2 HI

soLArbUiLdermAg.com | 11
SOLAR FRONTIER began research on CIS (copper, indium and selenium) technology in 1993 and is now celebrating two decades of suc-cess in the thin-film market of solar. At the heart of Solar Frontier’s CIS tech-nology are three key factors: perfor-mance, durable design and quality manufacturing. Offering among the highest labeled efficiencies in thin-film, the “light soaking” effect — a light exposure phenomenon that is unique to CIS — increases initial power output beyond factory specifications. Moreover, as PV demand grows where the sun shines most, these areas tend to be much hotter than standard testing conditions, and this is another advan-tage for CIS technology due to its lower temperature coefficient.
Performance at low irradiance levels are an advantage for CIS, too.
As a result, real-world data and third-party testing consistently show that Solar Frontier’s CIS modules gen-erate more kilowatt-hours per kilowatt-peak than silicon crystalline panels — the key to financial success of a PV system.
Manufactured in Southern Japan using advanced precision, highly auto-mated production lines, Solar Frontier’s CIS modules have passed the certifica-tion tests required by the highest stan-dards for installations globally. They are also certified for RoHS compliance, are lead-free and include no cadmium. Inherent characteristics of CIS module design also avoid the potential induced degradation and TCO-corrosion that
commonly attack other modules. Finally, CIS requires fewer steps,
fewer raw materials and less energy to produce than crystalline silicon, and this is proving that ultimately, the eco-logical solution is also the economical solution.
Solar Frontier’s cumulative installa-tions worldwide have surpassed 1 GW in total. This includes residential, com-mercial and utility scale installations in Asia, South Asia, Australia, Europe, the Middle East, Africa and the Americas. The company’s Americas references include both coasts, as well as the north/south extremes of Canada and Hawaii. Solar Frontier intends to grow in all of these markets, leveraging its offices in the United States, Germany, Italy and Saudi Arabia.
The inTeRnaTional Construction and Utility Equipment Exposition (ICUEE) comes around every two years, and its 16,000 attendees will have something new to look forward to this year. Solar Builder has worked with the show to create a first-of-its-kind solar seminar series. Solar Builder will sponsor two educational sessions — one on utility-scale con-struction and industry trends, and a second on resi-dential and commercial options.
Attendees at the biggest trade fair in the utility con-struction business include utility professionals, con-struction contractors, cities, utilities, consultants and manufacturers. Also known as the Demo Expo, ICUEE features more than 800 exhibitors and hun-dreds of demo opportunities. We hope you’ll join us October 1-3 in Louisville, Ky., at ICUEE for the brand new Solar Builder educational sessions!
www.icuee.com
Solar frontIer celebrateS 20 yearS of DeVeloPIng thIn-fIlM technology
Solar bUIlDer eDUcatIonal SeSSIonS at IcUee

12 JULY/AUgUst 2013
bos
According to Greentech Media, the module-level power electronics (MLPE) segment in 2009 was 51 MW. Today it stands close to 800 MW — an annual growth rate of around 150 percent. MLPE could be considered the next “killer app” of the U.S. solar market, but what is driving all of the attention? Initially, MLPE were regarded as niche products designed to reduce the impact of shading and to reduce losses on complex rooftops. They achieve this by eliminating what are known as mismatch losses. But
today, MLPE are becoming a mainstream solution. The added energy was just the starting point. What attracts customers now is the design flexibility, module-level monitoring and enhanced electri-cal safety during installation and maintenance.
WhAt Are MLPe? Module-level power electronics
transfer some or all of an inverter’s functions to the module level. Basically, they are circuit boards that fit right next to the module in a PV array. The circuit boards serve
Module-level power electronics — like
power optimizers — have increased their
influence in the industry in
recent years. By Mike rogerson
all Control to the Modules
MainstreaM solution SolarEdge power optimizers are installed by Eco Solar on a roof-top in Hawaii. Module-level power electronics, like power optimizers, are growing in popularity.

soLArbUiLderMAg.coM | 13
as turbo boosters for the modules, enhancing energy output by maintaining the module at its maximum power point. Traditional inverters cannot do this because they only track the maximum power point for an entire string or array of modules. This means that when you connect mod-ules in a string, you typically see 2 to 3 percent energy loss due to module mismatch. As modules age, these mismatch losses double, meaning that over the life of a PV system, the system owner loses around 5 percent of the energy of the PV array through mismatch. Shading can increase this up to 25 percent.
So, what makes MLPE the next “killer app” of solar? MLPE not only reduce the losses of a properly designed system but they can rede-fine proper design. Once there are electronics on the modules, system owners can do much more than module-level maximum power point (MPP) tracking. Since the modules operate independently, shading, module orientation and uneven string lengths are no longer design limitations. This allows designers the flexibility to cover more of the roof with solar and to cover the roof in new and novel ways. Module-level electronics can also enable improved safety features which automatically drop the string voltage to a safe voltage if the inverter is off. This creates a safer environment during installation, troubleshooting and in the event of an emergency.
Some MLPE solutions take this level of control one step further. For example, SolarEdge offers a mod-
ule-level power optimizer with a fixed-voltage string inverter. The power optimizer performs module-level MPP tracking and DC/DC conversion to adjust the voltage and current on the output side of the power optimizer. This enables the inverter to work at a fixed voltage and eliminates MPP tracking and DC/DC conversion from the inverter. By controlling voltage at the module-level, an installer can see a significant increase in string sizing options. With traditional string inverters, string sizing is set by the MPP range of the inverter and by the module voltage. With SolarEdge power optimizers, since the voltage can be “bucked” lower or “boosted” higher, the maximum string length is determined by power and not by voltage. Since the MPP is handled at the module level, the requirement for inverter MPP is also eliminated. This enables an installer to use two to three times longer strings and to have a much wider range of string length options.
hoW MLPe infLUence the indUstrY
Module-level electronics offer module-level monitoring that tracks output throughout the system life. The top companies in the MLPE space have millions of modules being monitored today, representing — arguably — the largest databases of module performance in the
world. These solutions can create notifications (text messages and e-mails) for issues, saving O&M time and headcount throughout the lifetime of the system. Monitoring can also be used to further improve system design. Most designs today are built to maximize the first year of performance. But, the industry has very little understanding about maximizing lifetime performance in real world conditions, and this is one more area where MLPE can help. With MLPE, every installa-tion becomes a miniature laborato-ry collecting performance data throughout the system life. Plus, the dataset grows with every sys-tem. The industry has just scratched the surface of what “big-data” will mean for solar.
With the growth in the MLPE market and the capabilities that are unlocked with this technology, MLPE is quickly approaching mass adoption. Enhanced energy produc-tion, simplified system designs, improved safety and visibility into module-level performance all offer significant changes to the industry. These changes will impact system designers, developers and owners, redefining what is proper and what is possible.
Mike rogerson is marketing manager of North America for SolarEdge Technologies. Find more information at solaredge.com.
all Control to the Modules
working as a teaM When coupled with a power optimizer, inverters can work at fixed voltages and eliminate MPP tracking and DC/DC conversion. Photos courtesy of Eco Solar.
Flat rooFtops are very rarely flat. The roof might be flat, but other things protruding out of the roof ruin the relatively smooth landscape. Vents, pipes and air-condi-tioning units all throw a wrench into plans for an entire rooftop full of solar panels with no interruptions.
That is, until now. Washington-based racking and mounting manufac-turer Sunmodo took the idea of a ground-mount, made it stronger and stuck it above vents and pipes on the roof. Instead of single rows of panels
with spaces skipping over vents, the Sunmodo SunBeam system allows complete, uninterrupted rows of solar all elevated above roof obstructions.
“One of the main objectives of the SunBeam system is to maximize the roof space,” says John Quintero, strate-gic accounts manager for Sunmodo. “In traditional commercial systems, you usually can only use the space that is available that has no pipes or vents or AC units or any obstructions in the way. They have to work on the space that is up there [and] work around things.”
The all-aluminum system does look very similar to a ground-mount, espe-cially when it has panels tilted. The SunBeam system is offered in two configurations — a tilted system and a flat system tilted just enough for water runoff.
“With [the flat system], you really maximize the space,” Quintero says. “Yes, the panels are not going to pro-duce as much power output as the tilt-ed, but you’re getting more [panels] on the roof. In extreme situations, there are not just vents [on the roof]. There
14 JULY/AUgUst 2013
mounting
ElEvatEd Thinking
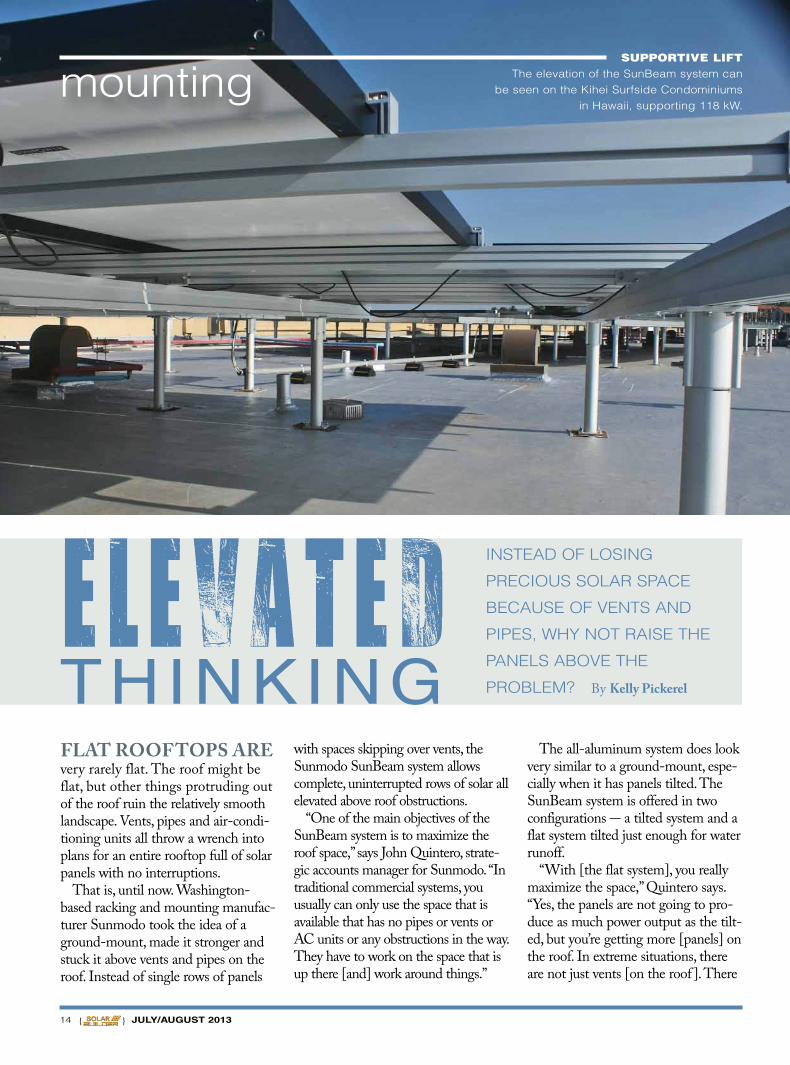
SUPPORTIVE LIFT The elevation of the SunBeam system can
be seen on the Kihei Surfside Condominiums in Hawaii, supporting 118 kW.
InSTead of loSIng
preCIouS Solar SpaCe
BeCauSe of venTS and
pIpeS, WHy noT raISe THe
panelS aBove THe
proBlem? By Kelly pickerel
soLArbUiLdermAg.com | 15
are a lot of pipes up there. A flatter system solves all of those issues. It maximizes space, withstands high winds and corrosive salt.”
The system comes with a pene-trating base and heavy-duty rails and clamps to ensure the system with-stands windloads. The SunBeam sys-tem is very flexible and allows for on-the-fly modifications.
“Not everything is always perfect on the roof,” Quintero says. “They might have to do some slight adjust-ments and the system allows for that in many different ways.”
The beams, which run horizontally and parallel with the rooftop, are adjustable for any height. The rails can also tilt to whichever angle is necessary.
There is no height requirement for the flat system. The posts can be adjusted to 18 in. tall or 4 ft; it’s real-ly up to the customer. There are no walkways between rows with the flat system. It essentially looks like one complete, seamless system. Panels can run in portrait or landscape ori-entation.
The SunBeam system was released to customers in late 2012, and it’s already seen success across Hawaii, the Northwest and the East Coast, mostly on hotels and condominiums. Hawaii installer HNU Energy has used the SunBeam product on a number of projects, including a few condominiums.
Chauncey J. Brown, vice president of HNU Energy, stumbled upon Sunmodo at a trade show in 2010. Finding Sunmodo’s components to be reasonably priced, he decided to try out some racking profiles on jobs back in his home state.
“Sunmodo was the first company I found that was willing to design a product to meet my needs,” Brown says. “I was in search of a racking solution for a commercial client that was strong enough to elevate above obstructions so we could get [the] most amount of power on a compact roof area. Most of these commercial buildings were located directly on water [so] products needed to be able to withstand sun, saltwater, seis-mic activity and high winds in addi-
tion to meeting strict structural engi-neering guidelines. Sunmodo designed SunBeam to meet these needs.”
Brown says the SunBeam system provides “an outstanding platform” for installing all types of solar power arrays.
“In conjunction with a high effi-ciency solar module, [the SunBeam system] provides the maximum amount of power possible,” he says. “It allows you more power and a stronger foundation than any other product I’ve found. SunBeam mounting feet are customizable and can be used with every roofing sur-face I’ve found.”
The success of the SunBeam sys-tem on rooftops has allowed Sunmodo to develop its ground-mounts to go all-aluminum as well. Aluminum systems cost less to pro-duce, cost less to ship and are more flexible than traditional steel systems.
“The more we produce, the cheap-er it is for us, and we pass that on to our customers,” Quintero says.
Brown says Sunmodo has been a great company to work with.
“Sunmodo has been phenome-nal,” Brown says. “If they don’t have a product that meets your needs, there is a good chance they’ll create one.”
By listening to customer feedback, Sunmodo has managed to produce a system that stands apart. The SunBeam system — and its elevated components — really does raise Sunmodo to a level higher than the competition.
Kelly pickerel is associate editor of Solar Builder.
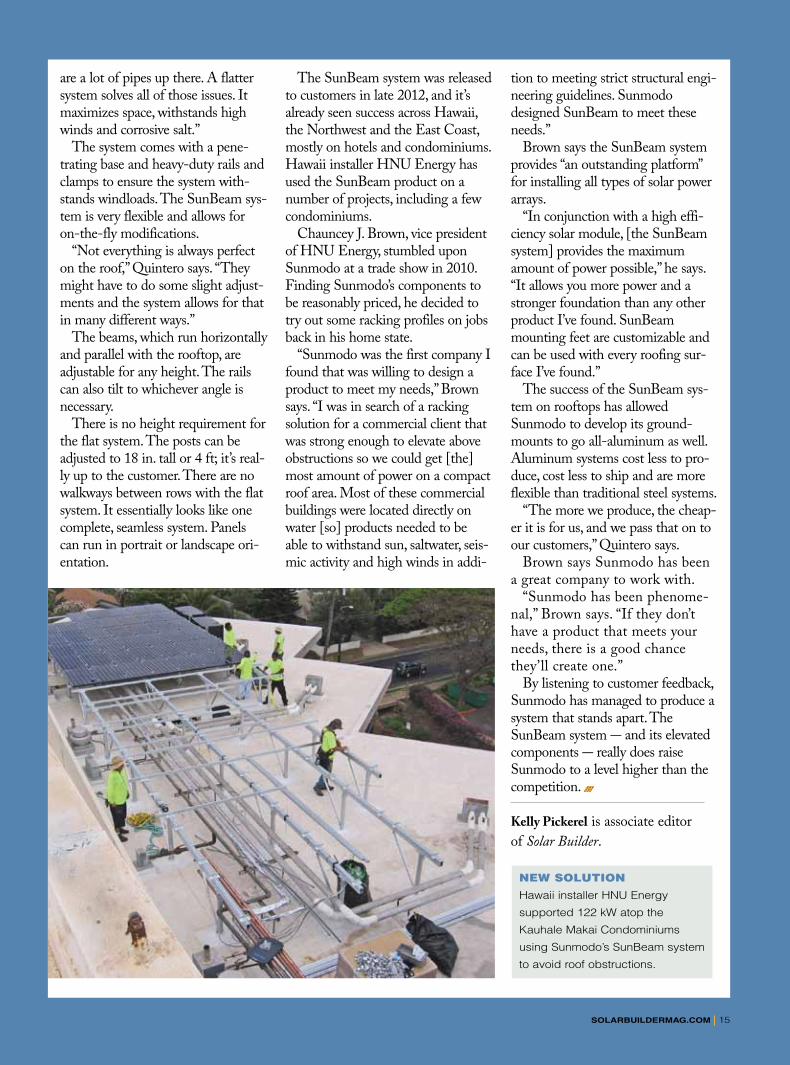
NEW SOLUTION
Hawaii installer Hnu energy
supported 122 kW atop the
Kauhale makai Condominiums
using Sunmodo’s SunBeam system
to avoid roof obstructions.

16 JULY/AUgUst 2013
cover story
above easy installationRenusol offers a “one-size, one-panel” design with its CS60 system, incorporating a ballasted plastic roof-mount, saving 25 percent of the parts needed for rooftop systems. JuSt when you
thought CoStS Couldn’t get loweR, integRated balanCe of SyStem developmentS help Save even moRe on inStallationS. By Charles W. Thurston
Integrated
e s I g n
right DireCt sUPPort
Zep Solar’s Zep groove makes the panel part of
the racking hardware through a grooved frame,
eliminating rails and improving installation speed.
the module thus acts as a structural and mounting
element.
d
soLArbUiLdermAg.com | 17
Driving DoWn cost has been the mantra in the solar industry for several years and once module prices dropped by 75 percent, manufacturer focus has turned squarely on balance-of-sys-tem (BOS) savings through integra-tion. Racking, microinverters, com-biner boxes, grounding wire and optimizers are among areas where new developments are helping hold the line on installers’ profit margins.
While material cost savings are a key benefit to the integration effort, installation time is where the great-est savings occur. Several manufac-turers assure that installation time can be cut 50 percent through facto-ry integration, as opposed to field assembly of systems sourced from multiple vendors.
rAcking-to-modULe integrAtion evoLves
Perhaps the primary area of design savings in BOS integration is the combining of the racking system and modules at the factory. Westinghouse Solar came out with the first such integrated system in 2007, based on a grooved channel on the frame that permits rapid attachment to racking. The compa-ny has since refined that design into its current Instant Connect model, unveiled in October 2012, which now uses 80 percent fewer parts than a non-integrated system, says Roger Pang, the director of business development for Westinghouse Solar, based in Campbell, Calif.
“Our plug-and-play design involves only nine SKUs (stock-keeping units) versus 20 to 30 SKUs for a site-installed system from dif-ferent component suppliers,” Pang says. “We trained Habitat for Humanity workers in one night, and they installed systems the next day.” One former official at Westinghouse Solar says that the integration of the Westinghouse system reduces the cost of a system by 25 cents per kilowatt of capacity.
Zep Solar, another pioneer in BOS integration, invented the Zep Groove design in 2009 to facilitate the panel-to-support system. According to Executive Vice President Daniel Flanigan, the San Rafael, Calif.-company now has forged strategic partnerships under its Zep Compatible program with 12 panel makers and with three other solar electronics manufactur-ers, further establishing its technolo-gy as an industry standard. Zep recently signed a two-year agree-ment to supply installation systems to Solar City, one of the largest resi-dential installers in the United States.
Another integrator, SunLink, also based in San Rafael, joins racking to panels at its facilities, shipping pal-leted “pre-panelization” units to the jobsite, says Yuri Resnikov, the com-pany's vice president of product and strategy. Using SunLink’s legacy RMS system, “a four-person crew working a 7.5-hour day can install up to 180 modules per day,” the company calculates.
And Lumos Solar, based in Boulder, Co., offers integrated rack-ing with frameless panels in its LSX
series of products. Its system “can withstand wind loads of 130 mph and 30 pounds per square foot of snow,” the company indicates.
integrAted bALLAst sYstems sAve time
One racking-to-module inte-gration application that is now well tested in the market is bal-last-mounted panels on flat roofs, and recently on sloped surfaces as well. “In the last couple of years we have expanded from flat roof-mount to ballasted ground appli-cations,” says Resnikov of SunLink. To date, the company has supplied integrated systems to more than 1,200 installations totaling 250 MW in yield.
Another supplier of integrated rooftop ballast systems, Renusol America based in Atlanta, offers a “one-size, one-panel design” with its CS60 system, which includes a molded plastic skirt base that resembles a custom-formed packing protector that might be used in box packing for shipping. The integra-tion between panel and ballast saves close to 25 percent of the parts needed for a non-integrated system,
Integrated

18 JULY/AUgUst 2013
and is faster to install, the company indicates.
A similar design is that of Solon’s SOLquick system, that features a mounting skirt for fra-meless modules made from Andersen Windows’ Fibrex, a pat-ented wood fiber and thermoplas-tic polymer composite. Albuquerque, N.M.-based Solon estimates that installers can put up 15 units or 4.2 kW per man-hour using SOLquick.
combiner boxes & eLectronics integrAtion
Another area of system integra-tion is in combiner boxes and wir-ing simplification. SunLink offers “Home Run” combiner boxes that will adapt to “more than 2,500 pos-sible combiner box assemblies to support multiple installation con-figurations,” the company indicates.
Several integrators note that their systems do not require separate bare copper grounding wires.
Zep Solar has strategically part-nered with microinverter maker Enphase, optimizer maker Tigo and monitoring system maker SolarEdge Technologies to help integrate electronics within and outside panels.
FUtUre deveLopmentsOne area of ripe potential for
factory integration is an interface with the utility. “In the future per-haps we will see a system that would enable a do-it-yourselfer to plug into the load center,” predicts Pang.
Another advancement in panel-racking integration will come from the use of powerful adhesives in place of clips, rivets and screws.
“We are working with a billion-dollar adhesives maker to adhere metal struts to the backs of panels and expect to announce the design soon,” Resnikov says of SunLink.
Among other expected develop-ments in BOS integration is the establishment of industry bench-marks for installation time, says MJ Shiao, a senior analyst in solar markets at GTM Research. “There needs to be a baseline for compari-sons; that will be our next area of research,” he says.
Limits to growth“If you look at SunPower and
Solon, they are primarily module makers, so it was easier for them to
develop an integrated mounting system that was customized to their module than it would be for a rack-ing company to develop universally adaptable integration,” observes Shiao.
Warranties also need to include the engineering, procurement and construction companies (EPCs) so that entire systems are covered by one policy rather than through a mix of individual com-ponent manufacturer warranties, Shiao says.
Charles W. Thurston is a freelance writer who covers solar energy from Northern California. Reach him at [email protected].
cover storyintegrateD raCking
by combining racking and panels before shipping, Sunlink is able to provide installers
with “pre-panelized” packages. this encourages faster installation times among fewer
crew members.


20 JULY/AUgUst 2013
feature
BankaBility has always been important when evalu-ating vendors for the overall finan-cial viability of a solar energy proj-ect, but the importance has increased considerably over the past several quarters among inverter companies, as module companies continue to operate under tremen-dous financial pressure and as some
inverter companies have either left the North American market or entered liquidation.
Despite its importance, there does not seem to be a process or open-sourced method for monitoring bankability. Bankability involves “scoring” six critical quantitative and qualitative factors of a compa-ny: debt-to-equity ratio, balance
sheet strength, profitability, history, transparency and diversification. The goal is that solar project stake-holders can understand how differ-ent inverter companies compare rel-ative to one another in terms of bankability, at a level just a little more complex than reviewing a company’s available cash.
The factors are based on using a
Real-woRld examples help explain the tool used
to evaluate companies in the solaR industRy. By Matt Denninger
B A n k A B i L i t Y : what it is and how it woRks

soLArBUiLdermAg.com | 21
combination of financial and non-financial data that are publicly available. A low score for one factor in and of itself should not be seen as a significant issue, since the combined score of these factors are what provide a bankability score for a given company.
All this being said, it should be made clear that a low bankability score for a company does not imply that a project with its equipment is not viable. If the financing compa-ny also recognizes there is higher risk associated with the equipment company’s low bankability, then it is safe to imply that the cost of debt will be higher. Equity inves-tors would likely require a higher return or other more strenuous conditions as an offset against the higher risk. By no means is a low score an indication of the compa-ny’s viability, but rather, a transpar-ent method of making an apples-to-apples comparison. The Altman-Z score is seen by many to be a standard method to judge the risk of bankruptcy, and it is not dis-cussed in this article.
The first three factors (debt-to-equity ratio, balance sheet strength and profitability) are based on financial data and carry a numerical score. The second three factors (history, transparency and diversifi-cation) are based on non-financial data, don’t change dramatically over time and are used for comparative purposes against other companies.
deBt-to-eqUitY rAtioHomeowners do not typically
discuss the ratio of their remaining mortgage principle to the equity that they have built in their home, but it’s an important tool for credit analysts when assessing companies. A company that has a high ratio typically has less flexibility to respond to market changes in the short term and not enough equity
in the long term to fund long-term objectives. This score follows the standard risk classes used by credit analysts with the highest score for an A, the lowest score for a D and no score for negative equity.
BALAnce sheet strengthMost solar professionals have
heard someone say, “Our balance sheet is very strong, just look at how much cash we have.” The problem is not everyone discusses the liabilities they have due over the next 12 months. There are a number of ways to measure balance sheet strength, but one of the more common is the short ratio, which compares cash to current liabilities. A company with a ratio of 1.5 means they have $1.50 in cash for every $1.00 in current liabilities and would achieve the best possible evaluation. A company with a ratio less than 0.25 would be on the low-est end.
ProfitABiLitYTaken alone, either of the two fac-
tors mentioned above may not be a problem over the short term. Companies take on debt to fund research and development activities, expand capacity or acquire another company. However, combining either of the two above with a low profitability score would be a cause for concern. This scoring method is best used when updated on a quar-terly basis in line with public com-panies’ earnings releases which lends itself to the way profitability is scored. A company that was profit-able in each of the most recent four quarters receives the highest score, and a company that was not profit-able in each of the four most recent quarters receives a zero.
historYCompanies that have been in
business longer achieve a higher
score because they have the institu-tional experience required to man-age a supply chain and service organization to support the product for the life of the project. It is not enough for a company to have individuals with such experience. The organization needs to have tested and proven processes in place, which is more likely with companies that have been in busi-ness longer.
trAnsPArencYCompanies that provide greater
financial disclosure by being listed on the U.S. or European stock exchanges receive the highest score for transparency. Other companies receive the lowest score for trans-parency as well as the three factors described above. It isn’t that non-listed companies have financial troubles. Rather, the higher score is reserved for companies that provide audited results in the public domain in accordance with third party rules and regulations.
diversificAtionDiversification has a non-linear
scoring method. Companies that are pure-play solar companies receive the lowest score because their fortunes change with the fluctuations in the market. We have seen how dramatic decreases in demand in certain parts of Europe have impacted certain companies. Companies that are well-balanced between solar and non-solar businesses receive the highest scores because the busi-ness cycles are expected to be off-setting. Conglomerates with very diverse business portfolios receive the second highest score. The rea-son being that the solar business would not garner enough atten-tion or maintain flexibility because it would be only a small slice of the larger operations.

22 JULY/AUgUst 2013
Q1 ’10 Q2 ’10 Q3 ’10 Q4 ’10 Q1 ’11 Q2 ’11 Q3 ’11 Q4 ’11 Q1 ’12 Q2 ’12
debt-to-equity7.94 33.49 18.00 2.25 2.65 5.76 6.53 -7.23 -5.12 -4.12
1 1 1 1 1 1 1 0 0 0Balance sheet
strength0.37 0.33 0.15 0.37 0.30 0.18 0.15 0.18 0.15 0.03
2 2 1 2 2 1 1 1 1 1
profitability0 qtrs 0 qtrs 1 qtr 2 qtrs 2 qtrs 2 qtrs 1 qtr 0 qtrs 0 qtrs 0 qtrs
0 0 2 3 3 3 2 0 0 0
reAL-WorLd exAmPLe: sAtcon
The bankruptcy of Satcon Technology Group, previously an inverter manufacturer before fold-ing in February 2013, provides an interesting opportunity for a time series analysis using this scoring method. The table below includes the three financial factors and each factor has two rows: the top row is the actual result and the bottom row is the unweighted score on a scale of 1 to 5 with 5 being the most bankable. For example, the debt-to-equity ratio was 7.94 in Q1 2010 and generated an unweighted score of 1. Scoring zero is a rare occurrence, happening with a nega-tive debt-to-equity ratio and four, consecutive unprofitable quarters.
What happened in Q4 2011 can be considered a perfect storm. Satcon’s debt-to-equity ratio became negative after seven con-
secutive quarters of relatively high ratios. Balance sheet strength, as measured by the short ratio, had generated a third consecutive quar-ter below 0.25. A ratio of 0.18 implies Satcon had $0.18 in cash for every $1.00 of liabilities owed over the next 12 months. And finally, Satcon returned to having four consecutive quarters of unprof-itability (as denoted by the “0 qtrs”). The lack of profits over a sustained period made it very diffi-cult to fund either their assets to improve their debt-to-equity ratio or their cash to improve their short-term debt coverage as shown in the diagram above. This was a very precarious situation for Satcon. While it didn’t predict the compa-ny’s bankruptcy, this tool could have created a critical discussion point for solar project developers assessing a low-cost inverter manu-facturer’s bankability.
This method of scoring bank-ability is intended to be an open source, straightforward tool to objectively assess bankability. It considers many of the value prop-ositions companies use when pre-senting their strengths in an objec-tive, measurable manner. The weighting across the factors and scoring methodology can be adjusted to suit your business’ appetite for risk. With a more open and simple method for mea-suring bankability, the hope is to generate a more open conversation about what is important to suit various business models and help the solar industry grow in a sus-tainable manner.
Matt Denninger is senior manager of global market research and busi-ness development for AE Solar Energy. Find more info at advanced-energy.com.
sAtcon technoLogY groUP’s finAnciAL fActors thAt Led to BAnkrUPtcY
s At c o n t e c h n o L o g Y g r o U P B A n k r U P t c Y k e Y P o i n t s
feature
debt-to-equity became negative in december 2011 1
the short ratio remained at the lowest levels for several quarters 2
had four consecutive quarters of no profits by december 2011 3
Assets = deBt + -eqUitY
cAsh < $0.25short term deBt = $1.00
more difficULt to increAse Assets And imProve negAtive eqUitY sitUAtion
more difficULt to fUnd cAsh to imProve coverAge of short term deBt


54 JULY/AUgUst 2013
last word recent news from solarbuildermag.com
recurrent energy completed six solar power projects in ontario, totalling 70 mw in early June. three additional projects will be finished by next year. the projects have created approximately 650 jobs.
Voluntary contributions from bonnaroo music and arts festival’s roughly 80,000 annual attendees, collected through ticket sales since 2012, footed the bill for a 50-kw solar power array installed at the manchester, tenn.-site. it is the first permanent solar system installed at a major american music festival. the clean energy produced by the system is equivalent to 20 percent of the power consumed at bonnaroo during the annual four-day music and art extravaganza that kicked off June 13 this year.
“running part of bonnaroo on solar power has long been our goal as it underscores our commitment to the environment,” said festival Partner rich goodstone of superfly Presents.
composed of 196 solar panels made by solarworld, the system was installed by sustainable future. the system is mounted on the roof of a metal structure in the backstage area. the system is not visible to patrons, but fans could peruse a solar display in “Planet roo,” an area devoted to sustainability. Photo courtesy of Bonnaroo.
sPg solar opened its technology & training center in sacramento, calif., on June 12. the facility provides training for construction crews, engineers and designers to assemble and install sPg solar’s single-axis tracker.
3
1
1
2
3
2

Company Name
Contact #1
Contact #2
Address #1
Title
Title
Address #2
City
Zip/Pc
Phone
St/Pr
Country
Fax
Email Address Website
Solar DIrECTorY CaTEgorIES Please select five (5) specialties below. (If more than 5 are selected, only the first 5 will be included with your listing.)
Solar aSSoCIaTIoNS
DateSignatureState ZipCity
Address Card Holder Name
CID # (Back of Card)Exp. Date (MM/YY)
o Architectso Batteries & Energy Storage Systemso Cables / Wires & Equipmento Clamping Deviceso Cleaning Technologies / Systemso Combiner Boxeso Components for Mounting/Racking/Tracking
Systemso Consultingo Contractor: Commercial / Industrialo Contractor: Residentialo Contractor: Utility-Scaleo Developer: Commercial / Industrialo Developer: Residentialo Developer: Utility-Scaleo Distributorso Education / Workshopso Enclosures
o Energy Auditorso Environmental Consultingo Fastenerso Financial Serviceso Foundationso Fuseso Governmental Agencieso Incentive Programso Inspectiono Insuranceo Inverters: Grid-Tiedo Inverters: Off-Grido Legal Serviceso Logisticso Marketing Serviceso Mediao Modules: Crystallineo Modules: Thin-Film
o Monitoring / Assessment Equipmento Mounting / Racking Systems: Aluminumo Mounting / Racking Systems: Othero Mounting / Racking Systems: Steelo Ownero Permittingo Power Purchase Agreements (PPA)o Researcho Safety Equipmento Security / Theft Preventiono Smart Gridso Softwareo Staffingo Surge Protectiono Testing & Certificationo Tracking Systemso Welding Equipmento Other
o American Council on Renewable Energy ................................................................. ACOREo American Public Power Association ..............................................................................APPA o American Solar Energy Society .....................................................................................ASESo Canadian Solar Industry Association ........................................................................CANSIAo North American Board of Certified Energy Practitioners ......................................NABCEPo Solar Electric Power Association ...................................................................................SEPAo Solar Energy Industries Association ...............................................................................SEIA
Visa/Master Card Number
If you wish to enhance your listing with a logo or QR code, submit your form along with payment to:Benjamin Media, Inc. 10050 Brecksville Rd., Brecksville, OH 44141 USA
Attn: Kelly Dadich | Ph: 330-467-7588 | Fax: 888-585-0180 | e-mail: [email protected] INformaTIoN
0713
Visitwww.solarbuildermag.com/ buyers-guide-submission to submit your free listing.
Stand out from your competitorS with these listing enhancements!
include my color logo for $200 include my black and white logo for $150 include my Qr code for $350 contact me about other enhancements
soLAr bUiLder directorY
compLete this formto add your free, basic
comPany listing. (Please Print)
- or -
NOTE: All Enhanced listings must be prepaid with credit card or check.
(Please Specify)

JDRM provides sustainable engineering services pertaining to alternative energy sources
Photovoltaic DesignPVSys Software Photovoltaic Modeling
AC & DC Distribution DesignIndependent Engineering PV Field Reviews
Medium Voltage Distribution Design
5604 N. Main StreetSuite 200Sylvania, Ohio 43560
419.824.2400Visit our website
www.jdrm.com