designing the customer journey in a service delivery
TRANSCRIPT

Designing the customer journey in a service delivery network - evidence from cancer patient treatments
Kaat DE POURCQ Center for Service Intelligence - Ghent University
[email protected] Tweekerkenstraat 2, 9000 Gent, Belgium, +32 9 264 34 93
Paul GEMMEL
Center for Service Intelligence – Ghent University [email protected]
Tweekerkenstraat, 2, 9000 Gent, Belgium, +32 9 264 3518
Katrien VERLEYE Center for Service Intelligence - Ghent University
Research Foundation Flanders - FWO [email protected]
Tweekerkenstraat 2, 9000 Gent, Belgium, +32 9 264 34 94
Key words: Service design, service delivery network, service processes
ABSTRACT
Customer experiences - not in the least for customers with chronic diseases - depend on a series of exchanges over a considerable amount of time with a variety of service providers and thus a service delivery network (SDN). The impact of SDNs on the customer experience, however, is unclear. This research provides insight into (1) the service delivery system characteristics in SDNs, and (2) their impact on the relationship between customer journey duration and value for time as an important customer experience indicator. The service delivery system characteristics were explored by process travel sheets of patients undergoing cancer treatment in a hospital (n=412). These data were linked to time measurement data (n=262) and survey data (n=312) to explain customer journey duration and value for time, thereby showing the importance of the number of service events and the type of service providers. Theoretical and managerial implications are discussed.

INTRODUCTION
Service researchers have long recognized that customer experiences do not result from single encounters with a firm, but from multiple encounters with different touchpoints of the firm (Bitner et al. 2008, Patricio et al. 2011, Teixeira et al. 2012). It goes without saying that the same holds for experiences of customers with chronic diseases. An exploratory study of McColl-Kennedy et al. (2012), for instance, demonstrates that the experience of cancer patients depends not only on the encounter with the oncologist, but also on encounters with the nurses and fellow customers in the oncology department. Moreover, it is not inconceivable that cancer patient visit a general practitioner before going to the hospital (McColl-Kennedy et al. 2012). As illustrated by the example of cancer patients, customer experiences result from a series of exchanges with a variety of service providers (Tax et al. 2013). In other words, the customer experience has a sequential nature, which involves multiple encounters with various service providers. Recently, Tax et al. (2013) introduced the concept of “service delivery networks”, which captures “two or more entities that, in the eyes of the customers, are responsible for the provision of a connected, overall service” (p. 457). In line with the concept of service delivery networks, several researchers acknowledge that value co-creation increasingly takes place in systems composed of multiple actors or multi-actor systems, which extend beyond the boundaries of a single organization (Pinho et al. 2014, van Riel et al. 2013, Vargo and Lusch 2015). Similarly, customer value co-creation - not in the least for healthcare customers with complex needs - occurs through the integration of resources through activities and interactions with different collaborators in the customers’ service network (McColl-Kennedy et al. 2012). Despite the acknowledgement that customer value co-creation occurs in multi-actor systems, the service research community points out that there still remains a need to investigate (1) how to manage the customer experience in service delivery networks and (2) how to use service design to develop better customer experiences (Ostrom et al. 2015). To respond to these research gaps, the present research focuses on the design characteristics of service delivery networks from the customer perspective. Specifically, this research empirically investigates the impact of the design characteristics of the service delivery network on the customer experience. Since the customer experience can be seen as an important performance indicator, this research responds to calls for research on the performance effects of service design decisions (Zomerdijk and de Vries 2007). Furthermore, this research contributes to the literature on service delivery system design - which calls for further exploratory research - by focusing on service delivery networks crossing the boundaries of organizations (Ponsignon et al. 2011). Finally, this research investigates the impact of service delivery network characteristics beyond the boundaries of the organization on the experience of patients undergoing cancer treatments. By doing so, this research also contributes to the effective design of services that can improve well-being of people suffering from chronic diseases, which is another key research priority (Ostrom et al. 2015). This paper is organized as follows. First, we review the literature on service delivery system design, thereby discussing the implications of service delivery networks crossing the boundaries of organizations for the customer experience. The paper continues by outlining the methodological approach and the study setting for the

research. The subsequent sections report the study findings, followed by conclusions and implications for research and practice.
THEORETICAL FRAMEWORK Designing service delivery systems for better customer experiences Starting point for this research is that service providers cannot design the customer experience, but the service delivery system can be designed for generating better customer experiences (Patricio et al. 2011). Traditionally, service delivery system design relates to “how” the service of a single service providing organization is delivered to target customers (Tax and Stuart 1997). As a consequence, the design of the service delivery system is related to the service concept of the service providing organization (i.e., the service package offered) and the target market of the service provider (i.e., the customer), which constitute the service strategy triad (Roth and Menor 2003). Ponsignon et al. (2011) provide empirical support for the service strategy triad by showing that the service concept of a service providing organization is developed to address the requirements of a specific customer segment, which in turn influences the design of the service delivery system. To date, several researchers recognize that service delivery system design has become more complex, in that customers co-create unique customer experiences through activities and interactions with different touchpoints of a service provider - along with other elements that are not under the control of the service provider (Verhoef et al. 2009). Moreover, customer experiences do not only result from multiple encounters with different touchpoints of the firm (Bitner et al. 2008, Patricio et al. 2011, Teixeira et al. 2012), but from a variety of encounters with multiple service providers (Tax et al. 2013). As a consequence, service delivery crosses the boundaries of service providing organizations and occurs in networks of different service providers (Ponsignon et al. 2011). In the context of these service delivery networks, service providers are engaged in delivering a customer journey, which involves “a series of exchanges that may extend over a considerable period of time and with a variety of providers contributing to the experience” (Tax et al. 2013, p. 454). The next section therefore elaborates on service delivery system design characteristics in the context of delivering a customer journey in a service delivery network and their implications for the customer experience. Against this background, the customer experience involves the degree to which service providers make efficient use of customer’s time throughout the customer journey (Lemke et al. 2011). Value for time and service delivery system characteristics The degree to which service providers make efficient use of customer’s time throughout the customer journey has been labeled as “value for time” (Lemke et al. 2011). Several researchers - such as Lemke et al. 2011 - hold that value for time is an important aspect of the customer experience. A key question revolves thus around the drivers of value for time. Extant research shows that customer generally do not like to wait for service delivery (Bitner et al. 1990; Taylor 1995). Specifically, empirical evidence suggests that the length of the waiting time negatively effects the customer experience (Taylor 1994; Katz et al. 1991; Lim et al. 2015). Moreover, (McGuire et al. 2010) found that actual duration time also has a significant

relationship with wait evaluation, even after controlling for psychological factors. Based on the aforementioned evidence, the amount of time that customers spend on getting the service from a delivery network - and thus the customer journey duration - is often seen as an important design characteristic, that is an important determinant of value for time for customers. In the meanwhile, however, there is evidence that customers do not perfectly integrate the totality of the duration or waiting time into their experience (Ariely et al. 2000), thereby suggesting that other service delivery system characteristics might affect the relationship between customer journey duration and value for time. The next section further elaborates on key design decisions in service delivery systems with a moderating impact on the customer journey duration - value for time relationship in the context of delivering a customer journey in a service delivery network. Key design decisions in the context of a service delivery network A key design decision in service delivery systems is the amount of customer contact in a service delivery process, which refers to “a direct encounter between a customer and a service provider that takes place in the same time but not necessarily in the same place, and has the opportunity for interaction” (Zomerdijk and de Vries 2007, p. 114). This definition implies that physical presence of the customer is not a requirement for the occurrence of customer contact and the same goes for interaction. In terms of customer contact, Payne et al. (2008) hold that customers perform a series of activities as part of a multiplay of activities to create value. Tax et al. (2013) specify that a customer journey involves “a series of exchanges over a considerable amount of time and with a variety of service providers contributing to the experience” (p. 454). Building on these conceptualizations, the key activities and exchanges between customers and service providers – which we label as service events - are at the core of our attention. By looking at the customer journey as a process consisting of a series of service events, the number or frequency of service events involves an important characteristic of the service delivery system. Maxham and Netemeyer (2003) hold that the frequency of service events may vary throughout a process. In other words, a service delivery process may involve different amount of service events, depending on the service concept and/or the customer segment (Ponsignon et al. 2011). Recent research demonstrates that more service events in a service delivery process may reduce the perceived duration of the service delivery process (Lim et al. 2015b). This evidence suggests that the number or frequency of service events may affect the relationship between the customer journey duration and value for time. Therefore, we hypothesize:
H1: service event frequency moderates the relationship between customer journey duration and value for time in a service delivery network.
Next, service delivery processes also involve different stages. Dube-Riou (1989), for instance, proposes that service delivery processes are composed of three stages: a pre-process, an in-process, and a post-process. The pre-process refers to the stage where preliminary service events occur. The in-process involves the stage where the main service event is accomplished. The post-process is composed of those service events necessary to the termination of the service delivery process (Hui et al. 1998). Dasu and Chase (2013) identify the following principle in relation to the sequencing

of service events: finish strong, get bad parts over with early on, segment the pleasure, and combine the pain. As illustrated by these authors, another important service delivery system design characteristic involves the sequencing or timing of the service events. Specifically, the sequencing or timing of the service events refers to when the event occurs in the service processes (Ross and Simonson 1991). Since the control of the timing of different service events is an important goal of service management (Bitran et al. 2008), the timing of service events might also have an impact on the customer journey duration – value for time relationship. Therefore, we hypothesize:
H2: service event timing moderates the relationship between customer journey duration and value for time in a service delivery network.
Next to variety in terms of the number of service events and the timing of service events, service delivery networks also involve a variety of service providers contributing to the customer experience (Tax et al. 2013). In service delivery networks, service events occur in interactions with multiple parts of an organization and often with external partners (Patricio et al. 2011). In other words, customer contact occurs during service events between a customer and a variety of internal and even external service providers, thereby posing new decision requirements for the service provider (Meester et al. 2010). Specifically, service providers can decide not to allow customers to involve external service providers. Tax et al. (2013), for instance, argues “one decision a service provider must make is whether or not to restrict its customer’s selection of complementary providers” (p. 457). If service providers allow customers to involve complementary and thus external service providers, this may affect the impact of the customer journey duration on the value for time. Therefore, we hypothesize:
H3: the involvement of external service providers moderates the relationship between customer journey duration and value for time in a service delivery network.
Furthermore, service providers may rely on not only professional service providers but also customers helping one another. Helping other customers is a form of customer engagement behaviors (Verleye et al. 2014). This form of customer engagement behaviors can be expressed by encouraging one another to show appropriate behaviors (Bove et al. 2009), expressing empathy (Rosenbaum and Massiah 2007), and helping each other to get better customer experiences (Kumar et al. 2010). In other words, customers who are helping one another contribute to the service delivery process. Tax et al. (2013) hold that fellow customers who contribute to the service delivery also belong to the service delivery network. As a consequence, we assume that the involvement of fellow customers in the customer journey also affects the relationship between customer journey duration and value for time. Therefore, we hypothesize:
H4: the involvement of fellow customers moderates the relationship between customer journey duration and value for time in a service delivery network.

A final service delivery system design decision relates to physical elements or artefacts. Specifically, physical elements or artefacts refer to all tangibles that customers are exposed to or come in contact with that can influence their experience (Bitner et al. 2008, Teixeira et al. 2012). Several researchers, however, constrain physical elements or artefacts to location, facilities, infrastructure, layout, and equipment, thereby arguing that these physical elements or artefacts are important service delivery system design characteristics (Roth and Menor 2003, Ponsignon et al. 2011). Based upon this line of research, we hypothesize that these physical elements or artefacts also have a moderating role on the relationship between duration and value for time.
H5: physical elements moderate the relationship between customer journey duration and value for time in a service delivery network.
METHODOLOGY
The aim of the empirical study is to gain insight into (1) the service delivery system characteristics in the context of delivering a customer journey in a service delivery network, and (2) the impact of these design characteristics on the relationship between customer journey duration and value for time. To achieve this two-fold aim, we involved patients undergoing cancer treatment in one of the largest hospitals in the Flemish region in Belgium. Specifically, the selected hospital consists of two chemotherapy day units (CDUs), which offer several possible treatments for cancer patients. These treatments include anti-bacterial therapies, chemotherapy, blood transfusions and intravenous interventions. The cancer treatment processes in these CDUs represent an interesting case, in that the way in which cancer treatment is delivered - and thus the service delivery system - differs according to the nature of the illness and care (Masselink et al. 2012). Additionally, the service delivery network is likely to vary across cancer patients, in that the hospital allows patients to involve a wide range of external service providers in the treatment process. The recent trend for chemotherapy at home will also lead to a more complex service delivery network with a more important role for external service providers and the patient (Borras et al. 2001). Finally, cancer treatment processes involve a series of events over a considerable amount of time and may include long waiting times (Masselink et al. 2012, van Lent et al. 2009, McColl-Kennedy et al. 2012).
To gain an in-depth understanding of the service delivery system characteristics of the cancer treatment processes in the hospital (research aim 1), we observed the cancer treatment processes of each patient visiting one of the two CDUs during one week in April 2015 by means of process travel sheets. For each patient going through the process at the CDU, a process travel sheet was filled out by the personnel of the department. The form followed the patient throughout the cancer treatment journey. Data of process characteristics were collected by identifying the type of pathology and therapy, the type of room, data examining the different types of service providers that participated in the process, the different moments of service delivery, the equipment and artefacts used on the department

and in the process and the irregularities that occurred in the process. Also time measurement data (n=262) was collected to gain insight into the customer journey duration. In order to collect this this type of data, a time measurement coding sheet was coupled to the process travel sheet. The following time-stamps were collected: arrival of the patient at the CDU and the start of the therapy.
As background to the development of process travel sheets, we conducted a document analysis focusing on formal process descriptions, planning tools, and documentation from former operational studies and (re-)design projects. Additionally, we also conducted semi-structured interviews to develop and later on refine the process travel sheets. Based on the data of the process travel sheets, we investigated the patient journey of 410 patients undergoing a cancer treatment in the hospital, which were analyzed with Excel 2012 and SPSS 23. The data analyses were performed in close collaboration with both CDUs for analysis and a better understanding of why different service delivery systems exist. The interviews performed allowed us to map the different processes based on the data collected and additional information of the employees. Subsequently, we were able to operationalize service event frequency, service event timing, involvement of external service providers, involvement of fellow customers, and physical elements. To gain insight into the impact of these design characteristics on the relationship between customer journey duration and value for time (research aim 2), we combined the evidence provided by the process travel sheets with time measurement and survey data gathered among the patients involved in the development of the process travel sheet (n=410). Survey data were gathered to gain insight into value for time from the cancer patient perspective and were linked to the process travel sheet data. Specifically, each of the cancer patients involved in the development of process travel and time measurement coding sheets was invited to fill out a questionnaire, which resulted in 312 patients participating by filling in the questionnaire. The questionnaire involved a seven-point Likert-type scale to capture value for time, which was pretested in previous research (Gemmel et al., 2015).
Table 1: Value for time
Value for time
I experience the waiting time before the start of the treatment as very unplaisant.
I experience the waiting time before the start of the treatment as long.
I experience the waiting time before the start of the treatment as unacceptable.
The internal consistency of the instrument was sufficiently high (Cronbach’s α=
0.892). Additionally, the questionnaire also included questions related to demographic characteristics about the cancer patients, including gender and age.
RESULTS
The results of this study are presented in two different sections. First, we explore the service delivery system characteristics in the context of delivering a customer journey in a service delivery network by analyzing the process travel sheets (exploratory

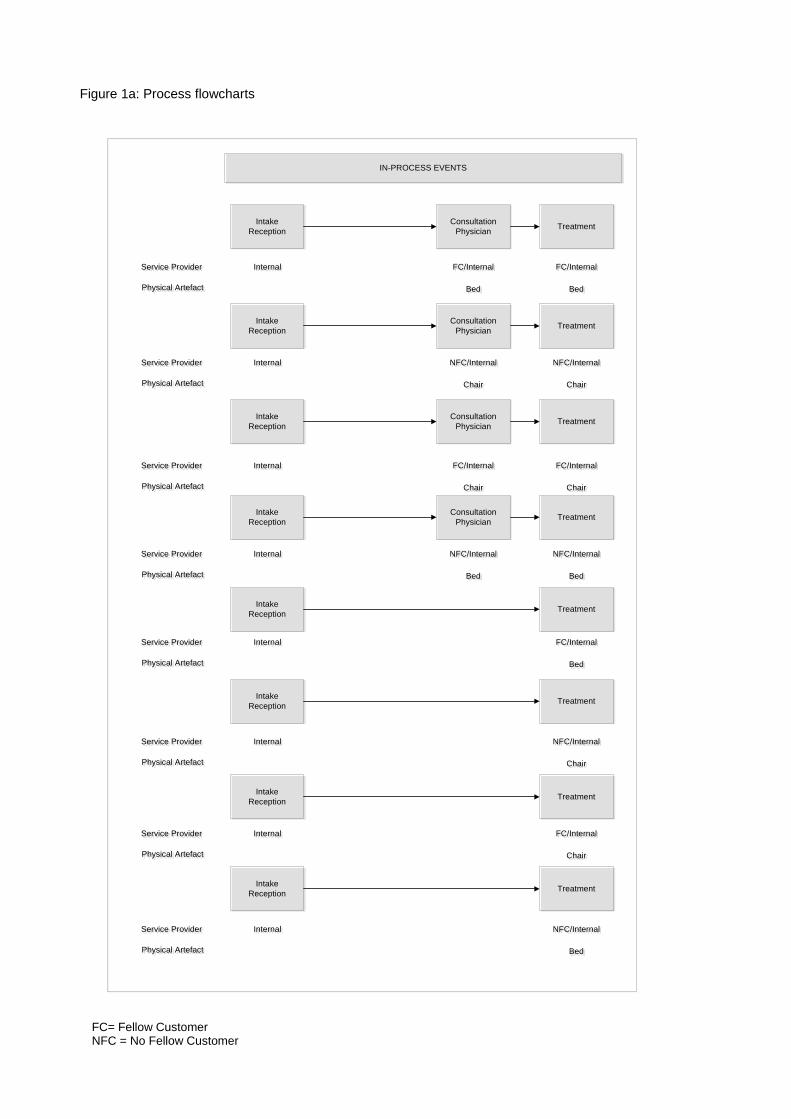
analysis associated with research aim 1), thereby operationalizing the five key service delivery system design characteristics (service event frequency, service event timing, involvement of external service providers, involvement of fellow customers, and physical artefacts). Second, we investigate the impact of the five key service delivery system design characteristics on the relationship between customer journey duration and value for time (explanatory analysis associated with research aim 2). Exploratory analysis To gain insight in the service delivery system characteristics in the context of delivering a customer journey in a service delivery network, we developed flowcharts for the journey of patients undergoing cancer treatment in the CDUs at the hospital based upon the information in the process travel sheets. Specifically, the flowcharts display the key service events (frequency and timing), the involved service providers (internal versus external versus fellow customers), and the involved physical artefacts. As shown in Figure 1, the flowcharts identified 28 types of journeys for patients undergoing cancer treatment in the CDUs at the hospital. These types of patient journeys differ in terms of the frequency and timing of service events (see blocks in Figure 1), the type of professional and non-professional providers involved in the service delivery system (see caption below blocks in Figure 1), and the involved physical artefacts (see caption below blocks in Figure 1). In what follows, we elaborate on these service delivery system design decisions and the considerations that underlie these design decisions.
Intake
Reception
Consultation
PhysicianTreatment
Intake
Reception
Consultation
PhysicianTreatment
Intake
Reception
Consultation
PhysicianTreatment
Intake
Reception
Consultation
PhysicianTreatment
Intake
ReceptionTreatment
Intake
ReceptionTreatment
Intake
ReceptionTreatment
Intake
ReceptionTreatment
InternalInternal FC/InternalFC/Internal FC/InternalFC/Internal
BedBed BedBed
Service ProviderService Provider
Physical ArtefactPhysical Artefact
InternalInternal NFC/InternalNFC/Internal NFC/InternalNFC/Internal
ChairChair ChairChair
Service ProviderService Provider
Physical ArtefactPhysical Artefact
InternalInternal FC/InternalFC/Internal FC/InternalFC/Internal
ChairChair ChairChair
Service ProviderService Provider
Physical ArtefactPhysical Artefact
InternalInternal NFC/InternalNFC/Internal NFC/InternalNFC/Internal
BedBed BedBed
Service ProviderService Provider
Physical ArtefactPhysical Artefact
InternalInternal FC/InternalFC/Internal
BedBed
Service ProviderService Provider
Physical ArtefactPhysical Artefact
InternalInternal NFC/InternalNFC/Internal
ChairChair
Service ProviderService Provider
Physical ArtefactPhysical Artefact
InternalInternal FC/InternalFC/Internal
ChairChair
Service ProviderService Provider
Physical ArtefactPhysical Artefact
InternalInternal NFC/InternalNFC/Internal
BedBed
Service ProviderService Provider
Physical ArtefactPhysical Artefact
IN-PROCESS EVENTS
Figure 1a: Process flowcharts
FC= Fellow Customer NFC = No Fellow Customer

Intake
Reception
Blood
Sample
Consultation
PhysicianTreatment
Intake
Reception
Blood
Sample
Consultation
PhysicianTreatment
Intake
Reception
Blood
Sample
Consultation
PhysicianTreatment
Intake
Reception
Blood
SampleTreatment
Intake
Reception
Blood
SampleTreatment
Intake
Reception
Blood
SampleTreatment
Intake
Reception
Blood
SampleTreatment
Intake
Reception
Blood
Sample
Consultation
PhysicianTreatment
InternalInternal FC/InternalFC/Internal FC/InternalFC/Internal FC/InternalFC/Internal
InternalInternal NFC/InternalNFC/Internal NFC/InternalNFC/Internal NFC/internalNFC/internal
BedBed BedBed BedBed
Service ProviderService Provider
Physical ArtifactPhysical Artifact
ChairChair ChairChair ChairChair
Service ProviderService Provider
Physical ArtifactPhysical Artifact
InternalInternal FC/InternalFC/Internal FC/InternalFC/Internal FC/internalFC/internal
ChairChair ChairChair ChairChair
Service ProviderService Provider
Physical ArtifactPhysical Artifact
InternalInternal NFC/InternalNFC/Internal NFC/InternalNFC/Internal NFC/InternalNFC/Internal
BedBed BedBed BedBed
Service ProviderService Provider
Physical ArtifactPhysical Artifact
InternalInternal FC/InternalFC/Internal FC/InternalFC/Internal
BedBed BedBed
Service ProviderService Provider
Physical ArtifactPhysical Artifact
InternalInternal NFC/InternalNFC/Internal NFC/InternalNFC/Internal
ChairChair ChairChair
Service ProviderService Provider
Physical ArtifactPhysical Artifact
InternalInternal FC/InternalFC/Internal FC/InternalFC/Internal
ChairChair ChairChair
Service ProviderService Provider
Physical ArtifactPhysical Artifact
InternalInternal NFC/InternalNFC/Internal NFC/InternalNFC/Internal
BedBed BedBed
Service ProviderService Provider
Physical ArtifactPhysical Artifact
IN-PROCESS EVENTS
Figure 1b: Process flowcharts
FC= Fellow Customer NFC = No Fellow Customer

Consultation
Physician
Intake
Reception
Intake
ReceptionBloodsample
Consultation
PhysicianTreatment
Blood
SampleTreatment
Blood
Sample
Consultation
Physician
Intake
ReceptionTreatment
Blood
Sample
Consultation
Physician
Intake
ReceptionTreatment
Blood
Sample
Consultation
Physician
Intake
ReceptionTreatment
Blood
Sample
Consultation
Physician
Intake
ReceptionTreatment
Consultation
Physician
Intake
Reception
Blood
SampleTreatment
Consultation
Physician
Intake
Reception
Blood
SampleTreatment
Consultation
Physician
Intake
Reception
Blood
SampleTreatment
Intake
ReceptionBloodsample
Consultation
PhysicianTreatment
Intake
ReceptionBloodsample
Consultation
PhysicianTreatment
Intake
Reception
Internal
Bloodsample
External
Consultation
PhysicianTreatment
InternalInternalExternalExternal FC/InternalFC/Internal FC/InternalFC/Internal
BedBed BedBed
Service ProviderService Provider
Physical ArtefactPhysical Artefact
InternalInternalExternalExternal FC/InternalFC/Internal FC/InternalFC/Internal
ChairChair ChairChair
InternalInternalExternalExternal NFC/InternalNFC/Internal NFC/InternalNFC/Internal
ChairChair ChairChair
InternalInternalExternalExternal NFC/InternalNFC/Internal NFC/InternalNFC/Internal
BedBed BedBed
InternalInternalExternalExternal FC/InternalFC/Internal FC/InternalFC/Internal
BedBed BedBed
InternalInternalExternalExternal NFC/InternalNFC/Internal NFC/InternalNFC/Internal
BedBed BedBed
InternalInternalExternalExternal FC/InternalFC/Internal FC/InternalFC/Internal
ChairChair ChairChair
InternalInternalExternalExternal NFC/InternalNFC/Internal NFC/InternalNFC/Internal
ChairChair ChairChair
InternalInternalExternalExternalExternalExternal NFC/InternalNFC/Internal
BedBed
InternalInternalExternalExternalExternalExternal FC/InternalFC/Internal
BedBed
InternalInternalExternalExternalExternalExternal NFC/InternalNFC/Internal
ChairChair
InternalInternalExternalExternalExternalExternal FC/InternalFC/Internal
ChairChair
Service ProviderService Provider
Physical ArtefactPhysical Artefact
Service ProviderService Provider
Physical ArtefactPhysical Artefact
Service ProviderService Provider
Physical ArtefactPhysical Artefact
Service ProviderService Provider
Physical ArtefactPhysical Artefact
Service ProviderService Provider
Physical ArtefactPhysical Artefact
Service ProviderService Provider
Physical ArtefactPhysical Artefact
Service ProviderService Provider
Physical ArtefactPhysical Artefact
Service ProviderService Provider
Physical ArtefactPhysical Artefact
Service ProviderService Provider
Physical ArtefactPhysical Artefact
Service ProviderService Provider
Physical ArtefactPhysical Artefact
Service ProviderService Provider
Physical ArtefactPhysical Artefact
PRE-PROCESS IN-PROCESS
Figure 1c: Process flowcharts
FC= Fellow Customer NFC = No Fellow Customer
Figure 1c: Process flowcharts

Service event frequency The first difference in service design characteristics is the number of key events that occur during the service delivery process or the service event frequency. As shown in Figure 1, each patient journey involves an intake moment at the reception of the CDU and the therapy at the CDU. These events are seen as respectively the start of the in-process at the CDU and the end moment of the in-process at the CDU. Furthermore, Figure 1 shows that most patient journeys involve additional service events. Specifically, the variety in service event frequency mainly depends on the type of treatment patients receive. First, several treatments require a blood sample to check whether the patient is capable of receiving medication and/or how the medication should be prepared. Second, a lot of treatments involve a consultation with a physician, but this is not the case for every treatment. Some treatments rely on an automated prescription, as a consequence of which the patient does not have to be seen by a physician each time a new process starts. In sum, we identify three categories in terms of service event frequency:
two service events: the intake at the reception and the start of the treatment three service events: the intake at the reception, the start of the treatment and
one extra event - i.e., a consultation with the physician or a blood sample four service events: the intake at the reception, the start of the treatment, a
consultation with the physician, and a blood sample Service event timing As shown in Figure 1, the timing of the blood sample and the consultation with the physician in the sequence of service events differ. Specifically, these service events can occur before, after, or before and after the intake at the CDU of the hospital, but always before the start of the treatment at the CDU of the hospital. If the additional event or events occur after the intake at the CDU of the hospital, these events are seen as in-process events. On the contrary, we use the notion of pre-process events for events that occur before the intake at the CDU of the hospital. Further inquiry revealed that pre-process events are introduced to decrease patient throughput time at the CDU and increase the number of patients that can be served in one day. Hence, the decision whether a patient receives pre-process events is made by the management team and physicians of the CDU and not by the patients. In sum, we identify three categories in terms of service event timing:
no pre-process events: the blood sample and consultation with the physician occur after the intake at the CDU of the hospital
one pre-process event : the blood sample or the consultation with the physician occurs before the intake at the CDU of the hospital
two pre-process events: the blood sample and the consultation with the physician occur before the intake at the CDU of the hospital
Involvement of external service provider Figure 1 illustrates that events that occur before the start of therapy - more particularly the blood sample and the consultation with the physician - can be performed by an internal service provider (i.e., service providers at the CDU of the

hospital) or an external service provider (i.e., service providers not operating at the CDU of the hospital). External service providers involve both service providers external to the CDU and service providers external to the hospital. Examples of service providers external to the CDU are mobile nurses or nurses at the ambulatory clinic of the hospital taking the blood sample and the specialist having consultation at an ambulatory clinic of the hospital. An example of service providers external to the hospital is a general practitioner taking the blood sample at his office. In sum, we identify two categories in terms of external service provider involvement:
no involvement of external service provider: all service providers involved in the cancer treatment journey operate at the CDU of the hospital
involvement of external service provider: not all service providers involved in the cancer treatment journey operate at the CDU of the hospital
Involvement of fellow customers As shown in Figure 1, involvement of fellow customers is another element in the service delivery network of patients undergoing cancer treatment. If patients undergoing cancer treatment have a single room, there is no involvement of fellow customers. Patients, however, do have contact with fellow patients when staying in a room where multiple patients receive their treatment. In other words, patients who share a room have the opportunity to communicate about their disease and the problems they are facing with fellow patients and have thus opportunities to connect with other customers. Whether patients have the opportunity or not to connect with other patients depends on the type of room where the treatment occurs. Further inquiry learned that the planning tool of the department assigns rooms to patients in most situations, but a couple of patients insist on having a single room and thus no involvement of fellow customers. As a consequence, we identify two categories in terms of involvement of fellow customers:
no involvement of fellow customers: patients undergoing cancer treatment do not have the opportunity to connect with other patients
involvement of fellow customers: patients undergoing cancer treatment have the opportunity to connect with other patients
Physical artefacts Figure 1 reveals that the main difference in terms of physical artefacts relates to whether the therapy is received when lying in a bed versus when sitting in a chair. If customers choose or end up in a single room, they will always have a bed. In other situations, customers may be confronted with a bed or a chair. The furniture related to the treatment is thus the most important physical artefact, which depends on coincidence rather than patient choice. In sum, we identify two categories:
chair: patients undergoing cancer treatment have a chair at their disposal bed: patients undergoing cancer treatment have a bed at their disposal

Explanatory analysis As mentioned in the method section, we have process travel sheets for 410 patients, time measurement data for 262 patients and survey data for 312 patients. To investigate the impact of design characteristics (cf. process travel sheets) on the relationship between customer journey duration (cf. time measurement data) and value for time (cf. survey data), we can only involve those patients for whom we have process travel sheets, time measurement data, and survey data. Our final sample therefore consists of 261 patients. As shown in Table 1, the patient sample is 55.6% female and 42.1% male. One hundred and twenty seven patients were younger than 60 and 127 patients were 60 or older.
Table1: Descriptives
As background to investigating the impact of the design characteristics on the relationship between customer journey duration and value for time, we conducted a linear regression analysis to gain insight into the impact of customer journey duration on value for time. We controlled for age, department and gender. To obtain a parsimonious model, control variables were not included because they were not significant.
As shown in Table 2, there is no relationship between duration and value for time (F(1,259)=2.252, p>0.05, adjusted R²=.005). The main focus, however, lies on the moderating impact of design characteristics on the customer journey duration and value for time relationship. In what follows, we elaborate on the moderating impact of the five service delivery system design characteristics.
Descriptives Frequency Percentage
Age
<60 127 50.00%
≥60 127 50.00%
Gender
Male 109 42.1%
Female 144 55.6%
Department
CDU 1 97 37.2%
CDU 2 164 62.8%
Service event frequency
two service events 2 0.80%
three service events 37 14.20%
four service events 222 85.10%
Service event timing
no pre-process events 184 70.5%
one pre-process event 60 23.00%two pre-process events 17 6.5%
Involvement of external
service provider
Yes 66 74.7%
No 195 25.3%
Involvement of fellow
customers
Yes 179 70.5%No 75 29.5%
Physical artifact
Bed 195 74.7%Chair 66 25.3%

Table 2: Linear Models
Service event frequency Since we did not have enough data for processes that contained only two events, we can only provide the analysis for the processes with three and four events. The results reveal that there is a negative significant relationship between customer journey duration and value for time when there are three events within a process (F(1,35)=6.892, p < .05, adjusted R²=.141). There is a non-significant relationship when four service events occur (F(1,220)=.868, p > .05, adjusted R²=-.001). Hence, H1 stating that service event frequency is a moderator is supported. Service event timing Regarding service event timing, the regression analyses reveal that there is no significant relationship between customer journey duration and value for time in the case of no pre-process event (F(1,182)=1.459, p > .05, adjusted R²=.003), one pre-process event (F(1,15)=.442, p > .05, adjusted R²=-.036), or two pre-process events (F(1,58)=.001, p > .05, adjusted R²=-.017). As a consequence, service event timing does not have a significant role as a moderator and therefore H2 is rejected. Involvement of external service provider The type of service provider has a moderating effect on the relationship between customer journey duration and value for time. The relationship between duration and value for time is not significant when external service providers are involved
Variables B Beta t
Constant 5.066
Duration -4.10E-05 -0.089 -1.501
Constant 5.514
Duration 0 -0.406 -2.625*
Constant 4.994
Duration -2.87E-05 -0.063 -0.932
Constant 4.976
Duration -3.67E-05 -0.089 -1.208
Constant 5.044
Duration 0 -0.169 -0.665
Constant 5.184
Duration 1.72E-06 0.003 0.024
Constant 5.179
Duration -5.81E-05 -0.142 -0.142*
Constant 4.659
Duration 3.98E-05 0.066 0.066
Constant 4.901
Duration -2.88E-05 -0.074 -0.636
Constant 5.18
Duration -5.43E_05 -0.113 -1.517
Constant 5.115
Duration -4.88E-05 -0.115 -1.585
Constant 4.543
Duration 4.25E-05 0.08 0.615
* = p<0.05
Physical artifact: Chair (n=60)
Complete sample (n=261)
Service event frequency: three
service events (n=36)
Service event frequency: four
service events (n=221)
Service event timing: no pre-process
events (n=183)
Service event timing: two pre-
process events (n=16)
Service event timing: one pre-
process event (n=59)
No involvement of external service
provider (n=194)
Involvement of external service
provider (n=65)
No involvement of fellow customers
(n=74)
Involvement of fellow customers
(n=178)
Physical artifact: Bed (n=190)
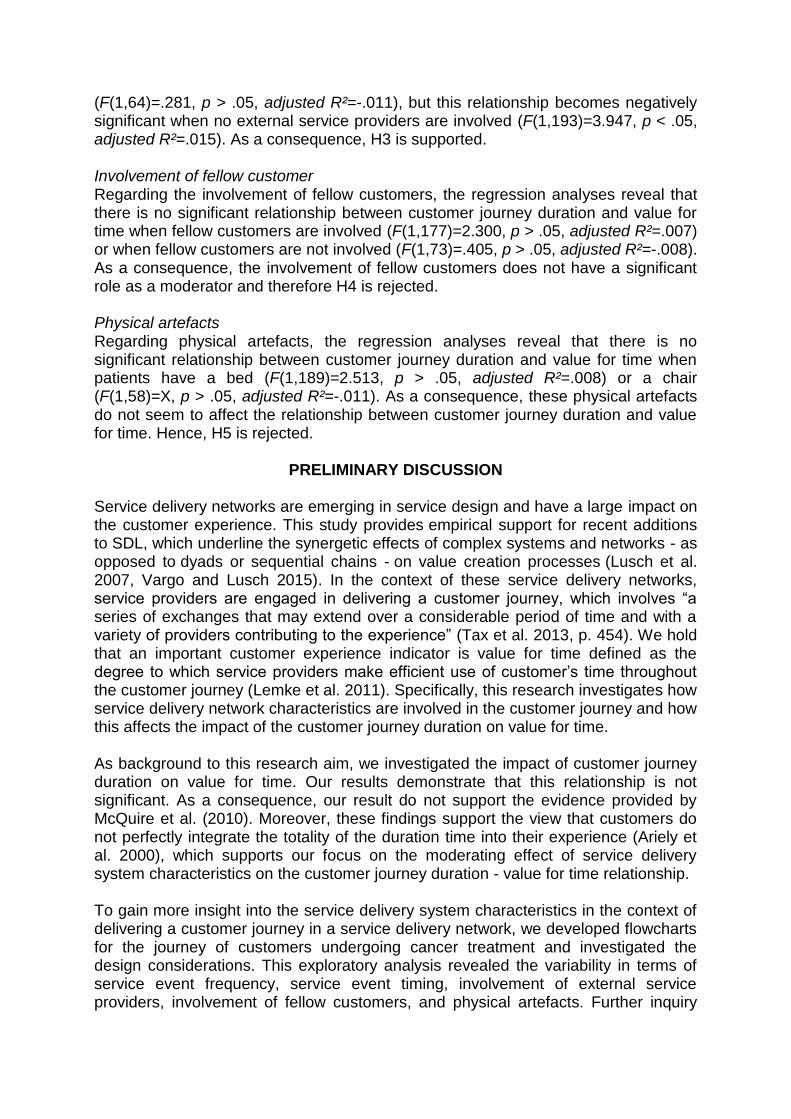
(F(1,64)=.281, p > .05, adjusted R²=-.011), but this relationship becomes negatively significant when no external service providers are involved (F(1,193)=3.947, p < .05, adjusted R²=.015). As a consequence, H3 is supported. Involvement of fellow customer Regarding the involvement of fellow customers, the regression analyses reveal that there is no significant relationship between customer journey duration and value for time when fellow customers are involved (F(1,177)=2.300, p > .05, adjusted R²=.007) or when fellow customers are not involved (F(1,73)=.405, p > .05, adjusted R²=-.008). As a consequence, the involvement of fellow customers does not have a significant role as a moderator and therefore H4 is rejected. Physical artefacts Regarding physical artefacts, the regression analyses reveal that there is no significant relationship between customer journey duration and value for time when patients have a bed (F(1,189)=2.513, p > .05, adjusted R²=.008) or a chair (F(1,58)=X, p > .05, adjusted R²=-.011). As a consequence, these physical artefacts do not seem to affect the relationship between customer journey duration and value for time. Hence, H5 is rejected.
PRELIMINARY DISCUSSION
Service delivery networks are emerging in service design and have a large impact on the customer experience. This study provides empirical support for recent additions to SDL, which underline the synergetic effects of complex systems and networks - as opposed to dyads or sequential chains - on value creation processes (Lusch et al. 2007, Vargo and Lusch 2015). In the context of these service delivery networks, service providers are engaged in delivering a customer journey, which involves “a series of exchanges that may extend over a considerable period of time and with a variety of providers contributing to the experience” (Tax et al. 2013, p. 454). We hold that an important customer experience indicator is value for time defined as the degree to which service providers make efficient use of customer’s time throughout the customer journey (Lemke et al. 2011). Specifically, this research investigates how service delivery network characteristics are involved in the customer journey and how this affects the impact of the customer journey duration on value for time. As background to this research aim, we investigated the impact of customer journey duration on value for time. Our results demonstrate that this relationship is not significant. As a consequence, our result do not support the evidence provided by McQuire et al. (2010). Moreover, these findings support the view that customers do not perfectly integrate the totality of the duration time into their experience (Ariely et al. 2000), which supports our focus on the moderating effect of service delivery system characteristics on the customer journey duration - value for time relationship. To gain more insight into the service delivery system characteristics in the context of delivering a customer journey in a service delivery network, we developed flowcharts for the journey of customers undergoing cancer treatment and investigated the design considerations. This exploratory analysis revealed the variability in terms of service event frequency, service event timing, involvement of external service providers, involvement of fellow customers, and physical artefacts. Further inquiry

learned that this variation relates to the pathology, the design choices and the considerations of the management of the department, and patient preferences and choices. As a consequence, service delivery system variability depends not only on the service provider, but also on the customer in the context of delivering a customer journey in a service delivery network. Several conclusions can be drawn from the exploratory analysis in the study. First, the complexity of the customer journey shows that both customer and organizational service delivery processes are important to investigate. Recent research points out the benefits of the combination of customer-focused service process diagram tools (i.e. service blueprinting) with organizational-focused process diagram tools (i.e. business process modeling notation, or BPMN) (Gounaris et al. 2012). Second, as a large number of stakeholders co-create the patient journey, we have to have a clear understanding of the roles and impact of the different stakeholder. Lush et al. (2010) underline the finding that as value is co-created and not firm created and delivered, and as co-creation involves complex systems and networks rather than dyads or sequential chains, the systemic and synergistic effects of these complex networks should be investigated. Third, since service delivery network characteristics are becoming more complex, service providers have less control on the enrolment of the totality of the process. This has important managerial implications in the context of service design.
Regarding the moderating impact of the aforementioned service delivery system characteristics on the relationship between customer journey duration and value for time, our exploratory analysis revealed that two out of five service delivery system design characteristics had a significant moderating effect. The first moderating affect was found for service events frequency. If there were only three events in the patient process, the relationship was significant. This can be explained by the attribution theory (Nie 2000). People tend to make causal links between events and causes, the fact that only one event happens before the start of the treatment will potentially affect the customers’ expectations. They will assume that there is less reason for delay. If there is a delay, this will decrease their value for time. This is not the case when there is more than one event within the process, since more can go wrong when there are multiple events. Second, also the type of event might influence this relationship. When only three events within the process occur, a patient can either receive a consultation with the physician or a blood sample. In most of the cases this was the consultation with the physician. People might ‘value’ this consultation more than receiving the blood sample. Next, the type of service provider had a significant moderating effect on the relationship between duration and value for time. The relation is significant when only internal service providers are interacting with the patient. Consequently, when services are solely internally provided, longer duration leads to lower perceptions of value for time. The real patient duration is important in this case and should be limited in order to increase the value for time perception. The fact that the relationship for external service providers is not significant, presumes that managers have less impact on the perceptions of customer experiences when the service is partially provided by an external service provider. However, it is not clear whether the patient considers this as ‘one patient journey’. More in-depth research to really explore the customer perceptions of service delivery networks is necessary.

Following these results, there is an impact of the SDN characteristics on value for time. Nonetheless, not all characteristics were significant. First, there was no difference in the relationship between duration and value for time for service event timing. This is not in line with the findings of Dubé-Rioux et al. (1989), who found that the events in the pre-process had a larger influence on the perception of waiting time. However, Dubé-Rioux et al. (1989) define a process as a sequential process wherein the pre-process is described as the first contact with the service provider inside the organization. In our case, processes are not sequential and a lot of variation is observed because of the broad service delivery network. Moreover, services can also be provided outside the organization. Hence, the impact of SDN characteristics on value for time in a broad service delivery network is different from services that are provided in one internal sequential process. Second, the interaction with a fellow customer was not significant. This might be explained by the fact that the interaction with the fellow customer is linked with the type of room of a customer. Patients tend to prefer to have a single room. However, not all patients that were treated in a single room, selected the room themselves. Third, the physical artefact did not moderate the relationship, which might be due to the fact that physical artefacts are associated with the type of room. Additionally, the department is using chairs instead of beds to increase the efficiency and occupancy. Some patients subscribed in the survey that these chairs were not comfortable and that they preferred a bed. However, this did not influence the relationship between patient journey duration and value for time significantly. In conclusion, in this case study a large variety of processes is provided because of the amount service delivery network characteristics. We showed that the impact of service delivery characteristics on value for time in a broad service delivery network is different from services that are provided in one internal sequential process. Managers should take this into account optimizing service design of service delivery. When providing internal services with few events, the duration of waiting does matter and there is negative relationship. However, when outsourcing services or increasing the number of events, this relationship becomes insignificant. The variability of the processes in a service delivery network (28 different process flow charts in figure 1) makes it much more challenging to understand the customer journey and manage the customer experience due to the larger number of stakeholders and the increasing role of the customers. Hence it is important to get insight in the complexity and variability of processes, even when they are partially enrolled outside the organization. Service design considerations should be made analyzing processes in the larger context of SDN taking into account the viewpoints of the different stakeholders including the customer. In line with Ponsignon et al. (2011), this study makes clear that design choices and considerations in a SDN perspective are different from internal processes not integrated in a larger network. Although the data reflect the complexity of the SDN, the focus is on actors involved in the SDN related to the treatment of cancer patients. Cancer patients, however, may also engage in other activities than oncological treatment - such as self-therapy or consulting peers in online communities - to deal with their disease (McColl-Kennedy et al. 2012). As a consequence, future research might investigate the impact of actors engaged in the SDN related to dealing with cancer rather than actors engaged in the SDN related to the oncological treatment on the customer experience. This can enhance insight in the patient’s perceptions of a customer journey. In addition, since we were not able to find evidence for all our hypotheses, we should gain a more in-depth understanding

of the effect of SDN characteristics on value for time and the customer experience through qualitative research.
REFERENCES
Ariely, D., Kahneman, D. and Loewenstein, G. (2000), “Joint commentary on the importance
of, duration in ratings of and choices between, sequences of outcomes”, Journal of Experimental Psychology General, Vol. 129, pp. 524-529.
Bitner, M.J. (1990), “Evaluating service encounters: the effects of physical surroundings and employee responses”, Journal of Marketing, pp. 69-82.
Bitner, M.J., Ostrom, A.L. and Morgan, F.N. (2008), “Service blueprinting: A practical technique for service innovation”, California Management Review, Vol. 50 No. 3, pp. 66.
Bitran, G.R., Ferrer, J.-C. and Rocha e Oliveira, P. (2008), “OM Forum-Managing Customer Experiences: Perspectives on the Temporal Aspects of Service Encounters”, Manufacturing & Service Operations Management, VoL. 10 No. 1, pp. 61-83.
Borras, J., Sanchez-Hernandez, A., Navarro, M., Martinez, M., Mendez, E., Ponton, J., Espinas, J. and Germa, J. (2001), “Compliance, satisfaction, and quality of life of patients with colorectal cancer receiving home chemotherapy or outpatient treatment: a randomised controlled trial”, Bmj, Vol. 322, pp. 826.
Dasu, S. and Chase, R. (2013), “The customer service solution: Managing emotions, trust, and control to win your customer’s business”, McGraw Hill Professional.
Dubé-Rioux, L., Schmitt, B.H. and Leclerc, F. (1989), “Consumers’ reactions to waiting: when delays affect the perception of service quality”, Advances in consumer research, Vol. 16 No.1, pp. 59-63.
Gemmel P, Cardoen B., Robberecht R., and Landry S. (2015), “ Process performance and service quality in chemotherapy day units: two sides of the same coin?”, Proceedings of the Quis14 conference, Shanghai, Jun 18-19, pp. 99-108.
Bove, L.L., Pervan, S.J., Beatty, S.E. and Shiu, E. (2009), “Service worker role in encouraging customer organizational citizenship behaviors”, Journal of Business Research, Vol. 62 No. 7, pp. 698-705.
Gounaris, S., Tanyeri, M., Milton, S. K. and Johnson, L. W. (2012), “Service blueprinting and BPMN: a comparison”, Managing Service Quality: An International Journal, Vol. 22 No.6, pp. 606-621.
Hui, M.K., Thakor, M.V. and Gill, R. (1998), “The effect of delay type and service stage on consumers' reactions to waiting”, Journal of Consumer Research, Vol. 24 No. 4, pp. 469-480.
Kumar, V., Aksoy, L., Donkers, B., Venkatesan, R., Wiesel, T. and Tillmanns, S. (2010), “Undervalued or overvalued customers: capturing total customer engagement value”, Journal of Service Research, Vol. 13 No. 3, pp. 297-310.
Lemke, F., Clark, M. and Wilson, H. (2011), “Customer experience quality: an exploration in business and consumer contexts using repertory grid technique”, Journal of the academy of marketing science, Vol. 39 No. 6, pp. 846-869.
Lim, E.A.C., Kum, D. and Lee, Y.H. (2015), “Understanding how changes within service experiences impact prospective vs. retrospective time judgments”, Journal of the academy of marketing science, Vol. 43 No. 6, pp. 730-745.
Lusch, R.F., Vargo, S.L. and O’Brien, M. (2007), “Competing through service: insights from service-dominant logic”, Journal of retailing, Vol. 83 No.1, pp. 5-18.
Masselink, I.H., van der Mijden, T.L., Litvak, N. and Vanberkel, P.T. (2012), “Preparation of chemotherapy drugs: Planning policy for reduced waiting times”, Omega, Vol. 40 No. 2, pp. 181-187.
Maxham III, J. G. and Netemeyer, R. G. (2003), “Firms reap what they sow: the effects of shared values and perceived organizational justice on customers’ evaluations of complaint handling”, Journal of Marketing, Vol. 67 No. 1, pp. 46-62.

McColl-Kennedy, J.R., Vargo, S.L., Dagger, T.S., Sweeney, J.C. and van Kasteren, Y. (2012), “Health care customer value cocreation practice styles”, Journal of Service Research, DOI: 10.1177/1094670512442806.
McGuire, K.A., Kimes, S.E., Lynn, M., Pullman, M.E. and Lloyd, R.C. (2010), “A framework for evaluating the customer wait experience”, Journal of Service Management, Vol. 21 No.3, pp. 269-290.
Meester, G.A., Mehrotra, A., Natarajan, H.P. and Seifert, M.J. (2010), “Optimal configuration of a service delivery network: An application to a financial services provider”, Production and Operations Management, Vol. 19 No. 6, pp. 725-741.
Nie, W. (2000), “Waiting: integrating social and psychological perspectives in operations management”, Omega, Vol. 28 No.6, pp. 611-629.
Ostrom, A.L., Parasuraman, A., Bowen, D.E., Patrício, L. and Voss, C.A. (2015), “Service Research Priorities in a Rapidly Changing Context”, Journal of Service Research, Vol. 18 No. 2, pp. 127-159.
Patricio, L., Fisk, R.P., Cunha, J.F.E. and Constantine, L. (2011), “Multilevel Service Design: From Customer Value Constellation to Service Experience Blueprinting”, Journal of Service Research, Vol. 14 No. 2, pp. 180-200.
Pinho, N., Beirão, G., Patrício, L. and P. Fisk, R. (2014), “Understanding value co-creation in complex services with many actors”, Journal of Service Management, Vol. 25 No. 4, pp. 470-493.
Ponsignon, F., Smart, P.A. and Maull, R.S. (2011), “Service delivery system design: characteristics and contingencies”, International Journal of Operations & Production Management, Vol. 31 No. 3, pp. 324-349.
Rosenbaum, M.S. and Massiah, C.A. (2007), “When customers receive support from other customers - Exploring the influence of intercustomer social spupport on customer voluntary performance”, Journal of Service Research, Vol. 9 No. 3, pp. 257-270.
Ross, W. T. and Simonson, I. (1991), “Evaluations of pairs of experiences: A preference for happy endings” Journal of Behavioral Decision Making”, Vol. 4 No. 4, pp. 273-282.
Roth, A. V. and Menor, L. J. (2003), “Insights into service operations management: A research agenda”, Production and Operations Management, Vol. 12 No. 2, pp. 145-164.
Tax, S. S., McCutcheon, D. and Wilkinson, I. F. (2013), “The Service Delivery Network (SDN): A Customer-Centric Perspective of the Customer Journey”, Journal of Service Research, Vol. 16 No. 4, pp. 454-470.
Tax, S. S. and Stuart, I. (1997) “Designing and implementing new services: The challenges of integrating service systems”, Journal of Retailing, 73(1), pp. 105-134.
Teixeira, J., Patricio, L., Nunes, N.J., Nobrega, L., Fisk, R.P. and Constantine, L. (2012), “Customer experience modeling: from customer experience to service design”, Journal of Service Management, Vol. 23 No. 3, pp. 362-376.
van Lent, W. A., Goedbloed, N. and Van Harten, W. (2009), “Improving the efficiency of a chemotherapy day unit: Applying a business approach to oncology”, European Journal of Cancer, Vol. 45 No. 5, pp. 800-806.
Van Riel, A.C.R., Calabretta, G., Driessen, P.H., Hillebrand, B., Humphreys, A., Krafft, M. and Beckers, S.F.M. (2013), “Consumer perceptions of service constellations: implications for service innovation”, Journal of Service Management, Vol. 24 No. 3, pp. 314-329.
Vargo, S. L. and Lusch, R. F. (2015), “Institutions and axioms: an extension and update of service-dominant logic”, Journal of the Academy of Marketing Science, Vol. 44 No. 1, pp. 5-23.
Verhoef, P.C., Lemon, K.N., Parasuraman, A., Roggeveen, A., Tsiros, M. and Schlesinger, L.A. (2009), “Customer Experience Creation: Determinants, Dynamics and Management Strategies”, Journal of Retailing, Vol. 85 No.1, pp. 31-41.
Zomerdijk, L.G. and de Vries, J. (2007), “Structuring front office and back office work in service delivery systems - An empirical study of three design decisions”, International Journal of Operations & Production Management, Vol. 27 No. 1, pp. 108-131.