designing webwork problems for applied … · designing webwork problems for applied statistics ii...
TRANSCRIPT
1
DESIGNING WEBWORK PROBLEMS FOR APPLIED STATISTICS II
Interactive Qualifying Project Report completed in partial fulfillment
of the Bachelor of Science degree at
Worcester Polytechnic Institute, Worcester, MA
Submitted to:
Professor Joseph Petruccelli (advisor)
Minh Le __________________________
Vorayos Roungrojkarnranan __________________________
04/28/2011
___________________________
Advisor Signature
2
Table of Contents Abstract ......................................................................................................................................................... 4
1. Introduction .......................................................................................................................................... 5
2. Background ........................................................................................................................................... 9
2.1 Online homework ......................................................................................................................... 9
2.1.1 Advantages of online homework .......................................................................................... 9
2.1.2 Student perceptions of online homework .......................................................................... 10
2.1.3 Difficulties in using online homework for classes ............................................................... 12
2.2 Statistics courses ......................................................................................................................... 13
2.2.1 The subject statistics ........................................................................................................... 13
2.2.2 Statistics courses ................................................................................................................. 13
2.3 WeBWorK .................................................................................................................................... 14
2.3.1 Special features of WeBWorK ............................................................................................. 14
2.3.2 Effectiveness of WeBWorK ................................................................................................. 16
2.3.3 Use of WeBWorK at Worcester Polytechnic Institute ........................................................ 17
2.4 Types of homework questions .................................................................................................... 18
2.4.1 Multiple choice questions ................................................................................................... 19
2.4.2 Short answer questions ...................................................................................................... 23
2.4.3 Essay questions ................................................................................................................... 25
2.4.4 Combinations of different types of questions .................................................................... 27
3. Methodology ....................................................................................................................................... 29
3.1 Develop questions for simple and multiple linear regression .................................................... 30
3.1.1 Contents of the questions ................................................................................................... 31
3.1.2 Types of questions .............................................................................................................. 31
3.1.3 Question set up ................................................................................................................... 32
3.1.4 List of topics ........................................................................................................................ 33
3.1.5 Designing the questions ...................................................................................................... 34
3.1.6 Consultation ........................................................................................................................ 34
3.2 Programming and uploading the problems ................................................................................ 35
3.3 Test the database ........................................................................................................................ 37
3.4 Improvements ............................................................................................................................. 38
4. Results and Discussion ........................................................................................................................ 39
3
4.1 Results ......................................................................................................................................... 39
4.2 Simple Linear Regression ............................................................................................................ 39
4.3 Multiple Linear Regression ......................................................................................................... 41
4.4 Results ......................................................................................................................................... 43
4.5 Discussion of the testing ............................................................................................................. 44
4.6 Other observations ..................................................................................................................... 49
5. Conclusions and Recommendations ................................................................................................... 50
Bibliography ................................................................................................................................................ 53
Appendix ..................................................................................................................................................... 61
Appendix A.1 : WebWork Problems for Simple Linear Regression ......................................................... 61
Appendix A.2 : WebWork Problems for Multiple Linear Regression ...................................................... 67
Appendix A.3: Pretest and posttest for testing simple linear regression ............................................... 70
Pretest ..................................................................................................................................................... 70
Posttest ................................................................................................................................................... 70
Appendix A.4: Pretest and Posttest for testing multiple linear regression ............................................ 72
Pretest ..................................................................................................................................................... 72
Posttest ................................................................................................................................................... 72
Appendix A.5: Simple linear regression WebWorK problems that were used in control group ............ 74
Appendix A.6: Multiple linear regression WebWorK problems that were used in control group ......... 76
4
Abstract
This project’s goal was designing effective WeBWorK problems for simple and multiple linear regression
topics covered in the course Applied Statistics II at WPI. In this project, current literature concerning
online homework was reviewed to determine the criteria for effective online homework problems. The
WeBWorK problems were designed according to these criteria. The problems designed in this project
were also tested against existing WeBWorK problems on the same topics for effectiveness and
recommendations were made based on the results.
5
1. Introduction Among various educational methods aimed at improving students’ understanding, homework
is important and currently being employed by most teachers and instructors. With the
advancement of technology, especially information technology, students have been assigned
online homework in addition to traditional paper assignments. With the assistance of various
technological tools such as media effects or online interactions, instructors have more options for
designing effective homework. However, online homework can only be useful if it is made
suitable and effective for students and currently there is a debate about the efficacy of online
homework as opposed to traditional paper homework (Bonham, Beichner and Deardoff, 2001).
To create an effective online homework set, an instructor has to face many decisions and
tradeoffs. One tradeoff is the difficulty level of the homework. A homework set with high level
of difficulty may encourage the best students in the class, but may hamper the rest of the students
in understanding the material. In contrast, a homework set with low level of difficulty can give
most of the students an incentive to finish the homework, but may not promote any further
investigation on the materials from the students (Vatterott, 2008). Instructors who do not have
experience with online homework also have difficulty deciding the number and the types of
questions for online homework. Since students interact with online homework in a different way
than they do with paper homework, the inexperienced instructors have to select the number and
the types of questions carefully so the homework stills remains effective. All those decisions and
tradeoffs have made creating effective online homework assignments a challenge for any
instructor who wants to utilize online homework assignment for his class.
6
The application of online systems to college courses has been extensively studied through
a variety of previous work. Vatterott presented criteria that characterize an effective homework
assignment and guidelines on how to make such homework assignments (Vatterott, 2002). These
criteria and guidelines can be applied to both traditional and online homework. Doorn and
O’Brien (2005) not only showed that online homework is preferred by students to traditional
homework but also pointed out some important criteria of a good online homework assignment
such as the existence of grading systems. Stirling in a paper on English Language Garden
Website surveyed various types of questions that can be used for homework and showed both
advantages and disadvantages of those types of questions. Although this article was aimed
mainly for English classes, the information from this article could be useful for any class
(Stirling, 2005).
One existing system for online homework assignments is WeBWorK, an online
homework system developed at the University of Rochester (Weibel and Hirssch, 2002).
WeBWorK has many advanced features such as automatic grading and grade recording, the
ability to recognize students’ answers in various forms, including complex algebraic expressions,
direct communication between students and instructors and flexibility for instructors in designing
problems and homework structures (Gage and Pizer, 2010). Moreover, according to a number of
studies, many instructors and students prefer the WeBWorK system to traditional paper
homework. In a survey given to 2387 students during 2002-2004 at all levels of Calculus,
Differential Equations, Discrete Mathematics and Linear Algebra, most students prefered to use
WeBWorK (Bressoud, 2010). Hodge, Richardson and York (2005) found that more students in a
college algebra course were motivated to complete homework using WeBWorK than using
traditional methods, and most students would take future courses using WeBWorK. There has
7
also been some research specifically on how to use WeBWorK effectively as a homework tool.
Lucas (2010) pointed out advantages and disadvantages of WeBWorK in helping students to
learn.
WeBWorK has been used increasingly frequently in colleges across the United States and
in particular in many mathematical courses at Worcester Polytechnic Institute, including calculus
at all levels, differential equations, linear algebra, statistics and some actuarial mathematics
courses such as Theory of Interest. However, as with other online homework systems, instructors
using WeBWorK face many challenges such as determining the amount and length of homework
and suitable problems to make an effective homework set. This problem is particularly more
important and difficult for statistics courses, as statistics employs more interpretation and
applications questions and less computation questions than other basic mathematics courses.
However, every online homework framework has unique features and presents different
problems. Moreover, every subject requires different approaches to homework. Thus, despite a
variety of research having been done on creating effective online homework, there are still places
for additional research on how to create an effective WeBWorK online homework database for
statistics students. A complete WeBWorK database for statistics students needs to be built. This
database needs to not only satisfy the need of an online homework database for statistics courses
at Worcester Polytechnic Institute but also serves as an effective tool for students to get better
understandings of the materials and instructors to have good evaluations of students’
performances.
With these goals in mind, it was our project’s mission to research methods for creating effective
WeBWorK homework problems for simple and multiple linear regression and to create a set of
8
such problems. We tested these problems in the statistics course MA 2612 taught by Professor
Joseph Petruccelli in D term, 2011. Thus, we focused on the following goals:
Identify the methods to build an effective WeBWorK homework database for simple and
multiple linear regression
Build a WebWorK homework database for simple and multiple linear regression
Test the effectiveness of the database in improving students’ performance in the MA
2612 course and make suggestions for further improvement.
In order to accomplish these goals, we worked closely with the instructor and students of the MA
2612 course. We also consulted other faculty members of the Mathematical Science department
of Worcester Polytechnic Institute.
9
2. Background
2.1 Online homework
Online homework systems provide a new way for instructors to assign homework and for
students to do homework. In contrast to traditional paper homework, online homework systems
require instructors to input homework assignments to an online network instead of supplying
handouts or assigning problems from textbooks. Students access these online homework
assignments by logging into the online homework network using their own accounts. Students
submit the assignments electronically through their online homework system rather than on
paper. These differences create both advantages and difficulties for instructors who use online
homework systems for their classes.
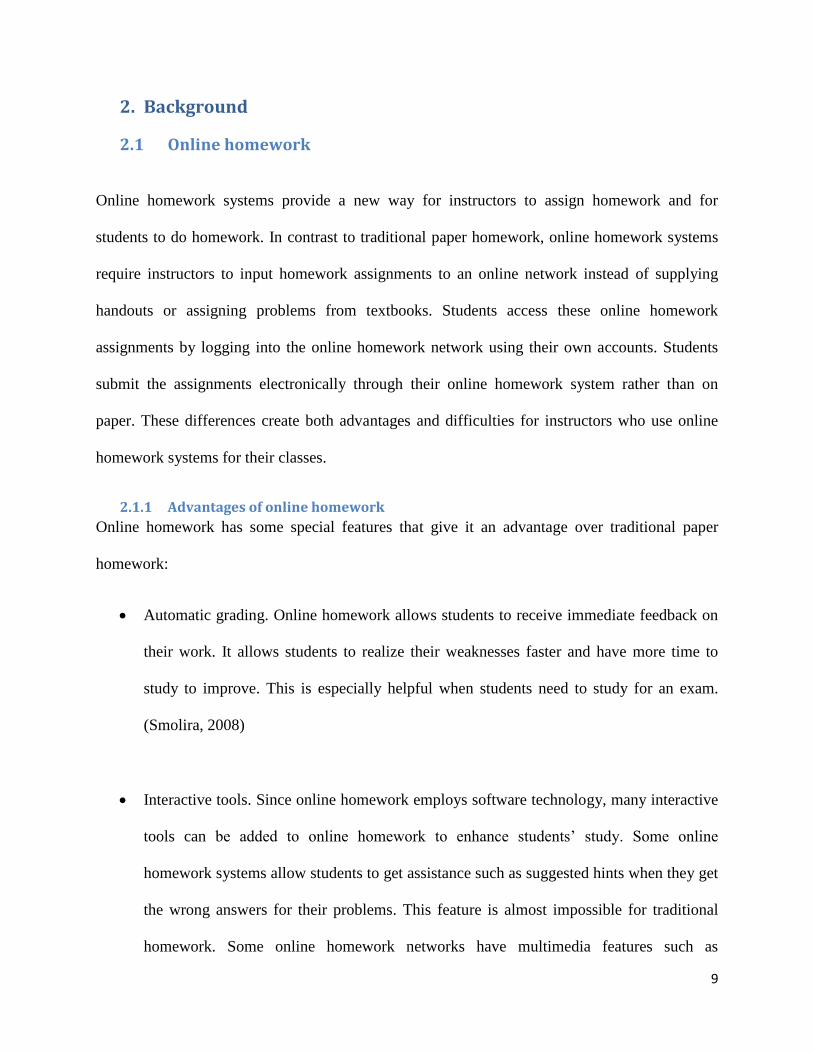
2.1.1 Advantages of online homework
Online homework has some special features that give it an advantage over traditional paper
homework:
Automatic grading. Online homework allows students to receive immediate feedback on
their work. It allows students to realize their weaknesses faster and have more time to
study to improve. This is especially helpful when students need to study for an exam.
(Smolira, 2008)
Interactive tools. Since online homework employs software technology, many interactive
tools can be added to online homework to enhance students’ study. Some online
homework systems allow students to get assistance such as suggested hints when they get
the wrong answers for their problems. This feature is almost impossible for traditional
homework. Some online homework networks have multimedia features such as
10
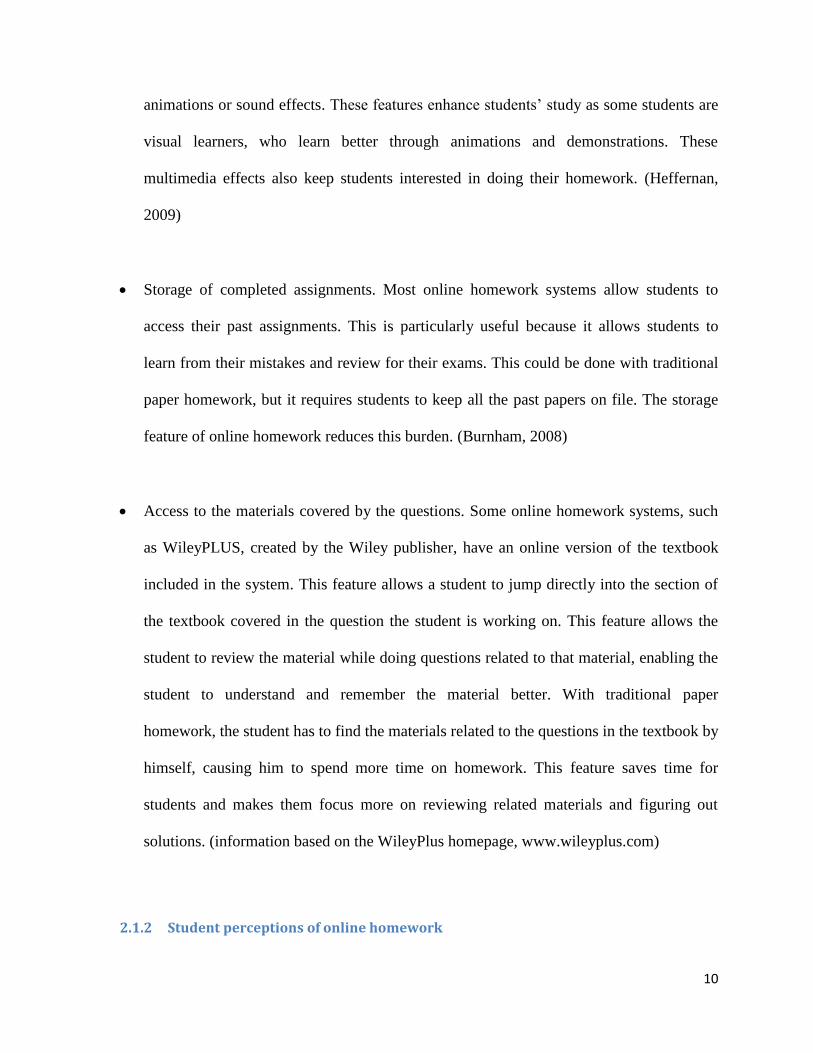
animations or sound effects. These features enhance students’ study as some students are
visual learners, who learn better through animations and demonstrations. These
multimedia effects also keep students interested in doing their homework. (Heffernan,
2009)
Storage of completed assignments. Most online homework systems allow students to
access their past assignments. This is particularly useful because it allows students to
learn from their mistakes and review for their exams. This could be done with traditional
paper homework, but it requires students to keep all the past papers on file. The storage
feature of online homework reduces this burden. (Burnham, 2008)
Access to the materials covered by the questions. Some online homework systems, such
as WileyPLUS, created by the Wiley publisher, have an online version of the textbook
included in the system. This feature allows a student to jump directly into the section of
the textbook covered in the question the student is working on. This feature allows the
student to review the material while doing questions related to that material, enabling the
student to understand and remember the material better. With traditional paper
homework, the student has to find the materials related to the questions in the textbook by
himself, causing him to spend more time on homework. This feature saves time for
students and makes them focus more on reviewing related materials and figuring out
solutions. (information based on the WileyPlus homepage, www.wileyplus.com)
2.1.2 Student perceptions of online homework
11
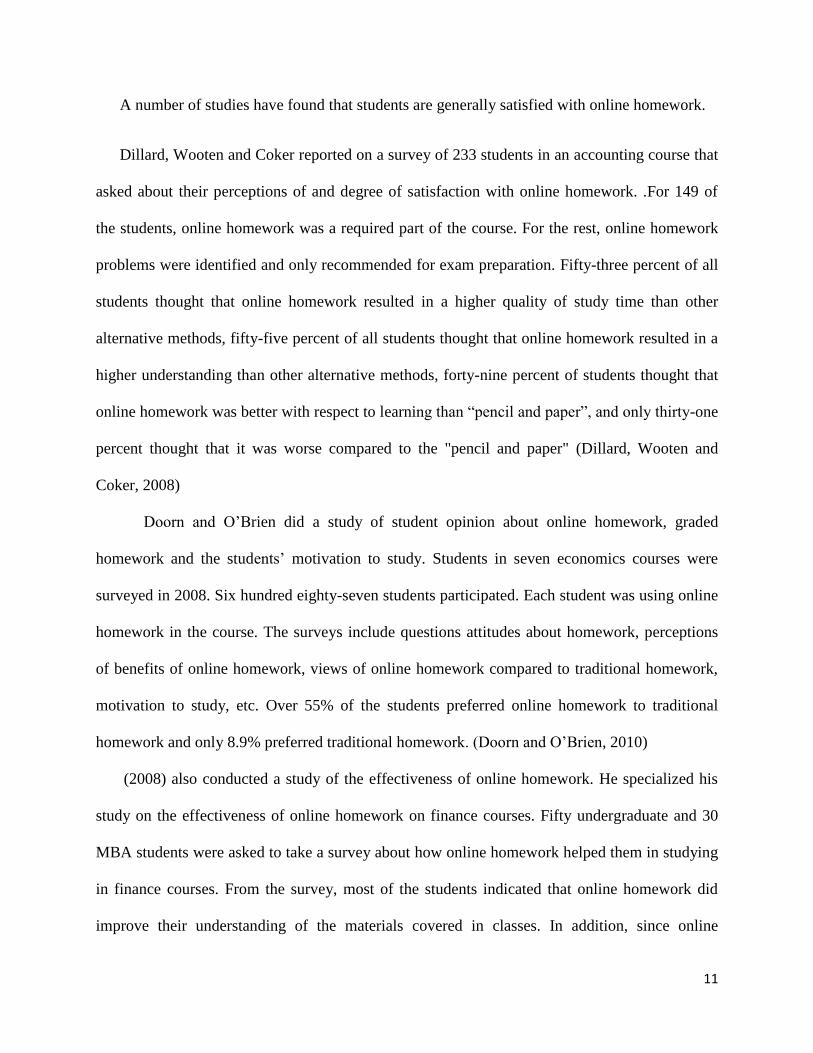
A number of studies have found that students are generally satisfied with online homework.
Dillard, Wooten and Coker reported on a survey of 233 students in an accounting course that
asked about their perceptions of and degree of satisfaction with online homework. .For 149 of
the students, online homework was a required part of the course. For the rest, online homework
problems were identified and only recommended for exam preparation. Fifty-three percent of all
students thought that online homework resulted in a higher quality of study time than other
alternative methods, fifty-five percent of all students thought that online homework resulted in a
higher understanding than other alternative methods, forty-nine percent of students thought that
online homework was better with respect to learning than ―pencil and paper‖, and only thirty-one
percent thought that it was worse compared to the "pencil and paper" (Dillard, Wooten and
Coker, 2008)
Doorn and O’Brien did a study of student opinion about online homework, graded
homework and the students’ motivation to study. Students in seven economics courses were
surveyed in 2008. Six hundred eighty-seven students participated. Each student was using online
homework in the course. The surveys include questions attitudes about homework, perceptions
of benefits of online homework, views of online homework compared to traditional homework,
motivation to study, etc. Over 55% of the students preferred online homework to traditional
homework and only 8.9% preferred traditional homework. (Doorn and O’Brien, 2010)
(2008) also conducted a study of the effectiveness of online homework. He specialized his
study on the effectiveness of online homework on finance courses. Fifty undergraduate and 30
MBA students were asked to take a survey about how online homework helped them in studying
in finance courses. From the survey, most of the students indicated that online homework did
improve their understanding of the materials covered in classes. In addition, since online
12
homework, with automatic grading, gave the faster feedbacks to the students than traditional
paper homework did, the students who had been given online homework usually had more time
to review their homework for exams.
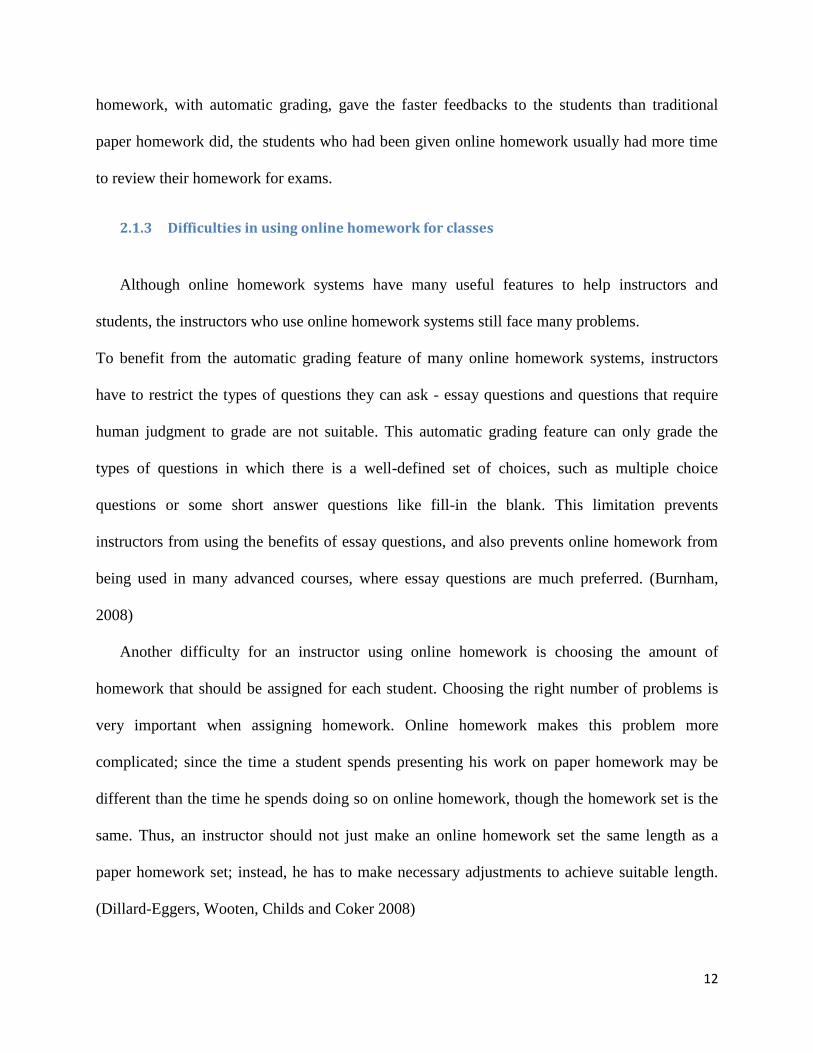
2.1.3 Difficulties in using online homework for classes
Although online homework systems have many useful features to help instructors and
students, the instructors who use online homework systems still face many problems.
To benefit from the automatic grading feature of many online homework systems, instructors
have to restrict the types of questions they can ask - essay questions and questions that require
human judgment to grade are not suitable. This automatic grading feature can only grade the
types of questions in which there is a well-defined set of choices, such as multiple choice
questions or some short answer questions like fill-in the blank. This limitation prevents
instructors from using the benefits of essay questions, and also prevents online homework from
being used in many advanced courses, where essay questions are much preferred. (Burnham,
2008)
Another difficulty for an instructor using online homework is choosing the amount of
homework that should be assigned for each student. Choosing the right number of problems is
very important when assigning homework. Online homework makes this problem more
complicated; since the time a student spends presenting his work on paper homework may be
different than the time he spends doing so on online homework, though the homework set is the
same. Thus, an instructor should not just make an online homework set the same length as a
paper homework set; instead, he has to make necessary adjustments to achieve suitable length.
(Dillard-Eggers, Wooten, Childs and Coker 2008)
13
2.2 Statistics courses
2.2.1 The subject statistics
Although usually considered a subfield of mathematics, statistics is quite different from other
mathematical subfields like algebra or analysis. Statistics is a science concerned with the
collection, organization, analysis and interpretation of data. (definition from Merriam-Webster
Dictionary) The problems designed in this project emphasized analysis and interpretation.
2.2.2 Statistics courses
Since statistics has its own focuses that are different from those of other mathematical branches,
the teaching of statistics requires a suitable approach. Some methods of teaching suitable for a
statistics courses are (Gelman and Nolan 2002):
Use of practical examples: Since statistics is a science dealing with data in real life, it is
very important for statistics students to get some real experiences in their courses. With
practical examples, students can see how statistics is applied in real life so they can use
statistics well in the future. Practical examples usually used in statistics courses include
data obtained from different fields, such as medicine or sociology.
More focus on concepts than on basic calculations: In statistics, theoretical concepts are
very important as different situations use different concepts and methods. Thus, a good
statistics course needs to have a strong emphasis on theoretical concepts.
Use of questions asking for interpretation: Since one important component of statistics is
interpreting the results of data analysis, a statistics student also needs to be taught how to
14
interpret the results of a statistical study. Thus, a statistics course needs to incorporate
interpretations of statistical results.
Use of statistical software, if applicable: Since data in real life usually are very complex,
analysis of those data is often complicated and requires a good amount of time to carry
out by hand. Thus statistical software is essential and knowledge of these software
applications is important. Therefore, a statistical course should prepare students with
knowledge and experience in using statistical software..
Those special aspects of a statistics course mentioned above were focused on during the process
of selecting statistical questions for the database in this project.
2.3 WeBWorK WeBWorK is an online homework system developed at the University of Rochester. Its purpose
is to provide an effective online homework system for courses in many different mathematical
branches, from calculus to statistics. This system has also been used for many science courses in
various subjects, including physics and chemistry. As do other online homework systems,
WeBWorK provides a means for instructors to input the homework problems online and for
students to log in using their own accounts and complete their assignments online. In addition,
WeBWorK has some special features that enhance students’ study. (Weibel and Hirsch, 2002).
2.3.1 Special features of WeBWorK
WeBWorK has many useful features that make it a good candidate for an online homework
system (Gaze and Pizer 2010)
Automatic grading and grade recording: WeBWorK is able to give automatic feedback to
students right after they enter their answers. This automatic grading system also frees
instructors from the grading task. WeBWorK also stores students’ grades on the system
15
so the instructors do not need to keep their own grade books, reducing the time
instructors need to spend on grading and administration. The student’s grades are
accessible anytime by the student and instructor, making it possible to keep track of the
student’s progress.
Allowing multiple trials and partial credit: WeBWorK has an option that allows students
to have multiple trials on any question, depending on the instructor’s discretion. The
default setting is unlimited number of trials, but the instructor can set it to the number of
trials he wants. If this option is utilized, a student will have a number of trials set by the
instructors to get a question right. This feature is very rare and difficult to carry out for
traditional paper homework, since it requires the student to submit his homework and the
instructor to grade and return to the student many times, consuming a lot of time.
WeBWorK solves this problem, by giving automatic results on those parts of the question
the student got wrong and allowing the student to try again immediately after that. The
multiple-trial feature is very useful as it allows the student to learn from his mistakes and
figure out the solutions all by himself, which enhances the student’s understanding of the
materials. Moreover, WeBWorK allows partial credit proportional to how much of the
question the student got correct. This feature creates an incentive for the student to keep
working on the question and employ all the trials he/she can get. Without partial credit, a
student may quit working on the question without using all the trials if he believes he
cannot get the question completely correct.
Recognizing various answer forms: WeBWorK is capable of recognizing different types
of answer forms, including complex algebraic expressions, such as ones including
multiple pairs of parentheses or trigonometric functions. WeBWorK does this by
16
automatically calculating the results of the answers given by the students and comparing
them to the one given by the instructor. This feature reduces the problem of losing points
due to a difference in answer forms between the answers given by the students and the
answer given by the instructor and also removes the worry about answer forms from the
students so they will focus more on how to solve the problems.
Allowing multiple question types: WeBWorK allows instructors to input various types of
questions depending on their intentions, from multiple choice questions to short answer
questions. Thus, instructors can choose the types of questions that they think are most
suitable to their classes. By combining different types of questions, an instructor can
accommodate different learning styles.
Direct communication between students and instructors: WeBWorK also enhances
learning by supporting direct communication between students and instructors. Whenever
a student has troubles with a question, he/she can ask WeBWorK to generate an email to
the instructor that contains a link to the problem and the student’s questions regarding the
problem, which allow him to diagnose the difficulty. From that point, the instructor and
the student can communicate via email about the problem and WeBWorK will serve as
an intermediate server to deliver the messages.
2.3.2 Effectiveness of WeBWorK
WeBWorK has received many positive reviews from both students and instructors.
Bressoud conducted a survey of 2387 students asking their opinions about WeBWorK. These
students were selected from many classes that used WeBWorK at all levels of calculus,
differential equations, discrete mathematics and linear algebra from 2002 to 2004. Based on the
17
survey, Bressoud concluded that most students prefer to WeBWorK to paper homework.
(Bressoud, 2010)
Professor Lucas at the University of California also conducted a study of the
effectiveness of WeBWorK by doing an experiment with students in his mathematics courses.
Those students were required to use WeBWorK during the first halves of their courses. For the
second halves of the courses, students did not use WeBWorK. Then the performances of students
were recorded and compared between the time they used WeBWorK and the time they did not.
The result showed that performances with WeBWorK were significantly better (Lucas, 2010)
Another study of the effectiveness of WeBWorK on student performance was done by Weibel
and Hirsch in calculus courses at Rutgers University. They performed statistical testing on
students’ grades to measure the performances of students with and without WeBWorK. They
also sent out surveys asking about students’ experiences with WeBWorK. They used data
obtained from those surveys and statistical methods to conclude that WeBWorK had positive
effects on students performance. They also measured some factors affecting the results such as
students’ consistency in doing WeBWorK problems. The results also showed positive feedbacks
on WeBWorK. (Weibel and Hirsch, 2002)
2.3.3 Use of WeBWorK at Worcester Polytechnic Institute
WeBWorK has been used in many mathematics courses at Worcester Polytechnic Institute.
Most of the courses are introductory courses in many mathematical fields, from calculus to
actuarial mathematics. Some examples of those courses are given below:
Professor Tilley used WeBWorK for his Calculus 4 course in A term 2010. WeBWorK
assignments were given once a week, each consisting of eight to ten problems. Most of the
questions were given in short answer form.
18
Professor Abraham has used WeBWorK for his Theory of Interest course for about three
years. WeBWorK assignments were given once every two weeks, each consisting of ten to
twelve problems. The types of questions given are short answer type and multiple choice.
Professor Farr has used WeBWorK for many of his basic mathematics courses, including
Linear Algebra I and Differential Equations. The assignments are usually given once every two
weeks. He has used many types of questions for WeBWorK assignments: True/False, short
answer and multiple choice.
WeBWorK has also been used in statistics courses. Professor Kim used WeBWork for his MA
2611 course two years ago. The assignments were usually given once a week and the types of
questions used were multiple choice and short answer. Professor Petruccelli has also used
WeBWorK for his MA 2611 course for two years and used it for his MA 2612 course once.
WeBWorK has also been used by other professors of the Mathematics department at Worcester
Polytechnic Institute, especially the basic mathematics courses required by all majors. Thus,
many students at Worcester Polytechnic Institute have been exposed to WeBWorK during their
study at Worcester Polytechnic Institute.
2.4 Types of homework questions
As mentioned above, since students have different learning styles that are best addressed by
different types of homework questions, selecting the right types of questions for homework
assignments is a very important task for any instructor. There are many types of homework
questions available for instructors to choose; each has its own advantages and disadvantages.
Among those, the most popular types of questions are multiple choice, short answer, and essay
questions.
19
2.4.1 Multiple choice questions
Multiple choice questions give a student a number of possible answers for each question and
the student earns credit if he chooses the right answers among all the options given. The range
for the number of options available for each multiple choice question is usually from two to five.
Most questions of this type do not ask for explanations from students; they simply choose the
options they think would be the right answers. However, some multiple choice questions ask
students to show their work; usually the explanatory parts are graded separately from the
multiple choice part. Multiple choice questions have been used intensively in most subjects, from
natural sciences such as physics to social sciences such as economics or sociology.
2.4.1.1 Advantages of multiple choice questions
An important advantage of this type of question is that since the amount of time spent on
each question is relatively short, more questions can be given on an assignment than would be
possible with other types of homework questions. This would allow the instructor to cover more
material on the homework assignment, thus increasing the breadth of the material covered by
homework. This would benefit the students as they would understand the materials more fully
while the likelihood that they would miss anything from the course would be decreased. To
clarify this point, compare multiple choice questions with essay questions. A multiple choice
question usually takes about 2 to 5 minutes to complete while an essay question typically
requires about 20 to 40 minutes. Thus, for an intended 40-minute homework assignment, using
the multiple choice questions, an instructor can assign 8 to 20 questions, which cover 8 to 20
different areas of the materials, comparing to only 1 to 2 essay questions We can see that
20
multiple choice questions allow the instructor to cover the materials more broadly. That also
benefits the students as they can review more materials through homework. (Seaman 2003)
Another advantage of multiple choice questions is that these questions require students to
have a solid understanding of the materials, since the instructor can make answer options that are
seemingly accurate but contain some false information. The students need to understand the
materials very well in order to distinguish the correct answer from those seemingly correct ones.
Thus, using this technique, the instructors can test whether the students understand the materials
really well or only superficially. (Trigwell 1992)
Another advantage of multiple choice questions is that these questions are very easy and
quick to grade. For traditional paper homework, the instructor just needs to make a single answer
key for the whole class and compare each student’s work with the answer. This is relatively fast
to carry out. For online homework, it is even easier and quicker to do as most online homework
systems have automatic grading for multiple choice questions. Thus, the instructor just needs to
access his account and record the grades of the students. The ease and quickness in grading
multiple choice questions will save a lot of time for the instructors and remove the burden of
grading from the instructors. (Ziemer 2010) In addition, automatic grading always guarantees
100% accuracy, thus reducing the errors in grading.
2.4.1.2 Disadvantages of multiple choice questions
One big disadvantage of multiple choice questions is the lack of opportunities for the
students to practice exposition skills. As multiple choice questions only ask the students to select
the right answer from a set of answer options, students do not have to show any of their work and
explanations on how they get their answers. As a result, students, who are assigned multiple
21
choice questions, do not have the chance to learn and practice explaining their work and ideas.
This can be a serious disadvantage as exposition skills are among problem-solving skills or team-
work skills. Thus, the lack of opportunities for practicing exposition skills is an important factor
that an instructor needs to take into consideration before assigning multiple choice questions.
(Newble and Cannon, 1989)
Another disadvantage of multiple choice questions is that they create an incentive for
students to be lazy by simply guessing the answer instead of spending time to review the
materials to figure out the answers. This problem is even more dramatic when the students are
having trouble understanding the material covered in class or when the homework is not a major
component of the final grade as these scenarios create a greater incentive for the students to
guess the answers. If the student simply guesses to finish his homework assignment, the whole
purpose of the homework assignment, which is helping the student to review materials and
practice, is lost, and the homework assignment will be meaningless for the student. Thus, how to
prevent the problem of students guessing is something that an instructor needs to consider when
making multiple choice questions. One solution is to provide each question with a significant
number of answer options in conjunction with a sensible number of trials allowed, thus lowering
the probability of guessing the right answers and discouraging students from guessing. (Newble
and Cannon, 1989)
One more disadvantage of multiple choice questions is that they create an incentive to cheat.
Since it is relatively quick to finish a multiple choice question – only selecting an answer option
- a student will have incentive to cheat by copying the selections of someone else. The only thing
he/she needs to do is to memorize the choices of other people and make the same answer
selections. As it is relatively easy to cheat, a student will have an incentive to cheat on all
22
assignments instead of really spending time working on homework assignments. This problem is
more dramatic in the case of the traditional paper homework or online homework systems that
can keep a record of completed homework, since in those cases, students can access completed
homework and share the results with each other. To prevent such a problem, it is important to
encourage academic honesty amongst students. (Newble and Cannon, 1989)
2.4.1.3 Types of multiple choice questions
There are a number of types of multiple choices questions. Among those, the three most
commonly used are the traditional multiple choice question, true/false question, and multiple
choice question with short explanation. (Trigger 1992)
The traditional multiple choice question is the most commonly used type. It comprises a
question and a set of answer options, usually ranging from four to six answer options. The
number of correct answers can be one or more than one, depending on the intention of the
question maker.
The true/false question is a special type of multiple choice question. Each true/false
question comprises of a statement and two answer options, namely true and false. The student’s
task is to check whether the statement is true or false and indicate the corresponding answer
choice. A disadvantage of the true/false question is the problem of student guessing, as each
question has only two answer options, making the probability of getting the correct answer very
high and encouraging students to guess.
To overcome the lack of opportunities for students to practice exposition skills, some
instructors also require students to add some explanations besides selecting the answer options.
This is a new form of multiple choice question, multiple choice questions with explanations.
23
Although partially overcoming the problem of lack of explanations, this type of multiple choice
question consumes more time and effort of the students to complete one question. Sometimes,
this type of multiple choice question can be considered a type of short answer question.
2.4.2 Short answer questions
In short answer questions students are asked to figure out and write down the solutions,
usually in short forms. The type of answer required by short answer questions can be a number,
an expression or a statement. Usually questions of this type do not ask for students’ explanations;
however some questions require students to briefly elaborate on their answers. Short answer
questions have been used in many subjects, from natural sciences such as physics to social
sciences such as economics.
2.4.2.1 Advantages of short answer questions
An advantage of short answer questions is that they avoid the problem of multiple choice
questions, the problem of student guessing. Since the student has to enter his/her own answer,
there is no way he/she can just guess the answer. Thus, short answer questions create an
incentive for students to review the materials and solve the problems. This makes homework
more helpful for the students. (Newble and Cannon, 1989)
One more advantage that short answer questions offer is the ease and quickness in grading
for the instructors. For traditional paper homework, since responses for short answer questions
are usually short and simple, instructors do not have to spend much time figuring out if the
students get the right answer. Although grading short answer questions is not as quick as grading
multiple choice questions, grading short answer questions will not consume much instructors’
24
time. Some, but not all, online homework systems do offer a feature that can recognize responses
from the students for short answer questions, thus enabling automatic grading for this type of
question. An example of such online homework system is WeBWorK. This automatic grading
feature will certainly save a lot of time for the instructors as the only thing they need to do is to
access their accounts and record the grades of the students. (Lucas, 2010)
2.4.2.2 Disadvantages of short answer questions
The first disadvantage of short answer questions is the same as that of multiple choice
questions: lack of opportunities for students to present their work and practice exposition skills.
Although short answer questions do ask students to enter their answers rather than simply
selecting the answer from a set of answer options, the answers entered are short, simple and not
the entirety of students’ thoughts and ideas. Thus, the chance for students to present their ideas
with short answer questions is extremely limited. As mentioned earlier in the discussion of
multiple choice questions, this can be a serious disadvantage to the students. Instructors,
therefore, need to take this disadvantage into consideration when assigning homework with short
answer questions. (Newble and Cannon, 1989)
Another disadvantage of short answer questions is that, as do multiple choice questions, they
create an incentive for students to cheat instead of honestly working on homework assignments.
Since a short answer question only asks for brief answers such as a number or a short statement,
it is relatively easy for a student to memorize answers from other people and copy those to his
own homework. The best way, according to Trigwell), to prevent such problem is to promote
academic honesty amongst students. (Trigwell, 1992) However, in the case of computational
questions, an even better way is to randomize the inputs.
25
2.4.3 Essay questions
The third type of questions that is usually assigned to students is the essay question, in which
students are asked to not only figure out the final answers but also to present their ideas and
thoughts. It differs from the two other types of questions discussed above in that in this type of
question, how to present the ideas is as important as getting the correct answers. Essay questions
have been used by many instructors in many subjects, from mathematics (in the form of
mathematical proofs) to history (in the form of discussion paper). Essay questions include all
forms of questions in which students need to present their work, from a worked problem in
mathematics to an essay in English.
2.4.3.1 Advantages of essay questions
The first advantage of essay questions is that they provide a very useful check on how much
students understand, since students need to present all their thoughts and ideas. Without a good
understanding of the materials, a student cannot present his work clearly and fluently. Thus, an
instructor can use essay questions to check his/her students’ understanding of important concepts
and subjects and adjust his teaching approach to make the class more effective. (Newble and
Cannon, 1989)
Another advantage of essay questions is that they create an incentive for students to review
materials and work on the homework assignments. In other words, this type of question
encourages students to spend time learning the materials and working on the homework. The
reason lies in the fact that this type of question requires students to have good understanding of
the materials to present their work and ideas well. If a student only has a superficial
understanding, it would be very difficult for him/her to successfully finish the question. Thus,
26
being assigned essay questions, students will have strong incentive to learn the materials and
complete the homework. This is an important advantage that an instructor should consider when
assigning homework to his/her students. (Newble and Cannon, 1989)
Essay questions also have another advantage; that is, unlike the other two types of questions,
essay questions make it difficult for students to cheat on homework. The reason is that essay
questions require a student to present all the work, not just the final answer. Thus, it is not easy
for a student to copy others’ answers for his homework; even when he can remember some parts
of others’ work, it is not easy to replicate. Thus, essay questions are helpful in discouraging
students from cheating and making them spending time working on the homework themselves.
(Trigger 1992)
2.4.3.2 Disadvantages of essay questions
The first major disadvantage of essay questions is that they require a substantial amount of
time from the students to complete. Even the shortest essay questions usually demand about ten
minutes from the students, and some instructors even expect their students to spend hours for
each essay question. This hampers instructors from assigning many essay questions on a
homework assignment. The major consequence of this is that the number of questions on a
homework assignment may not be enough to cover all the important aspects of the materials.
This is a disadvantage to the students as they may not be able to review all the important aspects
of the materials with homework. Therefore, this disadvantage needs to be considered by an
instructor when assigning homework to students. (Newble and Cannon, 1989)
Another disadvantage of essay questions is that they require a considerable amount of
time from the instructors for grading. Since for essay questions, the way of presenting the work
27
and ideas is as important as the final result, the instructors have to look through all the students’
work, not just the final answer, thus spending a lot of time in grading. Moreover, as students
have different ideas and ways to present their ideas, there is no unique answer key for essay
questions; thus, the instructors have to look at each student’s work to understand and evaluate
carefully, instead of simply comparing students’ answers with the answer key. Thus, essay
questions say create a burden in grading for instructors. (Newble and Cannon, 1989)
In the matter of grading, in the case of online homework, essay questions create a much
greater problem than the other two types of questions. The reason is that currently there is no
online homework system that can evaluate students’ responses to essay questions, as different
students have different ways to present their ideas. In contrast, most online homework systems
have available features to automatically grade multiple choice questions and many online
homework systems, such as WeBWorK, can grade short answer questions. Thus, while the
instructors do not have to spend time grading if using multiple choice questions or short answer
questions, instructors have to spend a lot of time grading if using essay questions. This is another
argument against the use of essay questions. (Zeimer 2010)
2.4.4 Combinations of different types of questions
From the discussion above, it can be seen that every type of question has its own strengths
and weaknesses. Thus, a combination of different types of questions may be desired to combine
the strengths and reduce the weaknesses, making homework assignments more helpful for both
the students and instructors. Unfortunately, there is no definitely superior combination and the
way to combine different types of questions very much depends on the intentions of the
instructor.
28
One such combination is to assign alternatively between essay questions and a combination
of multiple choice questions and short answer questions. Usually essay questions are assigned in
the paper format while multiple choice questions and short answer questions are assigned online
to utilize the automatic grading feature of many online homework systems. This kind of
combining different types of questions has been used widely at Worcester Polytechnic Institute.
An example is Professor Farr’s Linear Algebra I class. In that class, Professor Farr assigned one
paper homework assignment, which contained some essay questions, in one week and in the
following week, he asked students to complete an assignment on WeBWorK, which contained
multiple choice and short answer questions.
29
3. Methodology
The main goal of this project was to build an effective WeBWorK database of homework
problems for simple and multiple linear regression, which can be used for the course Applied
Statistics II offered at Worcester Polytechnic Institute, and other statistics courses which cover
these topics. In this project, our team mostly developed our database of problems ourselves,
based on relevant information and knowledge we had gained from our research. We also sought
advice from some faculty members of the Mathematical Sciences Department at Worcester
Polytechnic Institute. These professors had previously designed WeBWorK problems and
implemented WeBWorK in their courses; thus, they were able to provide us with useful advice
on how to design effective WeBWorK problems and what we needed to consider when designing
our problems. In addition, as WeBWorK is a quite popular online homework system and has
been used extensively by many educational institutions, we also consulted available documents,
information and existing WeBWorK problems from those institutions in order to design our
problems.
With this main goal in mind, our team had the following set of general objectives that we
strived to achieve during our project:
Research to develop useful and effective statistics questions that can be used for
homework about simple and multiple linear regressions. The goal of these questions was
to help students to acquire necessary skills and knowledge about these topics. To achieve
this goal, we took information and knowledge obtained from our review of literature,
advice given by faculty members and experience gained from existing problems
developed by other educational institutions to improve the quality of our problems.
30
Uploading our designed problems into WeBWorK system using pg programming
language, the language that WeBWorK supports. When we uploaded our problems, care
was taken with regard to programming techniques and designs; the goal was to ensure
that the interface of the problems would be according to what we intended and would not
affect the intended purposes of the problems. We also ensured that the display of the
problems would not create any difficulty for students to understand the problems and
input the answers.
Test the effectiveness of the database on the students in the class Applied Statistics II
offered in D term, 2011, which was taught by Professor Petruccelli, our IQP advisor.
Students tried our problems during their lab sessions, and we tested if there would be any
improvement of the students from using our problems.
Based on the results of test, we made some adjustments to the database to make it more
effective and suggested further developments.
3.1 Develop questions for simple and multiple linear regression
The first big step in this project we needed to take was to develop a set of useful and
effective questions for simple and multiple linear regression. This step was extremely important,
as without effective statistics problems and questions, our WeBWorK database would not be
efficacious and could not benefit any student.
To develop such a set of useful and effective statistics questions, we first tried to identify the
criteria and characteristics of effective homework questions, especially those for statistics
courses. In order to achieve this goal, we relied on existing literature which discussed this issue.
31
3.1.1 Contents of the questions
Gelman and Nolan (2002) pointed out that a successful statistics course needs to incorporate
statistical concepts and experiences with statistical software. Thus, when building the questions
for our project, we spent a good amount of time to develop conceptual questions to make sure
that students would get the most important concepts in those topics. The important issue was to
ensure that every major topic would be covered in a reasonable portion of our database of
problems. (Example questions: questions 4,5,18 in Appendix A.1; questions 1,2,3 and 15 in
Appendix A.2)
Of course, computational questions were also included. The goal of these computational
questions was to help students develop computational skills using statistical concepts they had
learned in class. The problems we designed asked students to apply their computational skills
using both basic and simple tools such as scientific calculators (examples: questions 6 and 14 in
Appendix A.2) and sophisticated tools like statistical software applications (examples: questions
6 and 7 in Appendix A.1).
Another important group of questions we designed was interpretation questions. As noted
in Gelman and Nolan (2002), a good statistics course needs to help students acquire the ability to
interpret statistical results in real life contexts. Thus, we spent time designing questions
specifically asking students for meaningful interpretations. (Examples: questions 14 and 17 in
Appendix A.1; question 18 in Appendix A.2).
3.1.2 Types of questions
Newbel and Canon (1989) and Trigger (1992) discuss extensively various questions types.
Based on their research, it appears clearly that multiple choice questions would be the most
suitable question type for conceptual and interpretation questions, as this type of question has
32
some major advantages on checking students’ understanding of the material compared to other
types of questions. These advantages include the ability to test a wide variety of topics in a single
homework set, the ability to make students realize the most important components of a single
concept and the ability to utilize WeBWorK’s automatic grading feature. Therefore, multiple
choice questions were our choice for conceptual questions and also questions involving
interpretations. (Examples: questions 1,2,8,9 in Appendix A.1; questions 1,2,3,4,5 in Appendix
A.2)
In addition, based on their research, we realized that multiple choice questions, though
effectively testing students’ understanding of the concepts, would not be as useful in testing and
helping students learn computational skills. The reason was that multiple choice questions
already gave a student a set of answer options; thus, a student might guess or figure out the
correct answer without going through computational steps. Therefore, we chose the short answer
question type for computational problems, as this type of question asked the students to go
through all the computational steps and figure out their own answers for the problems while still
retaining the ability to apply the automatic grading feature of WeBWorK. (Examples of this type
of question: questions 6,7 in Appendix A.1; questions 8 and 11 in Appendix A.2)
3.1.3 Question set up
Vatterott (2002) showed that it would be better to break down a question into multiple parts
than to assign a set of questions that only ask for final answers. He noted that in this way,
students would be more interested in finishing entire questions, as the students could use the
previous parts they had already done as a hint for the next part. Moreover, when the problems
were set up in this way, the material presented to the students would be more coherent and
33
correlated, as the students could see the relationship between different concepts and topics as
they went from one part of the question to another. Thus, we also broke down some
computational questions into multiple parts to take advantage of this finding. (Examples:
questions 6 and 7 in Appendix A.1; questions 12 and 19 in Appendix A.2)
3.1.4 List of topics
After obtaining a list of characteristics of good homework questions, we started developing
homework questions for the course. The first step was to review the materials and topics covered
in the topics simple and multiple linear regression to identify key areas and knowledge that a
student needed to acquire from those topics. This step was extremely important; if we missed any
important material, the students would not have enough practice on that specific material, which
might result in the lack of understanding on that specific material. Thus, to make our homework
questions effective for the students, care was taken to make sure no material of those topics
would be left out.
Through a careful process of reviewing the textbook and consulting our advisor, Professor
Petruccelli, we came up with the following list of topics.
For simple linear regression, the key topics are: association and Pearson correlations, the
simple linear regression model, least squares estimators, sum of squared errors, the coefficient of
determination, estimation and inference from the simple linear regression model, and one-way
and two-way tables.1
1 One-way and two-way tables are usually not considered topics in simple linear regression in
most textbooks. However, we put these topics into the simple linear regression since they
concern with the relationship between two variables, which is also the concern for simple linear
regression.
34
For multiple linear regression, the key topics are: the multiple linear regression model,
interpreting the model, the principle of parsimony, the coefficient of multiple determination and
adjusted coefficient of multiple determination, analysis of variance, the overall F test, the
individual t test, and multicollinearity.
3.1.5 Designing the questions
After we had a completed list of materials we needed to cover for those topics, we started
developing the homework questions. Our questions were written in such a way that they were
carefully checked to meet all the characteristics of good questions we had found from our
research. We built our questions in the order of topics covered in simple and multiple linear
regression in the textbook; this means that we focused on building questions for one specific
topic and then moving on to the next topic. In this manner, we believed we developed more
effective questions while making sure we did not skip any important concept or topic.
3.1.6 Consultation
Since we were very new to developing homework questions, it was important to learn from
experiences of others, who had developed questions for the topics covered in simple and linear
regression. The first resource we consulted was an online library of WeBWorK questions called
the National Problem Library (NPL). This library is a collection of many WeBWorK problems
developed by professors at many higher educational institutions, including the University of
Rochester and Arizona State University. This library contains questions and problems in many
subjects, including statistics. To use this library, we looked at the portion of the library about
statistics, downloading the questions related to the topics covered in simple and multiple linear
35
regression. Then we downloaded questions that met our criteria and used them as a reference
when we wrote our own questions.
When developing our set of questions and problems for the course, we also consulted many
textbooks that cover the topics offered in the course, especially the textbook used in the course.
This was important because the problems introduced in the textbooks would be very close to the
materials covered in the course, thus helping the students in reviewing the materials covered in
the course.
Since our advisor, Professor Petruccelli, had used WeBWorK for this course before, he
already had a collection of questions and problems designed specifically for this course. Thus,
we also used his collection as an important reference resource and sought his advice when
writing our own problems.
3.2 Programming and uploading the problems
In order to create questions in WeBWorK, we had to learn about the programming languages
used in WeBWork. WeBWork uses a Problem Generation (PG) language which allows the
inclusion of both Perl and LaTeX code. Therefore we had to fully understand how to program
using those languages before creating any WeBWork homework sets.
LaTeX is used by WeBWorK to display equations in the problems. There were many
resources online that gave information on how to program using LaTeX. However we only
needed LaTeX for displaying mathematical expressions, so the research and study for the
language was just to learn enough for inputting an equation so that the equation could be visible.
We learned how to use LaTeX from the UCLA Academic Technology Services website.
36
The Perl language is used by WeBWorK to perform calculations and evaluate student
answers in PG. Therefore, understanding this language was very important so no error in the
calculation would be made and we could also increase the capability on what we could do on the
questions. This information was learned from The Perl Programming Language website
(www.perl.org).
After researching and studying these two base languages, we started writing our
WeBWorK questions. We consulted a number of sources. The MAA (Mathematical Association
of America) website (www.maa.org) provided a number of problem templates and sample
techniques. We also looked at some of the techniques that Professor Petruccelli had used for his
homework sets in the previous courses. When constructing our problems, we used a test facility
called PGLabs. This facility allowed us to test the code before inputting it into the homework set.
Once we finished testing with the code, we inputted it into one of the blank problems in the
problem set.
Finally, we tested each problem to make sure that the answers were correct. For some
problems we used randomly-generated data to give each student a unique data set. We tested
these problems with several different random number seeds.
We encountered some difficulties in coding questions. For example, some questions with
short multiple word answers did not work well because there were many ways a student can
input an essentially correct answer. For instance, a student might accidentally press the space bar
twice. This type of question was changed into drop box format, which provides students with a
drop box containing the answer choices.
37
3.3 Test the database
After we finished building the database of problems, we tested the effectiveness of our
problems on the students of the course Applied Statistics II, taught by Professor Petruccelli in D
term 2011. Testing was done during a one hour lab period that accompanied the course. A total
of 105 students were available in four lab periods in each of two successive weeks. The first
week we tested our problems on simple linear regression, and the second week we tested the
multiple linear regression problems. In each lab session, before the lab began, the students were
randomly assigned to two groups: a treatment group and a control group.
The goal of the test was to compare the effectiveness of our problems against the existing
WeBWorK problems. Thus, for each topic, simple linear regression or multiple linear regression,
we formed two sets of WeBWorK problems: one comprising eight problems from our designed
problems (the treatment problems) and the other consisting of eight problems we obtained from
the National Problem Library (NPL) (the control problems). The topics and concepts covered in
the two sets were almost identical to avoid bias. The students, who had already been randomly
assigned to one of the two groups, were asked to take one of the two sets during the lab. One
group would take the set of our problems, while the other group would take the other set. The
students were informed that their performance on those problems would not be counted toward
their grades, but they were encouraged to do their best.
At the beginning of each lab session, all the students were given the same paper-based
pre-test, which consisted of a single problem with multiple parts. The pre-test was made in a way
such that its parts covered most of the important material covered in the topic we were testing
our problems on. The students were given ten minutes to complete the pre-test. During the pre-
38
test, the students were allowed to use supporting material such as calculators or software
applications as some parts of the problem required computation.
After that, the students worked on the WeBWorK problem set of the group they were
randomly assigned to. This served as practice for students, like homework, so students could
have access to any support, including help from the teaching assistant. The students were given
about 25 minutes to practice but they did not have to finish all the problems.
At the end of the lab session, the students were asked to take the post-test, which was
very similar to the pre-test. The goal of the post-test was to determine to what extent student
performance improved after working on the practice WeBWorK problems.
The students’ performances on the pre-test and post-test were recorded and separated
according to the problem sets they had worked on. Then we calculated the means and the
standard deviations of the differences between the pre-test scores and the post-test scores for
each problems set. After that, we conducted hypothesis testing (using t-test for comparing two
independent populations) to see if our problems significantly improved the students’
performances better comparing to the other set of problems.
3.4 Improvements
From the results of the testing, we drew conclusions about the effectiveness of our problems
on simple linear regression and on multiple linear regression. If our questions were not effective,
we tried to figure out the reasons and propose further adjustments to make them more effective.
This task was done by reviewing the literature again to search for ways for improvement, and
consulting our advisor, Professor Petruccelli.
39
4. Results and Discussion
4.1 Results
As stated in the methodology section, we successfully designed two WeBWorK sets, one
having 24 problems for the topic simple linear regression and the other having 22 questions for
the topic multiple linear regression. Screen shots of these questions are provided in Appendices
A.1 (simple linear regression) and A.2 (multiple regression). The pg code for these questions is
included in a supplementary file archived with this report.
After we finished designing these problems, we tested our problems on the students in the
course Applied Statistics II, offered in D term, 2011. The problems selected to test for our
problems were 1, 2, 3, 10, 13, 14, 15, and 17 for simple linear regression and 1, 3, 5, 8, 11,
12(parts a, b, c), 17, and 18 for multiple linear regression. The procedure for the test was discussed in
the methodology section. The screenshots of problems for the control set for simple linear
regression are provided in Appendix A5 and for multiple linear regression in Appendix A6. The
results of the test are provided below.
4.2 Simple Linear Regression After recording the scores for all the students on both the pretest and the posttest, we first
separated them according to which set of WeBWorK problems they took during the lab, either
the treatment set or the control set. After that, we proceeded by finding the difference between
the pretest score and the posttest score for each student. Note that this difference measures the
improvement in score between the pre and posttest. When doing so, we discarded the data from
the students who had not completed either the pretest or the posttest or both. For simple linear
regression, 49 students in the treatment group and 51 students in the control group actually
participated in the test. From those, we obtained 24 complete values for the treatment set and 29
40
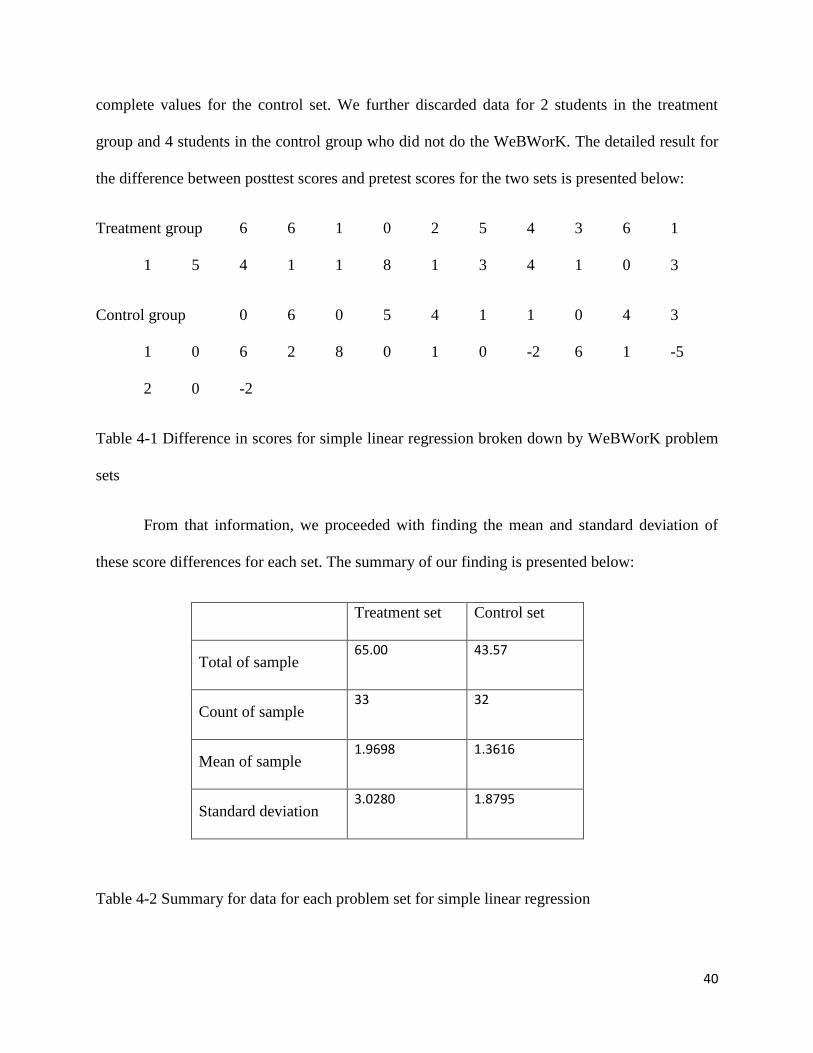
complete values for the control set. We further discarded data for 2 students in the treatment
group and 4 students in the control group who did not do the WeBWorK. The detailed result for
the difference between posttest scores and pretest scores for the two sets is presented below:
Treatment group 6 6 1 0 2 5 4 3 6 1
1 5 4 1 1 8 1 3 4 1 0 3
Control group 0 6 0 5 4 1 1 0 4 3
1 0 6 2 8 0 1 0 -2 6 1 -5
2 0 -2
Table 4-1 Difference in scores for simple linear regression broken down by WeBWorK problem
sets
From that information, we proceeded with finding the mean and standard deviation of
these score differences for each set. The summary of our finding is presented below:
Treatment set Control set
Total of sample 65.00 43.57
Count of sample 33 32
Mean of sample 1.9698 1.3616
Standard deviation 3.0280 1.8795
Table 4-2 Summary for data for each problem set for simple linear regression
41
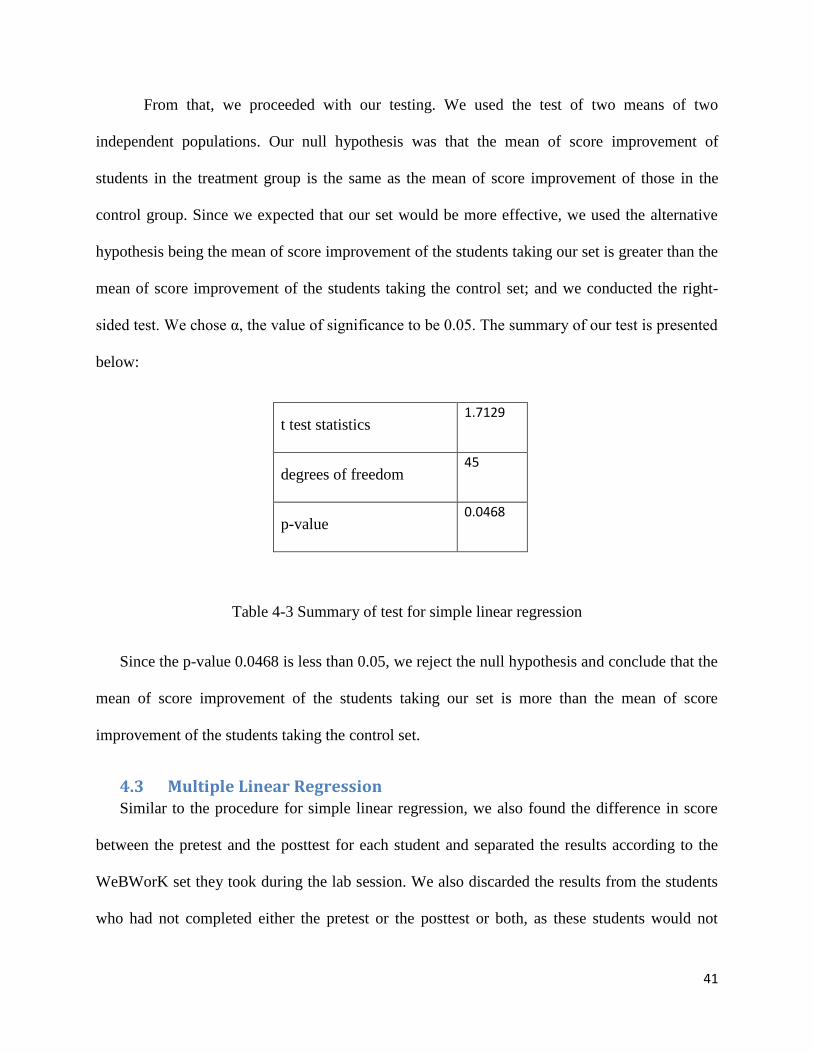
From that, we proceeded with our testing. We used the test of two means of two
independent populations. Our null hypothesis was that the mean of score improvement of
students in the treatment group is the same as the mean of score improvement of those in the
control group. Since we expected that our set would be more effective, we used the alternative
hypothesis being the mean of score improvement of the students taking our set is greater than the
mean of score improvement of the students taking the control set; and we conducted the right-
sided test. We chose α, the value of significance to be 0.05. The summary of our test is presented
below:
t test statistics 1.7129
degrees of freedom 45
p-value 0.0468
Table 4-3 Summary of test for simple linear regression
Since the p-value 0.0468 is less than 0.05, we reject the null hypothesis and conclude that the
mean of score improvement of the students taking our set is more than the mean of score
improvement of the students taking the control set.
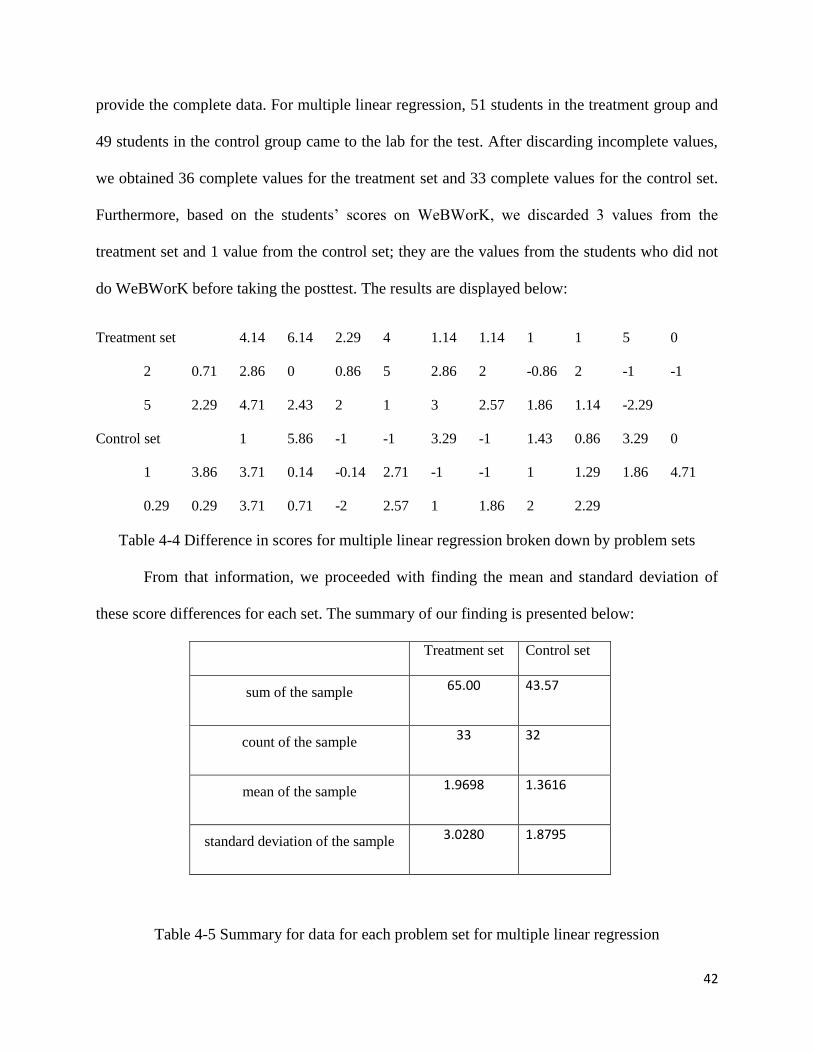
4.3 Multiple Linear Regression Similar to the procedure for simple linear regression, we also found the difference in score
between the pretest and the posttest for each student and separated the results according to the
WeBWorK set they took during the lab session. We also discarded the results from the students
who had not completed either the pretest or the posttest or both, as these students would not
42
provide the complete data. For multiple linear regression, 51 students in the treatment group and
49 students in the control group came to the lab for the test. After discarding incomplete values,
we obtained 36 complete values for the treatment set and 33 complete values for the control set.
Furthermore, based on the students’ scores on WeBWorK, we discarded 3 values from the
treatment set and 1 value from the control set; they are the values from the students who did not
do WeBWorK before taking the posttest. The results are displayed below:
Treatment set 4.14 6.14 2.29 4 1.14 1.14 1 1 5 0
2 0.71 2.86 0 0.86 5 2.86 2 -0.86 2 -1 -1
5 2.29 4.71 2.43 2 1 3 2.57 1.86 1.14 -2.29
Control set 1 5.86 -1 -1 3.29 -1 1.43 0.86 3.29 0
1 3.86 3.71 0.14 -0.14 2.71 -1 -1 1 1.29 1.86 4.71
0.29 0.29 3.71 0.71 -2 2.57 1 1.86 2 2.29
Table 4-4 Difference in scores for multiple linear regression broken down by problem sets
From that information, we proceeded with finding the mean and standard deviation of
these score differences for each set. The summary of our finding is presented below:
Treatment set Control set
sum of the sample 65.00 43.57
count of the sample 33 32
mean of the sample 1.9698 1.3616
standard deviation of the sample 3.0280 1.8795
Table 4-5 Summary for data for each problem set for multiple linear regression
43
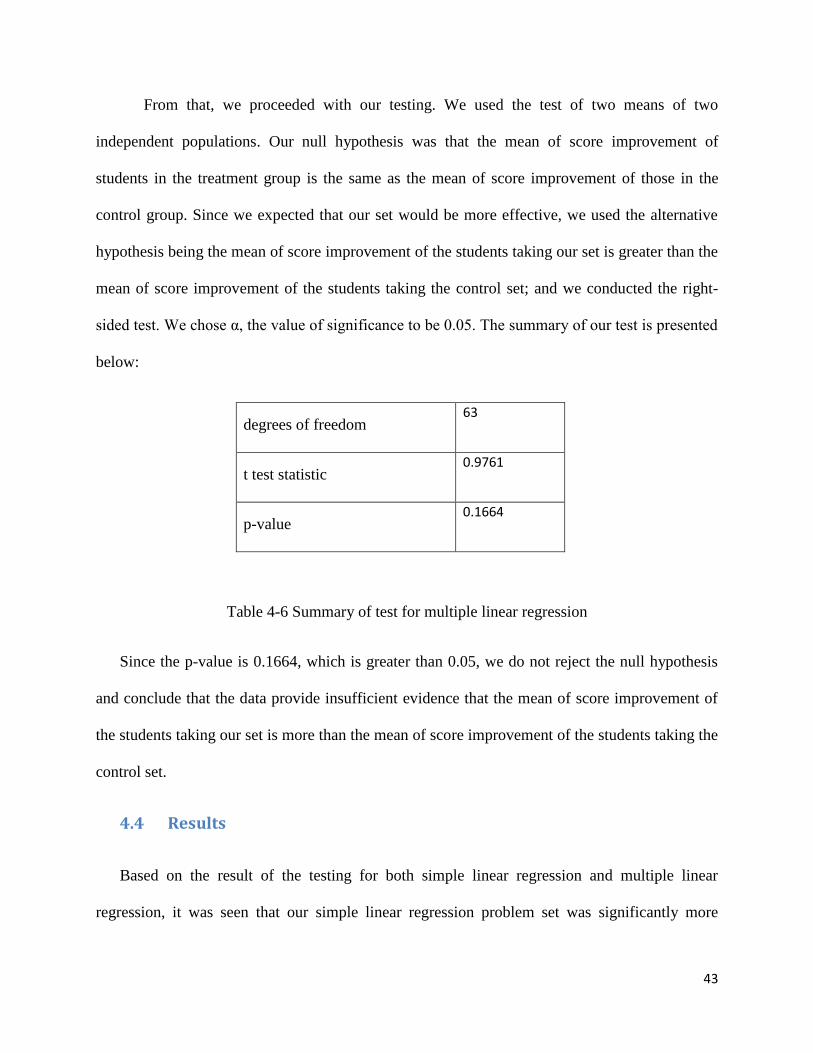
From that, we proceeded with our testing. We used the test of two means of two
independent populations. Our null hypothesis was that the mean of score improvement of
students in the treatment group is the same as the mean of score improvement of those in the
control group. Since we expected that our set would be more effective, we used the alternative
hypothesis being the mean of score improvement of the students taking our set is greater than the
mean of score improvement of the students taking the control set; and we conducted the right-
sided test. We chose α, the value of significance to be 0.05. The summary of our test is presented
below:
degrees of freedom 63
t test statistic 0.9761
p-value 0.1664
Table 4-6 Summary of test for multiple linear regression
Since the p-value is 0.1664, which is greater than 0.05, we do not reject the null hypothesis
and conclude that the data provide insufficient evidence that the mean of score improvement of
the students taking our set is more than the mean of score improvement of the students taking the
control set.
4.4 Results
Based on the result of the testing for both simple linear regression and multiple linear
regression, it was seen that our simple linear regression problem set was significantly more
44
effective than the control set in improving students’ scores while the multiple linear regression
set was not significantly more effective than the control set.
4.5 Discussion of the testing Since our tests were only conducted on students taking the course Applied Statistics II
offered in D term, 2011, care must be taken when extending the results to other groups of
students. For example, students at Worcester Polytechnic Institute usually possess a good
mathematical and computational background, suggesting that the results might be different for
other groups of students who do not possess the same level of background.
Moreover, since the control set was chosen by us from the National Problem Library, bias
might have arisen although we had tried our best to choose the problems that were closely
matched our problems in term of level of difficulty and topics covered. To avoid such bias, we
had spent time to choose the most appropriate problems, and spent time working on those
problems to make sure these problems would match our problems well. However, bias still could
arise. For example, some of the students tested in the simple linear regression experiment told us
that the control problems for simple linear regression seemed to require more computational
efforts than did the treatment problems, making it more difficult for the students to go through
the whole problem set. To estimate the significance of this bias, we looked at the scores of the
students on the WeBWorK problems given during the experiments. Below is the summary of the
WeBWorK scores:
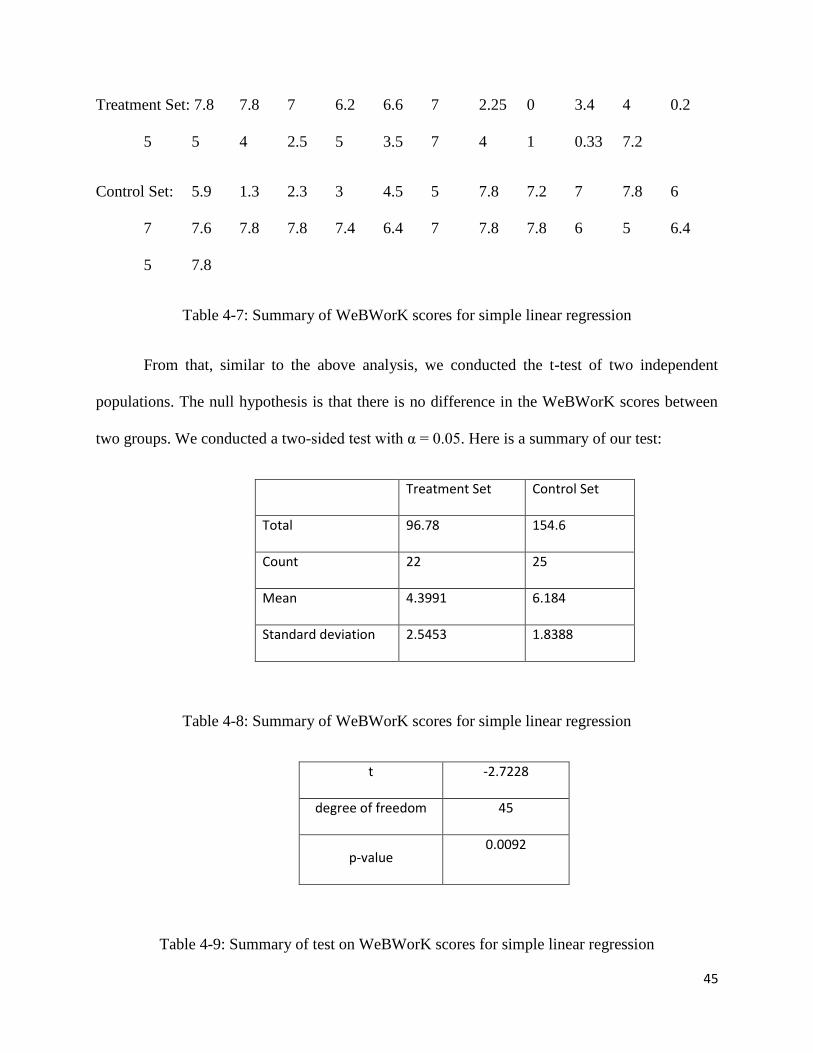
45
Treatment Set: 7.8 7.8 7 6.2 6.6 7 2.25 0 3.4 4 0.2
5 5 4 2.5 5 3.5 7 4 1 0.33 7.2
Control Set: 5.9 1.3 2.3 3 4.5 5 7.8 7.2 7 7.8 6
7 7.6 7.8 7.8 7.4 6.4 7 7.8 7.8 6 5 6.4
5 7.8
Table 4-7: Summary of WeBWorK scores for simple linear regression
From that, similar to the above analysis, we conducted the t-test of two independent
populations. The null hypothesis is that there is no difference in the WeBWorK scores between
two groups. We conducted a two-sided test with α = 0.05. Here is a summary of our test:
Treatment Set Control Set
Total 96.78 154.6
Count 22 25
Mean 4.3991 6.184
Standard deviation 2.5453 1.8388
Table 4-8: Summary of WeBWorK scores for simple linear regression
t -2.7228
degree of freedom 45
p-value 0.0092
Table 4-9: Summary of test on WeBWorK scores for simple linear regression
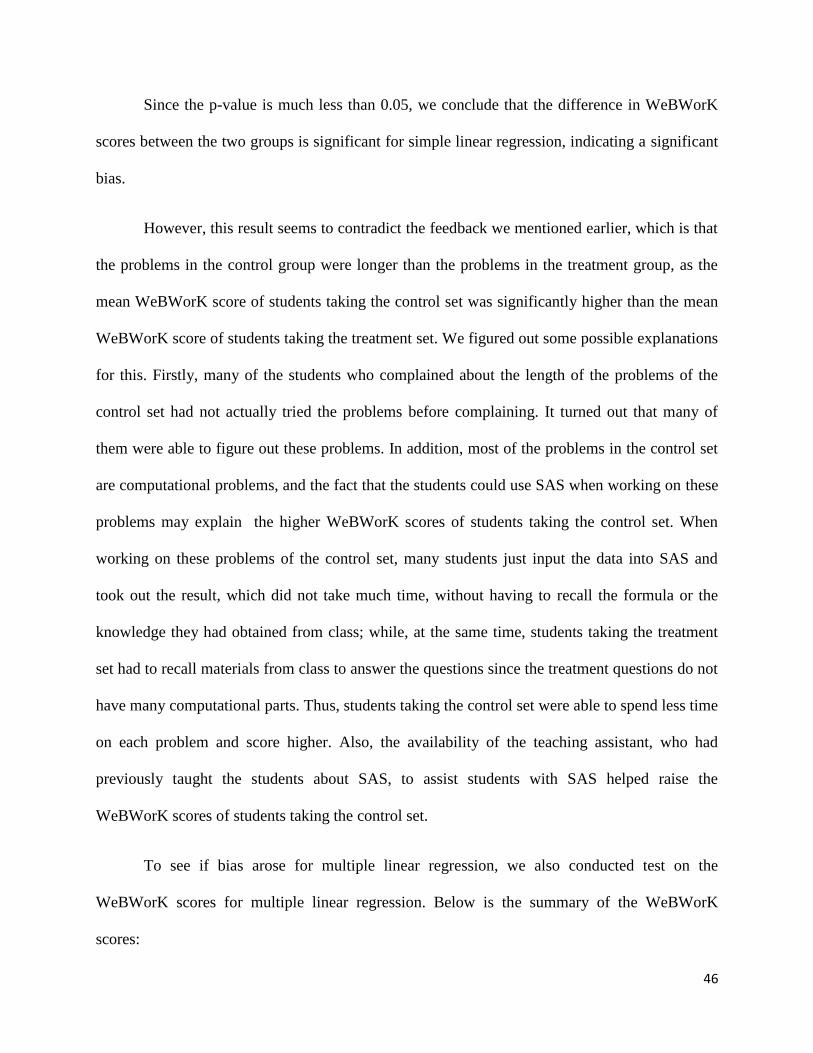
46
Since the p-value is much less than 0.05, we conclude that the difference in WeBWorK
scores between the two groups is significant for simple linear regression, indicating a significant
bias.
However, this result seems to contradict the feedback we mentioned earlier, which is that
the problems in the control group were longer than the problems in the treatment group, as the
mean WeBWorK score of students taking the control set was significantly higher than the mean
WeBWorK score of students taking the treatment set. We figured out some possible explanations
for this. Firstly, many of the students who complained about the length of the problems of the
control set had not actually tried the problems before complaining. It turned out that many of
them were able to figure out these problems. In addition, most of the problems in the control set
are computational problems, and the fact that the students could use SAS when working on these
problems may explain the higher WeBWorK scores of students taking the control set. When
working on these problems of the control set, many students just input the data into SAS and
took out the result, which did not take much time, without having to recall the formula or the
knowledge they had obtained from class; while, at the same time, students taking the treatment
set had to recall materials from class to answer the questions since the treatment questions do not
have many computational parts. Thus, students taking the control set were able to spend less time
on each problem and score higher. Also, the availability of the teaching assistant, who had
previously taught the students about SAS, to assist students with SAS helped raise the
WeBWorK scores of students taking the control set.
To see if bias arose for multiple linear regression, we also conducted test on the
WeBWorK scores for multiple linear regression. Below is the summary of the WeBWorK
scores:
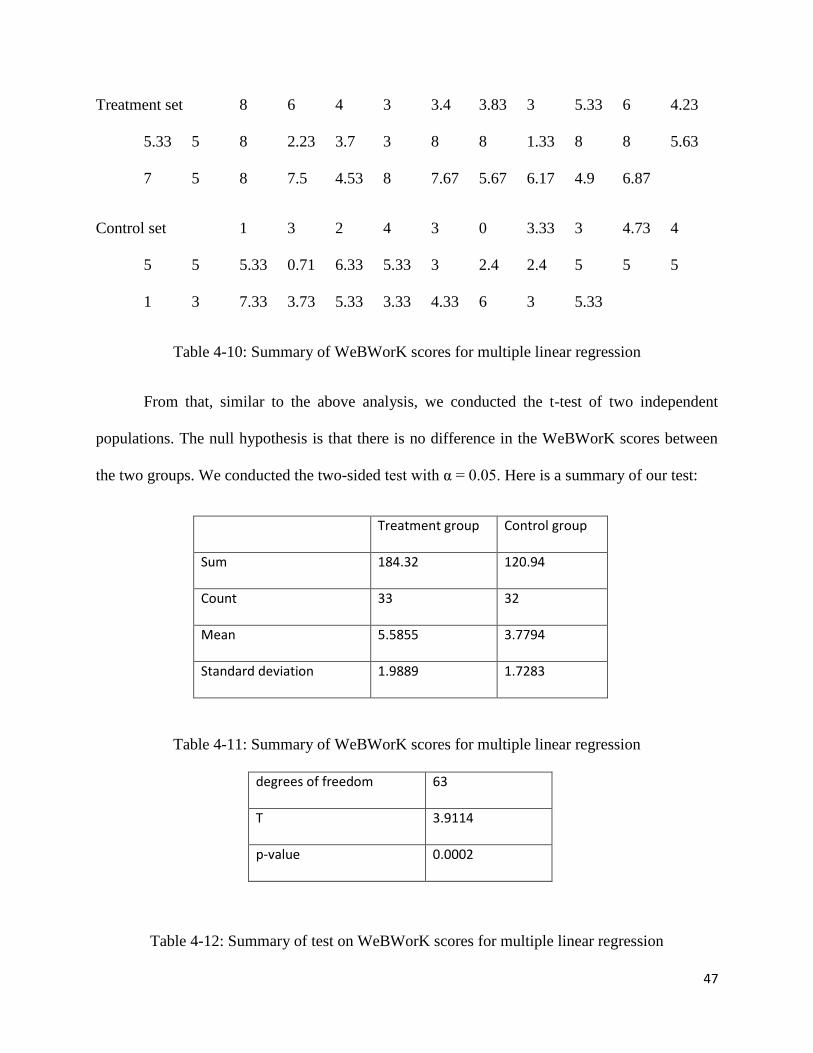
47
Treatment set 8 6 4 3 3.4 3.83 3 5.33 6 4.23
5.33 5 8 2.23 3.7 3 8 8 1.33 8 8 5.63
7 5 8 7.5 4.53 8 7.67 5.67 6.17 4.9 6.87
Control set 1 3 2 4 3 0 3.33 3 4.73 4
5 5 5.33 0.71 6.33 5.33 3 2.4 2.4 5 5 5
1 3 7.33 3.73 5.33 3.33 4.33 6 3 5.33
Table 4-10: Summary of WeBWorK scores for multiple linear regression
From that, similar to the above analysis, we conducted the t-test of two independent
populations. The null hypothesis is that there is no difference in the WeBWorK scores between
the two groups. We conducted the two-sided test with α = 0.05. Here is a summary of our test:
Treatment group Control group
Sum 184.32 120.94
Count 33 32
Mean 5.5855 3.7794
Standard deviation 1.9889 1.7283
Table 4-11: Summary of WeBWorK scores for multiple linear regression
degrees of freedom 63
T 3.9114
p-value 0.0002
Table 4-12: Summary of test on WeBWorK scores for multiple linear regression
48
From our analysis, we see that the p-value was much less than 0.05. Thus, we conclude
that the difference in WeBWorK scores between two groups is significant in this case. Therefore,
bias might have arisen from our selection of the control group.
The result above is the reverse of the result of the simple linear regression case. In this
case, the mean WeBWorK score of students taking the treatment set is significantly higher than
the mean WeBWorK scores of students taking the control set. There are some possible
explanations for this result. Firstly, most of the WeBWorK questions in both sets do not require
or only require minimal computation; thus the students did not use SAS at all. Therefore, the
problem from the assistance of SAS that had occurred in the simple linear regression case did not
occur here. In addition, some questions in the control set contain many parts, thus requiring
students taking the control set to spend more time than the students taking the treatment set.
From our discussion above, it is clear that the WeBWorK problems in the treatment set
and the control set are not similar in term of length, difficulty, and type of question. This is a bias
that might have significant effects on our results. Thus, when our results are used, it is strongly
recommended that care needs to be taken to make sure such bias is addressed.
Another problem with the test occurred in the test for simple linear regression. We
received feedback from the students that both the pretest and posttest were too long for many of
them so they could only get to some parts of those. It was a problem since it means the students
could not get to all the topics we wanted to test. Therefore, when testing for multiple linear
regression, we designed more plausible pretest and posttest; as a result, most students went
through all parts of our pretest and posttest.
49
4.6 Other observations
When conducting our tests, we also spent time observing how students worked on our
problems and received feedback from the students. One feedback was that the tolerance for
accuracy we set up made some difficulty for the students, especially when they tried to input
answers obtained from statistical software applications like SAS. Thus, we had to go back and
adjusted the tolerance for accuracy for some computational problems.
Another feedback we received was that the wording seemed confusing for some students.
However, since this only occurred for a small number of students, we did not change the
wording.
50
5. Conclusions and Recommendations
Throughout this project, we have carried out necessary steps to achieve our goal, building an
effective set of WeBWorK problems for simple and multiple linear regression. The first step of
our project was to review the literature related to the project to set up criteria for effective
WeBWorK problems. These criteria concern mostly with the type of questions and the setup of
questions. After obtaining the set of criteria, we proceeded with obtaining a list of topics we
needed to cover for these two subjects while, at the same time, got used to the programming
techniques used to program problems in WeBWorK. Then we proceeded by designing our
problems for simple and multiple linear regression based on the criteria we have found and also
on the suggestions we got from our advisor, Professor Petruccelli.
The result of our design process is a set of 24 WeBWorK problems for simple linear
regression and another set of 22 WeBWorK problems for multiple linear regression. The
screenshots of these problems are presented in Appendices A1 and A2. To measure the
effectiveness of our problems, we tested our problems with the students in the class MA2612
taught by our advisor Professor Petruccelli, offered in D term 2011. We tested our problems
against a set of existing WeBWork problems on the same topics developed by other institutions.
The goal of the test was to measure which WeBWorK set improved students’ performance
better. The result of the test showed that our set of WeBWorK problems for simple linear
regression was significantly more effective than the set of existing WeBWorK problems; while
for multiple linear regression, there was no significant difference between our set and the set of
existing problems.
51
However, bias occurred in our test that might affect these results. It turned out from our analysis
that the existing WeBWorK problems we selected to be our control were not completely similar
to our problems in term of difficulty, length and type of question. Moreover, when testing our
problems for simple linear regression, the pretest and posttest, which were used to measure
students’ performance before and after taking WeBWorK problems, were too long for many
students to go through all the topics tested, potentially biasing the results of the test.
Another problem was that we only tested our problems on students in the course MA 2612 at
WPI, which is a very limited group. The results might be different if the test of our problems was
conducted on other groups of students. Thus, care needs to be taken when extending the results
to other groups of students.
Although the statistical tests on our problems contain bias and are not enough to support the
effectiveness of our WeBWorK problems, we still recommend the use of our problems for
courses at Worcester Polytechnic Institute that cover the topics of simple and multiple linear
regression. There are some reasons for this recommendation. Firstly, we went through a lot of
literature that provides useful criteria for effective online homework problems and we have built
our problems based on these criteria. Secondly, we believe that we have covered most of the
important topics of simple and multiple linear regression; thus our problems will provide a
complete practice for students in any course covering simple and multiple linear regression. In
addition, we are also encouraged by the positive feedback from the students on our problems, as
during the test most students taking our problems liked our problems and said they learned
something from them. However, since the effectiveness of our problems could not be determined
completely from the test as the test contains bias, care should be taken when our problems are
used. We encourage applying any actions that may make our problems more effective.

52
Since our problems cover the most popular topics in simple and multiple linear regression,
we also recommend the use of our WeBWorK problems in classes covering these topics outside
Worcester Polytechnic Institute. However, since we only tested our problems on the students at
Worcester Polytechnic Institute, we recommend instructors to be cautious regarding the
difficulty level and the materials covered in each problem to make sure that the problems are
suitable and will benefit the students.
Since the tests of the effectiveness of our problems may contain some bias, the results
obtained from the tests may not be completely valid. Thus, to better measure of the effectiveness
of our problems, we recommend more tests on our problems. We recommend the same
procedures we carried out for our test, but with a more diversified group of students and a better
selection of the control set such that the problems tested and the problems in the control set are
equivalent. However, if possible, we recommend a test in which students’ performance could be
measured through a real exam environment and students take our WeBWorK problems and the
control problems in the form of homework. We believe this testing procedure result will
accurately show the effectiveness of our problems as homework problems.
53
Bibliography
Advantages And Disadvantages Of Homework | Tutorvista.com. (n.d.). Tutorvista.com - Online
Tutoring, Homework Help for Math, Science, English from Best Online Tutor. Retrieved
November 16, 2010, from http://www.tutorvista.com/physics/advantages-and-disadvantages-of-
homework
Bonham, S., Beichner, R., & Deardorff, D. (2001). Online Homework: Does it make a
Difference?. The Physics Teacher, 39, 293-296. Retrieved November 3, 2010, from
http://www.ncsu.edu/per/Articles/OnlineHomeworkArticle.pdf
Brand, M. (2008, September 11). Too Much Homework? : NPR. NPR : National Public Radio :
News & Analysis, World, US, Music & Arts : NPR. Retrieved November 5, 2010, from
http://www.npr.org/templates/transcript/transcript.php?storyId=94509873
Bressoud, D. M. (n.d.). WeBWorK. Mathematical Association of America. Retrieved November
8, 2010, from http://www.maa.org/columns/launchings/launchings_04_09.html
Burnham, N. (2008, February 6). hWPI Teaching wit Technology Collaboratory - How Online
Homework Reduces the Grading Load and Improves Instructor Feedback. Worcester Polytechnic
Institute (WPI). Retrieved November 16, 2010, from
http://www.wpi.edu/Academics/ATC/Collaboratory/Stories/burnham.html
54
Cooper, H. (1994). Homework Research and Policy: A Review of the Literature.
Research/Practice, 2(2). Retrieved November 16, 2010, from
http://www.cehd.umn.edu/carei/reports/Rpractice/Summer94/homework.html
Dedic, H., Rosenfield, S., & Ivanov, I. Just Computer Aided Instruction Is Not Enough:
Combining WeBWorK with In-Class Interactive Sessions Increases Achievement and
Perseverance of Social Science Calculus Students. Retrieved November 8, 2010, from
http://sun4.vaniercollege.qc.ca/PA-2005-
008/Pedagogie_Collegiale_Article_Dedic_Rosenfield_Ivanov.pdf
Denny, J., & Yackel, C. (2005). Implementing and Teaching with WebWork at Mercer
University. ASCUE Conference,, 1, 85-93.
Dillard-Eggers, J., Wooten, T., Childs, B., & Coker, J. (2008). Evidence On The Effectiveness.
College Teaching Methods & Styles Journal, 4(5), 9-16. Retrieved November 4, 2010, from
http://www.cluteinstitute-onlinejournals.com/PDFs/903.pdf
Doorn, D., Janssen, S., & O'Brien, M. (2010). Student Attitudes and Approaches to Online
Homework. International Journal for the Scholarship of Teaching and Learning, 4(1), 1-19.
Retrieved November 3, 2010, from
http://academics.georgiasouthern.edu/ijsotl/v4n1/articles/PDFs/Article_DoornJanssenOBrien.pdf
55
Fynewever, H. A Comparison of the Effectiveness of Web-based and Paper-based Homework
for General Chemistry. 1-15. Retrieved November 9, 2010, from
http://homepages.wmich.edu/~hfynewever/T0610114Dec13Revised.pdf
Gage, M. E., & Pizer, A. K. (n.d.). WeBWorK -- Math Homework on the Web. Mathematics
Archives WWW Server. Retrieved November 8, 2010, from
http://archives.math.utk.edu/ICTCM/VOL12/P003/paper.html
Graham, D. (2007, October 19). WeBWorK versus Brownstone EDU and MapleTA. Home |
Duke University. Retrieved November 8, 2010, from
http://www.duke.edu/~dgraham/webwork/WeBWorK-vs-Brownstone.html
Hauk, S., & Safer, A. (2004). Impact of the web-based homework program WeBWorK on
student performance in moderate enrollment college algebra courses. 1, 1. Retrieved November
6, 2010, from http://hopper.unco.edu/faculty/personal/hauk/segalla/WBWquan.pdf
Heffernan, N. T., Razzaq, L., & Mendicino, M. (2009, March 22). A comparison of traditional
homework to computer-supported homework.(Report) | HighBeam Business: Arrive Prepared.
Business information, news, and reports | HighBeam Business: Arrive Prepared. Retrieved
November 8, 2010, from http://business.highbeam.com/619/article-1G1-197722644/comparison-
traditional-homework-computersupported-homework
56
Hodge, A., Richardson, J. C., & York, C. S. (2009). The Impact of a Web-based Homework Tool
in University Algebra Courses on Student Learning and Strategies. MERLOT Journal of Online
Learning and Teaching , 5(4). Retrieved November 7, 2010, from
http://jolt.merlot.org/vol5no4/hodge_1209.pdf
How much do college students really study? – InfoRefuge.com. Info Refuge.
http://www.inforefuge.com/how-much-do-college-students-really-study (accessed December 14,
2010).
Linsin, M. (2010, July 31). A Simple, Effective Homework Plan For Teachers: Part 1 — Smart
Classroom Management. Smart Classroom Management. Retrieved November 5, 2010, from
http://www.smartclassroommanagement.com/2010/07/31/effective-homework-plan-for-teachers-
part-1/
Lucas, A. R. (2010). Using WeBWorK, a Web-Based Homework Delivery and Grading System,
to Help Prepare Students for Peer Instruction. 1, 1. Retrieved November 6, 2010, from
http://www.dillgroup.ucsf.edu/~alucas/webworks-PRIMUS.pdf
McMullen, Steven. "The Impact of Homework Time on Academic Achievement." The
University of North Carolina (2007): 1-38.
57
Jacobsen, M. Multiple Choice Item Construction. Online Presentation. Lecture conducted from
University of Calgary, 45-46.
Newble, D. I., Baxter, A., & Elmslie, R. G. (1979). A comparison of multiple-choice tests and
free-response tests in examinations of clinical competence. Medical Education (pp. 263-268).
Oxford: Blackwell.
Noyes, S. B. (n.d.). The Most Effective Homework: Insight and Ideas from an Expert. Make it
Better. Retrieved November 4, 2010, from www.makeitbetter.net/family/education/24-the-most-
effective-homework
Oak, M. (n.d.). Benefits of Homework. Buzzle Web Portal: Intelligent Life on the Web. Retrieved
November 16, 2010, from http://www.buzzle.com/articles/benefits-of-homework.html
Quilici, J. L., & Mayer, R. E. (1996). Role of Examples in How Students Learn to Categorize
Statistics Word Problems. Journal of Educational Psychology, 88(1), 144-161.
Shrestha, P., Maharjan, A., Wei, X., Razzaq, L., Heffernan, N. T., & Heffernan, C. Are Worked
Examples an Effective Feedback Mechanism During Problem Solving? 1876-1881.
Smolira, J. (2008, November 1). Student perceptions of online homework in introductory finance
courses | Education & Training > Academic Standards & Testing from AllBusiness.com. Small
58
Business Advice and Resources from AllBusiness.com. Retrieved November 5, 2010, from
http://www.allbusiness.com/education-training/academic-standards-testing/12597592-1.html
Stirling, J. (n.d.). English Language Garden Homework Article. English Language Garden
Homepage. Retrieved November 5, 2010, from http://www.elgweb.net/hwk_article.html#types
Stronge, J. H. (2007). Monitoring Student Progress and Potential. Qualities of Effective Teachers
(2 ed., pp. 86-88). Alexandria, VA: Association for Supervision and Curriculum Development.
Vatterott, C. (2008). what Is Effective Homework . Retrieved November 4, 2010, from
http://www.sanjuan.edu/webpages/godabashian/files/What%20Is%20Effective%20Homework.p
df
WebWork, the Math Problem Homework Internet Solution . (2008, September 4). iBridge:
Linking ideas & innovation. Retrieved November 7, 2010, from
www.ibridgenetwork.org/rochester/1-11060-699
Weibel, C. (n.d.). Effectiveness of Rutgers Calculus Formats. Mathematics Department -
Welcome. Retrieved November 10, 2010, from
http://www.math.rutgers.edu/~weibel/studies.html
59
Weibel, Churk and Lew Hirsch (2002). Webwork Effectiveness in Rutgers Calculus. From
http://www.math.rutgers.edu/~weibel/webwork.html
Ziemer, W. K. (0). WeBWorK: An Open-Source Online Homework System. Web-Enabled
Learning Environment, 0, 169-171. Retrieved November 10, 2010, from
http://www.aaas.org/publications/books_reports/CCLI/PDFs/06_WLE_Ziemer.pdf
Advantages and Limitations of Multiple-Choice Items. (n.d.). Techno World Inc - The Best
Technical Encyclopedia Online!. Retrieved December 15, 2010, from
http://www.technoworldinc.com/placement-papers/advantages-and-limitations-of-
multiplechoice-items-t3657.0.html;wap2=
RESTRICTED RESPONSE. (n.d.). Nipissing University. Retrieved December 15, 2010, from
http://www.nipissingu.ca/faculty/peterc/Psyc3205/Essay.htm
Seaman, P. (n.d.). Multiple Choice Testing: Will It Work For Me?. University of New Brunswick
Libraries. Retrieved December 15, 2010, from
http://www.lib.unb.ca/Texts/Teaching/JAN03/seaman.htm
Gelman, A. & Nolan, D. A. (2002). Teaching Statistics: A Bag of Tricks. Oxford University
Press.
60
Newble, D. and Cannon, R. (1989). A Handbook for Teachers in University and Colleges. New
York
Trigwell, K. (1992). Information for UTS staff on Assessment. Sydney
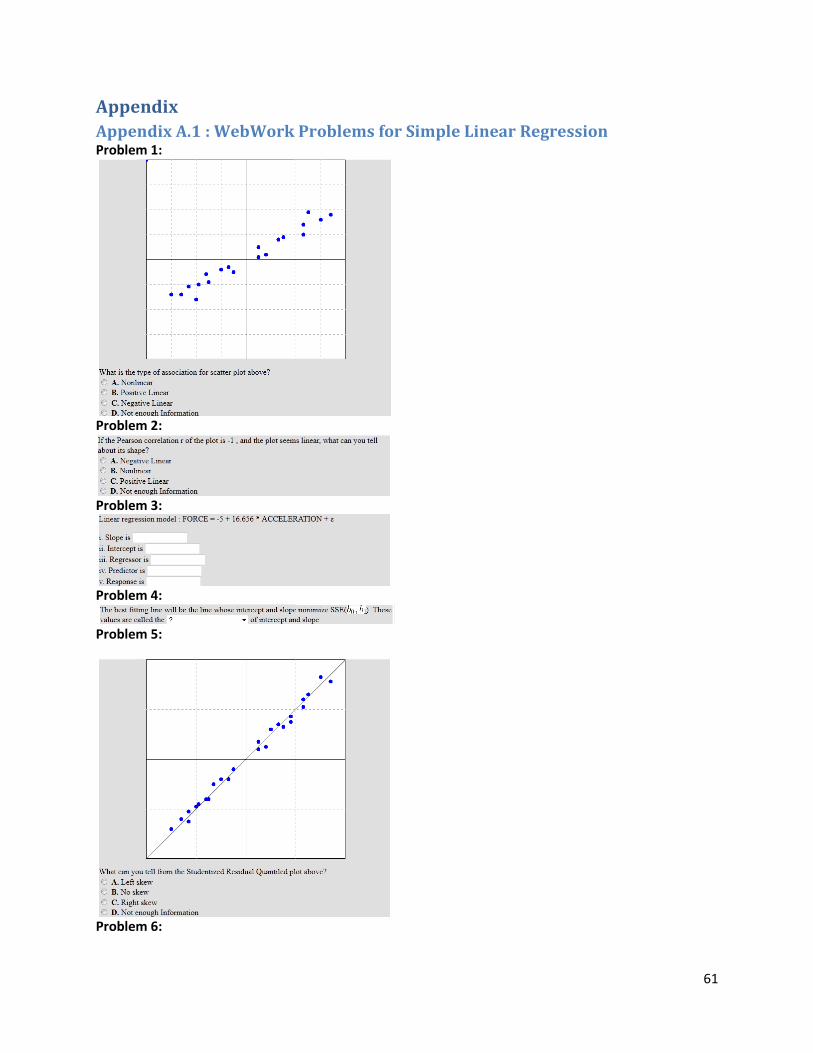
61
Appendix
Appendix A.1 : WebWork Problems for Simple Linear Regression Problem 1:
Problem 2:
Problem 3:
Problem 4:
Problem 5:
Problem 6:
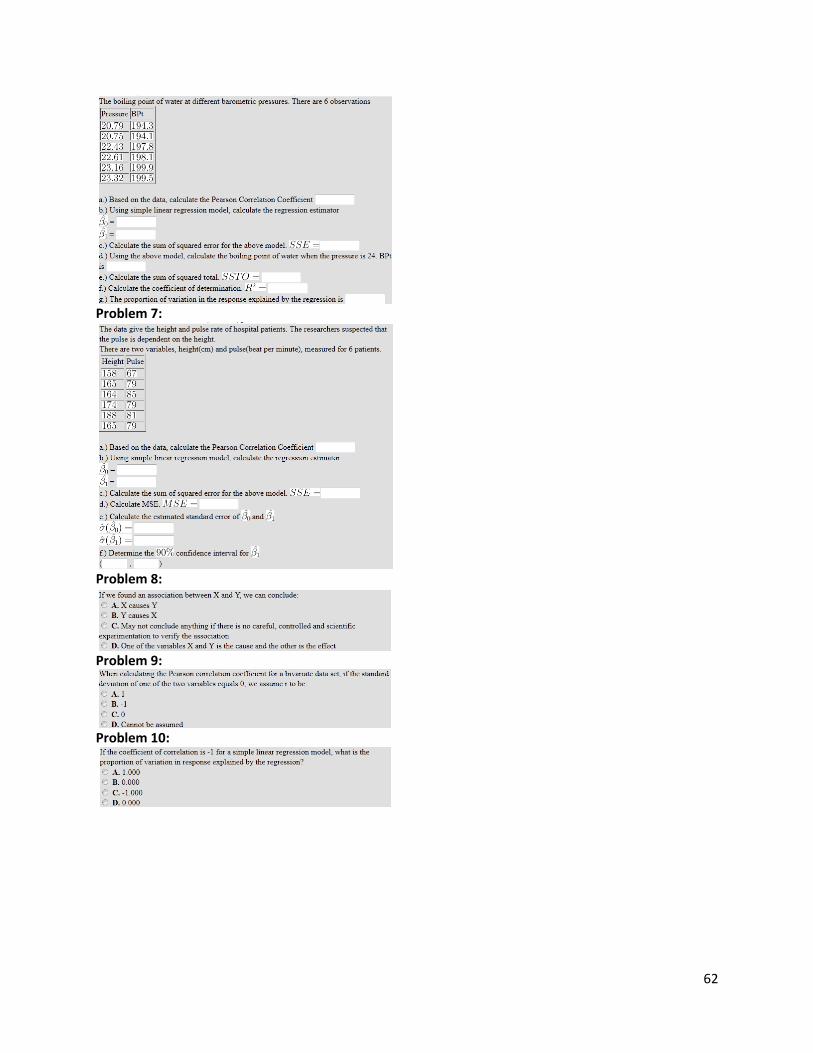
62
Problem 7:
Problem 8:
Problem 9:
Problem 10:
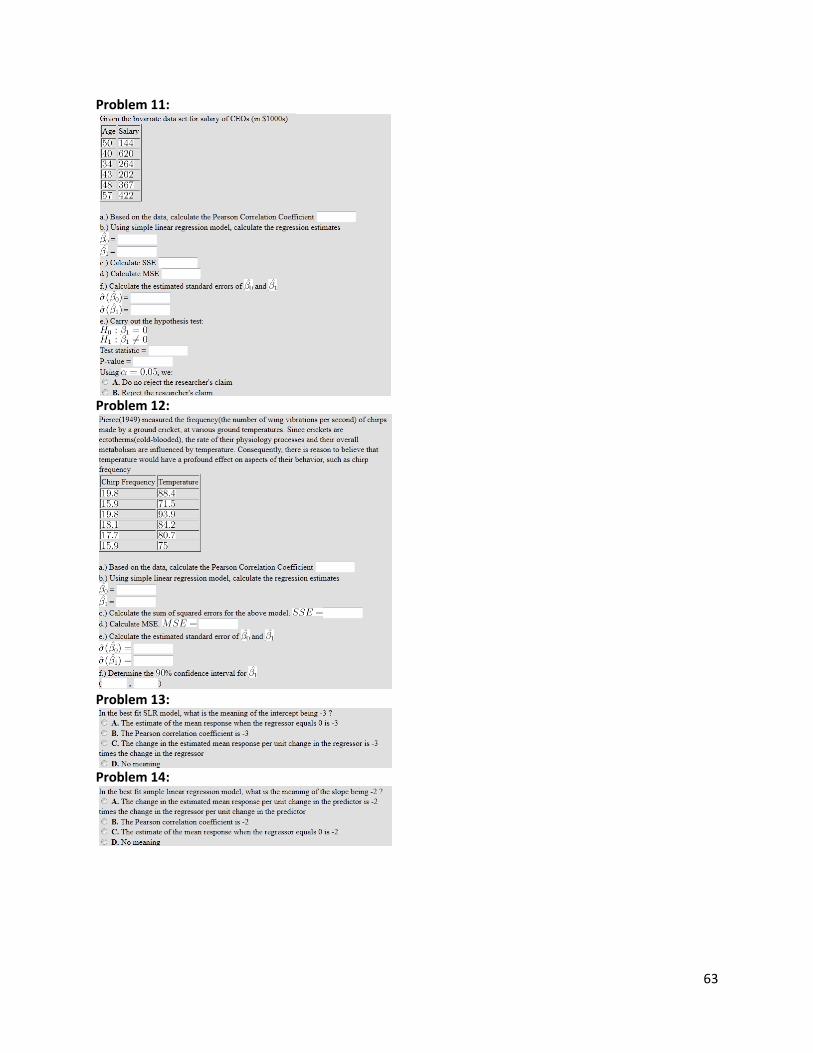
63
Problem 11:
Problem 12:
Problem 13:
Problem 14:
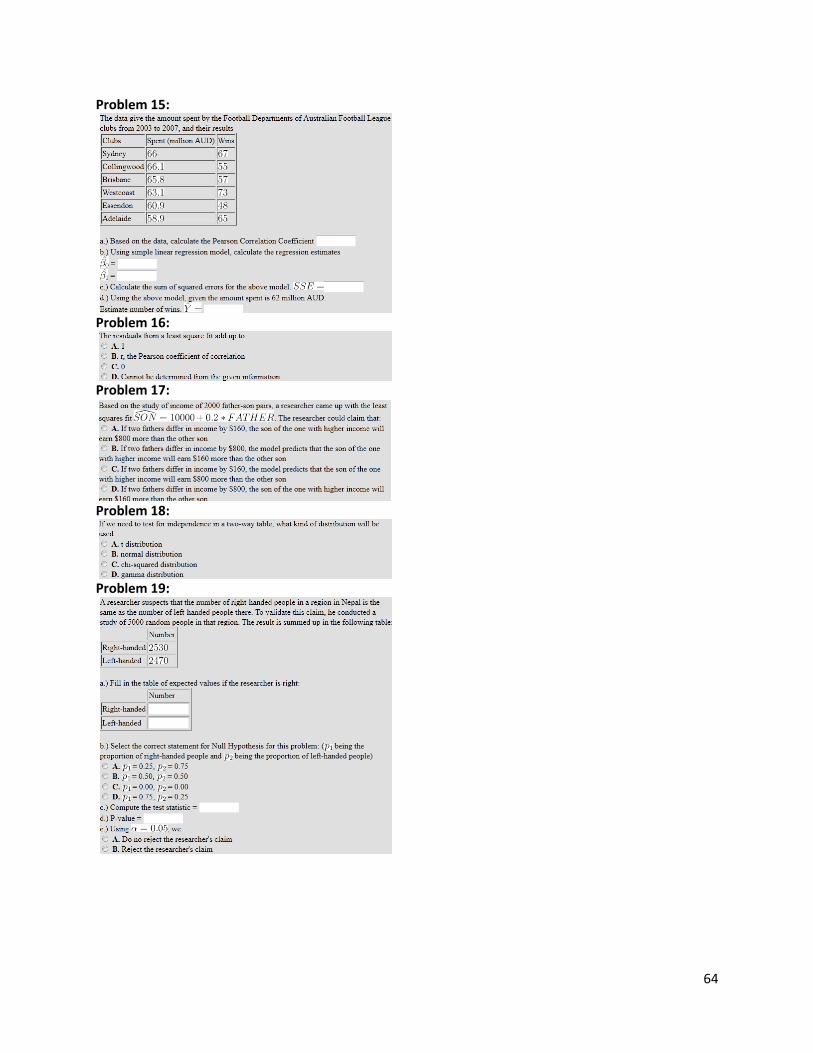
64
Problem 15:
Problem 16:
Problem 17:
Problem 18:
Problem 19:
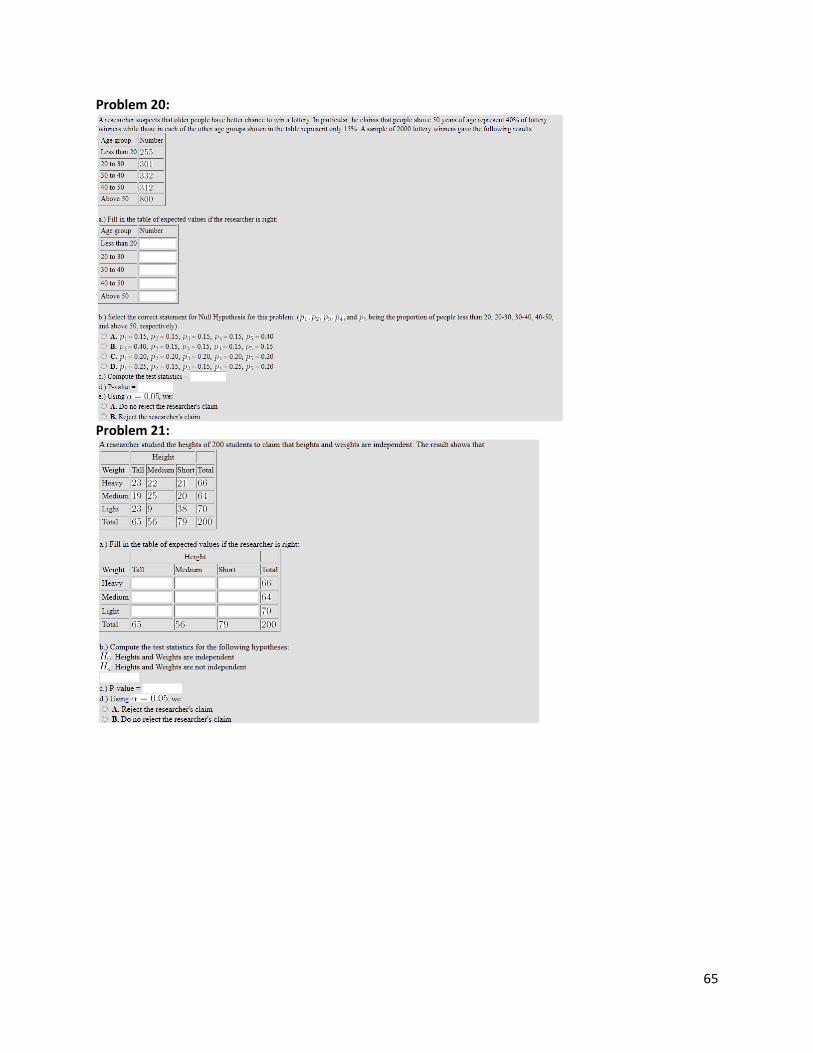
65
Problem 20:
Problem 21:
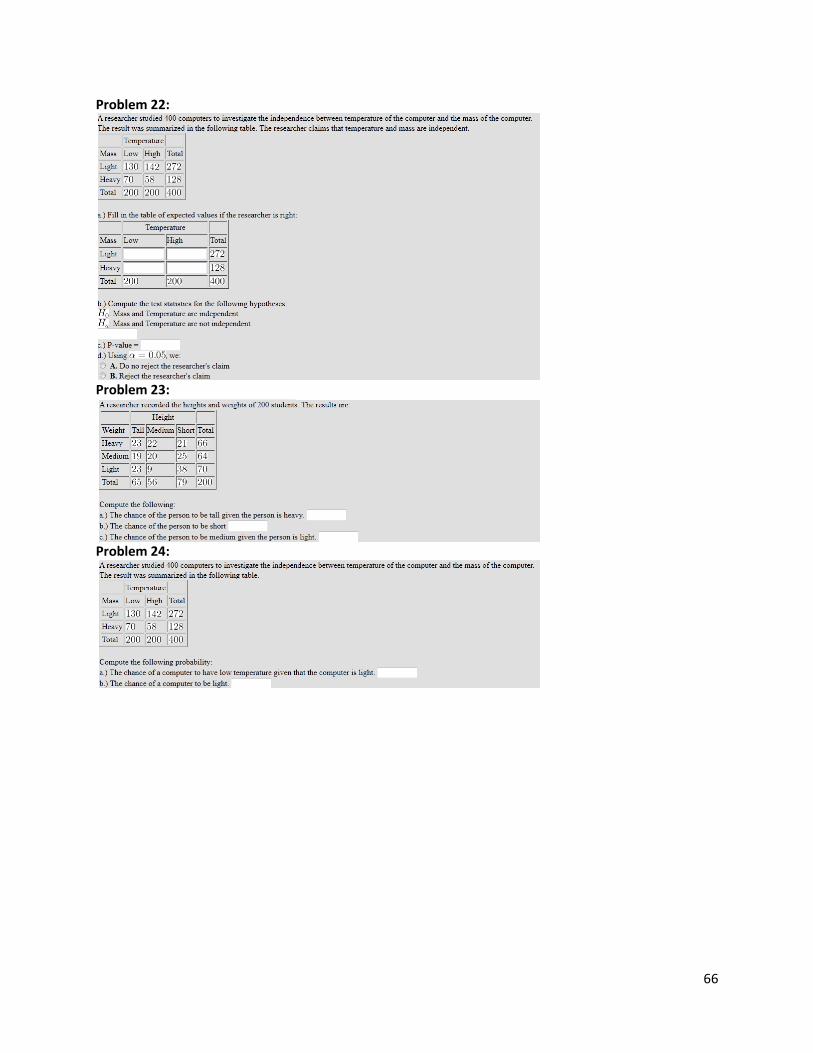
66
Problem 22:
Problem 23:
Problem 24:
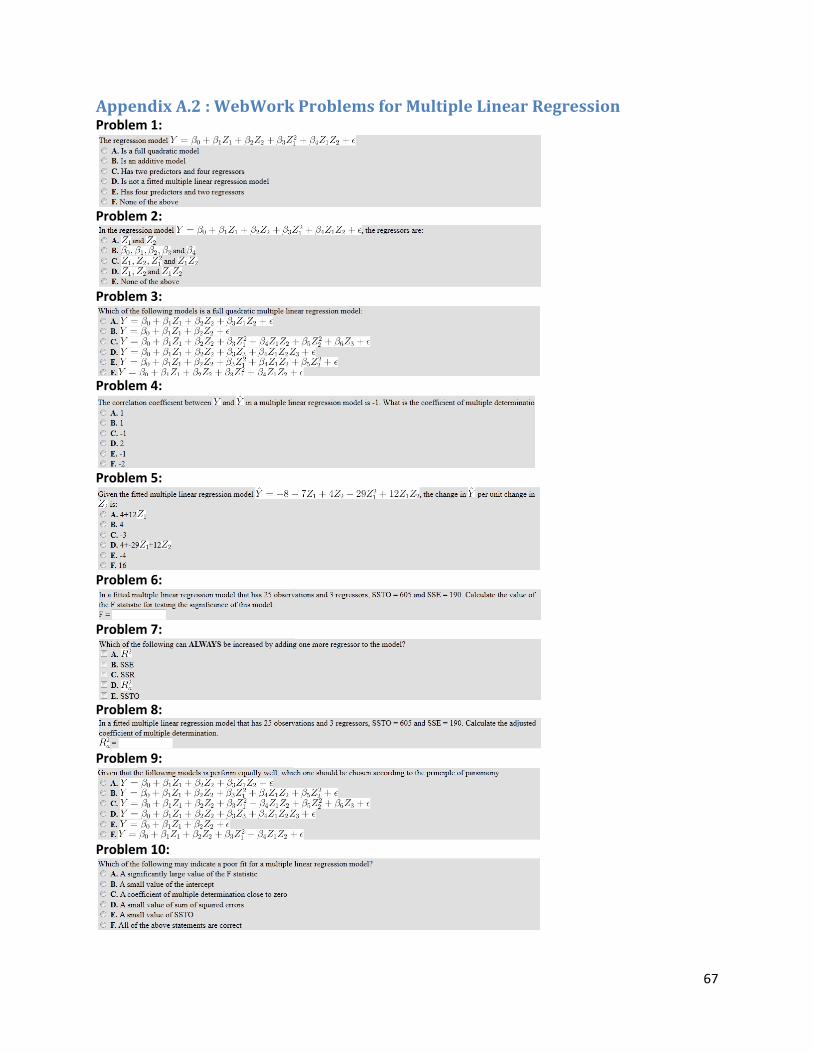
67
Appendix A.2 : WebWork Problems for Multiple Linear Regression Problem 1:
Problem 2:
Problem 3:
Problem 4:
Problem 5:
Problem 6:
Problem 7:
Problem 8:
Problem 9:
Problem 10:
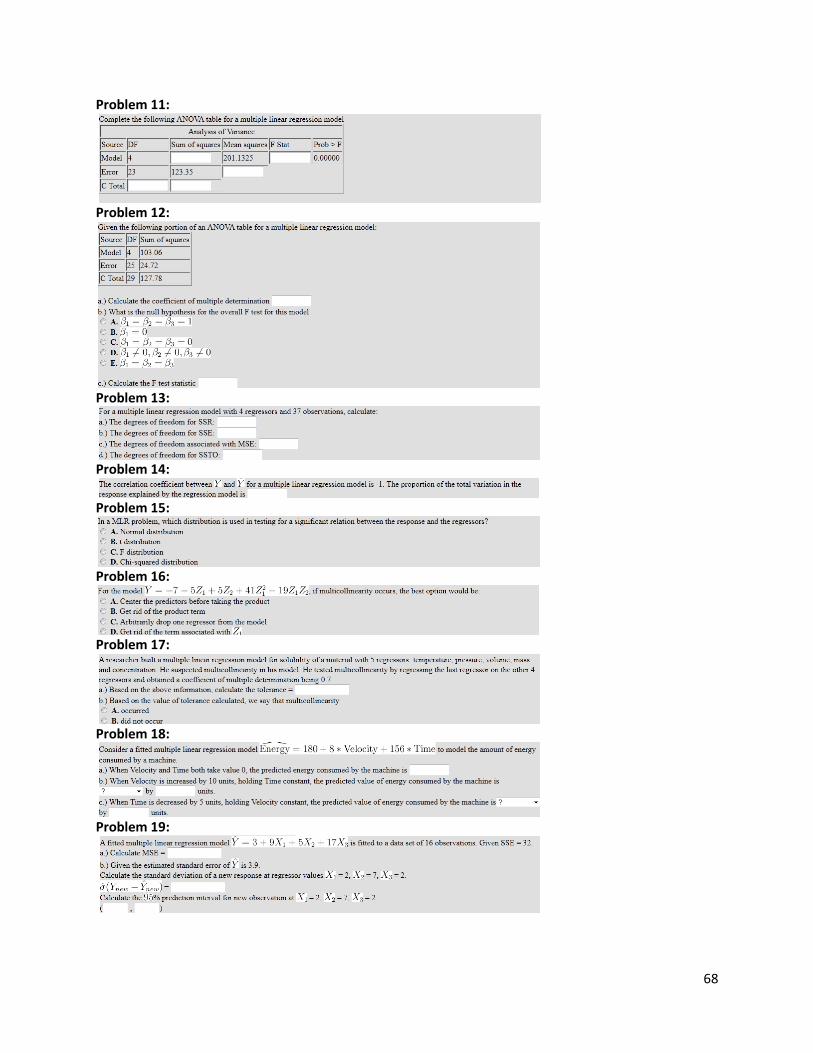
68
Problem 11:
Problem 12:
Problem 13:
Problem 14:
Problem 15:
Problem 16:
Problem 17:
Problem 18:
Problem 19:
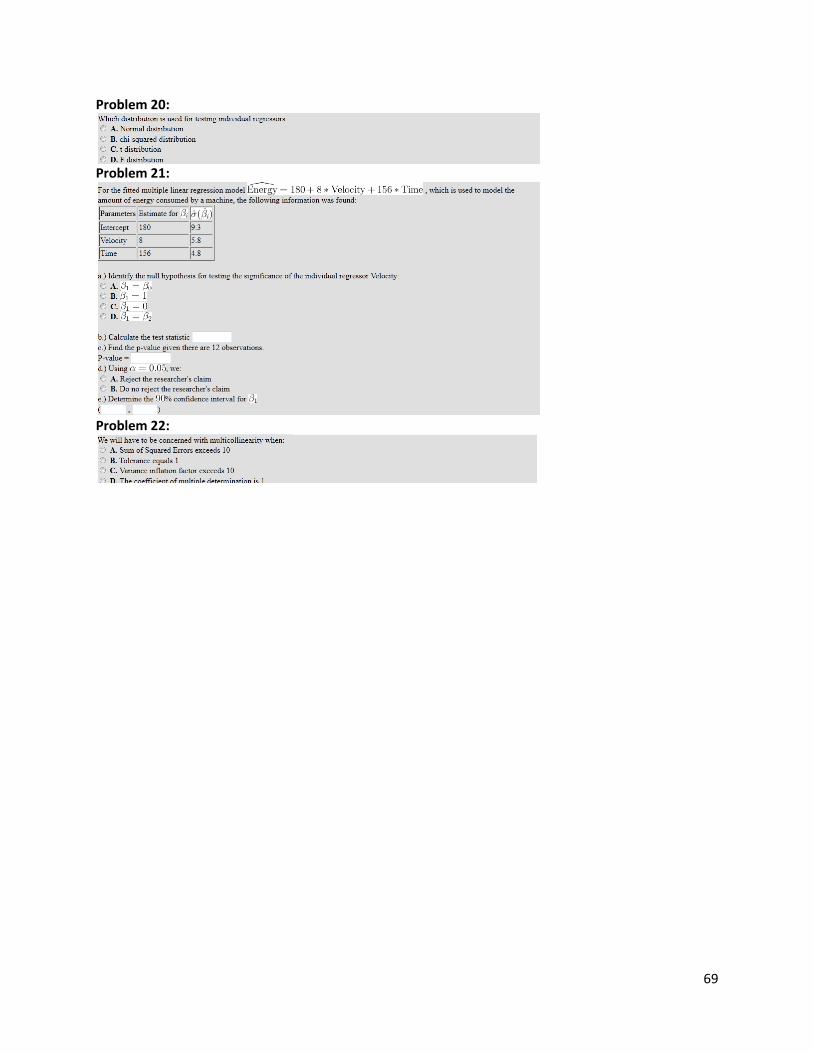
69
Problem 20:
Problem 21:
Problem 22:
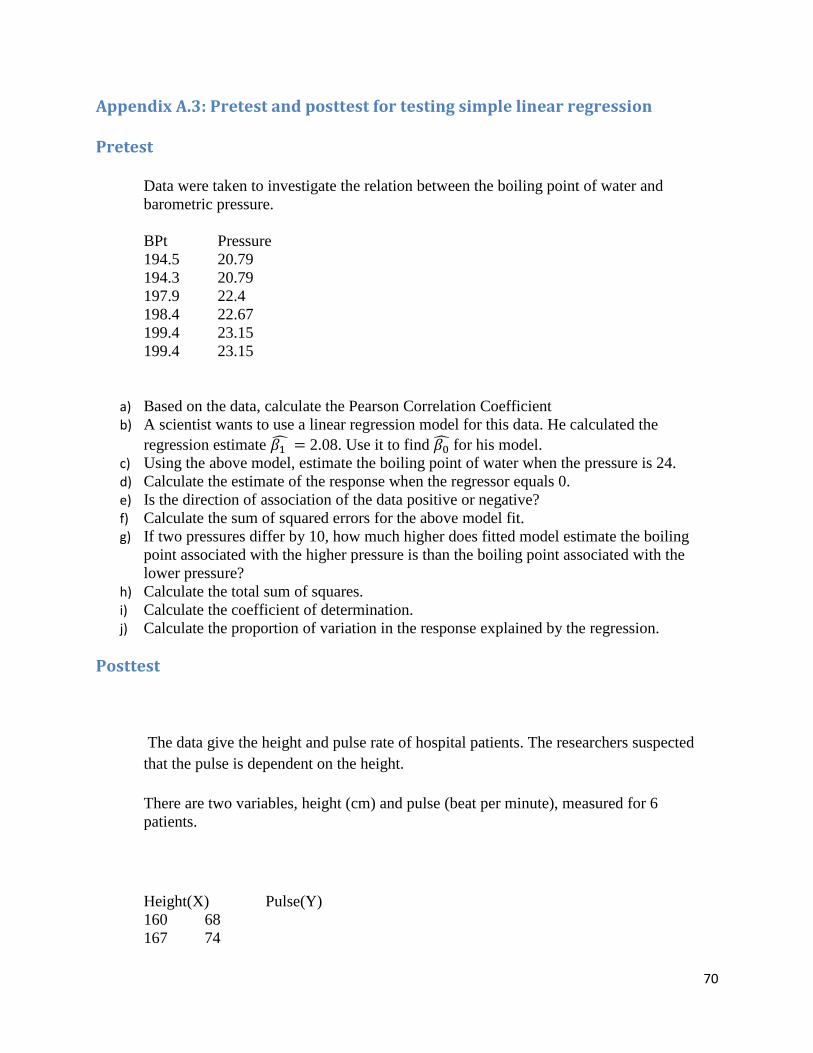
70
Appendix A.3: Pretest and posttest for testing simple linear regression Pretest
Data were taken to investigate the relation between the boiling point of water and
barometric pressure.
BPt Pressure
194.5 20.79
194.3 20.79
197.9 22.4
198.4 22.67
199.4 23.15
199.4 23.15
a) Based on the data, calculate the Pearson Correlation Coefficient
b) A scientist wants to use a linear regression model for this data. He calculated the
regression estimate 2.08. Use it to find for his model.
c) Using the above model, estimate the boiling point of water when the pressure is 24.
d) Calculate the estimate of the response when the regressor equals 0.
e) Is the direction of association of the data positive or negative?
f) Calculate the sum of squared errors for the above model fit.
g) If two pressures differ by 10, how much higher does fitted model estimate the boiling
point associated with the higher pressure is than the boiling point associated with the
lower pressure?
h) Calculate the total sum of squares.
i) Calculate the coefficient of determination.
j) Calculate the proportion of variation in the response explained by the regression.
Posttest
The data give the height and pulse rate of hospital patients. The researchers suspected
that the pulse is dependent on the height.
There are two variables, height (cm) and pulse (beat per minute), measured for 6
patients.
Height(X) Pulse(Y)
160 68
167 74
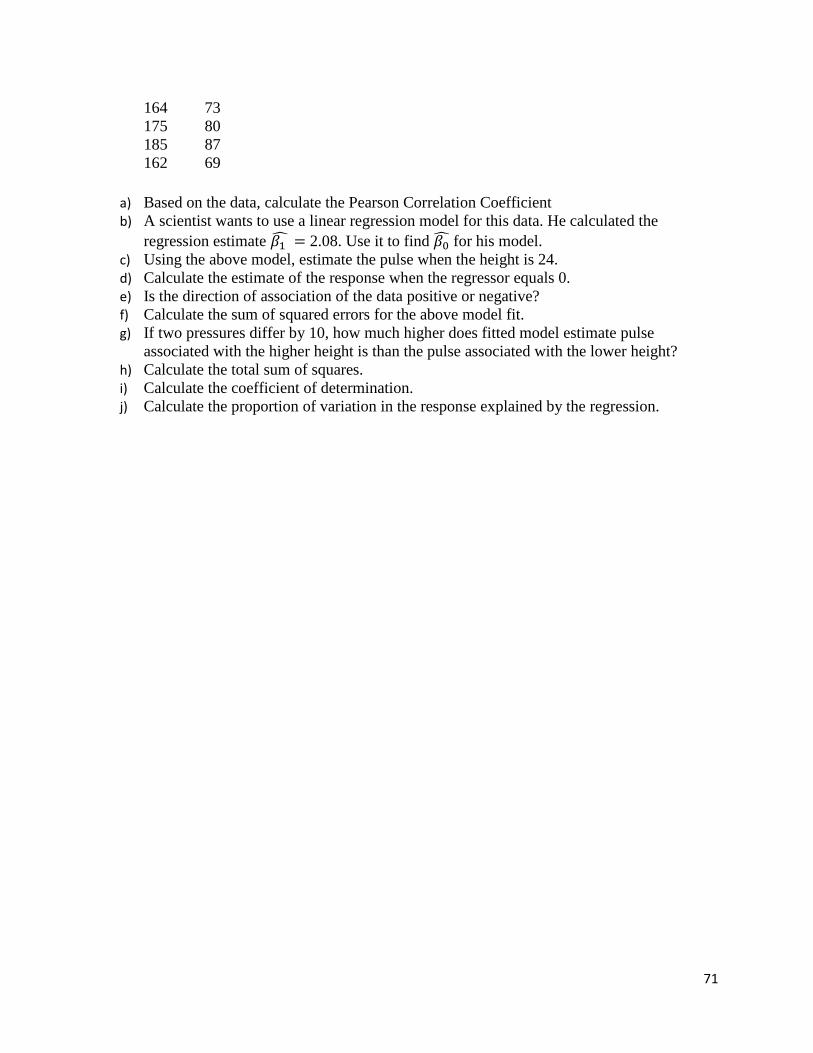
71
164 73
175 80
185 87
162 69
a) Based on the data, calculate the Pearson Correlation Coefficient
b) A scientist wants to use a linear regression model for this data. He calculated the
regression estimate 2.08. Use it to find for his model.
c) Using the above model, estimate the pulse when the height is 24.
d) Calculate the estimate of the response when the regressor equals 0.
e) Is the direction of association of the data positive or negative?
f) Calculate the sum of squared errors for the above model fit.
g) If two pressures differ by 10, how much higher does fitted model estimate pulse
associated with the higher height is than the pulse associated with the lower height?
h) Calculate the total sum of squares.
i) Calculate the coefficient of determination.
j) Calculate the proportion of variation in the response explained by the regression.
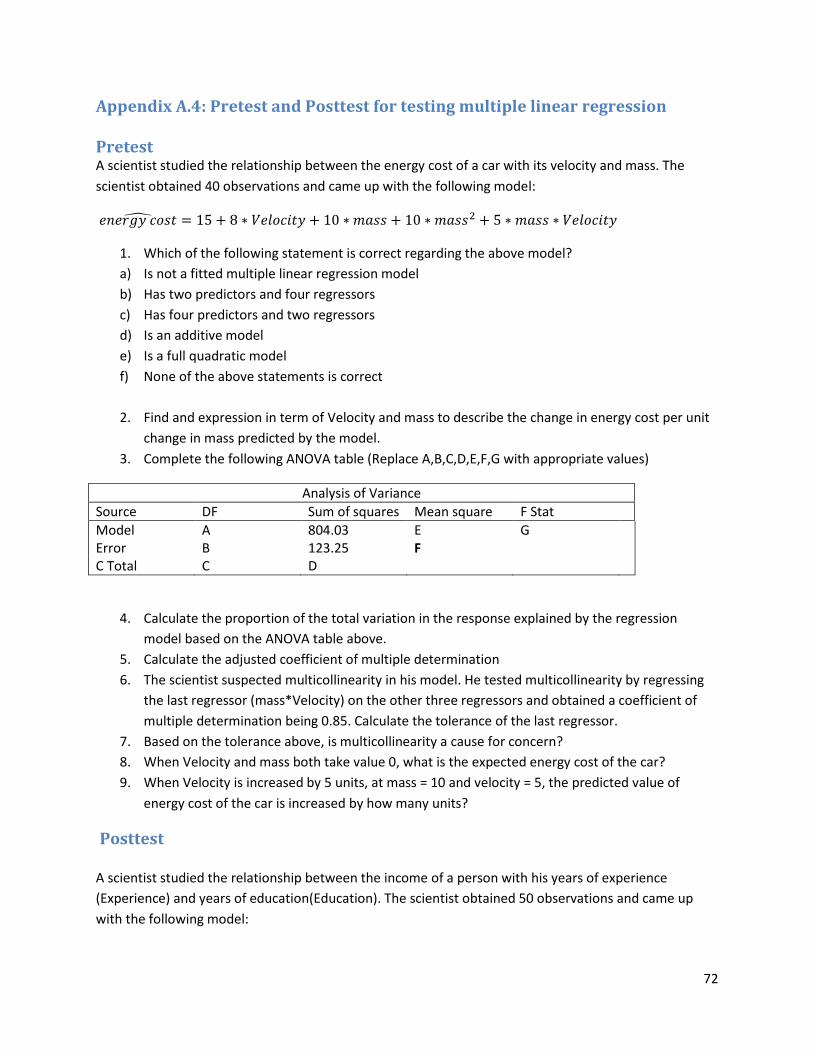
72
Appendix A.4: Pretest and Posttest for testing multiple linear regression Pretest A scientist studied the relationship between the energy cost of a car with its velocity and mass. The
scientist obtained 40 observations and came up with the following model:
1. Which of the following statement is correct regarding the above model?
a) Is not a fitted multiple linear regression model
b) Has two predictors and four regressors
c) Has four predictors and two regressors
d) Is an additive model
e) Is a full quadratic model
f) None of the above statements is correct
2. Find and expression in term of Velocity and mass to describe the change in energy cost per unit
change in mass predicted by the model.
3. Complete the following ANOVA table (Replace A,B,C,D,E,F,G with appropriate values)
Analysis of Variance
Source DF Sum of squares Mean square F Stat
Model A 804.03 E G Error B 123.25 F C Total C D
4. Calculate the proportion of the total variation in the response explained by the regression
model based on the ANOVA table above.
5. Calculate the adjusted coefficient of multiple determination
6. The scientist suspected multicollinearity in his model. He tested multicollinearity by regressing
the last regressor (mass*Velocity) on the other three regressors and obtained a coefficient of
multiple determination being 0.85. Calculate the tolerance of the last regressor.
7. Based on the tolerance above, is multicollinearity a cause for concern?
8. When Velocity and mass both take value 0, what is the expected energy cost of the car?
9. When Velocity is increased by 5 units, at mass = 10 and velocity = 5, the predicted value of
energy cost of the car is increased by how many units?
Posttest
A scientist studied the relationship between the income of a person with his years of experience
(Experience) and years of education(Education). The scientist obtained 50 observations and came up
with the following model:
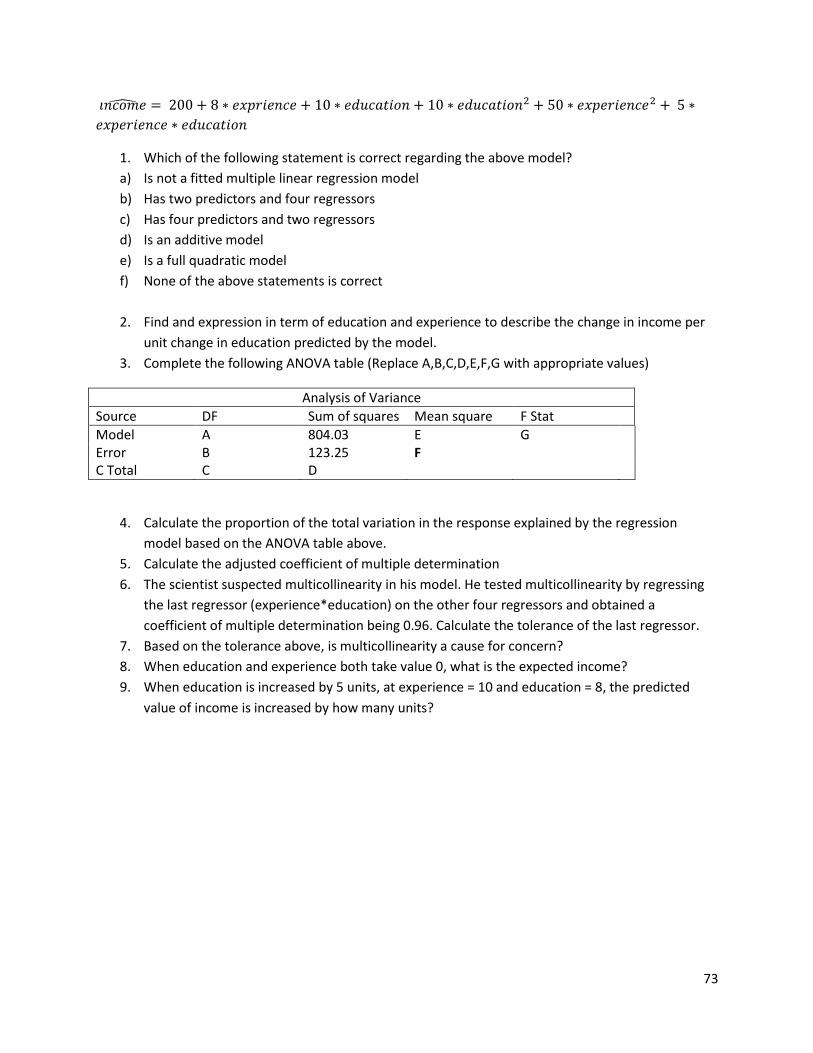
73
1. Which of the following statement is correct regarding the above model?
a) Is not a fitted multiple linear regression model
b) Has two predictors and four regressors
c) Has four predictors and two regressors
d) Is an additive model
e) Is a full quadratic model
f) None of the above statements is correct
2. Find and expression in term of education and experience to describe the change in income per
unit change in education predicted by the model.
3. Complete the following ANOVA table (Replace A,B,C,D,E,F,G with appropriate values)
Analysis of Variance
Source DF Sum of squares Mean square F Stat
Model A 804.03 E G Error B 123.25 F C Total C D
4. Calculate the proportion of the total variation in the response explained by the regression
model based on the ANOVA table above.
5. Calculate the adjusted coefficient of multiple determination
6. The scientist suspected multicollinearity in his model. He tested multicollinearity by regressing
the last regressor (experience*education) on the other four regressors and obtained a
coefficient of multiple determination being 0.96. Calculate the tolerance of the last regressor.
7. Based on the tolerance above, is multicollinearity a cause for concern?
8. When education and experience both take value 0, what is the expected income?
9. When education is increased by 5 units, at experience = 10 and education = 8, the predicted
value of income is increased by how many units?
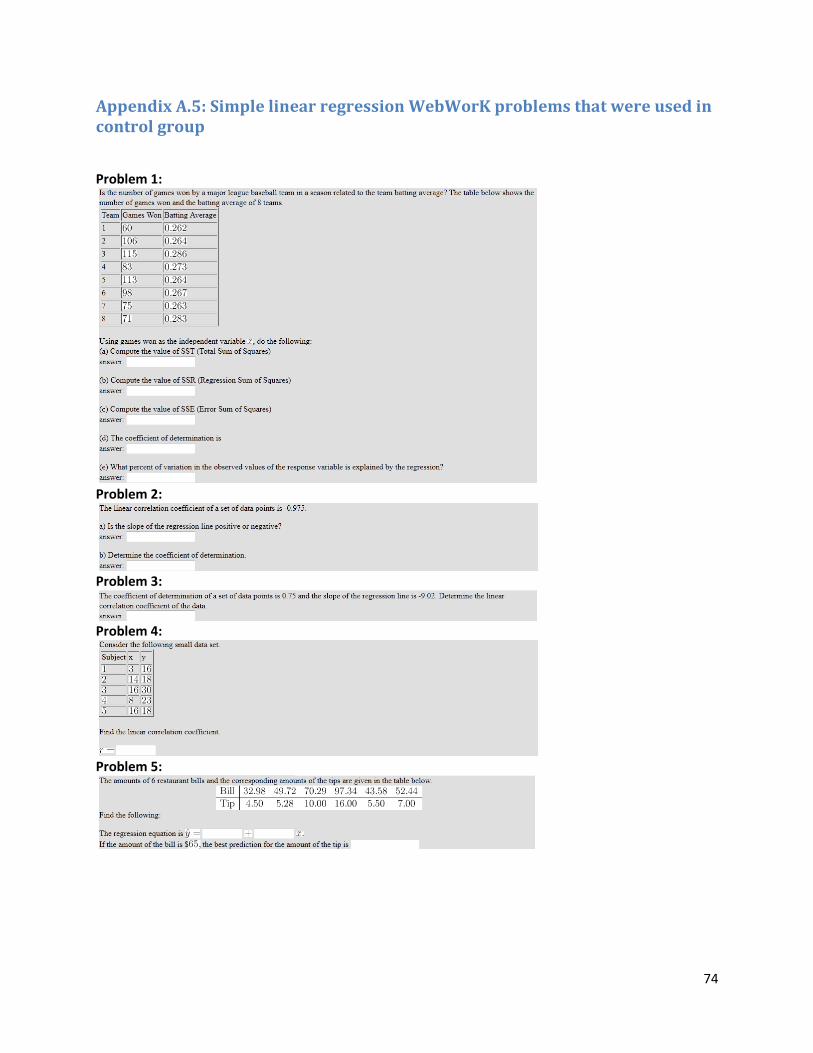
74
Appendix A.5: Simple linear regression WebWorK problems that were used in control group
Problem 1:
Problem 2:
Problem 3:
Problem 4:
Problem 5:
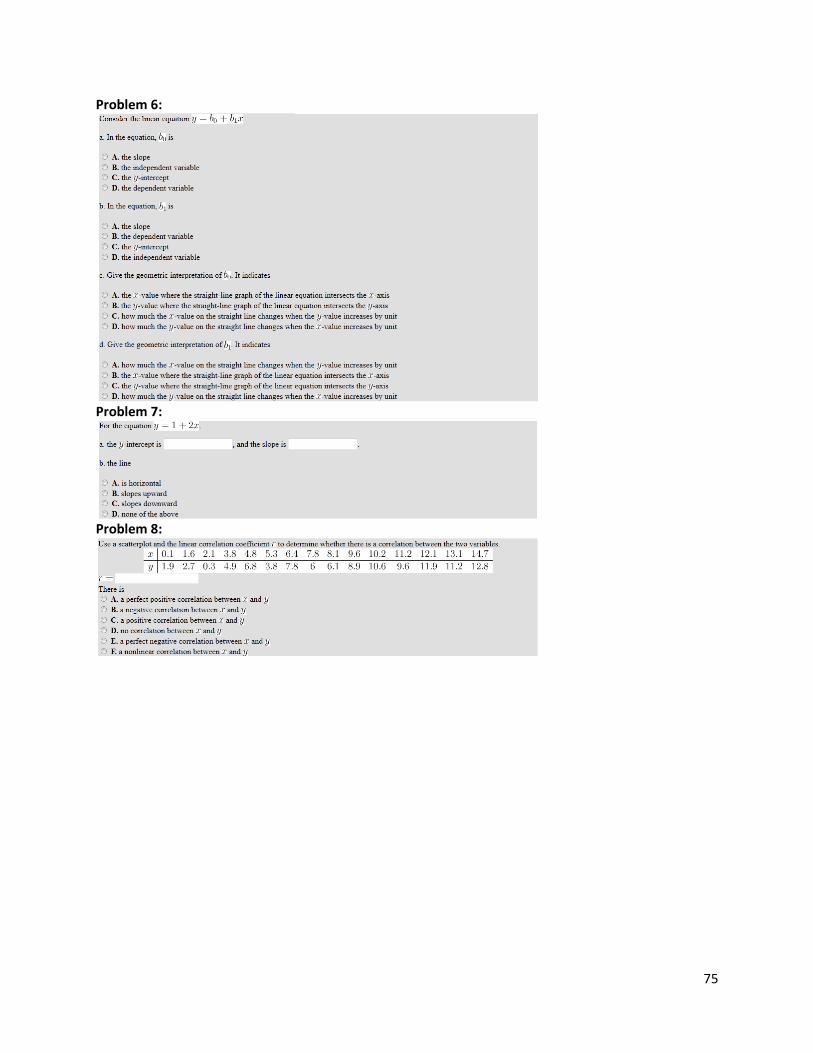
75
Problem 6:
Problem 7:
Problem 8:
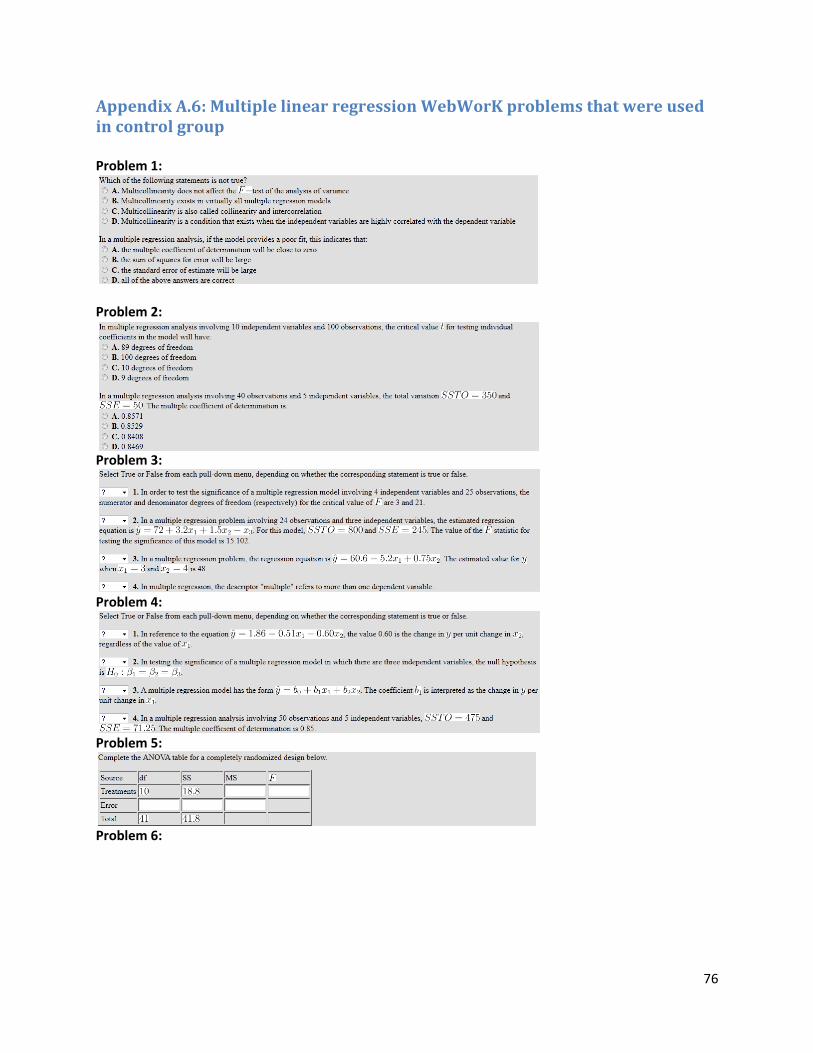
76
Appendix A.6: Multiple linear regression WebWorK problems that were used in control group
Problem 1:
Problem 2:
Problem 3:
Problem 4:
Problem 5:
Problem 6:
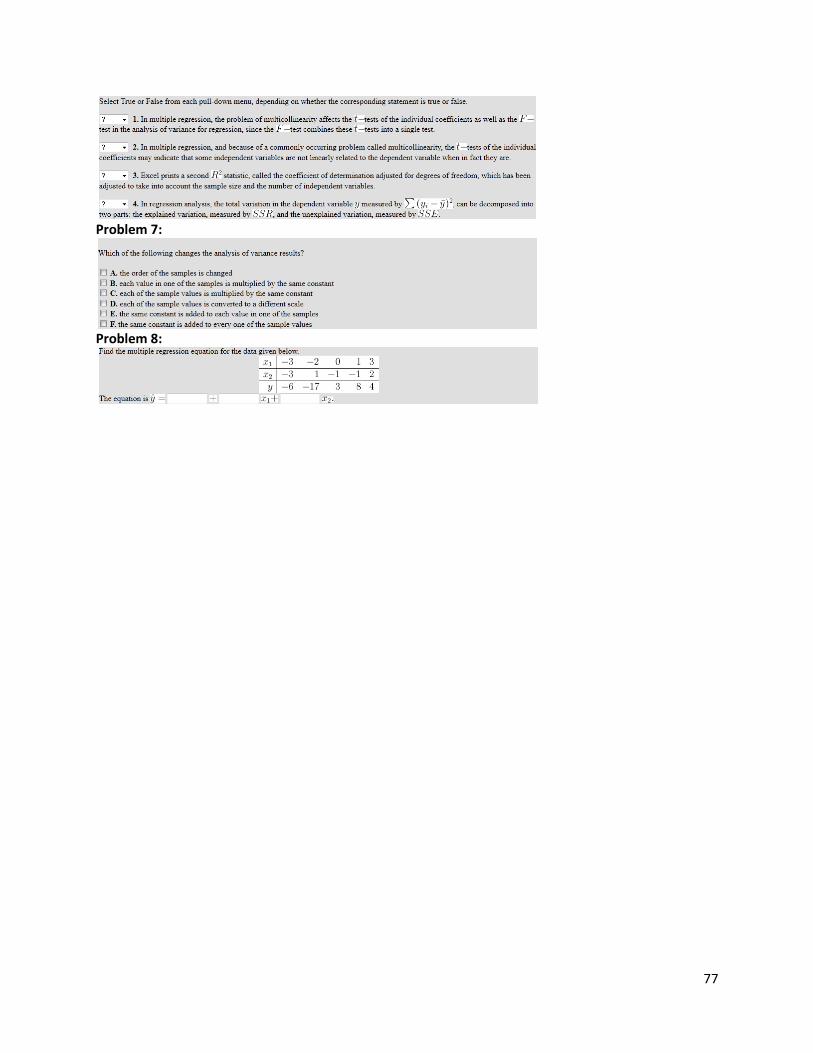
77
Problem 7:
Problem 8: