designs for the quality of service support in low-energy ... suhonen phd thesis.pdf · designs for...
TRANSCRIPT


Tampereen teknillinen yliopisto. Julkaisu 1061 Tampere University of Technology. Publication 1061 Jukka Suhonen Designs for the Quality of Service Support in Low-Energy Wireless Sensor Network Protocols Thesis for the degree of Doctor of Science in Technology to be presented with due permission for public examination and criticism in Tietotalo Building, Auditorium TB111, at Tampere University of Technology, on the 24th of August 2012, at 12 noon. Tampereen teknillinen yliopisto - Tampere University of Technology Tampere 2012

ISBN 978-952-15-2883-5 (printed) ISBN 978-952-15-2907-8 (PDF) ISSN 1459-2045

PREFACE
The research work for this Thesis was carried out in the Department of ComputerSystems at Tampere University of Technology during the years 2005-2012.
I would like to express my gratitude to my supervisor Professor Marko Hännikäinenfor the guidance, support, and motivation during the research. I am also gratefulto Professor Timo D. Hämäläinen for his guidance and support. I would like tothank Associate Professor Evgeny Osipov from Luleå University of Technology andProfessor Riku Jäntti from Aalto University for reviewing and providing commentsfor this Thesis. Also, I would like to thank Professor Timo T. Hämäläinen fromUniversity of Jyväskylä and Associate Professor Evgeny Osipov for agreeing to actas opponents in the defense.
I would like to express thanks to my co-authors Dr. Mikko Kohvakka and Dr. MauriKuorilehto for their valuable input in my research work, and also to Ville Kaseva,M.Sc., Teemu Laukkarinen, M.Sc., Lasse Määttä, M.Sc., Jani Arvola, M.Sc., andother members of the TUTWSN team for their work that made this Thesis possible.I am especially grateful to Markku Hänninen, M.Sc. for his valuable work in theextensive testing of the protocols presented in this Thesis. Also, I would like to thanDr. Olli Lehtoranta for both research related and not so related discussions.
This work was financially supported by Graduate School in Electronics, Telecommu-nications and Automation (GETA).
Finally, I would like to express my gratitude to my family for their support and en-couragement.
Tampere, July 2012
Jukka Suhonen

iv Preface

TABLE OF CONTENTS
Abstract . . . . . . . . . . . . . . . . . . . . . . . . . . . . . . . . . . . . i
Preface . . . . . . . . . . . . . . . . . . . . . . . . . . . . . . . . . . . . . iii
Table of Contents . . . . . . . . . . . . . . . . . . . . . . . . . . . . . . . v
List of Publications . . . . . . . . . . . . . . . . . . . . . . . . . . . . . . ix
List of Abbreviations . . . . . . . . . . . . . . . . . . . . . . . . . . . . . . xi
1. Introduction . . . . . . . . . . . . . . . . . . . . . . . . . . . . . . . . 1
1.1 WSN Design Characteristics . . . . . . . . . . . . . . . . . . . . . 1
1.2 Embedded WSN Platforms . . . . . . . . . . . . . . . . . . . . . . 3
1.3 Quality of Service in WSNs . . . . . . . . . . . . . . . . . . . . . 5
1.4 Scope, Objectives, and Methods of Research . . . . . . . . . . . . . 6
1.5 Results and Contributions . . . . . . . . . . . . . . . . . . . . . . . 7
1.6 Thesis Outline . . . . . . . . . . . . . . . . . . . . . . . . . . . . . 8
2. Applications and Standards . . . . . . . . . . . . . . . . . . . . . . . . 9
2.1 Applications . . . . . . . . . . . . . . . . . . . . . . . . . . . . . . 9
2.2 Wireless Communication Technologies . . . . . . . . . . . . . . . 10
2.3 WSN Communication Standards . . . . . . . . . . . . . . . . . . . 11
2.4 Technology Integration via Internet of Things . . . . . . . . . . . . 14
2.5 Conclusion on Standards . . . . . . . . . . . . . . . . . . . . . . . 15
3. Related Research on QoS Metrics and Protocols . . . . . . . . . . . . . . 17
3.1 QoS Standards in Computer Networks . . . . . . . . . . . . . . . . 17
3.2 Performance Analysis . . . . . . . . . . . . . . . . . . . . . . . . . 18

vi Table of Contents
3.3 Network Diagnostics . . . . . . . . . . . . . . . . . . . . . . . . . 19
3.3.1 Passive monitoring . . . . . . . . . . . . . . . . . . . . . . 20
3.3.2 Deployment Support Networks . . . . . . . . . . . . . . . . 20
3.3.3 In-Network Diagnostics . . . . . . . . . . . . . . . . . . . 21
3.4 QoS Protocols . . . . . . . . . . . . . . . . . . . . . . . . . . . . . 21
3.5 Medium Access Control Layer . . . . . . . . . . . . . . . . . . . . 22
3.5.1 Channel Access Techniques . . . . . . . . . . . . . . . . . 22
3.5.2 Low Duty Cycling . . . . . . . . . . . . . . . . . . . . . . 24
3.5.3 QoS Support in MAC . . . . . . . . . . . . . . . . . . . . . 26
3.6 Routing Layer . . . . . . . . . . . . . . . . . . . . . . . . . . . . . 27
3.6.1 Node-centric routing . . . . . . . . . . . . . . . . . . . . . 28
3.6.2 Location-based Routing . . . . . . . . . . . . . . . . . . . 28
3.6.3 Multipath Routing . . . . . . . . . . . . . . . . . . . . . . 28
3.6.4 Data-centric Routing . . . . . . . . . . . . . . . . . . . . . 29
3.6.5 Cost-based Routing . . . . . . . . . . . . . . . . . . . . . . 30
3.6.6 QoS-aware Routing Proposals . . . . . . . . . . . . . . . . 30
3.7 Transport Layer . . . . . . . . . . . . . . . . . . . . . . . . . . . . 32
3.8 Summary . . . . . . . . . . . . . . . . . . . . . . . . . . . . . . . 33
4. TUTWSN Platform and Deployments . . . . . . . . . . . . . . . . . . . 35
4.1 Medium Access Control . . . . . . . . . . . . . . . . . . . . . . . 35
4.2 Routing Protocol . . . . . . . . . . . . . . . . . . . . . . . . . . . 36
4.3 Hardware Prototypes . . . . . . . . . . . . . . . . . . . . . . . . . 37
4.4 Deployments . . . . . . . . . . . . . . . . . . . . . . . . . . . . . 40
4.4.1 Outdoor Environmental Monitoring in Rural Area . . . . . . 41
4.4.2 Outdoor Environmental Monitoring in Suburban Area . . . 42
4.4.3 Indoor Deployment at TUT Campus . . . . . . . . . . . . . 42

Table of Contents vii
5. QoS Analysis for WSNs . . . . . . . . . . . . . . . . . . . . . . . . . . 45
5.1 QoS Metrics . . . . . . . . . . . . . . . . . . . . . . . . . . . . . . 45
5.1.1 Latency . . . . . . . . . . . . . . . . . . . . . . . . . . . . 46
5.1.2 Throughput . . . . . . . . . . . . . . . . . . . . . . . . . . 46
5.1.3 Reliability and Availability . . . . . . . . . . . . . . . . . . 46
5.1.4 Network and Node Lifetime . . . . . . . . . . . . . . . . . 48
5.1.5 Node Density, Count, and Communication Range . . . . . . 48
5.1.6 Mobility . . . . . . . . . . . . . . . . . . . . . . . . . . . 49
5.1.7 Security . . . . . . . . . . . . . . . . . . . . . . . . . . . . 49
5.2 Usage of QoS Profiles . . . . . . . . . . . . . . . . . . . . . . . . . 50
5.2.1 ZigBee Network Example . . . . . . . . . . . . . . . . . . 51
5.3 QoS Metrics in TUTWSN . . . . . . . . . . . . . . . . . . . . . . 52
5.3.1 Application layer . . . . . . . . . . . . . . . . . . . . . . . 53
5.3.2 Routing layer . . . . . . . . . . . . . . . . . . . . . . . . . 54
5.3.3 MAC layer . . . . . . . . . . . . . . . . . . . . . . . . . . 54
5.3.4 Physical layer . . . . . . . . . . . . . . . . . . . . . . . . . 55
6. Protocol Designs for QoS . . . . . . . . . . . . . . . . . . . . . . . . . 57
6.1 QoS Schemes for WSN MACs . . . . . . . . . . . . . . . . . . . . 57
6.1.1 QoS Support Layer for WMNs . . . . . . . . . . . . . . . . 57
6.1.2 Dynamic Capacity Allocation . . . . . . . . . . . . . . . . 59
6.2 QoS Routing Cost Algorithm . . . . . . . . . . . . . . . . . . . . . 62
6.2.1 Minimum Cost Routing . . . . . . . . . . . . . . . . . . . 62
6.2.2 Cost Algorithm . . . . . . . . . . . . . . . . . . . . . . . . 63
6.2.3 Cost Functions for TDMA-based MAC . . . . . . . . . . . 65
6.2.4 Simulation Results . . . . . . . . . . . . . . . . . . . . . . 66
6.3 Cross-layer Design . . . . . . . . . . . . . . . . . . . . . . . . . . 69

viii Table of Contents
7. Network Diagnostics . . . . . . . . . . . . . . . . . . . . . . . . . . . . 73
7.1 Diagnostics Architecture . . . . . . . . . . . . . . . . . . . . . . . 73
7.2 Embedded Self-diagnostics . . . . . . . . . . . . . . . . . . . . . . 74
7.2.1 Node information . . . . . . . . . . . . . . . . . . . . . . . 74
7.2.2 Network and node events . . . . . . . . . . . . . . . . . . . 74
7.2.3 MCU and transceiver activity . . . . . . . . . . . . . . . . 75
7.2.4 Route and routing latency . . . . . . . . . . . . . . . . . . 76
7.2.5 Cluster and link traffic . . . . . . . . . . . . . . . . . . . . 76
7.2.6 Network topology . . . . . . . . . . . . . . . . . . . . . . 77
7.2.7 Software errors . . . . . . . . . . . . . . . . . . . . . . . . 77
7.3 Diagnosed QoS Metrics . . . . . . . . . . . . . . . . . . . . . . . . 78
7.4 Performance Analysis Tool . . . . . . . . . . . . . . . . . . . . . . 78
7.5 QoS Analysis on an Outdoor Network . . . . . . . . . . . . . . . . 80
7.6 Performance Comparison of Indoor and Outdoor Deployments . . . 83
8. Summary of Publications . . . . . . . . . . . . . . . . . . . . . . . . . 85
9. Conclusions . . . . . . . . . . . . . . . . . . . . . . . . . . . . . . . . 87

LIST OF PUBLICATIONS
This Thesis consists of an introductory part and the following publications. In theintroductory part, the publications are referred to as [P1]. . . [P6]. The publicationsare sorted in chronological order based on the publication date.
[P1] J. Suhonen, M. Kuorilehto, M. Hännikäinen, and T. D. Hämäläinen, "Cost-Aware Dynamic Routing Protocol for Wireless Sensor Networks - Designand Prototype Experiments", in Proceedings of the 17th Annual IEEE Inter-national Symposium on Personal, Indoor and Mobile Radio Communications(PIMRC’06), Helsinki, Finland, September 11-14, 2006, pp. 1-5.
[P2] J. Suhonen, M. Kohvakka, M. Kuorilehto, M. Hännikäinen, and T. D. Hämä-läinen, "Cost-Aware Capacity Optimization in Dynamic Multi-Hop WSNs",in Proceedings of the Design, Automation and Test in Europe (DATE’07),Nice, France, April 16-20, 2007, pp. 666-671.
[P3] J. Suhonen, M. Kohvakka, M. Hännikäinen, and T. D. Hämäläinen, "Em-bedded Software Architecture for Diagnosing Network and Node Failures inWireless Sensor Networks", in Proceedings of the 8th International Work-shop on Systems, Architectures, Modeling, and Simulation (SAMOS VIII),Samos, Greece, July 21-24, 2008, pp. 258-267.
[P4] J. Suhonen, T. D. Hämäläinen, and M. Hännikäinen, "Availability and End-to-end Reliability in Low Duty Cycle Multihop Wireless Sensor Networks,"Sensors, MDPI, vol. 9, no. 3, pp. 2088-2116, March 2009.
[P5] J. Suhonen, T. D. Hämäläinen, and M. Hännikäinen "Class of Service Sup-port Layer for Wireless Mesh Networks", Int’l J. of Communications, Net-work and System Sciences, SCIRP, vol. 3, no. 2, pp. 140-151, Feb. 2010.
[P6] M. Kohvakka, J. Suhonen, T. D. Hämäläinen, and M. Hännikäinen, "Energy-Efficient Reservation-Based Medium Access Control Protocol for Wireless

x List of Publications
Sensor Networks", EURASIP Journal on Wireless Communications and Net-working, vol. 2010, 20 pages, 2010.

LIST OF ABBREVIATIONS
6LoWPAN IPv6 over Low power Wireless Personal Area Networks
ADC Analog-to-Digital Converter
AODV Ad-hoc On-demand Distance Vector routing
APS Application Support
ATM Asynchronous Transfer Mode
BO Beacon Order
CAP Contention Access Period
CBR Constant Bit Rate
CDF Cumulative Distribution Function
CDMA Code Division Multiple Access
CFP Contention-Free Period
CO2 Carbon dioxide
CoAP Constrained Application Protocol
COTS Commercial Off-The-Shelf
CoS Class of Service
CSMA Carrier Sense Multiple Access
CSMA/CA Carrier Sense Multiple Access with Collision Avoidance
CTS Clear-To-Send
CW Contention Window
DCF Distributed Coordination Function

xii List of Abbreviations
DCF Distributed Coordination Function
DiffServ Differentiated Services
DoS Denial-of-Service
DSN Deployment Support Network
DSSS Direct Sequence Spread Spectrum
EEPROM Electrically Erasable Programmable Read-Only Memory
FDMA Frequency Division Multiple Access
GoS Grade of Service
GPS Global Positioning System
GPRS General Packet Radio Service
GSM Global System for Mobile Communications
HAL Hardware Abstraction Layer
HTTP Hypertext Transfer Protocol
IEC International Electrotechnical Commission
IETF Internet Engineering Task Force
IntServ Integrated Services
IoT Internet of Things
IP Internet Protocol
LAN Local Area Network
LPL Low Power Listening
LR-WPAN Low-Rate Wireless Personal Area Network
MAC Medium Access Control
MCU Micro-Controller Unit
MIB Management Information Base
MIPS Million Instructions Per Second
NS2 Network Simulator 2

xiii
NWK Network
OS Operating System
PAN Personal Area Network
PC Personal Computer
PHY Physical layer
PIR Passive Infra-Red
QoS Quality of Service
RF Radio Frequency
RFID Radio Frequency Identification
RPL Routing Protocol for Low-Power and Lossy Networks
RSSI Received Signal Strength Indicator
RSVP Resource Reservation Protocol
RTS Request To Send
RX Reception
SNMP Simple Network Management Protocol
SO Superframe Order
SQL Structured Query Language
SRAM Static Random Access Memory
TCP Transmission Control Protocol
TDMA Time Division Multiple Access
TOS Type of Service
TRP Transport
TUTWSN Tampere University of Technology Wireless Sensor Network
TX Transmission
UDP User Datagram Protocol
UI User Interface

xiv List of Abbreviations
UMTS Universal Mobile Telecommunications System
URI Universal Resource Identifier
WIA-PA Wireless network for Industrial Automation – Process Automation
WLAN Wireless Local Area Network
WMAN Wireless Metropolitan Area Network
WMN Wireless Mesh Network
WPAN Wireless Personal Area Network
WSN Wireless Sensor Network
WWAN Wireless Wide Area Network

1. INTRODUCTION
In the vision of future networking, devices co-operate for intelligent decision makingthus allowing unobtrusive operation without human interaction [2]. This enables avast amount of applications in various areas such as military surveillance [127], se-curity and asset management [14], environment monitoring [177], health care [103],building and home automation [165], and industrial control [57]. Generally, a sen-sor network refers to any set of interconnected sensor devices, including comput-ers, home appliances, and mobile phones. This Thesis concentrates on low-energyWireless Sensor Networks (WSNs), where tiny, unobtrusive sensor nodes gather in-formation from surrounding environment, detect and classify events, and control ac-tuators according to the detected events [169]. Compared to other wireless technolo-gies, WSNs are characterized by low cost and ultra low energy [145]. This allows thedeployment of even thousands of potentially disposable devices that can have a bat-tery powered lifetime of years or operate on energy gathered from their environment.However, as a trade-off, the low energy WSNs have limited computation, communi-cation, memory, and energy resources. Thus, the challenge is to ensure an adequatelevel of service.
This Thesis focuses on Quality of Service (QoS) in low energy WSNs. This Thesisconcentrates to the performance at the network traffic level. As such, this Thesis con-siders some metrics that are typically referred to as constraints in the protocol designbut still evaluate the performance from the application point-of-view. The main re-search problem is defining and implementing QoS with constrained energy budget,processing power, communication bandwidth, and data and program memories. Theproblem is approached via protocol designs and scheduling algorithms.
1.1 WSN Design Characteristics
A WSN consists of nodes that are deployed in the vicinity of an inspected phe-nomenon [4] as depicted in Fig. 1. A network typically contains one or more sinknodes that collect sensor values from other nodes. Instead of sending raw data to the

2 1. Introduction
sink, a sensor node may collaborate with its neighbors or nodes along the routingpath to provide application results [144]. The sink can use the collected informa-tion for own actuator decisions, present measurements to a user via an attached UserInterface (UI), act as a gateway to other networks, or forward data to backbone infras-tructure containing components for data storing, visualization, and network control[80].
A WSN is typically deployed to perform a specific task, e.g. environmental monitor-ing, target tracking, or intruder alerting. As a result, WSNs are often data-centric inthe sense that messages are not send to individual nodes but to geographical locationsor regions based on the data content [118]. The application specific approach allowsreducing communication overhead via data aggregation, and in-network processingand decision making [32].
Low energy nodes are typically battery powered but can also scavenge energy fromtheir environment [23]. As replacing batteries may not be feasible due to large net-work size and energy scavenging does not typically produce enough power for con-tinuous transceiver activity [134], network lifetime should be maximized via energy-efficient protocol designs.
Network density may be high as several nodes are located in close proximity. Still,a WSN may operate in large geographic areas and contain a vast amount of sensornodes. This has several implications. First, a network technology must be scalableto ensure that performance does not degrade even on large networks. Second, toreduce deployment and maintenance effort, a network must be autonomous and self-configurable. Third, transmitting data directly to a target node is not feasible as the
Fig. 1. An example WSN scenario presenting data collection in a multihop topology.

1.2. Embedded WSN Platforms 3
required (free space) transmission energy is proportional to the square of the distance[5] with obstacles further reducing the communication range [179]. Thus, coveringlarge geographical areas implies multihop routing.
Table 1.1 summarizes the typical WSN characteristics and their implications to theprotocol and hardware designs. A WSN may not share every characteristic, e.g. thescalability is not a primary concern on few nodes deployments.
1.2 Embedded WSN Platforms
A WSN platform comprises tightly coupled hardware and software. It determines theperformance and energy resources that are available for applications, thus having asignificant effect on the level of service.
WSN platform consists of four basic units [4] that are necessary for sensing, process-ing values, and delivering measurements to the locations where they can be exploited:
• Sensing unit measures physical phenomena via sensors, controls actuators,and convert measurements to digital values with Analog-to-Digital Converter(ADC).
• Computing unit that typically comprises a microprocessor to execute instruc-tions, persistent program memory for application code, temporary data mem-
Table 1. Typical WSN characteristics and their implications to the protocol and hardwaredesigns.

4 1. Introduction
ory such as Static Random Access Memory (SRAM), and persistent data mem-ory such as Electrically Erasable Programmable Read-Only Memory (EEPROM)or flash.
• Communication unit that connects node to network via wireless transceiver.The transceiver typically uses Radio Frequency (RF) technology as it does nothave the line-of-sight requirement of infrared and ultrasound.
• Power unit provides energy for other components e.g. via energy scavenging,batteries, or mains power.
The computing unit has the most diverse functionality as it manages collaborationbetween nodes and carries out sensing tasks. To ease development, a node may usean Operating System (OS) that manages memory, provides Hardware AbstractionLayer (HAL) for sensors and other hardware resources, and allows interaction be-tween application tasks [92, 168]. The communication between nodes is managedby a protocol stack that contains physical, Medium Access Control (MAC), routing,and transport layers. The physical layer exchanges bits over a physical link betweennodes. MAC manages neighbor discovery, establishes wireless links, and exchangesframes with neighbors by receiving and transmitting on wireless channel [84], whilerouting enables end-to-end communications over multiple hops [118]. The transportprotocol ensures reliable end-to-end transmission of packets and congestion control[192]. Instead of accessing the network stack directly, an application may use amiddleware layer that provides providing application frameworks and interfaces e.g.for collaboration between nodes, security, localization, and runtime configuration onheterogeneous hardware [144]. Based on hardware capabilities, WSN nodes maybe classified to high performance and low energy platforms [64]. The high perfor-mance platforms have computing and memory capabilities that are close to PersonalComputers (PCs) whereas low energy platforms aim at low cost and long lifetimeon batteries. A network may be heterogeneous and comprise both kind of nodes, asnodes can be specialized in certain tasks.
This Thesis concentrates on the low energy platforms that allow the deployment oflarge scale and long term sensor networks [57]. Due to the limitations in the manu-facturing techniques, low energy, low cost, and small size can be realized only witha resource constrained hardware [128]. A low energy WSN node has typically onlyfew Million Instructions Per Seconds (MIPSs) processing power, 32-128 kB programmemory, and 2-8 kB data memory [84].

1.3. Quality of Service in WSNs 5
1.3 Quality of Service in WSNs
QoS has various meanings depending on context. Generally, it describes whethera service satisfies user expectations and includes traffic performance, security leveland quality of technical support [76]. ITU-T makes a difference between Grade ofService (GoS) and QoS in its E.600 and E.800 recommendations. GoS is a subset ofQoS that concentrates on measuring the traffic performance [75]. In this Thesis, QoSis considered only from GoS point of view, and both terms are used interchangeably.
In communication networks, QoS is usually understood as a set of performance re-quirements to be met for transferring a data flow [33]. These requirements are definedand measured with a set of quantifiable attributes referred to as QoS metrics [150].In legacy computer networks, QoS is commonly expressed with throughput, delay,jitter (variation of transfer delays), and error rate metrics [56].
In this Thesis, a protocol that implements a control to differentiate at least one QoSmetric is referred to as a QoS protocol. Thus, a QoS protocol adapts its operation tomeet the QoS demands. In practice, QoS is realized in communication protocols thatgive either soft (relative) or hard (absolute) service level guarantees.
The importance of QoS is emphasized in wireless networks that suffer from unreli-able communications, link quality, link breaks, and limited communication capacity.In WSNs, these issues are especially evident due to the unplanned deployment thatcauses low quality links, and energy depletion that leads to node failures. While QoShas been researched in traditional computer networks, the existing QoS protocols aretoo complex for the resource constrained sensor nodes [193] and do not consider en-ergy that is important for WSNs. This necessitates the design of new QoS protocols.The state of the art research on sensor QoS has concentrated on single metrics suchas energy or latency.
The potential use cases for WSNs vary significantly and have different requirements.A simple measurement network that collects periodic samples tolerates high latenciesand low reliability, since the sensed physical phenomenon changes slowly and fewpacket misses can be tolerated. Alert messages, such as fire or intruder detection, cantolerate small, few second delays but high reliability is critical. Control traffic thatis used for interaction between users and devices necessitates low latency and highreliability. While the throughput requirements for all of these applications are low,high capacity WSNs may also be used e.g. for multimedia streaming that requirehigh bandwidth [3, 113]. As a single network may comprise traffic from differentclasses, QoS support is needed to fulfill the service level requirements.

6 1. Introduction
Table 2 shows an example use classes in industrial WSNs based on the patterns ofintended use, specified by the ISA standard organization in its ISA100.11a standard[74]. In process industry, latency and reliability are often critical but monitoringapplications can tolerate delays while human triggered control actions (open loop)and automatic control actions (closed loop) have strict timing and reliability require-ments. Traffic that triggers emergency actions must always be delivered with verylow latency and high reliability. In the context of ISA specifications, the scope of thisThesis are the low energy protocols that are suitable for classes 3-5. The other classesare meant for automated control with very high reliability requirements and latenciesin order of milliseconds.
To ensure that the network performance meets the desired QoS, network diagnosticsis required both in protocol testing and practical deployments. Although some ofthe issues can be eliminated with a careful deployment, a practical network mighthave software failures, logical errors in protocols and algorithms, and node failuresdue to energy depletion or hardware failures. Identifying problems in a large scaledeployment is particularly challenging as problems may reflect to several parts of thenetwork. This necessitates diagnostics to detect and identify the performance issues.
1.4 Scope, Objectives, and Methods of Research
The scope of this research consists of QoS definition and protocols for low energy,resource constrained WSNs. QoS is considered on MAC, routing, and transport lay-ers as presented in Fig. 2. Sensing applications are covered based on their servicerequirements. Application specific algorithms, data aggregation [29, 46], sensing[172], and hardware designs are outside the scope of this Thesis.
The first objective of this Thesis is to define QoS for low energy WSNs to enable
Table 2. Usage classes for wireless sensor networks [74].
Category Class Description Criticality oflatency
Safety 0 Emergency action Always criticalControl 1 Closed loop regulatory control Often criticalControl 2 Closed loop supervisory control Usually non-criticalControl 3 Open loop control Non-critical
Monitoring 4 Alerting Non-criticalMonitoring 5 Data logging Non-critical

1.5. Results and Contributions 7
Fig. 2. The scope of this Thesis is on protocol designs at MAC and routing layers.
quantitative performance comparisons between different networks. The second ob-jective is to design communication protocols that realize the defined QoS in practice.The third objective is to develop methods to measure and manage QoS in WSNs, thusallowing verification that the network performance met the user expectations.
The research started by identifying the QoS issues and requirements with a literaturereview and examining of the requirements of typical sensor applications. These re-sults were used as a basis for defining the WSN QoS definition and protocol designsfor QoS. The protocols were verified with simulations on Network Simulator 2 (NS2)tool, prototype implementations in Tampere University of Technology Wireless Sen-sor Network (TUTWSN) [91], and real-world deployment studies. TUTWSN is aWSN technology developed in the Department of Computer Systems at TampereUniversity of Technology (TUT) for low data rate monitoring applications. TheTUTWSN platform was used to verify the practical feasibility of the results of thisThesis. As an exception, the protocol presented in [P5] was tested in IEEE 802.11Wireless Local Area Network (WLAN) [68] environment. Finally, embedded self-diagnostics were designed and utilized to analyze the performance in deployments.
1.5 Results and Contributions
The main results of this Thesis are
• A survey of existing QoS communication protocols and standards for low en-ergy WSNs [P1-P6],
• Definition of metrics that allow assessing QoS quantitatively [P4],
• QoS support layer for Wireless Mesh Networks (WMNs) [P5],
• QoS control algorithm for WSN MACs [P2,P6],

8 1. Introduction
• Energy-efficient QoS routing protocol [P1],
• WSN self-diagnostics defining collected performance data on a sensor nodeand how the data is transmitted to the gateway for further analysis [P3], and
• Diagnostics tool to analyze the collected diagnostics information [P3].
1.6 Thesis Outline
The Thesis consists of an introductory part and 6 publications [P1]-[P6]. The intro-ductory part motivates the work, presents technical background, and summarizes theresults. The results are presented in the publications.
The rest of the introductory part is organized as follows. WSN application space,WSN related standards, and the research background on QoS protocols are providedin Chapters 2 and 3. Chapter 4 presents the TUTWSN platform that was used in theimplementations and presents the deployments that were used to verify the resultsof this Thesis. The rest of the Chapters describe the results of this Thesis: Chapter5 defines QoS metrics for WSNs, Chapter 6 composes the research results on QoSenabled WSN protocol design, and Chapter 7 presents sensor self-diagnostics frame-work and diagnostics tools for measuring and analyzing WSN QoS. The publicationsincluded in this Thesis are summarized in Chapter 8. Chapter 9 concludes the Thesis.

2. APPLICATIONS AND STANDARDS
This chapter presents the main requirements for sensing applications, covers the cur-rent key communication standards of the area, and discusses their applicability toWSNs.
2.1 Applications
While the application domain for WSNs is diverse, the applications can be classifiedwith few basic characteristics. In general, a WSN may execute one or more of thefollowing application tasks [4, 80]:
• Data logging: A node measures certain physical phenomenon e.g. tempera-ture, humidity, or luminance. The measurement may be triggered periodicallyor when a change is detected.
• Event detection: A node monitors and detects an event of interest, e.g. motionor a sensor reading that exceeds certain limits.
• Object classification: A node processes sensor values to identify the type ofobject or event, possibly combining values from several sensors. For exam-ple, the network might determine the type of moving object (animal, human,vehicle, etc.).
• Object tracking: Sensor information is used to trace the movement path of amobile object based on location, direction, and speed estimates.
• Control: A node controls actuators, such as light switches or valves, based ondirect commands from an user or an automation system, or by making inde-pendently decisions based on measured sensor values.
The tasks listed are complementary to each other, and a task does not need to beactive all the time. Many tasks require collaborative operation between nodes, e.g.combining values from several sensor nodes to give more accurate sensor value or

10 2. Applications and Standards
object classification. As an example, a surveillance network may perform continuousdata logging, while the collected data is used as a basis for event detection. Afteran event (e.g. motion) is detected, the network classifies the moving object. Objecttracking could be activated only when an unauthorized object is detected.
2.2 Wireless Communication Technologies
Wireless communication technologies are categorized based on their typical coverageand application domains [49, 65, 112]. The link range, data rate, mobility, and powerrequirements of the technologies are presented in Fig. 3. The values are not definitebut illustrate the differences between the technologies. In the figure, RF communica-tions is assumed as it is most widely used and does not have inherent limitations suchas line-of-sight requirement in infrared.
Wireless Wide Area Network (WWAN) covers a large geographical area and con-sists of telecommunications networks such as Global System for Mobile Communi-cations (GSM) and satellite communications. In telephone networks, broadband datais supported with packet-switched data services such as General Packet Radio Ser-vice (GPRS) or Universal Mobile Telecommunications System (UMTS). Mobilityrequirements are critical, as uninterrupted service is expected even when a user istraveling on high-speed rail (200+ km/h) [125].
Wireless Metropolitan Area Network (WMAN) covers geographic area or region thatis smaller than WWAN but larger than WLAN. An examples of WMANs is IEEE802.16 (WiMAX) [71]. Both WWAN and WMAN use highly asymmetric devices, assimpler end devices connect to base stations. As such, these networks are intended forsingle hop uses where the wireless access is used to connect to the Internet or globaltelephone network [35]. Wireless multihop support is rare and typically limited tobase stations.
WLAN spans a relatively small area, such as building or a group of buildings. IEEE802.11 [68] is the dominant WLAN technology. It was originally targeted to access awired Local Area Network (LAN) with wireless interface but has been since extendedto support mesh networking in 802.11s extension. IEEE 802.11 is widely utilized fornetwork access in public buildings and enterprises, and sharing Internet in homes.
Wireless Personal Area Network (WPAN) is a short distance network for intercon-necting devices centered around an individual person including watches, headsets,mobile phones, audio/video equipment, and laptops. Bluetooth [15] and IEEE 802.15standard family [69, 70] are the most widely used WPAN technologies. WPANs have

2.3. WSN Communication Standards 11
Fig. 3. Properties of wireless communication technologies.
varying energy and throughput requirements as the use cases range from low powerdata exchange with portable devices to high data rate home entertainment and multi-media transfers.
WSN shares most properties with WPANs and may utilize similar technologies. Forexample, IEEE 802.15.4 low-rate WPAN standard [70] is used as a basis for manyWSN communication standards. However, a WSN is designed for multiple users, hasusually more devices, and often emphasizes lifetime.
2.3 WSN Communication Standards
Standards promote interoperability between products from different manufacturers.Table 3 lists standards and industry specifications suitable for WSNs. The support forPhysical layer (PHY), MAC, Network (NWK), and Transport (TRP) denotes that thetechnology defines the layer in question. Application Support (APS) defines appli-cation profiles that detail services, message formats, and methods required to accessapplications.
IEEE 802.15.4 Low-Rate Wireless Personal Area Networks (LR-WPANs) uses CarrierSense Multiple Access with Collision Avoidance (CSMA/CA) for channel access andsupports real-time applications via guaranteed time slots. A network comprises threetypes of devices: a Personal Area Network (PAN) coordinator, coordinators, and enddevices. Coordinators are more complex but can route data while the end devices canbe realized with simpler hardware. A network may operate in two modes. In a non-beacon enabled operating mode, the coordinators listen to the channel continuouslytherefore necessitating mains power. In a beacon enabled mode, coordinators trans-mit periodic beacon frames that are used for synchronization. A beacon identifiesPAN and describe the structure of the following superframe. Beacons allow low duty

12 2. Applications and Standards
Table 3. Key WSN communication standards.
Freq. Databand rate Protocol layers
Standard (MHz) (kbps) PHY MAC NWK TRP APS
IEEE 802.15.4 868 20 # # #
IEEE 802.15.4 915 40 # # #
IEEE 802.15.4 2400 250 # # #
ZigBee - - # # #
Bluetooth Low Energy 2400 1000
Z-Wave 865 40 #
Z-Wave 915 40 #
MiWi 2400 250 G# # # #
ANT/ANT+ 2400 1000 #
WirelessHART 2400 250 G#
ISA100.11a 2400 250 G#
WIA-PA 2400 250 G#
ONE NET 868/ 38.4 # # #
ONE NET 915 230DASH7 433 27.8 # # #
IEEE 1902.1 RuBee 0.131 1.2 # # #
defined in standard, # not defined, G# reuse of IEEE 802.15.4 PHY
cycle operation where nodes wakeup to receive beacons and participate superframe,but remain in low power sleep state most of the time.
ZigBee technology [215] defines network and application layers on top of the IEEE802.15.4. A device referred to as a ZigBee coordinator controls the network. Thecoordinator is the central node in the star topology, the root of the tree in the treetopology, and can be located anywhere in the peer-to-peer topology. ZigBee definesa wide range of application profiles targeted at home and building automation, remotecontrols, and health care.
MiWi [48] specified by Microchip Technology Inc. is a simplified version of the Zig-Bee. It uses IEEE 802.15.4 non-beacon enabled mode and supports small networksup to 1024 nodes.
Z-Wave [210] is targeted at building automation and entertainment electronics. Atypical Z-Wave network contains a mixture of AC powered and battery powerednodes. The lifetime of routing nodes is very limited, as they listen continuously tothe channel. The maximum number of nodes in a network is 232. Supported networktopologies are star and mesh. Z-Wave has been developed by over 120 companies

2.3. WSN Communication Standards 13
including Zensys, Intel and Cisco.
WirelessHART [73] and ISA100.11a [74] are targeted at process industry applica-tions where process measurement and control applications have stringent require-ments for end-to-end communication delay, reliability, and security. The standardshave similar operating principle and the convergence of the standards is planned inISA100.12 [158]. Both standards build on top of the IEEE 802.15.4 physical layerand utilize a Time Division Multiple Access (TDMA) MAC that employs networkwide time synchronization, channel hopping, channel blacklisting. A centralized net-work manager is responsible for route updates and communication scheduling forentire network. However, as the centralized control of TDMA schedules limits thenetwork size and the tolerance of a WSN node against network dynamics, the usabil-ity of the standards is limited to relatively static networks.
Wireless network for Industrial Automation – Process Automation (WIA-PA) is orig-inally a Chinese specification for industrial automation but is also approved as an in-ternational standard by International Electrotechnical Commission (IEC) [96]. WIA-PA uses IEEE 802.15.4 physical and MAC layers. The standard specifies how theguaranteed time slots of IEEE 802.15.4 are allocated, defines adaptive frequency hop-ping, and allows aggregating several short packets into one packet to reduce overhead.Compared to WirelessHART and ISA100.11, WIA-PA is more adaptable to varyingtraffic loads but does not have as good real-time guarantees due to the limited amountof contention-free in IEEE 802.15.4 [214].
Bluetooth Low Energy (BLE) is an extension to the Bluetooth technology [15] aimedat low energy wireless devices. Devices advertise their presence with periodic bea-cons, while listening to the channel briefly for incoming connection or data requestsafter each advertisement. Data is exchanged with attribute/value pairs. Advertise-ments can also contain data and connections are established fast (less than 3 ms),therefore avoiding the need to stay in connected state and enabling devices to saveenergy in standby states.
ANT [43] defined by Dynastream Innovations Inc. is used e.g. by Suunto and Garminin their performance monitoring products. ANT is based on virtual channels that aredefined by operating frequency and message rate parameters. Due to TDMA basedcommunications, several channels may operate on same physical frequency. Masternodes always receive, while slaves transmit when new data is provided. Complextopologies can be formed as each node may act as a master and a slave on differ-ent channels. ANT+ extension includes profiles defining data formats and channelparameters.

14 2. Applications and Standards
ONE-NET [182] is an open-source WSN specification comprising MAC and rout-ing protocol designs and example hardware schematics. It operates on 868/915 MHzwith the data rate of 38.4-230 kbps. ONE-NET supports low duty cycling for batterypowered devices but routing nodes must keep their transceivers active thus necessi-tating mains power.
DASH7 [153] technology based on ISO 18000-7 standard is targeted at very low ratedata applications. Its main cited benefit stems from the 433 MHz operating frequency,which provides longer communication ranges and less crowded wireless channel thanthe typical 2.4 GHz frequency band [121]. DASH7 has the nominal communicationrange of 250 m at 0 dBm transmission power level, compared to 75 m of ZigBee and10 m of Bluetooth (High Rate variant) [121].
IEEE 1902.1 (RuBee) [67] fills the gap between WSN and Radio Frequency Identifi-cation (RFID) technologies. Unlike other listed technologies, signal does not includeelectric field component but uses magnetic dipole antennas. Thus, signal is unaf-fected by water and metals either enhance or do not affect the signal. RuBee nodes,referred to as tags, can be very simple identity tags or use 4-bit MCU, 0.5 kB-2 kBSRAM, optional sensors, signal processing firmware, displays and buttons [124]. Thenominal data rate is small, 1.2 kbps, limiting the applicability of RuBee.
2.4 Technology Integration via Internet of Things
Internet of Things (IoT) is a new paradigm that aims to integrate heterogeneous com-munication technologies to the part of global network infrastructure in a way thatthey can be used seamlessly with each other [218]. This enables co-operation andinteraction between a variety of things or objects, e.g., RFID tags, sensors, actuators,mobile phones, and computers [8]. In practice, this means making individual sensorsand actuators addressable anywhere from the Internet either by using Internet Pro-tocol (IP) for end-to-end communications, or via gateway adaptation by convertingmessages to technology specific formats and mapping network’s internal addressesto the global IP addresses.
Internet Engineering Task Force (IETF) has defined IPv6 over Low power WirelessPersonal Area Networks (6LoWPAN) standard to describe how IP is used in IEEE802.15.4 networks. It addresses IP routing on mesh networks and defines meth-ods to allow transmitting large sized IP packets in bandwidth constrained environ-ments. Other features addressed in 6LoWPAN include network autoconfigurationand multicast emulation. 6LoWPAN is also being adapted for Bluetooth Low Energy

2.5. Conclusion on Standards 15
[120]. The header compression and unicast and multicast methods defined for IEEE802.15.4 are reused in the Bluetooth Low Energy adaptation, while the Bluetoothaddress mapping to IP addresses is defined.
Constrained Application Protocol (CoAP) is an interface protocol especially targetedfor constrained networks and machine-to-machine applications such as smart energyand building automation [161]. The protocol operates over User Datagram Proto-col (UDP) and is designed according to the REST architecture. As such, the protocolis easy to map to Hypertext Transfer Protocol (HTTP) and Universal Resource Iden-tifiers (URIs), therefore enabling web integrated sensors. Messages can be cached toimprove performance, e.g. at the gateway to avoid requesting data directly from sen-sor network. Other features supported by CoAP are multicast support and congestioncontrol.
2.5 Conclusion on Standards
WSNs are being deployed for a wide range of uses, each with varying QoS require-ments. This demands QoS protocols that allow adjusting service level based on ap-plication demands. While a wide range of WSN standards have been introduced,none of the standards cover the entire WSN application space. Instead, each standardoptimizes its operation for a certain use case.
Current WSN standards have been mostly lacking controllable QoS support. Zig-Bee uses link reliability in its routing but does not otherwise consider QoS. IEEE802.15.4 supports bandwidth reservations for real-time traffic and throughput guar-antees. However, the mechanism is requires explicit reservation handshaking, mak-ing it mainly applicable for Constant Bit Rate (CBR) traffic. Also, an upper layerreservation protocol is required to trigger the reservation process. ISA100.11a, Wire-lessHART, and ANT enable fine grained QoS by allowing network wide control ofchannel access times. This enables delay and throughput guarantees for end-to-endflows, but requires prior knowledge of network traffic and disallows dynamic traf-fic. Thus, the applicability of the protocols is limited to relatively static networks orsimple devices, where traffic consists of predetermined polling.

16 2. Applications and Standards

3. RELATED RESEARCH ON QOS METRICS AND PROTOCOLS
This chapter discusses the related work on QoS methods and protocols relevant tothis Thesis. First, existing QoS standards and their suitability for WSNs is discussed.Then, models and frameworks that measure and manage QoS are presented. Finally,this chapter surveys QoS communication protocols proposed in the literature.
3.1 QoS Standards in Computer Networks
QoS has been extensively studied in wireless LANs and wired computer networks.For example, IP [132] and Asynchronous Transfer Mode (ATM) [178] provide ex-tensive QoS support ranging from best-effort service to guaranteed service. The QoSmodels in IP can be divided in the following categories: best-effort, relative prioritymarking, service marking, label switching, Differentiated Services (DiffServ) [117],and Integrated Services (IntServ) [18]. The best-effort service is the simplest andmeans that QoS is not specifically addressed.
The other service models provide a variable degree of QoS. The IP header contains aprecedence field for providing relative priority marking and a Type of Service (TOS)/ Differentiated Services (DS) field for providing service marking [117]. Relative pri-ority marking and service marking describe the desired service within the IP headerof a packet. The priority marks the importance of the packet (e.g. delay and drop pri-ority). The service marking allows selecting a routing path that prefers either delay,throughput, reliability, or (monetary) cost.
Label switching [146], DiffServ and IntServ operate on traffic aggregates instead ofmarking a single packet. Label switching is used within a single network to routedata along a specific path. In DiffServ, the traffic entering the network is classifiedand each class is assigned with different behavior. This approach to QoS is referredto as Class of Service (CoS). IntServ provides service guarantees by defining twotypes of services: guaranteed service and guaranteed load service [18]. The guaran-teed service uses reservations to enable end-to-end QoS and to guarantee the wanted

18 3. Related Research on QoS Metrics and Protocols
throughput together with maximum delays [162].
QoS has been addressed also on cellular and WMANs. However, the protocols usedin these networks differ greatly from WSNs as they have only one wireless hop lo-cated between an end device and a base station. A backbone network is usually wiredand based on circuit switching, IP, or ATM.
The QoS standards in computer networks are computationally complex, utilize ex-tensive routing tables requiring large data memory, or impose high communicationoverhead due to extensive messaging. Thus, they are not applicable to the resourceconstrained WSNs [4, 107, 213].
3.2 Performance Analysis
QoS need to be defined to allow comparing the user requirements to the realizedperformance. While several studies have evaluated the QoS related challenges andunique problems of WSNs [3, 27, 193, 206], only few of the published articles tryto define WSN QoS. Dietrich and Dressler [37] aim to formalize network lifetimedefinition by mapping node availability, sensor coverage, and network connectivitymetrics to the lifetime. Qiang et al. [133] define a QoS evaluation model whichmaps application layer parameters to network layer parameters with fuzzy logic. Theapplication layer parameters comprise data accuracy, network lifetime, response time,and event detection probability. The network layer parameters consist of energy-efficiency, packet delay, throughput, and reliability. However, these works examineQoS only partially, and mainly from the perspective of sensor coverage. Networklayer is considered only with the traditional QoS metrics.
The research on network performance measurements concentrates mainly on detect-ing misconfigured nodes [106], compromised nodes [38], software assertions and re-mote debugging [87, 198], and collecting sensor readings and detecting anomalies inthe sensor data [45, 217]. While the detected anomalies can trigger a distributed selfmanagement e.g. to compensate the fault by increasing sensing threshold on othersensors [148], the failure is often only reported to the gateway[207]. Generic purposeUI tools offer a framework for visualizing sensor networks but do not consider theactual methods to analyze the data [208].
Only few papers consider actual QoS performance measurements. Ringwald andRömer [141] list possible performance problems and their causes on WSN deploy-ments but do not specify any methods to measure or detect the issues. Softwarearchitecture that considers energy, neighbor, and link quality diagnostics is presented

3.3. Network Diagnostics 19
in [174]. The fault management method presented in [149] distinguishes betweenfaulty and depleted nodes. Nodes report their energy to the sink, and a fault is as-sumed if a node does not reply to a query but should have energy left based on thelast reported energy.
Haapola proposes goodness metric [59] for performance analysis that is composedfrom an expected average transmission energy consumption, throughput, and trans-mission delay metrics. These metrics are scaled with application dependent weightsto estimate the suitability of a protocol for a certain application scenario, e.g., settingthe weight of transmission delay to zero if it is not important. Furthermore, Haap-ola defines models to calculate the proposed metrics, and therefore goodness for acontention-based MAC protocol [58].
3.3 Network Diagnostics
In computer networks, Simple Network Management Protocol (SNMP) has becomethe de facto network management and monitoring protocol [154]. SNMP is an ap-plication layer protocol that accesses virtual information storage, referred to as aManagement Information Base (MIB), located at the target device. As a MIB con-tains device and protocol specific information, hundreds of specifications have beendefined, both by IETF and by other organizations as manufacturer specific extensions.Kim et al. [82] have proposed MIB for 6LoWPAN, comprising device address androle (coordinator, router, non-router), device capability information (e.g., can devicebe a coordinator), type of power source, and the enumeration of routes and knownneighbors. Other diagnostics information, such as reliabilities, were not considered.
Research effort has been made to improve the suitability of SNMP for constraineddevices by reducing traffic overhead [31, 154]. While the SNMP design is consideredrelatively light weight [154], its memory requirements can still be prohibitive forresource constrained nodes. In [93], it was found that a full implementation of SNMPon a AVR Raven platform with 6LoWPAN required 30.5 kB program memory and1 kB data memory, which correspond to 24% and 7% of total, respectively. A limitedimplementation with SNMPv1 and without authentication/privacy options reducedthe memory requirements to 8.6 kB (7%) program and 0.47 kB (4%) data memory.Still, SNMP can be used e.g., with a gateway acting as proxy/adapter that convertsin-network WSN diagnostics to SNMP [154].
As determining the level of performance and identifying potential network problemsare important both for end-users and developers, many current network technologies

20 3. Related Research on QoS Metrics and Protocols
support at least basic in-network diagnostics. For example, ZigBee allows queryingnode’s approximate energy level (near empty, half, full), and node’s neighbors andlink qualities [216]. Due to their tight reliability requirements, WirelessHART andISA100 standards have extensive diagnostics support. The supported features com-prise remaining lifetime estimate, neighbor and traffic information, and the averagelatency from gateway to device.
The related research proposals on network diagnostics can be categorized to passivemonitoring, deployment support networks, and in-network diagnostics. These arediscussed in the following sections.
3.3.1 Passive monitoring
Passive monitoring tools are typically portable devices that listen to the WSN traf-fic. They can be used without explicit planning and do not cause any overhead tothe monitored network. The simplest passive monitoring tools act as packet sniffers,while more advanced functionality includes bandwidth usage and connectivity anal-ysis. A complete network view can be formed by combining data from several packetanalyzers, thus allowing to reconstruct the network topology, determine bandwidthusage and routing paths, make connectivity analysis, and to identify hot-spot nodes.For example, Chen et al. in [26] log packets to Flash memory until the packet snif-fers are manually retrieved later. An offline software merges and analyzes the packettraces. The multi-sniffer approach proposed in [199] allows visualizing the otherwisecomplex behavior of a WSN with a graphical view. The proposed system is also ableto replay the recorded network activities at different speeds.
3.3.2 Deployment Support Networks
Deployment Support Network (DSN) refers to a separate diagnostics network that isinstalled alongside the actual sensor network [13]. As such, the DSNs are typicallyshort-lived and removed once the network operation is verified. A DSN node hastypically two radios: one for overhearing WSN traffic, and a second for forming thesupport network to forward the overheard packets to a gateway. LiveNet proposed in[26] uses wired Ethernet for collecting data. This ensures that wireless interferencedoes not affect diagnostics collection but also increases the network deployment ef-fort. [142] and [42] define wireless DSNs that use Bluetooth scatternet with up to100 mW transmission power. The high performance radio reduces the lifetime of theproposed DSNs to few weeks with two AA-size batteries. In general, due to doubled

3.4. QoS Protocols 21
hardware and increased costs DSNs are best suited for protocol testing and develop-ment.
3.3.3 In-Network Diagnostics
In in-network diagnostics, nodes collect diagnostics information concerning their op-eration and pass it to the gateway using the same communication protocols and radiosthan the sensor data. The approach has two distinct benefits. First, additional diag-nostics equipment is not needed which makes collecting the diagnostics throughoutthe lifetime of the network feasible. Second, nodes can include information abouttheir internal operation and decisions making. The main drawback is that the diag-nostics information consumes bandwidth in an already resource constrained network.
A diagnostics method presented in [101] piggybacks status information to data pack-ets. The method marks a packet with a forwarding node identifier if the packet isreceived out-of-sequence. This allows detecting the existence and location problemsbut does not reveal reasons for problems (e.g. interference or bad link). Visibilitymetrics introduced in [190] considers the cost (e.g. in terms of bandwidth or energy)to collect diagnostics from a network. The metric constructs tree-based decisiongraph that contains potential problems in the network. The visibility cost is cal-culated by assigning a probability and information collection cost to each problem.However, the paper does not specific any metrics.
3.4 QoS Protocols
The communication protocols presented in this section are categorized based on thelayers for which they are primarily targeted at. However, the distinction betweenthe layers is not always clear because many WSN communication protocols imple-ment features that traditionally belong to several layers [107, 167]. This enableslow complexity protocol designs that meet the resource constraints [6]. Also, it im-proves overall network performance as cross-layer information allows more optimalforwarding decisions [213].
The related work is limited to the protocols that consider network QoS. Applicationspecific QoS, such as sensor coverage [172], sensor accuracy [173], exposure 1, andmeasurement errors [27] are outside the scope of this Thesis. Furthermore, as the
1 Exposure denotes locating sensors in such way that effects from obstacles are minimized

22 3. Related Research on QoS Metrics and Protocols
number of protocol proposals is very large2, the protocols in this Chapter are meantto be representative examples of discussed techniques instead of exhaustively namingeach protocol.
3.5 Medium Access Control Layer
A MAC layer manages transmissions and receptions on a shared wireless medium,therefore having a significant impact on performance and energy consumption [84].This section describes the typical WSN MAC design principles and their effect toQoS. The protocols are classified based on their channel access technique and theuse of duty cycling as presented in Fig. 4.
3.5.1 Channel Access Techniques
MAC protocols can be categorized into contention and contention-free protocols.Alternatively, these are also referred to as random and scheduled protocols [59].In contention-based protocols, bandwidth is divided among nodes on-demand ba-sis. The method achieves low latencies and relatively good bandwidth utilization onlightly loaded networks or when the number of contending nodes is low [36]. When anetwork is loaded by multiple nodes, a collision avoidance scheme is required to pre-vent significant performance degradation. In WSNs, contention protocols typicallyutilize CSMA/CA [184] which checks channel activity prior to a transmission anddefers a transmission for a random backoff interval, referred to as Contention Win-dow (CW), to avoid collisions [36, 39, 175, 204]. The backoff time is a compromise
2 As an example, a search on IEEE Xplore digital library concerning routing protocols alone, withwireless, sensor, network, and routing in the publication title, produced 1504 publications betweenyears 2001-2011.
Fig. 4. Classification of MAC protocols.

3.5. Medium Access Control Layer 23
between latency, bandwidth utilization efficiency, and collision probability.
Typical problems in the contention-based protocols comprise the hidden node (hiddenterminal) problems [185] and idle listening. Hidden node problem can be preventedwith an additional signaling such as Request To Send (RTS)/Clear-To-Send (CTS)mechanism or a combination of carrier sensing and control packets. However, theseincrease communication overhead [89]. The idle listening is a result of unknowntransmission times, which necessitates a receiver to sense channel continuously forincoming packets [187, 203].
In contention-free schemes, transmissions are arranged for collision free channel ac-cess. The typical contention-free schemes are polling, TDMA, Frequency DivisionMultiple Access (FDMA), and Code Division Multiple Access (CDMA) [89]. Pre-determined channel access minimizes idle listening, avoids collisions, and enablesaccurate QoS control, as transmission times and capacity can be assigned determin-istically. However, the drawbacks are synchronization and slot assignment overhead.In traditional TDMA systems, Transmission (TX)/Reception (RX) slots are assignedby a central manager which reduces scalability. Therefore, many WSN proposalsuse distributed methods where nodes exchange known reservation information withintwo-hop neighborhood [25, 61, 94, 140].
Another problem in the contention-free protocols is determining the correct amountof reservations. As a monitored physical phenomenon may generate traffic burstswhen an event triggers, slot usage increases momentarily and unpredictably. Further-more, traffic varies even with CBR sources as varying channel conditions cause linkbreaks, packet errors, and retransmissions. As a result, capacity is either over or un-der reserved. Unused capacity is wasted and consumes energy due to unnecessarilyreception, while too low reserved capacity increases transfer delays and may causepacket losses [79]. For these reasons, a pure contention-free scheme is mainly ap-plicable for static or centrally controlled networks [89]. However, a contention-freeprotocol can react to traffic bursts by reserving only a part of the slots, while usingother slots dynamically on-demand. For example, in Y-MAC [83] a node operatesinitially on a certain base channel but uses additional channels for traffic bursts. Af-ter a successful reception, a node switches another channel and listens to the nexttime slot. Still, the reservation problem for the base channel slots remain in Y-MAC.
Hybrid approaches aim to combine the flexibility of contention-based protocols to theenergy-efficiency and reliability of the contention-free techniques. IEEE 802.11 andIEEE 802.15.4 protocols support both schemes. However, the contention-free accessis usually used only for guaranteed throughput. The Contention-Free Period (CFP)

24 3. Related Research on QoS Metrics and Protocols
slot reservations are constant and changes has to be negotiated between communi-cating nodes, making the approach taken in these protocols inflexible. Traffic adap-tive medium access protocol (TRAMA) [136] alternates between random access andscheduled periods. Nodes may join a network only during the random access period.Then, nodes exchange information in two-hop neighborhood about their intended re-ceivers and construct transmission time schedule based on this information. Thus,the protocol avoids assigning time slots to nodes without traffic therefore minimizingidle listening. Z-MAC [139] combines CSMA and TDMA based approaches. Timeis divided into communications slots where each slot may be assigned to a certainnode (owner). CSMA is used in each slot but owners use a shorter backoff time,thus giving them an earlier chance to transmit. Other nodes may steal the slot if it isnot used by its owner. Thus, Z-MAC uses TDMA scheme as a hint to enhance con-tention resolution. The scheme allows robustness to various slot assignment failuresand topology changes.
3.5.2 Low Duty Cycling
Due to the requirement for long term deployments and battery powered operation,most of the proposed sensor MAC protocols concentrate on lifetime maximization[4, 89, 156]. In the wireless networks, transceiver consumes most energy [52, 189].Thus, a common goal for energy-efficient MAC protocols is reducing the transceiveractivity by minimizing idle listening, collisions, and protocol overhead [84].
Several WSN protocols utilize low duty cycle operation, in which duty cycle (trans-ceiver activity) is adjusted to the network traffic therefore minimizing the idle listen-ing. Although duty cycling decreases energy usage, it increases forwarding latencydue to sleeping delay: a node must wait until the next active time before a packet canbe forwarded [204].
Duty cycling may use either synchronized or unsynchronized approach as illustratedin Fig. 5. In the synchronized method, a node maintains a periodic sleep scheduleconsisting of active and idle periods [134]. The synchronization is commonly real-ized by transmitting beacon frames at the beginning of an active period. The repeatedperiod is referred to as an access cycle or a superframe. A node may need to wakeup multiple times during an access cycle to forward data if its neighbors use differentschedules. In a typical approach, a node receives data during its active period. Theactive period can be realized with either contention or contention-free channel accesstechnique. During the idle period, a node forwards data to its neighbors (participatesanother node’s active period) or saves energy by sleeping.

3.5. Medium Access Control Layer 25
IEEE 802.15.4 LR-WPAN supports a synchronized low duty cycle approach wherecoordinators have temporally non-overlapping active periods within the interferencerange. In contrast, S-MAC [203, 204] and its derivatives, including T-MAC [187],nanoMAC [58], DSMAC [99], RMAC [39], and DW-MAC [175], aim to use acommon sleep schedule (overlapping active periods) between nodes. The approachreduces control messaging but is applicable only for contention-based channel ac-cess. All packets, including beacons, are transmitted with Carrier Sense MultipleAccess (CSMA) utilizing RTS/CTS mechanism. This allows relaxing synchroniza-tion requirements, and it reduces overhead as there is no need to transmit beaconsevery access cycle. T-MAC [187] improves S-MAC by adjusting active period lengthdynamically based on traffic requirements. An active periods ends when traffic is notreceived within a certain time interval.
NanoMAC [58] adds a support for block acknowledgments. DSMAC [99] keepsactive period length constant but scales access cycle length (sleep time) according totraffic. RMAC [39] improves S-MAC by sending control frame via multiple hops thatassigns reception schedules so that routing latency is minimized. DW-MAC [175]adds support for contention-free channel access by using sleep periods for communi-cation: frames transmitted in data period reserve proportional portion of sleep period.
Unsynchronized low duty cycle protocols use typically Low Power Listening (LPL)mechanism. In LPL, nodes poll channel asynchronously to test for incoming trafficinstead of transmitting regular beacons. Transmissions are preceded with a preamblethat acts as a wake-up signal. For correct operation, the preamble must be at leastas long as poll interval. A node detecting the preamble listens to the channel until apacket is received or a timeout occurs. As the preamble is often longer than the ac-tual transmission, a node may experience significant delay as it must wait until other
Fig. 5. Beacon synchronized and unsynchronized low duty cycle channel access techniques.Node A forwards a data frame to node B.

26 3. Related Research on QoS Metrics and Protocols
transmissions are complete [176]. For example, in Fig. 5 (right) node A misses oneof its periodic polls while transmitting the preamble. Thus, LPL MACs are mainlysuitable for light traffic loads [171]. LPL is used in IEEE 1902.1 and DASH7 stan-dards.
The proposed enhancements to the basic LPL scheme aim to optimize the preamblelength [131, 205]. WiseMAC [44] attempts to improve the efficiency by reducing theduration of preamble transmission with a fixed wakeup schedule and frequent com-munication between neighbors. X-MAC [20] transmits multiple short preambles withthe address of intended receiver. Upon receiving a short preamble, the destinationnode sends an acknowledgment between the preambles which triggers transmission.SCP-MAC [205] uses LPL mechanism with synchronized channel polling. This re-duces energy as only short preamble is needed. The synchronization is realized bybroadcasting periodic synchronization frames.
Receiver Initiated MAC (RI-MAC) [176] reverses the reception and transmissionphases in the LPL scheme. Instead of transmitting a preamble, a sender turns ittransceiver on and listens until the receiver transmits a beacon frame. This triggersthe transmission. A receiver acknowledges frame with another beacon thus extendingthe active period and allowing traffic bursts. Beacon interval is randomized around aset value to reduce collisions. The method improves throughput and reliability overother LPL schemes. However, depending on the traffic patterns, the energy-efficiencycan be lower as typical low power WSN transceiver consumes more energy in recep-tion state due to employed de-spreading and error correction techniques [22].
3.5.3 QoS Support in MAC
MAC layer QoS concentrates on reliability, energy, and latency. Reliability is mainlyensured by controlling the amount of retransmissions [163]. Clustered operation in-creases network lifetime by dedicating energy consuming routing to cluster heads[90, 195]. Clustering is especially energy-efficient with synchronized protocols asonly cluster heads need to transmit beacon frames and listen to the channel exten-sively. Member nodes listen only to the beacons unless they have data for the clusterhead. To even energy consumption, the cluster head role may be rotated among thenodes belonging to a cluster [63].
Latency is controlled with priority based channel access and duty cycle schedulingapproaches. The priority based channel access assumes CSMA/CA and assigns ahigh priority packet with a shorter contention window, thus allowing an earlier trans-

3.6. Routing Layer 27
mission opportunity [102, 104, 200]. This approach was also taken in IEEE 802.11ewhich defines QoS for IEEE 802.11 WLAN networks. While the contention windowlength is typically determined by an application, other metrics can be used. Q-MAC[200] derives the number of transmitted hops, residual energy, and the proportionalload of an output queue.
Duty cycle scheduling aims to adjust active periods in a manner that minimizes thesleeping delay. The active period of a next hop is located immediately after the activeperiod of an forwarding node assuming that a frame from previous hop is receivedduring own active [95, 105]. However, this kind of adjustment is mainly useful foroptimizing routing delay toward one destination, e.g. when a network has one sink.This reduces the forwarding delay of packets that have traveled several hops andincreases the importance of traffic from low energy nodes while avoiding overloadingthe wireless medium.
3.6 Routing Layer
As several alternative routes to a destination node may exist, each with different QoSproperties, the route selection has a significant impact on QoS [60]. Furthermore,a single route with an optimal all-purpose QoS might not exist, thus necessitatingthe route selection based on application requirements. For example, one route mighthave minimum end-to-end latency while another route could be more reliable.
WSN routing protocols can be categorized based on their operation as node-centric,data-centric, location-based, multipath, or cost-based [5, 118]. The routing categoriesare presented in Fig. 6. These categories are not exclusive as a protocol can be bothdata-centric and query based.
Fig. 6. Categories of WSN routing protocols.

28 3. Related Research on QoS Metrics and Protocols
3.6.1 Node-centric routing
Node-centric approach is the traditional approach used in the computer networks inwhich nodes are addressed with globally unique identifiers [118, 147]. Node-centricprotocols typically rely on routing tables containing an entry for each route identi-fied by destination address and next hop node for the target. The routing table maybe constructed proactively by discovering routes to all potential targets, but this in-creases memory requirements and would not be practical in large networks. Instead,the node-centric protocols designed for ad-hoc wireless networks, such as DynamicSource Routing (DSR) [80], or Ad-hoc On-demand Distance Vector routing (AODV)[130], use a reactive approach in which routes are constructed only when needed.The drawback compared to the proactive approach is the route construction delaywhen sending first packets.
3.6.2 Location-based Routing
Location-based routing uses geographic location information to make routing deci-sion. The approach is natural to WSNs, as sensor measurements usually relate toa specific location. A basic principle in the geographic routing is to select a nexthop neighbor that is closer to the target node than a forwarding node [81, 119, 157].Location-based routing is scalable as routing tables are not needed and a network cansupport a high degree of mobility. However, determining the position for each nodecan be problematic. The use of positioning chips such as Global Positioning Sys-tem (GPS) increases the price and energy consumption, while manual configurationis not suitable for large scale networks.
3.6.3 Multipath Routing
In the multipath routing, a packet traverses from a source node to a target node viaseveral paths [47, 51]. The main goal is to increase reliability, as a packet can bereceived via an alternative path even if the routing in some path fails. However, themultipath routing has a trade-off between the reliability and energy, as it increasesnetwork load and energy usage due to the extra transmissions. Flooding packet toevery node in the network is the simplest case of multipath routing [30]. In flooding,each node forwards a new flood packet to all of its neighbors. To suppress duplicates,already received flood packets are not forwarded. Flooding is commonly used during

3.6. Routing Layer 29
the setup phase of several WSN routing protocols, but is not used for routing as suchbecause packets can easily congest network and thus decrease reliability.
Another approach to multipath routing is the constructing of several routing pathsfrom a source to the destination, but using only one path at the time e.g., when a linkbreaks. For example, Localized Multiple Next-hop Routing (LMNR) extends AODVby storing several minimum hop paths to the destination [114]. The used route isselected based on local cost metric that aims at load balancing. Several alternativemetrics for calculating the cost are proposed: size of IEEE 802.11 CW, outgoingbuffer usage, packet leaving rate, or route table size and freshness of the routes.
3.6.4 Data-centric Routing
In data-centric routing, data is routed based on its content rather than using senderor receiver identifiers. As the data-centric routing is already content aware, data-aggregation can be naturally performed. Data centric routing may take interest, ne-gotiation, or query approaches.
In the interest approach, a sink node request data from the network by sending arequest describing the data it wants to every node in the network [5]. A node forwardsthe interest and directs its routing tree toward the sink. Then, nodes that fulfill therequirements as defined in the interest start transmitting data to the sink. Althoughthe route construction is proactive, the interest based routing is scalable as the numberof sinks (data consumers) is low compared to the number of nodes (data sources).
Negotiation protocols exchange messages before an actual data transmission takesplace [88, 116, 137]. This saves energy, as a node can determine during the negoti-ation that the actual data is not needed. For negotiation protocols to be useful, thenegotiation overhead and data descriptor sizes must be smaller than the actual data.
Query based routing protocols request a specific information from the network [17,53]. A query might be expressed with a high level language such as Structured QueryLanguage (SQL). For example, a query might request “average temperature aroundarea x,y during the last hour”. The query can be routed via a random walk [160],flooded to the whole network [151], or directed at a certain region [100]. After thequery has been resolved, the result is transmitted back to the source.

30 3. Related Research on QoS Metrics and Protocols
3.6.5 Cost-based Routing
In cost-based routing, each node is assigned with a cost value that is relative to thedistance between a node and a sink [78, 209]. The cost may be calculated froman any metric, e.g. the number of hops, the required energy to forward a packet tothe sink [1], or throughput [34, 98]. The benefit of the cost-based routing is thatthe knowledge of forwarding path states is not required: a node forwards its databy sending it to any neighbor that has lower cost. The drawback is that the routesmust be created proactively. Also, although data to the sink is forwarded efficiently,another routing mechanism, such as flooding, must be used for data traveling in theother direction. However, the trade-off can be acceptable since most of the traffic isusually toward the sink.
IETF has defined Routing Protocol for Low-Power and Lossy Networks (RPL) as arouting protocol for constrained IPv6 networks [196]. RPL uses cost-based routingfor node-to-sink (many-to-one) communications and node centric routing for sink-to-node traffic. Nodes periodically broadcast routing information to their neighborswhich allows the detection of route changes. The routing cost is referred to as a rank,and it is calculated from one or more metrics with an objective function. A networkmay run multiple routing instances concurrently with different objective functions,e.g., separate instances for different sinks in the network. The instance is recognizedfrom identifiers included in routed packets. The node centric routing in RPL has twoalternative modes. In a non-storing mode, nodes advertise their parents to the rootwhich then uses (DSR-like) source routing. In a storing mode, each node stores arouting table containing the reachable child nodes.
3.6.6 QoS-aware Routing Proposals
Several research proposals point out that finding the optimal route subject to multipleQoS constraints is NP-hard problem, necessitating very high communication over-head [194, 197]. As the overhead is unacceptable in the resource constrained WSNs,routing proposals typically aim towards approximate solutions [197].
Only few routing protocols consider route reliability [62, 86]. In ZigBee [215], a perlink cost is calculated from a measured link reliability which improves throughputcompared to traditional shortest hop-count routing protocols [86]. However, otherimportant metrics, such as energy, are ignored. GRAB [202] uses controlled multi-path routing where a packet can be given a certain credit to allow extra transmissionsand thus make a trade-off between energy and reliability. However, similar or higher

3.6. Routing Layer 31
reliability and a smaller overhead could be achieved by using per-hop retransmissions[P4].
Many WSN routing proposals consider residual energy or forwarding energy [24,212]. In [155], a next hop is selected randomly between routes having the same cost.If the energy remaining in a node is low, the node discourages others from routingthrough it by increasing its cost. The protocol in [159] uses similar cost approach butselects the forwarding node with a probability that depends on the energy metric ofthe route. The maximum lifetime routing [24] calculates the cost by combining thetransmission and reception energy consumption with the residual energy of a node.
Some cost-based routing proposals target at minimizing maintenance energy by re-ducing the messaging overhead from the exchange of cost information. MinimumCost Forwarding [201] uses a backoff algorithm to reduce the message overheadduring the setup phase. The localized max-min remaining energy routing [10] min-imizes the exchange of routing information between nodes by introducing an extradelay that is inversely proportional to the remaining energy. Thus, the route with thelowest delay has the lowest energy usage.
Sequential Assignment Routing (SAR) [166] forms a multipath tree rooted at a sinknode. Next hop is selected by energy cost, QoS metric, and priority level of a packet.The QoS metric may be defined as required, for example, it may be based on linkdelay. On each hop, SAR calculates weighted cost from the link cost and prioritylevel assigned for a packet. Thus, a higher priority packet result into a lower weightedcost and can traverse through nodes that have less energy but ensure higher QoS. Thedrawback of the SAR is that the changes in QoS metrics, energy, or topology requirea recomputation of routes. SAR recovers from these changes by performing periodicupdates initiated by the sink node.
Directed diffusion [72] is a data centric routing protocol that has motivated manyproposals. It names data with attribute-value pairs and forwards data based on itscontents rather than using sender or receiver identifiers. Initially, a sink requests databy injecting an interest into the network, where it gradually disseminates to eachnode. The sink refreshes its interest periodically to recover from unreliable inter-est propagation. When a node receives an interest, it establishes a gradient towardthe sender node. Once the gradients have been established, directed diffusion offersenergy-efficient node-to-sink data delivery [16]. Loops are prevented by maintaininga data cache that contains recently received items and data rates for each gradient.In self-stabilizing diffusion protocol [12] nodes can query cached interests from theirneighbors. This allows better error recovery and reduces the need for refreshing inter-

32 3. Related Research on QoS Metrics and Protocols
ests. Source initiated directed diffusion [21] increases reliability by sending a packetvia multiple paths.
CEDAR [164] uses core nodes located in a grid topology to form a QoS path. Thedestination node is found by flooding within the core. Then, a directed search isperformed to find a QoS constrained path. The drawback with the CEDAR is thatthe network core may be broken at transient times due to network dynamics and therepair cost is high. CEDAR does not consider energy consumption.
Trajectory Based Forwarding (TBF) [119] is a location-based routing protocol thatforwards a packet along a predefined curve. Energy consumption and forwardingdelay can be controlled by choosing a next hop near the curve that has most energyleft or is most forwarding link. Trajectory and Energy-Based Data Dissemination(TEDD) [55] uses the same concept as TBF but generates trajectories based on theglobal knowledge of remaining energies in sensor nodes (energy map). The problemwith both TBF and TEDD is that the sender requires global knowledge of the networkfor QoS and avoiding obstacles.
SPEED [183] is a stateless non-deterministic location based routing protocol. It pro-vides soft end-to-end guarantees that are proportional to the distance between sourceand destination nodes, thus determining certain delivery speed for a packet. MM-SPEED [47] extends SPEED by maintaining multiple speed information, thereforeallowing several classes of service. It also increases reliability by using probabilisticmultipath forwarding approach.
The IETF RPL supports the use of an arbitrary route cost metric that can be addi-tive, multiplicative, minimum or maximum among the local link and node costs ina route. In addition, the specification allows using constraints related to a metric,thus preventing the selection of paths that do not meet a certain metric value. IETFhas defined the remaining energy, hop count, throughput, latency, and link reliabilitymetrics for RPL [188]. However, the effect of co-using these metrics is not specified.
3.7 Transport Layer
The main objectives of a transport protocol are ensuring end-to-end reliability, con-gestion control, and in order packet delivery [9]. The congestion control reducestransmission rate to prevent packet losses due to buffer overflows. Problems withthe transport protocols used in the computer networks, such as Transmission Con-trol Protocol (TCP), are high overhead, low fairness for nodes for nodes that are far

3.8. Summary 33
away from sink, and mistaking packet loss for congestion even when they are causedtransmission errors on bad links [192].
In the proposed transport protocols for WSNs, the reliability is ensured either withend-to-end [77, 152] or hop-by-hop retransmissions [126, 126, 191]. The hop-by-hop transmission is generally more efficient in multihop WSNs as it requires lesspacket transmissions thus having better energy-efficiency [54]. Also, the hop-by-hopprotocols can support sink to many nodes multicasting [126, 191].
As guaranteeing the delivery of all packets might not be necessary due to the redun-dancy of sensor data, few transport protocols consider event reliability [135, 152].This way, only one packet related to an event, e.g. an intruder alert, is deliveredwhile the network can save resources by dropping other similar packets.
One proposed transport protocol, referred to as asymmetric and reliable transport[181], considers energy by selecting a high energy node to report an event. As thisonly affects source nodes, energy balancing do not affect forwarding nodes. In gen-eral, although the proposed protocols aim toward reliability, they do not explicitlyconsider QoS.
3.8 Summary
The QoS definitions and performance evaluation methods proposed in the literatureconcentrate on only one or few aspects of QoS. This has motivated the design of QoSmetrics, performance analysis methods, and WSN self-diagnostics in this Thesis.
Most of the related WSN protocols aim to optimize one aspect of QoS such as life-time. As a drawback, different traffic types, such as non-critical measurements andcritical alerts, have similar level of service. Few protocols support traffic differen-tiation but only with the regard of a specific metric (e.g. latency). As a result, theproposed protocols are optimal only for specific use cases.
This Thesis presents QoS designs at MAC and routing layers for traffic differentiationwith multiple QoS metrics. Thus, the protocol designs enable heterogeneous WSNapplications with varying QoS requirements to operate in the same network.

34 3. Related Research on QoS Metrics and Protocols
4. TUTWSN PLATFORM AND DEPLOYMENTS
This chapter describes the TUTWSN platform and the practical experiments used toverify the results of this Thesis. TUTWSN is a research platform targeted at low-energy applications requiring several years lifetime with AA-sized batteries. Theplatform contains research effort from several researchers, comprising hardware pro-totypes, network protocols, sensor operating systems, programming interfaces, em-bedded sensor applications, and services and applications outside the sensor network.
The author of this Thesis designed the queue control, error control, and bandwidthmanagement methods for the MAC layer, routing protocol, and cross-layer QoS con-trol for TUTWSN. These protocol designs for QoS are presented in detail in thefollowing chapters. As the research of this Thesis concentrates on the embeddednetwork protocol design, the other parts of the platform are discussed here with thedepth that allows evaluating the results.
4.1 Medium Access Control
TUTWSN MAC [91] utilizes synchronized low duty cycle channel access. The ac-tive portion of a superframe comprises contention access and contention-free periodssimilarly to e.g. IEEE 802.15.4. TUTWSN MAC has few distinct design choices.First, network beacons are transmitted on a dedicated network channel for rapid andenergy-efficient neighbor discovery as shown in Figure 7. This way, a node onlylistens to network channel instead of going through each cluster channel separately[84]. Second, Contention Access Period (CAP) is realized with slotted ALOHA toallow implementation on simple low cost transceivers that lack carrier sensing func-tionality.
The contention access and contention-free periods are divided into fixed length timeslots. Each time slot is further divided into two subslots where the first subslot is fordata transmission and the following subslot is for an acknowledgment. An example ofmessage exchange during an active period of the superframe is presented in Figure 8.

36 4. TUTWSN Platform and Deployments
Fig. 7. Multi-channel operation of TUTWSN MAC.
In the example, a member node sends data to the cluster head during the CAP andlater during the CFP. Another member node both sends and receives data during theCFP. All transmissions during the active period occur in the cluster channel.
In this Thesis, the MAC layer roles of nodes are defined as follows. A headnode is anode that acts as a cluster head in at least one cluster. A headnode can also join otherclusters as a member node e.g. to forward data. A subnode is a node that acts onlyas a member node. Thus, a subnode does not send beacons or maintain CAP, whichsignificantly reduces its energy consumption.
4.2 Routing Protocol
TUTWSN routing uses cost-based approach due to its simplicity and low overhead.As the cost-based approach exploits the notion that the number of data consumers(sinks) is usually much smaller than the number of data sources [171], the target ap-plications of the routing are monitoring and target-tracking. The developed routingprotocol extends the basic principle of cost-based routing with the support of multi-ple sinks, the use of interests to instruct data collection, localized route constructionallowing fast recovery from broken links, and multiple QoS metrics.
Fig. 8. Message exchange during an active period between a cluster head and two membernodes in TUTWSN.

4.3. Hardware Prototypes 37
The localized route construction is presented in Fig. 9. Initially, a node requestsroutes from its neighbors and selects the lowest cost route as its next hop. Nodes sendroute advertisements which allows their neighbors to detect new routes and recoverfrom missed route requests/replies.
TUTWSN forms a multi-cluster tree topology as shown in Fig. 10. Headnodes for-ward data towards sinks while subnodes communicate with the nearest headnode. Inthe figure, two routing trees are constructed towards a sink node. The source nodeselects which tree to follow by comparing the QoS definition of the route againstapplication requirements.
TUTWSN routing has features that are typically associated with the transport layer.End-to-end reliability is ensured by rerouting failed transmission on MAC layer viaanother link as described in publication [P4] while the congestion control is realizedby considering traffic load in cost calculations. The routing protocol is presented indetail in [P1] while the QoS routing cost calculation is presented in Chapter 6.
4.3 Hardware Prototypes
The TUTWSN hardware prototypes are built with Commercial Off-The-Shelf (COTS)components. The platforms use Microchip PIC18LF8722 Micro-Controller Unit(MCU) with 128 kB flash program memory, 4 kB SRAM data memory, and 2 kBEEPROM memory. Apart from gateway devices that use mains power, the nodes arepowered with two serially connected Lithium AA-size batteries with the total capac-
Fig. 9. Route discovery in TUTWSN. a) Node A broadcasts a route request. b) Neighbors re-ply with an advertisement. c) Node A selects the lowest cost route. d) Nodes advertiseperiodically their routes. e) An advertisement reveals a better path.
Fig. 10. Multi-cluster tree topology of TUTWSN.

38 4. TUTWSN Platform and Deployments
ity of 3000 mAh.
TUTWSN has two platform variants, a long range (LR) variant that is targeted atoutdoor deployments, and a low energy (LE) variant targeted at dense networks. Thetransceiver properties of these platforms are summarized in Table 4. In addition to thetwo variants, minor revisions of the platforms exist with varying sensors and an op-tional Ethernet connectivity. As these revisions do not affect network performance assuch, they are not further detailed here. Circuit board antennas are used to minimizethe physical size and cost of a node.
TUTWSN platform was selected because the author’s research was part of a largerresearch project with the focus of developing cross-layer designs with the joint opti-mization of hardware and network protocols. Currently, most widely used platformsin related literature include Berkeley motes and their variants [129]. Still, due to theapplication specific nature of WSNs, there is no de facto WSN platform. TUTWSNplatform is compared to the motes and selected commercial platforms in Table 5.The platform list is not exhaustive, as technology specific products (e.g., applicationdevelopment kits for a specific standard) are not listed because the research of thisThesis required the full control of hardware resources. As a summary, the communi-cation and computational resources of TUTWSN are in line with the related platformsand the TUTWSN prototypes act as examples of typical resource constrained and lowenergy WSN nodes [84].
Table 4. Transceiver properties of TUTWSN platforms.
Property Long range Low energy
Transceiver Nordic nRF905 [123] Nordic nRF24L01 [122]Frequency band 433 MHz 2.4 GHzPacket size, max 32 B 32 BNominal data rate 50 kbit/s 1 Mbit/sOutput power, max 10 dBm 0 dBmEnergy usage, RX mode 250 nJ/bit 11.3 nJ/bitEnergy usage, TX mode1 600 nJ/bit 11.8 nJ/bitCommunication range2 500 m 180 mUnique channels 3 271 Energy usage with the maximum transmission power.2 Range in open space with the optimum alignment of antennas.

4.3. Hardware Prototypes 39
Tabl
e5.
Com
pari
son
ofTU
TWSN
tose
lect
edco
mm
erci
ally
avai
labl
eW
SNpl
atfo
rms.
Plat
form
MC
UC
lock
Prgm
Dat
aE
EPR
OM
Rad
ioR
Fba
ndD
ata
Size
Not
es
mod
el(M
Hz)
(kB
)(k
B)
(kB
)m
odel
(MH
z)ra
te(m
m2 )
Ard
uino
Uno
[7]
AT
Meg
a328
1632
21
XB
eeZ
B24
0025
0n/
a1
Ard
uino
Meg
a[7
]A
Tm
ega2
560
1625
68
4X
Bee
ZB
2400
250
n/a
1
BT
node
ver3
[219
]A
tmeg
a128
L8
128
644
CC
1000
433/
915
76.8
1919
2
+180
ZV
4002
2400
1500
Lib
eliu
mW
aspm
ote
[97]
AT
meg
a128
18
128
84
XB
ee-8
02.1
5.4
2400
250
3749
1
XB
ee-9
0090
0X
Bee
-868
868
ME
MSI
CM
icaZ
[109
,111
]A
Tm
ega1
28L
812
84
4C
C24
2024
0025
018
56M
EM
SIC
IRIS
[108
,111
]A
Tm
ega1
281
812
88
4R
F230
2400
250
1856
ME
MSI
CTe
losB
[110
]M
SP43
08
4810
16C
C24
2024
0025
020
15Sh
imm
er[1
38]
MSP
430
848
100
CC
2420
2400
250
1969
2
RN
-42
2400
1500
TU
TW
SNL
RPI
C18
LF8
722
812
84
2nR
F905
433
5081
00T
UT
WSN
LE
PIC
18L
F872
28
128
42
nRF2
4L01
2400
1000
2800
1X
Bee
radi
om
odul
esin
ter-
chan
geab
le(o
nly
one
atta
ched
ata
time)
,2Pl
atfo
rmha
stw
oin
tegr
ated
radi
os(W
SNan
dB
luet
ooth
)

40 4. TUTWSN Platform and Deployments
Fig. 11 presents the examples of LE and LR nodes. The presented low energy nodeis equipped with temperature, humidity, and photo diode sensors, whereas the longrange node has only temperature sensor.
4.4 Deployments
The protocol designs of this Thesis were verified in several real-life TUTWSN pilotstudies in both outdoor and indoor environments. The pilots acted in the QoS researchas a practical source of performance measurements. The pilots are summarized inTable 6. Two outdoor environmental monitoring and campus network deploymentsare detailed in the following sections.
Fig. 11. TUTWSN low energy (left) and long range (right) nodes that were used to verify theresults of this Thesis.
Table 6. Main TUTWSN pilot studies.
Deployment Nodes Duration Technology
Sewer water level monitoring 25 2009-10 Long rangeChemical factory monitoring 62 2009 Low EnergyGreen house monitoring 30 2009 Low EnergyCampus network for teaching 200 2008- Low EnergyResidential monitoring1 180 2007- Low EnergyCargo monitoring and tracking1 50 2008-09 Low EnergyBuilding automation monitoring1 377 2008- Low EnergyOutdoor environment monitoring1 100 2005- Long rangeEnvironment conditions in a cow house 30 2009- Low Energy1 Several separate deployments, the amount of nodes is the total from these pilots.

4.4. Deployments 41
4.4.1 Outdoor Environmental Monitoring in Rural Area
An outdoor network using TUTWSN long range nodes was deployed in a rural area.It has been active since 2005 although the network topology has changed as it hasbeen upgraded with new versions of the developed protocols. Fig. 12 shows thetopology and traffic distribution of an early deployment during a 4 month period be-tween 2005 and 2006 [170]. The network comprised 19 nodes and covered 2 km2
area.
The results highlight the unpredictability and dynamic nature of a WSN, even whennodes are stationary. The communication range can be very short due to environ-mental obstacles but also unexpectedly long due to signal reflections. Thus, the com-munication topology can be unpredictable as evident from Fig. 12. Link quality canchange within few moments e.g. due to moving objects that block signal path, withinfew minutes or hours e.g. due to due to wet leaves and rain, or the quality can varyslowly based on the season of the year e.g. due to snow and lack of leaves on treeson winter. This necessitates the dynamic operation of network protocols.
Fig. 12. Distribution of transmitted traffic on selected nodes in the long range outdoor de-ployment.

42 4. TUTWSN Platform and Deployments
4.4.2 Outdoor Environmental Monitoring in Suburban Area
An outdoor network with the TUTWSN long range platform was deployed in thesuburban environment around Tampere University of Technology campus area. Thenetwork comprised 20 nodes that were deployed on 1 km long line topology. Thus,the goal was to experiment the effects of a multihop topology. The nodes were at-tached to trees as shown Fig. 13.
The deployment further highlighted the effect of environmental changes. In additionto the changing weather, vehicles cause network dynamics. For example, a parkedtruck can obstruct a link necessitating the discovery of alternate routes.
4.4.3 Indoor Deployment at TUT Campus
An indoor TUTWSN deployment has been used in Tampere University of Technol-ogy since 2008 for research and education purposes. Students utilize the network inan organized WSN course by designing sensor network applications that utilize thecollected data. In total, the network comprises over 200 nodes in several campusarea buildings and has a total network coverage of 23000 m2. The nodes are attachedto walls as shown in Fig. 14. Deployed nodes include temperature, humidity, illu-mination, Carbon dioxide (CO2), sound level, and Passive Infra-Red (PIR) sensors
Fig. 13. Node installation on trees in the outdoor deployment.

4.4. Deployments 43
Fig. 14. Indoor deployment at Tampere University of Technology. A typical battery powerednode installed at wall (left) and a mains powered sink acting as a gateway via Eth-ernet connection (right).
allowing e.g. air quality monitoring and space usage applications.
The large scale and long term deployment has highlighted the importance of energy-efficiency, scalability and autonomous operation of the network protocols, and thenecessity of network diagnostics. For feasible network maintenance, the lifetime onbatteries must be several years and network must be auto-configurable with multi-hop routing support. However, as node break ups, energy depletion, and wirelessinterference due to other networks are common in the large scale deployment, net-work diagnostics was identified as a necessity which further guided the developmentof diagnostics presented in this Thesis.

44 4. TUTWSN Platform and Deployments

5. QOS ANALYSIS FOR WSNS
The results of this Thesis are summarized in this and the following chapters. Thischapter presents QoS metrics to measure network performance and presents a prac-tical example of QoS trade-offs in TUTWSN protocols. The research related to thischapter is published in [P4].
5.1 QoS Metrics
Due to varying application requirements, QoS cannot be assessed as a single gradebut needs to be described with a collection of several metrics. While the traditionalreliability, latency, and throughput metrics apply to the WSNs, other metrics are re-quired to comprehensively assess QoS. The term metric in this Thesis means a pa-rameter that quantifies a certain aspect of network performance. From the protocoldesign point-of-view, some of the presented metrics may act as constraints instead. Inthis Thesis, a metric is understood to be a measurable goal for QoS, while a constraintis a limiting factor. For example, communication range is typically a constraint fora routing protocol. However, from the application and user point-of-view, the com-munication range is still a metric as it dictates, e.g., the number of nodes required tocover a certain area.
As the amount of potential WSN QoS metrics is large, this Thesis concentrates onthe metrics that affect end-to-end traffic, and thus, the practical performance availablefor end users and sensor applications. The performance is considered at network andnode levels, where the network performance is understood as an aggregate (e.g. av-erage) of individual node performances. For quantitative QoS comparison, each QoSmetric is assigned with a value and unit. The metrics are described in the followingsections and summarized in Table 7.

46 5. QoS Analysis for WSNs
Table 7. QoS metrics considered in this Thesis.
Metric Unit Metric Unit
Latency s Throughput bpsReliability % Availability %/sMobility m/s Lifetime daysCommunication range m Node count pcsNode density 1/m2 Security (grade)
5.1.1 Latency
Latency denotes the elapsed time between the generation of a packet at a source nodeto its reception at the target node.
5.1.2 Throughput
The throughput metric expresses the amount of application payload transferred pertime unit from a source to the target. In practice, the throughput is significantly lessthan the nominal transceiver data rate due to the protocol overhead and low dutycycling.
5.1.3 Reliability and Availability
The reliability metric denotes the probability that a packet is successfully deliveredfrom a source to a target. Publication [P4] evaluates the effect of beacon losses,limited buffer space, and reasons for unreliability in WSNs.
Three distinct reasons for unreliability can be identified as shown in Fig. 15. First,a packet may be dropped due to link errors. The protocol design choices such as re-transmissions on MAC layer or the use of store-and-forward mechanisms on routinglayer reduce the packet drops. Second, limited queuing space cause packet drops. Asthe typical data memory of a resource constrained WSN node is 2-8 kB [84], part ofwhich is required by applications and protocol stack, the remaining buffer may over-flow on a temporary traffic burst or when a next hop link is broken. This necessitatesqueuing disciplines and traffic differentiation to prevent the loss of high priority mes-sages. Third, node failures due to hardware malfunction or depleted energy cause theloss of queued data. The recovery from these require end-to-end retransmissions orstoring routed packets in persistent memory.

5.1. QoS Metrics 47
Fig. 15. Packet drops may occur due to limited memory or link errors.
Due to the inherent redundancy of sensor data, the reliability metric is not alwaysimportant in WSNs. Instead, it is important to ensure that the received sensor valuesare up-to-date. For this purpose, this Thesis defines the availability metric. Theavailability is defined as the probability that data is received from a node withincertain time interval I as
availability =|{1≤ i≤ N−1 : ai−ai−1 ≤ I}|
N−1, (1)
where ai is the arrival time of the ith sample, N is the number of received samples.Thus, a node is considered available when sensor values are received from it over thetime of observation.
An example of the availability when a node generates traffic at constant 60 s inter-vals is shown in Fig. 16. From (1) it follows that the measured availability resemblesthe Cumulative Distribution Function (CDF) of the process that generates traffic at asource node. Therefore, when a packet is not lost and delay jitter is minimal, the aver-age reception interval equals to the average traffic generation interval (60 s). Latencyjitter spreads CDF around the average traffic generation interval, thus increasing thetime to reach over 50% availabilities. Also, packet losses increase the time betweenreceptions and consequently decrease the availability.
In practice, the availability evaluate the applicability of the network for a certainpurpose. For example, in a WSN is targeted at intruder detection should not be un-available for a long time or otherwise an alert can be received too late. Thus, anavailability (e.g. 99.99%) must be associated with a time interval, e.g. one minute.In a measurement network the interval may be several minutes or even hours if theobserved phenomena changes slowly.

48 5. QoS Analysis for WSNs
0
25
50
75
100
0 60 120 180 240
Ava
ilabi
lity
(%)
Reception interval (s)
Wired equivalentDelay jitterLow reliability
Fig. 16. Availability metric expressing the probability that an update is received from a nodewithin certain time interval. Packet drops and network errors decrease the availabil-ity.
5.1.4 Network and Node Lifetime
The lifetime is considered as a QoS metric due to its importance for several WSNapplications. Furthermore, many of the other QoS metrics have a trade-off betweenlifetime, thus preventing optimizing all metrics. For example, the typical energysaving mechanisms, such as low duty cycling, have a negative impact on throughputand latency. The lifetime of a node is defined as the elapsed time from its deploymentto the depletion of its energy sources. The network lifetime is defined as the minimumlifetime of its nodes.
5.1.5 Node Density, Count, and Communication Range
Node density, node count, and communication range describe how a network canbe deployed. Node density defines the maximum number of nodes that can operatewithin the communication range. Contention-free and beacon-enabled protocols typi-cally necessitate non-overlapping data exchange times, thus having a design trade-offbetween the node density and the communication range.
Node count defines the maximum number of nodes in a network. While the numberof nodes is ideally only limited by the network throughput, practical protocols mayhave design choices, e.g. in address assignment, that limit the node count.

5.1. QoS Metrics 49
5.1.6 Mobility
The mobility metric describes how fast a node can move in a network but still ex-change data with other nodes. It is particularly important in tracking WSNs wherea node may be attached to moving objects. Mobility can be improved by increasingcommunication range for longer link lifetimes and by increasing protocol reactivitythat allows rapid neighbor discovery and communication links establishment.
An upper limit for mobility can be calculated as R/(td + ta+ tm), where R is the com-munication range, ta is neighbor discovery time, ta is the negotiation time between asource and a target to establish communication link (e.g. association procedure), andtm is the time needed to transfer a message. In the case of low duty cycle protocols,the initial sleeping delay decreases mobility significantly. As an example, assumingbeacon synchronized MAC with 2 s access cycle, the average sleeping delay is 1 s.
5.1.7 Security
Security means that unauthorized parties do not gain access or tamper with the senseddata [40]. As the sensor networks might carry sensitive sensor data or support actu-ation, security might be an important element of QoS. However, unlike the othermetrics, security does not have a straightforward unit or value. For comparison pur-poses, the security should be graded based on supported security features.
As an example, Table 8 presents a simple method to grade network security. Eachgrade is an incremental improvement over lower grades to allow comparison betweengrades. The use of encryption ensures data confidentiality. However, freshness coun-ters are required to prevent injection of recorded packets that could otherwise allowe.g. actuation. Data encryption can be either network wide with pre-shared key andalgorithm, or negotiated per node. Network wide encryption is less secure because arevealed key compromises the whole network.
Table 8. An example of security grading.
FreshnessGrade Encryption counter
0 No No1 Network wide shared key No2 Network wide shared key Yes3 Node specific key Yes

50 5. QoS Analysis for WSNs
5.2 Usage of QoS Profiles
Together, a set metric values form a QoS profile. This can be illustrated with a radarchart as shown in Fig. 17. A larger surface area in the chart denotes better QoS.Thus, the chart allows comparing QoS e.g. between different networks, networkconfigurations, and the network operation at different time instances. As some of theQoS metrics are only relevant for the whole network, such as node density, a QoSprofile for a node contains a reduced set of metrics.
A prominent use case of the QoS profile chart is comparing the theoretical QoS (e.g.what a technology promises) against measured performance as shown in Fig. 18(a).In practice, the actual QoS is equal or lower than the theoretical due to both non-idealistic network environment causing unreliability and available capacity whennetwork is not fully utilized. The second use case is the assessment of variationsin network performance by taking the average, minimum, and maximum representa-tives of individual node metrics and presenting the cases in the same chart as shownin Fig. 18(b). A big difference between minimum and maximum values denotes po-tential performance problems. Third use case is to assess whether a technology canfulfill the application requirements, or to assess whether a deployed network operatesas required. As an example, Fig. 18(c) presents a case where the measured perfor-mance indicates that all QoS requirements are not met.
Fig. 17. QoS profiles of (a) whole network and (b) a individual node.

5.2. Usage of QoS Profiles 51
(a) (b) (c)
Fig. 18. Comparison methods for QoS, a) theoretical vs. measured performance, b) per-formance differences between nodes, and c) application requirements vs. measurednetwork performance.
5.2.1 ZigBee Network Example
As a concrete example of the QoS profile usage, the performance of a ZigBee networkcomprising 32 nodes is analyzed in the following. The analysis assumes that thenodes form a symmetric tree topology, where each router (ZigBee coordinator) hasnc = 3 child routers and nd = 5 non-routing (leaf) devices. Each node generates a20 B measurement packet to the sink every 20 s, resulting into 296 bps total offeredload.
QoS is analyzed by keeping the application traffic requirements fixed, while exam-ining different Beacon Order (BO) (access cycle length) and Superframe Order (SO)(active period length) parameter values of IEEE 802.15.4. The parameters are listedin Table 9.
The end-to-end latency is evaluated for the leaf nodes that are farthest away (3 hops)from the sink by assuming that each hop causes on average an delay of 0.5 accesscycles. The assumptions is fairly accurate as the access cycle length is significantlylarger than the packet transmission times and the network is not saturated.
The throughput and reliability metrics are analyzed with the models from [85]. The
Table 9. IEEE 802.15.4 parameters used in the QoS analysis.
BO SO Active period (s) Access cycle (s)
4 6 0.246 0.9893 7 0.123 1.974 8 0.246 3.93

52 5. QoS Analysis for WSNs
used models consider collisions from hidden nodes and the contention-based channelaccess as the main sources for reliability (goodput) loss, and e.g., link errors, are notconsidered.
The mobility metric is calculated with the formula proposed in Section Section 5.1.6.As the IEEE 802.15.4 standard leaves several implementation aspects to the discre-tion of the equipment manufacturer, the following behavior is assumed. First, toensure that a beacon from a neighbor is detected, each channel must be scanned (atleast) for the duration of one access cycle. Next, a node must wait until the beginningof the next active period before an association can be requested, requiring an aver-age wait time of (accesscyclelength− activeperiodlength)/2. Assuming only oneoperating channel, discovery (td) and association (ta) take approximately 1.5 accesscycles. At least one data transmission is assumed before a node moves outside of thecommunication range. Communication range R is assumed to be 50 m. In the anal-ysis, ZigBee tree-based routing is assumed. The use of mesh routing would requireadditional route messaging before data can be transmitted.
Energy consumption is evaluated with the models presented in [P6]. The settingsof the High Rate (HR) platform presented in Table 2 of the publication were used,with the exception of data rate that was configured to 250 kbps to conform the IEEE802.15.4 standard. The lifetime was calculated for the routers one hop from the sink,as these forward most traffic and has thus the highest energy consumption. 3000 mAhbattery was assumed in the lifetime calculations. The full use of IEEE 802.15.4 dataconfidentiality, data authenticity, and replay protection features is assumed, and thesecurity is graded as 3 based on Table 8. As the modeled reliability was over 99.5%,the availability is assumed be the same as the packet generation interval.
The results are presented in the Fig. 19 and Table 10. While all settings fulfill theapplication throughput requirement, they have trade-offs with latency, lifetime, andreliability. Thus, the parameters should be selected based on application demands.
5.3 QoS Metrics in TUTWSN
This section presents the configuration of TUTWSN as an example of QoS trade-offsin a WSN protocol. The parameters and their affect on QoS are listed in Table 11.The effects are listed with the assumption that the network is not saturated.

5.3. QoS Metrics in TUTWSN 53
Latency
Through-
put
Reliability
Avail-
ability
Mobility
Lifetime
Comm.
range
Security
SO4/BO6 SO3/BO7 SO4/BO8
Fig. 19. ZigBee QoS profile with selected IEEE 802.15.4 MAC settings.
Table 10. ZigBee QoS results with selected IEEE 802.15.4 MAC settings
SO4/BO6 SO4/BO8 SO3/BO7
Latency (s) 2.2 8.6 4.3Throughput (bps) 2487.8 622.0 309.8Reliability (%) 99.6 99.6 99.5Availability (s) 20.1 20.1 20.1Mobility (m/s) 37.0 8.7 17.3Lifetime (days) 25 102 101Comm. range (m) 50 50 50Security (grade) 3 3 3
5.3.1 Application layer
An application samples sensors with a certain measurement rate and transmits thesamples to a sink. Increasing the measurement rate increases traffic load thus de-creasing lifetime and available throughput. However, it also increases availability asdata is received more often and reliability as possible packet losses are compensatedby a new sensor sample.
Instead of sending measurements immediately, they can be aggregated by combiningseveral values (e.g. averaging) or inserting several measurement values into a singlepacket. This decreases traffic overhead but increases latency and decreases availabil-ity as several measurements are cached before sending the aggregated value. Also, a

54 5. QoS Analysis for WSNs
Table 11. The effect of configuration parameters to the QoS in TUTWSN.
Configuration / change Com
m.
range
Lif
etim
e
Mobil
ity
Rel
iabil
ity
Avai
labil
ity
Lat
ency
Thro
ughput
Node
den
sity
Are
a co
ver
age
Sec
uri
ty
Application layer
Measurement rate / increase − + + −
Aggregation / increase + − − − +
Routing layer
Alternative routes / increase − +
Multipath routing / increase − + −
MAC layer
Access cycle length / increase + − − − +
CAP length / increase − + + + −
CFP length / increase + −
Network beacon rate / increase − + −
Acknowledgments / use − +
Retransmissions / increase + −
Encryption / use − − +
Physical layer
Frequency / increase − − + + − +
Transmission power / increase + −/+ + + − + −
Data rate / increase − + + −
+ positive effect on QoS − negative effect on the QoS metric of the column
packet loss causes the loss of several samples.
5.3.2 Routing layer
The use of alternative routes towards a sink requires maintaining synchronizationwith several neighbors which increases the energy usage. The benefit is that a replace-ment route is ready if a link breaks thus reducing the risk of buffer overflows. TUT-WSN also defines multipath routing where a packet is transmitted via each knownroute. This increasing reliability and mobility but requires more bandwidth and en-ergy.
5.3.3 MAC layer
In TUTWSN, the superframe structure has the most significant effect on the MAClayer performance. Because a cluster beacon is sent every access cycle, a long access

5.3. QoS Metrics in TUTWSN 55
cycle reduces energy usage. However, it also increases the forwarding latency since amember node must wait longer to send its data. Also, assuming that the active periodlength (CAP + CFP) is kept the same, duty cycle decreases and reduces the through-put. On the other hand, a low duty cycle allows fitting several non-overlapping clus-ters into the same channel thus increasing node density.
Increasing the CAP length increases idle listening on a cluster head but decreasescollision probability, therefore increasing reliability. Also, as mobile nodes can com-municate with a cluster only briefly before moving outside the communication range,long term reservations are not feasible and a long CAP increases mobility. A mobilenode also requires a high network beacon rate for detecting new neighbor clustersrapidly.
The MAC layer recovers from failed transmissions with acknowledgments and re-transmissions. However, as data frames are usually small and thus comparable to theacknowledgment frames, the use of acknowledgments essentially doubles the datatransmission energy. Generally, not using acknowledgments increases throughput onreliable links but the throughput is unaffected in TUTWSN due to the slotted channelaccess. The retransmissions increase latency, because new frames have to be waituntil an old frame is retransmitted.
In TUTWSN, security is implemented at the MAC layer by encrypting all data trans-missions. This has a small effect on lifetime due to increased frame processing timesand to the throughput as encryption adds a small communication overhead.
5.3.4 Physical layer
A transceiver has three important properties that affect the network performance:frequency, transmission power and data rate. These have a complex relations due toboth physical properties and legislation restrictions e.g. necessitating lowering datarate to fit into the allocated frequency band. A detailed analysis on their relations isoutside the scope of this Thesis. The effect of other physical layer components, e.g.MCU, is smaller and ignored in this example.
According to Friis communication equation [50], communication range decreases asfrequency is increased. The communication range has a direct effect on mobility, areacoverage, and node density. It can be further increased with high transmission powerwith the trade-off to the lifetime. It should be noted, however, that in low power radiosthe power consumption does not rise linearly with the output power. As an example,Table 12 presents measured communication range of the Nordic nRF905 [123] and

56 5. QoS Analysis for WSNs
Table 12. Transmission power vs. range in TUTWSN platforms.
Fre- Data Output RX sensi- Supply Comm.quency Rate power tivity current range
Radio (MHz) (kbps) (mW) (dBm) (mA) (m)
nRF905 433 50 10.0 -100 30.0 500nRF905 433 50 0.10 -100 9.0 105nRF24L01 2400 1000 1.00 -85 11.3 180nRF24L01 2400 1000 0.02 -85 7.0 10
nRF24L01 [122] transceivers in the TUTWSN platforms. With these transceivers,the highest output power has 4.8 and 18 times the range but only 3.3 and 1.6 timesthe supply current requirement, respectively. Thus, as fewer hops are required, theselection of higher transmission power can be feasible from the whole network pointof view.
The data rate parameter has a trade-off between reliability and lifetime. Althougha faster data rate typically slightly increases the transmission power per time unit,the overall energy requirement is lowered as more data can be sent at the same timeinterval. However, faster data rates often reduce reliability, as the sensitivity at the re-ceiver decreases. A higher carrier frequency enables the use of wider communicationband and therefore higher throughput.

6. PROTOCOL DESIGNS FOR QOS
This chapter summarizes the research results on MAC and routing protocol designsfor QoS and presents a cross-layed design between the presented protocols. Thedetails of the protocols are presented in [P1,P2,P5,P6].
6.1 QoS Schemes for WSN MACs
This research proposes two alternative QoS schemes for MACs. Both schemes sup-port QoS classification and reservations. The first scheme, QoS support layer forWMNs [P5], is targeted at contention-based MAC protocols. The support layer canbe realized without modifications to existing MAC protocols. The second scheme,dynamic capacity allocation [P2,P6], is targeted at MAC protocols with contentionand contention-free channel access. It has more efficient channel usage and thusbetter energy-efficiency but requires tighter integration to the MAC layer.
6.1.1 QoS Support Layer for WMNs
The QoS support layer uses bandwidth management and admission control tech-niques that avoid saturating the communication channel. It relies on the fact thatcontention-based MACs support strict QoS requirements when offered traffic load iscontrolled and not near the maximum capacity [211].
The QoS support layer assumes a clustered topology, where the cluster head managestraffic within one hop radius. Cluster’s member nodes connect to the cluster head asdepicted in Fig. 20.
A physical connection between two nodes consists of one or more logical links, eachusing distinct QoS definition that comprises operation mode, bandwidth limit, andpriority. A link operate in one of the two modes: bandwidth reserved or differentiated.In the bandwidth reserved mode, a link is guaranteed with certain throughput that isinitially requested from the controller. A source node is responsible for limiting

58 6. Protocol Designs for QoS
Fig. 20. Per hop and end-to-end flows in QoS support protocol.
its average traffic to the agreed bandwidth limit. The remaining capacity is dividedproportionally among the differentiated mode links based on their assigned priorities.In the differentiated mode, a node polls the controller for a permission to send. Thecontroller schedules requests and grants permissions to send for a certain time period,this way preventing congestion. The link priority affects the duration and urgency ofthe granted transmission time.
The throughput with different number of source nodes is shown in Fig. 21. Each nodetransmits three flows to the cluster head: 64 kbit/s real-time, 200 kbit/s best-effort,and 400 kbit/s background flow. The results are obtained with NS2 simulations ofIEEE 802.11 WLAN with the Distributed Coordination Function (DCF) MAC andDirect Sequence Spread Spectrum (DSSS) PHY models. Data rate, backoff, and CWparameters were the default values specified in IEEE 802.11b standard. The simula-tion details can be found in [P5]. Real-time flows reserved the 64 kbit/s bandwidth,whereas the best-effort flows are assigned with differentiated service priority 2 andthe background flows are assigned with differentiated service priority 1. The resultsshow that the bandwidth reserved mode guarantees the requested throughput evenwhen the offered throughput exceeds the capacity. Remaining bandwidth is dividedbetween the differentiated flows.
The key innovation in the QoS support layer is the co-existence of different typeslogical links, efficient bandwidth usage, and low overhead: control messaging andpolling is used only when the communication channel usage is near its saturationpoint. Also, unlike the fixed reservation schemes, unused reservations do not wastecapacity as the excess bandwidth is assigned for the differentiated flows. The logicallink based approach also enables end-to-end QoS flows. For example, links b, c,and d in Fig. 20 might use similar QoS settings thus defining an end-to-end flow.However, the construction of such flows is performed with a higher layer protocol,such as Resource Reservation Protocol (RSVP) [19], and is outside the scope of thisThesis.

6.1. QoS Schemes for WSN MACs 59
0
100
200
300
400
500
2 4 6 8 10 12 14 16 18 20 22 24
Thro
ughput
(kbit
/s)
Nodes
Real-timeBackgroundBest-effort
Fig. 21. Average throughput of traffic flows with the class of service support ayer on IEEE802.11.
6.1.2 Dynamic Capacity Allocation
The dynamic capacity allocation scheme assumes a beacon-enabled MAC that sup-ports both contention-based and contention-free channel access. These assumptionare compatible with many existing WSN MACs such as IEEE 802.15.4. Unlike therelated proposals that utilize contention-free channel access via static reservations,this scheme assigns contention-free slots dynamically based on traffic requirements.The scheme has three distinct benefits. First, the contention-free period is used onlyto manage reservations, therefore allowing to minimize its length and thus reducingidle listening. Second, contention-free period can also serve traffic bursts. Third, thescheme aims to minimize unused reservations with dynamic slot assignment.
The superframe used in the scheme is presented in Fig. 22. First, a cluster headtransmits a beacon that describes the structure of the superframe. This is followedby short contention period that can be used to request reservations or send data if acontention-free slot is not granted. The following contention-free slots are assignedby the cluster head based on traffic requests.
Three types of contention-free services are defined:
Guaranteed: Members explicitly request certain amount of reservations froma cluster head. The service ensures certain minimum throughput.
Adapted: A cluster head records the average traffic usage of its member nodesand automatically assigns slot reservations to match the traffic. This way, the

60 6. Protocol Designs for QoS
Fig. 22. Slot assignment in the dynamic capacity allocation scheme.
the need for reservation signaling is reduced which in turn reduces the use ofcontention access period.
On-demand: A member node may request for an additional reservation in anytransmission (contention based, adapted, or another on-demand) by setting aslot demand flag on the header of transmitted frame. Cluster head indicates thegranted slot (or none if the superframe was full) in its acknowledgment.
The services operate seamlessly together. The guaranteed and adapted services arebest suited for CBR traffic, while the on-demand service handles traffic bursts.
The amount of guaranteed and adapted slots is defined as slots per time unit e.g. slotsper minute. Therefore, a member node might not receive the same amount of reser-vations each access cycle. For example, assuming 10 guaranteed slots per minute,no adapted slots, and 2 s access cycle, a member node receives guaranteed slot everythird access cycle. This provides a trade-off between energy and forwarding latencyto a node: it can either transmit data immediately with the contention based channelaccess or wait few access cycles until a contention-free slot is granted. By sendingimmediately the node risks collision and might not have anything to send when thecluster head next time grants the reserved slot.
The average delay caused by postponing the frame transmissions until a next contention-free slot is granted is
delay = min(
RA
r,TA
)· tac, (2)
where TA is a configurable wait time for the contention-free slot, RA is reservationperiod length, r is the total number of granted reservations per period, and tac is theaccess cycle length
Figure 23 shows simulated one hop latency with on-demand, guaranteed, and adaptedcapacity services, when the maximum reserved slot wait time (TA) is 4 s (two accesscycles). The simulation parameters are described in detail in [P6]. In these results,the guaranteed and adapted services also supported on-demand allocations.

6.1. QoS Schemes for WSN MACs 61
The on-demand service has the highest delay because it always waits TA access cy-cles for a contention-free slot. The delay decreases slightly on higher traffic loads(smaller data generation interval) as several packets are buffered and can be trans-mitted after the initial wait time. The adapted service has low latency on high trafficloads, because a slot is granted on every access cycle. On low traffic loads, the prob-ability that a node is granted with a reservation is small, thus increasing the averagewaiting time. The guaranteed traffic service performs similarly regardless of the loadbecause the fixed reservations also guarantee a certain upper limit for latency.
The power consumption with the different services is presented in Fig. 24. On asubnode, the guaranteed service consumes 4% more power than the other serviceswhen the traffic load is low. However, as a subnode forwards only its own traffic, thedifferences between the schemes are otherwise negligible.
The guaranteed service has the highest power consumption on low traffic loads alsoon a cluster head. Although the bandwidth reservations were adjusted based on theknown traffic load, the probability that a node has data to send when a reservation isgranted decreases as the data generation interval increases. Thus, the reservations areunused which causes unnecessary listening.
The on-demand service has the lowest power consumption because it completelyavoids unnecessary reservations. However, its CAP usage was high, 42% with 1 sdata generation interval, whereas other methods had only 2% load. Thus, the lengthof contention-free period could be reduced from the fixed two slots (NA = 2) whenusing the other methods. Using only one contention-based slot (NA = 1) with thedynamic service decreases its power consumption by 24%, while the same amount ofslots would congest on-demand service. Decreasing the number of contention slots
0
2
4
6
8
10
1 10 100
Lat
ency
(s)
Data generation interval (s)
On-demandGuaranteedAdapted
Fig. 23. One-hop latency with different capacity allocation schemes.

62 6. Protocol Designs for QoS
0
0.1
0.2
0.3
0.4
0.5
0.6
0.7
0.8
1 10 100
Hea
dnode
pow
er (
mW
)
Data generation interval (s)
On-demandGuaranteedAdaptedAdapted (NA=1)
0.06
0.08
0.1
0.12
0.14
0.16
1 10 100
Subnode
pow
er (
mW
)
Data generation interval (s)
On-demandGuaranteedAdapted
Fig. 24. Headnode and subnode power consumption with different capacity allocationschemes.
with the dynamic service changed the per-hop latency and subnode power consump-tion less than 1%.
The results highlight the main benefit of the allocation scheme: the length of thecontention-free period can be reduced thus significantly decreasing the energy usageof a cluster head. As the cluster head consumes most energy, this increases the life-time of a network. Also, the results indicate that the scheme offers trade-offs betweenlatency, energy-efficiency, and capacity.
6.2 QoS Routing Cost Algorithm
This section presents an algorithm for QoS route selection and cost calculation pub-lished in [P1]. As several practical routing protocols (e.g. ZigBee) calculate routecost, the algorithm is applicable to several existing routing protocols. Unlike otherproposed cost algorithms, the routing proposed in this Thesis uses several QoS met-rics to calculate the routing cost. These metrics are reliability, throughput, delay, andenergy. Other QoS metrics, such as security or mobility, are less influenced by thechoice of routing path and thus not included. Fig. 25 summarizes the utilized QoSmetrics and the statistics that are used to calculate the cost.
6.2.1 Minimum Cost Routing
Route selection assumes that a) cost is increased on each hop and b) the route thathas the lowest cost is selected. If two routes have similar QoS, e.g. in respect of

6.2. QoS Routing Cost Algorithm 63
Fig. 25. QoS metrics and statistics used to derive cost in TUTWSN routing.
reliability, the route that is shorter has a lower cost and is thus selected. For compar-ison, the route cost can be calculated by multiplying link reliabilities along a routingpath but this increases routing overhead as either end-to-end route construction or anadditional hop counter is required to prevent loops.
The cost Ci of node i when routing via node j is expressed as
Ci =C j +Ci→ j, (3)
where C j is the cost advertised by node j and Ci→ j is an additive cost. The additivecost denotes both link cost used to avoid bad links and node based cost at ith nodeused to discourage other nodes from routing via a node, e.g. when a node has lowenergy. To ensure that the cost is increasing, Ci→ j must have a positive non-zerovalue.
6.2.2 Cost Algorithm
To construct the additive cost between nodes (Ci→ j), QoS routing first evaluates linkquality with cost functions at time t:
• energy ei j(t) represents the energy needed to forward a packet from node i tonode j,
• reliability ri j(t) that denotes the forwarding success rate between nodes i andj,
• delay di j(t) denoting the average time until a packet has been successfullyforwarded to node j,
• residual energy Ei(t) is the energy at node i, and

64 6. Protocol Designs for QoS
• traffic load Li(t) at node i.
For brevity of the presentation, time instance (t) is not included when discussing thecost functions in the remainder of this Chapter. As functions relate to different QoSmetrics that cannot be compared against each other as such, the cost function returnunitless values that are scaled within the same range [0, 1]. A higher value means anegative effect on QoS. For example, ri j = 1 means that all packets on link are lost,ei j = 1 means that a high transmission power or several retransmissions are requiredto deliver packet to the next hop, Ei = 1 denotes that node’s energy source is depleted,and Li = 1 means that the available bandwidth or the packet buffers of the node i hasbeen exceeded.
Next, the values of cost functions are multiplied against cost weights as shown inFig. 26. Thus, the cost weights describe which QoS metrics are considered important.Finally, the weighted values are combined to a single cost value that acts as the addi-tive cost:
Ci→ j = we · (0.5 · ei j +0.5 · (1−Ei))+wr · ri j +wd ·di j +wt ·Li, (4)
where we, wr, wd , and wt are cost weights for energy, reliability, delay, and through-put. Using two cost functions that relate to energy (ei j and Ei) allows selecting be-tween the least energy consuming route and balancing the energy consumption withinthe network [186]. Selecting only minimum energy route may cause early depletionof heavily loaded nodes, whereas considering only the residual energy can consumemore energy globally, thus shortening the total network lifetime [24]. The optimalselection between the two energy calculation techniques depends on application re-quirements and network topology. As a compromise, they are weighted equally inthis calculation.
Fig. 26. QoS metrics and statistics used to derive cost in TUTWSN routing.

6.2. QoS Routing Cost Algorithm 65
The cost weights are defined as
1 = we +wr +wd +wt . (5)
Thus, when one weight is increased, other weights must be decreased. This way,there is a clear trade-off between different metrics.
6.2.3 Cost Functions for TDMA-based MAC
This section defines cost functions for TDMA-based low duty cycle MACs such asTUTWSN MAC. Defining the functions for other MAC protocols is outside the scopeof this Thesis.
Load Li is calculated from the amount of utilized slots versus the maximum number ofslots. Residual energy Ei is derived from node voltage measurements, where Ei = 0equals to the typical maximum battery voltage and Ei = 1 equals to the shutdownvoltage.
Other components are more complex as they need to consider packet error rate, de-noted as pi j, in addition to the component specific parameters. Packet error ratecauses retransmissions that have an effect to the energy and delay. As practicalMACs have an upper limit umax for the attempts, the number of transmissions onlink between nodes i and j is formulated as
ui j = min
(∞
∑k=0
k · (1− pi j)k−1,umax
)= min
(1
(pi→ ji j )2
,umax
). (6)
The result of the sum is derived from geometric series.
Two sources for unreliability were identified in [P4], transmission errors and bufferoverflows. As the link and queue drop probabilities are independent, reliability com-ponent is derived from packet error rate pi j and queue drop probability qi at node ias
ri j = (1− pui ji j ) · (1−qi). (7)
It should be noted that these models assume uncorrelated packet losses. Generally,this is not the case as it has been observed that a wireless channel may enter a statewhere errors occur in bursts for a small interval [11]. However, as the error statehas been observed to last less than few tens of milliseconds [115], the time betweenconsecutive packet transmission in low duty cycle networks is much longer than the
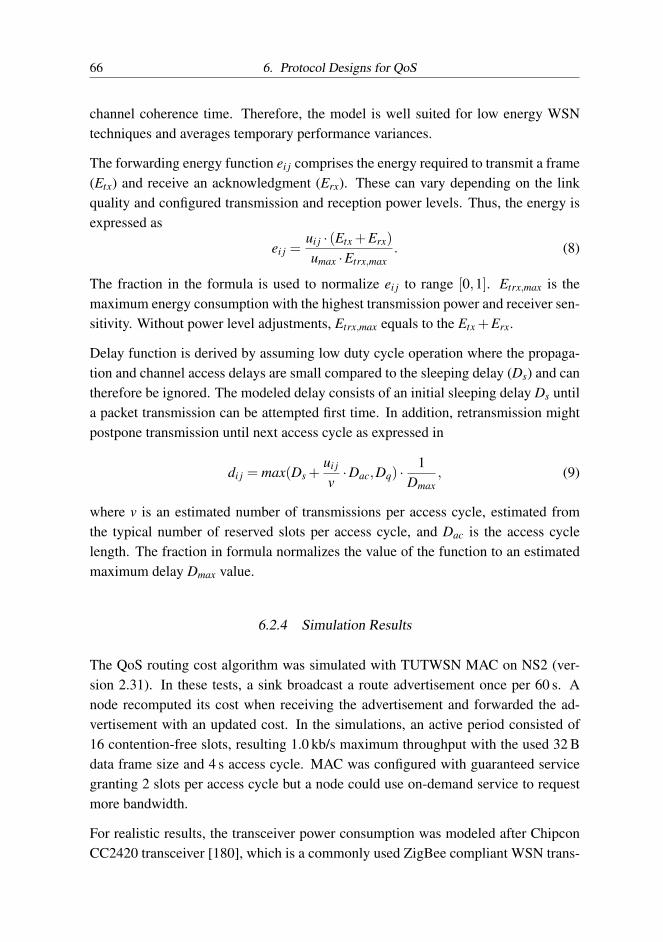
66 6. Protocol Designs for QoS
channel coherence time. Therefore, the model is well suited for low energy WSNtechniques and averages temporary performance variances.
The forwarding energy function ei j comprises the energy required to transmit a frame(Etx) and receive an acknowledgment (Erx). These can vary depending on the linkquality and configured transmission and reception power levels. Thus, the energy isexpressed as
ei j =ui j · (Etx +Erx)
umax ·Etrx,max. (8)
The fraction in the formula is used to normalize ei j to range [0,1]. Etrx,max is themaximum energy consumption with the highest transmission power and receiver sen-sitivity. Without power level adjustments, Etrx,max equals to the Etx +Erx.
Delay function is derived by assuming low duty cycle operation where the propaga-tion and channel access delays are small compared to the sleeping delay (Ds) and cantherefore be ignored. The modeled delay consists of an initial sleeping delay Ds untila packet transmission can be attempted first time. In addition, retransmission mightpostpone transmission until next access cycle as expressed in
di j = max(Ds +ui j
v·Dac,Dq) ·
1Dmax
, (9)
where v is an estimated number of transmissions per access cycle, estimated fromthe typical number of reserved slots per access cycle, and Dac is the access cyclelength. The fraction in formula normalizes the value of the function to an estimatedmaximum delay Dmax value.
6.2.4 Simulation Results
The QoS routing cost algorithm was simulated with TUTWSN MAC on NS2 (ver-sion 2.31). In these tests, a sink broadcast a route advertisement once per 60 s. Anode recomputed its cost when receiving the advertisement and forwarded the ad-vertisement with an updated cost. In the simulations, an active period consisted of16 contention-free slots, resulting 1.0 kb/s maximum throughput with the used 32 Bdata frame size and 4 s access cycle. MAC was configured with guaranteed servicegranting 2 slots per access cycle but a node could use on-demand service to requestmore bandwidth.
For realistic results, the transceiver power consumption was modeled after ChipconCC2420 transceiver [180], which is a commonly used ZigBee compliant WSN trans-

6.2. QoS Routing Cost Algorithm 67
ceiver. The simulations used transmission power level adjustment, because it is arecommended practice in wireless networks as it both decreases energy usage andreduces interference. The minimum power level that resulted into the average trans-mission success probability of 99% was used. As waking up a transceiver from thesleep typically takes some time, the transceiver was set to idle mode during an activeperiod and to sleep mode during an idle period. The power consumption in differentmodes is summarized in Table 13.
Shadowing propagation model was used to model an obstructed office environmentby setting shadowing deviation parameter to 4 dB and path loss exponent parameterto 4.95. In the shadowing model, the link error rate depend on the distance betweennodes, which is the realistic behavior. The used parameters give a reliable connec-tion with 0 dBm transmission power when distance is less than 28 m. The receptionprobabilities in 30 m, 40 m, 50 m, and 60 m distances are 99%, 70%, 14%, and 0.1%,respectively.
The simulation topology consisted of 50 nodes placed on a grid. The distance be-tween adjacent nodes was 28 m. Thus, the nodes in the center of the grid had 4 neigh-bors within 28 m distance and 4 additional neighbors within 40 m distance. Three ofthe nodes were configured as sinks, while 18 of the nodes transmitted data to the sinks(6 source nodes per sink). The other nodes acted as routers. To gain confidence onthe results, the results were averaged over 10 repetitions with different source nodes.As the hop count affects latency, the source nodes were selected so that their averagedistance to the sinks was 70 m. This way, the average hop count was the same due tothe grid topology.
To show the difference between cost components, each cost weight (we, wr, wd , andwt) was maximized separately. These were compared against max-min energy rout-ing [98] and the cost calculation used in ZigBee [215]. Max-min energy routing
Table 13. Static power consumptions in Chipcon CC2420 radio operating at 3 V supply volt-age.
Mode Power consumption (mW)
Transmit (-5 dBm) 42.0Transmit (0 dBm) 52.2Receive 56.4Idle 1.28Sleep 0.192

68 6. Protocol Designs for QoS
defines the routing cost for a route along nodes n1,n2, . . . ,nk−1 as
CR =k−1maxi=1
1Ei, (10)
where Ei is the residual energy at node i. In ZigBee, an implementation may report 7as cost value or derive the cost from the probability of packet reception on a link (pl)as
C{l}=
{7min(7,round(1, pl
4)) (11)
In these simulations, the reliability was used.
Figure 27 shows the average end-to-end reliability, end-to-end latency, and networklifetime. End-to-end reliability and latency were calculated as an average of individ-ual values of the data transmitting nodes. End-to-end reliability does not reach 100%as each link has non-zero packet error rate. Instead, a packet is dropped after itstransmissions attempt limit is exceeded or when a link breaks due to too many con-secutively missed synchronization beacons. The simulations used 4 attempts whichis the typical value in many practical MACs, e.g. IEEE 802.15.4 [70]. The networklifetime was defined as the time until the first node depletes its energy.
The best reliability, latency, and lifetime is achieved by maximizing the respectiveweight (wr, wd , or we). When the traffic load is high, maximizing the throughputweight (wt) gives the smallest latencies and the best end-to-end reliability as the leastloaded routes are selected.
The proposed reliability cost function (wr) has 99.4% end-to-end reliability on lowtraffic load. In comparison, the ZigBee cost function has 98.8% end-to-end reliabil-ity. The reliability of the proposed cost function is higher because it evaluates theactual link reliability after retransmissions instead of using an arbitrary exponent.In addition, the proposed cost function also considers queue drop probability, thushaving over 10% higher end-to-end reliability when the traffic load is high.
Compared to the max-min energy routing, the proposed energy cost function (we)gives 1% . . .6% longer network lifetime depending on traffic load. While theoreti-cally the max-min energy routing should maximize the time until first node dies [98],in a practical network with packet errors the max-min energy routing selects unreli-able links and wastes energy due to retransmissions.

6.3. Cross-layer Design 69
0.8
0.85
0.9
0.95
1
0 20 40 60 80 100 120 140 160 180
Goodput
Offered load (B/s)
0.6
0.7
0.8
0.9
1
0 20 40 60 80 100 120 140 160 180
Lif
etim
e
Offered load (B/s)
0
5
10
15
20
25
30
0 20 40 60 80 100 120 140 160 180
Routi
ng l
aten
cy (
s)
Offered load (B/s)
QoS routing, wr=1QoS routing, wd=1QoS routing, wt=1QoS routing, we=1
ZigBeeMax-min energy
Fig. 27. Goodput, end-to-end latency, and network lifetime with different QoS weights.
6.3 Cross-layer Design
The cross-layer design in TUTWSN integrates the presented dynamic capacity al-location algorithm and QoS routing protocol. In practice, the cross-layer design isrealized with shared traffic classes and packet queue as shown in Fig. 28.
TUTWSN defines a configurable traffic class that defines the QoS. A sensor applica-tion selects the most suitable traffic class for its data and identifies the traffic class inthe transmitted packet. The overhead is small as a class can be expressed with onlyfew bits. For example, in the TUTWSN implementation, two traffic classes wereused which required one bit overhead.
The traffic class comprises routing weights, traffic priority, and aging time. Routingweights are used in the route cost calculations. In addition, the maximum number ofaccess cycles to wait for a CFP slot at the MAC layer (used by the dynamic capacityallocation algorithm) is derived from the routing weight for delay (wd) as
TA = (1−wd) ·TA,max. (12)

70 6. Protocol Designs for QoS
Fig. 28. Cross-layer interaction in TUTWSN.
As a result, transmission is attempted immediately for traffic that is configured toprioritize latency (wd = 1), while other traffic may wait up to TA,max access cycles.The traffic priority has two purposes. First, high priority packets are enqueued andtransmitted first. Second, lower priority packets may be replaced when memory isfull. Thus, the priority setting promotes low latencies and improves reliability forhigh priority packets when a network or node is congested. As such, high prioritysettings is intended for emergency and alert packets, whereas a lower priority is usedfor normal traffic. Aging time defines a maximum queuing time per hop until a packetis discarded. The parameter reflects the redundant nature of sensor data: if a route isunavailable until a new measurement is received, it might be better to discard the oldmeasurement and deliver only the new one to save energy.
TUTWSN routing uses an interest based [72, 118] approach where a sink injects oneor more data requests (interests) to the network [P1]. Nodes that can fulfill a requestgenerate data and send it back to the sink. An interest defines
• target application or sensor that produces the desired information (e.g. temper-ature or diagnostics),
• area identifier or hop count from a sink to limit interest to certain part of thenetwork,
• traffic class that should be used to send data,
• data generation interval, and
• sensor value range to generate data only when certain thresholds are exceeded.
As an example, normal temperature readings might use long data generation intervaland normal traffic class to maximize energy-efficiency, while temperature readingsexceeding fire alarm threshold would use much shorter data generation interval andhigh priority traffic class to minimize latency and maximize reliability.
In the implementation, traffic classes are programmed to selected default values dur-

6.3. Cross-layer Design 71
Fig. 29. Traffic class and interest configuration via user interface.
ing deployment but may be configured via an UI as shown in Fig. 29 (dialog onthe left). The figure also shows the interest configuration (dialog on the right). TheUI sends the configuration as commands to the gateway server which interacts withnetworks.
The protocol stack was implemented in Microchip PIC18LF8722 MCU comprisingonly 128 kB program memory and 4 kB data memory. TUTWSN MAC protocol in-cluding the dynamic allocation algorithm consumed 37 kB program and 640 B datamemory, while the routing protocol required 16 kB program and 170 B data memory.Two traffic classes were supported, necessitating only 1 bit overhead on data packetsto denote the class. Route advertisements comprising sink address (3 B), route se-quence numbers (route freshness counter, 1 B) and costs (1 B) for both classes causedthe total of 7 B overhead. As the advertisements were piggybacked to cluster beacons,

72 6. Protocol Designs for QoS
they did not consume any additional overhead, Thus, the QoS based protocol designspresented in this Thesis can be implemented on very resource constrained hardware.

7. NETWORK DIAGNOSTICS
This chapter summarizes the research results on network diagnostics that can be usedanalyze realized QoS, and to detect and identify the performance issues.
7.1 Diagnostics Architecture
The diagnostics architecture comprises embedded self-diagnostics on sensor nodes,diagnostics data collection on a gateway, and data storage and analysis as shown inFig. 30. An analysis tool refines and visualizes the collected information, while analert service can notify e.g. via an email when battery depletes or a node disconnects[143]. The data is stored and analyzed in computer network due to the resourceconstraints and to allow maintaining longer history records. Still, the analysis couldbe located in embedded sensor nodes, e.g. to allow network self-configuration basedon the diagnostics.
Unlike the related work [87, 106, 198] that concentrates on remote debugging ofsoftware failures and filtering failed sensor values, this work allows determining thecause for the performance problems. The collected information allows suggestions toadd new nodes or move existing nodes to solve performance bottlenecks or unreliablelinks.
Fig. 30. Remote diagnostics collection architecture comprising embedded self-diagnostics ona sensor node, diagnostics data collection and storage, and an analysis tool.

74 7. Network Diagnostics
7.2 Embedded Self-diagnostics
The embedded self-diagnostics aggregate statistics from different protocol layers. Asthese statistics are typically necessary to the node’s operation, the self-diagnosticsincurs only small program and data memory overhead. The diagnostics data is passedto the gateway on application layer using the underlying protocol stack. Thus, thediagnostics does not require changing the communication protocols.
As all of the self-diagnostics information may not be needed at the same time, thediagnostics data is divided into several independent categories. Each category is as-sociated with a certain collection period that determines how often the diagnosticsdata is sent to the gateway. Only the categories of interest are collected. In addition,different nodes may be instructed to collect a different set of diagnostics. Thus, theoverhead, energy-usage, and the impact to other traffic can be minimized with selec-tive diagnostics collection, making the approach feasible for the resource constrainedWSNs. In practice, each category is transmitted to the gateway in a separate packet.The categories and collected statistics are summarized in Table 14.
7.2.1 Node information
Node information includes generic performance statistics and allows detecting per-formance problems that manifest as increased queue usage, node reboots, route chan-ges, or network scans. Thus, the node diagnostics can be always active and used toswitch on other, more extensive diagnostics when a symptom for a misbehavior isdetected.
In addition to the performance diagnostics, node information includes remaining en-ergy estimation used to determine when to replace the batteries. For practical reasons,the prototype implemented this with battery voltage. While the voltage indicateswhen the battery is about to deplete, it is inaccurate as an lifetime estimator due tonon-linear relation between voltage and remaining energy. Thus, in many cases itwould be preferable if a node could estimate its lifetime in percentage value or atreal-time value.
7.2.2 Network and node events
Events assign a reason for specific outcomes, e.g. a network scan event occurred be-cause a next hop link was lost. This information is crucial for detecting and analyzingproblems that cannot be expressed as simple counters.

7.2. Embedded Self-diagnostics 75
Table 14. Embedded self-diagnostics information grouped by category.
Category Statistic Description
Node Voltage Latest voltage measurementInformation Queue statistics Average and maximum queue usage and delays
Role Cluster head or member nodeBoots Boot counterNetwork scans Network scan counterRoute changes Cumulative number of route changes
Network and Event The descriptor of an occurred eventnode events Reason A reason for the event
Network Neighbor Neighbor identifier (e.g. unique address)Topology Link quality Link quality indication
Channel Frequency that the neighbor operates onSleep schedule Duty cycle timing relative to the sender
Cluster Channel usage Average and maximum channel usagetraffic RX/TX counters The number of attempted and failed operations
Link Neighbor Neighbor identifiertraffic RX/TX counters The number of attempted and failed operations
Activity MCU activity Time spent in active and idle statesRadio states Time spent in RX, TX, idle, and sleep modes
Route Path List of forwarding nodes
Routing Latency End-to-end latencylatency Energy Consumed energy to forward a packet
Hop count Number of unique hops to the sink
Software Boot reason Last boot reason: assertion, low voltage, ...errors Call stack List of function addresses
7.2.3 MCU and transceiver activity
Activity diagnostic expresses the fraction of time spent in MCU active (tmcu), radioreception (trx), and radio transmission (ttx) states. It allows detecting unusually hightransceiver or controller activity that might indicate other problems. In addition,the activity diagnostic allows estimating the average power consumption of a sensornode when static power consumptions of different operation modes is known. Thisapproach is similar to the [41] but extended here to allow remote diagnostics. The

76 7. Network Diagnostics
average power consumption P is calculated as
P = tmcu ·Pmcu +(1− tmcu) ·Psleep
+ trx ·Prx + ttx ·Ptx +(1− trx− ttx) ·Po f f , (13)
where Pmcu, Psleep, Prx, Ptx, and Po f f are static power consumptions of MCU ac-tive, MCU sleep, radio reception, radio transmission, and radio off states, respec-tively. These are platform specific constants and can be stored e.g. in the diagnosticsdatabase, thus reducing overhead.
7.2.4 Route and routing latency
The route diagnostic describes end-to-end data forwarding. It contains the routingpath as a list of node addresses. Each forwarding node updates the list. The in-formation can be used to detect unusually long routes and allow understanding howthe routes change over time. Routing latency describes end-to-end latency. Eachforwarding node n updates routing latency tn as
tn = tn−1 +(t1− t0)+Ttoa, (14)
where tn−1 is the latency in a packet that is received from the previous hop n−1, t1 isthe forwarding time, t0 is the reception time, and Ttoa is time-on-air that is estimatedfrom the transceiver data rate and packet length. The latency information is a partof the route diagnostic but could also be piggybacked to data packets for continuouslatency monitoring.
7.2.5 Cluster and link traffic
The hop-by-hop traffic is described with attempt and success counters of receptionsand transmissions, which allows calculating link reliabilities and estimating the usedbandwidth. The cluster traffic diagnostic describes the aggregate traffic flowing inand out from a node. The link traffic diagnostic is more descriptive as it maintainsseparate counters for each neighbor but has a higher overhead as the number of linksis typically higher than the number of clusters in the network. Depending on therequired level of detail, either diagnostic may be switched on.

7.2. Embedded Self-diagnostics 77
7.2.6 Network topology
Network topology describes the structure of the network and is essential when tryingto determine how problems in one node can affect the rest of the network.
The neighbor information includes link quality (e.g. Received Signal Strength Indica-tor (RSSI)), channel, and sleep schedules. The link quality information approximatesthe relative distance between nodes, thus allowing more accurate comprehension onthe topology. In addition, the information allows detecting when a node has only lowquality links, which requires a user interaction to add new nodes in the vicinity toensure reliable data forwarding.
The sleep schedules relate to the low duty cycle operation. Assuming that each nodereceives data on their own active period and forwards the data on the active period ofa next hop neighbor, duty cycling incurs a significant forwarding delay. Consideringthese delays, it is possible to calculate the optimal routing delay between a node anda gateway. This allows detecting performance problems, when the optimal delay iscompared against the actual diagnosed delay.
7.2.7 Software errors
Due to the resource constraints and tight coupling between software and hardware,embedded WSN devices are typically programmed with C or assembly languages thatlack the advanced exception handling and memory overwrite protection of higherlevel languages. As a result, the embedded programming is error prone and someerrors surface only in the actual deployments as the environment or network compo-sition differs from the testing phase.
The proposed software diagnostics indicates the reason and the place in code wherethe problem occurred. As the information need to be transmitted only when a prob-lem occurs, bandwidth is not typically required and the approach can be used in actualdeployments to catch errors not found during testing. Two types of programming er-rors are covered. First, the diagnostics provides information on serious errors thatprevent the execution of the embedded software, such as memory corruption, stackoverflows, hardware failure, and other unexpected or unhandled events. This is real-ized by placing assertion statements to the code. Second, the self-diagnostics allowsdetecting infinite code loops with a software watchdog timer. Unlike the typical ap-proach of using hardware watchdog timers to reboot the device, this approach allowsidentifying the problematic code segment.

78 7. Network Diagnostics
If the boolean condition assigned to a assertion is false or software watchdog timertriggers, the self-diagnostics reboots the device to ensure a clean state as presented inFig. 31. The diagnostics require a persistent memory, such as EEPROM, to maintaininformation while the node boots. The persistent memory holds an incremental bootcounter, last boot reason, and the call stack of the executed program. This informationis transmitted to a gateway after a boot.
7.3 Diagnosed QoS Metrics
The relation between the QoS metrics and collected diagnostics is summarized inTable 15. Security related diagnostics are not collected, as security features that af-fect the confidentiality, integrity, and authenticity of data, e.g., encryption, are oftendetermined at deployment time and their change typically requires user intervention.However, it should be noted that jamming resistance against Denial-of-Service (DoS)attacks is another aspect of security [28] but this is reflected in availability. The nodedensity can be calculated without diagnostics with known node locations. The diag-nostics information allows evaluating QoS at two levels: network wide (end-to-end)or local (link or node). Evaluating network wide QoS gives an average network per-formance, while examining the local performance identifies performance bottlenecks.
7.4 Performance Analysis Tool
The performance analysis tool presents visually the collected self-diagnostics. Thereceived node operation, link traffic (referred to as data forwarding in the screen
Fig. 31. Triggering software diagnostics on assert or unintentional endless loop.

7.4. Performance Analysis Tool 79
Table 15. Relation between QoS metrics and collected diagnostics.
QoS metric Network Node
Availability Worst node availability Packet interarrival times at sinkReliability Missing sequence numbers Transmission success countersLatency Routing latency Queuing delayThroughput Received traffic at sink Cluster/node traffic countersLifetime Worst node lifetime Long term: voltage drop
Short term: MCU and radio activityMobility Sum of route changes Amount of route changesComm. range Average node ranges Estimate from neighbor info and
known node locationsNode count Active nodes -
capture), cluster traffic diagnostics are directly visualized as charts and tables, butthe tool also combines and refines the existing data for more descriptive informa-tion. Figure 32 shows the chart selection interface, which is preceded by network,examined node, and analyzed timeframe selection. The actual main interface of thediagnostics tool comprises a tabbed view of different charts.
The tool comprises three levels of analysis: availability analysis, advanced views
Fig. 32. Chart types in the WSN diagnostics tool.

80 7. Network Diagnostics
based on the self-diagnostics, and the presentation of sensor values. The availabil-ity analysis does not require self-diagnostics but can be evaluated from any receiveddata. However, self-diagnostics is required for evaluating the performance. Sensorvalues allow examining the effect of environmental conditions, e.g. humidity affect-ing communication range, to the network operation.
7.5 QoS Analysis on an Outdoor Network
The developed diagnostics were used to analyze QoS in a network comprising 14long range 433 MHz TUTWSN nodes. The nodes were deployed on 1.2 km long linetopology to highlight the effects of a multihop topology.
Received packets chart shown in Fig. 33 is the basic method to examine networkoperation. The data point in the chart denotes a packet reception. Thus, a networkproblem manifests as a long period between packet receptions. In the figure, packetdelivery to the sink (node identifier 233) was interrupted at 9:17. Based on event di-agnostics, the reason was a broken link between the sink and the node that forwardedmost of the network data.
The availability in the test network is presented in Fig. 34. The diagnostics tool vi-
Fig. 33. WSN diagnostics UI showing received packets per node. The hole at 9:17 indicatesnetwork problems.

7.5. QoS Analysis on an Outdoor Network 81
sualizes availability with a summary table and chart. The summary shows the avail-ability intervals with selected percentages (80%, 90%, 99%, ...), where the intervalequals the worst availability among nodes. In addition, the summary shows the oc-curance time of longest time between receptions for each node. This informationeases finding and examining problematic times with other diagnostics. The avail-ability chart shows the best (maximum), average, and worst (minimum) availabilitiesamong nodes.
The logical and actual topologies of the network are shown in Figure 35. Logicaltopology is drawn based on the connectivity information, while the actual topologyuses node locations that were configured manually to a database. The self-diagnosticsallows showing usage (throughput), transmission reliability, and signal strength in-formation per link.
The self-diagnostics allows per node, per hop, and per traffic class visualization ofthe end-to-end latency. Figure 36 shows the per node and per traffic class latenciesin the test network. The latency information was collected by requesting latency di-agnostics via normal (maximize energy weight we) and delay optimized (maximizedelay weight wd) traffic classes. In general, latency increases linearly as the functionof hops. The relatively larger increment with 9 hops was due to momentary network
Fig. 34. Availability summary summarizing availabilities and showing the occurrence of thelargest unavailability per node (left), and availability chart with average, minimum,and maximum availabilities (right).

82 7. Network Diagnostics
Fig. 35. Network topology diagnostics: logical network topology showing link reliabilities(left) and actual network topology showing link signal strengths (right).
errors: the largest hop count was used only after a link break that caused delays. Theper traffic class results show that the latency optimized traffic class has 4 s (16%)smaller latency at 90% reception mark. Considering that the nearly linear topologyseverely limits available route choices, the result confirms the QoS selection via traf-fic classes.
Figure 37 shows received signal strengths on a selected node. The signal strengthvaries on short term basis although the network topology is static. The signal degra-dation on a next hop might break the connection necessitating time consuming neigh-
Fig. 36. End-to-end latency categorized as per hop (left) and per traffic class (right).

7.6. Performance Comparison of Indoor and Outdoor Deployments 83
bor and route discovery.
7.6 Performance Comparison of Indoor and Outdoor Deployments
This section presents the measured network QoS in the outdoor rural area and in theindoor campus area deployments. The analysis contains network diagnostics fromselected one week period. The results are summarized in Table 16.
In the indoor network, the node count varies because some of the nodes were givento students to carry around and were not therefore always within the network area.The presented node count was calculated from the number of active nodes within onehour. The area coverage and node density were calculated with known node place-ments, whereas the communication range is the measured range in an open space.To offload the higher traffic of the indoor network, the indoor network contained 9sinks. This way, the network load was balanced among the sinks via the throughputcomponent in the routing cost.
The end-to-end latency in the indoor network is smaller due to shorter hop count.Still, the average latency per hop is relatively high because the reliability of the in-door network suffered from several WLANs operating on the same frequency band.Although frequency agility methods were later developed for the TUTWSN [66],these were not in place in the examined time period.
Fig. 37. Link signal strength diagnostics of a selected node.

84 7. Network Diagnostics
Table 16. Comparison of QoS in the outdoor and indoor deployments.
Outdoor IndoorPerformance metric Min Avg Max Min Avg Max
Latency (s) 3.6 19.4 38.0 2.5 12.5 25.4Hops 1 4.5 11 1 3.2 16Latency/hop (s) 3.6 4.2 4.5 1.7 4.0 6.7Throughput (bps) 237 248 256 1194 1220 1290Reliability (%) 99.78 99.95 100.0 89.46 99.81 100.0Availability, 95% (s) 32.0 33.9 56.0 59.7 79.1 127.8Lifetime (days) 250 250 250 207 427 605Communication range (m) 500 500 500 140 140 140Node count 17 17 17 187 189 200Area coverage (m2) - 124000 - - 23000 -Node density (1/1000m2) 0.14 0.14 0.14 8.1 8.2 8.7
As the indoor deployment has been active several years, the lifetime was calculatedfrom the battery voltage as an elapsed time between full charge to an empty battery.However, this method was not feasible for the outdoor network due to its short, fewmonths deployment time. Instead, its lifetime was estimated by measuring averagecurrent (500 uA) over 10 minutes and applying this to the estimated the battery ca-pacity of 3000 mAh. It should be noted that while the measured node was part ofa network, the actual lifetime may vary due to different traffic loads and reliabilityproblems causing e.g. retransmissions.

8. SUMMARY OF PUBLICATIONS
The publications of this Thesis are based on the work of the author during yearsbetween 2005 and 2010. This chapter summarizes the contents of the publicationsand clarifies the contribution of the author. The co-authors agree with the describedcontributions of the Author. In each publication, the supervisor Prof. Marko Hän-nikäinen has given ideas for the designs, analyses, and experiments, and revised thedraft versions of the publications. Prof. Timo D. Hämäläinen has given ideas for thepublications and revised the draft versions of publications. None of the publicationshave previously been used as a part of a doctoral thesis.
Publication [P1] proposes a cost-based dynamic routing protocol for resource con-strained WSNs. The publication presents a reactive, energy-efficient protocol mes-saging and QoS based route selection metrics. The protocol is verified with experi-mental measurements.
The author is the main architect of the routing protocol and designed the cost metricsfor route selection. Mauri Kuorilehto gave ideas for the protocol and revised the text.
Publication [P2] proposes a reserved slot allocation algorithm for synchronized MACs.The algorithm adjusts slots dynamically based on traffic demands, and allows trade-off between delay and energy-efficiency determined by application and routing re-quirements. The algorithm is verified by modeling its operation on IEEE 802.15.4.
The author designed and analyzed the capacity optimization algorithm. Mikko Koh-vakka developed the original analytical models for IEEE 802.15.4 which the authormodified and extended for the performance analysis. Mauri Kuorilehto gave ideasfor the algorithm.
Publication [P3] presents an embedded software architecture of WSN diagnostics.It proposes a methodology and metrics to measure QoS and determine performanceproblems. Also, the publication defines a configuration process for adjusting networksettings to match the performance requirements.
The author designed and implemented the WSN diagnostics, while Mikko Kohvakkadesigned the prototype hardware used in the measurements.

86 8. Summary of Publications
Publication [P4] defines availability and reliability metrics for analyzing WSN QoS.The publications evaluates the factors affecting end-to-end QoS and the performanceof the low duty cycling and beacon synchronization. Based on the results, a reli-able data forwarding algorithm that guarantees end-to-end reliability is proposed forresource constrained WSNs.
The author designed and analyzed the presented metrics and protocols.
Publication [P5] presents a CoS add-on layer for wireless mesh networks. The proto-col implements a priority and reservation based traffic control over contention-basedMACs. It is verified with simulations and measurements on IEEE 802.11.
The author designed and implemented the CoS add-on layer, and performed the sim-ulations and measurements.
Publication [P6] extends the reserved slot allocation algorithm by analyzing differ-ent allocation approaches. In addition, the publication describes TUTWSN MAC indetail and analyzes its performance against other low energy WSN MAC proposals.
The author designed QoS-related aspects of the TUTWSN MAC protocol compris-ing queuing disciplines and the slot allocation method, whereas Mikko Kohvakkawas the main architect of the TUTWSN MAC layer. The author designed and wrotechannel access specific parts of the publication (Sections 4.2-4.3), verified modelsand the performance of slot allocation methods with simulations (Section 6), and an-alyzed the performance of the MAC protocol in a deployment (Section 7). MikkoKohvakka wrote the related work, generic MAC description, and designed the per-formance models.

9. CONCLUSIONS
The application space of WSNs is huge and each application has its distinct ser-vice requirements and characteristics. Despite the advancements in low-power com-munication and computing circuits, the current technology has trade-offs betweenavailable energy, physical size, computing, communication, and memory resources.Energy can be saved by reducing activity, but this necessitates QoS support in com-munication protocols and applications to ensure that the application requirements arefulfilled. The main research challenge is the design of scalable and adaptive QoScontrol for resource constrained hardware with the limited energy budget.
This Thesis presented a survey of QoS support in existing protocols and standards.The protocols were targeted for a specific purpose and did not support adjustableQoS or applications having different service requirements within the same network.Furthermore, QoS measurement and control methods concentrated only on ensuringconsistent sensor values but did not consider the network operation. This motivatedthe design of QoS definitions, diagnostics and management tools, and QoS commu-nication protocols.
This Thesis defined QoS that is suitable for resource constrained, low energy WSNs.The definition includes new availability metric and the selection of other relevant QoSmetrics. Next, protocol designs at MAC and routing layers were developed based onthe defined metrics. Instead of optimizing communication protocols for a certain usecase as in the related research, the designs allow configurable and adaptive level ofservice. A cross-layer design was utilized to combine the MAC and routing protocolswith the QoS metrics. The protocols and diagnostics were verified with simulationsand practical implementation on TUTWSN platform. Finally, sensor self-diagnosticsand diagnostics tools were designed to analyze and adjust the level of service in anetwork. Compared to the related proposals on in-network sensor diagnostics, theframework also detects performance problems and identifies reasons for the issuesthus easing the repair.
The results of this Thesis can be used in the WSN research, development, and imple-mentation in general. The presented methods and protocol designs can be adapted to

88 9. Conclusions
existing applications and protocols. To fulfill the vision of disposable sensor nodes,future advancements in the manufacturing technologies aim toward reduced size andcost instead of performance. While the manufacturing technologies are constantlyimproving, advancements that reduce cost, size, and energy at the same time areslower. Therefore, the resource constraints exist also in the near future and the prin-ciples and results of this Thesis remain valid.

BIBLIOGRAPHY
[1] K. Akkaya and M. Younis, “An energy-aware QoS routing protocol for wire-less sensor networks,” in 23rd Int’l Conf. on Distributed Computing SystemsWorkshops, May, 19–22 2003, pp. 710–715.
[2] I. F. Akyildiz, W. Su, Y. Sankarasubramaniam, and E. Cayirci, “Wireless sen-sor networks: a survey,” Computer Networks, vol. 38, no. 4, pp. 393–422,2002.
[3] I. F. Akyildiz, T. Melodia, and K. R. Chowdury, “Wireless multimedia sensornetworks: A survey,” IEEE Wireless Communications, vol. 15, no. 6, pp. 32–39, Dec. 2007.
[4] I. F. Akyildiz, W. Su, Y. Sankarasubramaniam, and E. Cayirci, “A survey onsensor networks,” IEEE Communications Magazine, vol. 40, no. 8, pp. 102–114, Aug. 2002.
[5] J. N. Al Karaki and A. E. Kamal, “Routing techniques in wireless sensor net-works: A survey,” IEEE Wireless Communications, vol. 11, no. 6, pp. 6–28,Dec. 2004.
[6] S. Al-Omari, J. Du, and W. Shi, “Score: a sensor core framework for cross-layer design,” in Proc. of the 3rd Int’l Conf. on Quality of service in heteroge-neous wired/wireless networks (QShine), 2006, p. 19.
[7] “Arduino product documentation,” Available: http://arduino.cc, Arduino, vis-ited: May 07, 2012.
[8] L. Atzori, A. Iera, and G. Morabito, “The internet of things: A survey,” Com-puter Networks, vol. 54, p. 2787U2805, Jun. 2010.
[9] A. Ayadi, “Energy-efficient and reliable transport protocols for wireless sensornetworks: State-of-art,” Wireless Sensor Network, pp. 106–113, Mar. 2011.

90 BIBLIOGRAPHY
[10] A. Bachir and D. Barthel, “Localized max-min remaining energy routing forWSN using delay control,” in IEEE Int’l Conf. on Communications (ICC),vol. 5, May 2005, pp. 3302–3306.
[11] H. Bai and M. Atiquzzaman, “Error modeling schemes for fading channels inwireless communications: A survey,” IEEE Communications Surveys Tutori-als, vol. 5, no. 2, pp. 2–9, 2003.
[12] D. Bein and A. K. Datta, “A self-stabilizing directed diffusion protocol for sen-sor networks,” in Proc. Int’l Conf. on Paraller Processing Workshops (ICPP),2004, pp. 69–76.
[13] J. Beutel, M. Dyer, L. Meier, and L. Thiele, “Scalable topology control fordeployment-support networks,” in Fourth Int’l Symposium on InformationProcessing in Sensor Networks (IPSN 2005), Apr. 2005, pp. 359–363.
[14] S. Bhatti and J. Xu, “Survey of target tracking protocols using wireless sen-sor network,” in Fifth Int’l Conf. on Wireless and Mobile Communications(ICWMC), Aug. 2009, pp. 110–115.
[15] Bluetooth Specification Version 4.0, Bluetooth SIG, Dec. 2009.
[16] T. Bokareva, N. Bulusu, and S. Jha, “A performance comparison of data dis-seminating protocols for wireless sensor networks,” in Proc. Global Telecom-munications Conf. Workshops, 2004, pp. 85–89.
[17] P. Bonnet, J. Gehrke, and P. Seshadri, “Querying the physical world,” IEEEPersonal Communications, vol. 7, no. 5, pp. 10–15, Oct. 2000.
[18] R. Braden, D. Clark, and S. Shenker, “Integrated services in the internet archi-tecture: an overview,” RFC 1633, Jun. 1994.
[19] R. Braden, L. Zhang, S. Berson, S. Herzog, and S. Jamin, “Resource ReSer-Vation Protocol (RSVP),” RFC 2205, Sep. 1997.
[20] M. Buettner, G. V. Yee, E. Anderson, and R. Han, “X-MAC: A short preambleMAC protocol for duty-cycled wireless sensor networks,” in Proc. of the 4thInt’l Conf. on Embedded Networked Sensor Systems, 2006, p. 307U320.
[21] L. A. Bush, C. D. Carothers, and B. K. Szymanski, “Algorithm for optimizingenergy use and path resilience in sensor networks,” in Proc. Second EuropeanWorkshop on Wireless Sensor Networks (EWSN), 2005, pp. 391–396.

BIBLIOGRAPHY 91
[22] H. Cao, K. W. Parker, and A. Arora, “O-MAC: A receiver centric power man-agement protocol,” in Proc. IEEE Int’l Conf. on Network Protocols (ICNP),2006, pp. 311–320.
[23] S. Chalasani and J. M. Conrad, “A survey of energy harvesting sources forembedded systems,” in IEEE Southeastcon, Apr. 2008, pp. 442–447.
[24] J.-H. Chang and L. Tassiulas, “Maximum lifetime routing in wireless sensornetworks,” IEEE/ACM Transactions on Networking, vol. 12, no. 4, pp. 609–619, Aug. 2004.
[25] S. Chatterjea, L. van Hoesel, and P. Havinga, “AI-LMAC: an adaptive,information-centric and lightweight MAC protocol for wireless sensor net-works,” in Proc. of the Intelligent Sensors, Sensor Networks and InformationProcessing Conference, Dec., 14-17 2004, pp. 381–388.
[26] B.-r. Chen, G. Peterson, G. Mainland, and M. Welsh, “Livenet: Using passivemonitoring to reconstruct sensor network dynamics,” in Distributed Comput-ing in Sensor Systems, ser. Lecture Notes in Computer Science, S. Nikoletseas,B. Chlebus, D. Johnson, and B. Krishnamachari, Eds. Springer Berlin / Hei-delberg, 2008, vol. 5067, pp. 79–98.
[27] D. Chen and P. K. Varshney, “Qos support in wireless sensor networks: asurvey,” in Proc. 2004 Int’l Conf. on Wireless Networks, 2004.
[28] X. Chen, K. Makki, K. Yen, and N. Pissinou, “Sensor network security: asurvey,” IEEE Communications Surveys Tutorials, vol. 11, no. 2, pp. 52–73,2009.
[29] Y. P. Chen, A. L. Liestman, and J. Liu, “A hierarchical energy-efficient frame-work for data aggregation in wireless sensor networks,” IEEE Transactions onVehicular Technology, vol. 55, no. 3, pp. 789–796, May 2006.
[30] Z. Cheng and W. B. Heinzelman, “Flooding strategy for target discovery inwireless networks,” Wireless Networks, vol. 11, no. 5, pp. 607–618, 2005.
[31] H. Choi, N. Kim, and H. Cha, “6LoWPAN-SNMP: Simple network manage-ment protocol for 6LoWPAN,” in IEEE Int’l Conf. on High Performance Com-puting and Communications (HPCC), Jun. 2009, pp. 305–313.
[32] C.-Y. Chong and S. P. Kumar, “Sensor networks: Evolution, opportunities,and challenges,” Proceedings of the IEEE, vol. 91, no. 8, pp. 1247–1256, Aug.2003.

92 BIBLIOGRAPHY
[33] E. Crawley, R. Nair, B. Rajagopalan, and H. Sandick, “A framework for QoS-based routing in the internet,” RFC 2386, Sep. 1998.
[34] D. S. J. De Couto, D. Aguayo, J. Bicket, and R. Morris, “A high-throughputpath metric for multi-hop wireless routing,” in Proc. 9th Annual Int’l Conf. onMobile Computing and Networking (MobiCom), 2003, pp. 134–146.
[35] S. Dekleva, J. Shim, U. Varshney, and G. Knoerzer, “Evolution and emergingissues in mobile wireless networks,” Communications of the ACM, vol. 50,no. 6, pp. 38–43, 2007.
[36] I. Demirkol, C. Ersoy, and F. Alagöz, “MAC protocols for wireless sensornetworks: A survey,” IEEE Communications Magazine, vol. 44, no. 4, pp.115–121, Apr. 2006.
[37] I. Dietrich and F. Dressler, “On the lifetime of wireless sensor networks,” ACMTransactions on Sensor Networks, vol. 5, no. 1, pp. 1–39, 2009.
[38] D. Dong, Y. Liu, and X. Liao, “Self-monitoring for sensor networks,” in Proc.of the 9th ACM Int’l Symposium on Mobile Ad Hoc Networking & Computing,2008, pp. 431–440.
[39] S. Du, A. K. Saha, , and D. B. Johnson, “RMAC: A routing-enhanced duty-cycle MAC protocol for wireless sensor networks,” in Proc. of the 26th An-nual IEEE Conf. on Computer Communications (INFOCOM), May 2007, pp.1478–1486.
[40] X. Du and H.-H. Chen, “Security in wireless sensor networks,” IEEE WirelessCommunications, vol. 15, no. 4, pp. 60–66, Aug. 2008.
[41] A. Dunkels, F. Österlind, N. Tsiftes, and Z. He, “Software-based on-line en-ergy estimation for sensor nodes,” in EmNets ’07: Proceedings of the 4th work-shop on Embedded networked sensors, 2007, pp. 28–32.
[42] M. Dyer, J. Beutel, T. Kalt, P. Oehen, L. Thiele, K. Martin, and P. Blum, “De-ployment support network,” in Wireless Sensor Networks, ser. Lecture Notesin Computer Science, K. Langendoen and T. Voigt, Eds. Springer Berlin /Heidelberg, 2007, vol. 4373, pp. 195–211.
[43] ANT Message Protocol and Usage Rev 3.1, Dynastream Innovations Inc.,2009, D00000652. [Online]. Available: http://thisisant.com

BIBLIOGRAPHY 93
[44] A. El-Hoiydi and J.-D. Decotignie, “WiseMAC: An ultra low power MACprotocol for multi-hop wireless sensor networks,” in Proc. of the First Int’lWorkshop on Algorithmic Aspects of Wireless Sensor Networks (ALGOSEN-SORS), Jul. 2004, pp. 18–31.
[45] M. Elhadef, A. Boukerche, and H. Elkadiki, “Diagnosing mobile ad-hoc net-works: two distributed comparison-based self-diagnosis protocols,” in 4thACM Int’l Workshop on Mobility Management and Wireless Access (Mobi-Wac’06), 2006, pp. 18–27.
[46] E. Fasolo, M. Rossi, J. Widmer, and M. Zorzi, “In-network aggregation tech-niques for wireless sensor networks: A survey,” IEEE Wireless Communica-tions, vol. 14, no. 2, pp. 70–87, Apr. 2007.
[47] E. Felemban, C.-G. Lee, and E. Ekici, “MMSPEED: Multipath multi-SPEEDprotocol for QoS guarantee of reliability and timeliness in wireless sensor net-works,” IEEE Transactions on Mobile Computing, vol. 5, no. 6, pp. 738–754,Jun. 2006.
[48] D. Flowers and Y. Yang, “MiWi wireless networking protocol stack,”Microchip Technology Inc., Tech. Rep., 2007, Doc. No. DS01066A.[Online]. Available: http://ww1.microchip.com/downloads/en/AppNotes/MiWiApplicationNote_AN1066.pdf
[49] N. Fourty, T. Val, P. Fraisse, and J.-J. Mercier, “Comparative analysis ofnew high data rate wireless communication technologies "from Wi-Fi toWiMAX",” in Joint Int’l Conf. on Autonomic and Autonomous Systems and In-ternational Conference on Networking and Services (ICAS-ICNS), Oct. 2005,pp. 66–66.
[50] H. Friis, “A note on a simple transmission formula,” Proceedings of the IRE,vol. 34, no. 5, pp. 254 – 256, may 1946.
[51] D. Ganesan, R. Govindan, S. Shenker, and D. Estrin, “Highly-resilient,energy-efficient multipath routing in wireless sensor networks,” SIGMOBILEMob. Comput. Commun. Rev., vol. 5, no. 4, pp. 11–25, 2001.
[52] Q. Gao, K. J. Blow, and D. J. Holding, “Analysis of energy conservation insensor networks,” Wireless Networks, vol. 11, pp. 787–789, 2005.
[53] J. Gehrke and S. Madden, “Query processing in sensor networks,” IEEE Per-vasive Computing, vol. 3, no. 1, pp. 46–55, jan 2004.

94 BIBLIOGRAPHY
[54] O. Gnawali, M. Yarvis, J. Heidemann, and R. Govindan, “Interaction of re-transmission, blacklisting, and routing metrics for reliability in sensor networkrouting,” in Proc. of 1st Annual IEEE Communications Society Conf. on Sen-sor and Ad Hoc Communications and Networks (SECON), 2004, pp. 34–43.
[55] O. Goussevskaia, M. do V. Machado, R. A. F. Mini, A. A. F. Loureiro, G. R.Mateus, and J. M. Nogueira, “Data dissemination based on the energy map,”IEEE Communications Magazine, vol. 45, no. 7, pp. 134–143, Jul. 2005.
[56] J. Gozdecki, A. Jajszczyk, and R. Stankiewicz, “Quality of service terminol-ogy in IP networks,” IEEE Communications Magazine, vol. 41, no. 3, pp.153–159, Mar. 2003.
[57] V. C. Gungor and G. P. Hancke, “Industrial wireless sensor networks: Chal-lenges, design principles, and technical approaches,” IEEE Transactions onIndustrial Electronics, vol. 56, no. 10, pp. 4258–4265, Oct. 2009.
[58] J. Haapola, “NanoMAC: A distributed MAC protocol for wireless ad hoc sen-sor networks,” in XXXVII Convention on Radio Science & IV Finnish WirelessCommunication Workshop, Oct., 17-20 2003.
[59] ——, “Evaluating medium access control protocols for wireless sensor net-works,” PhD Dissertation, University of Oulu, Feb. 2010.
[60] M. Haenggi and D. Puccinelli, “Routing in ad hoc networks: A case for longhops,” IEEE Communications Magazine, vol. 43, no. 10, pp. 93–101, Oct.2005.
[61] G. P. Halkes and K. G. Langendoen, “Crankshaft: An energy-efficient MAC-protocol for dense wireless sensor networks,” in Proc. of the 4th EuropeanConf. on Wireless Sensor Networks (EWSN), 2007, pp. 228–244.
[62] H. Hassanein and J. Luo, “Reliable energy aware routing in wireless sensornetworks,” in IEEE Workshop on Dependability and Security in Sensor Net-works and Systems (DSSNS), 2006, pp. 54–64.
[63] W. R. Heinzelman, A. Chandrakasan, and H. Balakrishnan, “Energy-efficientcommunication protocol for wireless microsensor networks,” in Proc. of the33rd Hawaii Int’l Conf. on System Sciences, 2000, pp. 1–10.
[64] J. Hill, M. Horton, R. Kling, and L. Krishnamurthy, “The platforms enablingwireless sensor networks,” Commun. ACM, vol. 47, no. 6, pp. 41–46, 2004.

BIBLIOGRAPHY 95
[65] M. Hännikäinen, “Design of quality of service support for wireless local areanetworks,” PhD Dissertation, Tampere University of Technology, Nov. 2002.
[66] M. Hänninen, J. Suhonen, T. D. Hämäläinen, and M. Hännikäinen, “Linkquality-based channel selection for resource constrained wsns,” in Proc. of the6th International Conference on Grid and Pervasive Computing (GPC2011),2011.
[67] IEEE Standard for Long Wavelength Wireless Network Protocol, Mar. 2009,IEEE Std 1902.1-2009.
[68] Information Technology—Telecommunications and information exchangebetween systems—Local and metropolitan area networks—Specificrequirements—Part 11: Wireless LAN Medium Access Control (MAC)and Physical Layer (PHY) specifications, Jun. 1997, IEEE Std 802.11-1997.
[69] IEEE Standard for Information Technology—Telecommunications and Infor-mation Exchange Between Systems—Local and Metropolitan Area Networks—Specific Requirements—Part 15.3: Wireless Medium Access Control (MAC)and Physical Layer (PHY) Specifications for High Rate Wireless Personal AreaNetworks (WPANs), Jun. 2003, IEEE Std 802.15.4-2003.
[70] IEEE Standard for Information Technology—Telecommunications and Infor-mation Exchange Between Systems—Local and Metropolitan Area Networks—Specific Requirements—Part 15.4: Wireless Medium Access Control (MAC)and Physical Layer (PHY) Specifications for Low-Rate Wireless Personal AreaNetworks (LR-WPAN), Sep. 2006, IEEE Std 802.15.4-2006.
[71] IEEE Standard for Local and Metropolitan Area Networks—Part 16: Air In-terface for Broadband Wireless Access Systems, May 2009, IEEE Std 802.16-2009.
[72] C. Intanangonwiwat, R. Govindan, D. Estrin, J. Heidemann, and F. Silva, “Di-rected diffusion for wireless sensor networking,” IEEE/ACM Transaction onNetworking, vol. 11, no. 1, pp. 2–16, Feb. 2003.
[73] IEC/PAS 62591: Industrial communication networks - Fieldbus specifications- WirelessHART communication network and communication profile, Interna-tional Electrotechnical Commission (IEC), 2008, iEC/PAS 62591/Ed.1.
[74] Wireless systems for industrial automation: Process control and related appli-cations, ISA, 2009, ISA-100.11a-2009.

96 BIBLIOGRAPHY
[75] Telephone Network and ISDN Quality of Service, Network Management andEngineering – Terms and Definitions of Traffic Engineering, ITU-T, 1994,ITU-T Recommendation E.600.
[76] Telephone Network and ISDN Quality of Service, Network Management andEngineering – Terms and Definitions Related to Quality of Service and Net-work Performance Including Dependability, ITU-T, 1995, ITU-T Recommen-dation E.800.
[77] Y. G. Iyer, S. Gandham, and S. Venkatesan, “STCP: A generic transport layerprotocol for wireless sensor networks,” in Proc. IEEE ICCCN, San Diego, CA,Oct., 17U-19 2005.
[78] Jian Wu and P. Havinga, “Reliable cost-based data-centric routing protocol forwireless sensor networks,” in Seventh ACIS Int’l Conf. on Software Engineer-ing, Artificial Intelligence, Networking, and Parallel/Distributed Computing(SNPD), Jun. 2006, pp. 267–272.
[79] A. Kanzaki, T. Hara, and S. Nishio, “An adaptive TDMA slot assignment pro-tocol in ad hoc sensor networks,” in Proc. ACM Symposium on Applied Com-puting (SAC), Mar., 13–17 2005, pp. 1160–1165.
[80] H. Karl and A. Willig, Protocols and Architectures for Wireless Sensor Net-works. John Wiley & Sons Ltd, 2005.
[81] B. Karp and H. T. Kung, “GPSR: Greedy perimeter stateless routing for wire-less networks,” in Proc. 6th annual Int’l Conf. on mobile computing and net-working (MobiCom’00), Boston, MA, USA, Aug., 06–11 2000, pp. 243–254.
[82] K. Kim, H. Mukhtar, S. Joo, S. Yoo, and S. D. Park, “6lowpan manage-ment information base,” IETF Internet-Draft: draft-daniel-6lowpan-mib-01,Oct. 2009.
[83] Y. Kim, H. Shin, and H. Cha, “Y-MAC: An energy-efficient multi-channelMAC protocol for dense wireless sensor networks,” in Proc. of the 7th Int’lConf. on Information Processing in Sensor Networks (IPSN), 2008, pp. 53–63.
[84] M. Kohvakka, “Medium access control and hardware prototype designs forlow-energy wireless sensor networks,” PhD Dissertation, Tampere Universityof Technology, May 2009.

BIBLIOGRAPHY 97
[85] M. Kohvakka, M. Kuorilehto, M. Hännikäinen, and T. D. Hämäläinen, “Per-formance analysis of IEEE 802.15.4 and zigbee for large-scale wireless sen-sor network applications,” in Proc. of the 3rd ACM Int’l Workshop on Per-formance Evaluation of Wireless Ad Hoc, Sensor, and Ubiquitous Networks(PE-WASUN), Oct. 2006, pp. 48–57.
[86] C. E. Koksal and H. Balakrishnan, “Quality-aware routing metrics for time-varying wireless mesh networks,” IEEE Journal on Selected Areas in Commu-nications, vol. 24, no. 11, pp. 1984–1994, Nov. 2006.
[87] V. Krunic, E. Trumpler, and R. Han, “NodeMD: diagnosing node-level faultsin remote wireless sensor systems,” in 5th Int’l Conf. on Mobile Systems, Ap-plications and Services (MobiSys’07), 2007, pp. 43–56.
[88] J. Kulik, W. Heinzelman, and H. Balakrishnan, “Negotiation-based protocolsfor disseminating information in wireless sensor networks,” Kluwer WirelessNetworks, vol. 8, no. 2, pp. 169–185, May 2002.
[89] S. Kumar, V. S. Raghavan, and J. Deng, “Medium access control protocols forad hoc wireless networks: a survey,” Ad Hoc Networks, vol. 4, pp. 326–358,2006.
[90] P. Kumarawadu, D. Dechene, M. Luccini, and A. Sauer, “Algorithms for nodeclustering in wireless sensor networks: A survey,” in Proc. 4th Int’l Conf. onInformation and Automation for Sustainability (ICIAFS), Dec. 2008, pp. 295–300.
[91] M. Kuorilehto, M. Kohvakka, J. Suhonen, P. Hämäläinen, M. Hännikäinen,and T. D. Hämäläinen, Ultra-Low Energy Wireless Sensor Networks in Prac-tice - Theory, Realization and Deployment. John Wiley & Sons Ltd, 2007.
[92] M. Kuorilehto, “System level design issues in low-power wireless sensor net-works,” PhD Dissertation, Tampere University of Technology, Jun. 2008.
[93] S. Kuryla and J. Schönwälder, “Evaluation of the resource requirements ofSNMP agents on constrained devices,” in Managing the Dynamics of Networksand Services, ser. Lecture Notes in Computer Science, I. Chrisment, A. Couch,R. Badonnel, and M. Waldburger, Eds. Springer Berlin / Heidelberg, 2011,vol. 6734, pp. 100–111.
[94] W. Li, J.-B. Wei, and S. Wang, “An evolutionary-dynamic TDMA slot assign-ment protocol for ad hoc networks,” in Wireless Communications and Net-working Conference (WCNC), Mar., 11–15 2007, pp. 138–142.

98 BIBLIOGRAPHY
[95] Y. Li, W. Ye, and J. Heidemann, “Energy and latency control in low dutycycle MAC protocols,” in IEEE Wireless Communications and NetworkingConference, vol. 2, Mar., 13–17 2005, pp. 676–682.
[96] W. Liang, X. Zhang, Y. Xiao, F. Wang, P. Zeng, and H. Yu, “Survey and ex-periments of WIA-PA specification of industrial wireless network,” WirelessCommunications and Mobile Computing, 2010.
[97] Waspmote - Datasheet, Available: http://www.libelium.com/waspmote, Li-belium Comunicaciones Distribuidas S.L., 2011, document version: v1.4 -10/2011.
[98] Lijuan Cao, T. Dahlberg, and Yu Wang, “Performance evaluation of energyefficient ad hoc routing protocols,” IEEE Int’l Performance, Computing, andCommunications Conference (IPCCC), pp. 306–313, Apr., 11–13 2007.
[99] P. Lin, C. Qiao, and X. Wang, “Medium access control with a dynamic dutycycle for sensor networks,” in Proc. Wireless Communications and NetworkingConference (WCNC), vol. 3, Mar., 21–25 2004, pp. 1534–153.
[100] J. Liu, F. Zhao, and D. Petrovic, “Information-directed routing in ad hoc sensornetworks,” IEEE Journal on Selected Areas in Communications, vol. 23, no. 4,pp. 851–861, Apr. 2005.
[101] K. Liu, M. Li, Y. Liu, M. Li, Z. Guo, and F. Hong, “Passive diagnosis for wire-less sensor networks,” in Proc. of the 6th ACM Conf. on Embedded NetworkSensor Systems (SenSys), 2008, pp. 113–126.
[102] Z. Liu and I. Elhanany, “RL-MAC: A QoS-aware reinforcement learning basedMAC protocol for wireless sensor networks,” in IEEE Int’l Conf. on Network-ing, Sensing and Control (ICNSC), Apr., 23-25 2006, pp. 768–773.
[103] K. Lorincz, D. J. Malan, T. R. Fulford-Jones, A. Nawoj, A. Clavel, V. Shnay-der, G. Mainland, M. Welsh, and S. Moulton, “Sensor networks for emergencyresponse: Challenges and opportunities,” IEEE Pervasive Computing, vol. 3,no. 4, pp. 16–23, Oct./Dec. 2004.
[104] C. Lu, B. Blum, T. Abdelzaher, J. Stankovic, and T. He, “RAP: A real-timecommunication architecture for large-scale wireless sensor networks,” in Real-Time and Embedded Technology and Applications Symposium, 2002, pp. 55–66.

BIBLIOGRAPHY 99
[105] G. Lu, B. Krishnamachari, and C. S. Raghavendra, “An adaptive energy-efficient and low-latency MAC for data gathering in wireless sensor networks,”in Proc. Parallel and Distributed Processing Symposium, Apr., 26–30 2004,pp. 224–231.
[106] D. McCoy, D. Sicker, and D. Grunwald, “A mechanism for detecting and re-sponding to misbehaving nodes in wireless networks,” in 4th IEEE Commu-nications Society Conf. on Sensor, Mesh and Ad Hoc Communications andNetworks (SECON’07), Jun. 18–21, 2007, pp. 678–684.
[107] T. Melodia, M. C. Vuran, and D. Pompili, “The state of the art in cross-layerdesign for wireless sensor networks,” in Proc. of EuroNGI Workshops on Wire-less and Mobility, Springer Lecture Notes on Computer Science, LNCS 388,2005.
[108] IRIS Wireless Measurement System, MEMSIC Inc., document: 6020-0124-02Rev A.
[109] MICAz Wireless Measurement System, MEMSIC Inc., document: 6020-0065-05 Rev A.
[110] TELOSB Mote Platform, MEMSIC Inc., document: 6020-0094-04 Rev B.
[111] Mote Processor Radio & Mote Interface Boards User, MEMSIC Inc., 2010,document: 7430-0021-09 Rev A Manual.
[112] A. Mihovska, F. Platbrood, G. Karetsos, S. Kyriazakos, R. Muijen,R. Guarneri, and J. M. Pereira, “Towards the wireless 2010 vision: A tech-nology roadmap,” Wirel. Pers. Commun., vol. 42, no. 3, pp. 303–336, 2007.
[113] S. Misra, M. Reisslein, and G. Xue, “A survey of multimedia streaming inwireless sensor networks,” IEEE Communications Surveys Tutorials, vol. 10,no. 4, pp. 18–39, 2008.
[114] S. Nethi, C. Gao, and R. J. adn Mikael Pohjola, “Localized multiple next-hop routing protocol (lmnr),” in Int’l Conf. on Telecommunications (ITST ’07),Jun., 6-8 2007, p. 5.
[115] G. T. Nguyen and B. Noble, “A traceubased approach for modeling wirelesschannel behavior,” in Proc. Winter Simulation Conf., Dec. 1996, pp. 597–604.

100 BIBLIOGRAPHY
[116] K. Nguyen, T. Nguyen, C. K. Chaing, and M. Motani, “A prioritized MACprotocol for multihop, event-driven wireless sensor networks,” in First Int’lConf. on Communications and Electronics, Oct. 2006, pp. 47–52.
[117] K. Nichols, S. Blake, F. Baker, and D. Black, “Definition of the differentiatedservices field (DS field) in the IPv4 and IPv6 headers,” RFC 2474, Dec. 1998.
[118] D. Niculescu, “Communication paradigms for sensor networks,” IEEE Com-munications Magazine, vol. 43, no. 3, pp. 116–122, Mar. 2005.
[119] D. Niculescu and B. Nath, “Trajectory based forwarding and its applications,”in Proc. 9th annual Int’l Conf. on Mobile computing and networking (Mobi-Com’03), San Diego, CA, USA, Sep., 14–19 2003, pp. 260–272.
[120] J. Nieminen, B. Patil, T. Savolainen, M. Isomaki, Z. Shelby, and C. Gomez,“Transmission of IPv6 packets over bluetooth low energy,” IETF Internet-Draft draft-ietf-6lowpan-btle-06, Mar. 2012.
[121] J. P. Norair, “Introduction to DASH7 technologies,” DASH7 TechnologyWorking Group, Tech. Rep., Mar. 2009.
[122] Nordic Semiconductor, “Single chip 2.4 GHz transceiver nrf24l01 - prod-uct specification,” Available: http://www.nordicsemi.com/eng/Products/2.4GHz-RF/nRF24L01, Sep. 2006, revision: 1.0.
[123] ——, “Single chip 433/868/915 MHz transceiver nRF905 - product specifica-tion,” Available: http://www.nordicsemi.com/eng/Products/Sub-1-GHz-RF/nRF905, Jun. 2006, revision: 1.4.
[124] “An introduction to RuBee technology,” Oracle & Visible AssetsInc., 2010. [Online]. Available: http://www.rubee.com/Partners/Oracle/RuBeeWhitePaper-v3.pdf
[125] I. Papapanagiotou, D. Toumpakaris, J. Lee, and M. Devetsikiotis, “A survey onnext generation mobile WiMAX networks: Objectives, features and technicalchallenges,” IEEE Communications Surveys & Tutorials, vol. 11, no. 4, pp.3–18, 2009.
[126] S.-J. Park, R. Sivakumar, I. Akyildiz, and R. Vedantham, “GARUDA: Achiev-ing effective reliability for downstream communication in wireless sensor net-works,” IEEE Transactions on Mobile Computing, vol. 7, no. 2, pp. 214–230,Feb. 2008.

BIBLIOGRAPHY 101
[127] J. L. Paul, “Smart sensor web: Tactical battlefield visualization using sensorfusion,” IEEE Aerospace and Electronic Systems Magazine, vol. 21, no. 1, pp.13–20, Jan. 2006.
[128] Z. Pei, Z. Deng, B. Yang, and X. Cheng, “Application-oriented wireless sen-sor network communication protocols and hardware platforms: A survey,” inIEEE Int’l Conf. on Industrial Technology (ICIT), Apr. 2008, pp. 1–6.
[129] ——, “Application-oriented wireless sensor network communication proto-cols and hardware platforms: A survey,” in IEEE Int’l Conf. on IndustrialTechnology (ICIT), Apr. 2008, pp. 1–6.
[130] C. Perkins, E. Belding-Royer, and S. Das, “Ad hoc on-demand distance vector(AODV) routing,” RFC 3561, Jul. 2003.
[131] J. Polastre, J. Hill, and D. Culler, “Versatile low power media access for wire-less sensor networks,” in Proc. of the 2nd Int’l Conf. on Embedded NetworkedSensor Systems (SenSys), 2004, pp. 95–107.
[132] J. Postel, “Internet protocol,” RFC 2474, Sep. 1981.
[133] D. Qiang, X. Dong-liang, and C. Shan-zhi, “A fuzzy logic based QoS evalua-tion model for wireless sensor network,” in 5th Int’l Conf. on Wireless Com-munications, Networking and Mobile Computing (WiCom), Sep., 24–26 2009,pp. 1–4.
[134] V. Raghunathan, S. Ganeriwal, and M. Srivastava, “Emerging techniquesfor long lived wireless sensor networks,” IEEE Communications Magazine,vol. 44, no. 4, pp. 108–114, Apr. 2006.
[135] A. Rahman, A. E. Saddik, and W. Gueaieb, “Wireless sensor network transportlayer: State of the art,” in Sensors, S. C. Mukhopadhyay and R. Y.-M. Huang,Eds. Springer-Verlag Berlin Heidelberg, 2008.
[136] V. Rajendran, K. Obraczka, and J. J. Garcia-Luna-Aceves, “Energy-efficient,collision-free medium access control for wireless sensor networks,” WirelessNetworks, vol. 12, no. 1, pp. 63–78, 2006.
[137] H. Rangarajan and J. Garcia-Luna-Aceves, “Reliable data delivery in event-driven wireless sensor networks,” in Proc. of Ninth Int’l Symposium on Com-puters and Communications (ISCC), 2004, pp. 232–237.
[138] Shimmer User Manual, Realtime technologies Ltd., 2011, revision 2R.d.

102 BIBLIOGRAPHY
[139] I. Rhee, A. Warrier, M. Aia, J. Min, and M. Sichitiu, “Z-MAC: A hybridMAC for wireless sensor networks,” IEEE/ACM Transactions on Networking,vol. 16, no. 3, pp. 511–524, Jun. 2008.
[140] I. Rhee, A. Warrier, J. Min, and L. Zu, “DRAND: Distributed randomizedTDMA scheduling for wireless ad-hoc networks,” in Proc. of ACM Int’l Sym-posium on Mobile Ad Hoc Networking and Computing (MobiHoc), May, 22–25 2006, pp. 190–201.
[141] M. Ringwald and K. Romer, “Deployment of sensor networks: Problems andpassive inspection,” in Proc. Fifth Workshop on Intelligent Solutions in Em-bedded Systems, Jun. 2007, pp. 179–192.
[142] M. Ringwald, K. Römer, and A. Vitaletti, “Passive inspection of sensor net-works,” in Distributed Computing in Sensor Systems, ser. Lecture Notes inComputer Science, J. Aspnes, C. Scheideler, A. Arora, and S. Madden, Eds.Springer Berlin / Heidelberg, 2007, vol. 4549, pp. 205–222.
[143] J. Rintanen, J. Suhonen, M. Hännikäinen, and T. D. Hämäläinen, “Applicationserver for wireless sensor networks,” in Proc. of the 8th Int’l Workshop onSystems, Architectures, Modeling, and Simulation (SAMOS VIII), Jul., 21–242008, pp. 248–257.
[144] K. Römer, O. Kasten, and F. Mattern, “Middleware challenges for wirelesssensor networks,” ACM SIGMOBILE Mobile Computing and CommunicationsReview, vol. 6, no. 4, pp. 59–61, Oct. 2002.
[145] K. Römer and F. Mattern, “The design space of wireless sensor networks,”IEEE Wireless Communications, vol. 11, no. 6, pp. 54–61, Dec. 2004.
[146] E. Rosen, A. Viswanathan, and R. Callon, “Multiprotocol label switching ar-chitecture,” RFC 3031, Jan. 2001.
[147] E. M. Royer and Chai-Keong, “A review of current routing protocols for adhoc mobile wireless networks,” IEEE Personal Communications, vol. 6, no. 2,pp. 46–55, Aug. 1999.
[148] L. B. Ruiz, T. R. M. Braga, F. A. Silva, H. P. Assuncao, J. M. S. Nogueira, andA. A. F. Loureiro, “On the design of a self-managed wireless sensor network,”IEEE Communications Magazine, vol. 43, no. 8, pp. 95–102, Jul. 2005.

BIBLIOGRAPHY 103
[149] L. B. Ruiz, I. G. Siqueira, L. B. e Oliveira, H. C. Wong, J. M. S. Nogueira,and A. A. F. Loureiro, “Fault management in event-driven wireless sensor net-works,” in 7th ACM Int’l Symposium on Modeling, Analysis and Simulation ofWireless and Mobile Systems (MSWiM’04), 2004, pp. 149–156.
[150] B. Sabata, S. Chatterjee, M. Davis, J. J. Sydir, and T. F. Lawrence, “Taxonomyfor qos specifications,” in Third Int’l Workshop on Object-Oriented Real-TimeDependable Systems, Feb. 1997, pp. 100 –107.
[151] N. Sadagopan, B. Krishnamachari, and A. Helmy, “The ACQUIRE mecha-nism for efficient querying in sensor networks,” in IEEE Int’l Workshop onSensor Network Protocols and Applications, May 2003, pp. 149–155.
[152] Y. Sankarasubramaniam, Özgür B. Akan, and I. F. Akyildiz, “ESRT: Event-to-sink reliable transport in wireless sensor networks,” in Proc. of the 4th ACMInt’l Symposium on Mobile Ad Hoc Networking & Computing (MobiHoc), An-napolis, Maryland, Jun. 2003, pp. 177–188.
[153] D. Schneider, “Wireless networking dashes in a new direction,” IEEE Spec-trum, vol. 47, no. 2, pp. 9–10, Feb. 2010.
[154] J. Schoenwaelder, H. Mukhtar, S. Joo, and K. Kim, “SNMP optimizationsfor constrained devices,” IETF Internet-Draft: draft-hamid-6lowpan-snmp-optimizations-03, Oct. 2010.
[155] C. Schurgers and M. B. Srivastava, “Energy efficient routing in wireless sensornetworks,” in Military Communications Conference (MILCOM), Oct. 2001,pp. 357–361.
[156] C. Schurgers, V. Tsiatsis, S. Ganeriwal, and M. Srivastava, “Optimizing sensornetworks in the energy-latency-density design space,” IEEE Transactions onMobile Computing, vol. 1, no. 1, pp. 70–80, 2002.
[157] K. Seada, M. Zuniga, A. Helmy, and B. Krishnamachari, “Energy-efficient for-warding strategies for geographic routing in lossy wireless sensor networks,”in Proc. of the 2nd Int’l Conf. on Embedded Networked Sensor Systems (Sen-Sys), Nov., 3–5 2004, pp. 108–121.
[158] P. Sereiko and P. Fuhr, “The integration of ISA100 and Wireless HART,”Pipeline & Gas Journal, vol. 235, no. 2, 2008.

104 BIBLIOGRAPHY
[159] R. C. Shah and J. M. Rabaey, “Energy aware routing for low energy ad hocsensor networks,” in Wireless Communications and Networking Conference(WCNC), Mar. 2002, pp. 350–355.
[160] Y. Shavitt and A. Shay, “Optimal routing in gossip networks,” IEEE Transac-tions on Vehicular Technology, vol. 54, no. 4, pp. 1473–1487, 2005.
[161] Z. Shelby, K. Hartke, and C. Bormann, “Constrained application protocol(CoAP),” IETF Internet-Draft: draft-ietf-core-coap-09, Mar. 2012.
[162] S. Shenker, C. Partridge, and R. Guerin, “Specification of guaranteed qualityof service,” RFC 2212, Sep. 1997.
[163] J. Shin, U. Ramachandran, and M. Ammar, “On improving the reliability ofpacket delivery in dense wireless sensor networks,” in Proc. of 16th Int’l Conf.on Computer Communications and Networks (ICCCN), Aug., 13–16 2007, pp.718–723.
[164] R. Sivakumar, P. Sinha, and V. Bharghavan, “CEDAR: A core-extraction dis-tributed ad hoc routing algorithm,” IEEE Selected Areas in Communications,vol. 17, no. 8, pp. 1454–1465, Aug. 1999.
[165] D. Snoonian, “Smart buildings,” IEEE Spectrum, vol. 40, no. 8, pp. 18 – 23,Aug. 2003.
[166] K. Sohrabi, J. Gao, V. Ailawadhi, and G. J. Pottie, “Protocols for self-organization of a wireless sensor network,” IEEE Personal Communications,vol. 7, no. 5, pp. 16–27, Oct. 2000.
[167] L. Song and D. Hatzinakos, “A cross-layer architecture of wireless sensor net-works for target tracking,” IEEE/ACM Transactions on Networking, vol. 17,no. 1, pp. 145–158, Feb. 2007.
[168] W. Stallings, Operating Systems Internals and Design Principles, 5th ed.Prentice-Hall, 2005.
[169] I. Stojmenovic, Handbook of Sensor Networks Algorithms and Architectures.John Wiley & Sons Ltd, 2005.
[170] J. Suhonen, M. Kohvakka, M. Hännikäinen, and T. D. Hämäläinen, “Design,implementation, and experiments on outdoor deployment of wireless sensor

BIBLIOGRAPHY 105
network for environmental monitoring,” in Proc. Embedded Computer Sys-tems: Architectures, Modeling, and Simulation (SAMOS VI) - Special Sessionon Wireless Sensor Networks, Jul., 17–20 2006, pp. 109–121.
[171] J. Suhonen, M. Kohvakka, V. Kaseva, T. D. Hämäläinen, and M. Hännikäi-nen, “Low-power wireless sensor network platforms,” in Handbook on SignalProcessing Systems. Springer Verlag, 2010, pp. 123–160.
[172] J.-Z. Sun, “QoS compromise in data gathering for WSN,” in 6th Annual Int’lMobile and Ubiquitous Systems: Networking Services (MobiQuitous), Jul.,13–16 2009, pp. 1–2.
[173] ——, “QoS parameterization algorithm in data collection for wireless sensornetworks,” in Proc. of the 5th ACM Symposium on QoS and security for wire-less and mobile network (Q2SWinet), 2009, pp. 57–64.
[174] L. Sun, Y. Sun, J. Shu, and Q. He, “MotePlat: A monitoring and control plat-form for wireless sensor networks,” in Grid and Cooperative Computing Work-shops (GCCW’06), Oct. 2006, pp. 452–458.
[175] Y. Sun, S. Du, O. Gurewitz, and D. B. Johnson, “DW-MAC: A low latency,energy efficient demand-wakeup MAC protocol for wireless sensor networks,”in Proc. of the Ninth ACM Int’l Symposium on Mobile Ad Hoc Networking andComputing (MobiHoc), May 2008, p. 53U62.
[176] Y. Sun, O. Gurewitz, and D. B. Johnson, “RI-MAC: A receiver-initiated asyn-chronous duty cycle MAC protocol for dynamic traffic loads in wireless sensornetworks,” in Proc. of the 6th ACM Conf. on Embedded network sensor sys-tems, 2008, pp. 1–14.
[177] R. Szewczyk, E. Osterweil, J. Polastre, M. Hamilton, A. Mainwaring, andD. Estrin, “Habitat monitoring with sensor networks,” Communications of theACM, vol. 47, no. 6, pp. 34–40, Jun. 2004.
[178] A. S. Tanenbaum, Computer Networks, 4th ed. Prentice Hall, 2003.
[179] E. Tanghe, W. Joseph, L. Verloock, L. Martens, H. Capoen, K. V. Herwegen,and W. Vantomme, “The industrial indoor channel: Large-scale and temporalfading at 900, 2400, and 5200 MHz,” IEEE Transactions on Wireless Commu-nications, vol. 7, no. 7, pp. 2740–2751, Jul. 2008.
[180] Texas Instruments Inc., “CC2420 2.4 GHz IEEE 802.15.4 / ZigBee-ready RFtransceiver,” Available: http://www.ti.com/lit/gpn/cc2420, 2007.

106 BIBLIOGRAPHY
[181] N. Tezcan and W. Wang, “Art: An asymmetric and reliable transportmechanism for wireless sensor networks,” Int. J. Sen. Netw., vol. 2, pp.188–200, Apr. 2007. [Online]. Available: http://dl.acm.org/citation.cfm?id=1359004.1359009
[182] ONE-NET Specification, Threshold Corporation, 2009, version 1.5.0.
[183] Tian He, J. A. Stankovic, C. Lu, and T. Abdelzaher, “SPEED: A statelessprotocol for real-time communication in sensor networks,” in Proc. 23rd Int’lConf. on Distributed Computing Systems, Providence, RI, USA, May, 19–222003, pp. 46–55.
[184] F. A. Tobagi, “Analysis of a two-hop centralized packet radio network–part ii:Carrier sense multiple access,” IEEE Transaction on Communications, vol. 28,no. 2, pp. 208–216, Feb. 1980.
[185] F. A. Tobagi and L. Kleinrock, “Packet switching in radio channels: Part ii–the hidden terminal problem in carrier sense multiple-access and the busy-tonesolution,” IEEE Transactions on Communications, vol. 23, no. 12, pp. 1417–1433, Dec. 1975.
[186] C.-K. Toh, “Maximum battery life routing to support ubiquitous mobile com-puting in wireless ad hoc networks,” IEEE Communications Magazine, vol. 39,no. 6, pp. 138–147, Jun. 2001.
[187] T. van Dam and K. Langendoen, “An adaptive energy-efficient MAC protocolfor wireless sensor networks,” in Proc. of the 1st Int’l Conf. on EmbeddedNetworked Sensor Systems (SenSys), 2003, pp. 171–180.
[188] J. Vasseur, M. Kim, K. Pister, N. Dejean, and D. Barthel, “Routing metricsused for path calculation in low-power and lossy networks,” IETF RFC 6551,Mar. 2012.
[189] R. Vidhyapriya and P. Vanathi, “Conserving energy in wireless sensor net-works,” IEEE Potentials, vol. 26, no. 5, pp. 37–42, Sep./Oct. 2007.
[190] M. Wachs, J. I. Choi, J. W. Lee, K. Srinivasan, Z. Chen, M. Jain, and P. Levis,“Visibility: a new metric for protocol design,” in Proc. of the 5th Int’l Conf.on Embedded Networked Sensor Systems (SenSys), 2007, pp. 73–86.
[191] C.-Y. Wan, A. T. Campbell, and L. Krishnamurthy, “Pump-slowly, fetch-quickly (PSFQ): A reliable transport protocol for sensor networks,” IEEE

BIBLIOGRAPHY 107
Journal on Selected Areas in Communications, vol. 23, no. 4, pp. 862–872,Apr. 2005.
[192] C. Wang, K. Sohraby, B. Li, M. Daneshmand, and Y. Hu, “A survey of trans-port protocols for wireless sensor networks,” IEEE Network, vol. 20, no. 3, pp.34–40, 2006.
[193] Y. Wang, X. Liu, and J. Yin, “Requirements of quality of service in wirelesssensor networks,” in Proc. of the Int’l Conf. on Networking, Systems, and Mo-bile Communications and Learning Technologies (ICNICONSMCL), 2006, pp.1–5.
[194] Z. Wang and J. Crowcroft, “Quality-of-service routing supporting multimediaapplications,” IEEE J. Sel. Areas Commun., vol. 14, no. 7, pp. 1228–1234,Sep. 1996.
[195] D. Wei and H. A. Chan, “Clustering ad hoc networks: Schemes and classifi-cations,” in 3rd Annual IEEE Communications Society on Sensor and Ad HocCommunications and Networks (SECON), vol. 3, Sep. 2006, pp. 920–926.
[196] T. Winter, P. Thubert, A. Brandt, J. Hui, R. Kelsey, P. Levis, K. Pister,R. Struik, J. Vasseur, and R. Alexander, “RPL: IPv6 routing protocol for low-power and lossy networks,” IETF RFC 6550, Mar. 2012.
[197] G. Xue, A. Sen, W. Zhang, J. Tang, and K. Thulasiraman, “Finding a pathsubject to many additive QoS constraints,” IEEE/ACM Trans. Netw., vol. 15,no. 1, pp. 201–211, 2007.
[198] J. Yang, M. L. Soffa, L. Selavo, and K. Whitehouse, “Clairvoyant: A compre-hensive source-level debugger for wireless sensor networks,” in Proc. of the5th Int’l Conf. on Embedded Networked Sensor Systems (SenSys), 2007, pp.189–203.
[199] Y. Yang, P. Xia, L. Huang, Q. Zhou, Y. Xu, and X. Li, “Snamp: A multi-sniffer and multi-view visualization platform for wireless sensor networks,” inIndustrial Electronics and Applications, 2006 1ST IEEE Conference on, May2006, pp. 1–4.
[200] Yang Liu, I. Elhanany, and Hairong Qi, “An energy-efficient QoS-aware mediaaccess control protocol for wireless sensor networks,” in Proc. Mobile Adhocand Sensor Systems Conf., Washington D.C., USA, November 2005, p. 3.

108 BIBLIOGRAPHY
[201] F. Ye, A. Chen, S. Lu, and L. Zhang, “A scalable solution to minimum costforwarding in large sensor networks,” in 10th Int’l Conf. on Computer Com-munications and Networks, Oct. 2001, pp. 304–309.
[202] F. Ye, G. Zhong, S. Lu, and L. Zhang, “GRAdient broadcast: a robust datadelivery protocol for large scale sensor networks,” Kluwer Wireless Networks,vol. 11, no. 3, pp. 285–298, May 2005.
[203] W. Ye, J. Heidemann, and D. Estrin, “An energy-efficient MAC protocol forwireless sensor networks,” in Proc. IEEE INFOCOM, vol. 3, 2002, pp. 1567–1576.
[204] ——, “Medium access control with coordinated adaptive sleeping for wirelesssensor networks,” IEEE/ACM Transactions on Networking, vol. 12, no. 3, pp.493–506, Jun. 2004.
[205] W. Ye, F. Silva, and J. Heidemann, “Ultra-low duty cycle MAC with sched-uled channel polling,” in Proc. of the 4th Int’l Conf. on Embedded NetworkedSensor Systems (SenSys). New York, NY, USA: ACM, 2006, pp. 321–334.
[206] M. Younis, K. Akkaya, M. Eltoweissy, and A. Wadaa, “On handling QoS traf-fic in wireless sensor networks,” in Proceedings of the 37th Hawaii Int’l Con-ference on System Sciences, 2004, pp. 1–10.
[207] M. Yu, H. Mokhtar, and M. Merabti, “Fault management in wireless sensornetworks,” IEEE Wireless Communications, vol. 14, no. 6, pp. 13–19, Dec.2007.
[208] M. Yu, J. Song, J. Kim, K.-Y. Shin, and P. S. Mah, “NanoMon: A flexiblesensor network monitoring software,” in 9th Int’l Conference on AdvancedCommunication Technology, vol. 2, Feb. 12–14, 2007, pp. 1423–1426.
[209] D. Yuan, X. Liu, X. Zhang, and H. Cho, “CEERP: Cost-based energy-efficientrouting protocol in wireless sensor networks,” in IEEE Asia Pacific Conf. onCircuits and Systems (APCCAS), Nov. 2008, pp. 1041 –1045.
[210] Z-Wave Protocol Overview, Zensys A/S, 2007, Doc. No. SDS10243-4.[Online]. Available: http://www.zen-sys.com/
[211] H. Zhai, Z. Chen, and Y. Fang, “How well can the IEEE 802.11 wireless LANsupport quality of service,” IEEE Transactions on Wireless Communications,vol. 4, pp. 3084–3094, Nov. 2005.

BIBLIOGRAPHY 109
[212] B. Zhang and H. T. Mouftah, “Energy-aware on-demand routing protocols forwireless ad hoc networks,” Wireless Networks, vol. 12, no. 4, pp. 481–494,2006.
[213] Q. Zhang and Y.-Q. Zhang, “Cross-layer design for qos support in multihopwireless networks,” Proceedings of the IEEE, vol. 96, no. 1, pp. 64–76, Jan.2008.
[214] T. Zhong, C. Mengjin, Z. Peng, and W. Hong, “Real-time communication inWIA-PA industrial wireless networks,” in Computer Science and InformationTechnology (ICCSIT), 2010 3rd IEEE International Conference on, vol. 2, Jul.2010, pp. 600–605.
[215] ZigBee Specification, ZigBee Standards Organization, Jan. 2008, ZigBee Doc-ument 053474r17.
[216] Network Device: Gateway Specification, ZigBee Standards Organization, Mar.2011, ZigBee Document 075468r35.
[217] F. A. Zohra and R. R. Selmic, “Fault aware wireless sensor networks,” in Int’lConf. on Networking, Sensing and Control, Apr. 15–17, 2007, pp. 30–35.
[218] M. Zorzi, A. Gluhak, S. Lange, and A. Bassi, “From todayŠs intranet of thingsto a future internet of things: A wireless- and mobility-related view,” IEEEWireless Communications, pp. 44–51, Dec. 2010.
[219] B. P. . E. Zurich, “BTnode rev3 hardware reference,” Available: http://www.btnode.ethz.ch/Documentation/BTnodeRev3HardwareReference, 2007,visited: May 04, 2012.
