desired target return
TRANSCRIPT
Desired Target Return®An Upside Potential/Downside Risk Framework
A Desired Target Return® Briefing
Optimal Blending of Active and Passive Investments

Table of Contents
DESIRED TARGET RETURN® OVERVIEW...................................................................................................3Modern Portfolio Theory (MPT) Meets Post Modern Portfolio Theory (PMPT)
Five Fundamental Investment Beliefs
DESIRED TARGET RETURN® PORTFOLIO CONSTRUCTION METHODOLOGY ....................9
THE DTR® CALCULATION ................................................................................................................................10Identifying the DTR® Calculation
Risk/Return Assessment and Measurements
Upside Potential
Downside Risk Deviation
DTR®-Alpha
SURZ STYLE PURE® INDICES.......................................................................................................................12Better Built Indices/Better Built Portfolios
Mutually Exclusive, Exhaustive, Investable and Macro Consistent
Significance of Centric— Segment Between Value and Growth— “Blend” Definition Difference
BOOTSTRAPPING TECHNIQUE ...................................................................................................................14Manager Statistical Data
Data Interpretation
DESIRED TARGET RETURN® SCREENING PROCEDURES ............................................................16
DESIRED TARGET RETURN® PORTFOLIO CONSTRUCTION INTEGRATION .......................18
SUMMARY ..............................................................................................................................................................21
GLOSSARY ...............................................................................................................................................................22
DISCLAIMER ..........................................................................................................................................................27
PAGE 2
• D
TR®
PAGE 3
• D
TR®
D E S I R E D T A R G E T R E T U R N ®
Overview
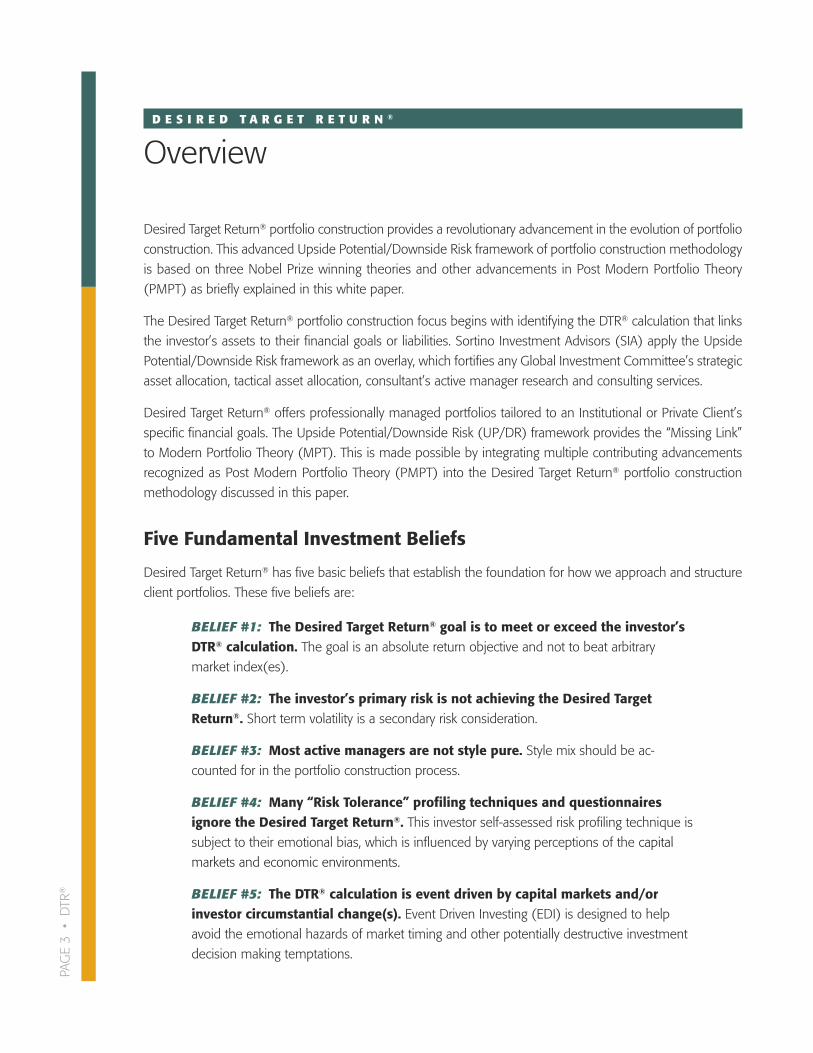
Desired Target Return® portfolio construction provides a revolutionary advancement in the evolution of portfolio
construction. This advanced Upside Potential/Downside Risk framework of portfolio construction methodology
is based on three Nobel Prize winning theories and other advancements in Post Modern Portfolio Theory
(PMPT) as briefly explained in this white paper.
The Desired Target Return® portfolio construction focus begins with identifying the DTR® calculation that links
the investor’s assets to their financial goals or liabilities. Sortino Investment Advisors (SIA) apply the Upside
Potential/Downside Risk framework as an overlay, which fortifies any Global Investment Committee’s strategic
asset allocation, tactical asset allocation, consultant’s active manager research and consulting services.
Desired Target Return® offers professionally managed portfolios tailored to an Institutional or Private Client’s
specific financial goals. The Upside Potential/Downside Risk (UP/DR) framework provides the “Missing Link”
to Modern Portfolio Theory (MPT). This is made possible by integrating multiple contributing advancements
recognized as Post Modern Portfolio Theory (PMPT) into the Desired Target Return® portfolio construction
methodology discussed in this paper.
Five Fundamental Investment Beliefs
Desired Target Return® has five basic beliefs that establish the foundation for how we approach and structure
client portfolios. These five beliefs are:
BELIEF #1: The Desired Target Return® goal is to meet or exceed the investor’sDTR® calculation. The goal is an absolute return objective and not to beat arbitrary market index(es).
BELIEF #2: The investor’s primary risk is not achieving the Desired Target Return®. Short term volatility is a secondary risk consideration.
BELIEF #3: Most active managers are not style pure. Style mix should be ac-
counted for in the portfolio construction process.
BELIEF #4: Many “Risk Tolerance” profiling techniques and questionnaires ignore the Desired Target Return®. This investor self-assessed risk profiling technique issubject to their emotional bias, which is influenced by varying perceptions of the capital
markets and economic environments.
BELIEF #5: The DTR® calculation is event driven by capital markets and/or investor circumstantial change(s). Event Driven Investing (EDI) is designed to help
avoid the emotional hazards of market timing and other potentially destructive investment
decision making temptations.
PAGE 4
• D
TR®
Ove
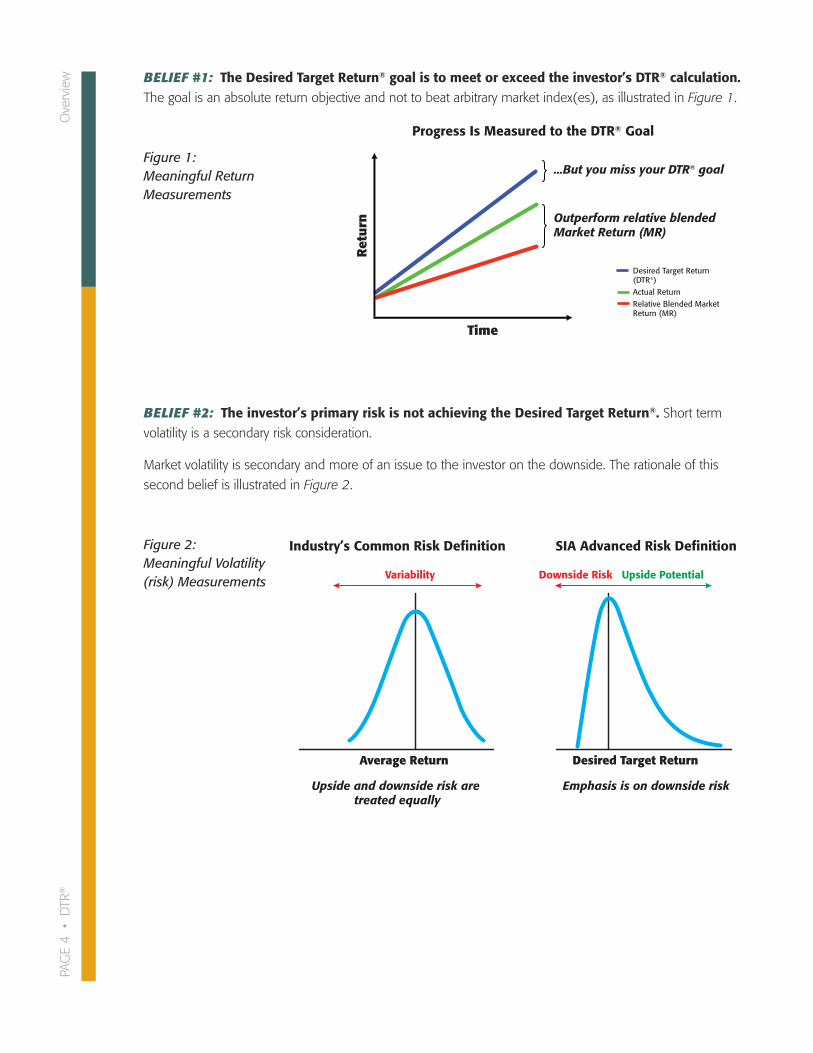
rview BELIEF #1: The Desired Target Return® goal is to meet or exceed the investor’s DTR® calculation.
The goal is an absolute return objective and not to beat arbitrary market index(es), as illustrated in Figure 1.
Figure 1: Meaningful Return Measurements
BELIEF #2: The investor’s primary risk is not achieving the Desired Target Return®. Short termvolatility is a secondary risk consideration.
Market volatility is secondary and more of an issue to the investor on the downside. The rationale of this
second belief is illustrated in Figure 2.
Figure 2: Meaningful Volatility(risk) Measurements
...But you miss your DTR® goal
Desired Target Return(DTR®)Actual ReturnRelative Blended Market Return (MR)
Ret
urn
Time
Outperform relative blended Market Return (MR)
Progress Is Measured to the DTR® Goal
Average Return Desired Target Return
Upside and downside risk are treated equally
Emphasis is on downside risk
Industry’s Common Risk Definition
P
Variability
Downside Risk Upside Potential
SIA Advanced Risk Definition
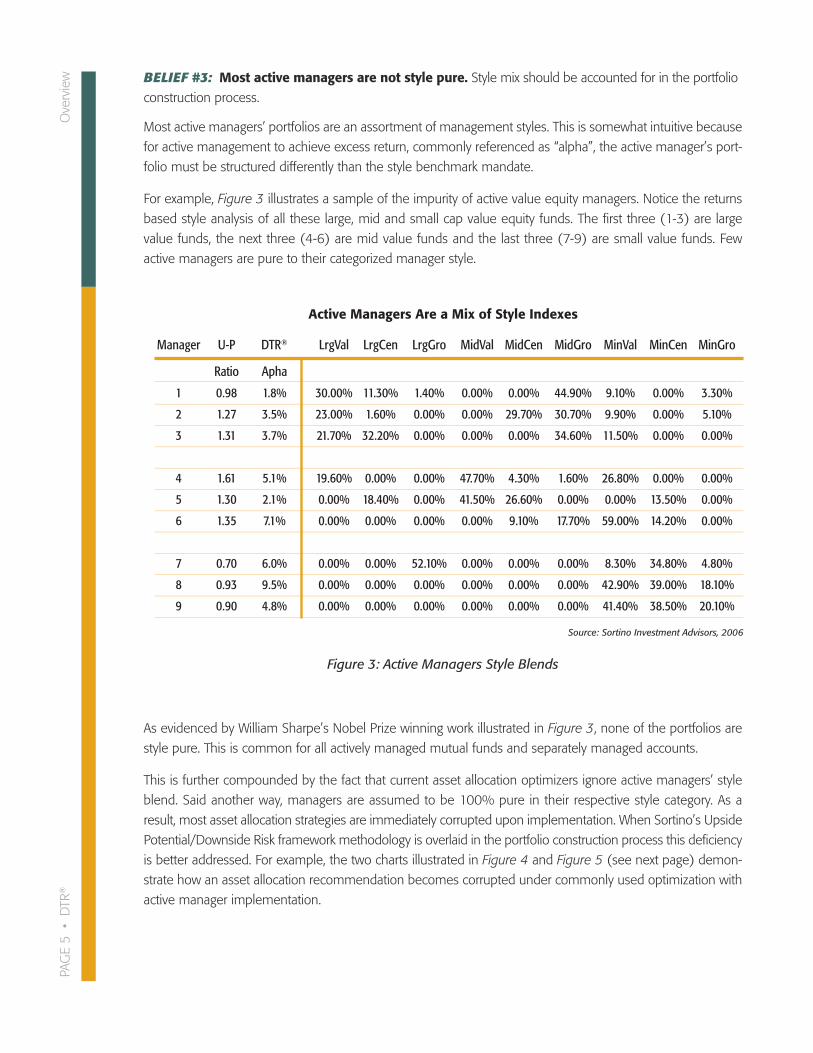
BELIEF #3: Most active managers are not style pure. Style mix should be accounted for in the portfolio
construction process.
Most active managers’ portfolios are an assortment of management styles. This is somewhat intuitive because
for active management to achieve excess return, commonly referenced as “alpha”, the active manager’s port-
folio must be structured differently than the style benchmark mandate.
For example, Figure 3 illustrates a sample of the impurity of active value equity managers. Notice the returns
based style analysis of all these large, mid and small cap value equity funds. The first three (1-3) are large
value funds, the next three (4-6) are mid value funds and the last three (7-9) are small value funds. Few
active managers are pure to their categorized manager style.
Figure 3: Active Managers Style Blends
As evidenced by William Sharpe’s Nobel Prize winning work illustrated in Figure 3, none of the portfolios are
style pure. This is common for all actively managed mutual funds and separately managed accounts.
This is further compounded by the fact that current asset allocation optimizers ignore active managers’ style
blend. Said another way, managers are assumed to be 100% pure in their respective style category. As a
result, most asset allocation strategies are immediately corrupted upon implementation. When Sortino’s Upside
Potential/Downside Risk framework methodology is overlaid in the portfolio construction process this deficiency
is better addressed. For example, the two charts illustrated in Figure 4 and Figure 5 (see next page) demon-
strate how an asset allocation recommendation becomes corrupted under commonly used optimization with
active manager implementation.
PAGE 5
• D
TR®
Ove
rview
Active Managers Are a Mix of Style Indexes
Manager U-P DTR® LrgVal LrgCen LrgGro MidVal MidCen MidGro MinVal MinCen MinGro
Ratio Apha
1 0.98 1.8% 30.00% 11.30% 1.40% 0.00% 0.00% 44.90% 9.10% 0.00% 3.30%
2 1.27 3.5% 23.00% 1.60% 0.00% 0.00% 29.70% 30.70% 9.90% 0.00% 5.10%
3 1.31 3.7% 21.70% 32.20% 0.00% 0.00% 0.00% 34.60% 11.50% 0.00% 0.00%
4 1.61 5.1% 19.60% 0.00% 0.00% 47.70% 4.30% 1.60% 26.80% 0.00% 0.00%
5 1.30 2.1% 0.00% 18.40% 0.00% 41.50% 26.60% 0.00% 0.00% 13.50% 0.00%
6 1.35 7.1% 0.00% 0.00% 0.00% 0.00% 9.10% 17.70% 59.00% 14.20% 0.00%
7 0.70 6.0% 0.00% 0.00% 52.10% 0.00% 0.00% 0.00% 8.30% 34.80% 4.80%
8 0.93 9.5% 0.00% 0.00% 0.00% 0.00% 0.00% 0.00% 42.90% 39.00% 18.10%
9 0.90 4.8% 0.00% 0.00% 0.00% 0.00% 0.00% 0.00% 41.40% 38.50% 20.10%
Source: Sortino Investment Advisors, 2006
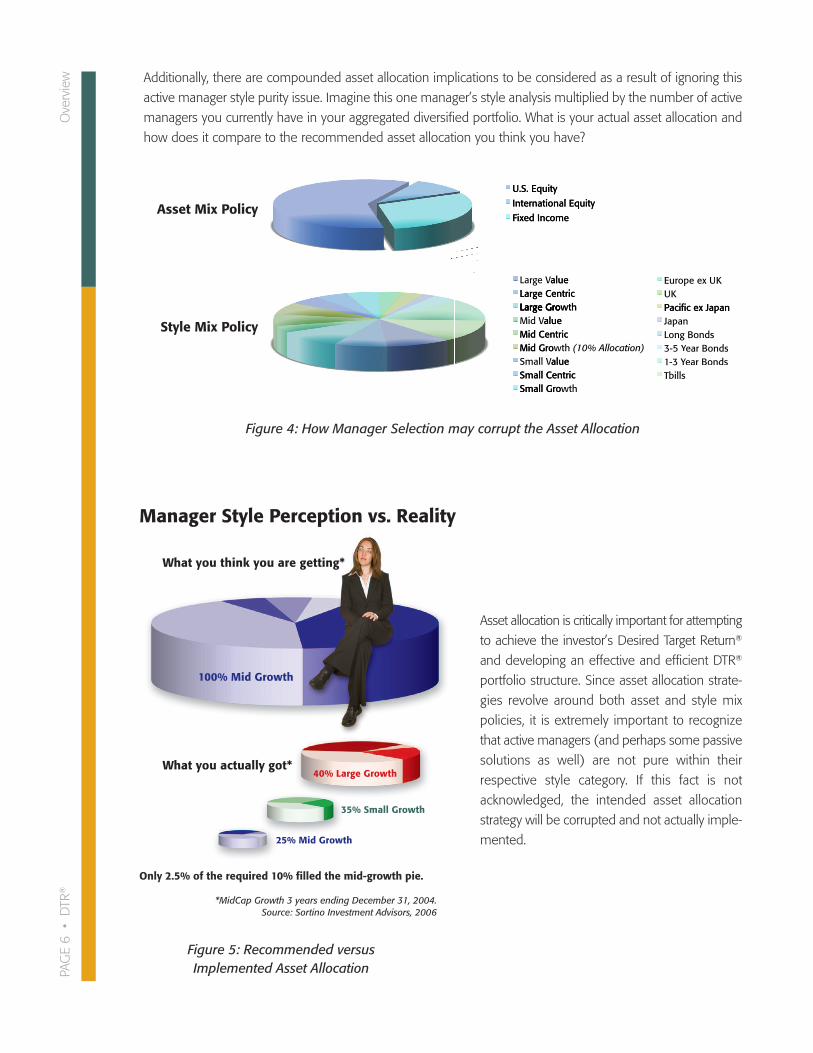
Additionally, there are compounded asset allocation implications to be considered as a result of ignoring this
active manager style purity issue. Imagine this one manager’s style analysis multiplied by the number of active
managers you currently have in your aggregated diversified portfolio. What is your actual asset allocation and
how does it compare to the recommended asset allocation you think you have?
Figure 4: How Manager Selection may corrupt the Asset Allocation
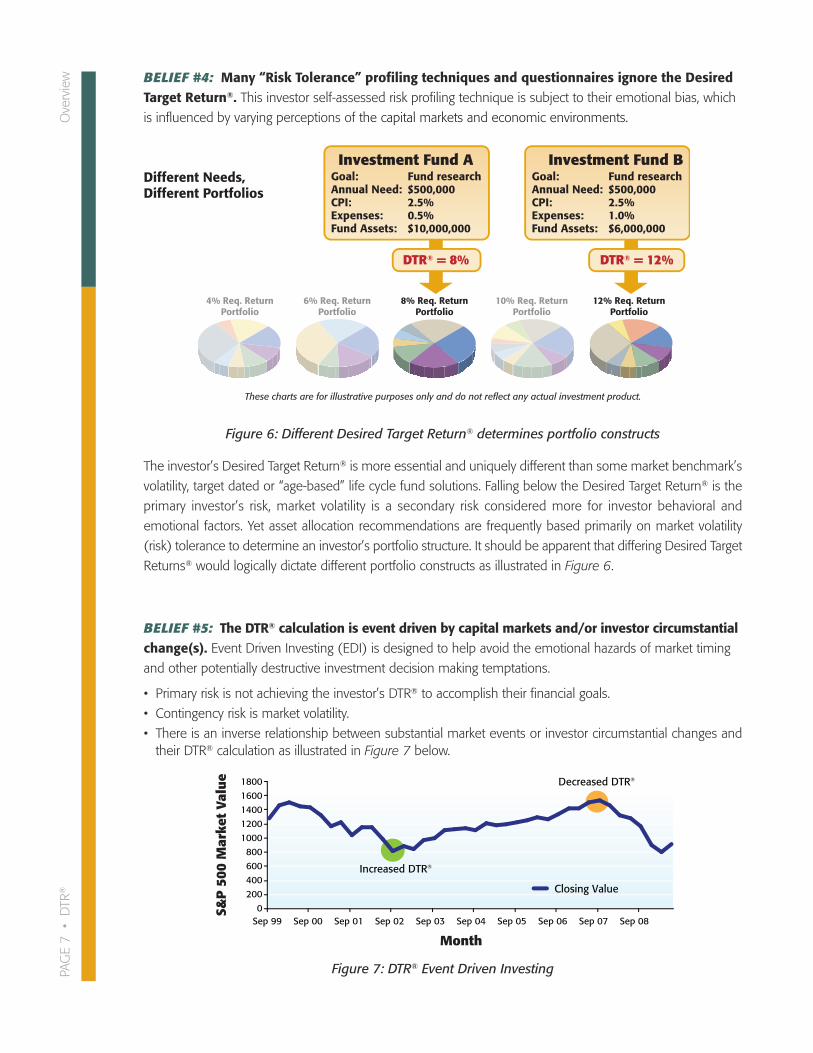
Asset allocation is critically important for attempting
to achieve the investor’s Desired Target Return®
and developing an effective and efficient DTR®
portfolio structure. Since asset allocation strate-
gies revolve around both asset and style mix
policies, it is extremely important to recognize
that active managers (and perhaps some passive
solutions as well) are not pure within their
respective style category. If this fact is not
acknowledged, the intended asset allocation
strategy will be corrupted and not actually imple-
mented.
PAGE 6
• D
TR®
Ove
rview
100% Mid Growth
What you think you are getting*
What you actually got*
25% Mid Growth
35% Small Growth
40% Large Growth
Only 2.5% of the required 10% filled the mid-growth pie.
*MidCap Growth 3 years ending December 31, 2004. Source: Sortino Investment Advisors, 2006
Figure 5: Recommended versus Implemented Asset Allocation
Manager Style Perception vs. Reality
alue VLarge Large CentricLarge Gro
alue Large Centric
th wLarge Gro
K UEurope ex K Uacific ex Japan PLarge Gro
alue VMid Mid CentricMid Gro
alue VSmall Small CentricSmall Gro
th wLarge Groalue
Mid Centric(10% Allocation)th wMid Gro
alue Small Centric
th wSmall Gro
acific ex Japan PJapan Long Bonds
ear Bonds Ye 3-5 ear Bonds YYear Bonds -3 1
bills T
U.S. Equity
International Equity
Fixed Income
U.S. Equity
International Equity
Fixed Income
Asset Mix Policy
Style Mix Policy
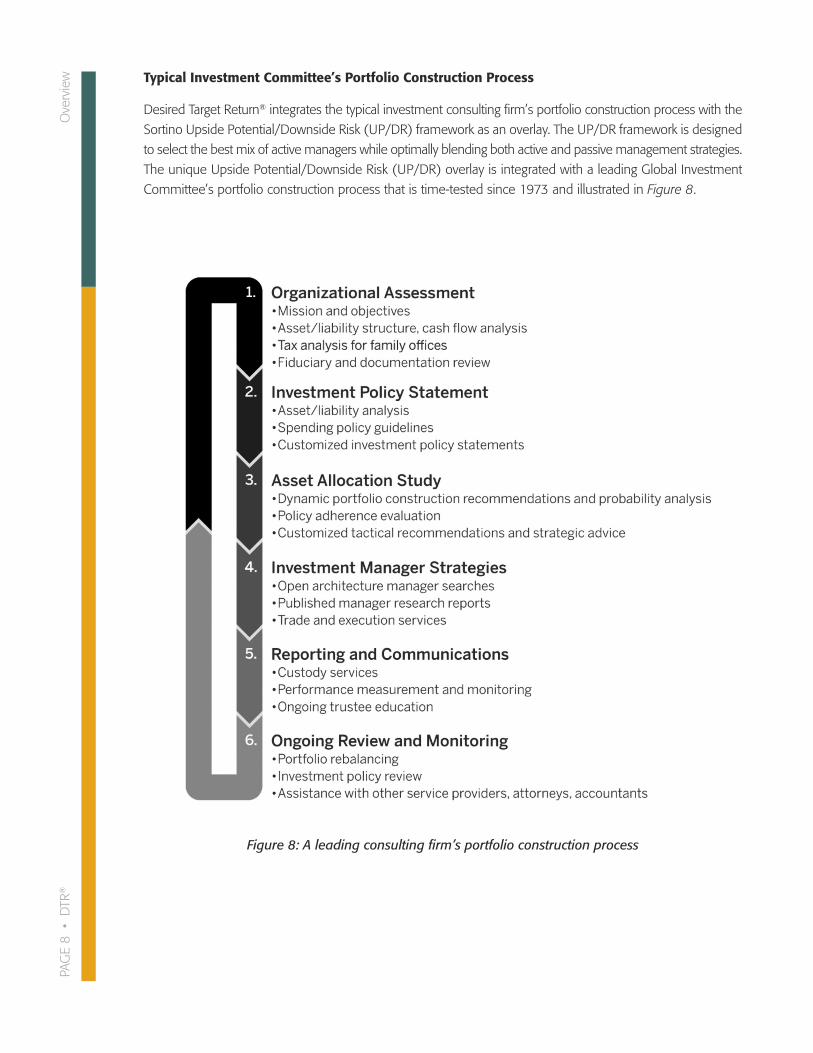
BELIEF #4: Many “Risk Tolerance” profiling techniques and questionnaires ignore the DesiredTarget Return®. This investor self-assessed risk profiling technique is subject to their emotional bias, which
is influenced by varying perceptions of the capital markets and economic environments.
The investor’s Desired Target Return® is more essential and uniquely different than some market benchmark’s
volatility, target dated or “age-based” life cycle fund solutions. Falling below the Desired Target Return® is the
primary investor’s risk, market volatility is a secondary risk considered more for investor behavioral and
emotional factors. Yet asset allocation recommendations are frequently based primarily on market volatility
(risk) tolerance to determine an investor’s portfolio structure. It should be apparent that differing Desired Target
Returns® would logically dictate different portfolio constructs as illustrated in Figure 6.
BELIEF #5: The DTR® calculation is event driven by capital markets and/or investor circumstantialchange(s). Event Driven Investing (EDI) is designed to help avoid the emotional hazards of market timing
and other potentially destructive investment decision making temptations.
• Primary risk is not achieving the investor’s DTR® to accomplish their financial goals.
• Contingency risk is market volatility.
• There is an inverse relationship between substantial market events or investor circumstantial changes andtheir DTR® calculation as illustrated in Figure 7 below.
PAGE 7
• D
TR®
Ove
rview
Goal: Fund researchAnnual Need: $500,000CPI: 2.5%Expenses: 1.0%Fund Assets: $6,000,000
Investment Fund B
DTR® = 12%
Goal: Fund researchAnnual Need: $500,000CPI: 2.5%Expenses: 0.5%Fund Assets: $10,000,000
4% Req. ReturnPortfolio
6% Req. ReturnPortfolio
8% Req. ReturnPortfolio
10% Req. ReturnPortfolio
12% Req. ReturnPortfolio
Investment Fund A
DTR® = 8%
These charts are for illustrative purposes only and do not reflect any actual investment product.
Figure 6: Different Desired Target Return® determines portfolio constructs
Decreased DTR®
Month
S&P
500
Mar
ket
Valu
e
Increased DTR®
Sep 990
200400600800
10001200140016001800
Sep 00 Sep 01 Sep 02 Sep 03 Sep 04 Sep 05 Sep 06 Sep 07 Sep 08
Closing Value
Figure 7: DTR® Event Driven Investing
Different Needs, Different Portfolios
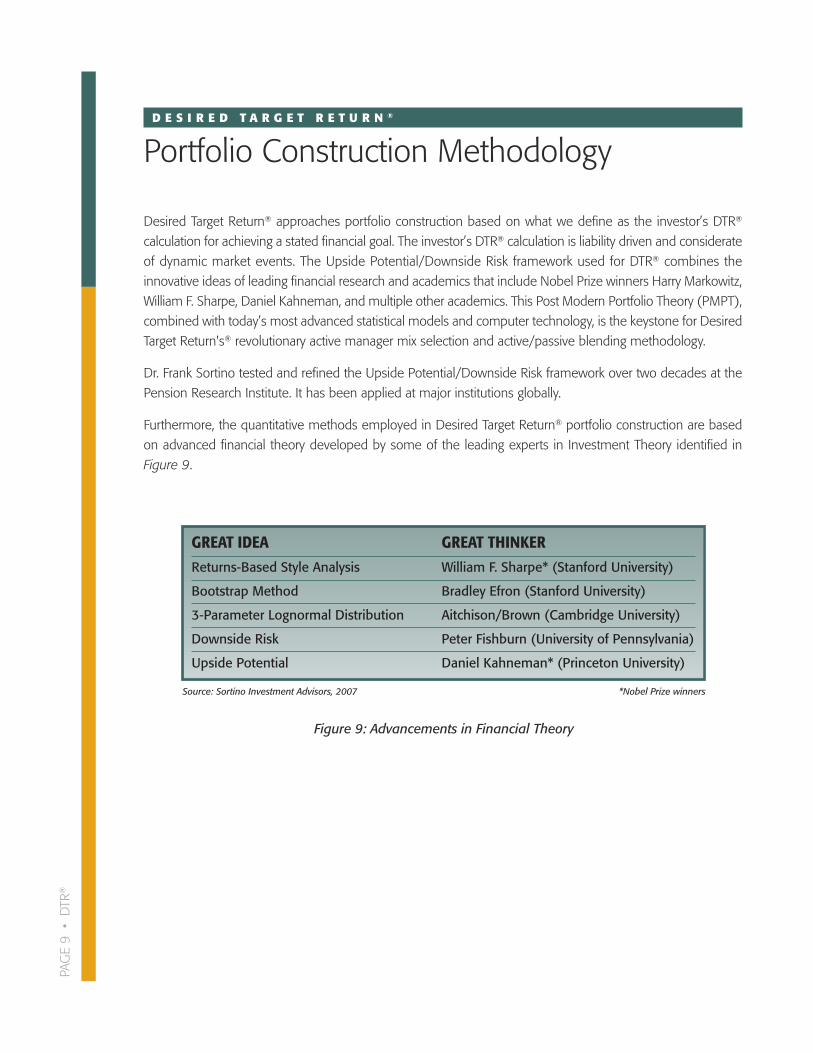
Typical Investment Committee’s Portfolio Construction Process
Desired Target Return® integrates the typical investment consulting firm’s portfolio construction process with the
Sortino Upside Potential/Downside Risk (UP/DR) framework as an overlay. The UP/DR framework is designed
to select the best mix of active managers while optimally blending both active and passive management strategies.
The unique Upside Potential/Downside Risk (UP/DR) overlay is integrated with a leading Global Investment
Committee’s portfolio construction process that is time-tested since 1973 and illustrated in Figure 8.
PAGE 8
• D
TR®
Ove
rview
Figure 8: A leading consulting firm’s portfolio construction process
D E S I R E D T A R G E T R E T U R N ®
Portfolio Construction Methodology
Desired Target Return® approaches portfolio construction based on what we define as the investor’s DTR®
calculation for achieving a stated financial goal. The investor’s DTR® calculation is liability driven and considerate
of dynamic market events. The Upside Potential/Downside Risk framework used for DTR® combines the
innovative ideas of leading financial research and academics that include Nobel Prize winners Harry Markowitz,
William F. Sharpe, Daniel Kahneman, and multiple other academics. This Post Modern Portfolio Theory (PMPT),
combined with today’s most advanced statistical models and computer technology, is the keystone for Desired
Target Return's® revolutionary active manager mix selection and active/passive blending methodology.
Dr. Frank Sortino tested and refined the Upside Potential/Downside Risk framework over two decades at the
Pension Research Institute. It has been applied at major institutions globally.
Furthermore, the quantitative methods employed in Desired Target Return® portfolio construction are based
on advanced financial theory developed by some of the leading experts in Investment Theory identified in
Figure 9.
PAGE 9
• D
TR®
GREAT IDEA GREAT THINKERReturns-Based Style Analysis William F. Sharpe* (Stanford University)
Bootstrap Method Bradley Efron (Stanford University)
3-Parameter Lognormal Distribution Aitchison/Brown (Cambridge University)
Downside Risk Peter Fishburn (University of Pennsylvania)
Upside Potential Daniel Kahneman* (Princeton University)
Source: Sortino Investment Advisors, 2007 *Nobel Prize winners
Figure 9: Advancements in Financial Theory
D E S I R E D T A R G E T R E T U R N ®
The DTR® Calculation
Identifying the DTR® Calculation
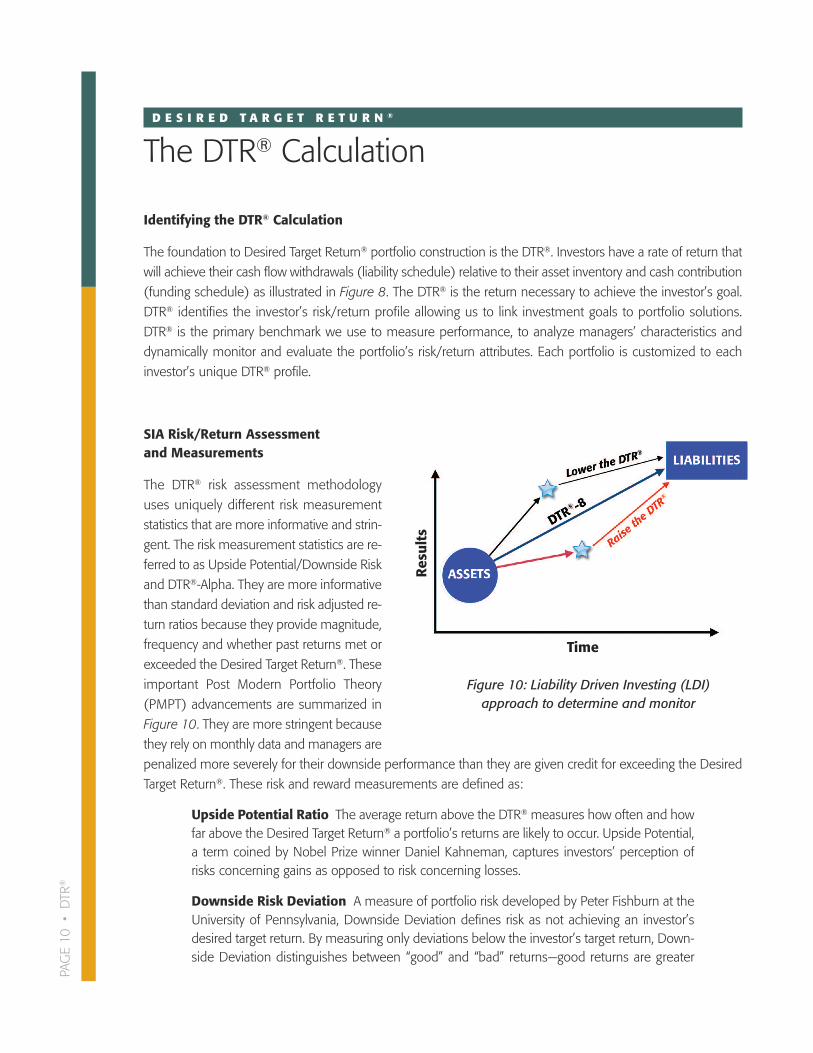
The foundation to Desired Target Return® portfolio construction is the DTR®. Investors have a rate of return that
will achieve their cash flow withdrawals (liability schedule) relative to their asset inventory and cash contribution
(funding schedule) as illustrated in Figure 8. The DTR® is the return necessary to achieve the investor’s goal.
DTR® identifies the investor’s risk/return profile allowing us to link investment goals to portfolio solutions.
DTR® is the primary benchmark we use to measure performance, to analyze managers’ characteristics and
dynamically monitor and evaluate the portfolio’s risk/return attributes. Each portfolio is customized to each
investor’s unique DTR® profile.
SIA Risk/Return Assessment and Measurements
The DTR® risk assessment methodology
uses uniquely different risk measurement
statistics that are more informative and strin-
gent. The risk measurement statistics are re-
ferred to as Upside Potential/Downside Risk
and DTR®-Alpha. They are more informative
than standard deviation and risk adjusted re-
turn ratios because they provide magnitude,
frequency and whether past returns met or
exceeded the Desired Target Return®. These
important Post Modern Portfolio Theory
(PMPT) advancements are summarized in
Figure 10. They are more stringent because
they rely on monthly data and managers are
penalized more severely for their downside performance than they are given credit for exceeding the Desired
Target Return®. These risk and reward measurements are defined as:
Upside Potential Ratio The average return above the DTR® measures how often and howfar above the Desired Target Return® a portfolio’s returns are likely to occur. Upside Potential,a term coined by Nobel Prize winner Daniel Kahneman, captures investors’ perception ofrisks concerning gains as opposed to risk concerning losses.
Downside Risk Deviation A measure of portfolio risk developed by Peter Fishburn at theUniversity of Pennsylvania, Downside Deviation defines risk as not achieving an investor’sdesired target return. By measuring only deviations below the investor’s target return, Down-side Deviation distinguishes between “good” and “bad” returns—good returns are greater
PAGE 10
• D
TR®
Time
Results
Figure 10: Liability Driven Investing (LDI) approach to determine and monitor
than the target return, and bad returns are below the target return. Only the latter representsrisk. In addition, the more returns fall below the target return, the greater the risk.
DTR®-Alpha A risk-adjusted return measuring the value added by a manager over andabove performance that could have been achieved with its “style benchmark”. A stylebenchmark, versus market index, is a blended benchmark that is representative of the actualstyle assortments in the active managers’ portfolio(s). This is accomplished using Sharpe’sstyle based analysis. The style-blended benchmarks serve as a more precise measurementfor identifying manager skill versus random luck. Sortino’s DTR®-Alpha is the differencebetween the manager’s style blended return and the manager’s customized style blendedbenchmarks return.
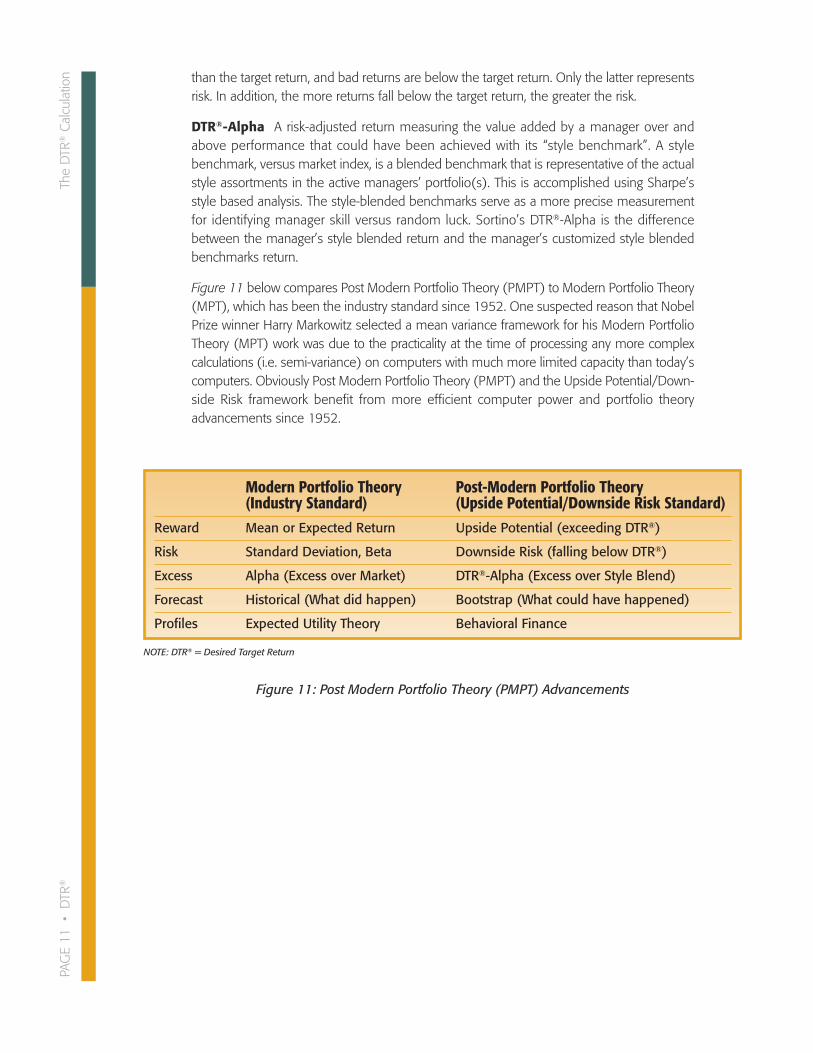
Figure 11 below compares Post Modern Portfolio Theory (PMPT) to Modern Portfolio Theory(MPT), which has been the industry standard since 1952. One suspected reason that NobelPrize winner Harry Markowitz selected a mean variance framework for his Modern PortfolioTheory (MPT) work was due to the practicality at the time of processing any more complexcalculations (i.e. semi-variance) on computers with much more limited capacity than today’scomputers. Obviously Post Modern Portfolio Theory (PMPT) and the Upside Potential/Down-side Risk framework benefit from more efficient computer power and portfolio theory advancements since 1952.
PAGE 11
• D
TR®
The DTR
®Calcu
latio
n
Modern Portfolio Theory Post-Modern Portfolio Theory(Industry Standard) (Upside Potential/Downside Risk Standard)
Reward Mean or Expected Return Upside Potential (exceeding DTR®)
Risk Standard Deviation, Beta Downside Risk (falling below DTR®)
Excess Alpha (Excess over Market) DTR®-Alpha (Excess over Style Blend)
Forecast Historical (What did happen) Bootstrap (What could have happened)
Profiles Expected Utility Theory Behavioral Finance
NOTE: DTR® = Desired Target Return
Figure 11: Post Modern Portfolio Theory (PMPT) Advancements
D E S I R E D T A R G E T R E T U R N ®
Surz Style Pure® Indices
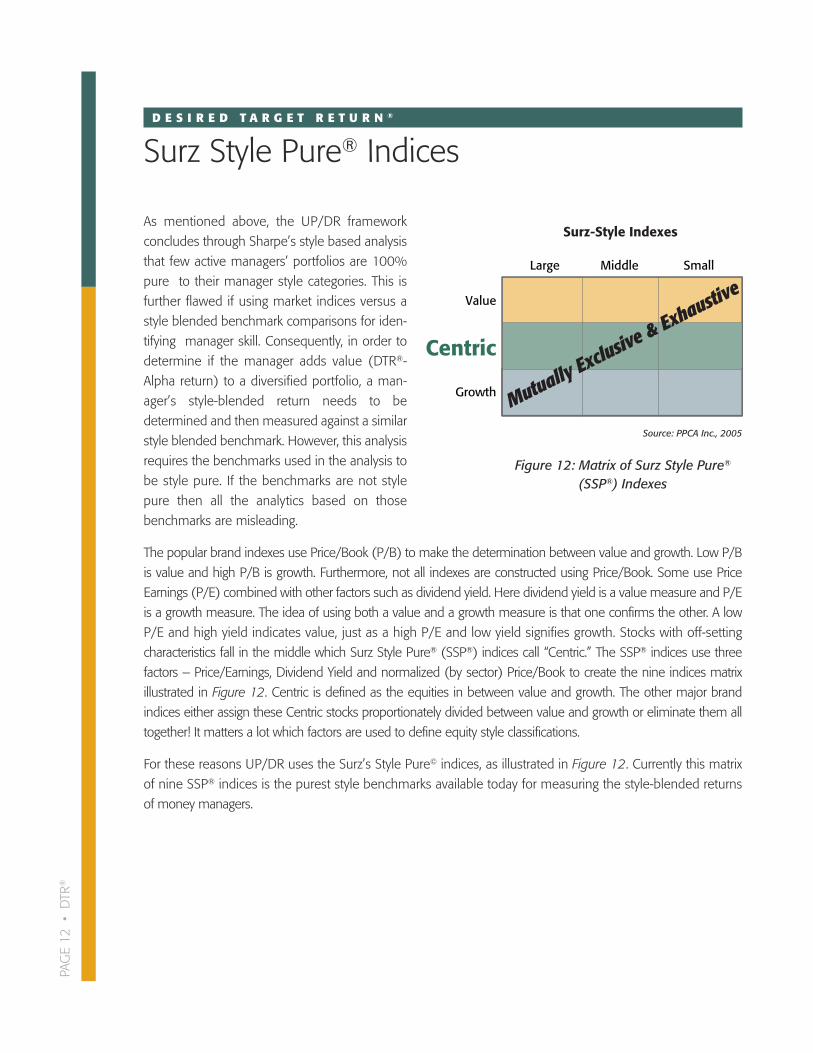
As mentioned above, the UP/DR framework
concludes through Sharpe’s style based analysis
that few active managers’ portfolios are 100%
pure to their manager style categories. This is
further flawed if using market indices versus a
style blended benchmark comparisons for iden-
tifying manager skill. Consequently, in order to
determine if the manager adds value (DTR®-
Alpha return) to a diversified portfolio, a man-
ager’s style-blended return needs to be
determined and then measured against a similar
style blended benchmark. However, this analysis
requires the benchmarks used in the analysis to
be style pure. If the benchmarks are not style
pure then all the analytics based on those
benchmarks are misleading.
The popular brand indexes use Price/Book (P/B) to make the determination between value and growth. Low P/B
is value and high P/B is growth. Furthermore, not all indexes are constructed using Price/Book. Some use Price
Earnings (P/E) combined with other factors such as dividend yield. Here dividend yield is a value measure and P/E
is a growth measure. The idea of using both a value and a growth measure is that one confirms the other. A low
P/E and high yield indicates value, just as a high P/E and low yield signifies growth. Stocks with off-setting
characteristics fall in the middle which Surz Style Pure® (SSP®) indices call “Centric.” The SSP® indices use three
factors – Price/Earnings, Dividend Yield and normalized (by sector) Price/Book to create the nine indices matrix
illustrated in Figure 12. Centric is defined as the equities in between value and growth. The other major brand
indices either assign these Centric stocks proportionately divided between value and growth or eliminate them all
together! It matters a lot which factors are used to define equity style classifications.
For these reasons UP/DR uses the Surz’s Style Pure© indices, as illustrated in Figure 12. Currently this matrix
of nine SSP® indices is the purest style benchmarks available today for measuring the style-blended returns
of money managers.
PAGE 12
• D
TR®
Value
Large Middle Small
Centric
Growth Mutually Exclusive & Exhaustive
Source: PPCA Inc., 2005
Figure 12: Matrix of Surz Style Pure®
(SSP®) Indexes
Surz-Style Indexes
UP/DR Risk/Return Assessment and Measurements
The strengths of the Surz Style Pure® indices (SSP®) for portfolio construction purposes are as follows:
1. The SSP® indices used as manager skill benchmarks offer enhanced manager attribution evaluation versus
market indexes.
2. SSP® indices utilization ensures better built portfolios under basic tenets of Modern Portfolio Theory (MPT).
SSP® indices have greater adherence, than other industry popular indices, to MPT’s important fundamental
tenets* of:
a.Mutually exclusive—no asset class should overlap with another
b.Exhaustive—all securities should fit in the set of asset classes
c. Investable—it should be possible to replicate the return of each asset class at relatively
low cost
d.Macro-consistent—the performance of the entire set should be replicable with some
combination of asset classes
*Dr. William F. Sharpe, “Determining a Fund’s Effective Asset Mix,“ Investment Management Review, December, 1988, pages 59-69.
Using the combination of all the above noted academics, Sortino’s Upside Potential/Downside Risk (UP/DR)
framework is a more thorough approach to analyzing a manager’s past performance and determining whether
a manager is skillful based not on an ill-defined market benchmark but on pure style-blended benchmarks
and considering the investor’s Desired Target Return®.
PAGE 13
• D
TR®
Surz Style Pure©
Indice
s
D E S I R E D T A R G E T R E T U R N ®
Bootstrapping Technique
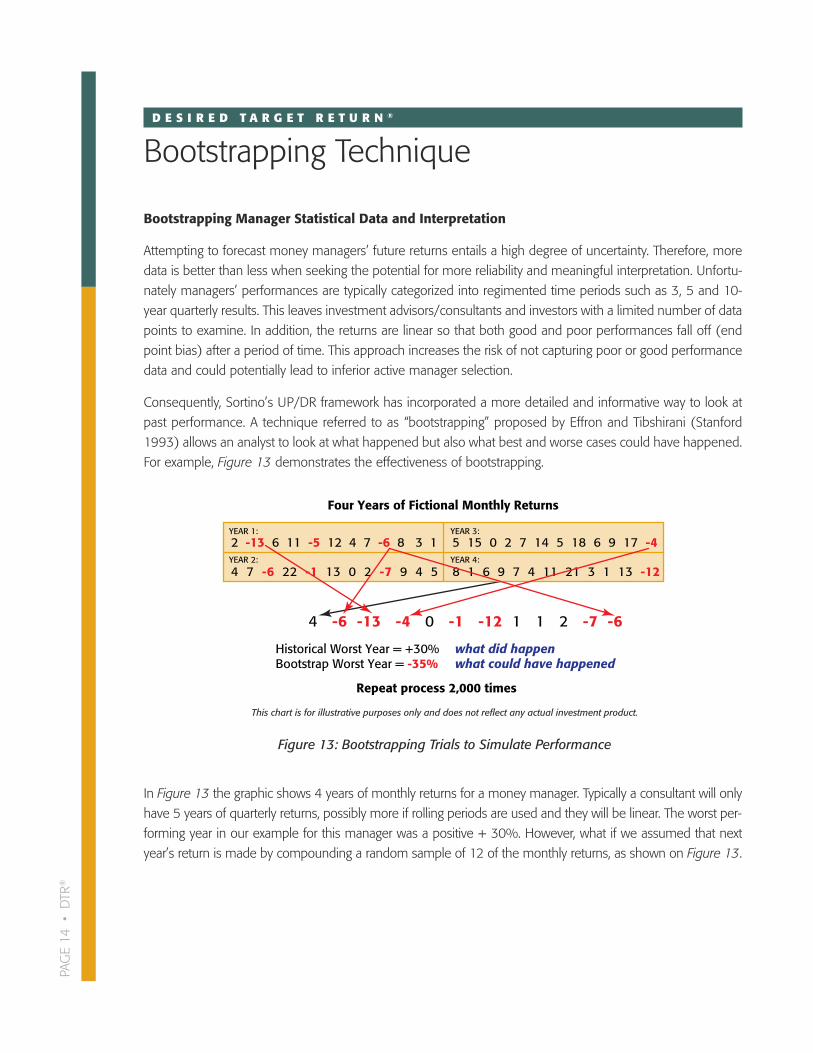
Bootstrapping Manager Statistical Data and Interpretation
Attempting to forecast money managers’ future returns entails a high degree of uncertainty. Therefore, more
data is better than less when seeking the potential for more reliability and meaningful interpretation. Unfortu-
nately managers’ performances are typically categorized into regimented time periods such as 3, 5 and 10-
year quarterly results. This leaves investment advisors/consultants and investors with a limited number of data
points to examine. In addition, the returns are linear so that both good and poor performances fall off (end
point bias) after a period of time. This approach increases the risk of not capturing poor or good performance
data and could potentially lead to inferior active manager selection.
Consequently, Sortino’s UP/DR framework has incorporated a more detailed and informative way to look at
past performance. A technique referred to as “bootstrapping” proposed by Effron and Tibshirani (Stanford
1993) allows an analyst to look at what happened but also what best and worse cases could have happened.
For example, Figure 13 demonstrates the effectiveness of bootstrapping.
In Figure 13 the graphic shows 4 years of monthly returns for a money manager. Typically a consultant will only
have 5 years of quarterly returns, possibly more if rolling periods are used and they will be linear. The worst per-
forming year in our example for this manager was a positive + 30%. However, what if we assumed that next
year’s return is made by compounding a random sample of 12 of the monthly returns, as shown on Figure 13.
PAGE 14
• D
TR®
2 -13 6 11 -5 12 4 7 -6 8 3 1YEAR 1:
YEAR 2:
YEAR 3:
YEAR 4:
4 7 -6 22 -1 13 0 2 -7 9 4 5
5 15 0 2 7 14 5 18 6 9 17 -4
8 1 6 9 7 4 11 21 3 1 13 -12
4 -6 -13 -4 0 -1 -12 1 1 2 -7 -6
what did happen what could have happened
Historical Worst Year = +30%Bootstrap Worst Year = -35%
Four Years of Fictional Monthly Returns
Repeat process 2,000 times
This chart is for illustrative purposes only and does not reflect any actual investment product.
Figure 13: Bootstrapping Trials to Simulate Performance

Our first random draw might be 4% selected from the sixth month of the fourth year. The first draw is replaced
and a second return is randomly selected, in this case negative 6%. Notice this same return is again selected
for the last month of one year that could have happened. We repeat this process with 2000 random trials and
we now have more data points than using the standard approach.
As the graph demonstrated, a negative 35% year is possible. This results in having more downside deviations
and upside potential data, and a measurement of the magnitude of such data as well, for attempting to
determine the Upside Potential Ratio and DTR®-Alpha Return of the money managers.
PAGE 15
• D
TR®
Bootstrapp
ing Te
chniqu
e
D E S I R E D T A R G E T R E T U R N ®
Desired Target Return® Screening Procedures
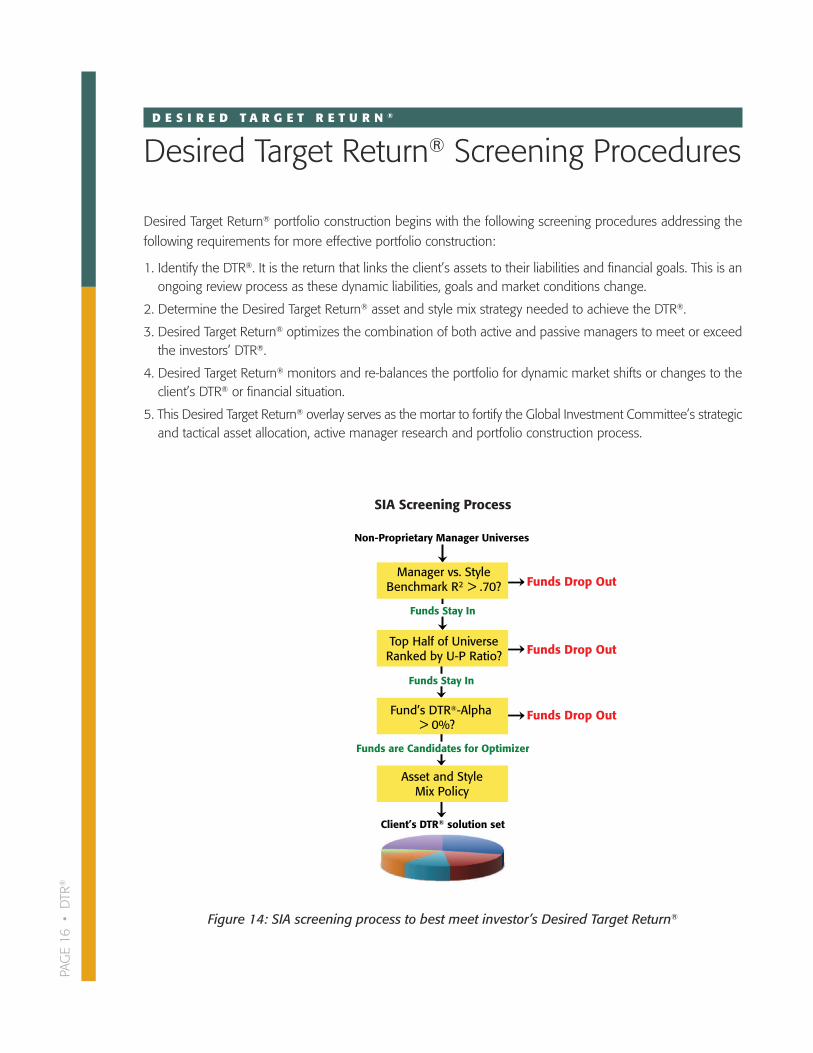
Desired Target Return® portfolio construction begins with the following screening procedures addressing the
following requirements for more effective portfolio construction:
1. Identify the DTR®. It is the return that links the client’s assets to their liabilities and financial goals. This is anongoing review process as these dynamic liabilities, goals and market conditions change.
2. Determine the Desired Target Return® asset and style mix strategy needed to achieve the DTR®.
3. Desired Target Return® optimizes the combination of both active and passive managers to meet or exceedthe investors’ DTR®.
4. Desired Target Return® monitors and re-balances the portfolio for dynamic market shifts or changes to theclient’s DTR® or financial situation.
5. This Desired Target Return® overlay serves as the mortar to fortify the Global Investment Committee’s strategicand tactical asset allocation, active manager research and portfolio construction process.
PAGE 16
• D
TR®
Top Half of Universe Ranked by U-P Ratio?
Non-Proprietary Manager Universes
Manager vs. Style Benchmark R2 > .70?
Funds Drop Out
Funds are Candidates for Optimizer
Funds Drop Out
Funds Drop Out
Funds Stay In
Fund’s DTR®-Alpha> 0%?
Funds Stay In
Asset and Style Mix Policy
Client’s DTR® solution set
Figure 14: SIA screening process to best meet investor’s Desired Target Return®
SIA Screening Process
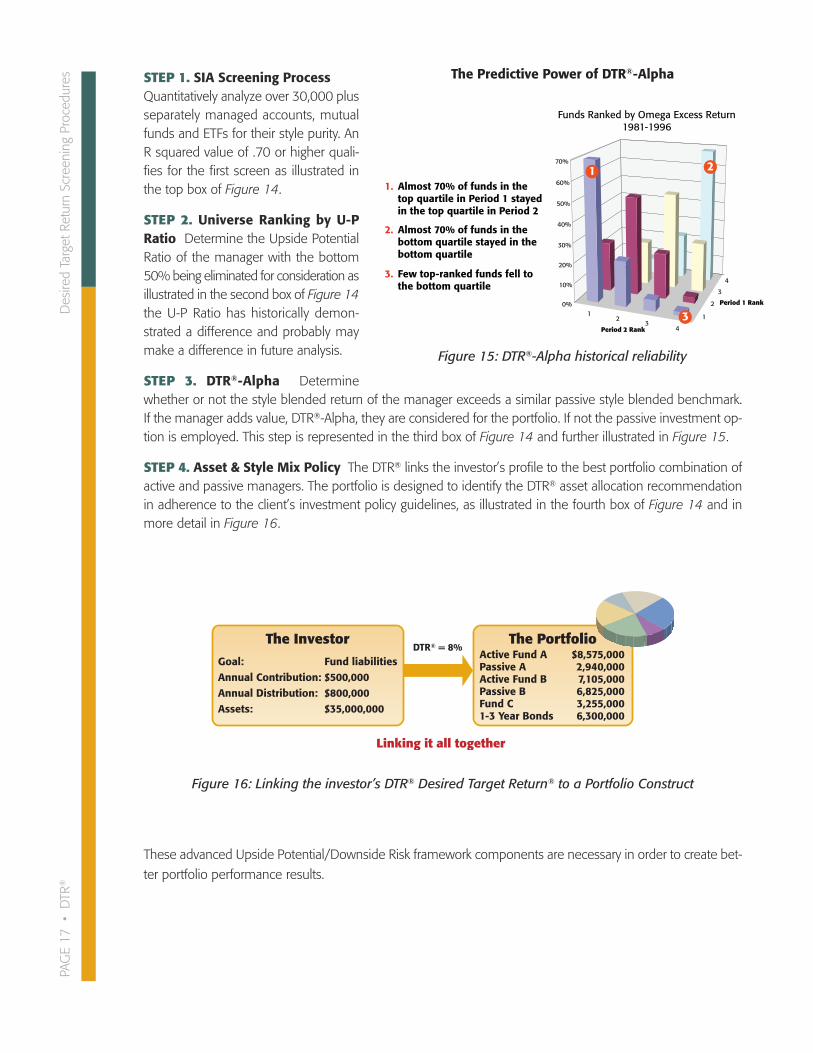
STEP 1. SIA Screening ProcessQuantitatively analyze over 30,000 plusseparately managed accounts, mutualfunds and ETFs for their style purity. AnR squared value of .70 or higher quali-fies for the first screen as illustrated inthe top box of Figure 14.
STEP 2. Universe Ranking by U-PRatio Determine the Upside PotentialRatio of the manager with the bottom50% being eliminated for consideration asillustrated in the second box of Figure 14the U-P Ratio has historically demon-strated a difference and probably maymake a difference in future analysis.
STEP 3. DTR®-Alpha Determinewhether or not the style blended return of the manager exceeds a similar passive style blended benchmark.If the manager adds value, DTR®-Alpha, they are considered for the portfolio. If not the passive investment op-tion is employed. This step is represented in the third box of Figure 14 and further illustrated in Figure 15.
STEP 4. Asset & Style Mix Policy The DTR® links the investor’s profile to the best portfolio combination ofactive and passive managers. The portfolio is designed to identify the DTR® asset allocation recommendationin adherence to the client’s investment policy guidelines, as illustrated in the fourth box of Figure 14 and inmore detail in Figure 16.
These advanced Upside Potential/Downside Risk framework components are necessary in order to create bet-
ter portfolio performance results.
PAGE 17
• D
TR®
Des
ired Target Return Sc
reen
ing Proc
edures
Period 1 Rank
Funds Ranked by Omega Excess Return 1981-1996
Period 2 Rank
1 2
3 4
1
2
3
4
0%
10%
20%
30%
40%
50%
60%
70%
3
1. Almost 70% of funds in the top quartile in Period 1 stayed in the top quartile in Period 2
2. Almost 70% of funds in the bottom quartile stayed in the bottom quartile
3. Few top-ranked funds fell to the bottom quartile
2 1
Figure 15: DTR®-Alpha historical reliability
The Predictive Power of DTR®-Alpha
Linking it all together
Goal: Fund liabilitiesAnnual Contribution: $500,000Annual Distribution: $800,000Assets: $35,000,000
DTR® = 8%The Investor
Active Fund A $8,575,000Passive A 2,940,000Active Fund B 7,105,000Passive B 6,825,000Fund C 3,255,0001-3 Year Bonds 6,300,000
The Portfolio
Figure 16: Linking the investor’s DTR® Desired Target Return® to a Portfolio Construct

D E S I R E D T A R G E T R E T U R N ®
Portfolio Construction Integration
The Upside Potential/Downside Risk framework is overlaid in a utilitarian application across non-proprietary
manager universes. There are three basic integrating steps to Desired Target Return® portfolio construction,
which are as follows:
STEP 1: Global Investment Committee Asset Allocation
Global Investment Committee’s Strategic and Tactical Asset Allocation recommendation is the first step of the
portfolio construction procedure as illustrated in Figure 17.
PAGE 18
• D
TR®
Larg
e Va
lue
Larg
e C
ore
Larg
e G
row
th
Mid
Val
ue
Mid
Cor
e
Mid
Gro
wth
Smal
l Val
ue
Smal
l Cor
e
Smal
l Gro
wth
Tbill
s
1-3
Year
Bon
ds
3-5
Year
Bon
ds
Long
Bon
ds
Euro
pe
U.K
.
Paci
fic
Japa
n
U.S. Equity U.S. Fixed Income International Equity
Figure 17: Step 1—Strategic and Tactical Allocation
Global Investment Committee’s Asset Allocation Recommendation
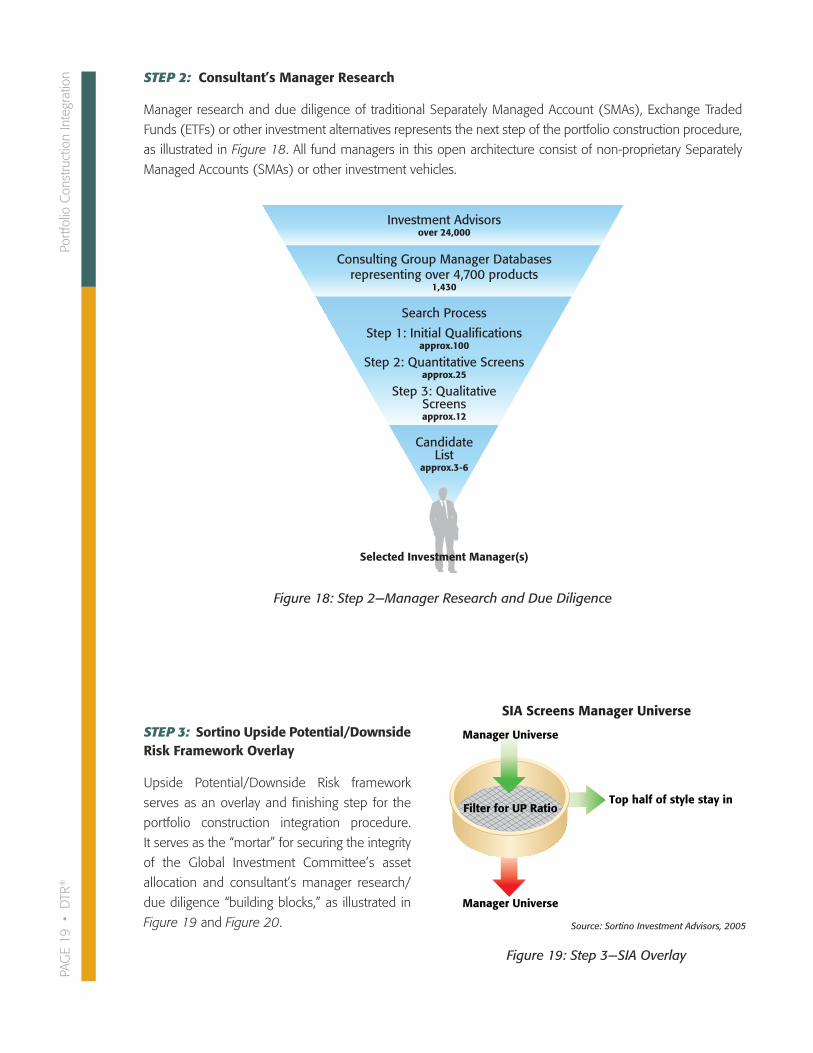
STEP 2: Consultant’s Manager Research
Manager research and due diligence of traditional Separately Managed Account (SMAs), Exchange Traded
Funds (ETFs) or other investment alternatives represents the next step of the portfolio construction procedure,
as illustrated in Figure 18. All fund managers in this open architecture consist of non-proprietary Separately
Managed Accounts (SMAs) or other investment vehicles.
STEP 3: Sortino Upside Potential/DownsideRisk Framework Overlay
Upside Potential/Downside Risk framework
serves as an overlay and finishing step for the
portfolio construction integration procedure.
It serves as the “mortar” for securing the integrity
of the Global Investment Committee’s asset
allocation and consultant’s manager research/
due diligence “building blocks,” as illustrated in
Figure 19 and Figure 20.
PAGE 19
• D
TR®
Portfolio Con
struction Integration
Investment Advisorsover 24,000
Consulting Group Manager Databasesrepresenting over 4,700 products
1,430
Search Process
Step 1: Initial Qualificationsapprox.100
Step 2: Quantitative Screensapprox.25
Step 3: QualitativeScreensapprox.12
CandidateList
approx.3-6
Selected Investment Manager(s)
Figure 18: Step 2—Manager Research and Due Diligence
Top half of style stay in
Manager Universe
Filter for UP Ratio
Manager Universe
Source: Sortino Investment Advisors, 2005
Figure 19: Step 3—SIA Overlay
SIA Screens Manager Universe
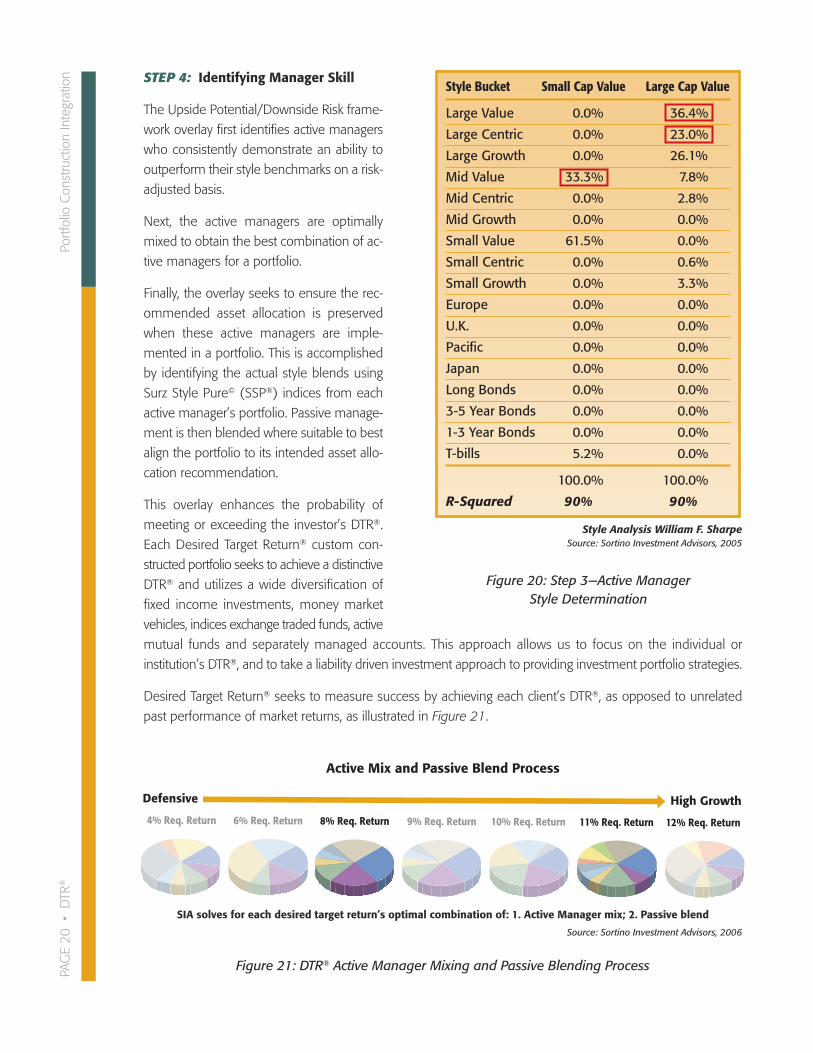
STEP 4: Identifying Manager Skill
The Upside Potential/Downside Risk frame-
work overlay first identifies active managers
who consistently demonstrate an ability to
outperform their style benchmarks on a risk-
adjusted basis.
Next, the active managers are optimally
mixed to obtain the best combination of ac-
tive managers for a portfolio.
Finally, the overlay seeks to ensure the rec-
ommended asset allocation is preserved
when these active managers are imple-
mented in a portfolio. This is accomplished
by identifying the actual style blends using
Surz Style Pure© (SSP®) indices from each
active manager’s portfolio. Passive manage-
ment is then blended where suitable to best
align the portfolio to its intended asset allo-
cation recommendation.
This overlay enhances the probability of
meeting or exceeding the investor’s DTR®.
Each Desired Target Return® custom con-
structed portfolio seeks to achieve a distinctive
DTR® and utilizes a wide diversification of
fixed income investments, money market
vehicles, indices exchange traded funds, active
mutual funds and separately managed accounts. This approach allows us to focus on the individual or
institution’s DTR®, and to take a liability driven investment approach to providing investment portfolio strategies.
Desired Target Return® seeks to measure success by achieving each client’s DTR®, as opposed to unrelated
past performance of market returns, as illustrated in Figure 21.
PAGE 20
• D
TR®
Portfolio Con
struction Integration
Style Bucket Small Cap Value Large Cap Value
Large Value 0.0% 36.4%
Large Centric 0.0% 23.0%
Large Growth 0.0% 26.1%
Mid Value 33.3% 7.8%
Mid Centric 0.0% 2.8%
Mid Growth 0.0% 0.0%
Small Value 61.5% 0.0%
Small Centric 0.0% 0.6%
Small Growth 0.0% 3.3%
Europe 0.0% 0.0%
U.K. 0.0% 0.0%
Pacific 0.0% 0.0%
Japan 0.0% 0.0%
Long Bonds 0.0% 0.0%
3-5 Year Bonds 0.0% 0.0%
1-3 Year Bonds 0.0% 0.0%
T-bills 5.2% 0.0%
100.0% 100.0%
R-Squared 90% 90%
Style Analysis William F. SharpeSource: Sortino Investment Advisors, 2005
Figure 20: Step 3—Active Manager Style Determination
4% Req. Return 6% Req. Return 8% Req. Return 9% Req. Return 10% Req. Return 11% Req. Return 12% Req. Return
Defensive High Growth
SIA solves for each desired target return’s optimal combination of: 1. Active Manager mix; 2. Passive blend
Source: Sortino Investment Advisors, 2006
Figure 21: DTR® Active Manager Mixing and Passive Blending Process
Active Mix and Passive Blend Process
D E S I R E D T A R G E T R E T U R N ®
SummaryThe Desired Target Return® portfolio construction process results in an optimal mix of managers and an optimal
blend of active and passive investment strategies. The optimal active manager mix and passive blend strategies
are designed to ensure that the recommended asset allocation results in the actual implemented asset
allocation strategy.
The integration of Modern Portfolio Theory (MPT) with Post Modern Portfolio Theory (PMPT) and today’s tech-
nology results in a revolutionary advancement in the evolution of portfolio construction. Desired Target Return®
portfolio construction is designed to build more effective custom portfolios for better portfolio performance
with less portfolio risk for investors.
PAGE 21
• D
TR®
D E S I R E D T A R G E T R E T U R N ®
Glossary
Bootstrap Method
A statistical method developed by Bradley Effron of Stanford University that is used by Sortino Investment Ad-
visors (SIA) to develop better estimates of risk and return. With the Bootstrap Method, a manager’s performance
is simulated by developing a distribution of possible returns through random sampling with replacement.
The process is as follows: Twelve returns are selected at random from historical monthly returns of a manager’s
style benchmark and combined to make a single annual return. Each monthly return can be drawn more than
once. This is repeated many times to construct a full distribution of possible annual returns.
Bootstrapping avoids the dual problems of time sensitivity (beginning/ending date) and limited data because
it is not dependent on an arbitrarily selected single period of history. By randomly sampling from a manager’s
actual historical monthly returns to simulate future performance, this method measures what could have hap-
pened rather than what did happen.
Desired Target Return® (DTR®)
The Desired Target Return® an investor must earn in order to accomplish his/her financial goal. While returns
above the Desired Target Return® are welcome, returns below this level represent risk to the investor. For
example, a 50-year-old investor with $100,000 in retirement assets who is looking to retire at age 65 with
$600,000 in assets and is willing to contribute $10,000 a year will need to earn at least an 8% annual return.
Thus the Desired Target Return® is 8%; if the actual return falls below 8%, the investor will have to contribute
more and/or retire with fewer assets.
The following performance measures are calculated based on the DTR®: Downside Deviation, DTR®-Alpha
Return, Omega Return, Sortino Ratio, Upside Potential, and U-P Ratio.
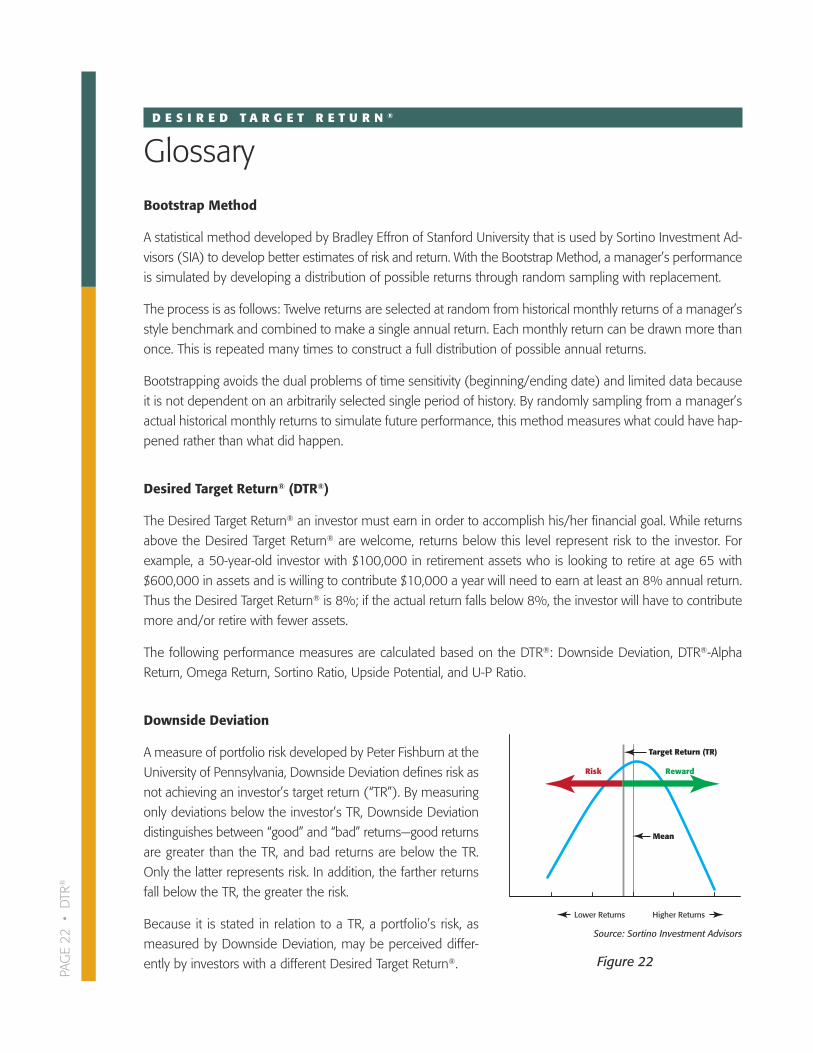
Downside Deviation
A measure of portfolio risk developed by Peter Fishburn at the
University of Pennsylvania, Downside Deviation defines risk as
not achieving an investor’s target return (“TR”). By measuring
only deviations below the investor’s TR, Downside Deviation
distinguishes between “good” and “bad” returns—good returns
are greater than the TR, and bad returns are below the TR.
Only the latter represents risk. In addition, the farther returns
fall below the TR, the greater the risk.
Because it is stated in relation to a TR, a portfolio’s risk, as
measured by Downside Deviation, may be perceived differ-
ently by investors with a different Desired Target Return®.
PAGE 22
• D
TR®
Risk Reward
Target Return (TR)
Mean
Lower Returns Higher Returns
Source: Sortino Investment Advisors
Figure 22
Downside Probability
The probability, or likelihood, that a portfolio’s return will fall below the DTR®.
Downside Risk
See Downside Deviation.
Holdings-Based Style Analysis
See Style Analysis.
DTR®-Alpha Return
A risk-adjusted return measuring the value added by a manager over and above performance that could have
been achieved with its style benchmark. DTR®-Alpha Return is the difference between the manager’s Omega
Return and the style benchmark’s Omega Return.
Mathematically,DTR Alpha® Return = OmegaMgr – OmegaBenchmark
Where,OmegaMgr = Manager’s Omega ReturnOmegaBenchmark= Style Benchmark’s Omega Return
Omega Return
A measure of risk-adjusted performance that indicates whether a manager was compensated for the level of
risk taken.
Mathematically,Omega Return = RMgr – 3 (Style Beta * DVarBenchmark)
Where,RMgr = Manager’s ReturnDVarBenchmark = Downside Variance of Style Benchmark
R-Squared
A statistical measure that represents the percentage of a manager’s returns that are explained by returns in
the manager’s style benchmark. R-Squared ranges from 0 to 100 where 100 means that all movements of a
portfolio are completely explained by movements in the style benchmark.
PAGE 23
• D
TR®
Glossary
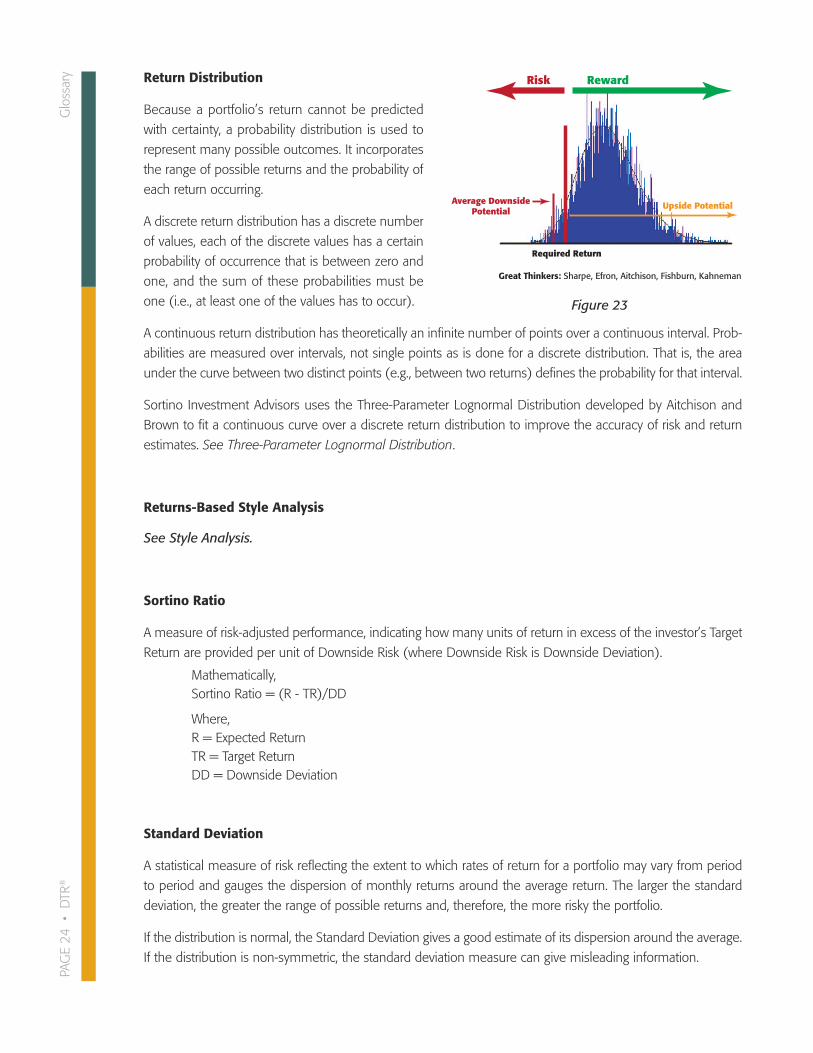
Return Distribution
Because a portfolio’s return cannot be predicted
with certainty, a probability distribution is used to
represent many possible outcomes. It incorporates
the range of possible returns and the probability of
each return occurring.
A discrete return distribution has a discrete number
of values, each of the discrete values has a certain
probability of occurrence that is between zero and
one, and the sum of these probabilities must be
one (i.e., at least one of the values has to occur).
A continuous return distribution has theoretically an infinite number of points over a continuous interval. Prob-
abilities are measured over intervals, not single points as is done for a discrete distribution. That is, the area
under the curve between two distinct points (e.g., between two returns) defines the probability for that interval.
Sortino Investment Advisors uses the Three-Parameter Lognormal Distribution developed by Aitchison and
Brown to fit a continuous curve over a discrete return distribution to improve the accuracy of risk and return
estimates. See Three-Parameter Lognormal Distribution.
Returns-Based Style Analysis
See Style Analysis.
Sortino Ratio
A measure of risk-adjusted performance, indicating how many units of return in excess of the investor’s Target
Return are provided per unit of Downside Risk (where Downside Risk is Downside Deviation).
Mathematically,Sortino Ratio = (R - TR)/DD
Where,R = Expected ReturnTR = Target ReturnDD = Downside Deviation
Standard Deviation
A statistical measure of risk reflecting the extent to which rates of return for a portfolio may vary from period
to period and gauges the dispersion of monthly returns around the average return. The larger the standard
deviation, the greater the range of possible returns and, therefore, the more risky the portfolio.
If the distribution is normal, the Standard Deviation gives a good estimate of its dispersion around the average.
If the distribution is non-symmetric, the standard deviation measure can give misleading information.
PAGE 24
• D
TR®
Glossary Risk Reward
Required Return
Upside PotentialAverage DownsidePotential
Great Thinkers: Sharpe, Efron, Aitchison, Fishburn, Kahneman
Figure 23
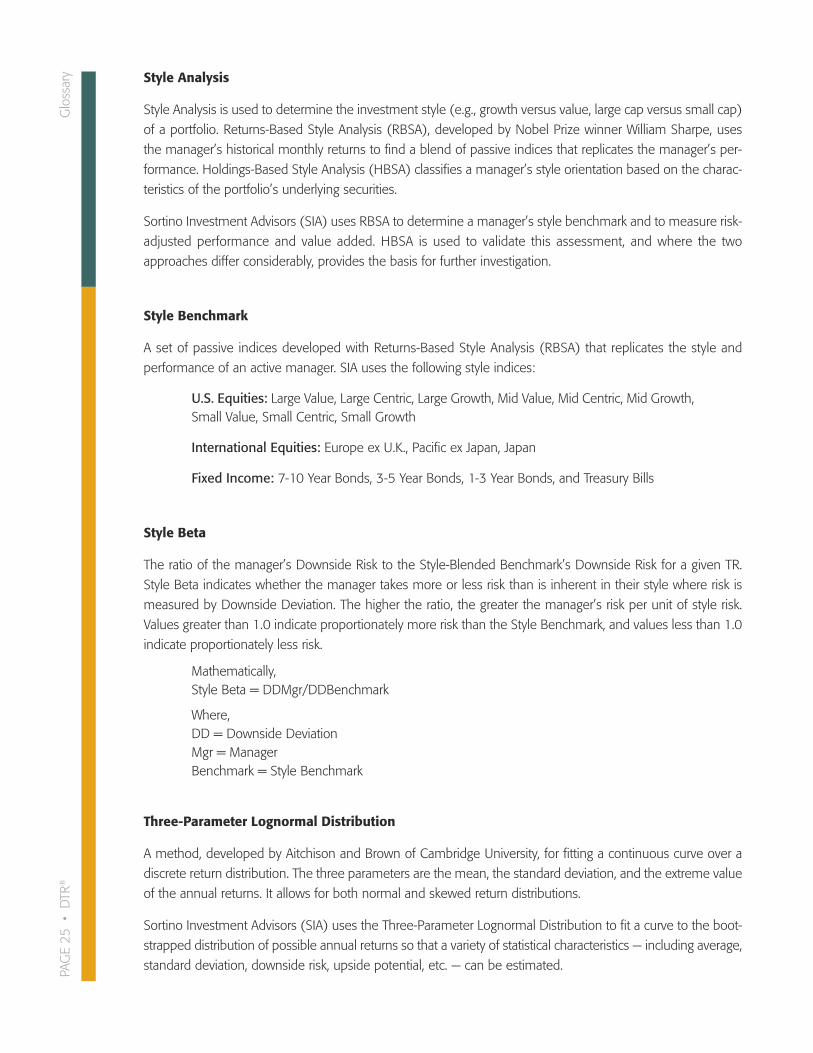
Style Analysis
Style Analysis is used to determine the investment style (e.g., growth versus value, large cap versus small cap)
of a portfolio. Returns-Based Style Analysis (RBSA), developed by Nobel Prize winner William Sharpe, uses
the manager’s historical monthly returns to find a blend of passive indices that replicates the manager’s per-
formance. Holdings-Based Style Analysis (HBSA) classifies a manager’s style orientation based on the charac-
teristics of the portfolio’s underlying securities.
Sortino Investment Advisors (SIA) uses RBSA to determine a manager’s style benchmark and to measure risk-
adjusted performance and value added. HBSA is used to validate this assessment, and where the two
approaches differ considerably, provides the basis for further investigation.
Style Benchmark
A set of passive indices developed with Returns-Based Style Analysis (RBSA) that replicates the style and
performance of an active manager. SIA uses the following style indices:
U.S. Equities: Large Value, Large Centric, Large Growth, Mid Value, Mid Centric, Mid Growth,Small Value, Small Centric, Small Growth
International Equities: Europe ex U.K., Pacific ex Japan, Japan
Fixed Income: 7-10 Year Bonds, 3-5 Year Bonds, 1-3 Year Bonds, and Treasury Bills
Style Beta
The ratio of the manager’s Downside Risk to the Style-Blended Benchmark’s Downside Risk for a given TR.
Style Beta indicates whether the manager takes more or less risk than is inherent in their style where risk is
measured by Downside Deviation. The higher the ratio, the greater the manager’s risk per unit of style risk.
Values greater than 1.0 indicate proportionately more risk than the Style Benchmark, and values less than 1.0
indicate proportionately less risk.
Mathematically,Style Beta = DDMgr/DDBenchmark
Where,DD = Downside DeviationMgr = ManagerBenchmark = Style Benchmark
Three-Parameter Lognormal Distribution
A method, developed by Aitchison and Brown of Cambridge University, for fitting a continuous curve over a
discrete return distribution. The three parameters are the mean, the standard deviation, and the extreme value
of the annual returns. It allows for both normal and skewed return distributions.
Sortino Investment Advisors (SIA) uses the Three-Parameter Lognormal Distribution to fit a curve to the boot-
strapped distribution of possible annual returns so that a variety of statistical characteristics — including average,
standard deviation, downside risk, upside potential, etc. — can be estimated. PAGE 25
• D
TR®
Glossary
Surz Style Pure® (SSP®) Indices
Style groupings are based on data provided by Compustat. Two security databases are used. The U.S. database
covers more than 6000 firms, with total capitalization exceeding $18 trillion. The non-U.S. database coverage
exceeds 15,000 firms, 20 countries, and $31 trillion – substantially broader than EAFE.
To construct style groupings, Surz first break the Compustat database for the region into size groups based on
market capitalization, calculated by multiplying shares outstanding by price per share. There are 3 regions
maintained in our system: U.S., Foreign and Global. Beginning with the largest capitalization company, Surz
adds companies until 65% of the entire capitalization of the region is covered. This group of stocks is then
categorized as “large cap” (capitalization). There are generally about 200 companies in this group for the U.S.,
800 for Foreign, and 1000 for Global. The second size group represents the next 25% of market capitalization
and is called “mid cap”. There are generally about 1000 companies in this group for U.S., 2700 for Foreign,
and 3500 for Global. Finally, the bottom 10% is called “small cap”. There are generally 5000 U.S. securities
in this group, 10,000 Foreign, and 15,000 Global.
Then within each size group, a further breakout is made on the basis of orientation. Value, centric, and growth
stock groupings within each size category are defined by establishing an aggressive measure. Aggressiveness
is a proprietary measure that combines dividend yield and price/earnings ratio. The top 40% (by count) of
stocks in aggressiveness are designated as “growth,” while the bottom 40% are called, “value,” with the 20%
in the middle of falling into “centric.”
Upside Potential
The average return above the Desired Target Return®, measuring how often and how far above the Desired
Target Return® a portfolio’s returns are likely to occur. Upside Potential, a term coined by Nobel Prize winner
Daniel Kahneman, captures investors’ perception of risks concerning gains as opposed to risk concerning losses.
U-P Ratio (Upside Potential Ratio)
The ratio of Upside Potential to Downside Deviation at a given DTR® Desired Target Return®, measuring how
much upside potential is provided by a manager at a given level of downside risk.
Mathematically,U-P Ratio = UP/DD
Where,UP = Upside Potential DD = downside deviation
PAGE 26
• D
TR®
Glossary
D E S I R E D T A R G E T R E T U R N ®
DisclaimerThe material presented in this brochure is for illustration purposes only and is an attempt to communicate a
complex subject in a simplified fashion. For more information regarding Sortino’s Upside Potential/Downside
Risk optimization methodology you can visit www.sortino.com or www.sortinoim.com. Sortino’s methodology
strives to take a cautious approach to analyze past performance in order to predict future results in a world of
uncertainty. Many calculations are performed as it related to protecting the investor on the downside. From
Style Beta, Downside Deviation, Risk Aversion and DTR®-Alpha, in essence each statistic measurement is
calculated by design to penalize each active manager solution more severely for performing below than giving
them credit for meeting or exceeding the Target Rate of Return. Passive management is integrated where this
scrutinized satisfactory active manager is absent and to budget active manager risk.
The culmination of over 40 years of work by Dr. Sortino and the work of highly acclaimed academics and
Noble Prize winners has brought us to a new paradigm of investing — one that focuses on the return needed to
accomplish an investor’s goal while at the same time providing the downside protection every investor seeks.
The Desired Target Return® Program does not take into consideration the investor’s tax situation, debt or future
changes in assets or income needs. The investor should evaluate their level of risk tolerance based on their own
investment knowledge, experience, demographics and net worth and consider either adjusting their portfolio
risk, investigating alternative investment options, or consulting with an investment advisor to consider their
specific situation and needs. The program assumes that the DTR® is the underlying goal of the investor, and
the possibility of the investor failing to reach the Desired Target Return® accordingly is a primary investor risk.
Investing in financial securities involves risk. The higher the Desired Target Return® the greater the potential for
significant loss of principle in your retirement account balance. Ignoring or under estimating the Desired Target
Return® increases the risk of not replacing a sufficient amount of pre-retirement salary. Sortino Investment Ad-
visors, LLC (SIA) makes no assurances, implied or implicit, that the Desired Target Return® assigned to each
participant will be achieved nor if achieved will result in replacing a significant amount of pre-retirement salary.
Past performance is no guarantee of future results. SIA, its affiliates, and its employees are not in the business
of providing tax or legal advice. These materials and any tax-related statements are not intended or written to
be used, and cannot be used or relied upon, by any such taxpayer for the purpose of avoiding tax penalties.
Tax-related statements, if any, may have been written in connection with the “promotion or marketing” of the
transaction(s) or matters(s) addressed by these materials, to the extent allowed by applicable law. Any such
taxpayer should seek advice based on the taxpayer’s particular circumstances from an independent tax advisor.
PAGE 27
• D
TR®