desktop corrosion control study | us epa archive document
TRANSCRIPT


Report
Desktop Corrosion Control Study
Prepared for
USE EPA Region III
Philadelphia, P A
April 2004
Washington Aqueduct Washington, D.C.
and CH2M HILL Herndon, VA
CH2MHILL
Executive Summary
Introduction For the period July 2001 through June 2002, W ASA' s compliance tap samples for lead exceeded the action level of 15 parts per billion (ppb). The 90th percentile level of lead went from 8 ppb the monitoring period before, to 75 ppb, with more than 50-percent of the collected samples exceeding the action leveL The two monitoring periods in 2003 resulted in 90th percentile lead levels of 40 ppb and 63 ppb respectively.
Review of Options Washington Aqueduct and its engineers have conducted this review of engineering reports and recent water quality changes in customers' distribution systems. This review includes evaluation of options that have worked successfully in other locations. The steps include:
1. Evaluation of the option of maintaining a constant, high pH at the Dalecarlia and McMillan WTPs using either quicklime (current practice) and/or sodium hydroxide (caustic soda);
2. Evaluation of the option of feeding a corrosion inhibitor such as orthophosphate, while maintaining a constant pH throughout the year of about 7.7;
3. Develop a recommended corrosion plan and present it to the Technical Expert Working Group (TEWG) consisting of members from EPA, DC Department of Health (DC DOH), WASA, Washington Aqueduct, Falls Church, Arlington County and, consultants representing WASA and the Washington Aqueduct; and
4. Preparation of the Optimum Corrosion Control Treatment (OCCT) document and subsequent submission to EPA for approval.
Three reports were previously produced for the Washington Aqueduct dealing specifically with the Lead and Copper Rule (LCR) and alternative pH and alkalinity control. A fourth report was produced for EPA. The reports include:
"Corrosion Control Study" June 1994 (contracted for by WA);
"Caustic Soda Feasibility Study", October, 1997 (contracted for by WA);
"Corrosion Inhibitor Study for Dalecarlia and McMillan Treatment Plants"
May ,1998 (contracted for by WA); and
"Review of Washington, DC Corrosion Control Recommendation" December, 1996 ( commissioned by EPA).
ES·1

EXECUTIVE
The 1994 Study produced the following results:
• Optimization of pH and alkalinity is directly related to calcium hardness adjustment and calcium carbonate precipitation potential.
• pH should be maintained in the 8.6 to 9.0 range.
• The 1:3 zinc orthophosphate reduced corrosion to a greater degree than the other inhibitors tested during static testing.
Pipe Loop Testing
• Pipe Loop 1: Addition of a 1:5 Zinc Orthophosphate (Z-OP) at a dosage of 1.5 mg/L showed a tendency to reduce lead levels to lower values than either the pHIalkalinity/hardness/calcium hardness adjustment loop or the control loop. However, random high spikes of lead were observed. The 1994 Report recommended further study to understand the random spikes prior to implementing the Z-OP alternative.
• Pipe Loop 2: Modification of finished water pH to target 8.8. The target pH was previously determined to achieve an optimum calcium carbonate precipitation potential (CCPP) in the 4.0 to 10.0 range. The results of this pipe loop reduced lead levels in eight hour standing samples There were less lead concentration spikes with this pipe loop than the Z-OP loop but more lead spikes than with the control loop. Pipe Loop 2 identified severe calcium carbonate deposition issues associated with increasing the pH to 8.8.
• Pipe Loop 3: Control loop. Utilized unadjusted Dalecarlia finished water. Produced consistently higher lead levels than either Pipe Loop 1 or Pipe Loop 2. Pipe Loop 3 did not produce lead spikes that were observed in Pipe Loops 1 and 2.
The 1994 Report concluded, "Based on these findings, it is recommended that the Washington Aqueduct water treatment plants maintain current water treatment practices by maintaining a positive Langeliers Saturation Index, as close to zero as possible, through adjustment of pH."
In a December, 1996 letter to EPA Region III, prepared by Black and Veatch, it was concluded that"As previously discussed, there are two options: (1) raising the pH to 9.0; or (2) maintaining the pH between 7.4 - 7.8 in the distribution system and adding orthophosphate to > 3 mg/L as P04. pH adjustment to 9.0 appears to be more appropriate at the present time"
The 1997 Report concluded that maintenance of pH 8.5 throughout the year with either caustic soda or quicklime would result in excessive calcium precipitation in the distribution system. The 1997 Report showed that maintaining a pH of 8.5 with quicklime would result in CCPP values of 80 mg/L or above at both the McMillan and Dalecarlia WTPs. The practice of caustic soda addition would result in CCPP levels of 60 mg/L or greater at both WTPs. Although the use of caustic soda would result in lowered CCPP values, when compared to the CCPP values projected through the use of quicklime, the CCPP values would be excessively high. The recommended CCPP range is acknowledged as 4 to 10 mg/L for lead and copper corrosion abatement. Section 4 of the 1997 Report concludes by
ES·2
EXECUTIVE SUMMARY
stating "Because conversion to caustic soda will not enable WA to significantly reduce calcium carbonate deposition while maintaining adequate corrosion control by pH adjustment to 8.5 or above, other corrosion control strategies such as the use of corrosion inhibitors may be more appropriate".
The 1997 Report cited a capital cost of $600,000 (in 1997 dollars) to convert to caustic soda.
The 1998 Report concluded:
1. No major benefit was observed for the addition of Z-OP compared to orthophosphate (phosphoric acid) in the reduction of lead levels in finished water.
2. Chemical costs for Z-OP are approximately laO-percent greater than chemical costs for phosphoric acid.
3. Phosphoric acid should be used as the preferred corrosion control alternative should the Washington Aqueduct switch to a corrosion inhibitor strategy. Initially the dose should be 1.0 mg/L as phosphate. The 1.0 mg/L dose may be reduced over time while still providing effective corrosion control.
4. Should the Washington Aqueduct switch to the phosphate corrosion control strategy and apply a 1.0 mg/L phosphate dose, the maximum phosphate dose that will arrive at the receiving WWTPs due to phosphate addition at Washington Aqueduct's WTPs would be 1.0 mg/L. Under the worst scenario this would represent a 10-percent increase in the phosphate levels currently received.
5. Annual O&M costs for initiating a phosphoric acid feed system were determined to be $166,000 and $148,000 per year (1998 dollars) for the Dalecarlia and McMillan WTPs respectively. However, since a phosphoric acid treatment regime would reduce quicklime addition quantity requirements a savings of $30,000 (1998 dollars) per WTP would be recognized.
6. Total estimated capital costs for implementation of phosphoric acid feed were determined to be $350,000 and $220,000 (1998 dollars) for the Dalecarlia and McMillan WTPs respectively.
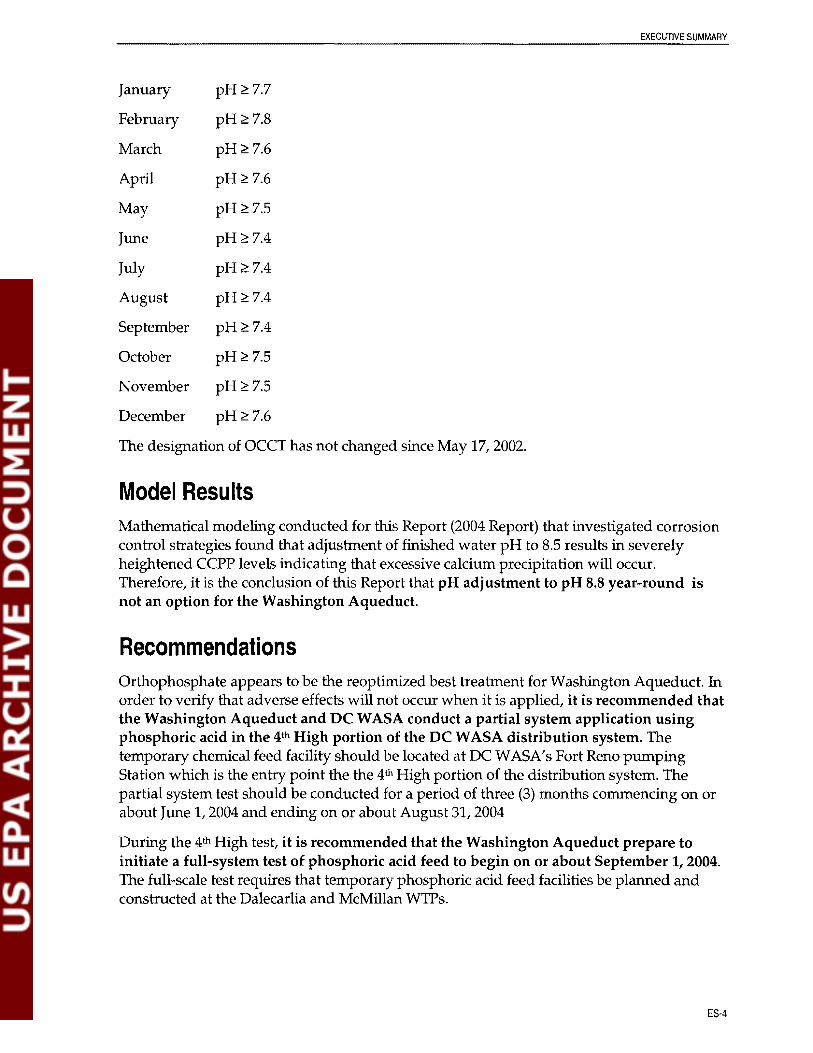
OCCT Designation In the case of Washington Aqueduct, EPA approves optimal corrosion control treatment (OCCT) as the primacy agency for the District of Columbia. In June 1994, W A submitted a corrosion control report to EPA. The study evaluated and recommended pH control to maintain a positive Langelier Saturation Index (LSI) for corrosion control as optimal treatment. In 1996, EPA conducted a study that recommended that WA maintain pH at, or above pH 8.5 at all times. On July 16, 1997, EPA granted a conditional OCCT to W A. In Februsry, 2000, EPA made a designation of OCCT for the Washington Aqueduct which required W A to maintain a pH in the finished water between 7.7 and 8.5 while also maintaining a positive LSI. Subsequent studies conducted for W A indicated that maintaining a finished water pH at, or above, pH 8.5 was infeasible due to calcium precipitation. On May 17, 2002, EPA revised its designation of OCCT to meet monthly pH goals as follows:
ES-3
EXECUTIVE
January pH~7.7
February pH ~ 7.8
March pH ~ 7.6
April pH~ 7.6
May pH ~ 7.5
June pH~7.4
July pH ~ 7.4
August pH ~ 7.4
September pH ~ 7.4
October pH ~ 7.5
November pH ~ 7.5
December pH ~ 7.6
The designation of OCCT has not changed since May 17, 2002.
Model Resu Its Mathematical modeling conducted for this Report (2004 Report) that investigated corrosion control strategies found that adjustment of finished water pH to 8.5 results in severely heightened CCPP levels indicating that excessive calcium precipitation will occur. Therefore, it is the conclusion of this Report that pH adjustment to pH 8.8 year-round is not an option for the Washington Aqueduct.
Recommendations Orthophosphate appears to be the reoptimized best treatment for Washington Aqueduct. In order to verify that adverse effects will not occur when it is applied, it is recommended that the Washington Aqueduct and DC WASA conduct a partial system application using phosphoric acid in the 4th High portion of the DC WASA distribution system. The temporary chemical feed facility should be located at DC W ASA' s Fort Reno pumping Station which is the entry point the the 4th High portion of the distribution system. The partial system test should be conducted for a period of three (3) months commencing on or about June 1, 2004 and ending on or about August 31, 2004
During the 4th High test, it is recommended that the Washington Aqueduct prepare to initiate a full-system test of phosphoric acid feed to begin on or about September 1, 2004. The full-scale test requires that temporary phosphoric acid feed facilities be planned and constructed at the Dalecarlia and McMillan WTPs.
ES-4

EXECUTIVE SUMMARY
As soon as possible, it is recommended that the Washington Aqueduct should plan, design, construct and implement a pilot-scale testing program to incorporate pipe loops fabricated from harvested DC WA5A L5Ls. The pipe loop study will be beneficial in optimizing fullscale inhibitor feed rates and therefore, effectively reduce full-scale corrosion while minimizing treatment costs.
ES·5
Contents
1 Introduction ........................................................................................................................... 1-1 1.1 Corrosivity Reduction Plan......................................................................................... 1-4
1.1.1 Desktop Study ................................................................................................. 1-4 1.1.2 Partial System Application ............................................................................ l-S 1.1.3 Full System Implementation .......................................................................... l-S 1.1.4 Pipe Loop Studies ............................................................................................ l-S 1.1.5 Distribution System Operations Team Monitoring Plan ........................... l-S
2 Treatment Options................................................................................................................ 2-1 2.1 Mechanisms of Corrosion ........................................................................................... 2-1 2.2 Treatment Approaches ................................................................................................ 2-1
2.2.1 pH and Alkalinity Adjustment ..................................................................... 2-1 2.2.2 Calcium Adjustment ....................................................................................... 2-2 2.2.3 Phosphate Inhibitor Addition ....................................................................... 2-3 2.2.4 Silicate Inhibitor Addition ............................................................................. 2-3 2.2.S Other Corrosion Inhibitor Strategies ............................................................ 2-4
3 Summary of Corrosion Control Reports........................................................................... 3-1 3.1 Corrosion Control Study, June 1994 .......................................................................... 3-1
3.1.1 Desk-Top Evaluation ...................................................................................... 3-1 3.1.2 Static Test Evaluation ..................................................................................... 3-1 3.1.3 Pipe Loop Testing ............................................................................................ 3-2 3.1.4 1994 Study Results .......................................................................................... 3-2
3.2 Caustic Soda Feasibility Study, October, 1997 ......................................................... 3-3 3.2.1 1997 Report Results ......................................................................................... 3-4
3.3 Corrosion Inhibitor Study for Dalecarlia and McMillan Treatment Plants, May, 1998 ....................................................................................................................... 3-4 3.3.1 1998 Report Results ......................................................................................... 3-4
3.4 Review of Washington, DC Corrosion Control Recommendation December, 1996 ................................................................................................................................. 3-S
3.4 OCCT Designation ....................................................................................................... 3-6
4 Model Description ................................................................................................................ 4-1 4.1 Model Development .................................................................................................... 4-3
4.1.1 Model Runs Without Orthophosphate ........................................................ 4-3 4.1.2 Model Runs With Orthophosphate .............................................................. 4-3
4.2 Model Results ............................................................................................................... 4-5 4.2.1 Model Runs Without Orthophosphate ........................................................ 4-5 4.2.2 Model Runs With Orthophosphate .............................................................. 4-6
5 Recommendations ................................................................................................................ 5-1 S.l Full-Scale Treatment .................................................................................................... S-l 5.2 Pilot-Scale Testing ........................................................................................................ 5-4

6 Peer Review ................................................................................................................................... 6-1 6.1 Peer Review Committee Recommendations ......... 6-Error! Bookmark not defined. 6.2 Response to PRC Recommendations ...................... 6-Error! Bookmark not defined.
Appendices A through F are provided on CD-ROM
Tables
1-1 Survey of Similar Facilities
1-2 Water Quality Annual Average for Fluoride
2-1 Characteristics of Common pH, Alkalinity, and Calcium Adjustment Treatment Chemicals
4-1 Water!Pro Example Input Parameters
4-2 Water!Pro Example Output Parameters - Based on Input Water Quality Characteristics and Chemical Addition
4-3 Model Runs Without Orthophosphatel • 2 Influent Water Quality Characteristics and Chemical Addition
4-4 Model Runs Without Orthophosphatel - Influent Water Quality Characteristics and Chemical Addition
5-1 Effect of Phosphoric Acid on Finished Water pH
Appendices
A Table A-1: Water!Pro Detailed Data Table - Without Orthophosphate, Varying Initial Water Quality, Varying Chemical Addition, and Varying Target pH
B Table B-1: Summary Table of Modeling Scenarios in Figures 1 (A, B, C) through 27 (A, B, C)
Figures 1-A through 27-A: Without Orthophosphate, Lead II vs. Target pH
Figures 1-B through 27-B: Without Orthophosphate, Total CaC03 Added vs. CCPP
Figure 1-C through 27-C: Without Orthophosphate, Total CaC03 Added vs. Target pH
C Water!Pro Corrosion Data Reports, Without Orthophosphate, Run Nos. 1 through 486
D Table D-1: Water!Pro Detailed Data Table - With Orthophosphate (1 to 3 mg/L), Varying Initial Alkalinity, and Varying Initial pH
E Table E-1: Summary of Modeling Scenarios in Figures E-1 through E-9
Figures E-1 through E-9: With Orthophosphate, Lead II vs. Orthophosphate Dose
CONTENTS
F Water!Pro Corrosion Data Reports, With Orthophosphate, Run Nos. C-l through C66
iii
SECTION 1
Introduction
The Washington Aqueduct is a wholesale water utility that provides potable water to the District of Columbia Water and Sewer Authority (WASA), Arlington County, V A, and the City of Falls Church, VA. The Washington Aqueduct owns, operates and, maintains two water treatment plants (WTPs) the Dalecarlia WTP and the McMillan WTP. The two WTPs provide conventional treatment, of Potomac River water, which includes coagulation (with aluminum sulfate), sedimentation, filtration and, primary and secondary disinfection (chlorination followed by chloramination).
For the period July 2001 through June 2002, W ASA' s compliance tap samples for lead exceeded the action level of 15 parts per billion (ppb). The 90th percentile level of lead went from 8 ppb the monitoring period before, to 75 ppb, with more than 50-percent of the collected samples exceeding the action level. The two mOnitoring periods in 2003 resulted in 90th percentile lead levels of 40 ppb and 63 ppb respectively.
In the Spring of 2003 EPA commissioned a study to evaluate the existing optimized corrosion control treatment (OCCT). The draft version of that report speculated on a link between excessive lead concentrations in tap water and the introduction of monochloramine to the system. Free chlorine was replaced by monochloramine in November 2000 in order to reduce the concentrations of disinfection byproducts. Disinfection byproducts include trihalomethanes and halogenated acetic acids which are suspected human carcinogens.
A telephone survey of similar systems (age, size, use of chloramines, etc.) was conducted to evaluate whether other utilities had experienced increased lead levels due to the practice of chloramination. The results of the survey are presented in Table 1-1 below. Of the twelve utilities surveyed none reported a direct correlation between a conversion from free chlorine to chloramine and increased lead corrosion.
It has been suggested that the addition of hydrofluosilicic acid (for fluoride addition) has contributed to elevated lead levels in the United States. The Dalecarlia and McMillan WTPs have been providing fluoride addition, in accordance with Centers for Disease Control (CDC) recommendations, since 1952. Recently, DC W ASA staff conducted a review of fluoride fed at the Dalecarlia and McMillan WTPs. The results of that review are presented in Table 1-2. Based on the stable fluoride residuals maintained from 1997 through 2002, there is no evidence that suggests fluoride addition has contributed to lead corrosion.

1 - INTRODUCTION
TABLE 1-1 Washington Aqueduct Survey of Similar Facill1ies
Utility Population Oldest Piping Chloramine Initial LCR Status LCR Treatment Current LCR Cause of Notes Size in Cist. Conversion Year Status Problem
System
Richmond. VA 500 K many years ago non-compliant
Massachusetts Water Resources Authority (MWRA)
2_5 M very old 1996 non-compliant
Ottowa. Ontario CANADA
Anaheim, CA
Louisville, KY
1.0 M
325K
800K
1880
1991
-1 0 years ago (only 15% of system)
1980
(Does not follow EPA's LCR) high lead levels
compliant
Bangor, ME 50K 1875 1995 Some higher lead levels
Oneida City, NY 21K 1883 Use Free Chlorine non-compliant
pH & alkalinity adjustment and added Zinc Ortho
In compliance low pH and alkalinity unstable water
Improved ammonia mixing; raised alkalinity fL 6 to 30 and pH from 7 to 9
In compliance unstable water; insufficient ammonia mixing
pH & alkalinity adjustment
OK, lead levels down
low pH and alkalinity unstable water
stable water - very high alk (avg 198); avg. pH 7.8
In compliance N/A Not many lead service lines
program to replace lead pipe connections
In compliance
raise pH to 9.5; increase In compliance alkalinity
low pH and alkalinity
Found nitrification in
unstable water dist. system in summer
Better control of chlorine In compliance residual; Increase zinc orthophosphate dose
high chlorine residual; low pH and alkalinity
1-2

1 - INTRODUCTION
TABLE 1·1 (CONTINUED) Washington Aqueduct Survey of Similar Facilities
Utility Population Oldest Piping Chloramine Initial LCR Status LCR Treatment Current LCR Cause of Notes Size in Dist. Conversion Year Status Problem
System
Mohawk Valley 128K 1874 Use Free Chlorine non-compliant Water Authority, Oneida County, NY
Dallas, TX > 1.0 M 1900 on Chloramines since compliant mid-80's at least
Denver, CO 1.1 M 1920 Many years ago compliant
Norfolk, VA 350K 1900 2001 compliant
Portsmouth, VA 200K 1890 2001 compliant
control pH and alkalinity In compliance unstable water some - stabilize water; adjust biological pH to 9.0 activity
concurrent with high lead levels
Control pH and In compliance N/A all surface alkalinity; pH range = water 7.5-8.5, alk. = 100
Control pH and In compliance N/A low alkalinity; alkalinity; no corrosion pH=7.5; silica inhibitor in water reacts
w/aluminum to form protective scale on pipes
Orthophosphate In compliance N/A pH 6.8-7.2; alkalinity -30 mg/L
Sodium In compliance N/A mix of surface Hexametaphosphate water and well
water; pH 7.4; alkalinity 114
1-3

1·
TABLE 1·2
Year Dalecarlia WTP McMillan WTP
2002 0.87 ppm 0.93 ppm
2001 0.80 ppm 0.80 ppm
2000 0.90 ppm 0.80 ppm
1999 0.90 ppm 0.90 ppm
1998 0.90 ppm 0.80 ppm
1997 0.85 ppm 0.84 ppm
1.1 Corrosivity Reduction Plan The Production Treatment Operations Team was formed by a consensus consisting of EPA Region III, Washington Aqueduct, DC Water and Sewer Authority (DC WASA) and, the DC Department of Health to evaluate water treatment at Washington Aqueducts two WTPs in light of corrosion considerations. The team is led by the Washington Aqueduct and its consultants including CH2M HILL and Dr. Vernon L. Snoeyink. (Professor of Environmental Engineering, University of Illinois). The Washington Aqueduct's Virginia customers are also participating. The team has completed this Desktop Study that leads to a recommended treatment approach as well as future pipe loop studies to verify that approach and implement a partial, then full system treatment process to reduce the corrosivity of the water.
1.1.1 Desktop Study Washington Aqueduct and its engineers have conducted this review of engineering reports and recent water quality changes in customers' distribution systems. This review includes evaluation of options that have worked successfully in other locations. The steps include:
1. Evaluation of the option of maintaining a constant, high pH at the Dalecarlia and McMillan WTPs using either quicklime (current practice) and/or sodium hydroxide (caustic soda);
2. Evaluation of the option of feeding a corrosion inhibitor such as orthophosphate, while maintaining a constant pH throughout the year of about 7.7;
3. Develop a recommended corrosion plan and present it to the Technical Expert Working Group (TEWG) consisting of members from EPA, DC Department of Health (DC DOH), WASA, Washington Aqueduct, Falls Church, Arlington County and, consultants representing W ASA and the Washington Aqueduct; and
4. Preparation of the revised Optimum Corrosion Control Treatment (OCCT) document and subsequent submission to EPA for approval.

1-INTRODUCTION
This document constitutes the Desktop Study and includes items 1 through 3 above.
1.1.2 Partial System Application Using the results obtained from this Desktop Study and input from electrochemistry and recirculating pipe loops from the Distribution System Operations Team (formed by EPA Region III and lead by WASA), WASA and the Washington Aqueduct will conduct a partial system application of the preferred alternative in the Fourth (4th) high pressure zone in the District of Columbia served by WASA. The 4th High pressure zone has elements consistent with other service zones in the WASA system including lead service lines (LSLs) as well as unlined cast iron pipe. Temporary chemical feed facilities will be set-up in the Fort Reno pumping station. During the partial system application period, samples will be collected utilizing existing LCR sampling sites in addition to others that will be established prior to partial system applications start-up.
It is anticipated that the partial system application will be conducted over a period of three (3) months beginning June 1,2004 and concluding at the end of August 2004. At the conclusion of the first three (3) months of the partial system application, Washington Aqueduct will submit a recommendation to the TEWG for conducting full system implementation.
1.1.3 Full System Implementation The full-scale implementation of the selected corrosion reduction plan will begin 3-months after initiation of the partial system application assuming that there are no unresolvable adverse effects associated with the partial system application. Following implementation of the agreed upon full-scale solution (by the TEWG) samples will be collected utilizing existing LCR sampling sites in addition to others that will be established prior to full-scale system application start-up.
1.1.4 Pipe Loop Studies Pipe loop studies are scheduled to be conducted beginning in the summer of 2004. The pipe loop studies will be utilized as a technical tool to refine the corrosion inhibitor dose, pH, inhibitor type and, system control. The pipe loops will be constructed at the Dalecarlia WTP with the testing material consisting of DC W ASA lead service lines (LSL). They will be run in a manner to simulate distribution system operation, and the data will be used to refine the chemical dosages and full-scale operating procedures.
1.1.5 Distribution System Operations Team Monitoring Plan The Distribution System Operations Team's plan is to develop an extensive distribution system monitoring program. The monitoring plan will be used to assess conditions before and after a revised treatment change. Either as a part of that plan, or as a separate monitoring plan, W ASA will design a sampling plan for purposes of assessing extent of the lead levels in homes without lead service lines. The Production Treatment Operations Team will use these data as input into the effectiveness of the revised corrosion control treatment.
1·5
SECTION 2
Treatment Options
2.1 Mechanisms of Corrosion Corrosion in water distribution and home plumbing systems occurs when water chemistry and physical conditions combine to allow one or more of the following corrosion scenarios:
• Uniform Corrosion. Water freely dissolves metals from the pipe surface.
• Concentration Cell Corrosion. Localized anodes (negative apparent charge) and cathodes (positive apparent charge) become established along the pipe wall surface, resulting in the sacrifice of metals at the anodes (formation of dissolved metal species) and reprecipitation of less-soluble metal compounds at the cathodes.
• Galvanic Corrosion. Contact of two dissimilar metal pipe materials, which accelerates the dissolution of the material with the greatest tendency to corrode.
Treatment for corrosion control is typically intended to inhibit dissolution by altering water characteristics such that chemical reactions between the water and the pipe surface favor the formation of a protective layer on the interior pipe walls. The ideal protective coating would have the following characteristics:
• Present throughout the distribution and home plumbing systems.
• Relatively impermeable.
• Resistant to abrupt changes in velocity and/or flow direction.
• Less soluble than the pipe material.
Formation of the protective coating can be accomplished in two ways: precipitation or passivation. The precipitation approach involves altering water chemistry to form insoluble compounds within the water which then adhere to the pipe wall. The passivation approach involves a direct interaction between the pipe wall and the water to promote formation of less-soluble compounds at the pipe surface.
2.2 Treatment Approaches
2.2.1 pH and Alkalinity Adjustment Modification of alkalinity (as a surrogate for dissolved inorganic carbonate) and pH can be used as a passivation technique for controlling soluble lead and copper. The solubility of lead and copper in water is dependent upon the chemical species in which those metals are found. Elemental lead and copper will form complexes with chemical groups such as hydroxyl, carbonate, bicarbonate, orthophosphate, and silicate. The goal of pH and

2
alkalinity adjustment is to promote the formation of less soluble lead and copper complexes. In general, leaching of lead and copper from consumer plumbing can be minimized by elevating water pH. In addition, sufficient alkalinity must be present to serve as a buffer for preventing changes in pH within the distribution system. A common rule of thumb for minimizing the potential for lead corrosion of residential piping and plumbing fixtures is to maintain a minimum alkalinity of 30 mg/L as CaC03 throughout the distribution system.
TABLE 2·1 Washington Aqueduct Characteristics of Common pH, Alkalinity, and Calcium Adjustment Treatment Chemicals
Chemical Formula Method of Feed Effect on Effect on Effect on Notes pH Calcium Alkalinity
Caustic Soda NaOH Bulk storage of Increase None + 1.55 mg/L as pH control difficult 50% liquid CaC03 per mg/L in low-alkalinity
as NaOH. water
Lime Ca(OHh Dry storage Increase Increase +1.21 mg/L as pH control difficult with slurry feed CaC03 per mg/L in low-alkalinity
as Ca(OHh water. Mis-feed of slurry can increase finished water turbidity
Sodium NaHCOs Dry storage Slight None +0.60 mg/L as Way of adjusting Bicarbonate with solution increase CaC03 per mg/L alkalinity, but
feed as NaHCOs expensive because relatively high doses are required.
Soda Ash Na2COs Dry storage Moderate None +0.90 mg/L as More pH increase with solution Increase CaC03 per mg/L than sodium feed as Na2HC03 bicarbonate, but
less expensive.
2.2.2 Calcium Adjustment Adjusting the calcium content and pH of a water is a treatment technique which relies on a precipitation mechanism. This method of corrosion control operates on the theory that a protective layer of calcium carbonate (CaC03)will precipitate on the pipe wall under the proper chemical conditions. The insoluble CaC03 acts as a barrier to the dissolution of lead and copper into the water.
To implement this method of treatment, the CaC03 equilibrium is adjusted to promote the deposition of a slight CaC03layer on pipe walls in the distribution system. Where there is appreciable calcium present in the raw water, this can be accomplished by a simple increase in pH during treatment.
2·2
2- TREATMENT
Reliance on supersaturation of CaC03 in the distribution system can have side effects. Excessive saturation at the point of entry to the distribution system can result in scale buildup, reducing the hydraulic capacity of the pipe network. Changes in pH within the distribution system can result in localized loss of the protective CaC03 coating, or in excessive scale formation. Precipitation of CaC03 in the water system can also result in a measurable increase in finished water turbidity.
2.2.3 Phosphate Inhibitor Addition This method of corrosion control is based on the theory that the addition of phosphate to a finished water will result in the formation of low-solubility lead-phosphate complexes on interior pipe surfaces. The protective layer acts as a barrier to corrosion, reducing dissolution of lead into the water. Copper solubility is not significantly affected by phosphate inhibitors at reasonable dosages.
Phosphate inhibitor products applied to drinking water treatment can be separated into three categories:
• Orthophophates. This is the most common form used for lead control. The simplest source of orthophosphate is phosphoric acid.
• Polyphosphates. Polyphosphates are commonly considered for use as sequestering agents for treatment of groundwaters with low to moderate levels of iron and/or manganese. Their use for lead control is not recommended.
• Orthophosphate/polyphosphate blends. A variety of proprietary blends are available, and are typically applied when multiple treatment objectives need to be met.
The pH range at which orthophosphate is most effective for minimizing lead solubility is 7.4 to 7.8. Above pH 7.8, metal phosphate precipitation can become problematic. Orthophosphate can interact with other cations such as calcium or magnesium which may be present in the water. These interactions represent an orthophosphate demand, which reduces the amount of orthophosphate available to complex with lead.
Because phosphates are most effective over a defined pH range, maintaining stable pH throughout the distribution system is critical to success of a phosphate-based corrosion control program. Commercial phosphate-based inhibitors tend to be acidic solutions, and their effect on finished water pH must also be considered.
2.2.4 Silicate Inhibitor Addition Silicate inhibitors may be added to finished water to form insoluble silicate coatings on pipe interior walls. This technique has been most commonly applied to minimize corrosion of iron from distribution systems. Some data are available documenting improvements in lead and copper corrosion rates with use of these products. However, the use of silicates is generally associated with the corrosion of iron as the primary metal of concern.
2-3

2
2.2.5 Other Corrosion Inhibitor Strategies In addition to the corrosion inhibitors listed above, several other proprietary chemicals are currently marketed in the United States such as Stannous Chloride, Seaquest, etc. However, due to a lack of consistent operational and performance data on similar waters, only corrosion control inhibitors (and strategies) presented in the March, 2003, Revised Guidance Manual for Selecting Lead and Copper Control Strategies, EPA, are considered applicable strategies for the Washington Aqueduct.
2-4

SECfION3
Summary of Corrosion Control Reports
This Section presents summaries of corrosion control associated reports previously contracted by for the Washington Aqueduct. The reports include:
"Corrosion Control Study" June 1994 (contracted for by WA);
"Caustic Soda Feasibility Study", October, 1997 (contracted for by WA);
"Corrosion Inhibitor Study for Dalecarlia and McMillan Treatment Plants"
May ,1998 (contracted for by WA); and
"Review of Washington, DC Corrosion Control Recommendation" December, 1996 (commissioned by EPA).
3.1 Corrosion Control Study, June 1994 The Corrosion Control Study (1994 Report) was prepared for the Washington Aqueduct by ECG, Inc. The 1994 Report consisted of a Preliminary report and Pipe Loop studies. The Preliminary report consisted of two phases:
• Desk-Top Evaluation; and
• Static testing with alternate corrosion inhibitors.
3.1.1 Desk-Top Evaluation The Desk-Top Evaluation was used as a screening tool to evaluate the efficacy of alternate industry accepted corrosion control strategies. This primarily consisted of a literature search and evaluation based on the Washington Aqueduct's raw water quality. The Desk-Top study evaluated the following strategies:
• Alkalinity and pH adjustment;
• Calcium hardness adjustment; and
• Corrosion inhibitor feed including: orthophosphate, polyphosphates and, zinc orthophosphate.
3.1.2 Static Test Evaluation Static tests are often used as alternatives to pipe-loop testing. Static tests provide rapid results, when compared to pipe loops, but generally are not considered to be as accurately controlled as pipe loops. The purpose of static testing in this instance was to select corrosion control strategies to be carried forward for pipe loop testing.
Five corrosion inhibitors were chosen for static testing including:
3·1

CONTROL
• Phosphoric Acid (H3P04);
• 1:3 zinc orthophosphate (1 part by weight zinc to 3 parts by weight orthophosphate);
• 1:10 zinc orthophosphate;
• zinc polyphosphate; and
• sodium silicate.
Lead coupons were immersed in five gallon containers containing five-gallons of Dalecarlia finished water adjusted to pHs of 8.0 (annual system average) and 7.5 (manufacturer's recommended pH). All of the containers were pre-dosed with inhibitors (one per container) at doses of 0.5, 1.0 and, 1.5 mg/L for the phosphate based inhibitors (as P04) and doses of 4.0, 8.0 and, 12.0 mg/L for the sodium based inhibitor (as product). The lead coupons were pre-weighed prior to test initiation and re-weighed at test completion to determine the relative effectiveness of the selected corrosion inhibitors in abating lead corrosion. The five inhibitors were also tested at pH 8.5 to confirm the precipitation of zinc and effectiveness (or lack thereof) of phosphates at the elevated pH level.
3.1.3 Pipe Loop Testing Three pipe loop racks were constructed in the Dalecarlia WTP. Each pipe loop rack consisted of two lead loops constructed in parallel. The loops were constructed of new lead and therefore had no previous scale on the lead pipes' interior. Each pipe loop was constructed to also incorporate two soldered copper loops and two Construction Engineering Research Laboratory (CERL) loops. The CERL loops were included at the influent end of each lead loop assembly for the purpose of metal coupon insertion to evaluate the impact of strategy impact on metal dissolution rate(s). The metal coupons inserted in the CERL loops were composed of mild steel, iron, lead and, copper coupons. As with the static tests, all coupons were pre-weighed prior to test initiation and re-weighed following their removal from the system.
The three pipe loop racks were operated continuously for a period of nine-months and would shut down on a daily basis between the period of 1:00 am until 9:30 am for the purpose of meeting the six hour standing period while also providing a 2.5 hour sample collection period. The six hour standing period follows the method outlined for lead sample collection in EPA's LCR.
The first pipe loop rack was fed a 1:5 zinc orthophosphate at a dose of 1.5 mg/L (as P04). The second pipe loop rack was adjusted to run at a pH of 8.8 to correspond to a CCPP in the 4.0 to 10.0 range which is recommended for corrosion control. The water for the third pipe loop rack was not chemically adjusted and used Dalecarlia finished water as its source.
3.1.4 1994 Study Results The 1994 Study produced the following results:
3.1.4.1 Preliminary Study
• Optimization of pH and alkalinity is directly related to calcium hardness adjustment and calcium carbonate precipitation potential.
3-2

CONTROL REPORTS
• pH should be maintained in the 8.6 to 9.0 range.
• The 1:3 zinc orthophosphate reduced corrosion to a greater degree than the other inhibitors tested during static testing.
3.1.4.2 Pipe Loop Testing • Pipe Loop 1: Addition of a 1:5 Zinc Orthophosphate (Z-OP) at a dosage of 1.5 mg/L
showed a tendency to reduce lead levels to lower values than either the pHIalkalinityIhardnesslcalcium hardness adjustment loop or the control loop. However, random high spikes of lead were observed. The 1994 Report recommended further study to understand the random spikes prior to implementing the Z-OP alternative.
• Pipe Loop 2: Modification of finished water pH to target 8.8. The target pH was previously determined to achieve an optimum calcium carbonate precipitation potential (CCPP) in the 4.0 to 10.0 range. The results of this pipe loop reduced lead levels in eight hour standing samples There were less lead concentration spikes with this pipe loop than the Z-OP loop but more lead spikes than with the control loop. Pipe Loop 2 identified severe calcium carbonate deposition issues associated with increasing the pH to 8.8.
• Pipe Loop 3: Control loop. Utilized unadjusted Dalecarlia finished water. Produced consistently higher lead levels than either Pipe Loop 1 or Pipe Loop 2. Pipe Loop 3 did not produce lead spikes that were observed in Pipe Loops 1 and 2.
3.1.4.3 1994 Report Recommended aCCT The 1994 Report recommended that Washington Aqueduct "rigorously maintain a consistent pH level which would optimize the Langelier's Saturation Index in the positive range, preferably as close to zero as possible, for both the Dalecarlia and McMillan plants. Further, W A should include a twice daily calcium carbonate precipitation potential at the plant and selected sites in the distribution system to monitor the potential extent of precipitation. Because the CCPP range of 4 -10 was determined to be infeasible due to scaling and other problems, it is recommended that the CCPP also be kept positive and very near zero. It is anticipated that maintaining a positive Langelier'S while monitoring the CCPP in the distribution system will passivate the distribution system as well as reduce the tendency for lead to leach."
3.2 Caustic Soda Feasibility Study, October, 1997 The Caustic Soda Feasibility Study (1997 Report) was prepared for the Washington Aqueduct by Malcolm Pimie, Inc. The 1997 Report was conducted to evaluate the use of sodium hydroxide (caustic soda) for pH adjustment instead of the current practice of adding quicklime for finished water pH adjustment. Specifically the 1997 Report addressed the following three issues:
1. Can a higher pH be achieved through the use of caustic soda that will not cause exceedence of the total trihalomethane (TTMH) maximum contaminant level (MCL) or cause excessive post caustic addition precipitation of calcium;
3·3

SUMMARY OF CORROSION CONTROL
2. Determination of the cost of conversion to caustic soda including construction and annual operations and maintenance (O&M) costs; and
3. Associated cost impacts to receiving wastewater treatment plants (WWTPs) due to an increase in pH in potable water.
3.2.1 1997 Report Results The 1997 Report concluded that maintenance of pH 8.5 throughout the year with either caustic soda or quicklime would result in excessive calcium precipitation in the distribution system. The 1997 Report showed that maintaining a pH of 8.5 with quicklime would result in CCPP values of 80 mg/L or above at both the McMillan and Dalecarlia WTPs. The practice of caustic soda addition would result in CCPP levels of 60 mg/L or greater at both WTPs. Although the use of caustic soda would result in lowered CCPP values, when compared to the CCPP values projected through the use of quicklime, the CCPP values would be excessively high. The recommended CCPP range is acknowledged as 4 to 10 mg/L for lead and copper corrosion abatement. Section 4 of the 1997 Report concludes by stating "Because conversion to caustic soda will not enable WA to significantly reduce calcium carbonate deposition while maintaining adequate corrosion control by pH adjustment to 8.5 or above, other corrosion control strategies such as the use of corrosion inhibitors may be more appropriate".
The 1997 Report cited a capital cost of $600,000 (in 1997 dollars) to convert to caustic soda. The chemical cost associated with feeding caustic soda to maintain an annual pH of 8.5 was determined to be approximately $1,300,000 per year versus a chemical cost associated with feeding quicklime to maintain an annual pH of 8.5 that was determined to be approximately $300,000 per year (all chemical costs were developed in 1997 dollars). The use of caustic soda instead of quicklime represents a chemical cost increase of approximately 433-percent.
3.3 Corrosion Inhibitor Study for Oalecarlia and McMillan Treatment Plants, May, 1998
The Corrosion Inhibitor Study for Dalecarlia and McMillan Treatment Plants (1998 Report) was prepared for the Washington Aqueduct by Malcolm Pirnie, Inc. in May ,1998. The 1998 Report was produced to evaluate:
1. The appropriate corrosion inhibitor dose based on a review of: the 1994 Report, a literature review and, standard and accepted water industry practice;
2. Estimated phosphate levels that could be anticipated by the receiving WWTPs should a phosphate based inhibitor be applied. The estimate was developed based on a review of the 1994 Report as well as standard and accepted water industry practice; and
3. Capital and O&M costs associated with the implementation of corrosion inhibitor facilities at both the Dalecarlia and McMillan WTPs.
3.3.1 1998 Report Results Following completion of the three tasks presented above, the 1998 Report concluded:
3·4

OF CORROSION CONTROL
1. No major benefit was observed for the addition of Z-OP compared to orthophosphate (phosphoric acid) in the reduction of lead levels in finished water.
2. Chemical costs for Z-OP are approximately 100-percent greater than chemical costs for phosphoric acid.
3. Phosphoric acid should be used as the preferred corrosion control alternative should the Washington Aqueduct switch to a corrosion inhibitor strategy. Initially the dose should be 1.0 mg/L as phosphate. The 1.0 mg/L dose may be reduced over time while still providing effective corrosion control.
4. Should the Washington Aqueduct switch to the phosphate corrosion control strategy and apply a 1.0 mg/L phosphate dose, the maximum phosphate dose that will arrive at the receiving WWTPs due to phosphate addition at Washington Aqueduct'S WTPs would be 1.0 mg/L. Under the worst scenario this would represent a 10-percent increase in the phosphate levels currently received.
5. Annual O&M costs for initiating a phosphoric acid feed system were determined to be $166,000 and $148,000 per year (1998 dollars) for the Dalecarlia and McMillan WTPs respectively. However, since a phosphoric acid treatment regime would reduce quicklime addition quantity requirements a savings of $30,000 (1998 dollars) per WTP would be recognized.
6. Total estimated capital costs for implementation of phosphoric acid feed were determined to be $350,000 and $220,000 (1998 dollars) for the Dalecarlia and McMillan WTPs respectively.
3.4 Review of Washington, DC Corrosion Control Recommendation December, 1996.
The Review of Washington, DC Corrosion Control Recommendation letter (1996 letter) was prepared by Black and Veatch for EPA Region III in December, 1996. The 1996 letter observed that there are two options for OCCT at Washington Aqueduct:
1. Raise the pH to 9.0; or
2. Maintain a consistent pH in the 7.4 to 7.8 range in the distribution system and add orthophosphate at a dose greater than 3 mg/L. There are secondary concerns associated with each option.
3. Orthophosphate may not be viable due to pH swings in the distribution system. 4. A consistent distribution system pH needs to be maintained regardless of the option
chosen. 5. Orthophosphate addition at a dose greater than 3 mg/L may cause red water problems. 6. Use of orthophosphate is not recommended unless cast iron pipe-loop testing can be
conducted to assess the potential for red water formation.
3-5

3 - SUMMARY OF CORROSION
3.4 OCCT Designation In the case of Washington Aqueduct, EPA approves optimal corrosion control treatment (OCCT) as the primacy agency for the District of Columbia. In June 1994, WA submitted a corrosion control report to EPA. The study evaluated and recommended pH control to maintain a positive Langelier Saturation Index (LSI) for corrosion control as optimal treatment. In 1996, EPA conducted a study that recommended that WA maintain pH at, or above pH 8.5 at all times. On July 16, 1997, EPA granted a conditional OCCT to W A. In Februsry, 2000, EPA made a designation of OCCT for the Washington Aqueduct which required W A to maintain a pH in the finished water between 7.7 and 8.5 while also maintaining a positive LSI. Subsequent studies conducted for W A indicated that maintaining a finished water pH at, or above, pH 8.5 was infeasible due to calcium precipitation. On May 17, 2002, EPA revised its designation of OCCT to meet monthly pH goals as follows:
January pH;;::: 7.7
February pH;;::: 7.8
March pH;;::: 7.6
April pH;;::: 7.6
May pH;;::: 7.5
June pH;;:::7.4
July pH;;::: 7.4
August pH;;::: 7.4
September pH;;::: 7.4
October pH;;::: 7.5
November pH;;::: 7.5
December pH;;::: 7.6
The designation of OCCT has not changed since May 17, 2002.
3-6

SECfION4
Model Description
Water!Pro is a Microsoft Excel macro-based spreadsheet program that is used for determining the impacts of chemical addition on water quality and corrosion indices. The water quality characteristics of a surface water source and chemical addition (type and dosage) are provided by the user as input parameters for individual modeling scenarios. The program uses the input parameters to model the resulting changes in water quality characteristics. Water!Pro may also be used to model how selected corrosion treatment methods may affect the corrosivity of the finished water. Changes in water quality characteristics may cause shifts in the equilibrium of theoretical lead and copper concentrations and corrosion indices.
It is noted that the calculated values of lead and copper presented in the model output are theoretical concentrations that would be reached at equilibrium for new lead & copper pipe (kinetics are not factored into the model). The theoretical lead concentrations are based on assumptions made by the model for lead release and are not system specific. Therefore, the values presented should only be used as "benchmarks." The solubility equations used include chloride & sulfate that can change the solubility state & kinetics of the water. For lead (controlling solids): Cerussite PbC03and hydrocerussite Pb3(C03h(OHh are the controlling solids in the pH range of 5-12. Hydroxypyromorphite Pbs(P04)30H is considered if orthophosphate is added. For copper (controlling solids): Malachite CU2(OHh(C03), cupric hydroxide Cu(OHh, tenorite CuO, and cupric phosphate CU3(P04h*2H20 as the controlling solids in the pH range of 6-11. Waterpro uses Cu(OHh as the controlling solid before treatment, and Cu(OHh and CU3(P04h*2H20 (if orthophosphate is used) as the controlling solids after treatment. Actual
Table 4-1 and 4-2 highlight the available input and output parameters, respectively, used by Water!Pro.
4·1

4 - MODEL DESCRIPTION
TABLE 4·1 Washington Aqueduct
Initial Water Quality Parameters Chemical Addition (type and dosage) Parameters
Total Dissolved Solids (TDS)
Total Calcium
Total Alkalinity
PH
Temperature (water and field)
Lime, Ca(OH)2
Quicklime, CaO
Soda Ash
Caustic Soda
Sulfuric Acid
Orthophosphate
Aluminum Sulfate
Ferric Sulfate
Chlorine Gas
Hydrofluosilicic Acid
TABLE 4·2 Washington Aqueduct Water!Pro Example Output Parameters
Finished Water Quality Parameters
Total Alkalinity
PH
Total Calcium
Carbon Dioxide
Final Dissolved Inorganic Carbon (DIC)
Copper II
Lead II
Calcium Carbonate Precipitation Potential (CCPP)
4·2

4
4.1 Model Development Water!Pro, version 2.S2, was used for the modeling scenarios evaluated in this technical memorandum.
The modeling scenarios were performed using a range of initial water quality characteristics and chemical addition (type and dosage) to meet target pH values of theoretical distribution system water. The model scenarios were performed in two sets comprised of (a) without orthophosphate and (b) with orthophosphate (i.e. corrosion inhibitor).
4.1.1 Model Runs Without Orthophosphate Approximately SOD Water!Pro model runs were performed using varying initial water quality characteristics and chemical addition, without orthophosphate (i.e. without addition of a corrosion inhibitor). The dosage of chemicals for pH adjustment required to meet target finished water pH values of 8.0,8.2,8.4,8.6,8.8, and 9.0 were determined in the model runs. The chemicals used for pH adjustment consisted of Quicklime, Caustic Soda, and SO% Quicklime/SO% Caustic Soda (i.e. required dose of Quicklime to reach a pH halfway between the initial pH and target pH, and required dose of Caustic Soda to complete pH adjustment to the target pH).
Table 4-3 presents the range of influent water quality characteristics and chemical addition evaluated in this set of model runs without orthophosphate.
4.1.2 Model Runs With Orthophosphate Approximately 100 Water!Pro model runs were performed using varying initial pH and alkalinity, with orthophosphate (i.e. corrosion inhibitor) doses of 1.0, 2.0 and 3.0 mg/L. The doses of chemicals for pH adjustment required to meet a target theoretical distribution system pH value of 7.7 were determined in the model runs. As in the previous model runs without orthophosphate, the chemicals used for pH adjustment consisted of Quicklime, Caustic Soda, and SO% Quicklime/SO% Caustic Soda.
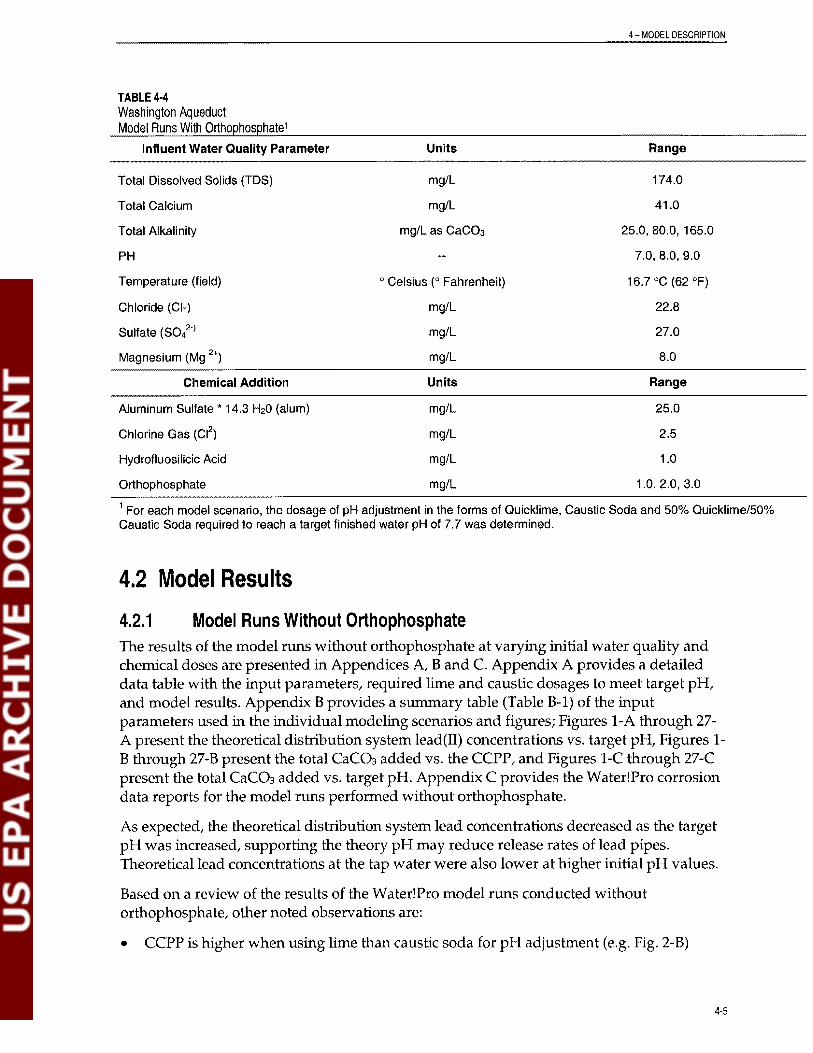
Table 4-4 presents the values of influent water quality characteristics and chemical addition evaluated in this set of model runs with orthophosphate.
4·3

4-MODEL
TABLE 4·3 Washington Aqueduct
Influent Water Quality Parameter Units Range
Total Dissolved Solids (TDS)
Total Calcium
Total Alkalinity
PH
Temperature (field)
Chloride (CI·)
Sulfate (S04 2.)
Magnesium (Mg 2+)
mg/L
mg/L
mg/L as CaC03
° Celsius (0 Fahrenheit)
mg/L
mg/L
mg/L
99.0,174.0
13.0, 41.0, 64.0
25.0, 80.0, 165.0
7.0,8.0,9.0
0.56° C (33 OF), 16.7 °C (62 OF), 33° C (91.4 OF)
7.2,22.8,58.3
16.0,27.0
4.0,8.0
Chemical Addition Units Range
Aluminum Sulfate' 14.3 H20 (alum) mg/L 10.0, 25.0, 75.0
Chlorine Gas (C12) mg/L 1.0, 2.5, 4,0
Hydrofluosilicic Acid mg/L 1.0
1 For each model scenario, the dosage of pH adjustment in the forms of Quicklime, Caustic Soda and 50% Quicklime/50% Caustic Soda required to reach a target pH of 8.0, 8.2, 8.4, 8.6, 8.8 and 9.0 was determined. 2 Every possible combination of varying influent water quality parameters and chemical addition was not evaluated based on results of sensitivity analysis. Actual scenarios that were modeled are presented in Appendix A.
4·4
4 - MODEL DESCRIPTION
TABLE 4·4 Washington Aqueduct
Influent Water Quality Parameter Units Range
Total Dissolved Solids (TDS)
Total Calcium
Total Alkalinity
PH
mg/L
mg/L
mg/L as CaC03
174.0
41.0
25.0, 80.0, 165.0
7.0, 8.0, 9.0
Temperature (field)
Chloride (CI-)
Sulfate (SO/·)
Magnesium (Mg 2+)
° Celsius (0 Fahrenheit)
mg/L
mg/L
mg/L
16.7 °C (62 OF)
22.8
27.0
8.0
Chemical Addition Units Range
Aluminum Sulfate' 14.3 H20 (alum) mg/L 25.0
Chlorine Gas (C12) mg/L 2.5
Hydrofluosilicic Acid mg/L 1.0
Orthophosphate mg/L 1.0. 2.0, 3.0
1 For each model scenario, the dosage of pH adjustment in the forms of Quicklime, Caustic Soda and 50% Quicklime/50% Caustic Soda required to reach a target finished water pH of 7.7 was determined.
4.2 Model Resu Its
4.2.1 Model Runs Without Orthophosphate The results of the model runs without orthophosphate at varying initial water quality and chemical doses are presented in Appendices A, B and C. Appendix A provides a detailed data table with the input parameters, required lime and caustic dosages to meet target pH, and model results. Appendix B provides a summary table (Table B-1) of the input parameters used in the individual modeling scenarios and figures; Figures I-A through 27A present the theoretical distribution system lead(II) concentrations vs. target pH, Figures 1B through 27-B present the total CaC03 added vs. the CCPP, and Figures 1-C through 27-C present the total CaC03 added vs. target pH. Appendix C provides the Water!Pro corrosion data reports for the model runs performed without orthophosphate.
As expected, the theoretical distribution system lead concentrations decreased as the target pH was increased, supporting the theory pH may reduce release rates of lead pipes. Theoretical lead concentrations at the tap water were also lower at higher initial pH values.
Based on a review of the results of the Water!Pro model runs conducted without orthophosphate, other noted observations are:
• CCPP is higher when using lime than caustic soda for pH adjustment (e.g. Fig. 2-B)
4-5

4 - MODEL nC"'~OOD·T,m'
• A higher dose of lime, than caustic soda, is required for a given pH increase (e.g. Fig. 1
C)
• Sulfuric acid was not required for pH adjustment at the tested conditions
• Higher initial alkalinity results in higher theoretical distribution system lead
concentrations (e.g. Fig. 3-A, vs. Fig. i-A and 2-A)
• An increase in alum dosage did not appear to affect theoretical distribution system lead
concentrations (e.g. Fig. 5-A vs. Fig. i-A)
• An increase in chlorine dosage did not appear to affect theoretical distribution system
lead concentrations (e.g. Fig. 9-A vs. Fig. 7-A)
• Higher temperature results in higher theoretical distribution system lead concentrations
(e.g. Fig. ll-A vs. Fig. i-A)
• Higher initial total calcium concentration had a negligible effect on the theoretical
distribution system lead concentration (e.g. Fig. 17-A, vs. Fig. ll-A)
• Higher initial alkalinity results in higher CCPP (e.g. Fig. 2-B)
• As initial alkalinity increases, a greater lime and/or caustic soda dose is required for pH
adjustment (e.g. Fig. 4-C, vs. Fig. l-C)
• As the alum dosage is increased, a greater lime and/or caustic soda dose is required for
pH adjustment (e.g. Fig. 1-C, vs. Fig. 4-C)
• As the temperature increases, a greater lime and/or caustic soda dose is required for pH
adjustment (e.g. Fig. 27-C, vs. Fig. 14-C)
4.2.2 Model Runs With Orthophosphate The results of the model runs with orthophosphate at varying dosages and varying initial alkalinity and pH are presented in Appendices D, E, and F. Appendix D provides a detailed data table with the input parameters, required lime and caustic dosages to meet target pH, and model results. Appendix E provides a summary table (Table E-l) of the input parameters used in the individual modeling scenarios and figures; Figures E-l through E-9 present the finished water lead(lI) concentration vs. orthophosphate dosage. Appendix F provides the Water!Pro theoretical lead concentration data reports for the model runs performed with orthophosphate.
Based on a review of the results of the Water!Pro model runs conducted with orthophosphate, it is apparent that orthophosphate reduces lead(lI) concentrations in the distribution system water. The lowest lead concentrations were observed for the runs with low initial alkalinity (25 mg/L) and high initial pH (9.0). Conversely, the highest lead concentrations were observed for the runs with high initial alkalinity (165 mg/L) and low pH (7.0).
4-6
4
Other noted observations are the following:
• At increased initial pH, there is slightly less lead in the theoretical distribution system water (e.g. Fig. C-3, vs. Fig. C-l and C-2)
• At increased initial alkalinity, there is a significant increase in the theoretical distribution system finished water lead concentrations (e.g. Fig. C-6, vs. C-5)
• At increased initial pH, there is a decrease in the theoretical distribution system water lead concentrations (e.g. Fig. C-9, vs. Fig. C-8)
4-7

SECTION 5
Recommendations
This section presents the recommended course of action for the Washington Aqueduct for additional testing and potential treatment upgrades to reduce lead corrosion rates recently observed in the DC W ASA distribution system. The recommendations are based on reviews of previously documented studies conducted for the Washington Aqueduct (the 1994, 1997and, 1998 Reports) discussed in Section 3.0 of this report, mathematical modeling of corrosion abatement strategies conducted for this report, a review of similar drinking water facilities, and water treatment industry accepted corrosion control practices.
5.1 Full-Scale Treatment The 1994 Report recommended further investigation of pH adjustment to a finished water pH of 8.8 as a potential corrosion control strategy. However, the 1994 Report cited that severe calcium precipitation would result from implementation of this strategy. The 1997 Report observed that adjustment of finished water to a pH of 8.5 would result in excessive calcium precipitation. Mathematical modeling conducted for this Report (2004 Report) that investigated corrosion control strategies found that adjustment of finished water pH to 8.5 results in severely heightened CCPP levels indicating that excessive calcium precipitation will occur. Therefore, it is the conclusion of this Report that pH adjustment to pH 8.8 yearround is not an option for the Washington Aqueduct.
The 1994 Report recommended that the Washington Aqueduct pursue either pH adjustment or Z-OP addition as a preferred corrosion control strategy. The 1998 Report found that there was no inherent benefit of feeding Z-OP as a preferred alternative to phosphoric acid. The findings of the mathematical modeling conducted for the 2004 Report found that the addition of phosphoric acid reduced theoretical lead (II) levels. As stated previously It is noted that the calculated values of lead and copper presented in the model output are theoretical concentrations that would be reached at equilibrium for new lead & copper pipe (kinetics are not factored into the model). The theoretical lead concentrations are based on assumptions made by the model for lead release and are not system specific. Therefore, the values presented should only be used as "benchmarks." The solubility equations used include chloride & sulfate that can change the solubility state & kinetics of the water. For lead (controlling solids): Cerussite PbC03and hydrocerussite Pb3(C03h(OHh are the controlling solids in the pH range of 5-12. Hydroxypyromorphite Pbs(P04)JOH is considered if orthophosphate is added. For copper (controlling solids): Malachite CU2(OHh(C03), cupric hydroxide Cu(OH)z, tenorile CuO, and cupric phosphate CU3(P04)z*2H20 as the controlling solids in the pH range of 6-11. Waterpro uses Cu(OHh as the controlling solid before treatment, and Cu(OH)z and CU3(P04)z*2H20 (if orthophosphate is used) as the controlling solids after treatment. While the lead solids assumed by the model may not be the identical solid that forms we orthophosphate is used as the inhibitor, we believe it is representative of the solid that will form on the pipe wall in the DC W ASA
5·1

5· RECOMMENDATIONS
distribution system. The modeling results indicate a significant reduction in lead (II) levels with the addition of phosphoric acid.
Phosphoric acid addition for corrosion control is widely used throughout the United States and Canada. It has been used for many years as a reliable, known and, safe chemical additive that has been shown to reliably reduce lead and copper corrosion. However, the amount of time to reach the desired results (lead levels diminished below regulatory requirements) can vary considerably. In Winnipeg the addition of phosphoric acid reduced lead levels below the Canadian limit within 15-months. Detroit and Milwaukee were in compliance with the LCR approximately one-year after the initiation of phosphoric acid feed. In addition to Detroit, Milwaukee and Winnipeg, other utilities using phosphoric acid for corrosion control include: Norfolk, VA; Yonkers, NY; Makawao, Maui; Vassaris Water,\; and others. Orthophosphate appears to be the best inhibitor for Washington Aqueduct. In order to verify that adverse effects will not occur when it is applied, it is recommended that the Washington Aqueduct and DC WASA conduct a partial system application using phosphoric acid in the 4th High portion of the DC WASA distribution system. The 4th High section of DC W ASA' a distribution system is representative of the entire system in terms of materials (LSLs, unlined cast iron pipe, etc.) The temporary chemical feed facility should be located at DC W ASA' s Fort Reno pumping Station which is the entry point the the 4th High portion of the distribution system. The partial system application should be conducted for a period of three (3) months commencing on or about June 1, 2004 and ending on or about August 31,2004. At test start-up it is recommended that phosphoric acid be fed at a concentration of 1.0 mg/L as phosphate. Following the first seven (7) days of operation it is recommended that the dose be increased to 2.0 mg/L and following the first fourteen (14) days of operation the dose should be increased to 3.0 mg/L for the duration of the test. The step-wise increase in chemical dose will achieve two goals:
1. Prevent "system shock" which could adversely impact distributed water aesthetics; and
2. Achieve a higher, yet safe, dose of orthophosphate over a relatively short period of time that could accelerate the positive effects of corrosion inhibitor addition.
The addition of phosphoric acid will depress pH. Some examples of estimated pH change due to phosphoric acid addition are presented in Table 5-1.
5·2

5·
TABLE 5·1 Washington Aqueduct Effect of Phosphoric Acid on Finished Water pH
Finished Water pH =8.4
Resulting pH at Fourth High:
Alkalinity
120
100
80
60
Finished Water pH =8.0
Resulting pH at Fourth High:
Alkalinity
120
100
80
60
3
7.81
7.74
7.65
7.52
3
7.63
7.58
7.51
7.42
P04 3· dose (mg/L)
2
7.97
7.9
7.82
7.71
8.16
8.11
8.05
7.97
P04 3 . dose (mg/L)
2
7.74 7.86
7.7 7.83
7.64 7.79
7.56 7.74
Since phosphoric acid addition will sufficiently depress pH within the recommended range, the Washington Aqueduct should operate targeting traditional seasonal pH levels. This will result in the 4th High water being in the industry accepted range for phosphoric acid addition at pH 7.4 to 7.S.
During the 4th High application, it is recommended that the Washington Aqueduct prepare to initiate a full-system application of phosphoric acid feed to begin on or about September 1, 2004. The full-scale application requires that temporary phosphoric acid feed facilities be planned and constructed at the Dalecarlia and McMillan WTPs. During the fullsystem application finished water pH levels should be maintained at pH 7.5. At full-system test start-up it is recommended that phosphoric acid be fed at a concentration of 1.0 mg/L as phosphate. Following the first seven (7) days of operation it is recommended that the dose be increased to 2.0 mg/L and following the first fourteen (14) days of operation the dose should be increased to 3.0 mg/L. The step-wise increase in chemical dose will achieve two goals as noted in the partial system test:
1. Prevent "system shock" which could adversely impact distributed water aesthetics; and
2. Achieve a higher, yet safe, dose of orthophosphate over a relatively short period of time that could accelerate the positive effects of corrosion inhibitor addition.
5·3
5·
During the full-scale system application of phosphoric acid, feed levels may be decreased following reduction of lead concentrations that achieve the LCR action level of 15 parts per billion lead in the 90th percentile samples.
5.2 Pilot-Scale Testing As soon as possible, it is recommended that the Washington Aqueduct should plan, design, construct and implement a pilot-scale testing program to incorporate pipe loops fabricated from harvested DC WASA LSLs. Harvested LCLs should be used to best represent the condition of existing chemistry in the DC W ASA distribution system. The pipe loop study will be beneficial in optimizing full-scale inhibitor feed rates and therefore, effectively reduce full-scale corrosion while minimizing treatment costs.
The following pipe racks were recommended in the Action Plan:
• Rackl: Control Rack - Dalecarlia finished water;
• Rack 2: Filtered water w / chloramines, a pH adjusted to 7.7 and orthophosphate;
• Rack 3: Filtered water w / chloramines at a dose of 2.5 mg/L total chlorine, a pH adjusted to 7.7 and orthophosphate;
• Rack 4: Filtered water w / chloramines at a dose of 2.0 mg/L total chlorine, a pH adjusted to 7.7 and orthophosphate;
• Rack 5: Filtered water w / chloramines at a dose of 2.5 mg/L total chlorine, a pH adjusted to 8.4 (or some other high pH) and orthophosphate.
The modified Racks were designed to address the following questions:
1. Does tight pH control help reduce lead corrosion? (rack 1 versus rack 2)
2. Do lower chloramine levels reduce lead concentrations?
In an attempt to compile a final list of Rack conditions that is most relevant to the current corrosion control plan, a new list of 3 fundamental questions were subsequently developed. These racks were designed to address the following questions
1. Does tight pH control help reduce lead corrosion?
2. Do lower chloramine levels reduce lead concentrations?
3. What is the optimum phosphate dose for the long term (i.e., what is the minimum effective corrosion control chemical dose that can be fed once the system is passivated)?
The minimum number of pipe racks required to address these questions are as follows:
• Rack 1: Control- Dalecarlia finished water (pH control with lime), maintain pH at 7.5 +/ - 0.3 units, with phosphate addition;
• Rack 2: Filtered water adjusted to same conditions as Rack Condition I, but control pH to within + / - 0.1 units of pH = 7.7 with caustic. Add phosphate. Once lead levels stabilize (after 6 months + / -), lower phosphate dose until optimum dose is determined;
5-4

5·
• Rack 3: Filtered water adjusted to a chloramine dose of 2.5 mg/L, as total chlorine, control pH to within + / - 0.1 units of pH = 7.7 with caustic. Add phosphate. Once lead levels stabilize (after 6 months + / -), lower phosphate dose until optimum dose is determined.
As assumed in the previous pipe loop plans, each operating condition (pipe rack) will be run on three lead pipe loops. This approach will assure that the data obtained is statistically valid. This translates into a total of nine (9) lead pipe loops.
It is recommended that the Washington Aqueduct initiate the three pipe rack system described above to evaluate long-term chemistry impacts and optimize corrosion inhibition.
5·5

SECTION 6
6 Peer Review
A peer review committee (PRC) was assembled by EPA to provide technical review of the approach to, and implementation of, the recommended corrosion control strategy. PRC comments to Sections 1.0 through 5.0 of this report are presented in Section 6.1.
6.1 Peer Review Committee Recommendations Following PRC review of this report, comments were forwarded to EPA for distribution to the Washington Aqueduct for consideration. The PRC developed the following four major comments:
1. Consider using zinc orthophosphate (ZOP) for both the partial system (4th High) and full-scale tests. It was the opinion of the PRC that ZOP is a proven corrosion inhibitor that is also currently successfully used for corrosion inhibition on Potomac River water. It has also been suggested that, following full-scale corrosion passivation, the Washington Aqueduct could convert to phosphoric acid.
2. Begin feeding ZOP at a high dose (5 mgL as P04) instead of the ramping-up recommendation suggested by this report in Section 5.0. It was the opinion of the PRC that a high initial dose of ZOP to rapidly passivate the system and thereby minimize potential red water impacts.
3. The PRC recommended that W ASA operate the partial system test in a narrow pH range to target pH 7.7 with a variance of 0.1 unit + / -. Further, it was recommended that W ASA consider installing an automated caustic soda feed system to maintain a pH of 7.7.
4. Consider flushing the system(s) during the initial period of corrosion inhibitor application. It was the opinion of the PRC that flushing in this manner (not a directional flushing program) will allow the corrosion inhibitor to get to all areas of the system more rapidly and, in greater quantity. The PRC also suggested that this type of flushing would assist in reducing potential red water problems.
6.2 Response to PRC Recommendations In light of the PRe recommendations, the Washington Aqueduct proposes the following:
1. The Washington Aqueduct proposes to use zOP initially with the ability to later convert to phosphoric acid.
2. The chemical feed equipment currently designed by the Washington Aqueduct is capable of feeding ZOP at a dose of 5 mg/L (asP04). The Washington Aqueduct proposes to feed zinc orthophosphate at a dose required to achieve 3 mg/l P04 in the distribution system and reduce the dose as improving water quality data allows.
6-1

6- PEER
3. The Washington Aqueduct is currently evaluating their lime slaking/feed facilities at the Dalecarlia and McMillan WTPs. By June 1 the Washington Aqueduct will implement limited improvements to the existing lime system to optimize the ability to control pH stability. It is anticipated that this will result in both plants being able to maintain pH leaving the plants at the target + / - 0.3 pH units. The Washington Aqueduct will then study means of optimizing pH stability leaving the plants and will assess necessary capital improvements to make the recommended changes. It is anticipated that this will result in both plants being able to maintain pH leaving the plants at the target + / - 0.2 pH units or possibly + / - 0.1 pH units, assuming that adequate language concerning excursions is included in water quality parameter requirements.
As for pH control in the 4th high partial system application, the Washington Aqueduct proposed to set a target pH leaving the plant at 7.9. This will result in an anticipated pH in the 4th high distribution system in the range suggested, based on 3 mg/l P04 as ZnoP. This will also meet current OCCT for the remainder of the distribution system for the duration of the 4th high partial system application.
4. Due to the size of the W ASA distribution system and, because of the June 1 st , 2004 Partial System application start-up, it is recommended that the flushing program continue at a heightened pace.
6·2

Appendices A through F are provided on CD-ROM