detailed analysis of fires attended by fire and rescue ... · 2016/17, and was by far the ... mains...
TRANSCRIPT
0
Detailed analysis of fires attended by fire and rescue services, England, April 2016 to March 2017
Statistical Bulletin 16/17
12 October 2017

Contents
1 Key facts ............................................................................................................. 1
2 Introduction ........................................................................................................ 2
3 Overview of incidents attended ........................................................................ 4
Trends in all incidents ........................................................................................... 4
Fires attended ...................................................................................................... 5
4 Fire-related fatalities and casualties ................................................................. 6
Fire-related fatalities and casualties by gender and age ...................................... 6
Causes of deaths and injuries .............................................................................. 9
5 Extent of fire damage ....................................................................................... 10
6 Causes of dwelling fires and fire-related fatalities ........................................ 11
Sources of ignition in accidental dwelling fires ................................................... 11
Main cause of, and material mainly responsible for, dwelling fires ..................... 12
7 Smoke alarm function ...................................................................................... 13
Smoke alarms in dwelling fires ........................................................................... 13
Fire-related fatalities and non-fatal casualties by smoke alarm function ............ 14
8 Temporal and seasonal fire analyses ............................................................. 17
Temporal fire analyses ....................................................................................... 17
Seasonal fire analyses ....................................................................................... 17
9 Further information .......................................................................................... 19
1
1 Key facts
This release presents detailed statistics on fire incidents which covers the financial year
2016/17 (1 April 2016 to 31 March 2017) for fire and rescue services (FRSs) in England.
These statistics do not cover the tragic events at Grenfell Tower on 14 June 2017.
The results show:
There were 558,963 incidents attended by FRSs in 2016/17. Of these incidents,
around 161,770 (29%) were fires. This is a decrease of 0.3 per cent since 2015/16
and less than half compared with ten years ago (336,233 in 2006/07). The total
number of fires attended by FRSs has been broadly level since 2012/13.
In 2016/17 there were 261 fire-related fatalities and 7,081 non-fatal casualties in
fires. For every million people in England, there were 4.7 fire-related fatalities in
2016/17. The fatality rate for older people was higher than for the total population:
9.7 per million people for those 65 to 79 years old and 19.8 for those 80 years and
over.
Smokers’ materials (such as cigarettes, cigars or pipe tobacco) were the source of
ignition in six per cent of accidental dwelling fires and eight per cent of accidental
dwelling fire non-fatal casualties in 2016/17. In contrast, smokers’ materials were the
source of ignition in 36 per cent of fire-related fatalities in accidental dwelling fires in
2016/17, and was by far the largest ignition category involved in accidental dwelling
fire-related fatalities.
Cooking appliances were the source of ignition in 49 per cent of accidental dwelling
fires and 50 per cent of non-fatal casualties in accidental dwelling fires in 2016/17,
and was by far the largest ignition category. In contrast, in 2016/17, there were only
nine per cent of accidental dwelling fire-related fatalities where the source of ignition
was cooking appliances.
Fires where a smoke alarm was not present accounted for 27 per cent (8,100) of all
dwelling fires and 36 per cent (77) of all dwelling fire fatalities in 2016/17. This is in
the context of 11 per cent of dwellings not having a working smoke alarm in 2015/16
(the latest year for which data are available).
Mains powered smoke alarms continue to have a lower “failure rate” than battery
powered alarms. Twenty-one per cent of mains powered smoke alarms and 39 per
cent of battery powered smoke alarms failed to operate in dwelling fires in 2016/17 in
England.
2
2 Introduction
Headline figures on incidents attended by fire and rescue services (FRSs) in England and
fire-related fatalities and casualties in 2016/17 were published in ‘Fire and rescue incident
statistics’ on 10 August 2017.
This release provides more detailed analysis of fire incidents attended by FRSs in 2016/17,
including detailed breakdowns of fatalities and casualties, the causes of fires, the functioning
of smoke alarms in fires and the seasonality and temporality of fires. Additionally, this
publication includes details on the average area of fire damage which was previously
included in the ‘Fire incident response times’ release.
Further analyses of these statistics are concurrently published in ‘Focus on trends in fire
incidents and fire-related fatalities’, which uses data from this release to explore the historical
trends in the numbers of fires and fire-related fatalities. It summarises the main trends and
considers a number of factors – including increased preventative and safety measures,
legislative changes, societal trends and changes in behaviour – which may have contributed
to these trends. The data in this report are supplemented by publicly available information
from other organisations, such as the Office for National Statistics, to highlight some of the
factors which may have influenced fire trends including reductions in smoking, decreases in
arson and increases in smoke alarm ownership.
Previously, detailed statistics on all types of incidents attended by FRSs were published in
‘Fire Statistics: England’, which has now been replaced by this release covering fire incidents
and a new release on non-fire incidents due to be published in Winter 2017/18.
As this publication covers the period 1 April 2016 to 31 March 2017 it does not include data
on the tragic fire at Grenfell Tower on 14 June 2017. The first of our publications to include
this will be ‘Fire and rescue incident statistics: England, July 2016 to June 2017’, scheduled
for publication on 9 November 2017.
Prior to the 2014/15 release this publication covered Great Britain. However, after a survey of
‘Fire Statistics: Great Britain’ users, it was decided to change the scope of the release to
reflect user needs. Commentary on national comparisons between England, Scotland and
Wales was included in the 2015/16 ‘Fire Statistics: England’, but Scotland figures for 2016/17
are not yet available and will be included in the next Fire and Rescue Incident Statistics
publication, scheduled for release on 9 November 2017. The latest statistical releases on the
Scottish and Welsh fire and rescue services can be found on the following websites:
http://www.firescotland.gov.uk/about-us/fire-and-rescue-statistics.aspx
http://gov.wales/statistics-and-research/fire-statistics/?lang=en
Each time a fire and rescue service (FRS) attends an incident in England, details of that
incident are uploaded to the Home Office’s Incident Recording System (IRS) by the FRS.
As the Incident Recording System (IRS) is a continually updated database, the statistics
published in this release may not match those held locally by FRSs and revisions may occur
in the future. This may be particularly relevant for fire-related fatalities where a coroner’s
report could lead to revisions in the data some time after the incident. The figures in this

3
release refer to records of incidents which had reached the IRS by 7 June 2017, when the
database was “frozen”. More information on the IRS can be found at:
www.gov.uk/government/publications/incident-recording-system-for-fire-and-rescue-
authorities
Numbers quoted in the commentary for the longer term trend are rounded to the nearest
thousand (incidents) or hundred (non-fatal casualties), whereas numbers in bullet points are
quoted unrounded.
This publication is accompanied by reference data tables. All fire statistics tables can be
found at:
www.gov.uk/government/statistical-data-sets/fire-statistics-data-tables
The following tables have been updated as part of this publication:
Incidents attended: 0101, 0103
Dwelling fires attended: 0201, 0203, 0204
Non-dwelling fires attended: 0304, 0305
Fatalities and casualties: 0501, 0503, 0504, 0505, 0506, 0507
Cause of fire: 0601, 0602, 0603, 0604, 0605
Smoke alarms: 0702, 0703, 0704, 0705, 0706, 0707, 0708
Temporal and seasonal: 0801, 0802

4
3 Overview of incidents attended
The Fire and Rescue Incident Statistics publication gives more information on types of and
trends in fires, non-fire incidents and fire false alarms attended by fire and rescue services
(FRSs). Key points are included here for background to the following chapters.
Trends in all incidents
In 2016/17, FRSs in England attended around 559,000 incidents, six per cent more than in
2015/16 (530,000) and eight per cent fewer than in 2011/12 (607,000). The number of
incidents has been on a general downward trend since the peak of around 1,016,000
incidents attended in 2003/04, levelling off between 2012/13 and 2014/15, then increasing in
the last two years. These increases were mainly driven by higher numbers of non-fire
incidents attended. (Source: FIRE0101).
Of the total incidents attended in 2016/17 around 162,000 (29%) were fires, around 224,000
(40%) were false alarms and around 174,000 (31%) were non-fire incidents (also known as
special service incidents). Non-fire incidents attended in England increased by 14 per cent
since 2015/16 (153,000) and this marks the first time that FRSs have attended more non-fire
incidents than fires. (Source: FIRE0102).
Box 1: Types of fire as recorded in the Incident Recording System
- Primary – more serious fires that cause harm to people or damage to property.
To be categorised as primary these fires must either: be a fire that occurred in a
(non-derelict) building, vehicle or outdoor structure, be a fire that involved
fatalities, casualties or rescues, or be a fire that was attended by 5 or more
pumping appliances.
- Secondary – are generally small outdoor fires, not involving people or property.
- Chimney fires – are fires in buildings where the flame was contained within the
chimney structure, and did not meet any of the criteria for primary fires.
The IRS also captures the motive for a fire, which is recorded as either accidental,
deliberate or unknown. Those recorded as unknown are included in the accidental
category for the purposes of this report. Accidental fires are therefore those where the
motive for the fire was presumed to be accidental or is unknown. Deliberate fires include
those where the motive was ‘thought to be’ or ‘suspected to be’ deliberate and includes
damage to own or other’s property. These fires are not the same as (although include)
arson, which is defined under the Criminal Damage Act of 1971 as ‘an act of attempting
to destroy or damage property, and/or in doing so, to endanger life’.

5
Fires attended
The total number of fires attended by FRSs decreased for around a decade, falling from
474,000 in 2003/04 to 154,000 in 2012/13. Since then the total number of fires has been
broadly stable, ranging from 155,000 (in 2014/15) to 171,000 (in 2013/14), while 162,000 in
2016/17 was a decrease of less than one per cent since 2015/16.
In 2016/17, 22,032 deliberate primary fires were attended by FRSs, an increase of 14
per cent since 2015/16 (19,369) largely driven by an increase of 25 per cent in
deliberate road vehicle fires since 2015/16 and, to a much lesser extent, deliberate
dwelling fires (3% increase). (Source: FIRE0401)
There were 30,296 dwelling fires attended in 2016/17. This was a decrease of three
percent from 2015/16, a 14 per cent decrease compared with five years ago in
2011/12 (35,401) and a decrease of 32 per cent compared with ten years ago in
2006/07 (44,422). (Source: FIRE0102)
There were 82,746 secondary fires attended in 2016/17. This was a decrease of two
per cent compared with the previous year (84,588 in 2015/16), a 37 per cent
decrease compared with five years ago (131,118 in 2011/12) and a 59 per cent
decrease compared with ten years ago (201,551 in 2006/07). (Source: FIRE0102)
6
4 Fire-related fatalities and casualties
As the Incident Recording System (IRS) is a continually updated database, the statistics
published in this release may not match those held locally by FRSs and revisions may occur
in the future (see Introduction for further detail). This may be particularly relevant for fire-
related fatalities where a coroner’s report could lead to revisions in the data some time after
the incident.
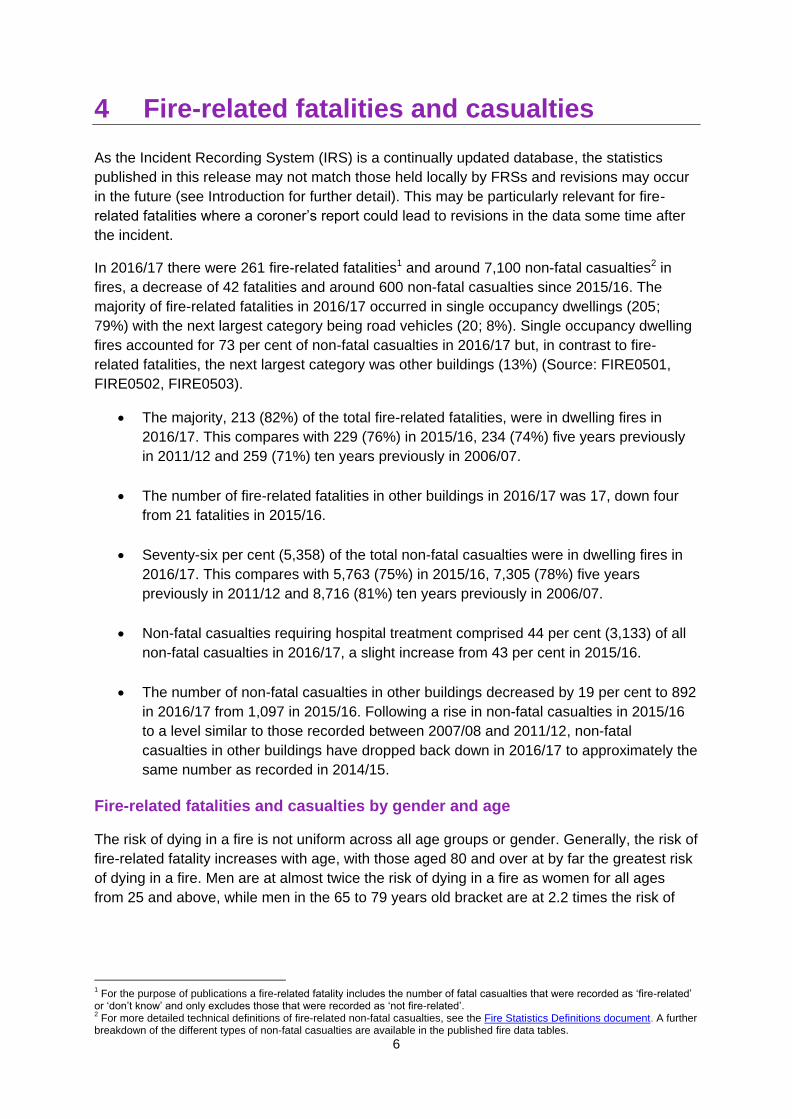
In 2016/17 there were 261 fire-related fatalities1 and around 7,100 non-fatal casualties2 in
fires, a decrease of 42 fatalities and around 600 non-fatal casualties since 2015/16. The
majority of fire-related fatalities in 2016/17 occurred in single occupancy dwellings (205;
79%) with the next largest category being road vehicles (20; 8%). Single occupancy dwelling
fires accounted for 73 per cent of non-fatal casualties in 2016/17 but, in contrast to fire-
related fatalities, the next largest category was other buildings (13%) (Source: FIRE0501,
FIRE0502, FIRE0503).
The majority, 213 (82%) of the total fire-related fatalities, were in dwelling fires in
2016/17. This compares with 229 (76%) in 2015/16, 234 (74%) five years previously
in 2011/12 and 259 (71%) ten years previously in 2006/07.
The number of fire-related fatalities in other buildings in 2016/17 was 17, down four
from 21 fatalities in 2015/16.
Seventy-six per cent (5,358) of the total non-fatal casualties were in dwelling fires in
2016/17. This compares with 5,763 (75%) in 2015/16, 7,305 (78%) five years
previously in 2011/12 and 8,716 (81%) ten years previously in 2006/07.
Non-fatal casualties requiring hospital treatment comprised 44 per cent (3,133) of all
non-fatal casualties in 2016/17, a slight increase from 43 per cent in 2015/16.
The number of non-fatal casualties in other buildings decreased by 19 per cent to 892
in 2016/17 from 1,097 in 2015/16. Following a rise in non-fatal casualties in 2015/16
to a level similar to those recorded between 2007/08 and 2011/12, non-fatal
casualties in other buildings have dropped back down in 2016/17 to approximately the
same number as recorded in 2014/15.
Fire-related fatalities and casualties by gender and age
The risk of dying in a fire is not uniform across all age groups or gender. Generally, the risk of
fire-related fatality increases with age, with those aged 80 and over at by far the greatest risk
of dying in a fire. Men are at almost twice the risk of dying in a fire as women for all ages
from 25 and above, while men in the 65 to 79 years old bracket are at 2.2 times the risk of
1 For the purpose of publications a fire-related fatality includes the number of fatal casualties that were recorded as ‘fire-related’
or ‘don’t know’ and only excludes those that were recorded as ‘not fire-related’. 2 For more detailed technical definitions of fire-related non-fatal casualties, see the Fire Statistics Definitions document. A further
breakdown of the different types of non-fatal casualties are available in the published fire data tables.

7
women in the same age bracket.3 While the overall numbers of fire-related fatalities are
relatively low, and so prone to fluctuation, these are general patterns seen in the online IRS
data since 2009/10. (Source: FIRE0503).
Specifically:
Forty-seven per cent of all fire-related fatalities in England were 65 years old and over
in 2016/17, compared with 22 per cent of all non-fatal casualties. This is similar to the
previous year (44% of fire-related fatalities and 21% of all non-fatal casualties in
2015/16).
In dwelling fires, 54 per cent of all fire-related fatalities were 65 years old and over in
2016/17, compared with 26 per cent of non-fatal casualties, again similar to the
previous year (52% of fire-related fatalities and 25% of non-fatal casualties in dwelling
fires were aged 65 years and over in 2015/16).
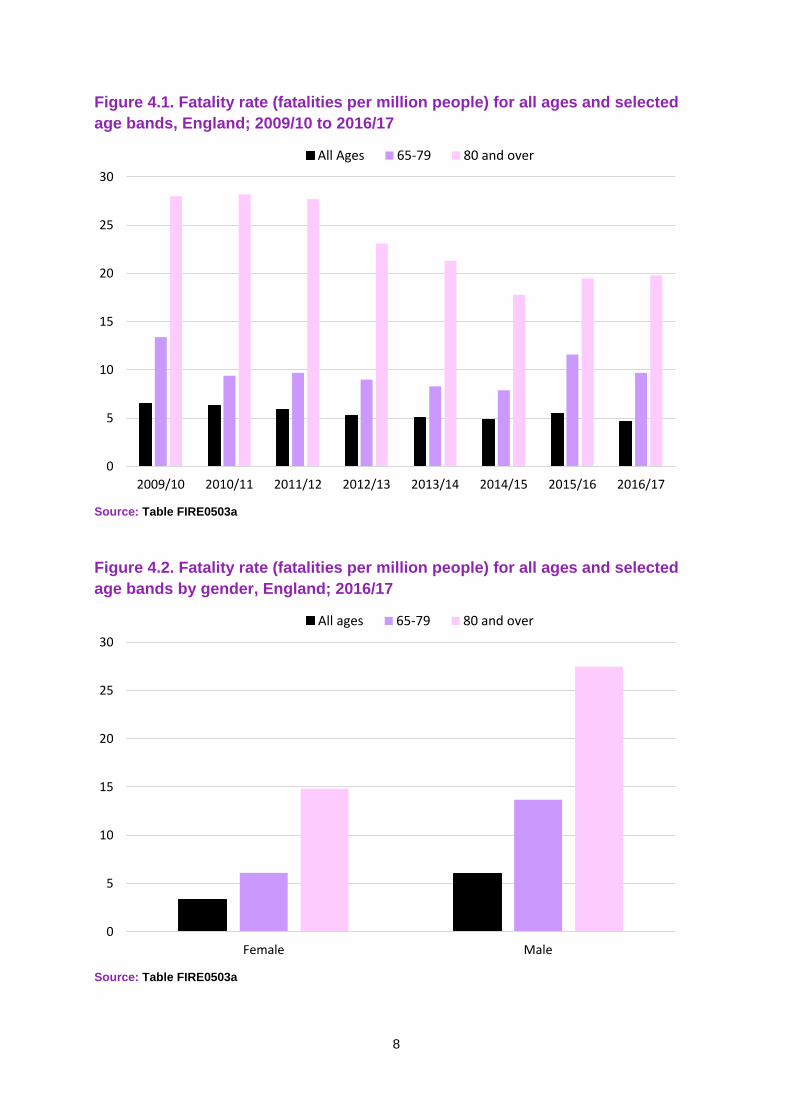
For every million people in England, there were 4.7 fire-related fatalities in 2016/17.
The fatality rate was highest among older people: 9.7 people per million for those 65
to 79 years old and 19.8 for those 80 years and over. (Figure 4.1) The fatality rates
for age bands within 64 years and younger vary but were typically below 5 fatalities
per million population.
Men are at greater risk of dying in a fire than women. The per million population
fatality rate for men aged 65 to 79 was 13.7 while the equivalent rate for women was
6.1. For those aged 80 and over, the rate for men was 27.5 and for women 14.8.
(Figure 4.2)
3 Further detail on these figures can be found on the Home Office’s ‘fire statistics data tables’ page. The relevant tables are
FIRE0501 to FIRE0507. The tables can be found here.
8
Figure 4.1. Fatality rate (fatalities per million people) for all ages and selected
age bands, England; 2009/10 to 2016/17
Source: Table FIRE0503a
Figure 4.2. Fatality rate (fatalities per million people) for all ages and selected
age bands by gender, England; 2016/17
Source: Table FIRE0503a
0
5
10
15
20
25
30
2009/10 2010/11 2011/12 2012/13 2013/14 2014/15 2015/16 2016/17
All Ages 65-79 80 and over
0
5
10
15
20
25
30
Female Male
All ages 65-79 80 and over

9
Causes of deaths and injuries
The IRS records the cause of death or nature of injury for fatal and non-fatal casualties in
fires, respectively. As for almost every year since the start of the online IRS in 2009/10, the
most common cause of death for fire-related fatalities in 2016/17, where known, was
‘overcome by gas or smoke’.
Specifically:
The most common cause of death for fire-related fatalities in 2016/17 (where the
cause of death was known) was ‘overcome by gas or smoke’, given in 38% (100
deaths) of fire-related fatalities and was similar to 2015/16 (36%). This was followed
by ‘burns alone’ (25%; 65 fire-related fatalities) and the combination of ‘burns and
overcome by gas and smoke’ (16%; 43 fire-related fatalities) in 2016/17. (Source:
FIRE0504).
There were 4,751 non-fatal casualties from accidental dwelling fires in 2016/17,
including those who received first aid (1,654) and who were advised to seek
precautionary checks (1,136). When these two groups are removed, the largest
category of injury was ‘overcome by gas or smoke’ (941; 48%) followed by ‘burns’
(397; 20%) and ‘other breathing difficulties’ (301; 15%). All other categories
combined4 comprised the remaining 16% of injuries. (Source: FIRE0506)
4 For a full list of injury categories, see the Fire Statistics Definitions document.

10
5 Extent of fire damage
The IRS also records the extent of damage (due to smoke, heat, flame and water etc.) to
dwellings and other buildings by thirteen area categories, from ‘None’ up to ‘Over 10,000’
square metres.5
The average extent of damage to dwellings and other buildings has generally fallen since
2003/04, though increased slightly between 2015/16 and 2016/17.
In 2016/17, the average area of fire damage to dwellings (excluding those over
5,000m2) in England increased by one per cent to 17.1m2 compared with the historical
low of 16.9m2 in 2015/16. This was a decrease of 12 per cent from five years ago
(19.4m2 in 2011/12) and 27 per cent from ten years ago (23.5m2 in 2006/07). (Source:
FIRE0204)
The average area of fire damage to other buildings (excluding those over 1,000m2)
decreased by one per cent to 29.2m2 since 2015/16. This was an increase of three
per cent from five years ago (28.3m2 in 2011/12) and a decrease of two per cent from
ten years ago (29.7m2 in 2006/07). (Source: FIRE0305)
Calculations for averages that include dwelling fires with more than 5,000m2 of damage and
other buildings fires with more than 1,000m2 of damage can skew the averages; however, for
completeness, other calculations are available in tables FIRE0204 and FIRE0305, which
accompany this release. It should be noted that excluding these area categories removes
less than 0.01 per cent of dwelling fires and just over one per cent of other building fires.
5 For a list of the damaged area size bands, see the Fire Statistics Definitions document.

11
6 Causes of dwelling fires and fire-related fatalities
The Incident Recording System collects information on the source of ignition (e.g. ‘smokers
materials’), the cause of fire (e.g. ‘fault in equipment or appliance’), which item or material
was mainly responsible for the spread of the fire (e.g. ‘clothing/textiles’), as well as other
factors including ignition power (e.g. gas).6
Sources of ignition in accidental dwelling fires
Since 2010/11 accidental dwelling fires have decreased by 14 per cent. This is in part due to
a 15 per cent decrease (between 2010/11 and 2016/17) in fires where the ignition source
was “cooking appliances”, as these make up around half of all accidental dwelling fires. Other
ignition types that have contributed to the decrease include “space heating appliances” and
“central and water heating appliances” (a decrease of 33% and 30% over the same time,
respectively). (Source: Fire0602).
Figure 6.1 shows the proportion of accidental dwelling fires, and their resulting non-fatal
casualties and fire-related fatalities, attributable to different sources of ignition.7 It shows that
while some ignition sources cause relatively many fires they often result in relatively few fire-
related fatalities, and vice versa.8
Cooking appliances were the source of ignition in 49 per cent of accidental dwelling
fires and 50 per cent of non-fatal casualties in accidental dwelling fires in 2016/17,
and was by far the largest ignition category. In contrast, in 2016/17, there were only
nine per cent of accidental dwelling fire-related fatalities where the source of ignition
was cooking appliances.
Smokers’ materials (such as cigarettes, cigars or pipe tobacco) were the source of
ignition in six per cent of accidental dwelling fires and eight per cent of accidental
dwelling fire non-fatal casualties in 2016/17. In contrast, smokers’ materials were the
source of ignition in 36 per cent of fire-related fatalities in accidental dwelling fires in
2016/17, and was by far the largest ignition category involved in accidental dwelling
fire-related fatalities. This was relatively unchanged from 2015/16. (Source:
FIRE0602).
6 For a more detailed definition on the different types of cause of fire, see the definitions document.
7 This excludes ‘Other/Unspecified’ and the smallest source of ignition categories: ‘Central and water heating appliances’ and
‘Blowlamps, welding and cutting equipment’. 8 Further detail on these figures can be found on the Home Office’s ‘fire statistics data tables’ page. The relevant tables are
FIRE0601 to FIRE0605. The tables can be found here.

12
Figure 6.1. Percentage of fires, non-fatal casualties and fire-related fatalities in
accidental dwelling fires by selected sources of ignition, England; 2016/17
Source: Table FIRE0602
Main cause of, and material mainly responsible for, dwelling fires
Exactly how a fire originated, and then the material which was mainly responsible for it spreading, are both important determinants in the outcomes of fires. Notably and similarly to sources of ignition, above, the most common causes and materials responsible for the spread of fires are not those that lead to the greatest proportion of fire-related fatalities.
Of the 27,289 accidental dwelling fires in 2016/17, 35 per cent were caused by
“misuse of equipment or appliances”, similar to 36 per cent in 2015/16. The second
largest cause category was “faulty appliances and leads” which caused 16 per cent of
all accidental dwelling fires. (Source: FIRE0601).
The material mainly responsible for the spread of the fire in 25 per cent of all dwelling
fires and the item first ignited in 26 per cent of all dwelling fires in 2016/17 was
“Textiles, upholstery and furnishings”. The former caused 62 per cent of all fire-related
fatalities in dwellings. (Source: FIRE0603, FIRE0604).
“Food” was the material mainly responsible for the spread for 23 per cent of all
dwelling fires and the item first ignited in 30 per cent of all dwelling fires. However, it
was the material mainly responsible for the spread of fire in only two per cent, and
item first ignited in only three per cent, of all dwelling fire-related fatalities.
0%
5%
10%
15%
20%
25%
30%
35%
40%
45%
50%
55%
Cooking appliances
Smokers material
Other electrical
appliances
Electrical distribution
Space heating
appliances
Candles Cigarette lighters
Matches
Total accidental dwelling fires Casualties Fatalities

13
7 Smoke alarm function
The Incident Recording System (IRS) records information on whether a smoke alarm was
present at the fire incident as well as the type (mains or battery powered) and whether or not
it functioned as intended i.e. if it operated and if it raised the alarm.
Smoke alarms in dwelling fires
Fires where a smoke alarm was present but either did not operate or did not raise the alarm
accounted for just under a third (31%) of all dwelling fires, similar to the figure of 32 per cent
in 2015/16. Mains powered alarms continued to have a lower “failure rate” than battery
powered alarms: 21 per cent of mains powered smoke alarms and 39 per cent of battery
powered smoke alarms failed to operate in dwelling fires in 2016/17 in England, which has
been essentially unchanged since 2010/11. (Source: FIRE0703).
Table 7.1: Reason smoke alarms did not operate in primary dwelling fires, by
type of alarm, England, 2016/17
Reason for failure Battery
powered Mains
powered
Missing Battery 12% 0%
Defective battery 10% 0%
Other act preventing alarm from operating 3% 8%
Fire products did not reach detector(s) 44% 50%
Fire in area not covered by system 12% 13%
Faulty system / incorrectly installed 3% 5%
Other 17% 23%
Source: Table FIRE0704 - see table notes for explanation of categories
Box 2: Reasons alarms did not function as expected
Did not operate: alarm battery missing; alarm battery defective; system not set up
correctly; system damaged by fire; fire not close enough to detector; fault in system;
system turned off; fire in area not covered by system; detector removed; alerted by other
means; other; not known.
Operated but did not raise the alarm: no person in earshot; occupants did not respond; no
other person responded; other; not known.
14
‘Fire products did not reach detector(s)’ and ‘fire in area not covered by system’ accounted
for 63 per cent of mains powered smoke alarm failures and continued to be the principal
reason mains powered smoke alarms failed to operate in dwelling fires in 2016/17, as in
previous years (Table 7.1). Similarly, the main reason battery powered smoke alarms failed
to operate in dwelling fires was due to ‘fire products did not reach detector(s)’ and ‘fire in area
not covered by system’ (56% of dwelling fires in 2016/17). This has also been the principal
cause of battery powered smoke alarm failure in previous years. (Source: FIRE0704).
Fires where a smoke alarm was not present accounted for 45 per cent of all other building
(i.e. buildings that are not dwellings) fires; a small decrease from 46 per cent in 2015/16 and
53 per cent in 2011/12. (Source: FIRE0706).
Fire-related fatalities and non-fatal casualties by smoke alarm function
Fires where a smoke alarm was not present accounted for 27 per cent (8,100) of all primary
dwelling fires and 36 per cent (77) of all dwelling fire-related fatalities in 2016/17. This is in
the context of 11 per cent of dwellings not having a working smoke alarm in 2015/169.
(Source: FIRE0701, FIRE0702).
Fires where a smoke alarm was present but either did not operate or did not raise the alarm
accounted for 42 per cent (89) of all dwelling fire-related fatalities in 2016/17; an increase
from 38 per cent in 2015/16. (Source: FIRE0702).
As for all years since 2010/11, the most common category of smoke alarm failure in dwelling
fires involving any casualties was ‘Other’ (including ‘alerted by other means’, ‘system
damaged by fire’, ‘other’ and ‘don’t know’), which accounted for 32 per cent of these fires
where battery powered smoke detectors were present and 42 per cent where mains powered
detectors were present (Table 7.2). This was followed by faulty or incorrectly installed
systems for battery powered detectors (14%) and other acts preventing the alarm from
operating (including detectors removed or system turned off) at 16 per cent for mains
powered detectors in primary dwelling fires involving any casualties. (Source: FIRE0704).
The most common category of smoke alarm failure in dwelling fires involving any casualties
(‘Other’) is unchanged for battery powered alarms from 2015/16 and represents a decrease
of two percentage points since 2011/12. For mains powered alarms it has increased by four
percentage points from 2015/16 and seven percentage points since 2011/12.
9 English Housing Survey (2008/09- 2015/16). Data for 2016/17 had not yet been released by the date of publication.

15
Table 7.2: Reason smoke alarms did not operate in primary dwelling fires resulting in casualties, by type of alarm, England, 2016/17 Reason for failure
Battery powered
Mains powered
Missing Battery 11% 5%
Defective battery 11% 5%
Other act preventing alarm from operating 11% 16%
Fire products did not reach detector(s) 11% 11%
Fire in area not covered by system 9% 8%
Faulty system / incorrectly installed 14% 13%
Other 32% 42%
Source: Table 0704 - see table notes for explanation of categories
Fires where a smoke alarm was not present accounted for 37 per cent of all other building
(i.e. buildings that are not dwellings) fire-related fatalities and casualties (combined) in
2016/17, an increase of seven percentage points since 2015/16 but a decrease of four
percentage points since 2011/12. (Source: FIRE0706).
Figure 7.1, below, shows the proportion of primary dwelling fires and dwelling fire-related
fatalities where the alarm was either “present, operated and raised the alarm” or “absent”. It
shows that, since the online IRS was introduced, the proportion of primary dwelling fires
where the alarm was present, operated and raised has been consistently ten to fifteen
percentage points higher than the proportion of fire-related fatalities where the smoke alarm
was present, operated and raised. Conversely, while smoke alarms were absent in 27% of
primary dwelling fires in 2016/17, they were absent for 36% of the dwelling fire-related
fatalities in the same year.10
10
Further detail on these figures can be found on the Home Office’s ‘fire statistics data tables’ page. The relevant tables are
FIRE0701 to FIRE0708. The tables can be found here.

16
0%
5%
10%
15%
20%
25%
30%
35%
40%
45%
2010/11 2011/12 2012/13 2013/14 2014/15 2015/16 2016/17
Alarm present: Fires
Alarm absent: Fires
Alarm present: Fatalities
Alarm absent: Fatalities
Figure 7.1. The proportion of primary dwelling fires and dwelling fire-related fatalities by smoke alarm operation, England; 2010/11 to 2016/17
Source: Table FIRE0702 - Totals do not add to 100 per cent due to the exclusion of two smoke alarm operation
categories: “present, operated but did not raise the alarm” and “present, but did not operate”.

17
8 Temporal and seasonal fire analyses
Fires and fire-related fatalities are affected by both seasonality and time of day. Similar to
previous years, generally fewer fires happened between midnight and 11am, but the number
of fire-related fatalities remained relatively high despite lower incidence of fires and with no
strong temporal pattern. This difference is also found for accidental dwelling fires.
Temporal fire analyses
Forty-six per cent of all fires in 2016/17 in England took place between 16:00 and
22:00 (Figure 8.1). These six hours were the six individual hours where the highest
proportion of fires took place, which is unchanged since 2015/16. The peak was
between 19:00 and 20:00 and was when, as for each year since 2010/11, between
eight and nine per cent of fires occurred. (Source: FIRE0801).
In contrast to the number of fires, the hourly number of fire-related fatalities showed
no clear pattern across the day in 2016/17, with the highest number of fire-related
fatalities (just under 6%) occurring in each of the hours between 17:00 and 19:00,
with comparable peaks in the hours of 07:00 to 09:00 and 14:00 to 15:00 (Figure 8.1).
Figure 8.1. Percentage of fires and fire-related fatalities by hour of the day,
England; 2016/17
Source: Table FIRE0801
Seasonal fire analyses
Very little seasonality was evident in dwelling, other building and road vehicle fires, however
outdoor fires and chimney fires showed much stronger seasonal effects. There tend to be
more grassland, refuse and other outdoor fires in the summer months and these seem to
reflect weather patterns. Conversely, chimney fires are more numerous in the winter months.
0%
1%
2%
3%
4%
5%
6%
7%
8%
9%
00- 01
01- 02
02- 03
03- 04
04- 05
05- 06
06- 07
07- 08
08- 09
09- 10
10- 11
11- 12
12- 13
13- 14
14- 15
15- 16
16- 17
17- 18
18- 19
19- 20
20- 21
21- 22
22- 23
23- 24
Fires Fatalities
18
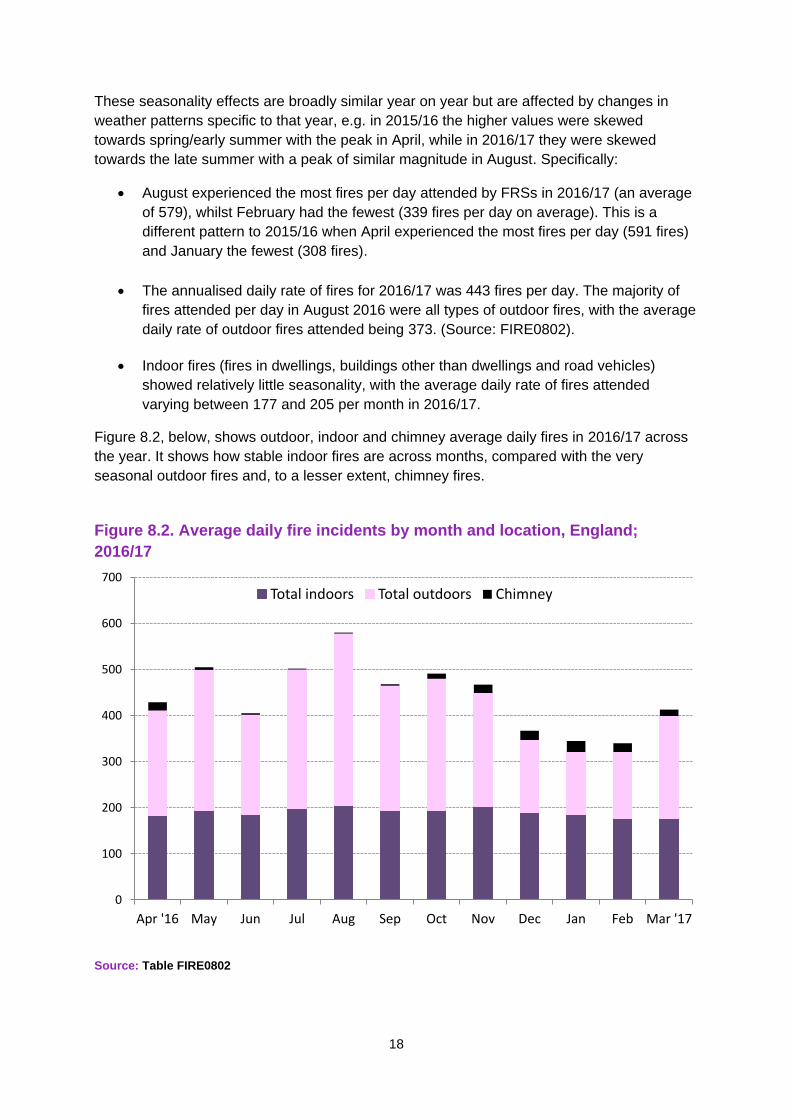
These seasonality effects are broadly similar year on year but are affected by changes in
weather patterns specific to that year, e.g. in 2015/16 the higher values were skewed
towards spring/early summer with the peak in April, while in 2016/17 they were skewed
towards the late summer with a peak of similar magnitude in August. Specifically:
August experienced the most fires per day attended by FRSs in 2016/17 (an average
of 579), whilst February had the fewest (339 fires per day on average). This is a
different pattern to 2015/16 when April experienced the most fires per day (591 fires)
and January the fewest (308 fires).
The annualised daily rate of fires for 2016/17 was 443 fires per day. The majority of
fires attended per day in August 2016 were all types of outdoor fires, with the average
daily rate of outdoor fires attended being 373. (Source: FIRE0802).
Indoor fires (fires in dwellings, buildings other than dwellings and road vehicles)
showed relatively little seasonality, with the average daily rate of fires attended
varying between 177 and 205 per month in 2016/17.
Figure 8.2, below, shows outdoor, indoor and chimney average daily fires in 2016/17 across
the year. It shows how stable indoor fires are across months, compared with the very
seasonal outdoor fires and, to a lesser extent, chimney fires.
Figure 8.2. Average daily fire incidents by month and location, England;
2016/17
Source: Table FIRE0802
0
100
200
300
400
500
600
700
Apr '16 May Jun Jul Aug Sep Oct Nov Dec Jan Feb Mar '17
Total indoors Total outdoors Chimney

19
9 Further information
This release contains statistics about incidents attended by fire and rescue services in England. The statistics are sourced from the Home Office’s online Incident Recording System (IRS), which allows fire and rescue services to complete an online incident form for every incident attended, be it a fire, a false alarm or a non-fire (sometimes known as Special Service) incident. The online IRS was introduced in April 2009. Previously, paper forms were submitted by FRSs and an element of sampling was involved in the data compilation process.
Fire and Rescue and other Home Office statistical releases are available from the Statistics at Home Office pages on the GOV.UK website. The dates of forthcoming fire and rescue and other Home Office publications are pre-announced and can be found via the Statistics: release calendar. For further information about the statistics in this publication, email [email protected].
Data tables linked to this release and all other fire statistics releases can be found on the Home Office’s ‘Fire statistics data tables’ page. The sections above state the most relevant tables for each section. The tables can be found here: https://www.gov.uk/government/statistical-data-sets/fire-statistics-data-tables
Further analyses of these statistics are concurrently published in ‘Focus on trends in fire incidents and fire-related fatalities’, which uses data from this release to explore the historical trends in the numbers of fires and fire-related fatalities.
Guidance for using these statistics and other fire statistics outputs can be found on the fire statistics collection page, found here: https://www.gov.uk/government/collections/fire-statistics
The information published in this release is kept under review, taking into account the needs of users, burdens on suppliers and producers, in line with the Code of Practice for Official Statistics. If you have any comments, suggestions or enquiries, please contact the team via email using [email protected] or via the user feedback form on the fire statistics collection page.
Media enquiries via Home Office news desk:
Office hours: 020 7035 3535; 7am-8pm Monday-Friday
Out of hours: 07659 174240
Statistical or public enquiries:
The responsible statistician for this publication is Deborah Lader
To contact the Fire Statistics team:
Email: [email protected];
20
ISBN: 978-1-78655-572-4
ISSN: 1759-7005
© Crown copyright 2017
This publication is licensed under the terms of the Open Government Licence v3.0
except where otherwise stated. To view this licence, visit
nationalarchives.gov.uk/doc/open-government-licence/version/3 or write to the
Information Policy Team, The National Archives, Kew, London TW9 4DU, or email:
Where we have identified any third party copyright information you will need to obtain
permission from the copyright holders concerned.
This statistical bulletin is produced to the highest professional standards and is free from political interference. It has been produced by statisticians working in the Home Office Analysis and Insight Directorate in accordance with the Home Office’s statement of compliance with the Code of Practice for Official Statistics, which covers Home Office policy on revisions and other matters. The Chief Statistician, as Head of Profession, reports to the National Statistician with respect to all professional statistical matters and oversees all Home Office National Statistics products with respect to the Code, being responsible for their timing, content and methodology.