detailed analysis on storm surge impacts due to typhoon ... · impacts due to typhoon yolanda and...
TRANSCRIPT
Detailed analysis on storm surge impacts due to Typhoon Yolanda and
multidisciplinary research for disaster risk reduction
Hiroshi Takagi / Mario P. de Leon
Ryo Matsumaru
PCIEERD DOST
Eastwood Richmonde Hotel, Quezon City, Manila, April 16, 2015

J-Rapid Team
Principle Investigators:
H. Takagi (Tokyo Tech), L. D. Mario (DLSU)
Co-researchers:
R.Matsumaru (Toyo Univ.), T.Shibayama (Waseda U.), T.Mikami (Waseda U.), M. Esteban (U. Tokyo), Paolo B. V. (Disaster Preparedness Foundation), Ruth L. Caminong (DPWH) , Thao N.D. (HCMUT), Nistor I. (U. Ottawa)
Students:
S. Li, W. Wu (Tokyo Tech), L.C. Yap (DLSU), R. Nakamura (Waseda U.), M. Hayashi, K. Kimura (Toyo U.)

Publication International Journal (2 papers accepted and 5 journal papers still under review)
H. Takagi, E. Miguel, T. Shibayama, T. Mikami, R. Matsumaru, L.D. Mario, Thao N.D., T. Oyama, R. Nakamura. Track Analysis, Simulation and Field Survey of the 2013 Typhoon Haiyan Storm Surge, Journal of Flood Risk Management, Wiley, 2015.
M. Esteban, Valenzuela V.P., Yun N Y., Mikami T., Shibayama T., Matsumaru R., Takagi H., Thao N.D., Mario De L., Oyama T., Nakamura R. Typhoon Haiyan 2013 Evacuation Preparations and Awareness, J-SustaiN, 2015.
Book Chapter
H. Takagi , L.D. Mario, E. Miguel, T. Mikami, R. Nakamura. Storm Surge due to 2013 Typhoon Yolanda in Leyte Gulf, the Philippines, IN: Esteban M., Takagi H., Shibayama T. Handbook of Coastal Disaster Mitigation for Engineers and Planners, 1st Edition, Elsevier (June, 2015 upcoming book) ISBN: 9780128010600
Japanese Domestic Journal
Nakamura R., Oyama T., Shibayama T., Matsumaru R., Takagi H., Esteban M., Takahito M. Comparison between simulation of storm surge invoked by typhoon “Yolanda” and field results, Journal of Japan Society of Civil Engineers, Ser. B2 (Coastal Engineering), Vol. 70, No. 2, pp. 236-240, 2014.
Esteban M, Mtsumaru R, Takagi H, Mikami T, Shibayama T, Mario d l, Valenzuela V.P., Thao N.D.. Study on disaster information dissemination and people’s respose for evacuation - the case of the 2013 Typhoon Yolanda (Haiyan) -, Journal of Japan Society of Civil Engineers, Ser. B3 (Ocean Engineering), JSCE, Vol. 70, No. 2, 2014.
Shibayama T, Matsumaru R, Takagi H, Mario p. d, Esteban M, Mikami T., Oyama T, Nakamura R. Field survey and analysis of storm surge caused by the 2013 typhoon Yolanda (Haiyan), Journal of Japan Society of Civil Engineers, ser. B3 (ocean engineering), vol. 70, no. 2, 2014.
Takagi H, Mikami T, Shibayama T, Matsumaru R, Mario d l, Esteban M, Nguyen D. T., Nakamura R. analysis of the 2013 typhoon yolanda (haiyan) and subsequent storm surge, Journal of Japan Society of Civil Engineers, ser. B3 (ocean engineering), vol. 70, no. 2, 2014.
(as of April, 2015)

Seminar at De La Salle University, October 17, 2014

Topics
1. Characteristics of Typhoon Yolanda
2. Findings through the Field Surveys
3. Findings through Storm Surge Simulation
4. Intense Investigation in Tacloban
5. People’s awareness of Storm Surge
6. Recovery Process

1. Characteristics of Typhoon Yolanda

Typhoon Track Analysis
Yolanda was one of the largest typhoons in the North West
Pacific, only 28 typhoons are comparable.
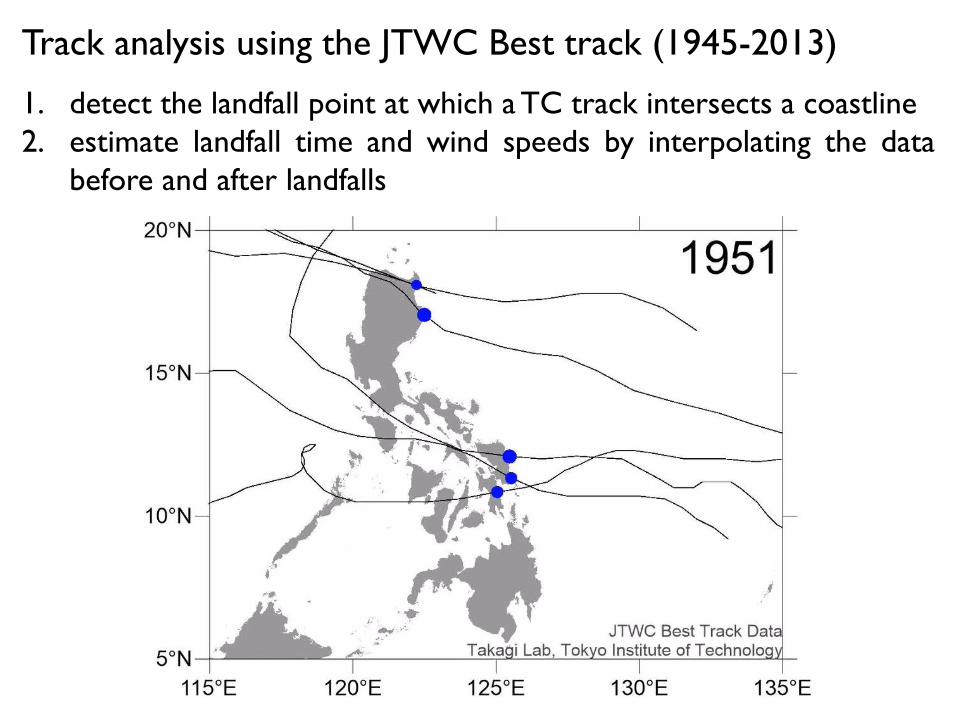
Track analysis using the JTWC Best track (1945-2013)
1. detect the landfall point at which a TC track intersects a coastline
2. estimate landfall time and wind speeds by interpolating the data
before and after landfalls
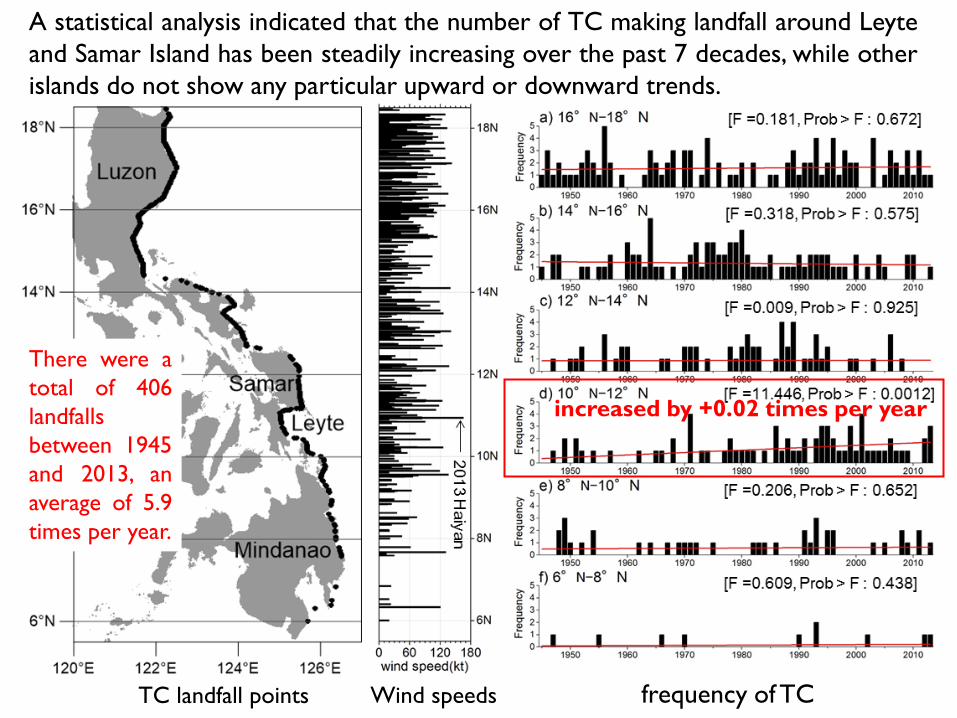
A statistical analysis indicated that the number of TC making landfall around Leyte
and Samar Island has been steadily increasing over the past 7 decades, while other
islands do not show any particular upward or downward trends.
increased by +0.02 times per year
TC landfall points Wind speeds frequency of TC
There were a
total of 406
landfalls
between 1945
and 2013, an
average of 5.9
times per year.

Haiyan (Yolanda) can be characterized as both the fastest
moving and strongest typhoon measured in the Philippines.
Fig. Relationship between wind speeds and forward speeds for the strongest 67
among 406 TCs, which made landfall in the Philippines between 1945 and 2013

Relationship between return periods and wind speeds derived
from extreme value analysis using a Weibull distribution. The return
period of Haiyan (Yolanda) is estimated to be 200 years, while that
of typhoon Zeb in 1998 is 19 years.

One of the most unusual characteristics of Haiyan is that it was
found to be the fastest typhoon in addition to the strongest
typhoon in the past 7 decades.
The fast moving typhoon caused:
→ amplification of storm surge at some locations
→ insufficient time for local people to prepare and evacuate
Key Points for Disaster Management (1) The wind speed at the time of landfall (165.8 knots) was found to
be the strongest among 406 TCs in the last seven decades, 16%
faster than the second strongest typhoon (142.7 knots during
Typhoon Zeb in 1998). The return period for a Haiyan-class
typhoon to make landfall was estimated to be 200 years.
A significant increase in TC landfall frequency (+0.02 times per
year) in recent decades was found in the latitude zone between
10°N and 12°N, which encompasses Leyte Island.

2. Findings through the Field Surveys

Post-disaster Survey in the Philippines after Yolanda
The 1st Dispatch,
December 4-13, 2013
Surveyed extent
The 2nd Dispatch, May 1-6, 2014
Dulag
Giposo
Tanauan
The 3rd Dispatch, Oct 18-20, 2014

Storm Surge Height Measurements

Storm Surge Height Distribution

Results of survey
in May 2014
Storm Surge Height Distribution

Storm Surge Height (m)
Tacloban City
Storm Surge Height Distribution
Google Earth

Surveyed Points (San Pedro Bay)
Tacloban City
a. Airport
b. Convention Center
c. Paterno Street
d. City Hall
e. Anibong

Survey Results - Airport, Tacloban City
Located in a narrow low-lying peninsula
Airport worker (remained at the
airport during the event) “the water
level came to the outer air conditioning
machine”
⇒ Height: 5.25m (Depth: 3.45m)
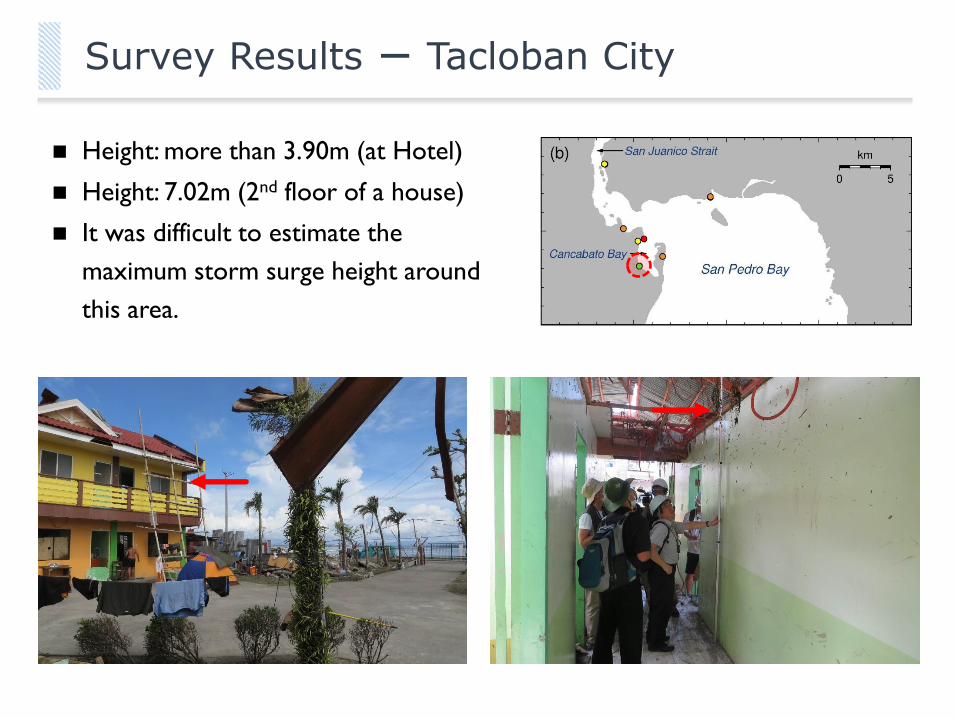
Survey Results - Tacloban City
Height: more than 3.90m (at Hotel)
Height: 7.02m (2nd floor of a house)
It was difficult to estimate the
maximum storm surge height around
this area.

Survey Results - Anibong, Tacloban City
Height at a house: 5.65m (residents
evacuated to a hill behind the house).
Storm surge attacked densely
populated area.
Ships were washed inland (this area is
next to a port area).
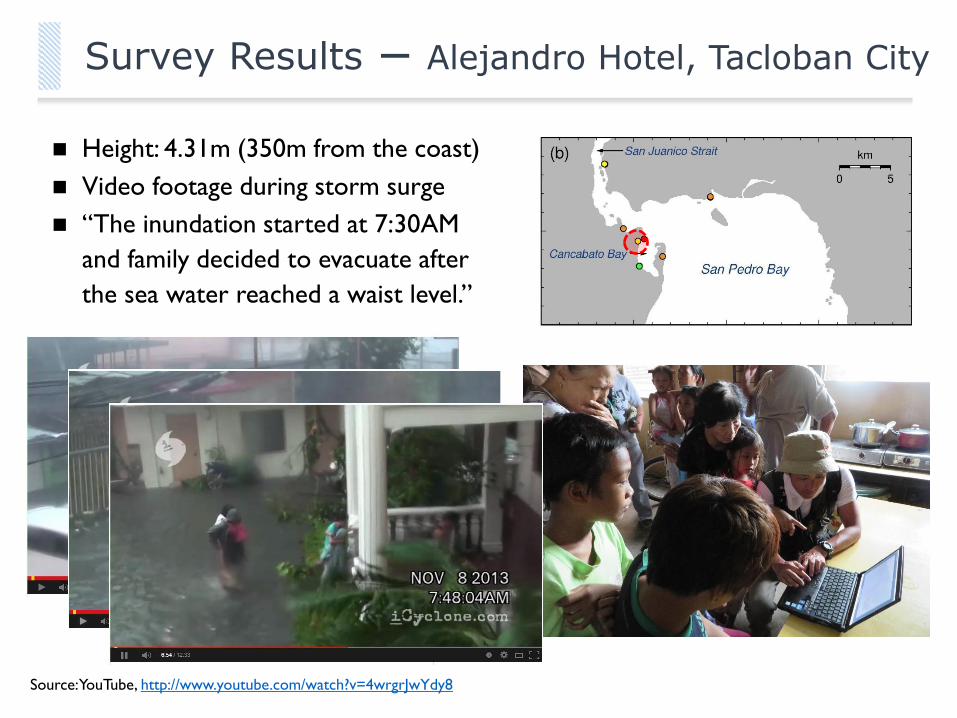
Survey Results - Alejandro Hotel, Tacloban City
Source: YouTube, http://www.youtube.com/watch?v=4wrgrJwYdy8
Height: 4.31m (350m from the coast)
Video footage during storm surge
“The inundation started at 7:30AM
and family decided to evacuate after
the sea water reached a waist level.”

Survey Results - Edible Oil Mfg., Tanauan
Height: 6.10m (100m from the coast)
Oil tanks were displaced by the storm
surge and the high waves.
2012/02/23
2013/11/10

Survey Results - Bislig, Tanauan
Height: 7.71m (near the coast)
Height: 3.72m (290m from the coast)
The water carried a great deal of
garbage with it (flow was like “washing
machine”).
Waves was
breaking at this
height
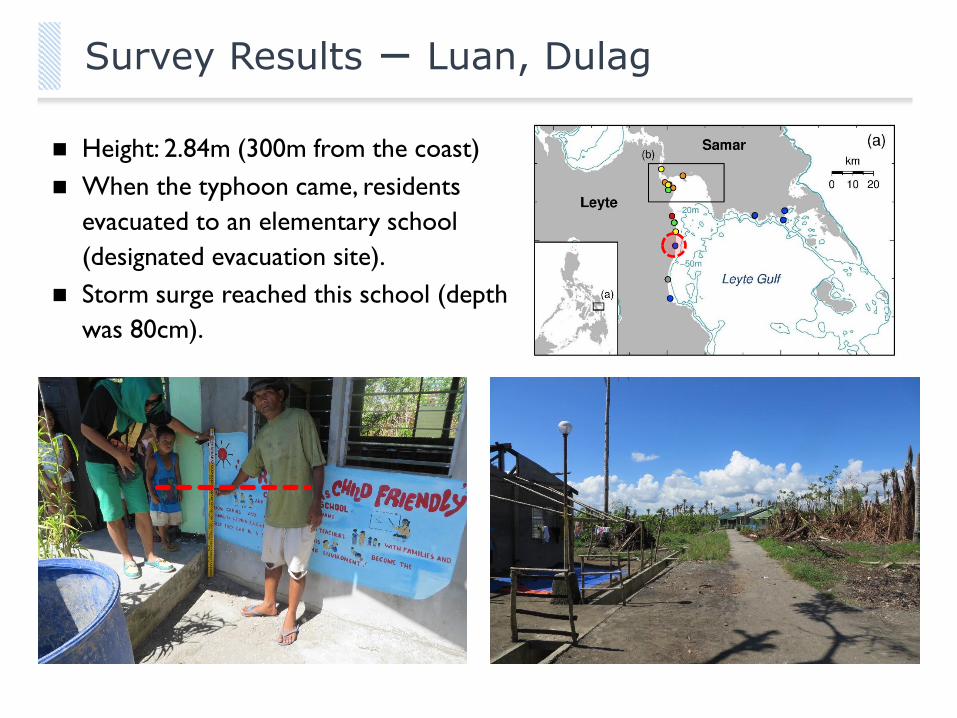
Survey Results - Luan, Dulag
Height: 2.84m (300m from the coast)
When the typhoon came, residents
evacuated to an elementary school
(designated evacuation site).
Storm surge reached this school (depth
was 80cm).

Survey Results - Basey
Height: 5.87m (City Hall)
Height: 5.22m (behind the City Hall)
1st floor was flooded
Strong winds started around 5AM
→ the water started to recede 6AM
→ the storm surge started 7AM

Survey Results - Gigoso, Giporlos
The mayor brought us to the most
affected barangay.
Height: 3.93m (near the coast)
1st floor was flooded and the water
came to the 2nd floor (wind waves?).

Survey Results - Northern Cebu
Some evidence of storm surges was
found (but not as great as that
observed in Leyte and Samar).
Low tide during the typhoon.
Coral reef and mangrove forests. Daanbantayan
Medellin
Bogo
Medellin

Key Points for Disaster Management (2)
Storm Surge Field Survey after the 2013 Typhoon Yolanda
Field surveys revealed that:
– Storm surge heights were over 5m inside Leyte Gulf
– Storm surge above 3m started to cause damage to
housing, especially to the wooden settlements
– Devastating storm surge was induced by rapid change of
wind direction over Leyte Gulf
In the Philippines, the characteristics of storm surges can be
different depending on typhoon path, shape of a bay, near
shore bathymetry, etc.
In order to prepare for future typhoons, it is important to
analyze past storm surge events as well as recent events and
accumulate knowledge and lessons.

3. Characteristics of Storm Surge revealed
through Numerical Simulation

Storm Surge Model
Typhoon Path JMA Typhoon Best Track
Typhoon Model
Pressure: Myers Formula, Wind:
Gradient winds considering Super-
gradient wind effect
Fluid Dynamics
Model Nonlinear shallow water equation
Computational
Domain
Cartesian (UTM51N), grid @3000m
(Philippines), @100m (San Pedro
Bay)
Bathymetry GEBCO_08 Grid (Philippines)
Chart by NAMRIA (San Pedro Bay)
Terrain Data ASTER GDEM (Satellite Data)
Tacloban, measured by the team
Manning’s n value Ocean: 0.025, Land: 0.060

Bathymetry around Leyte and Samar
Data: GEBCO_08 Grid, GEBCO (General Bathymetric Chart of the Oceans)
Cebu Samar
Leyte

Panay
Cebu
Leyte
Simulation for a wide area of the Philippines
Negros
storm
surge
Wave
Guiuan
movie embedded

Detailed simulation focusing on Leyte Gulf Leyte
Island
Samar
Island
Leyte Gulf
movie
embedded
Storm
surg
e e
leva
tions
(m)

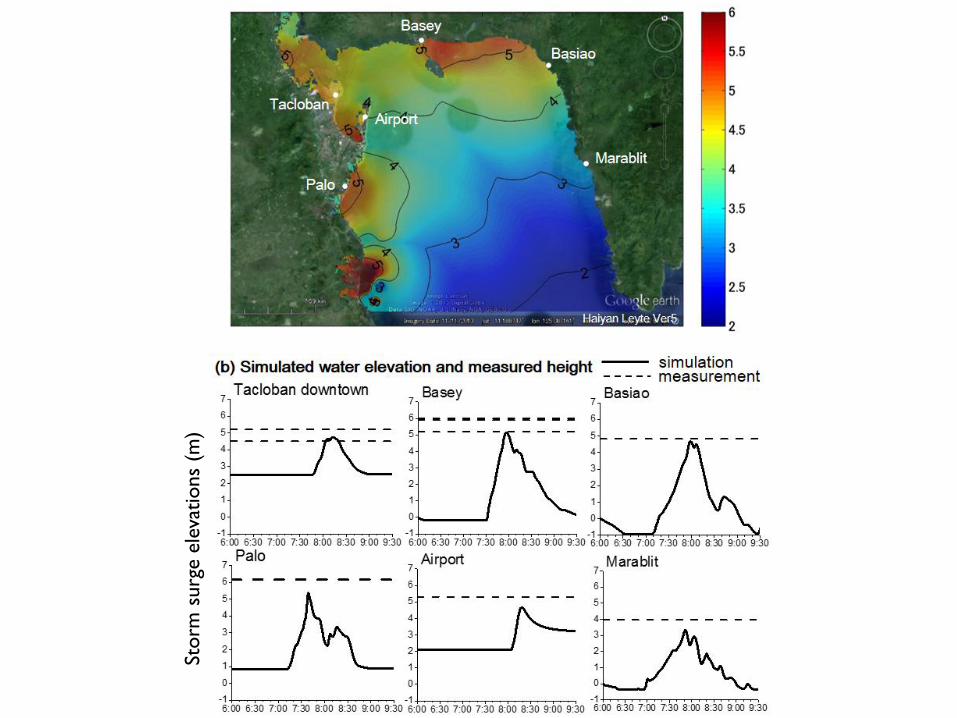
Receding of water observed in Basey, which was reproduced by the simulation as well.
water was receded by strong
wind towards the sea
Damage of houses due to
runup flow
Rapid
decrease
Strong wind towards the sea
shallow depth
movie
embedded

Key Points for Disaster Management (3)
• The winds brought by Yolanda was one of the strongest in the history of the Philippines between 1945 and 2013.
• The return period of Yolanda-class typhoon was estimated to be 200 years.
• The forward speed of Yolanda was unusually fast, reaching speeds of 41km/h, which potentially increased the extent of damage.
• Water levels begun with receding at some places, which might have intrigued people living nearby the coasts.
• The result of numerical simulation is sufficiently reliable, which shows a good agreement with the inundations observed in the survey along the coast of Leyte Island.

4. Intense Investigation in Tacloban

(a) Inundation height
(b) Inundation height
(c) Inundation height
(d) Topographical survey
1
Detail simulation focusing on the downtown Tacloban Intense field survey

Satellite
Data
ASTER-
GDEM 30
meters
The precise ground elevation is a key to a reliable simulation
Refined elevation data
of Tacloban City
topographical
survey
unrealistic elevations
Tacloban
downtown
realistic elevations
Topographical survey in the downtown Tacloban

Storm surge heights from the sea surface (black) and inundation
depths from the ground (blue) (unit: meter)

43
Visual inspection using a movie taken from Alejandro Hotel
(a)
movie
embedded

Comparison of flow speed between the movie and simulation
The flow speed was about 60cm/s in front of Alejandro Hotel
from the visual inspection
from the simulation
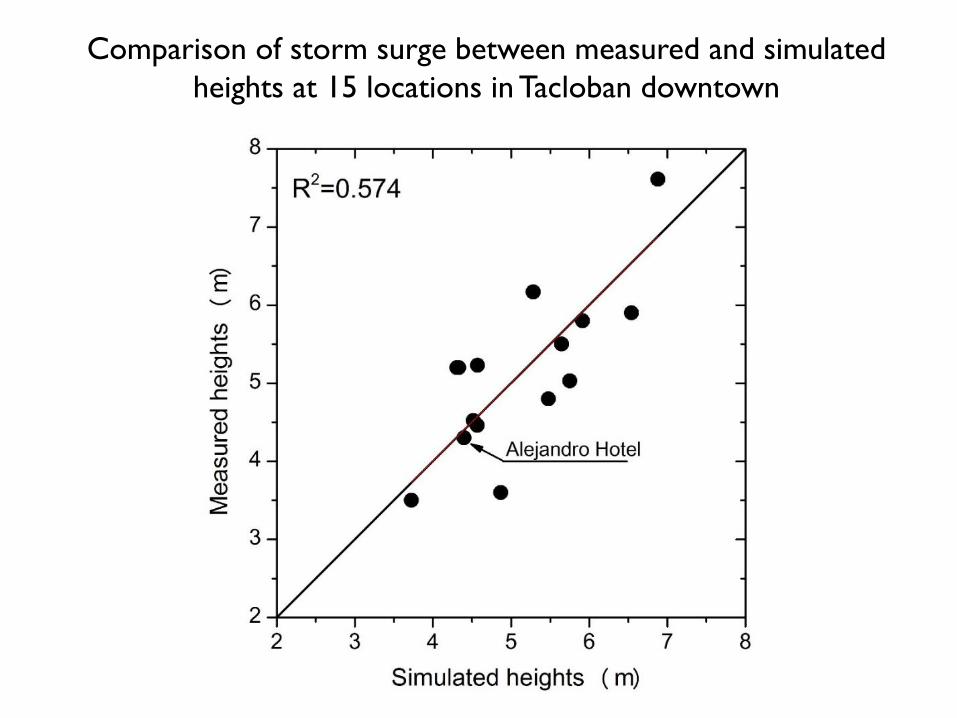
Comparison of storm surge between measured and simulated
heights at 15 locations in Tacloban downtown

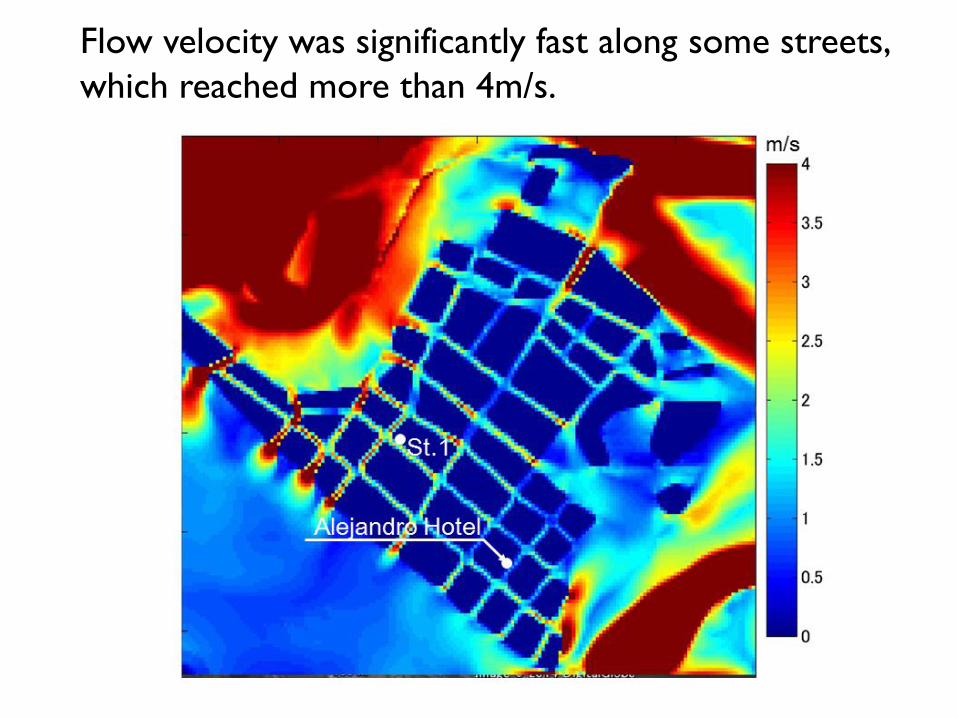
Flow velocity was significantly fast along some streets,
which reached more than 4m/s.
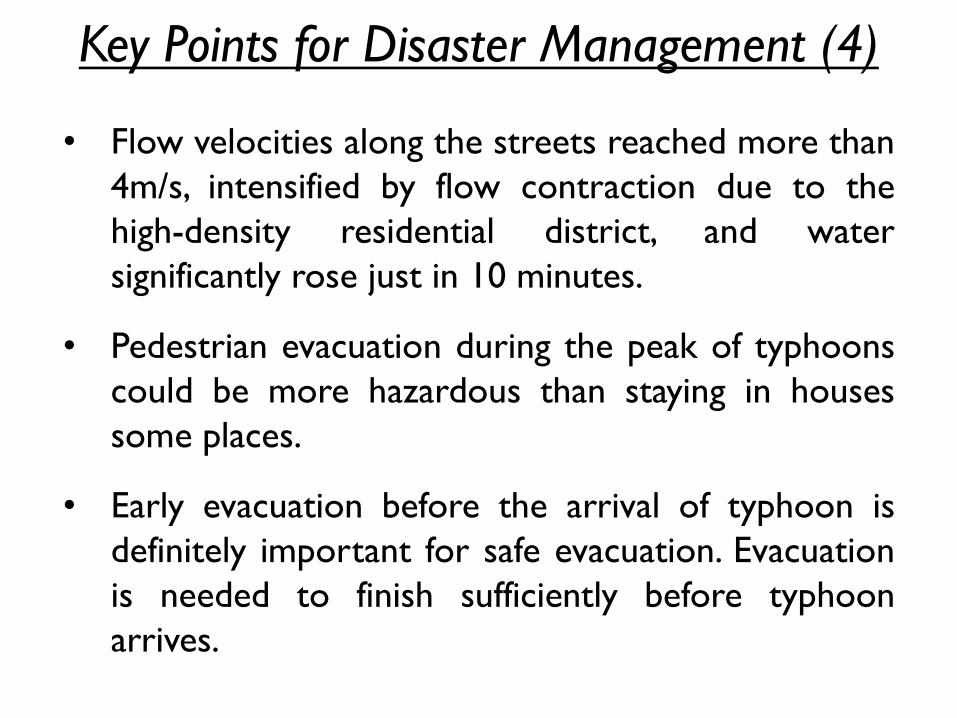
Key Points for Disaster Management (4)
• Flow velocities along the streets reached more than
4m/s, intensified by flow contraction due to the
high-density residential district, and water
significantly rose just in 10 minutes.
• Pedestrian evacuation during the peak of typhoons
could be more hazardous than staying in houses
some places.
• Early evacuation before the arrival of typhoon is
definitely important for safe evacuation. Evacuation
is needed to finish sufficiently before typhoon
arrives.

5. People’s awareness of Storm Surge
Survey Period: Dec. 2013
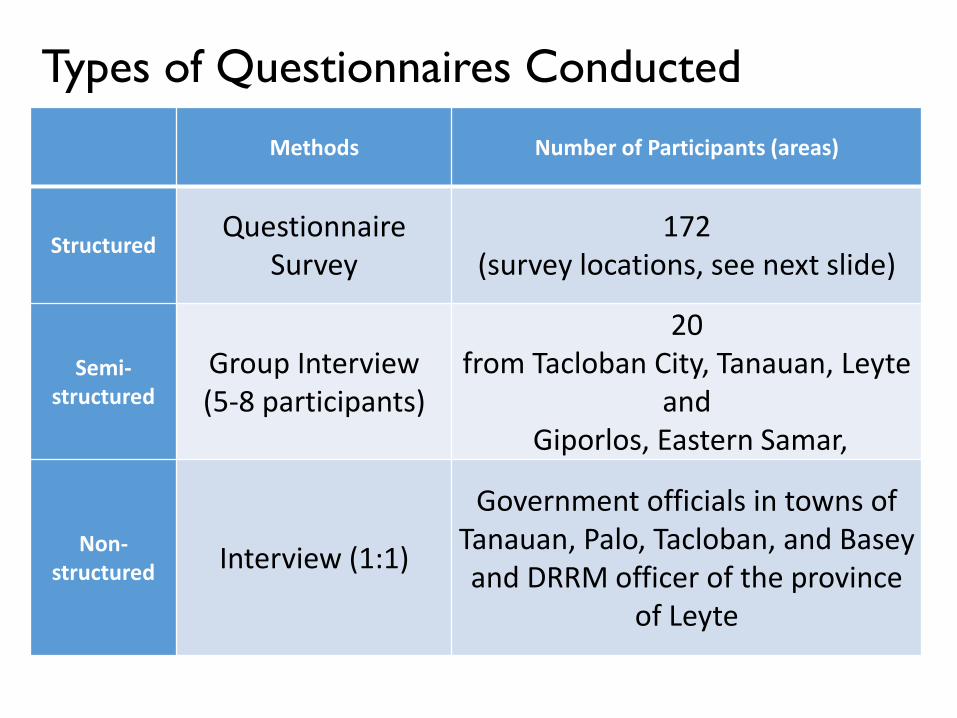
Types of Questionnaires Conducted
Methods Number of Participants (areas)
Structured Questionnaire
Survey 172
(survey locations, see next slide)
Semi-structured
Group Interview (5-8 participants)
20 from Tacloban City, Tanauan, Leyte
and Giporlos, Eastern Samar,
Non-structured Interview (1:1)
Government officials in towns of Tanauan, Palo, Tacloban, and Basey and DRRM officer of the province
of Leyte

Structured Questionnaires (I): Distribution
• Same place as storm surge survey.
• 172(valid response) /198(distribution)
Place
No. of response
Storm Surge Height
(m)
a Tacloban Airport 13 5.25 d Tacloban City Hall 7 6.20 b Convention Center 44 7.02 g Basey 13 5.87 9 Sto Nino 15 2.72 8 Gigoso 16 3.93 7 Balangiga 22 2.78 1 Bislig, Tanauan 15 7.71 e Barangay 68, Tacloban 5 5.65 c Hotel Alejandro, Tacloban 8 4.31
Palo 14 -

Structured Questionnaires (II): Demographics
• Structured questionnaires of local residents and emergency officials (n=172)
Male 32%
Female 56%
Unclear/No
answer 12%
23% 24%
16%
11% 9%
6% 3%
0%
9%
0%
5%
10%
15%
20%
25%
30%
% o
r re
spo
nd
ents
Age distribution

Structured Questionnaires (III): Occupation
• Majority were young people, many students and people in fishing industry
• Also many office workers (emergency officials, etc)
Fishing 17%
Students 20%
Housewife 15%
Office workers
24%
Others 24%

Storm Surge Awareness • Despite no recent storm surge events 77% of all respondents felt that storm
surges represented a strong or very strong danger for them. Thus, relatively high awareness about the potential danger
3% 1% 1%
15%
62%
18%
0%
10%
20%
30%
40%
50%
60%
70%
% o
r re
spo
nd
ents
35%
5% 2%
56%
2% 0%
10%
20%
30%
40%
50%
60%
Yes
(1 t
ime)
Yes
(2 t
imes
)
Yes
(3 o
r m
ore
tim
es)
No
No
An
swer
% o
r re
spo
nd
ents
Storm Surge Awareness Previous Experiences
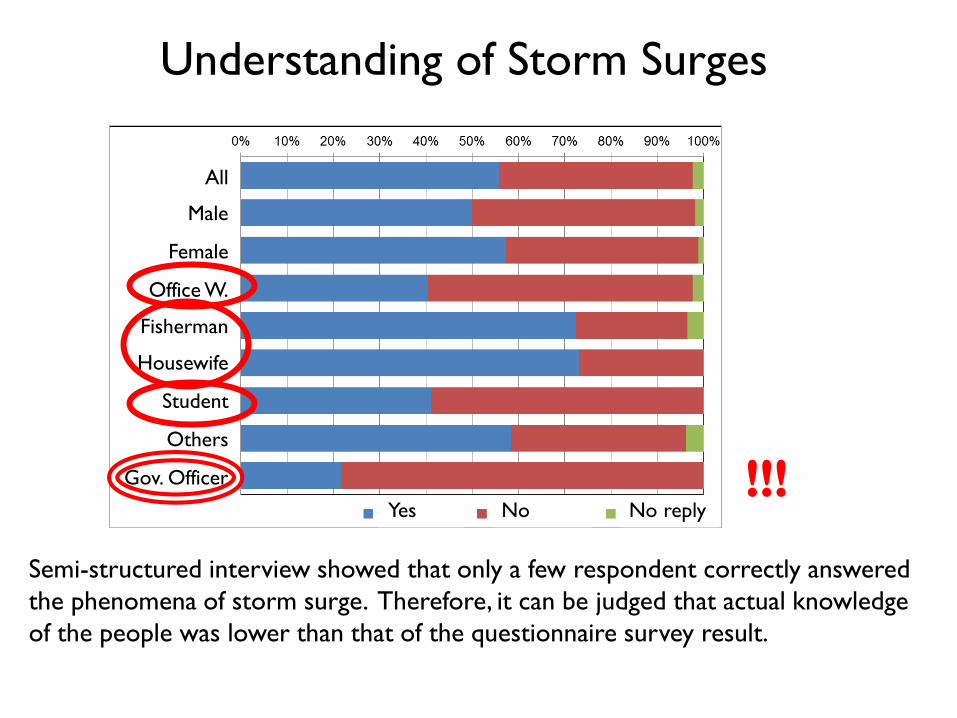
Semi-structured interview showed that only a few respondent correctly answered
the phenomena of storm surge. Therefore, it can be judged that actual knowledge
of the people was lower than that of the questionnaire survey result.
Yes No No reply
All
Office W.
Female
Male
Housewife
Student
Others
Gov. Officer
Fisherman
!!!
Understanding of Storm Surges
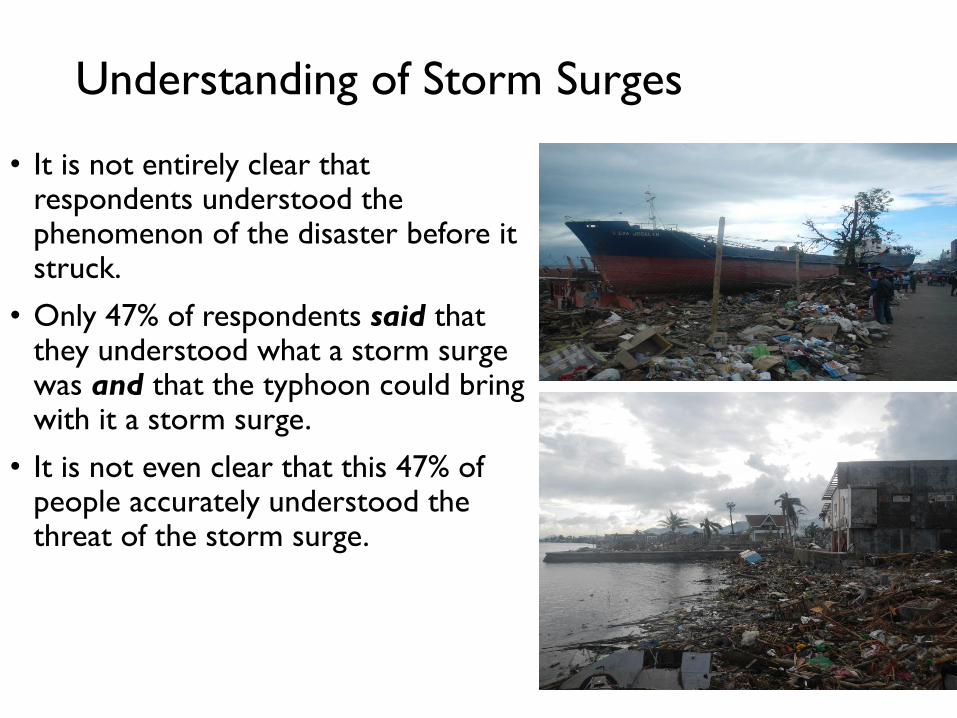
Understanding of Storm Surges
• It is not entirely clear that respondents understood the phenomenon of the disaster before it struck.
• Only 47% of respondents said that they understood what a storm surge was and that the typhoon could bring with it a storm surge.
• It is not even clear that this 47% of people accurately understood the threat of the storm surge.

Sources of information (by gender)
TV/Radio
Internet
Family
Police/Fire Sta.
Speaker on the Car
Speaker in community
Others
Myself
Neighbors
No reply
Multiple Reply Total: 187
female
male
People rely on media.
Information from the
Internet was emerging. Diffusion of smart phone?
Government-based
information sources were
not widely used. Might be issue considering
gov. responsibility.

Sources of information (by age group)
TV/Radio
Internet
Family
Police/Fire Sta.
Speaker on the Car
Speaker in community
Others
Myself
Neighbors
No reply
Multiple Reply
Total: 193

Knowledge about evacuation • Only 20% or respondents confirmed that they had taken part in evacuation
drills at some point in their lives (13% in one evacuation drill, and 7% in 2 or more)
• 58% said they knew how to evacuate
• Indication of efforts by train the population, generally understood by a sizeable majority of the population.
20%
58%
19%
3% 0%
10%20%30%40%50%60%70%
Yes, have joined No, but knowshow to evacuate
No, did not join No answer
% o
r re
spo
nd
ents

Actual Evacuation Behavior
35%
31%
23%
8%
6%
0% 10% 20% 30% 40%
After I saw the forecast
After I got warning or order
After the typhoon made landfall
After the typhoon had passed
No answer/unclear answer
% or respondents
73%
17%
6%
11%
4%
0% 20% 40% 60% 80%
I evacuated because of the evacuation warning/order
I evacuated after seeing the rainfall and sea/river levels rise
I evacuated because of verbal warnings given by thosearound me
I evacuated because I saw those who were evacuating
I evacuated because I was forced by authorities (police,army, firefighters, etc)
% or respondents
OCD issued an evacuation
warning, obeyed by 73% (n=124)

Evacuation mode and destination
Destination Mode of Evacuation
34%
29%
20%
7%
8%
2%
0% 10% 20% 30% 40%
Shelter Area(Evacuation Centre)
Place of other familyor relatives
Nearby high ground
Other public facility
High Buildings
No answer
% or respondents
74%
9%
2%
8%
2%
6%
0% 20% 40% 60% 80%
Walking
Motorcycle
Bycicle
Car or multicab
Other
No answer
% or respondents
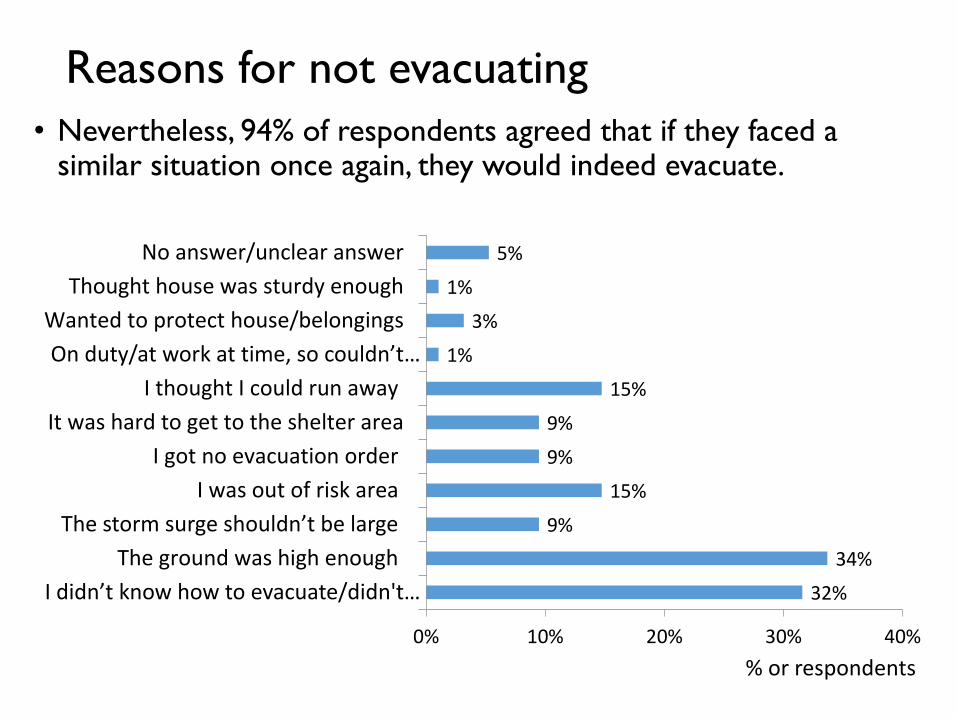
Reasons for not evacuating
• Nevertheless, 94% of respondents agreed that if they faced a similar situation once again, they would indeed evacuate.
32%
34%
9%
15%
9%
9%
15%
1%
3%
1%
5%
0% 10% 20% 30% 40%
I didn’t know how to evacuate/didn't …
The ground was high enough
The storm surge shouldn’t be large
I was out of risk area
I got no evacuation order
It was hard to get to the shelter area
I thought I could run away
On duty/at work at time, so couldn’t …
Wanted to protect house/belongings
Thought house was sturdy enough
No answer/unclear answer
% or respondents
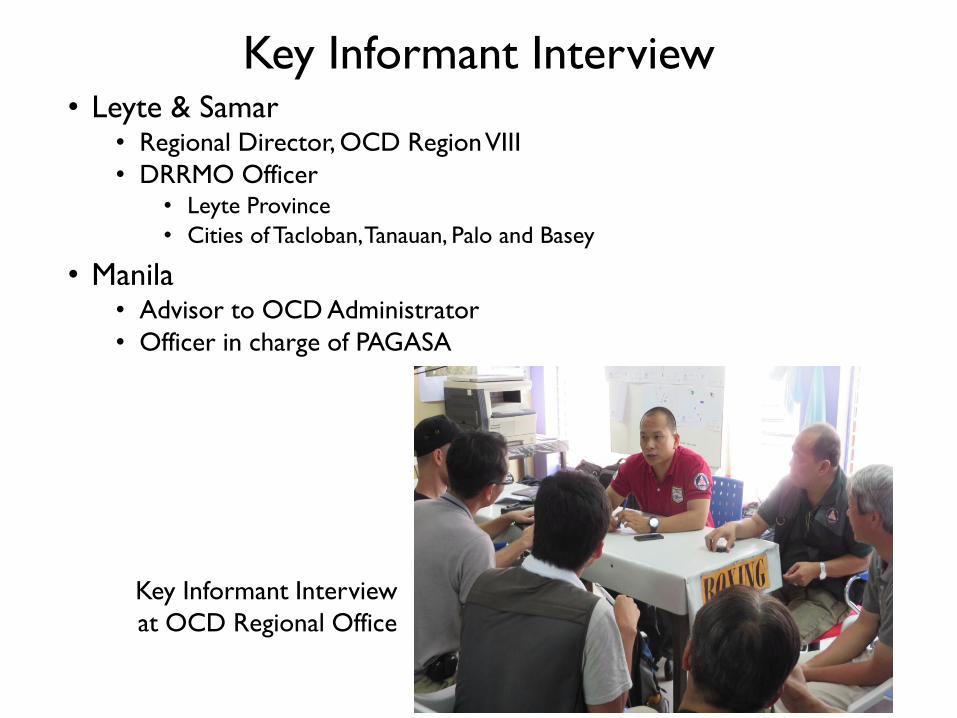
Key Informant Interview • Leyte & Samar
• Regional Director, OCD Region VIII
• DRRMO Officer • Leyte Province
• Cities of Tacloban, Tanauan, Palo and Basey
• Manila • Advisor to OCD Administrator
• Officer in charge of PAGASA
Key Informant Interview
at OCD Regional Office

• Give an accurate picture of the event
• Many respondents said that they did not possess an accurate picture of the event.
• Key informants emphasized that people had been warned of the flooding, though they just did not seem to conceptualize the phenomenon itself correctly.
• Many people expressed the view that it would have been better for authorities and media to describe it as a “tsunami or tidal wave”, which would have given people a better feeling of the danger
• Give an easy warning
• Information given by PAGASA being too technical. Storm surges were explained as “dagko nga balod” (“very big waves”). Some people thought that their houses could withstand strong waves, and did not evacuate
• Education
• Many of respondent did not evacuate because of the lack of knowledge on evacuation.
Key Points for Disaster Management (5)

6. Recovery Process
Survey Period: May 2014

6. Recovery Process
(1) Change of Living Place

Living place – Four different case
1. Own House (Original Place)
2. Evacuation Center
3. Bunkhouse
4. Tent
67

Change of living place - Own house
• Before the disaster • Own house or emergency shelter
• At the time of disaster • Own house or emergency shelter
• Soon after the disaster Stayed short period in emergency shelter then
1. Went back to own house
2. Left Leyte for relatives or friends place (sometimes stayed in several place) then came back to own house
• May 2014 • Own house
68

Why they left?
• Difficult to reach emergency supplies.
• No water and electricity
Reason for they left Tacloban City
Threfore,
• After establishment a system to supply relief goods to the disaster affected people who were staying outside the evacuation centers, they came back to Tacloban.
• Relief goods supply ended at the end of March, 2014.
69

Change of living place - Bunkhouse
70
Almost people living with family.
Time to move to
bunkhouse Most of the people moved to the
bunkhouse between Mar. 1 and Mar.
8.
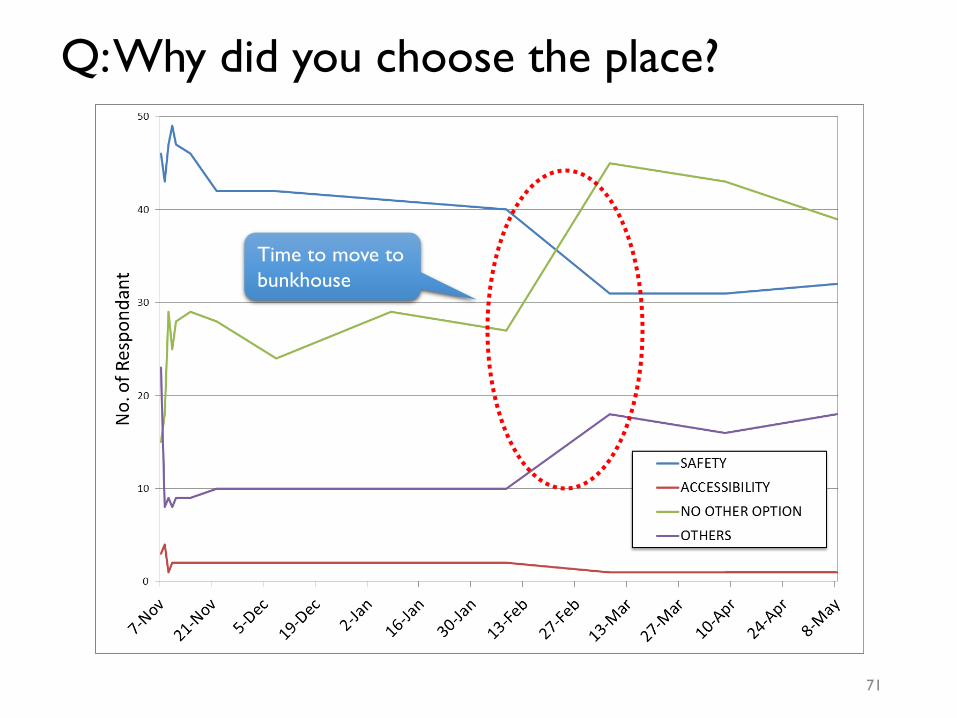
Q: Why did you choose the place?
71
Time to move to
bunkhouse

Q: Who instructed you to go to the place?
72
BGY Captain
Gov. Official
Time to move to
bunkhouse

6. Recovery Process
(2) Gaps between Assistance and Needs

Q: What kind of assistance did you receive?
74

Q: Who gave you the assistance?
75

Q: What kind of assistance did you need?
76
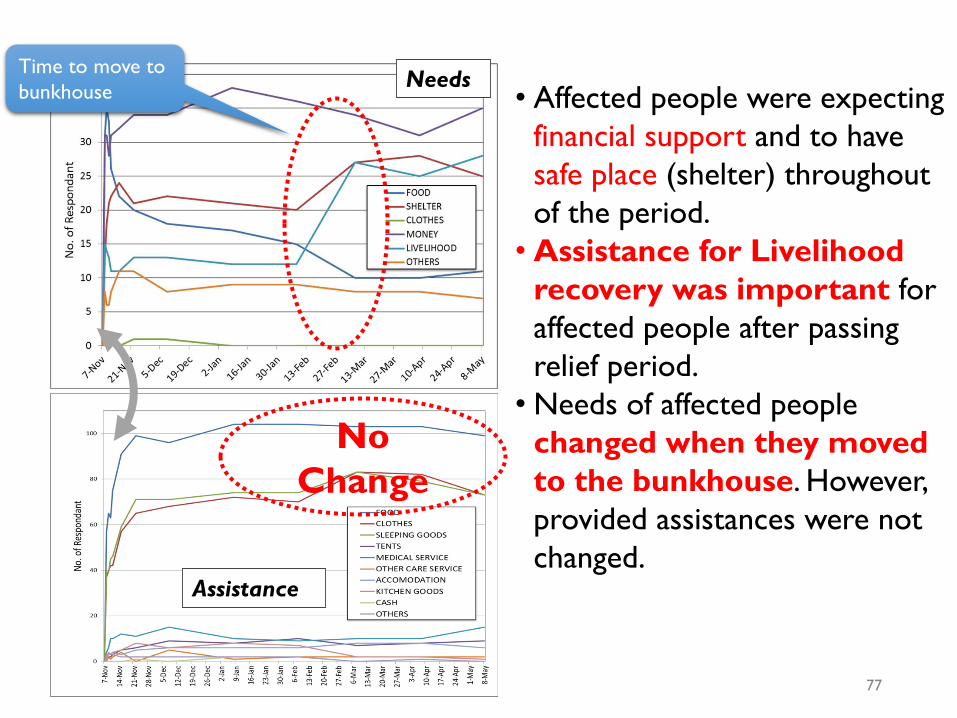
77
Time to move to
bunkhouse • Affected people were expecting
financial support and to have
safe place (shelter) throughout
of the period.
• Assistance for Livelihood
recovery was important for
affected people after passing
relief period.
• Needs of affected people
changed when they moved
to the bunkhouse. However,
provided assistances were not
changed. Assistance
Needs
No
Change

Key Points for Disaster Management (6)
• Establishment of an appropriate system for distributing
assistances to the people who were staying outside the
evacuation centers
• Victims who returned to home from the evacuation center left
Tacloban because of the difficulty of access to the assistance
• Establishment of the appropriate system will also contribute to
minimize the people in evacuation centers, and it will lead the
improvement of living environment of the evacuation centers
• Mindsets Change of assistance providers
• Gap between provided assistance and needs
Victim’s needs: changed form goods to livelihood recovery
Provided assistances: no change

Thank you for your attention