detailed requirements and constraints for the control of ...€¦ · project no. 609687...
TRANSCRIPT

General rights Copyright and moral rights for the publications made accessible in the public portal are retained by the authors and/or other copyright owners and it is a condition of accessing publications that users recognise and abide by the legal requirements associated with these rights.
Users may download and print one copy of any publication from the public portal for the purpose of private study or research.
You may not further distribute the material or use it for any profit-making activity or commercial gain
You may freely distribute the URL identifying the publication in the public portal If you believe that this document breaches copyright please contact us providing details, and we will remove access to the work immediately and investigate your claim.
Downloaded from orbit.dtu.dk on: Nov 27, 2020
Detailed requirements and constraints for the control of flexibility
Hänninen, Seppo; Kyritsis, Anastasios ; Abdulhadi, Ibrahim ; Schwalbe , Roman; Strasser, Thomas;Kosmecki, Michael; Sobczak , Bogdan; Rink, Robert; Kedra, Bartosz; Wilk, MaclejTotal number of authors:24
Publication date:2015
Document VersionPublisher's PDF, also known as Version of record
Link back to DTU Orbit
Citation (APA):Hänninen, S., Kyritsis, A., Abdulhadi, I., Schwalbe , R., Strasser, T., Kosmecki, M., Sobczak , B., Rink, R.,Kedra, B., Wilk, M., Jankowski , R., Marinelli, M., Hu, J., Verbeeck, J., Obushevs, A., Guagliardi, A., Blank, M.,Lehnhoff, S., Mayer, C., ... Evens, C. (2015). Detailed requirements and constraints for the control of flexibility.

Project No. 609687
FP7-ENERGY-2013-IRP
WP 6Controllable Flexibility
Internal Report R6.1
Detailed requirements and constraints for the control offlexibility
16/01/2015
ELECTRAEuropean Liaison on Electricity Committed
Towards long-term Research Activities for SmartGrids

Project ID: 609687
dd/mm/yyyy Page 2 of 2
ID&TitleR6.1Detailed requirements and constraints for thecontrol of flexibility
Number of pages: 118
Short description (Max. 50 words):
This Electra internal report describes the nature, availability and contribution of the flexibilityresources, and identifies sources of control conflict and their extent across controlboundaries. Furthermore it establishes appropriate control cycles across flexible boundariesof control through which controllers at different system levels should adhere to.
Version Date Modification’s nature
V 0.01 03/10/2014 Table of content
V 0.02 13/10/2014 First draft for Ch 3,4,5+ table of content for Ch 6
V 0.03 03/11/2014 Updated Ch 3, 4, 5
V 0.04 13/11/2014 Updated Ch 3, 4, 5, 6
V 0.05 21/11/2014 Updated introduction, summary
V 0.06 15/12/2014 WP6 internal review
V 1.00 10/12/2014 Submitted for TOQA review
V1.01 15/01/2015 Edited based on the comments of the quality review
V1.02 16/01/2015 Submitted to ELECTRA Technical Committee
Accessibility
PU, Public
PP, Restricted to other program participants (including the Commission Services)
RE, Restricted to other a group specified by the consortium (including the CommissionServices)
X CO, Confidential, only for members of the consortium (including the CommissionServices)
If restricted, please specify herethe group:
e
Owner / Main responsible:
WP 6 Leader: Seppo Hänninen (VTT)
Reviewed by:
WP 5 LeaderTOQA assigned reviewerTOQA assigned reviewer
Andrei Morch, SINTEFKlaas Visscher, TNOCarlo Tornelli, RSE
05/01/201505/01/201505/01/2015
Final Approval by:
ELECTRA Technical Committee 16/01/2015

Authors
Name Last Name Organization Country
Seppo Hänninen VTT FINLAND
Anastasios Kyritsis CRES GREECE
Ibrahim Abdulhadi USTRATH United Kingdom
Roman Schwalbe AIT Austria
Thomas Strasser AIT Austria
Micha Kosmecki IEN Poland
Bogdan Sobczak IEN Poland
Robert Rink IEN Poland
Bartosz Kedra IEN Poland
Maciej Wilk IEN Poland
Robert Jankowski IEN Poland
Mattia Marinelli DTU Denmark
Junjie Hu DTU Denmark
Jef Verbeeck VITO Belgium
Artjoms Obushevs IPE Latvia
Antonio Guagliardi RSE Italy
Marita Blank OFFIS Germany
Sebastian Lehnhoff OFFIS Germany
Christoph Mayer OFFIS Germany
Evangelos Rikos CRES Greece
Fidalgo Jose Nuno INESC PORTO Portugal
Abdullah Nadar TUBITAK Turkey
Kari Mäki VTT Finland
Corentin Evens VTT Finland

Project ID: 609687
dd/mm/yyyy Page 4 of 118
Copyright
@ Copyright 2013-2016 The ELECTRA Consortium
Consisting of:
CoordinatorRicerca Sul Sistema Energetico – (RSE) Italy
ParticipantsAustrian Institute of Technology GmbH - (AIT) AustriaVlaamse Instelling Voor Technologisch Onderzoek N.V. - (VITO) BelgiumBelgisch Laboratorium Van De Elektriciteitsindustrie - (LABORELEC) BelgiumDanmarks Tekniske Universitet - (DTU) DenmarkTeknologian Tutkimuskeskus - (VTT) FinlandCommissariat A L’Energie Atomique Et Aux Energies Alternatives - (CEA) FranceFraunhofer-Gesellschaft Zur Förderung Der Angewandten Forschung E.V – (IWES) GermanyCentre For Renewable Energy Sources And Saving) - (CRES) GreeceAgenzia Nazionale per Le Nuove Tecnologie, L´Energia E Lo Sviluppo EconomicoSostenibile - (ENEA) ItalyFizikalas Energetikas Instituts - (IPE) LatviaSINTEF Energi AS - (SINTEF) NorwayInstytut Energetyki - (IEN) PolandInstituto De Engenharia De Sistemas E Computadores Do Porto - (INESC_P) PortugalFundacion Tecnalia Research & Innovation - (TECNALIA) SpainJoint Research Centre European Commission - (JRC) BelgiumNederlandse Organisatie Voor Toegepast Natuurwetenschappelijk Onderzoek –(TNO) NetherlandsTurkiiye Bilimsel Ve Teknolojik Arastirma Kurumu - (TUBITAK) TurkeyUniversity Of Strathclyde - (USTRATH) UKEuropean Distributed Energy Resources Laboratories (DERlab) GermanyInstitute for Information Technology at University of Oldenburg (OFFIS) Germany
This document may not be copied, reproduced, or modified in whole or in part for anypurpose without written permission from the ELECTRA Consortium. In addition to suchwritten permission to copy, reproduce, or modify this document in whole or part, anacknowledgment of the authors of the document and all applicable portions of thecopyright notice must be clearly referenced.
All rights reserved.
This document may change without notice.

Project ID: 609687
dd/mm/yyyy Page 5 of 118
Executive summary
This Electra internal report includes the work of Task T6.1 describing the nature, availability andcontribution of flexibility resources. This task also models the interactions across controlboundaries and identifies sources of control conflicts, giving also an overview of experiences fromthe ELECTRA partners regarding the realization of controllers in demonstration and field testprojects. The work was carried out during the period from May to December 2014.
The different type of flexibility resources, their characteristics, affecting market mechanisms andpotential for aggregation were researched using a survey among project partners. The parametersused to characterise flexibility include the amount of power modulation, the duration, the rate ofchange, the response time, the location, the availability, the controllability, etc. Views were alsoreceived how these parameters will develop until 2030 and what are the general trends fordevelopment of amount and controllability of this resource types. The parameters characterisingdifferent energy resources provide the technical requirements for their applicability to flexibleoperation of the grid and their suitability for frequency and voltage control now and in the future.Regarding the flexibility of electricity generation, gas turbines and other heat motors asreciprocating engines can be started quickest. The speed of power change is clearly the highest forheat motors and their minimum power is low. Also steam and combined heat and power plantscan be utilised in the relatively quick increasing of the electricity generation. Slower power changesare possible also with the nuclear power but they cannot be carried out continuously. Theregulation characteristics of hydro power are superb in comparison to the other electricitygeneration methods. Besides the sun power, wind power is increasing most quickly in the world inthe coming years. The modern wind power plants are able to active and reactive power control.Storage systems can contribute to the frequency and voltage control mechanisms. Charging anddischarging of the storage system at the right moments (response within milli-seconds to seconds)can help to preserve the balance between consumption and generation. Storages can also providesecondary and tertiary frequency control. Static compensation devices maintain desired voltagelevel by feeding the grid with necessary reactive power. FACTS devices and cross-borderconnections based on HVDC converter schemes can play an important role in frequency andvoltage support. Demand response, including industrial loads and household devices and electricvehicles, will have great influence in flexible operation of the grid.
This report describes appropriate models that characterize the interactions across controlboundaries under normal and emergency situations, introducing suitable data rates and models ofuse by real-time control functions. In the future power system scheme, TSOs will be able to controlsignificantly smaller part of the generation compared to the traditional centralized configuration,and thus they will not be able any more to compensate large deviations in the power balance.Moreover, increased electricity loads and sources such as EVs and residential PV systems, willinfluence the balance between day-ahead production and consumption schedule and will leaveenergy markets with higher and less predictable need for balancing power. The actors involved inthe future grid control are balance responsible Party (BRP), cell system operator (CSO), celloperational information system (COIS), distribution system operator (DSO). Their respective rolesare described and these actors play roles both to technical and market operations. Considering theweb of cells concept developed in this project, the generation units will be smaller and in manycases these will be renewable resources which are less suitable for frequency control [1]. For thatreason a more important role for participation at the demand side will be expected for voltage andfrequency control in the future. The report describes “model based interfaces”, where the flexibility

Project ID: 609687
dd/mm/yyyy Page 6 of 118
user and the flexibility contributor agree on a simplified model which describes the actual behaviourand constraints of the flexibility resource.
Main outcomes of the work are the definition of controller conflict from a flexible power systemperspective, a review of state of the art in power system control conflict and an outline of themethodology for identifying these conflicts during system operation and their impact on systemstability. The report summaries the main findings from the literature and from project participant’sexperience in terms of scenarios or examples of controller interactions resulting in conflict. Ameasure of controller conflict is presented for each example. This can be used as an indicator ofthe impact of controller conflict on system stability. Suggestions for resolving controller conflict arealso presented. The report describes the methodology proposed to construct such a dynamicmodel for the purposes of extracting conflicting interactions of interest from the point of viewfrequency and voltage stability. From the voltage stability perspective there are many factors whichmay significantly influence the environment for voltage stability. It seems quite certain, thatpossible conflicts affecting voltage stability may occur mainly due to lack of proper coordinationamong players in the system voltage control and reactive power reserves management which areTSOs, DSOs, Generators and Aggregators. Generally the scenery foreseen for frequency, voltageand reactive power control in 2030+ is much more complicated than it is presently.
An overview of experiences from the ELECTRA partners regarding the realization of controllers indemonstration and field test projects are also provided. It summarizes best practices and lessonslearned which will provide valuable inputs for the implementation of control concepts and theirtesting and validation. The main requirements for controllers are reliability, fault tolerance androbustness.

Project ID: 609687
dd/mm/yyyy Page 7 of 118
Terminologies
Abbreviations
ACACEaFFRAGCASAVRBASBRPCAESCAPEXCHILCHPCOISCSOCPUCWRDSODSRDFIGDGEDSOEERAELECTRA
EMSEPCEPREUDPEVEVSPFACTSFCRFCR-DFDSFOFRRFRTHPPHVHVACHVDCICTIGBTIRPISJPLAESLCCLFDDmFRRMPPT
Automatic generation controlArea control errorAutomatic frequency restoration reserveAutomatic generation controlAncillary ServicesAutomatic generation controlBuilding automation system.Automatic voltage regulationBalance responsible PartyCapital expenditureCompressed air energy storageController-hardware-in-the-loop testingCombined heat and power plantCell operational information systemCell system operatorCooling water reactorDistribution system operatorDistributed series reactorDouble fed induction generatorDistributed generationEuropean distribution system operatorsEuropean energy research allianceEuropean liaison on electricity committed towards long-termresearch activities for smart grids.Energy management systemEmergency power controlEuropean pressurised water reactorEnergy technology development and demonstration programElectric vehicleElectric vehicle service providerFlexible alternating current transmission systemsFrequency control reservesFrequency containment reserve for disturbancesFACTS device stabilizersFleet operatorFrequency restoration reservesFault ride throughHydro power plantHigh voltageHigh voltage alternative currentHigh voltage direct currentInformation and communication technologyInsulated-gate bipolar transistorIntegrated research programInformation systemJoint programmeLiquid air energy storageLine commutated converterLow frequency demand disconnectionManual frequency restoration reserveMaximum power point tracking

Project ID: 609687
dd/mm/yyyy Page 8 of 118
MSMVMVARMWNaSNiMHNVROPFPbAPCCPHESPHEVPHSPIDPLLPPPQRPSSPSTPVPVRPWMPWRQVRESRRRVRSCSCADASFCSGSGAMSMESSPSPSCSSSCSTATCOMSVCSVRTCRTSCSTSOTSRTFCTVRULTCUPFCVAR
VFTVPPVRVSCV2H
MilestoneMedium voltageMega unit of reactive power in electrical engineeringMega wattSodium sulphurNickel metal hydrideNational voltage regulatorOptimal power flowLead (Pb) acidPoint of common couplingPumped hydro energy storagePlugin hybrid electric vehiclePumped hydro storageProportional integral derivativePhase locked loopPower plantReactive power (Q) regulatorPower system stabilizerPhase shifting transformersPhotovoltaicPrimary voltage regulationPulse width modulationPressurised water reactorReactive power (Q) and voltage (V)Renewable energy resourcesReplacement reservesRegional voltage regulatorSupercapacitorSupervisory control and data acquisitionSecondary frequency controlSmart gridSmart grid architecture modelSuperconductive magnetic energy storageSubprogramSpecial protection and supplementary controlStatic synchronous series compensatorStatic compensatorSecondary voltage controlSecondary voltage regulationThyristor controlled reactorThyristor controlled series compensationTransmission system operatorThyristor Switched reactor (capacitor)Tertiary frequency controlTertiary voltage regulationUnder load tap changing transformersUnified power flow controllerVAR compensator is a set of electrical devices for providingfast-acting reactive power on high-voltage electricitytransmission networksVariable frequency transformerVirtual power plantVoltage regulatorVoltage source converterVehicle to home

Project ID: 609687
dd/mm/yyyy Page 9 of 118
Table of contents1 Introduction ............................................................................................................................ 14
1.1 Scope of the report ......................................................................................................... 14
1.2 Structure of the report ..................................................................................................... 15
2 Methodology .......................................................................................................................... 16
3 Characterizing flexibility potential and control requirements for frequency and voltage control ......……………………………………………………………………………………………………………..18
3.1 Electricity generation ....................................................................................................... 18
3.1.1 Hydro power ............................................................................................................ 19
3.1.2 Thermal power ......................................................................................................... 23
3.1.3 Nuclear power.......................................................................................................... 26
3.1.4 Wind power .............................................................................................................. 28
3.1.5 Photovoltaic ............................................................................................................. 32
3.2 Demand response........................................................................................................... 33
3.2.1 Industrial loads......................................................................................................... 33
3.2.2 Electric vehicles (EV) ............................................................................................... 34
3.2.3 Household appliances.............................................................................................. 36
3.3 Energy Storage ............................................................................................................... 37
3.3.1 Electricity storage .................................................................................................... 38
3.3.2 Heat and cold storage .............................................................................................. 40
3.3.3 Pumped hydro storages (PHS) ................................................................................ 40
3.3.4 Other types of storage ............................................................................................. 46
3.4 Other flexibility resources ................................................................................................ 47
3.4.1 Static compensation devices.................................................................................... 47
3.4.2 Static compensators (STATCOM) and other FACTS devices .................................. 47
3.4.3 Synchronous condensers ........................................................................................ 48
3.4.4 Cross border connections ........................................................................................ 48
3.4.5 Tap changing transformers ...................................................................................... 50
3.4.6 Phase shifting transformers ..................................................................................... 52
3.4.7 Frequency transformer............................................................................................. 52
4 Abstractions for modelling interactions across control boundaries ......................................... 53
4.1 Identification of control boundaries within the European Electricity Networks .................. 53
4.1.1 State of the Art in Frequency Control and Regulating Reserves .............................. 53
4.1.2 State of the Art in Voltage Control and regulating Reserves .................................... 56
4.1.3 Frequency and Voltage Control - the Vision of 2030 ................................................ 59
4.2 Interactions between actors involved in Frequency Control ............................................. 61

Project ID: 609687
dd/mm/yyyy Page 10 of118
4.2.1 Interactions between actors involved in Voltage Control .......................................... 62
4.2.2 Primary Voltage Control ........................................................................................... 64
4.2.3 Secondary voltage control ....................................................................................... 65
4.2.4 Tertiary voltage control ............................................................................................ 66
4.3 Interactions modelling under normal and emergency situations ...................................... 67
4.4 Model based interfaces for demand response contributors ............................................. 68
4.4.1 Interface requirements for demand response ........................................................... 68
4.4.2 Model Based interfaces ........................................................................................... 69
4.4.3 Hardware abstraction ............................................................................................... 70
4.4.4 Flexibility categories ................................................................................................ 71
5 Modelling the conflicts across multiple control boundaries ..................................................... 72
5.1 Definition and causes of controller conflict ...................................................................... 72
5.1.1 Definition of controller conflict .................................................................................. 72
5.1.2 State of the art and identification of the causes of controller conflict ........................ 73
5.2 General methodology for controller conflict identification in a system with high penetrationof flexibility resources ................................................................................................................ 80
5.2.1 Mapping between flexibility resources ...................................................................... 81
5.2.2 Development of representative control sequences ................................................... 81
5.2.3 Identification and classification of controller conflict ................................................. 81
5.3 Impact of controller conflict on frequency stability ........................................................... 82
5.3.1 Identification of conflict scenarios impacting frequency stability ............................... 82
5.3.2 Approaches to quantifying controller conflict impact on frequency stability ............... 88
5.4 Impact of controller conflict on voltage stability ............................................................... 89
5.4.1 Identification of conflict scenarios impacting voltage stability ................................... 90
5.4.2 Approaches to quantifying controller conflict impact on voltage stability ................... 95
6 Experiences in controller development, implementation and deployment in demonstration andfield test projects ........................................................................................................................... 97
6.1 Introduction ..................................................................................................................... 97
6.2 Control algorithm definition and prototyping .................................................................... 97
6.2.1 Development/collection of environment/plant model ................................................ 98
6.2.2 Development of controller model ............................................................................. 98
6.2.3 Concept testing and validation ................................................................................. 99
6.3 Controller development and implementation ................................................................... 99
6.3.1 Interface definition for testing environment and target environment ....................... 100
6.3.2 Development of validation scenarios and test cases .............................................. 101
6.3.3 Controller development .......................................................................................... 101
6.3.4 Controller-Hardware-in-the-Loop testing (CHIL) ..................................................... 102

Project ID: 609687
dd/mm/yyyy Page 11 of118
6.4 Controller deployment ................................................................................................... 102
6.4.1 Open and closed loop operation ............................................................................ 102
6.4.2 Acceptance test ..................................................................................................... 103
6.4.3 Start of unattended operation................................................................................. 103
6.5 Validation of the developed control concept in field test ................................................ 103
6.5.1 Analysis of measurement data ............................................................................... 103
6.6 Experiences and lessons learned from demonstration and field test projects ................ 104
6.6.1 Experiences, best practices and lessons learned ................................................... 104
6.6.2 Important points for the ELECTRA developments .................................................. 104
7 Conclusions ......................................................................................................................... 106
8 References .......................................................................................................................... 112
9 Disclaimer ............................................................................................................................ 118

Project ID: 609687
dd/mm/yyyy Page 12 of118
List of figures and tables
Figures
Figure 1: Power ratings and discharge times required for different types of networkservices. ...................................................................................................................................... 38Figure 2: Current framework for frequency regulation within the European ElectricityNetworks [65] .............................................................................................................................. 54Figure 3: Traditional centralized Power system configuration with vertical control capability ..................................................................................................................................................... 55Figure 4: General Voltage regulation scheme in nowadays large power systems ................. 57Figure 5: The bi-directional vertically and horizontally integrated power system controlscheme ........................................................................................................................................ 60Figure 6: Future Power system configuration based on the combination cells (web of cellsconcept) ....................................................................................................................................... 60Figure 7: The scheme of the hierarchical voltages control of a National Transmission Grid 63Figure 8: Time responses in closed loop of the hierarchical voltages control of a nationaltransmission grid ........................................................................................................................ 64Figure 9: The AVR Controller ..................................................................................................... 65Figure 10: The Secondary Hierarchical Voltage Control Structure ......................................... 66Figure 11: Voltage controllers interaction of the HV transmission grid .................................. 67Figure 12: Explanation of the model based interface for demand response contributors .... 69Figure 13: Adaption of the original equations and constraints in power and energy terms . 71Figure 14: General methodology for the identification of controller conflicts. ...................... 80Figure 15: Design, implementation and validation process for Smart Grid systems andapplications (simplified view) [110] ........................................................................................... 97Figure 16: Example architecture for interfacing a voltage controller to operate in testenvironment and field [109]...................................................................................................... 100Figure 17: Example architecture for synchronizing several components in a co-simulationenvironment [110] ..................................................................................................................... 101Figure 18: Example configuration for Controller Hardware in the Loop: CoordinatedSimulation of power grid, communication, with the controller operated at the field targethardware [110]........................................................................................................................... 102
Tables
Table 1: Typical hydropower size and connection to grid ....................................................... 19Table 2: Some control characteristics of hydropower ............................................................. 20Table 3: Power factor controllability of hydro power plants .................................................... 21Table 4: Future trends of hydro power ...................................................................................... 22Table 5: Control characteristics of the thermal power plants .................................................. 24Table 6: Typical gas power plants and connections to grid and control ................................ 25Table 7: Typical wind power size and connections to grid ...................................................... 29Table 8: Output power controllability for wind power .............................................................. 29Table 9: Power factor controllability for wind power ................................................................ 31Table 10: Typical pumped hydro power size and connections to grid.................................... 42Table 11: Availability of control for pumped hydro power ....................................................... 43Table 12: Output power controllability for pumped hydro power ............................................ 44

Project ID: 609687
dd/mm/yyyy Page 13 of118
Table 13: Power factor controllability for pumped hydro power ............................................. 46Table 14: Summary of examples and experiences of controller conflict involving flexibilityresources..................................................................................................................................... 73Table 15: Impact of grid state on the performance of protection schemes ............................ 78Table 16: Model components and their importance ................................................................. 84Table 17: Scenario impacts on frequency stability................................................................... 87Table 18: Component’s importance from voltage stability viewpoint ..................................... 90Table 19: Scenario impacts on voltage stability ....................................................................... 94

Project ID: 609687
dd/mm/yyyy Page 14 of118
1 Introduction
1.1 Scope of the reportThe main objective of the work package 6 (WP6) of Electra project is to design and develop controlfunctions for the three axes of grid operation (distributed control, vertical control, pan-Europeancontrol). The main focus is in the frequency and voltage control in the transmission level but alsothe other control objectives in distribution level, among other reactive power, load control etc. willbe taken into account in order to avoid congestions, security margins and minimising losses.
The purpose of this whole project is to research radical control solutions for the real time operationof the 2030 power system. The control solutions utilise the flexibility from across traditionalboundaries (of voltage level, stakeholders, license areas, etc.) in a holistic fashion and buildubiquitous sensing and dynamic and autonomous control functions under normal and disturbedconditions.
A number of national and European projects have demonstrated the utilisation of flexibility withinindividual categories of grid connected devices, such as various types of domestic load, EVcharging, storages, virtual power plants (VPPs) with distributed generation. This work packagebuilds on this body of work but importantly addresses the problem more holistically. The work willconsider the flexibility of different types of resources (demand, generation, storage,interconnection, network automation and network devices) and the coordinated utilisation ofdispatchable resources taking account of inherent fast-acting response of other devices. Thesolutions exploit the design of associated flexibility in control and protection schemes in order toadapt to the changing of power system states. Such a scheme must take account of inherentdynamic response, local controls, centralised control actions, decentralised controls, and direct andprice driven control mechanisms. This work will include the flexible provision of both voltage andfrequency control.
Effective control and equitable distribution of rewards requires the flexibility to be measurable.Control actions must take account of the confidence bands associated with these observations.Such flexibility must be able to be exercised under emergency and restorative conditions as well asnormal operating conditions. The solutions are based on the Smart Grid Architecture Model(SGAM), and they use the flexibility available at smart grid connection points and in the networkprovided by a diverse group of actors – individual prosumers, large generators, network operators,aggregators, suppliers. The work is also in line with the high profile of flexibility in SRA2035,especially Research area IS “Integrated truly sustainable, secure and economic electricitySystems”. This work package will develop key elements that contribute to the realisation of the newsystem control architectures under development within the EERA JP SG SP1. Likewise the controltechniques will incorporate the flexibility available from storage resources in SP4 andinteroperability issues available in SP3.
Task 6.1 is preparing for the conceptual design of the controllable flexibility by further detailing therequirements and issues as well as detailing the means such as the sources of flexibility, startingfrom the overall problem description worked out in WP3 (D3.1). The outcome of Task 6.1 will bedocumented in this internal report R6.1.
The large scale of controllable resources available at different voltage levels will play an importantrole in operating the network in a more flexible manner. These ‘flexibility resources’ are to be usedto overcome constraints and increase network reliability and security. At the same time flexibilityresources available at the consumer level can be integrated in the network through a marketmechanism. However, the types of available responses will vary with consumer types and theavailability of the resources. The results characterise the nature, availability and contribution ofthese flexibility resources including the control regimes necessary to integrate them in the overall

Project ID: 609687
dd/mm/yyyy Page 15 of118
network operation strategy. It will produce a set of template flexibility responses based on differentresource types and potential responses.
The interactions between the different stakeholders become more complex in an increasinglyflexible power system. Moreover, real-time operation of the system in full view of these interactionsis challenging. Therefore it is necessary to understand the impact of control actions acrossoperator boundaries (DSO-DSO, TSO-DSO, TSO-TSO). The establishment of a level ofstandardisation and commonality in operational procedures of the interaction between systemoperators and control elements will be researched. These interactions will be in the set power flowexchanges and ancillary services across control boundaries, and will provide for clear responsibilitypartitioning between stakeholders and control entities. The results include models that characterisethese interactions under normal and emergency situations, introducing suitable data rates andmodels of use by real-time control functions. The results also include these models in a form that issuitable for supporting real-time system control functions as e.g., models to be used by stateestimators.
Conflicting control actions can arise between multiple control schemes even though the controlactions aim to satisfy a single operating objective. This particularly manifests itself when theschemes operate at different control boundaries. Frequency and voltage control are particularlyprone to such conflict and are in evidence across the approaches of individual focussed projects.For instance, demand side measures and primary frequency control acting at the same time toprovide a frequency response can result in controller hunting. A similar situation can be observedwith voltage controls that are implemented with a mix of conventional (tap changer, excitercontrols) and power electronic based voltage control.
In summary, this Electra internal report includes the work of Task T6.1 describing the nature,availability and contribution of these flexibility resources and will identify sources of control conflictand their extent across control boundaries. Furthermore it will establish appropriate control cyclesacross flexible boundaries of control through which controllers at different system levels shouldadhere to [2].
1.2 Structure of the reportThe document has been divided into four different main chapters that cover the work done in theELECTRA Task 6.1 and its three different subtasks during the period from May to December 2014.
Chapter 3 provides a summary of the Sub-task 6.1.1 “Characterising flexibility potential and controlrequirements”. It describes the results of survey carried out among WP6 partners with regard to thecharacteristics of different flexibility resources including the inherent flexibility of electricitygeneration, storages, demand response and other type of flexible resources.
Chapter 4 describes the appropriate models that characterize the interactions under normal andemergency situations across control boundaries, introducing suitable data rates and models of useby real-time control functions. The work was conducted in subtask 6.1.2 “Creation of suitableabstractions for modelling interactions across control boundaries”. The fundamental concepts thatgovern the operation of the present electricity networks are presented. These concepts are appliedboth to frequency and voltage control of the present electrical network and executed/applied locallyor from distance. These operation and control principles through appropriate modifications oradjustments would dominate also the operation of the future electrical networks.

Project ID: 609687
dd/mm/yyyy Page 16 of118
Chapter 5 describes the main outcomes of the work conducted under subtask T6.1.3 “Modellingthe conflicts across multiple control schemes”. It includes the definition of controller conflict from aflexible power system perspective, a review of state of the art in power system control conflict andan outline of the methodology for identifying these conflicts during system operation and theirimpact on system stability.
Chapter 6 provides an overview of experiences from the ELECTRA partners regarding therealization of controllers in demonstration and field test projects. It summarizes best practices andlessons learned which will provide valuable inputs for the implementation of control concepts inWP6 and their testing and validation in WP7.
2 Methodology
The methodology used to collect practical knowledge from the flexibility resources in the grid isbased on survey among the WP 6 partners and data collected from literature. The WP 6 partnersrepresent a as from many sides as possible different European electricity market. For the survey atemplate was prepared and circulated. The questions in the template addressed to different typesof flexibility resources, their characteristics and affecting market mechanisms. The flexibility ofdifferent resources is able to characterise with parameters which are the amount of powermodulation, duration, the rate of change, response time, location, availability, controllability, etc.Important aspect was to receive views how these parameters will develop until 2030 and what arethe general trends for development of amount and controllability of this resource types. In all, 12partners among WP6 answered to this enquiry. The chapter 3 describes the results of this survey.The parameters characterising different flexibility resources provide the technical requirements ofthese resources for flexible operation of the grid and their suitability for frequency and voltagecontrol in the future.
The work under T6.1.2 was initiated by preparing a template in order to collect material andanalysis related to control interactions. This survey was used for the elaboration of the high-levelapproach which showed the abstractions of interactions between various actors from the point ofview of TSOs and DSOs (based on the ENTSO-E [62-63],[65-70] and EDSO SmartGrids reports[61],[64]). The next step was the elaboration of the specific high-level scheme, by means ofconsidering more concrete use cases which make use of flexibility for system operation. The roleof the template was to organise the collected information and cover topics such as scope, involvedactors, interactions and assets used for scheduling and real-time activation of resources andtechnical requirements. The focus was in the five main cases, namely; primary, secondary, andtertiary frequency control for TSOs, voltage control and congestion management for DSOs. Inorder to complement the analysis, two extra cases were studied regarding the use of flexibilityunder normal operation, such as; regulation and flexibility during fast ramps from Solar/Windgenerators.
The work undertaken in T6.1.3 aims to identify the sources of controller conflict and their extentacross control boundaries. In order to obtain the comprehensive view of state of the art in this area,a controller conflict example template was prepared, and task participants were requested toprovide examples based on literature or their own practical experiences. This forms the basis onwhich conflicting interactions are identified as well as the development of effective methods ofcontroller conflict resolution. More than 30 unique responses were provided by task participants.

Project ID: 609687
dd/mm/yyyy Page 17 of118
The responses which are most relevant to the proposed definition of controller conflict arepresented in section 5.1.2.
Dependencies between all subtasks of T6.1 were used to devise a high level methodology for theidentification of controller conflict in light of flexibility resource capabilities and the interactionsbetween these resources or their controllers. Furthermore, dependencies with T3.1 and T4.2.2were taken into account to ensure that that relevant backdrop of high level grid scenarios anddetailed use cases are utilised for identifying controller conflict. This methodology is outlined insection 5.2.

Project ID: 609687
dd/mm/yyyy Page 18 of118
3 Characterizing flexibility potential and control requirementsfor frequency and voltage control
This chapter provides a summary of the work under subtask 6.1.1. It describes the results of thesurvey carried out among WP6 partners with regards to the characteristics of different flexibilityresources including the inherent flexibility of electricity generation, storage, demand response andother types of flexible resources.
The characteristics and potential capabilities of different types of flexibility resources were collectedwith the aim of representing as much of the different European electricity markets as possible. Inorder to collect data related to flexibility resources, a template was prepared and circulatedbetween partners. The research questions addressed different types of flexibility resources, theircharacteristics, affecting market mechanisms and potential for aggregation. The parameters usedto characterise flexibility include the amount of power change, duration, rate of change, responsetime, location, availability, controllability, etc. It was also expected to receive views on how theseparameters will develop until 2030 and what the general trends are for the development andinstalled capacity and controllability of this resource types. Twelve partners among WP6 replied tothis enquiry. The results of this survey are presented in the following subsections of chapter 3. Theparameters characterising different flexibility resources provide the technical requirements forapplying these resources for the purposes of the flexible operation of the grid and their suitabilityfor frequency and voltage control in the future.
3.1 Electricity generationThe base-load power, peak-load power, reserve power and regulation power described the use ofpower plants. But after the liberalization of the electric markets the three first terms have lost theirofficial roles. However, the mode of production in power system varies in electricity markets ofdifferent countries. For example, the condensing power plant is used often for peak-load powerproduction in Finland whereas for base-load power production in Germany. Base-load powermeans production capacity which is even and the production amount of electricity is wellforeseeable. Base-load capacity is, for example, hydropower, combined heat and power andnuclear power. The annual operating time of peak-load power is normally short and it is used forload levelling for the purpose of reducing peak demand. Peak-load power can be supplied fromhydropower plants or generated by gas turbines. The reserve power replaces the base-load powerduring maintenance or failure of the power plant. The same power plant may be used for both thereserve or peak-load purposes. The regulation power refers to production capacity in electricitymarkets or other flexible production by which the controllable electricity generation adapts to thevariability of renewable electricity generation (wind, solar etc.) and consumption. The regulationcapacity is used for hourly, daily or weekly regulation.
The minimum power which can be used to run a power plant, start speed and speed which can beused to carry out power changes affect the regulation properties of the power plants. Gas turbinesand motors are the quickest to start. The speed of power change is clearly the highest for motorsand their minimum power is low. Also steam and combined heat and power plants can be utilisedrelatively quickly to increase the electricity production if they are already running and operatingunder the nominal power production. Slower power changes are possible also with nuclear powerbut they cannot be carried out continuously.

Project ID: 609687
dd/mm/yyyy Page 19 of118
3.1.1 Hydro power
The regulation characteristics of hydro power are superior in comparison to other electricitygeneration methods. Hydro power is best suited for regulation purposes, particularly for high-speedregulation. Hydro power is the most profitable alternative in the hour time frame and quickerregulation. Also the main part of the daily power balancing is carried out by hydro power. Exploitingthe hydro capacity for high-speed regulation of the power system needs effective short term waterregulation and sufficient water stores.
The regulation capability depends on the adequacy of water, season, water system and type ofturbine. The regulation causes changes in the water level downstream of the water system. Therequirements of the licence also influence on the possibilities of regulation by setting restrictions tothe water level changes and water flow rate. River hydro power can be exploited in power systemregulation but its regulation characteristics are not as good as the ones of reservoir type hydropower. The regulation characteristics of the river hydro power can be improved by optimizing theutilization of the whole water system. Typical hydropower size and connection to grid are shown inTable 1.
Table 1: Typical hydropower size and connection to grid.
Country Typical unit size Connectinggrid level
Type ofcommunicationchannel
Availability ofcontrolfunctions
Finland In all 250 powerplants. In the rangeP > 100 MW (100-182 MW, 6 plants),100 MW>P>10MW, 54 plants.
P >10 MWconnected toHV and smallerto MV.
Fixed fibreconnection for largeand medium sizeplants. Wirelessconnection forsmaller plants.
Frequency andvoltageregulation
Italy In all 2977 powerplants. In the rangeP > 200 MW, 17plants; 200MW>P>10 MW,293 plants.
P >10 MWconnected toHV 10 MW>P>100 kW to MV.
Fixed fibre or wiredconnection for largeand medium sizeplants. Wirelessconnection forsmaller plants.
For P> 10MW,frequency andvoltageregulation
Greece In all 15 (3018MW)large power plants.In the range P >100 MW (100-437.2 MW), 11plants), 100MW>P>10 MW, 4plants. Also, 104(219,84MW) smallhydro-electricplants.
P >10 MWconnected toHV 10 MW>P>100 kW to MV.
Wired and wirelessconnection.
Frequency andvoltageregulation

Project ID: 609687
dd/mm/yyyy Page 20 of118
Latvia 10 units, total: 894MW, Francisturbines
HV, 330kV Fixed fibreconnection.
Voltageregulation
Poland There are 73 unitsin run-of-riverpower plants,among them : P =26MW – 6 units, P= 10MW..14MW –9.
Usually P >10MW connectedto HV andsmaller to MV.
Some largerconnected by fixedfibre.
Frequency andvoltageregulation
Turkey In the range P >100 MW 27 plants,P<100 MW 44plants.
HV By Turkish Telecomoptical fibre utility
Frequency andvoltageregulation
Portugal
5239 MW (Total).With 413 MW ofSmall Hydro power
UHV/HV Fibre connection Secondaryfrequencycontrol andVoltageregulation
Table 1 shows typical size of hydro power plants in some European countries [3…14] and Table 2shows the control characteristics of hydropower. Largest plants are between 200 MW- 500 MW.Plants P >10 MW are connected to the HV network and smaller capacities are connected to theMV network. In each country there are also many small scale hydropower plants connected tomedium or low voltage networks.
Power plants have remote communication and control capability by fibre or wired connection forlarge and medium size plants and wireless connection for smaller plants. The parameters arepossible to change via remote connections by service and mode control, but set points can bechanged also locally. Smaller generators have usually fixed control.
Table 2: Some control characteristics of hydropower.
Characteristics Hydro power Pumpedhydro unit*
Efficiency
old 87 % 66 %
new 92 % 70 %
Starting times
cold start-up n/a 5-10 min
warm start-up 1-2 min 30 s

Project ID: 609687
dd/mm/yyyy Page 21 of118
hot start-up 1-2 s 1-2 s
Minimum power 15-20 % 5-20 %
Speed of power change high high
*Pumped hydro unit = one pump turbine; cold start-up = the time from pumping state to electricity generation; warm start-up = from stand idle to electricity generation; hot start-up = turbine is already running.
They have usually continuous availability and simultaneous provisions for both voltage andfrequency control. Local voltage and frequency control schemes are normally used. For thesynchronous and asynchronous generators the voltage regulation is executed by excitation(Voltage Control and Excitation System), and frequency regulation by rotating speed of turbine(Governor).
The output power controllability for upwards regulation is 20%->100% and for downward regulation100%->20% of nominal power. The constraints for regulation action are the minimum power of 15-20 %, size of water reservoirs and the regulation time, being in warm start 1-2 min and in hot start1-2 sec. The duration of control can range from minutes to some hours depending on waterreservoirs. Table 3 shows corresponding parameters for power factor controllability of hydro powerplants and Table 4 the future trends.
Table 3: Power factor controllability of hydro power plants.
Country Power factorcontrollability[cos limits]
Constraintsofcontrollability
Duration ofcontrol
Response time
Finland 0,7–0,95. (cap/ind) Mins, hours Rotating DC exciter machine: 1-2 s, Static exciter: 0,15–0,3 s
Italy 0,7–0,95. (cap/ind) Mins, hours Rotating DC exciter machine: 1-2 s, Static exciter: 0,15–0,3 s
Greece 0,7-0,85* (cap./ind.)*0,4ind. for <35%loading
Voltage,Active power
Continuous Mins, hours
Latvia 0.85-1 (cap/ind) - - -
Poland 10MW typically0,93cap..0,99cap ÷0,83ind..0,88ind,the rest: cos 1,(cap/ind – inconvention ofgeneration)
Generatorcapabilitycurve
Continuous Static exciter: less 1 min
Turkey 0,7–0,95. (cap/ind) - Mins, hours Rotating DC exciter machine: 1-2 s, Static exciter: 0,15–0,3 s

Project ID: 609687
dd/mm/yyyy Page 22 of118
Market mechanisms affecting hydro power are the balancing power market for intra-day and hourregulation and bilateral contract for reserves. The big generation units are subject to no productionsubsidies and small hydroelectric power plants have potential for aggregation. A capitalexpenditure (CAPEX) for small-scale hydropower can be quite high. Small scale hydropower canbe subsidized as for example green certificates in Norway and Sweden.
Table 4: Future trends of hydro power.
Country How these parameters will developuntil 2030? General trends fordevelopment of amount andcontrollability of this resourcetype?
Additional information:
Finland Finland has about 2000 MW hydropower capacity for power regulationand it possible to increase 200 MW.By building two reservoirs too, (whichare now “freezed” since many yearsdue to the environmental reasons) theregulation capacity is possible toincrease for daily regulation by 300-400 MW.
Finland has mainly river hydroelectricpower plant with restricted reservoirs.After long regulation, it has to wait untilthe reservoir of the river has filled.
Italy Italy has about 22000 MW hydro powercapacity for power regulation
Greece The most important evolution until2030 is the increase in the number ofsmall hydro-electric power plants aswell as the use of more large-scaleplants as Pumped-hydro storagesystems. Currently, there are twoplants with storage capacity 699MW.According to the National Roadmap-2050 report, in order to fulfil the RESdevelopment targets, about 1 GW ofPHES capacity is required by 2020and 2 to 5 GW up to 2050, dependingon the scenario.
Latvia Daugava HPPs Plavinas+Rigas+Kegums)in total generated 2852 GWh of electricity,which constitutes 59% of the totalelectricity output. This approximatelycorresponds to the long-term averageelectricity output. Although the capacity ofthe hydropower plants is great, their

Project ID: 609687
dd/mm/yyyy Page 23 of118
ability to generate electricity depends onthe water inflow in the Daugava river. Thecapacity of the hydropower plants usuallycan only be fully utilised during the springhigh water period, which lastsapproximately two months. The greatestvolume of electricity generation usuallyoccurs in April.
Poland A significant number of newinstallations of run-of-river powerplants of power P 2MW shouldn’t beexpected till 2030. Building the secondstage of fall on Wis a near W oc awekwith a new 100MW run-of-river powerplant has been considering for longtime, but still the final decision hasn’tbeen made up.
The share of run-of-river power plants oftotal installed capacity amounts to 2%.
Turkey EÜA has more than 12.000 MWhydro power capacity and thiscorrespond to nearly 20 % of Turkishinstalled capacity. According to recentsearches Turkish energy demands willduplicate in 10 years. Due to thisprediction EÜA ’s mission is supplythis demands by using hydrolic powercapacity.
Portugal For 2030 is expected an increase ofthe total hydro power capacity for 9650MW.
Concerning the future trends Turkey is the only country that has possibilities to increase hydropower capacity significantly. The hydro power is based on river power plants in many countries andthe available capacity is already built in spite of the small hydro power plants which are stillpossible to increase a minor amount.
3.1.2 Thermal power
Typical thermal power plants are condensing, combined heat and power (CHP), gas turbine, motorand nuclear power plants. The nuclear power plants are discussed in the next paragraph 3.1.3.The starting time of condensing power plant depends on the time when the plant was last time inoperation (cold start or warm start). The start-up of warm plant takes about two hours but the start-up of the cold plant takes more than 10 hours. If the maintenance of the start readiness of thepower plant is neglected, the return to production may take months.

Project ID: 609687
dd/mm/yyyy Page 24 of118
The control characteristics of new coal fired plants are in the development phase with regards tothe minimum power. The objective is the running with 20 % part-load due to the development offeeding of the fuel. New technical solutions are also in the development phase allowing higherspeed of the temperature rise for the main components and solutions maintaining the temperatureof components during shutdown. Frequency and voltage control can be provided at the same time,given that the working point of the synchronous machine and of the prime mover are within thecapability limits.
The technical control characteristics of the motor power plants are insurmountable in comparisonto the other thermal power plants. The high maintenance charges of the motor power plants remainreasonable in the regulation power projects in the case the operation time is below 50 000 hoursduring the lifetime of the application. Motor power plants and gas turbines are normally used assystem reserves.
The exact values for the speed of power change are difficult to give for the combined heat andpower plants (CHP) intended for cogeneration of district heating or cogeneration of industry. Theincrease of the electricity power decreases the heat power or vice versa, in the case, the fuelefficiency remains constant. An advantage of using the cogeneration in the power system control isthe long and continuous power regulation possibility, because the CHP plants are in operation dueto the heat production. On the other hand, the control possibilities of the CHP plants for districtheating vary according to the season and temperature. The minimum power characteristics of thecogeneration based on the fluidized-bed boiler are quite good because the combustion process isstable. The fluidised bed is a large heat storage allowing the maintenance of the high temperatureof the power plant for long time during the shutdown. The cogeneration power plant for districtheating is normally run according to the heat demand. Therefore the possibilities to participate forgeneration of regulation power are low during the peak demand of heat power. Also during thesummer time the cogeneration may be too expensive due to the low heat demand. It is possible toincrease the flexibility of the cogeneration by heat storages, and in this way to decrease thedependence between electricity and heat production. For example, in Finland there are many heatstorages in use in the capacity range of 10 MWh to 10000 MWh and in the maximum power rangeof 1 MW to 130 MW. The energy efficiency of the heat storages is over 90 % in short term usage.
The main driver of the cogeneration in industry is the heat production whereas the electricity is onlythe secondary product. However, it is possible to increase the flexibility and electricity generation ofthe industry and its value on the electricity market. Depending on the profitability of the industrialproduction, flexibility can be achieved by increasing the electricity generation at peak demand,when the price of electricity is high, at the expense of heat production to industrial processes.Control characteristic of the thermal power plants are shown in Table 5. Table 6 shows typical gaspower plants and their connections to grid and control.
Table 5: Control characteristics of the thermal power plants.
Characteristics Condensingpower plant
Combinedpower plant(CHP)
Gasturbine
Motor Nuclear
Typical unit size
MWe 600-900 60-400 10-300 1-20 1000-1600

Project ID: 609687
dd/mm/yyyy Page 25 of118
Efficiency
old 40% 50% 32% 45% 33%
new (max) 47% 61% 38% 48% 37%
Starting time
cold start-up 5-10 h 2-3 h 10 min 15 min 2 days
warm start-up 3-5 h 1-1,5 h 10 min 15 min 1 day*
8-16 h,
60-100%
hot start-up 1,3-2,5 h 0,5-1 h 10 min 5 min 2-4 h
Minimum power 40% 40-50% 50%** 30%** (15-)30%
Speed of powerchange
3-6 %/min 4-6 %/min 5-10%/min
25%/min
*after shutdown of many hours** the emission threshold of nitrogen dioxide exceeds by running lower power. The technical minimum power 10 %.
Table 6: Typical gas power plants and connections to grid and control.
Country Typical unit size Connecting gridlevel
Type ofcommunication channel
Availabilityof controlfunctions
Belgium 100kW – 400MW LV/MV/HV Depends onthe size of theunit, fibreconnection
Frequency,voltagecontrol,powerbalancing
Denmark In the range of 100 - 600MW
HV Voltage andfrequency
Latvia 2 gas turbines and 1 steamturbine, 2x48MW and1x48MW total: 144MW, 1x1CCGT-2/1 (2008) 413MW(steam turbine122(150)MW, gas turbine291MW) and 1x1 CCGT-2/2(2013) 419MW (steamturbine 125(145)MW, gasturbine 294MW), total:Cogeneration 832 MW,Condensation 881 MW
Gas turbines 110kV and 330kV,steam turbines110kV
Fixed fibreconnection.
Voltageregulation
Poland There are 5 turbine sets ofpower P > 50MW: In therange P = 198MW..235MW
One gas-steampower plant(198MW) is
Fixed fibreconnection forlarge and
Voltage andfrequencyregulation

Project ID: 609687
dd/mm/yyyy Page 26 of118
– 2 turbine sets, P =101MW..116MW – 2 turbinesets.
connected toEHV, the restusually to HV,smaller to MV.
medium sizeplants.
Turkey In the range P > 100 MW 18plants, P<100 MW 4 plants.
HV By TurkishTelecomoptical fibreutility
Voltage andfrequencycontrol
Portugal 3829 MW (Total, includenon-renewablecogeneration
HV FibreConnection
Frequencyand Voltageregulation
Gas fired power plants are available for control continuously. Frequency and voltage control can beprovided at the same time, given that the working points of the synchronous machine and of theprime mover are within the capability limits. Concerning the output power controllability gas firedpower plants are able for upwards regulation: 40% ->100% of nominal power, and for downwardsregulation: 100% -> 40% of nominal power. The technical minimum is 20-50 % of nominal powerand the starting phase takes (typical) 2-15 minutes. For the power factor controllability, the coslimits are 0,7-0,95 ind/cap. The other constraints are:
excitation limits: field heating limit (max provision of reactive inductive power); under excitation limit (max consumption of reactive inductive power); armature heating limit (constraints with max active power output).
The duration of control may be from min to hours. Response time of control is 1-2 sec, usingrotating DC exciter machine, and 0,15 - 0,3 s for static exciter.
With regard to the general development trends for the amount and controllability of this resourcetype, the Polish Power System has 917 GW of power capacity of gas and gas-steam power plants.Realisation of investments planned to year 2030 can increase the amount to more than 6500 MW[11]. The share of gas and gas-steam power plants of total installed capacity amounts to 2,4%.Turkey has more than 13.000 MW of thermal power capacity and this correspond to nearly 20% ofTurkish installed capacity. According to recent searches Turkish energy demands will duplicate in10 years [13]. For 2030, Portugal is expecting a decrease of the total natural gas capacity for 1766MW. For 2030 is expected a gradual disqualification of all thermoelectric power station until 2030and the licensing of four CCGT groups (2017) [22].
3.1.3 Nuclear power
Nuclear power plants are normally run in full power because the capital costs are high but theoperating costs are low due to the low fuel cost. The reduction of the operating hours of plantdecreases the profitability of investments. The downward control is the primary because nuclearpower plants are run normally in full power. The need for downward regulation is most plausibleduring low demand. The regulation of the nuclear power plant succeeds best when the time andreduction of demand are foreseeable. Multiple changes of power production lead to no-optimal useof fuel. Any change of the operation state increases the risk of the failure occurrence and may leadto an unwanted shutdown. For example, due to these reasons, the Finnish nuclear authority(STUK- Radiation and Nuclear Safety Authority) has restricted the speed of power change, itsmagnitude and frequency by specifications.

Project ID: 609687
dd/mm/yyyy Page 27 of118
The generated power can be controlled by affecting to the nuclear reactivity, also known as to thenumber of nuclear fissions. The reactivity of the pressurised water reactor (PWR) is regulated bycontrol rods and by the boron concentration of the reactor water. The reactivity of the cooling waterreactor (CWR) is regulated by control rods and by the pumps recycling the reactor water. Thetechnical characteristics of the fission reactors restrict the ability to regulate the nuclear powerplant. The restricting factor for the speed of changes so called “xenon poisoning” affects to thestability of the power distribution in the nuclear core. The xenon stability after the power change ispossible to achieve in about 40 hours. This restricts the possibilities for the power changesespecially in the end of refuelling interval.
The new nuclear power plants are designed more suitable for control purposes. According to theclarifications done by Elforsk in Sweden for the Areva European Pressurised Water Reactor (EPR),the regulation characteristics for power changes are the following:
Down regulation (power drop) 5%/min in the power range 100% -> 60% and back in thedaily operation.
Down regulation 5%/min in the power range 100% -> 25% and after that the up-regulation2,5%/min in the power range 25% -> 60% . Main priority is down regulation.
The constructions of the Mitsubishi, Toshiba and General Electric-Hitachi have the same controlcharacteristics. France generates relatively the highest part of electricity by nuclear power in theworld. The power plants are controlled according to the variation of the demand. Nuclear power isalso used for frequency control. The controllability of the nuclear power plants is also taken in theaccount in the development of new reactors, and also the international nuclear association havegiven new recommendation for controllability of new power plants [14].
Typical unit sizes of Finnish nuclear power plants are 2x500 MW and 2x880 MW and one 1600MW unit is under construction. They fit to voltage and frequency control, and they are continuouslyavailable for control but control is rarely applied. For the output power controllability [MW or % ofnominal] the minimum power is 30 % of nominal power in continuous operation. The cold starttakes 2 days and warm start 1 day (8-16 h; 60% ->100 %) and hot start 2-4 h. The nuclear powerplants are intended for base load operation, and the power regulation means that the nuclear fuelis not used optimally. Duration of control may be from minutes to hours and the rate of change[MW/s] is 2,5-5 %/min of the nominal power. Response time is seconds.
For the power factor controllability, the cos limits are 0,7–0,95 (cap/ind). Constraint ofcontrollability is that generator must be able to produce the same amount of reactive power as thenominal active power for 10 s and minimum voltage is 70% of nominal voltage. Duration of controlis in min and the response time for a rotating DC exciter machine is 0,2-0,5 s: 0 ->90% voltage inup-regulation, and 0,2-0,8 s in down-regulation.
Concerning the future trends the nuclear capacity in base load operation will be about 4000-6000MW in Finland and from the control point of view the main priority is the down regulation [3]. Thefirst nuclear power plant in Poland will start operation in year 2024 with generating capacity of 1000MW, which is going to reach 3000 MW in 2030. Total capacity of nuclear power plants will reach6000 MW in 2035, [15].

Project ID: 609687
dd/mm/yyyy Page 28 of118
3.1.4 Wind power
Wind power, besides the sun power, is increasing most quickly in the world in the coming years.The modern wind power plants are able to active and reactive power control. The power of windturbine is possible to control in three different way; Pitch Controlled Wind Turbines, Stall ControlledWind Turbines and Active Stall Controlled Wind Turbines.
On a pitch controlled wind turbine the turbine's electronic controller checks the poweroutput of the turbine several times per second. When the power output becomes too high, itsends an order to the blade pitch mechanism which immediately pitches (turns) the rotorblades slightly out of the wind. Conversely, the blades are turned back into the windwhenever the wind drops again. During normal operation the blades will pitch a fraction of adegree at a time - and the rotor will be turning at the same time.
(Passive) stall controlled wind turbines have the rotor blades bolted onto the hub at a fixedangle. The geometry of the rotor blade profile, however has been aerodynamicallydesigned to ensure that the moment the wind speed becomes too high, it createsturbulence on the side of the rotor blade which is not facing the wind. This stall prevents thelifting force of the rotor blade from acting on the rotor. Around two thirds of the wind turbinescurrently being installed in the world are stall controlled machines.
Technically the active stall machines resemble pitch controlled machines, since they havepitchable blades. In order to get a reasonably large torque (turning force) at low windspeeds, the machines will usually be programmed to pitch their blades much like a pitchcontrolled machine at low wind speeds.When the machine reaches its rated power,however, you will notice an important difference from the pitch controlled machines: if thegenerator is about to be overloaded, the machine will pitch its blades in the oppositedirection from what a pitch controlled machine does. In other words, it will increase theangle of attack of the rotor blades in order to make the blades go into a deeper stall, thuswasting the excess energy in the wind, [15].
In addition of downward control also the upward control is possible to a certain extent, if thewind generation is first curtailed. Upward regulation requires stable wind conditions. Thesecond option for upward regulation is to exploit momentarily the kinetic energy stored in theinertia of the rotor. By this way the wind power plants can momentarily support the systemfrequency. The grid operators have given some requirements to wind turbines:
The wind turbine has to be able to control the upper limit of its active power generation.By the controllable upper limit it is possible to ensure if needed that the active powerproduction will not exceed the predefined level.
The rising speed of the active power production has to be able to restrict so that thespeed of power change is possible to the speed of 10 %/min of the nominal power.
The active power generation downward has to be able from 100% -> 20 % fromnominal power in 5 s.
Based on the survey among Electra WP6 partners the following tablets Tables 3-9 show somecharacteristics concerning grid connections, frequency and voltage control of wind power.

Project ID: 609687
dd/mm/yyyy Page 29 of118
Table 7: Typical wind power size and connections to grid.
Country Typical unit size Connectinggrid level
Type ofcommunicationchannel
Availability ofcontrol functions
Denmark From 1 MW to 200MW
MV/HV Voltage andfrequency
Finland 1 MW, 3 MW and 5MW units and windparks in scale of100 MW. Thewhole capacity 500MW
HV Fixed fibreconnection
Active power control,reactive powercontrol
Greece In all 106 windfarms(1520,02MW). 69of them(1358,32MW) are>10MW and theyhave the obligationof regulated output.
32(462,47MW)connected toMV while 37(895,85MW) toHV.
Fiber-opticcommunication.
Voltage andfrequency
Poland Total of 873 windpower plants. In therange P >= 100MW (100-177.5MW) - 3 plants, 100MW>P>=40 MW -28 plants, P<=40MW – 842 plants.
P >10 MWconnected toHV andsmaller to MV.3 plantsconnected toEHV (177.5MW, 135 MWand 100 MW).
Fixed fibreconnection forlarge andmedium sizeplants. Wirelessconnection forsmaller plants.
Voltage regulation,frequency control (forwind farms with P>50MW).
Portugal 4448 MW UHV/HV Fibre Connection Frequency andVoltage control
Turkey In the range P >100 MW 6 plants,P<100 MW 70plants.
HV, MV By TurkishTelecom opticalfibre utility
Voltage andfrequency control
Table 8: Output power controllability for wind power
Country Output powercontrollability [MW or
Constraintsofcontrollabili
Duration ofcontrol
Rate ofchange
Responsetime [s or

Project ID: 609687
dd/mm/yyyy Page 30 of118
% of nominal ty [min]: [MW/s]: min]:
Denmark For upwards regulation:possible only if the farmis operating below theavailable power output.For downwardsregulation: possible(over-frequencyregulation). Can berealized both at windturbine and farm level(i.e. reducing the outputof the wind turbine orshutting down one ormore wind turbines inorder to reduce theoverall farm output)
Windavailability(for upward)
Continuous Any fordownward;limited to thewindavailable forupward
seconds
Finland For upwards regulation:not applied
Naturalrestrictionsrelating towindavailability.
Seconds tohours
12%/sec 5 secondsforcompleteddownregulation
Greece For upwards regulation:Defined by systemoperator; Fordownwards regulation:Defined by systemoperator
Voltage,Power Factor
Continuous Defined bysystemoperator
1 min
Poland For upwards regulation:0%->100% of nominalpower; For downwardsregulation: 100%->0%of nominal power
Possible forwind speedhigher thanturbine cut-inspeed.
Unlimited. maximum25%/s forbothdirections
seconds
Portugal For upwards regulation:N.A; For downwardsregulation: Although notincluded in the grid-code, around 1.4 GW ofwind power capacityoffered, in a publictender, the ability to becurtailed (reduce activepower) in an annual
min

Project ID: 609687
dd/mm/yyyy Page 31 of118
amount of energycorresponding to 50hours at rated powerand also the ability tosupport primaryfrequency control withina de-load power curveof ±5%.
Table 9: Power factor controllability for wind power.
Country Power factorcontrollability[cos limits]
Constraints ofcontrollability
Duration ofcontrol
Response time
Denmark Capabilitylimits of PWMconverters(roughly 0.8power factor)
Capabilitylimits of PWMconverters orcapacitors
Continuous Seconds
Finland 0,95 cap –0,95 ind.
In normaloperationremains inpower factor 1.
Minutes tocontinuousoperation
Seconds
Greece 0,835-0,835(cap./ind.)
Voltage,Maximumpower
Continuous Seconds
Poland 0,975–0,975.(cap/ind)
unlimited for asynchronousmachine: 1 ÷ 2 s, forfull converter: 0,2 ÷0,3 s
Portugal Minutes Seconds
General trends for development of the amount and controllability of wind power in Denmark showsthat the degree of controllability of active power will improve in the moment that more newlyinstalled wind turbines (and wind plants) will possess these characteristics [21]. Naturally itdepends also on the willingness to operate the wind farm at reduced output. In Finland, the amountof wind power is expected to increase. Wind power plants are requested to participate moreactively in network control [16]. In Greece, the national roadmap for the development of RES inGreece predicts an increase in the wind farms which are expected to reach 7500 MW by 2020 [18-20]. Installed capacity of wind generation in Poland reached over 3676 MW. Total power of windfarms with signed connection conditions equals 13 300 MW (5700 MW to EHV, 5270 MW to HV

Project ID: 609687
dd/mm/yyyy Page 32 of118
and 2430 to MV), total power of wind farms with issued connection conditions exceeds 6200 MW(2440 MW to EHV, 3600 to HV and 160 MW to MV). Therefore, the installed capacity of windgeneration is expected to be gradually rising over the following years [17]. In Portugal, for 2030 isexpected an increase of the total wind capacity for 6400 MW [22]. In Turkey, the private companieshave more than 4.000 MW wind power capacity and this correspond to nearly 6 % of Turkishinstalled capacity. It will be 25 GW and incentives will be finished at 2030. Intraday market will beapplied at 2016. RITM will be used for all wind plants for monitoring and controlling [13]
3.1.5 Photovoltaic
Solar-sourced electricity can be generated either directly using photovoltaic (PV) cells or indirectlyby collecting and concentrating the solar power to produce steam, which is then used to drive aturbine to provide the electric power (CSP). The main control problems with solar plants are relatedto sun tracking and control of the thermal variables. Although control of the sun-trackingmechanisms is typically done in an open-loop mode, control of the thermal variables is mainly donein closed loop. Solar plants exhibit changing dynamics, nonlinearities, and uncertainties,characteristics that result in detuned performance with classical PID control. Advanced controlstrategies that can cope with these issues are needed for better performance and for decreasingthe cost per kilowatt-hour generated [23].
The following analysis covers mainly the results of survey received from Austria and Poland.Typical unit sizes of PV power plants in Austria are:
0-5 kW more than 143 MW 5-20 kW nearly 15000 PV plants with more than 150 MW 21-50 kW more than 1000 plants with more than 35 MW 50-100 kW more than 250 with more than 18 MW >100 kW more than 360 PV plants with more than 115 MW
In total nearly 40000 plants with total rated power of more than 450 MW; Installation peaks at4-6 kW and 19-20 kW.
Poland has total of 39 plants in the range of P<0.1 MW 31 plants and 0.1 MW<P<1 MW 8 plants.
Power plants are connected to the low voltage network in the range of 20 – 50 kW and large plantsto medium voltage network. The small-scale PVs are most growing e.g. in Denmark installed athouseholds and office buildings and feeding directly into the distribution network.
Type of communication channel is fixed fibre connection for large and medium size plants andwireless connection for smaller plants.
Monitoringo Currently: Mainly proprietary vendor-specific protocols are being used. The PV-inverter
systems also provide web-based interfaces to configure the system and to show theproduction profiles.
o In Future: IEC 61850 and SunSpec (based on Modbus) should be used to have astandardized interface to the PV-inverter functions and to monitor the PV plants.Especially, IEC 61850-7-420 - Communications systems for Distributed EnergyResources (DER) - Logical nodes IEC 61850-90-7 - Object Models for Photovoltaic,Storage and other DER inverters should be applied in future installations.
Control

Project ID: 609687
dd/mm/yyyy Page 33 of118
o Currently: Vendor specific solutions are being used today for controlling PV systems(mainly bigger PV plants). The Modbus approach (serial communication) is commonlyused today but Modbus/TCP (Ethernet-based mapping of the serial communication) isalready being provided by some PV-inverter vendors.
o In Future: IEC 61850 and SunSpec (based on Modbus) should be used to have astandardized interface to the PV-inverter functions and to monitor the PV plants.Especially, IEC 61850-7-420 - Communications systems for Distributed EnergyResources (DER) - Logical nodes IEC 61850-90-7 - Object Models for Photovoltaic,Storage and other DER inverters should be applied in future installations.
Balancing market:o Currently: Only protocol IEC 60870-5-101 is allowed (all balancing markets FCR,
mFRR, aFRR). Only point-to-point connection, no Ethernet.
PVs are heavily subsidized today and thus cannot be used for balancing purposes. At least untilthe present supporting schemes will be changed. PV plants are available for voltage control so farbut also frequency control is possible in the future. Voltage control is normally implemented locallyby reactive/active power droop control, Q(U), P(U), cos (P), constant cos . No fixed, local orcentralized frequency control schemes are applied for the time being but 50.2 Hz control andislanding detection are implemented. Flexibility for control scheme and parameter changes islocally possible and also the possibility of simultaneous provision of these functions. Availability foroutput power and power factor control is continuous, but depends on solar radiation.Output power controllability:
For upwards regulation: in case of upfront curtailment 0-100% possible For downwards regulation: 100-0% Duration of control [min]: continuous, depending on solar radiation Rate of change [MW/s]: ~10%/s Response time [s or min]: s
Power factor controllability [cos limits]: 0,9–0,9. (cap/ind)
Constraints of controllability: 0.9 for plants <13.8 kVA and 0.95 for smaller plants Duration of control [min]: continuous, depending on solar radiation Response time [s or min]: s
PVs are subject to high changes depending on sun conditions. Therefore, it requires balancingpower what affects balancing power market and to some extent electricity markets. PV plants havepotential for aggregation to virtual power plant and participation in markets as for examplebalancing markets. Concerning the future trends, PV capacity will increase significantly and itenables the participation in the frequency and voltage regulation especially for plants connected tomedium voltage level [16, 21].
3.2 Demand response
3.2.1 Industrial loads
Processes where the electricity consumption can be modulated are suitable for demand responsein industry. Typically modulation is subject to constraints as buffer management, throughput,production numbers. This type of flexibility is suitable for continuous operation. Examples of

Project ID: 609687
dd/mm/yyyy Page 34 of118
processes are many industrial installations e.g. electrolysis, reduce speed of a rolling millinstallation, pulp and paper processes, extruder operation, etc. The typical unit size offered tomarkets varies from 100 kW to several mega Watts. The minimum size for participation in reservesvaries from 1 MW to 10 MW and for real time disconnection 20 MW in some countries. As anexample, the potential is about 1200 MW in Finland and about 4000 MW in Turkey. Industrial loadsare normally connected to MV, HV or EHV network and the communication channel used is phonecall, relay-connected, automated or manual dis-connectable loads. They are available forbalancing, voltage control at feeder level and frequency support functions. Frequency controlscheme can be local and also centralized by phone call of TSO for real time disconnection. Powercontrollability for upwards regulation depends strongly on the conditions, but typically limited.Downwards regulation is more suitable for fixed power agreed. The control is subject toconstraints. Typically modulation is subject to constraints as buffer management, throughput,production numbers etc. Duration of power control may be from minutes to hours and responsetime can be from milliseconds to minutes. In the power factor controllability the cos limits variestypically 0,7–0,95 (cap/ind) and the duration of control may be from minutes to hours and responsetime is in the range of seconds. Affecting market mechanisms are reserve markets includingfrequency containment reserves, balancing, day ahead market, BRP portfolio management andthey have potential for aggregation. Industrial loads are continuously available for control in so faras the industrial process is running. An activation may result in an opposite reaction of the unit forsome time but it depends on the industrial process. Frequency Containment Reserve forDisturbances (FCR-D) is activated immediately with frequency 30 s 49,70 Hz or 5 s 49,50 Hzand load can be reconnected to grid, when frequency is at least 49.90 Hz for five mins in Finland.The activation is Immediate with frequency 49,1 Hz and load can be reconnected to grid, whenfrequency is at least 49.90 Hz for five mins in Italy. Concerning the future trends the potential inItaly is max 4318 MW (4297 within 0.2 sand 21 within 5 sec) activated automatically, [24]. Heatingventilation and air conditioning applications in public and office buildings will be a very relevant partof demand response, which has been growing due to implementation of Building AutomationSystems (BAS).
3.2.2 Electric vehicles (EV)
Electric vehicles (EVs) are commonly recognized as smart grid assets in addition to theirenvironmental benefits due to their flexible charging time.
They can be utilized to balance power fluctuations caused by the high penetration of intermittentrenewable energy sources in the transmission system level. The studies performed in US, UK andDenmark are summarized in the following three paragraphs, [25].
Kempton et al. [26] [27] analyzed the potential profits of vehicle to grid (V2G) support by comparingit to existing ancillary services and found that participating regulation power market appears to bemost promising and offers a substantial earning potential to EV owners. This is because: (a) it hasthe highest market value for V2G among the different forms of electric power (much higher thanpeak power, for example), (b) it minimally stresses the vehicle power storage system, and (c)battery-electric vehicles are especially well suited to provide regulation services. The electricvehicles can participate in the regulation services individually or by joining a fleet, thecommunication can be facilitated by power line and wireless control connections. It is advocatedthat fleets are more easily accommodated within existing electric market rules, which typicallyrequire power blocks of 1 MW. To fulfil the concept of V2G, each vehicle must have three requiredelements: (a) a connection to the grid for electrical energy flow, (b) control or logical connection

Project ID: 609687
dd/mm/yyyy Page 35 of118
necessary for communication with the grid operator, and (c) controls and metering on-board thevehicle. By predefining the wanted driving distance and the comfortable buffer, the electric vehiclescan be connected to the grid and then participate the regulation service market. It is also learnedfrom the studies [26] [27] that important variables for the V2G market are: (a) the value of ancillaryservices in the area, (b) the power capacity of the electrical connections and wiring, and (c) thekWh capacity of the vehicle battery. The amount of time the vehicles were on the road ordischarged did not turn out to be a major variable. The results showed that battery electric vehiclesfleets have significant potential revenue streams from vehicle to grid.
Based on the survey in UK [27], [28] the typical size of electric vehicle for demand purpose is about2kW for vehicle-to-grid (v2g) and the total available capacity depends on the number of EVs in thearea. EVs are connected to low voltage network and they are available for primary frequencycontrol. The frequency control scheme used is local EV battery discharge or disconnection of EVduring low system frequency events. Concerning power controllability the upwards regulation ispossible up to 100% of stored energy. The constraints of controllability depend on the state ofcharge (SOC), it is assumed that EV only contributes to primary frequency control when SOC isabove a predetermined level. Also different EV types and usage result in a temporal distribution ofEV available for response which requires scheduling. Duration of control takes seconds and theresponse time is seconds with up to 100ms charger time delay. Affecting market mechanism isbilateral contracts with aggregator within TSO’s balancing mechanisms framework. Charging of theEVs (as energy storage) utilizes a dual tariff that is cheaper during off-peak hours. Aggregation isnecessary for the control to be effective. Studies show that EVs can play an effective role incontributing to primary frequency control, thus potentially meeting a larger proportion of thesecured sudden generation loss of 1800 MW in the UK. It is also projected that 5-36 million EVcharging controllers will be deployed by 2050. The projections are based on different scenarios(e.g. high electrification, low electrification).
In term of the Danish Power system, Divya et al. [30] carried out a study investigating the feasibilityof integrating electric vehicles in the Danish electricity network which is characterized by high windpower penetration. They found that electric vehicles have the potential to assist in integrating morewind power in 2025 when the electric vehicle penetration levels would be significant enough tohave an impact on the power systems. Østergaard et al [31], [32] shows that intelligent integrationof electric vehicles in the Danish power system with high wind power penetration has substantialsocio-economic benefits due to its balancing capability. Pillai and Jensen [33] investigated the V2Gregulation capabilities in the West Denmark power system by using a simplified load frequencycontrol model, in the study, they used an aggregated battery storage model and generators model.The results indicated the regulation needs from conventional generators are significantly minimizedby the faster up and down regulation characteristics of the EV battery storage.
All these results indicate that it is feasible to participate in the electricity market and provideancillary service to the gird. It is summarized and concluded from the literature that a new businessentity, namely the EV fleet operator (FO) has been widely proposed capturing the new businessopportunities by providing the multiple services of EVs and then by this contributing to thechallenges solving of power system operator. Alternatively names for an EV FO are used such asEV virtual power plant, EV aggregator, EV charging service provider or EV service provider(EVSP). The new entities [34], [35] could be independent or integrated in an existing businessfunction of the energy supplier or distribution system operator.
However, a large scale application of EVs also mean new loads to electric utilities, and undesirablepeaks may exist in the distribution network when recharging the battery [36]. Research has

Project ID: 609687
dd/mm/yyyy Page 36 of118
indicated that uncoordinated charging [37] or price responsive charging [38], [39] bring congestionand voltage violation problems to the distribution system operators. The price responsive chargingmeans the EVs may react to the wholesale/regulating power market prices in a correlated waysince they react to the same electricity price. For example, when EVs postpone charging until theelectricity price is at lowest, they will create a peak demand at that moment. To address thecongestion problems introduced by the uncoordinated charging or price responsive charging, muchresearch has been done to coordinate the interests of different actors such as optimize thecharging cost of electric vehicles as well as respecting the hard constraints imposed by thedistribution system operator. The proposed solutions include centralized control strategies [38],[40]dynamic tariff based approach [41] and market based control or transactive energy approach [39],[42], [43]. All the proposals use the charging flexibility of electric vehicles.
For more information, the reader is referred to [44] where the authors presents a review regardingthe using of electric vehicle fleet as a kind of demand response resources. More specifically, theEVs aggregation objectives, the control strategies used by the aggregator, the battery modellingtechnology and driving pattern of EVs, and the control algorithms are reviewed.
PHEV is now also able to supply electrical power to home using a V2H system in addition to beable to be charged from a domestic outlet. To date, the use of a V2H system had only beenapproved for all-electric vehicles such as the Mitsubishi i-MiEV series. The V2H system makes itpossible to use the PHEV as an emergency power source, supplying electricity stored in thevehicle's drive battery to run domestic appliances in a power outage or a natural disaster. This is aworld-first for a plug-in hybrid electric vehicle [113].
In summary, it is safe to conclude that EVs can be used to provide services to various actors in asmart grid environment. However, it will mostly bring localized distribution problems. Therefore,knowing where those loads will occur, having the data and tools to analyse their impacts, andproviding incentives for network-friendly charging patterns will be the key to both consumers andutilities realizing the potential of electric vehicles. Furthermore, how to handle the ’controllerconflict’ is also an important issue such as the activation requested from the TSO might introducethe congestion problem to the DSO level.
3.2.3 Household appliances
Various household appliances can participates in demand response if the device is scheduled foroperation with a due time and for example, the device has a fixed load profile like dishwashers,washing machines, tumble dryers, fridges, water heaters, space heating etc. It is expected agrowing share of heat pumps applied for space heating and cooling. Several countries will prohibituse of heavy fuel-based heating at households from 2017 (Norway, Denmark +) and supportinstallation of heat pumps for space heating purposes. Heat pumps represent a great resource forDR schemes.
Their typical sizes of household appliances are from 100 W to 5 kW and they are connected to lowvoltage network. Communication channel may be, for example, via smart meters using automateddirect control of on/off switching or indirect with price signal (market based control) or manual(dis)connection. Household devices can be aggregated for voltage control at feeder level and alsofor frequency support. Frequency control scheme may be fixed or centralized control throughdirectly sending external control signals to frequency-responsive household appliances. Fixedcontrol means automated on/off switching of the device based on predetermined thresholdfrequency. The control scheme can be switched to consumer-based scheme that involves active

Project ID: 609687
dd/mm/yyyy Page 37 of118
participation from the demand side and consumers managing their household appliances on thebasis of their own preferences. Or number of fridges participating to the control may changeaccording to the constraints of users. Direct load control and consumer-based scheme have a highpossibility to be issued to consumers at the same time. Household appliances can be applied forpower control of downwards regulation 100% of nominal (switch off). In the case of fridges, thetemperature of the fridge room may case constraints of controllability. The load profile and the “duetime” are predefined. The starting time of the load can be chosen freely, but in some cases startedload can be interrupted and in some cases this is not possible. Duration of the control may be fromminutes to hours, but for fridges it depends on the thermal constant of the fridge and also on theamount of food located inside. Rate of power change is high (100 % power on/off) and theresponse time is in seconds including delays which may be determined by communicationlatencies. With regard to market mechanisms there are no business cases without aggregation andthey depend strongly on business model. Participation is possible in the reserve, balancing andday ahead markets.
Control of household equipment may be available at discrete times, depending on the customersscheduling. An activation of control may result in an unwanted reaction of the unit for some timewhich is so called rebound effect. For example uncoordinated control may lead to synchronizationof the fridges dynamics determining a correlated on/off cycles. Also load will be delayed, no extraconsumption on an individual basis. On an aggregated level, however, a major activation/delaymay result in a concentrated activity of the loads afterwards. Will demand response activationsmay influence the overall annual energy consumption of the unit depending on consumers’ energyconsumption patterns and preferences.
With regard to the general trends until 2030, scheduled load is not used in any commercialdemand response program yet. Now, direct load control and price-incentive scheme could achievean average 8%-15% demand reduction during peak time durations for residential loads. With theactive participation from the demand side, (or combined with direct load control/price-incentivescheme), the potential demand reduction would be hard to estimate, [45…48].
3.3 Energy StorageStorage systems can contribute to the frequency and voltage control mechanisms. The frequencyof the grid may be altered by short-term, random fluctuations in demand or power provision whichrequires either power or loads adjustment for recovering the load-generation balancing; thereforethis service is also known as continuous control or load following. This is a short-term service,primary frequency control acting within seconds and with a minimum duration of 15 minutes.Charging and discharging of the storage system at the right moments (response within milli-seconds to seconds) can help to preserve the balance between consumption and generation [49].Storages can also provide secondary and tertiary frequency control. Basically the same controlalgorithm as for secondary control applies but tertiary control is often requested manually by thesystem operator [50].
Reactive power compensation is needed when big voltage variations occur in the grid (e.g. voltagesags and swells). A voltage sag is defined as a temporary voltage drop and voltage swell is definedas temporary voltage rise which pose serious instantaneous problems in the grid. Voltagevariations can cause production interruptions and damage to machines. In order to avoidbigvoltage variations, an energy storage system can be installed to smooth the power fluctuationand control the flow of reactive power in the grid. Voltage support may also be operated at a veryshort timescale of 2-5 seconds. This specific task performed by the storage unit depends on itsoperation mode. The storage system compensates for the reactive power and load unbalance [51].A flywheel energy storage has a fast charge and discharge speed and therefore it is capable of

Project ID: 609687
dd/mm/yyyy Page 38 of118
supplying the necessary active and reactive power demanded by the load in a very short time. Withthat, flywheels could be a good way to solve voltage variation problems. [52] By controlling thereactive power the voltage level of the network can be regulated. By providing reactive powerlocally the grid can be used more efficiently and therefore the losses and voltage variations in thenetwork can be reduced. Under a big voltage variation (sag or swell) condition, the speed of theflywheel varies in order to supply or absorb the required power. Reactive power compensation canbe controlled either directly from the load or from the grid voltage.
The grid applications for storage technologies can be loosely divided into power applications andenergy management applications, which are differentiated based on storage discharge duration.Figure 1 shown below, presents power ratings and discharge times required for different types ofnetwork services [53].
Figure 1: Power ratings and discharge times required for different types of networkservices.
3.3.1 Electricity storage
Conventional battery categories today include the most technologically and commercially maturetechnologies, i.e. Lead Acid batteries (PbA) and nickel based batteries, including Nickel Cadmium(NiCd) and Nickel Metal Hydride (NiMH) batteries. All conventional batteries are commerciallyavailable on the market. High recyclability improves usability. Rechargeable type conventionalbatteries, which could be used in smart grids, are PbA, NiMH and NiCd type batteries. They arealready used widely in end-user systems and in other grid applications. Batteries are providingenergy storage for decentralized grids including renewables. They are essential to a vast range ofapplications from protecting control and switching systems and supporting UPS (UninterruptablePower Supply) installations. Batteries are used to improve grid stability by acting as a buffer tocompensate for the intermittent nature of renewable energy resources, [53].
Main application areas for these batteries are

Project ID: 609687
dd/mm/yyyy Page 39 of118
Photovoltaic energy systems Solar & wind hybrid systems Telecommunication networks Emergency power back-up and generator starting applications UPS
Lithium-ion batteries are expected to contribute to the energy storage in grids due to fast charging,light weight, and high energy density in comparison to their counterparts. Lithium-ion batteries arebecoming the energy storage of choice for future electric mobility applications. Foreseen prospectsfor Lithium-ion technology in larger applications are significantly growing with respect to otherelectrochemical storage systems and, particularly, in combination with more innovative integrationof electricity grids within the transport sector. Sulphur Sodium (NaS) battery systems providesolutions for energy management (peak shaving), reliability (outage) and power quality issues.These applications increase asset utilization, provide alternatives to meet peak demand andimprove quality of service. Italy has two NaS battery applications with two 12 MW units and one10.8 MW unit connected to HV grid. They are used for voltage and frequency control scheme withlocal and also centralized control. Output power controllability is 0%-100% in charge and 100%-0%in discharge mode and rate of change is 100%/s. In the power factor control, the duration andresponse time is seconds and rate of change is 1 s. They are used in the balancing power market[53]. Vanadium Redox flow batteries are particularly suitable for large-scale utility applications suchas peak shaving, back-up systems and applications coupled with renewables, such as large-scalephotovoltaic fields. Vanadium redox batteries also have a short response time and good powerdensity that makes them suitable for Power Quality applications.
Superconductive magnetic energy storage (SMES) systems store energy in the magnetic fieldcreated by the flow of a direct current in an inductor realized with a superconducting coil. In normalinductors, current decreases due the losses caused by the increasing coil resistance. Insteadsuperconducting materials have a very low resistivity (of the order of 10-25 ). SMES devices arecomparatively expensive with parasitic losses and low total energy density. There are stilltechnology challenges especially for the development of larger higher energy SMES systems. Hightemperature superconductors, more efficient cryogenic cooling systems, high magnetic field andalso mechanically secure structure are the key issues in the future development. SMES has highelectrical efficiency and SMES system has fast response and capability to control active andreactive power makes its potential to stabilise many smart grid applications. Micro-SMES unitsaddress applications such as transmission line stability, spinning reserve, static VAR compensationand voltage support for critical loads.
Supercapacitors can offer advantages over other forms of energy storage. These include longcycle life, high charge/discharge rates, no overcharge, high cycle efficiency, low maintenancecosts, reliability, and a rated voltage independent of the cell chemistry. Supercapacitors are incontrast quite sensitive to overcharging. Supercapacitors can perform various functions in electricgrids for example: transmission line stability, spinning reserve, phase correction, harmonicssuppression, area and frequency control. The characteristics of supercapacitors are the fastresponse time in milliseconds, high-energy efficiency (more than 95%), high power density andlong shelf and cycle life. Various functions can be then performed by SC devices in electric grids,such as, for example:
1. Transmission line stability. The stability of a transmission system by adding energy storage.This serves to dampen oscillation through the successive generation and absorption of real(as opposed to reactive) power. There is also transient stability – the stability required aftera utility event (loss of substation or major line). During a transient event, achieving stability

Project ID: 609687
dd/mm/yyyy Page 40 of118
requires a substantial capability to absorb energy quickly. This is somewhat analogous to“dynamic braking” because generator turbines must be slowed. A typical specification is100 MW with 500 MJ (< 5 s).
2. Spinning reserve. This is the generation capacity that a utility holds in reserve to preventservice interruptions if a generator fails. An ultracapacitor system can be built to supplypower during the interruption, until quick-start diesels begin to supply power. A typicalspecification is 20 MW to 100 MW and 300 MJ to 1500 MJ.
3. Area and frequency control. The lack of matching between electrical energy production andenergy consumption (including losses) appears as a frequency variation. SC system wouldbe considerably more effective than a generating plant in supplying frequency regulationdue ot its fast response time. A system based on SC can absorb or supply energy asrequired, freeing other generation sources from frequency regulation or tie-line controlduties. A typical specification is 100 MW to 1000 MW and 0.1 MWh to 10 MWh.
Flywheels have high steady inertia and they can support ancillary services like frequencyresponse, provide short time support for spinning reserves and standby reserves. One module istypically 2 kW - 250 kW. Low speed type flywheels have used in industrial applications in Polandand their power size has been in the range from 120 kW to 2 MW. They were connected to lowvoltage and medium voltage networks and used for voltage control. Flywheels have the potentialfor effectively supporting Flexible Alternating Current Transmission Systems (FACTS) devices tomaintain grid stability and reliability but main applications of flywheels in the smaller distributedpower systems are for UPS systems. Flywheels in UPS applications typically provide power for 15- 30 seconds that covers most power quality events and short power shortages. Flywheel systemscan work as ride-through power sources with generators and can be used with batteries to covershort-duration events and save batteries that work for longer outages. Flywheel systems withpower conversion electronics can serve customers as a controllable and automatic demand-sidemanagement option that can provide premium services, including power quality for sags or surgeslasting less than 5 seconds, uninterruptible power supply for outages lasting about 10 minutes, andpeak demand reduction to reduce electricity bills. For output power control the response time isvery short and the rate of change is for example 100 kW / 20 s in the Polish case [53].
3.3.2 Heat and cold storage
Fast-type ancillary services are not directly relevant application areas for typically slow-responsetype thermal energy storage, but indirectly for example when installed with local CHP systems,thermal energy storage can participate for providing ancillary services. They can also provideancillary type reserve services for local and district thermal energy production systems. Thermalenergy storage can also support blackstart after power outage by shifting the start of HVACsystems. Off-peak electricity can be used to make ice from water. Molten salt storage is used tostore heat in solar tower to be used for electricity generation by nights or in non-sunny days.Thermal energy storage can also be used with wind power stations to store energy during low price(low consumption) periods [54].
3.3.3 Pumped hydro storages (PHS)
Pumped hydroelectric storage (PHS) can be pure PHS or pump-back PHS. Pure PHS plants relyentirely on water that is pumped to an upper reservoir from a lower reservoir, while pump-backPHS use a combination of pumped water and natural inflow to produce energy [55].

Project ID: 609687
dd/mm/yyyy Page 41 of118
PHS plants are characterized by long asset life, typically between 50 and 100 years, round-tripefficiencies of 70–85%, fast response time, usually in orders of seconds or minutes. Generallystorage system requires less than 10 minutes to get to full capacity, or 10 to 30 seconds within 1minute if it runs on standby. The discharge time can attain in some installations as much as 24hours. Pumping and generating can follow a daily cycle, or weekly or even seasonal cycling inlarger PHS plant. During long holding times, there are almost no losses in the storing process,which enables long-time scale storage. The storage capacity can attain several gigawatts. Thestorage power is dependent on the reservoir capacity and the head. As well known the hydraulicpower available is proportional with flow and head. The energy available is dependent of how longtime before the reservoir is empty. The average plant size in the EU-27 is about 270 MW, with thelargest pumped-storage facilities being Grand’Maison plant located in Isère in France and theDinowig power station in Wales, United Kingdom, developing each about 1800 MW (EC, 2009).
Response time is dependent on mainly two time constants, the inertial time constants of rotationalmasses and the time constant for the hydraulic inertia. The first one is dominated by the generatorand is usually of the order of 6 seconds. The hydraulic inertia is approximate 1 second, which ismore or less a design criterion. The result is that the hydropower plants will stabilize atapproximately 10 s.
Dinorwig Power Plant in UK:
• Auto-start, synchronize and load to 150MW 125 seconds• Generate normal step load change 150MW-250MW 6.5 seconds• Emergency response from spin-generate to generate 150 MW in 8.5 seconds• Emergency response from 150 MW generate 70 MW in 4 seconds• Pump to spin-pump 95 seconds• Generate 200 MW to spin-generator 11 seconds• Spin-pump to pump 41 seconds
In normal operation Dinorwig pumped storage plant in UK, Wales can regulate 100 MW in 6.5seconds, which equals 923 MW/min. The emergency response equals 2250 MW/min, whiletraditional hydro power plants will have trouble with meeting 200 MW/min.
PHS plants offer a significant technology base for regulation and can accommodate variableelectricity generation. The main applications for hydropower storage are wholesale arbitrage andpeak power capacity, energy balancing, the provision of tertiary and secondary reserves, forecasthedging, transmission curtailment, time shifting, load following etc. PHS can provide both up anddown regulation and can assist with frequency regulation and voltage control. Due to quick startcapabilities, PHS can provide black starts and provision of spinning and standing reserves. Theyare most suitable for transmission application rather than distribution. PHS plants are also used forseasonal fluctuations, being capable of providing hundreds of megawatts for many hours at a time.The Vattenfall Goldisthal PHS plant in Germany, for example, which was commissioned in 2003with a capacity of 1060 MW, is currently used for load management (intertemporal arbitrage) andfor ancillary services (secondary and tertiary reserves and black start).
With regard to the future trends the technical potential of new pumped hydro plants in Europe isvery low, due to the high potential impact on the environment and to the necessity of an adequatealtitude profile and geology. It is estimated that about 75% of the total potential for hydropower hasalready been developed in Europe. By 2030 more than 50% of the present installed capacity ofhydro storage in Europe will have to be refurbished in any case due to aging. The capacity of hydroreservoirs in Europe is estimated to be approximately 180 TWh, of which, the Norwegian hydroreservoir capacity accounts for about 50% (84.3 TWh). The large hydropower capacity of Norway

Project ID: 609687
dd/mm/yyyy Page 42 of118
already supports the need for flexibility and storage of its neighbouring countries. The largedeployment of wind power in the North Sea drives to the exploitation the Norwegian hydro powerpotential. This necessitates the establishment of grid connections with Germany and the UK, andthe reinforcement of the existing connection with the Netherlands. Tables 10-13 show the typicalpumped hydro power characteristics.
Table 10: Typical pumped hydro power size and connections to grid.
Country Typical unit size Connectinggrid level
Type of communicationchannel
Availabilityof controlfunctions
Austria Total 112 with 7847 MW;
<10MW 45 plants with154 MW;
<1MW: 9 plants;
1 - 2.5 MW: 14 plants;2.5 - 5 MW: 11 plants;
5 - 10 MW: 11 plants;
>10MW: 67 plants with7693 MW;
10 - 20 MW: 16 plants;20 - 30 MW: 10 plants;30 - 40 MW: 5 plants;
40 - 50 MW: 4 plants;
50 - 80 MW: 8 plants;
80 - 100 MW: 3 plants;100 - 200 MW: 7 plants;200 - 300 MW: 7 plants;>300MW: 7 plants
typically<10MW MVor HV forbiggerplants
Fixed fibre connection for largeand medium sizeplants. Currently: IEC 60870-5-104 is a common approachin Austria to control the powersystem. Future: It is expectedthat the IEC 61850 will play amore important role in Austriafor controlling power plans. Indetail, the IEC 61850-7-420(Hydroelectric Power Plants -Communication for monitoringand control) should be appliedfor monitoring and controlpurposes. Balancing market:Currently: Only protocol IEC60870-5-101 is allowed (allbalancing markets FCR,mFRR, aFRR). Only point-to-point connection, no Ethernet.
voltage andfrequencycontrol
Greece 2 plants 315 and 384MW
HV Continuous availability andwired (fibre-optic)communication channel
Continuous
Poland There are 20 units in 7pumped-storage powerplants, among them:
P = 135MW-179MW; 8units,
P = 28MW- 68MW; 12units (power of
Twopumped-storagepowerplants(4x135MWand4x179MW)are
Fixed fibre connection for largeand medium size plants.
Frequencyand voltageregulation

Project ID: 609687
dd/mm/yyyy Page 43 of118
generation has beengiven).
connectedto EHV, therest to HV.
Portugal 1036 MW (Total) EHV/HV Fibre connection
UnitedKingdom
Depends on generationtechnology used.
HV - Voltageandfrequencycontrol
Table 11: Availability of control for pumped hydro power.
Country Voltagecontrolschemeused
Frequencycontrolschemeused
Flexibility forcontrolscheme andparameterchanges
Possibility ofsimultaneousprovision of thesefunctions[describe]:
Availability forcontrol
Austria local orcentralizedcontroldependingon plantsize
Yes, local orcentralizeddependingon size andtype FCR,aFRR ormFRR;
Yes Yes. Continuous, butdepending onwater reservoir
Greece Local Local Yes, viaremoteconnections
Yes. Synchronousgenerator: voltageregulation byexcitation, andfrequency regulationby rotating speed ofturbine
Poland Local fastcontrol ofvoltage setvalue, setpointscoordinatedon area
Local fastcontrol, setpointscoordinatedon area
Parameterscan bechanged onsite, modecontrol and setpoints can bechangedremotely.
Synchronousgenerator: voltageregulation byexcitation (VoltageControl andExcitation System),and frequencyregulation byrotating speed of
Typically: 4÷5,5hours ofmaximumpowergeneration and6 hours ofpomping

Project ID: 609687
dd/mm/yyyy Page 44 of118
turbine (Governor)
UnitedKingdom
- Centralized - - Fast reserve:resource isexpected to beavailable withinclose proximityto last utilization
Table 12: Output power controllability for pumped hydro power.
Country Output powercontrollability
Constraints ofcontrollability
Durationofcontrol
Rate ofchange
Responsetime
Austria For upwards regulation(only pumped storage):0% 1 synchronous pumpturbine;7 0-100% 1asynchronous pumpturbine; 0-35% 2synchronous pumpturbine with hydraulicbypass; 0-60% 1conventional mechanicalpump and turbine set withhydraulic bypass; 0- >90%best case e.g. Kops II; Fordownwards regulation:100-40% 1 synchronouspump turbine; 100-35% 1asynchronous pumpturbine; 100-20% 2synchronous pumpturbine with hydraulicbypass; 100-40% 1conventional; 100-10%possible for best Casee.g. Kops II; mechanicalpump and turbine set withhydraulic bypass;
Depending onavailablereservoir, state(stop/consumption/generation)
Continuous forseveralhours,depending onreservoir
Sec; Stop - fullgeneration:60-90s forconventionalmechanicalpump andturbine set /100-150s forpump turbine;
Stop - fullconsumption:80-110s/ 250-400 sec; Fullgeneration -fullconsumption:80 – 110 s/450-700 s;Fullconsumption -full generation:40-120s/ 75-100s
Greece 100 % Water reservoirlevels
Fromminutesto hours
s

Project ID: 609687
dd/mm/yyyy Page 45 of118
Poland For the sake ofoptimaltechnicaloperationcondition unitsgeneratemaximumpower(recomended)depending onwater level,start (typical)1-2 minutes.
Maxsomehours,dependson waterinreservoirs
nominalpower in ca.5 sec
seconds
Portugal
For upwards regulation:N.A (only participates indownward tertiarycontrol): For downwardsregulation: downwardtertiary control
60minutes(maximum)
Upwardreservepowerdivided by 5minutes(e.g., powerplant of 10MW shallguarantee a2.5 MW/minrate ofchange)
seconds
UnitedKingdom
For upwards regulation:minimum contractedcapacity of 3MW for shortterm operating (STOR)reserve and 50MW forfast reserve (FR)
FR:15min
STOR: 2hours
FR: 25MW/minandmaintaining50MW forduration ofcontrol.Ramp downat a similarrate.
STOR:minimumcontractedcapacitywithinresponsetime.
FR: within 2minutes ofinstruction.
STOR: within240 minutes ofinstruction.

Project ID: 609687
dd/mm/yyyy Page 46 of118
Table 13: Power factor controllability for pumped hydro power.
Country Power factorcontrollability [coslimits]:
Constraints ofcontrollability
Duration ofcontrol
Response time
Austria 0.9 for plants <13.8 kVArequired and possibilityto define default value;possibility to up to 0.75
continuous,depending onreservoir
seconds
Greece 0,7-0,85* (cap./ind.)*0,4ind. for <35%loading
Continuous seconds
Poland 0,88cap0,98 cap ÷0,85 ind0,88 ind(cap/ind – inconvention ofgeneration)
Generator capabilitycurve
Max some hours,depends on waterin reservoirs.
Static exciter:less than 1 min
According to the National Roadmap-2050 report in Greece, in order to fulfil the RES developmenttargets, about 1 GW of PHES capacity is required by 2020 and 2 to 5 GW up to 2050, dependingon the scenario. In Poland, no new pumped-storage power plants are planned till 2030. The shareof total nominal power of pumped-storage power plants run- of total installed capacity amounts to5%. Pumped-storage power stations are able to generate maximally 1788 MW for 4 hours.Efficiency of pumped-storage power station is ca. 75%. Portugal is expected to increase the totalpumped hydro capacity for 5052 MW by 2030. With regard to UK, with increasingly lower systemsynchronous inertia (due to renewables connection) and closure of fossil fuel generation plants,National Grid will require more of these services to maintain system security. National Gridforesees a greater role for interconnection in providing flexibility with estimates of 7-11GW worth ofinterconnection in 2030 (that is around 6.3-10.7%) of total installed generation capacity [56…58].
3.3.4 Other types of storage
Compressed air energy storage (CAES) systems are a hybrid form of storage that is used forlarge-scale energy storage. The underlying principle of CAES is to rely on the elastic energy of airto store electricity for later expansion, which generates power via a natural gas turbine. Theeconomic and technical performance of CAES plants is expected to continue to improve. The largesize of CAES technologies (50-300 MW of energy) and their fast ramping rates (several minutes)make them suitable for system applications, such as load following, frequency regulation andvoltage control. One feature of a new generation of proposed CAES plants is that they may beclosely integrated with wind farms, representing a means of storing additional power generated off-peak.
Another form of energy storage based on air (or nitrogen) is liquid air energy storage (LAES) orcryogenic energy storage. LAES works similarly to CAES however the energy is used to cool the

Project ID: 609687
dd/mm/yyyy Page 47 of118
air until it liquefies in order to store it in normal pressure conditions. Liquefied air takes about1/1000 of ambient air’s volume. Next, when energy is needed, liquid air is pumped at high pressureto a heat exchanger, which acting like a boiler is used to drive a gas turbine. Commercial LAESsystems are available in sizes ranging from 5 – 100 MW and 15 – 250 MWh with the targetefficiency at around 60%.
3.4 Other flexibility resources
3.4.1 Static compensation devices
Currently there are quite a few static shunt compensation devices operating in EHV and HV grid(both capacitive and reactive). The source of reactive power is either a reactor or capacitor. Thetypical unit size is around 15 MVAr, whereas max is 50 MVAr. Typically they are connected totertiary winding of 220 or 400 kV/110 kV transformers, and operating at MV level. Some of themare also connected to 110 kV and 220 kV voltage level. Their main goal is to maintain desiredvoltage level by feeding the grid with necessary reactive power. They are controlled by switch, sothey can operate either at their nominal power, or switched off. The control signals come eitherfrom local station SCADA system, or from TSO/DSO dispatching centre. Control functions aremaintained by station group voltage regulation system that controls both transformer tap changesand static compensation devices.
There are few directions in which these devices can evolve in 2030 time horizon. One would beincreasing their number, as well as nominal power. It will enable to fulfil their main aim (which ismaintaining voltage in an allowable level) in wider range of situations and grid operating conditions.This is the way they evolved historically. Another direction of evolution for static compensationdevices would be shift from mechanically (switch) controlled to electronically (thyristor) switcheddevices. This change will enable them to not only regulate the voltage level but also dynamicallyrespond to grid operating state. The main advantage of thyristor switched devices over simplemechanically-switched is their near-instantaneous response to changes in the system voltage.Most of the currently installed devices (both reactors and capacitors) can be updated to thyristorswitched ones and thus create either TCR - Thyristor Controlled Reactor or TSC - ThyristorSwitched Capacitor.
The only present drawback of TCR and TSR is that they are more expensive than mechanicallyswitched compensation devices. A combination of the two technologies (even in the sameinstallation) can be utilized. In this case static VAR compensators are used to provide support forfast changes and the mechanically switched ones are used to provide steady-state reactive powercompensation, however a lot of attention has to be put into optimal selection of device’s location tobe upgraded to TCR or TSR.
3.4.2 Static compensators (STATCOM) and other FACTS devices
FACTS (Flexible AC Transmission Systems) are power-electronics-based devices that are able toinfluence such parameters of AC system as impedances (shunt and series), current, voltage,phase angle and power flow. They are very effective in power flow control, voltage control,oscillation damping on various frequencies, voltage and transient stability improvement and etc.
Depending on the technology used in a particular device, both static and dynamic properties will bedifferent. For the two most popular solutions, i.e. SVC and STATCOM, differences in static

Project ID: 609687
dd/mm/yyyy Page 48 of118
characteristic mean different achievable operational range in QV plane, wider and less dependenton PCC voltage for STATCOM. Also in terms of dynamic performance, i.e. time response andstability of control STATCOM is superior to that offered by SVC, being approximately three timesfaster and more robust against system condition changes. In fact, the performance of both of thesestatic compensators is highly dependent on system impedance, which continuously varies, andthus worst case response time is typically in the range of 30 – 80 ms. Typical rated power of aFACTS device can be as high as a few hundreds MVAR, with almost symmetrical division intocapacitive and inductive range. Usually, they have been installed in the HV transmission networks,but nowadays more and more often they are also present in the distribution systems, since(distributed) generation is also there and due to its volatile nature it needs support from flexibleresources.
With great flexibility boost in the power system comes considerable cost of a FACTS device, thus alot of attention has to be put into optimal location search for such a device. The selected locationcan often be optimal only for a set of the most critical or the most frequent grid conditions andcontingencies, but not for all. A future, emerging concept improving this situation is a distributedflexible AC transmission system (D-FACTS) device. These modular, simple, cost and space savingdevices can perform similar tasks to their lumped counterparts, however the impact of their actioncan be more widespread and equally distributed. A main representative of D-FACTS group is aDSR (Distributed Series Reactor), which can address some of the typical system expansionproblems like congestion, flow control and etc. Currently it is the only commercially available D-FACTS device, however others are developed with D-STATCOM being in main focus.
3.4.3 Synchronous condensers
Synchronous condensers have already been known and used in the power system for more than ahundred years and after a few decades of reduced interest in favour of their power electronicscounterparts, namely SVC and STATCOM, they now regain the attention, primarily as dynamicreactive power devices, and additionally due to synchronous inertia and short circuit powerprovision. Unit size can extend from a few tens of MVARs for industrial applications to severalhundreds of MVARs in power system use, both as new dedicated units and conversions ofsynchronous generators of the phased-out nuclear power plants.
The main reason for synchronous condenser installation is reactive power output and/or voltagestabilisation. For conditions or contingencies including low voltage, SVC will perform much worse,as its reactive power output decreases in square with voltage. Synchronous condenser andSTATCOM have better performance in this respect since reactive power decreases proportionallyto voltage. The distinguishing feature of a synchronous condenser is its overloading capabilityallowing to keep the reactive power output constant for a few seconds when the voltage dropsdown. Another difference is that like any rotating machine, synchronous condensers inherently andconstantly provide inertia support, which is of special importance in smaller (islanded) systems withhigh RES penetration. On the other hand, STATCOMs can also be controlled in a way that virtualsynchronous inertia is obtained, but this is subject to time and magnitude limits.
3.4.4 Cross border connections
Cross-border connections enable each single power system to constitute a part of a largeinterconnected power system thus improving operational stability and economic efficiency. Theyare also a prerequisite for pan-European electricity market and allow for market coupling. There

Project ID: 609687
dd/mm/yyyy Page 49 of118
are two types of the interconnections with respect to the power balance, i.e. connections betweencountries but inside the interconnected power system, which do not change the power balance(neglecting the losses) and connections reaching outside of the interconnected power system,which provide surplus energy or load to the system. Regarding the technology used, cross-borderconnections can be both AC and DC.
AC interconnections are predominant means for cross-border connections within a synchronouslyoperating power system. Power transfer via AC lines depends only on the laws of physics andproperties of lines thus does not require any additional equipment or control; what is more, AClines provide means for active power auto-balancing and frequency control since they inherentlytransfer information on voltage frequency.
Cross-border connections based on AC lines can also be used for interconnections betweenasynchronously operating power systems. In this case AC line forms a radial connection stretchingout from one power system to another and is often used to import energy from a power plant that isisolated in the external power system.
However, for the purpose of asynchronous system interconnection DC technology is used muchmore often. HVDC technology is one of the fastest growing branches of the power industryintroducing new technology breakthroughs every year. Currently maximum transfer capacity for apoint-to-point interconnection is 8000 MW for 800 kV classic Line Commutated Converter (LCC)type and 1000 MW for 320 kV Voltage Source Converter (VSC) type (525 kV has been releasedrecently and has not been used yet). A single connection can be as long as 2000 km for LCC and450 km VSC. Larger distances are economically unjustified due to high conduction losses, forwhich the foreseen solution is to increase the DC voltage.
More and more often HVDC technology is used for cross-border connections inside theinterconnected power system, creating so called embedded HVDC converter schemes. It is choseninstead of AC lines due to the ability to transfer more power with the same right-of-way, for bulkpower transmission or AC reinforcement and, more importantly, due to its superior controllability.Examples of the projects under construction or in planning are Inelfe (Spain – France), ALEGrO(Belgium – Germany), South-West Link (Sweden – Norway) and electricity highways in Germany.Another step in HVDC technology development and utilisation consist in increasing the number ofconverter stations in one scheme (multi-terminal HVDC) and, more futuristically, interconnectingmany point-to-point links to form a DC grid. There are still however many obstacles, especially inthe latter concept, e.g. tackling short-circuits in DC circuits (lack of DC breakers), operation anddispatching problems, multi-vendor coordination and etc.
Both LCC and VSC exhibit full controllability of active power during normal operation, howeverreactive power behaves differently depending on the type of the converter. In thyristor convertersreactive power is proportional to active power and usually filters are used in order to assure limitedexchange of reactive power with external AC system. On the other hand, converters based onIGBTs are able to control reactive power in the same manner as active power, respecting limitsdependent on present voltage level and short circuit power.
Cross-border connections based on HVDC converter schemes can play an important role infrequency and voltage support. Irrespective of the type of HVDC link each scheme can beequipped with a supplementary control loop which adds to the scheduled power order a signal Presulting from frequency control loop or power oscillation damping loop operation. Voltage supportis really offered only by VSC type HVDC links since VSC converter station has inherent STATCOMcapabilities and can take part in independent (from active power level) reactive power or voltagecontrol. Settling times of power control (current control) loop can be as small as 100 ms for LCC

Project ID: 609687
dd/mm/yyyy Page 50 of118
type and 10 ms for VSC type, however the operational practice is to change power via slowerramps (MW/min) in order not to cause disturbances in the power system and fast regulation is onlyused for emergency power control (EPC) action.
In contrast to HVDC, AC cross-border connections have no inherent control capability. However, itcan be improved by utilisation of FACTS devices, especially series or shunt-series type, such asTSCS, SSSC, UPFC or by slower-acting phase shifting transformers.
3.4.5 Tap changing transformers
Tap changing transformers provide a means of voltage control, typically in the range of ±10%. Itenables transformer linking networks at different voltage levels to keep the voltage in the requiredrange, while undesirable voltage fluctuation usually caused by system load changes. Ratioadjustment is performed by changing the number of windings turns in the transformer either on theprimary or the secondary winding. Number of turns is stepwise changed through the taps. Thisgives a step regulation of the transformer.
From point of view of tap changing facilities transformers can be divided into two groups:
- ULTC – under load tap changing transformers (also called on load tap changing - OLTC orload tap changing - LTC) – which allows the taps to be changed whilst the transformer isenergised – under load without interruption.
- Off-load tap changing transformers (No-Load Tap Changer - NLTC, off-circuit tap changer,or De-Energized Tap Changer - DETC) – the tap changer requires to be de-energisedwhilst tap changing take place.
A transformer may include a tap changer on each winding, for example, in distribution networks,a large step-down transformer may have an off-load tap changer on the primary winding and anon-load automatic tap changer on the secondary winding or windings. In practice, mainly foreconomic reason, changing the number of turns is performed on one side of the transformer.Because of lower current, the taps are usually situated on the high voltage side of the transformerand near the neutral end of the winding, where voltage with respect to ground is the least. Inautotransformers taps are also on the high voltage side but near common part of the winding.
Off-load tap changing transformers are commonly used in distribution MV network, where tap isusually changed manually seasonally (e.g. twice year).
The ULTC transformers operating in EHV and HV substation are supervised by substationtransformer control system within the scope of:
- maintaining the set (reference) voltage level at transformer substation busbars,- maintaining the set value of reactive power flow through a transformer,- turn-ratio control of a transformer.
The tap selection in under load tap changing transformers is automatic and controlled by assignedan individual regulator that typically can operate according to one of the following four regulationmodes:
- voltage control on switching substation busbars at higher-voltage side of a transformer,- voltage control on switching substation busbars at lower-voltage side of a transformer,- control of reactive power flow through a transformer,- turn-ratio control of a transformer.

Project ID: 609687
dd/mm/yyyy Page 51 of118
The ULTC can be classified as mechanical, electronically assisted, or fully electronic. The tapselection in mechanical under load tap changing transformers operate by motors. The mechanicaltap changer physically makes the new connection before releasing the old one using selectorswitches. To avoid creating high circulating currents a diverter switch to temporarily place a largediverter impedance in series with the short-circuited turns is used. Such motor-based ULTCs arecharacterized by a slow time response (tens of seconds) and low operating speed, short lifetimeand heavy size. In order to improve these properties, two technologies are used: electronicallyassisted and solid-state ULTCs. Both technologies are inherently faster than the motor-based one.However, the differences in the model are mainly in the low-level logic of the electronic switches.These solutions prevents problems with open or short-circuit turns.
Electronically assisted tap changers are based on thyristors, which take the on-load current whilethe main contacts changeover from one tap to the next. This prevents arcing on the main contactsand lengthen lifetime and period between service and maintenance activities. This solution is morecomplex and requires a low voltage power supply for the thyristor circuits. The most recent solutionis a solid state tap changer, which use thyristors both to switch the load current and to pass theload current in the steady state. Comparing to others solid state tap changer are smaller. Adisadvantage of this solution is less efficiency of the transformer, what is connected with leakagecurrent of the non-conducting thyristors connected to the unselected taps. The lost powertransformed to heat has to be removed from the device. Solid state tap changers are typicallyapplied on smaller power transformers.
For the time being, no alternative to regulating transformers is expected. What is more, a possibleway of controlling the voltage in LV distribution grids is by means of on load tap changer of aMV/LV transformer (ULTC MV/LV) in a similar way of how it is currently done for MV grids withHV/MV ULTC will be developing. The tap-changer will therefore continue to play an essential partin the optimum operation of electrical networks and industrial processes in the foreseeable future.Conventional tap-changer technology has reached a very high level and is capable of meetingmost requirements of transformer manufacturers. This applies to all the voltage and power fields oftoday, which will probably remain unchanged in the foreseeable future. It is very unlikely that, as aresult of new impulses to development, greater power and higher voltages will be required. Today,the main concern focuses on service behaviour as well as the reliability of tap-changers and how toretain this reliability at a consistently high level during the regulating transformer’s life cycle.Today’s design concepts of ULTCs (both resistor and reactor-type) are based more and more onvacuum switching technology, in fact is the state-of-the-art design of today and tomorrow. Theproper implementation of vacuum switching technology in ULTCs provides the best formula forquality, reliability, and economy that can be achieved for maintenance-free design in the field ofULTCs.
A further level of complexity can be added with the possibility of tapping the 3 phasesindependently and in an asynchronous way. The ULTC type is normally divided into 3-phase ULTCwhere the ULTC has the commonly winding on three phases and 3 single-phase ULTCs where theULTC has the winding on each phase (for simplicity, 3 single-phase ULTCs is named 1 phaseULTC afterwards of this report). The ULTC changes the ratio of a transformer by adding orsubtracting to and turns from either the primary or secondary winding. Specifically, DTU is carryingout a Danish EUDP project ‘Energy saving by voltage management’ [59] which aims for verifyingthe benefits of the 1 phase ULTC transformer in presence of unbalanced load or PV connections.

Project ID: 609687
dd/mm/yyyy Page 52 of118
The main conclusion of the simulation study shows that power distribution transformer with 1phase ULTC control significantly improves the PV hosting capacity in the analysed unbalancedscenarios without side effects [60].
3.4.6 Phase shifting transformers
Phase shifting transformers are specially designed transformers for the purpose of changingvoltage angle. When installed in series with a line or a transformer they can effectively controlpower flow in this element by changing voltage phase angle on one of the ends and thus
= (1)
changes. For this reason they are often installed in cross-border AC connections allowing for lineoverloading reduction and stability improvement. PSTs are installed on borders between Germanyand Belgium, Germany and the Netherlands, Italy and Slovenia and are under constructionbetween Germany and Poland.
With respect to PSTs’ controllability, maximum phase shift ± max is the main parametercharacterising available control range. max is typically in the range of 20 – 40 . Resulting powerflow change depends on network voltage level (EHV/HV) and the present power flow conditions inthe power system; for instance it can be in the level of 10 – 30 MW/deg for 400 kV network. Theobjective of the PST operation is to control the power flow in the tie lines in the medium-to-longterm operation so the time regime for tap-changing operation is rather low. It takes 30 – 60 sec. fora tap to change and the following power change is immediate.
Example from Poland shows that phase shifting transformers are going to be an effective solutionfor congestion problems caused by excessive renewable (uncontrolled) generation. Where othermeans failed (e.g. redispatching generation, DC loop flow and switchyard coupler opening), PSTsare promising option and therefore their development and wider utilisation is likely, particularly inprospect of further RES integration.
3.4.7 Frequency transformer
A device functionally surpassing a phase shifting transformer, both with respect to construction andoperation principle, is a variable frequency transformer (VFT) [111, 112]. It is a controllable,bidirectional transmission device based on a rotating doubly fed induction machine, used forconnecting asynchronous systems, where one system is connected to the stator windings and theother to the rotor windings. Power flow controllability is accomplished by use of a mechanicallycoupled DC motor and proper torque control of on the common shaft. In comparison to PST, VFTcan connect grids of different system frequency, has wider on-load phase angle control, no powercontrol dead band, faster response and no tap-changing mechanism. Its first commercialdeployment took place in 2004 (a 100 MW unit), and there are several examples of fielddeployment but only few of planning studies in the literature. This is caused partly by the functionalsimilarity between VFT and back-to-back HVDC and better characteristics of B2B HVDC withrespect to response and recovery time. On the other hand, B2B HVDC produces harmonics whichhave to be filtered out by separate large devices, whereas VFT produces none and thereforeneeds no filters at all[114-117].

Project ID: 609687
dd/mm/yyyy Page 53 of118
4 Abstractions for modelling interactions across controlboundaries
The scope of this section is to approximate appropriate models that characterize the interactionsunder normal and emergency situations, introducing suitable data rates and models for use byreal-time control functions. This section starts by presenting the fundamental concepts that governthe operation of the present electricity networks. These concepts are applied both to frequency andvoltage control of the present electrical network and executed/applied locally or remotely. Theseoperating and control principles through appropriate modifications or adjustments are envisaged toalso dominate the operation of the future electrical networks.
The trend of increased growth of decentralized (mostly renewable) electricity production lends itselfto a decentralized approach for frequency and voltage control. Thus, local distribution grids willplay significant role in the resolution of voltage and frequency issues. Considering that in future,the generation units will be mainly small renewable resources (which until now are not designed fordirectly frequency and voltage control), it is believed that new strategies and techniques that affectthe flexible and economic electricity production and demand are needed. Thus, some strategiesthat are believed to play a particularly important role in the operation of the future electrical gridsare presented next.
Trends from WP3, WP4, WP5 and Subtask 6.1.1, the current practice of observing Transmissionand Distribution networks, as well as the following documents [60-71] were used as a basis forcollecting relevant information and formulating the nature of future interactions between entitiesinvolved in a flexibility market
4.1 Identification of control boundaries within the European ElectricityNetworks
In the European Electricity Networks two forms of control can be observed. Frequency Control andVoltage Control. The boundaries of these control types extend over the European level, regionallevel (neighbouring electrical grids), national level, local, etc. Boundaries are affected by theelectrical grid structure, the demand and generation characteristics and the market. In futureelectricity networks the boundaries should be defined through more sophisticated structures thatbase their operating principles on structures such as the micro-grids and the smart-grids.
4.1.1 State of the Art in Frequency Control and Regulating Reserves
Frequency Control and the corresponding regulating reserves have to keep the balance betweendemand and supply of electricity. The frequency Control can be seen as a global quality criterionfor real-time power and energy balances. Disturbances depending on generation units operation,the availability of power resources, changes in the demand and real-time behaviour of third partiesand grid customers cause the system frequency to deviate from its set value, which can affect thebehaviour of electrical equipment and may lead to protective disconnection of generation units andeventually a system black-out in the case of large deviations. Imbalances between demand andsupply of electricity are initially offset by the rotating generating sets and motors connected to thesystem’s kinetic energy (system synchronous inertia). System synchronous inertia can only slowdown frequency deviations and is not in the least able to restore the power balance.

Project ID: 609687
dd/mm/yyyy Page 54 of118
For this reason TSOs procure balancing services, called Frequency Control Reserves (FCRs), inthe balancing or real-time market . FCRs compromise an essential part of Ancillary Services (AS)and consist of primary, secondary and tertiary control reserves. In general terms, the PrimaryControl Action taken within 5-30 seconds by generators droop control. Secondary Control resetsthe primary control reserves in 5-15 min in order to be ready for the next disturbance and theTertiary Control restores the Secondary control reserves, manage eventual congestions, and bringback the frequency and the power exchange programs to their target, if the secondary controlreserve is not sufficient. Next, figure 4-1 summarizes the current framework for frequencyregulation within the European Electricity Networks.
Figure 2: Current framework for frequency regulation within the European ElectricityNetworks, [65].
Primary Frequency Control
The objective of Primary Control is to maintain a balance between generation and consumptionwithin the Control Areas/Blocks. By the joint action of all interconnected parties, Primary Controlaims to ensure operational reliability of the Controlled Area and stabilises the system frequencywithin a band around a setpoint, static setpoint, or dynamically set after a disturbance or incident inthe time-frame of seconds. Primary control has no capability of restoring the frequency and thepower exchanges to their reference values. Adequate primary control depends on generation orload resources made available to the cell operator.
Secondary Frequency Control
Secondary Frequency Control (SFC) maintains the balance between generation and demandwithin each Control Area/Block and keeps the frequency within the allowable limits that may bewithin a band around a setpoint, static setpoint, or dynamically set. The SFC should take intoaccount the Control Program and should never degrade the performance of the Primary Controlthat is operating simultaneously in the Synchronous Area . The activation of SFC Reserves isperformed automatically. In order to achieve SFC, the local controller should measure the ControlError (by measuring the appropriate observable signals and send control objectives (active powerset points) to Secondary Control Reserves (adjustment of generation sets). SFC reserves shouldreset the primary control reserves in 5 –15 minutes to be ready for a subsequent disturbance.Adequate Secondary Control depends on generation resources made available by generationcompanies to the system operator, independently from Primary Control Reserves
Tertiary Frequency Control

Project ID: 609687
dd/mm/yyyy Page 55 of118
In a balanced system situation, the Tertiary Frequency Control (TFC) is mainly used to release theSFC Reserves by triggering the Replacement Reserves (RRs). Moreover, it is also possible toactivate supplementary Frequency Restoration Reserves (FRRs) after larger incidents in order torestore the system frequency and consequently free up the system wide activated PrimaryReserves. Tertiary control ought to ensure power balance within a control block/area in a longerduration that complements that of Primary control and SFC. The time frame, in which the RRs’activation and operation takes place, ranges from minutes to hours. In particular, the activation ofRRs is limited within 15 minutes from the disturbance while they can remain active even after thisinterval (e.g. for 1 hour). Although, nowadays TFC Reserves are usually activated manually by theTSOs. In the web of cells concept (to be presented in section 4.5.3), TFC may be activatedautomatically. In the near future the diversity of resources that can be used as RestorationReserves will be quite extensive mainly due to the increasing number of DERs at the distributionlevel.
The above Frequency Control scheme is assumed effective, as far as the power system followsthe traditional centralized configuration as illustrated in Figure 3. According to this configuration thedemand is passive and uncontrollable and does not contribute actively to the operation of thesystem.
Figure 3: Traditional centralized Power system configuration with vertical control capability.
The TSOs keep the power balance on a second to minutes time scale by monitoring the electricsystem frequency, while the generation schedules are pre-defined on a day-ahead market andmay further be adjusted on intra-day and regulating power markets, where available. DSO’sdistribute the power coming in from the transmission grid to their load centers, where localconstraints to transmit ample power are indicated by the deviations from nominal voltage in theinvolved substation nodes of their distribution system. Thus, the power system is controlledvertically by TSO’s and DSO’s. Moreover, TSOs are able to keep the power balance since theycontrol the majority of the total generation in the system. Relatively small distributed generation(e.g. 10% in total) in or near the load centres has little influence on the day-ahead prediction of thesystem load, and therefore little effect on the overall power system control and stability.
More recently, the power system complexity has been increasing mainly due to the widespreaduse of DER (mainly in LV and MV grids). Thus, many frequency deviations (close enough to thedesign limit for primary control reserve) not only at hour boundaries have been observed. Thesefrequency deviations at hour or half hour boundaries appear due to fact that generation followsmarket rules which anticipate the necessary energy and does not consider the real time load

Project ID: 609687
dd/mm/yyyy Page 56 of118
demand and can be predictable. On the other hand frequency deviations at random time pointsmay reveal a short-time mismatch between load and generation due to rapid DER plants outputpower in case of electrical grids with high DER penetration. These continuous system frequencydeviations involve the activation of ancillary services such as e.g. primary and secondary reserve,and increase end-users final electricity prices. Under specific situations the gradient of thesefrequency drops may be higher than 1.5 mHz/s which is comparable to outage conditions.
4.1.2 State of the Art in Voltage Control and regulating Reserves
Generally, the Voltage levels in an electricity network are maintained by reactive power generationprovided by different facilities. The voltage value depends on network topology, generation andloads unbalance, as well as on physical limitations such as transmission line capacity andtransformer loading. Depending on the operational state of electricity networks, the energygeneration units, the consumers as well as system components such as lines and transformer,consume or produce reactive power. Nowadays, in order to compensate an immoderateconsumption of reactive power, TSOs have to ensure that some producers feed sufficient reactivepower efficiently into the networks.
Contrary to the active power, reactive power cannot be transmitted over long distances efficiently,since the transmission of reactive power causes an additional demand for reactive power in thesystem components and thus an extra voltage drop is generated. In order to maintaining anacceptable voltage level and allowable voltage deviation within predefined limits, reactive powergeneration and consumption have to be situated close to each other. Thus voltage control isprimarily a regional problem, which may involve several TSOs in an interconnected system.
Proper voltage levels, close to their rated values, are necessary for correct, safe and efficientoperation of power systems. Too low or too high voltages may cause consumer equipment, if notdisconnected earlier, to malfunction, be damaged or manifest properties that are very undesirableregarding secure system operation. The same applies to the components of transmission anddistribution systems. In turn, if voltages are in their prescribed ranges then usually there is someheadroom for their optimization to minimize losses.
Requirements for voltages involve not only their levels in very different conditions of system steadystate operation but also their behaviour during transient conditions. For instance faults should notcause deep wide area voltage depressions and after fault clearance voltages should quickly returnto their pre-fault values.
All the mentioned aspects of maintaining proper voltage require voltage control which can berealized only when there are regulated sources of reactive power with sufficient reserves and whenconsidering transient condition requirements, part of these sources is able to provide reactivepower rapidly. Therefore system voltage control is inseparable with reactive power management. Itshould be noted that the network itself especially EHV lines dependent on their loading can be areactive power source or sink.
Other than in the case of system wide frequency regulation the voltage regulation and reactivepower management are characterized by area limitations due to the inability to practically transmitreactive power over long distances. The limitation depends mostly on the network characteristics –in a stiff meshed network the voltages are much more uniform and reactive power transfer is moreefficient than in a weak network. It means that in the stiff network a control of one selected bus

Project ID: 609687
dd/mm/yyyy Page 57 of118
voltage may be sufficient while in a weak widespread network one could need more controlsresponsible for voltages in some pre-determined network zones.
Reactive power sources necessary for voltage control are mostly allocated to transmissionnetworks. The most important sources are large synchronous generators with AVR which have theability to provide or consume reactive power very quickly (often less than a hundred milliseconds)and over a wide range. Therefore synchronous generators with AVR have the main responsibilityfor voltage levels and voltage behaviour in transient states.
Referring to the regulation speed and range, synchronous condensers, SVCs and STATCOMshave similar characteristics as synchronous generators. Their rather limited using in today’snetworks is due to economic reasons – fast voltage regulation and some other features likeimprovement of power quality and damping are usually not sufficient for economically viableinstallations of such devices.
Beside synchronous generators the commonly used controllable sources of reactive power intransmission systems are mechanically switchable shunt devices – reactors and capacitors (MSC).Achievable voltage regulation from these devices is not continuous and slower (seconds) than thatfrom synchronous generators. Network switching operations, especially in case of lightly loadedEHV lines are used as a voltage regulation measure by some TSOs.
From the voltage regulation perspective the distribution network is usually a stiff and meshednetwork where adequate voltage profiles can be achieved by regulating voltage at only one buswhich is normally the bus supplied by an EHV/HV (or HV/MV) transformer with a controllable tapchanger. In some cases the tap changer regulation is complemented by mechanically switchedcapacitors and/or reactors. In order to maintain the right voltage profile, energy-intensiveconsumers are ordered to maintain their power factor in predefined values (keep proper balancebetween reactive and active needs).. Also generators in distribution networks are commonlyobliged to maintain a specific power factor.
Area limitation for voltage control and different speeds of reactive reserves provisions are thereasons why power system voltage regulation is realized in a hierarchical scheme which consistsof three layers: fast primary voltage regulation (PVR), slow secondary voltage regulation (SVR)and much slower tertiary voltage regulation (TVR). PVR is always present; SVR and TVR arebecoming more common in modern power systems. Time and spatial separation between involvedregulations allow for using the scheme presented in Fig.4.
Figure 4: General Voltage regulation scheme in nowadays large power systems.

Project ID: 609687
dd/mm/yyyy Page 58 of118
Primary Voltage Regulation
Fast PVR involves large generators operating in transmission networks and usually is synonymouswith generator automatic voltage regulation (AVR). Only local measurements are used in PVR. Thegoal of PVR is to act over the reactive power injection in order to maintain a set-point voltage atgenerator terminals or in some cases when current compensation is used, further in the network atsome real or artificial bus. The reference voltage values are set mostly by SVRs although directsetting by TVR also takes place when an SVR level control is not present. Stations supplyingdistribution networks through transformers with on-load tap changers possibly equipped withswitchable shunt capacitors and reactors and/or more sophisticated faster equipment(synchronous condensers, SVCs, STATCOMs) are sometimes also classified as PVR.
Control area/block operators should have available a sufficient reserve of rapid reactive powerresources participating in the primary voltage control in order not only to ensure normal operationalconditions with a continuous evolving of load and transits but also to prevent voltage collapse afterany contingency.
Secondary Voltage Regulation
SVR has to maintain a set-point voltage value within a certain band at some selected networknode. The set-point value may come from TVR or directly from TSOs if TVR is not present in thesystem. The selected network node so called “pilot node” or “pilot bus” is representative of somepart of the network from a voltage profile point of view. To achieve its regulation goal an SVR usesreactive power resources which are available in generators using rather slow and slightmodifications of PVR set values. Typical time frames are in minutes for SVR. SVR supervises andcoordinates the primary voltage regulators within an area, however solutions adopted for SVRdiffer among systems. In some systems SVR only controls the voltage of a power plant station bususing AVRs of individual generators. In other systems, more sophisticated solutions have beenadopted where the pilot bus is not necessarily a power plant bus and SVR includes generators andother reactive power sources from a larger area (regulation zone). Examples of an SVR limited to aplant voltage control can be found in the Polish and some Balkan countries’ power systems. Oftencited in papers, examples of more complex zonal SVR are from the French and Italian powersystems.
An important function of SVR is the maximization of reactive reserves of the involved generators. Itis realized by proper reactive loading of generators, controlling tap changers of step-up andcoupling transformers and switchable shunt reactive power sources (if these measures areavailable). The main SVR control goal may be realized by an automatic PI controller or usingsome optimization algorithm with constraints (which is a better and more efficient solution). It isobvious that SVR, especially the zonal type, requires using a sort of SCADA system.
Tertiary Voltage Regulation
The tertiary voltage regulation represents an enhancement of the secondary voltage controlscheme. It is usually based on a global system optimization which calculates updated voltage set-points for the regional voltage controllers associated with SVR. It is completed in a time scaleranging from 10 min to 30 min or even hours. TVR is generally present in all large systems but mayhave very different forms. The most primitive form of TVR involves set-point values for PVR orSVR given by operators based on their experience and/or on power flow analyses which areperformed routinely by TSOs in various cycles (planning, day ahead, intraday). Increasingcapabilities of SCADA-EMS equipped in power system state estimators provide possibility of

Project ID: 609687
dd/mm/yyyy Page 59 of118
conducting real-time system security analysis and optimal voltage scheduling. Such solution ofTVR is used in the Italian power system. In all cases the goals demanded from TVR are systemoperation security including voltage stability and minimization of losses. It seems possible thatincreasing performance of the SCADA-EMS systems might eliminate at some point in the futurethe need for SVR – optimal set-point values for voltage controlling equipment in transmissionnetworks will be determined in real time based on appropriately frequent SCADA measurements.An obstacle for such solution may be growing dispersed variable generation which will definitelymake system voltage control more complex.
Large participation of variable renewable generation in some systems (Germany, Denmark, Spain)already forced certain modifications to voltage regulation schemes which involve more activetreatment of reactive reserve capabilities present in some types of dispersed generation. Thesecapabilities (reactive power generation or consumption) may be activated based on system loadconditions or remotely on request from system operators. There are also more installations ofpassive and active sources of reactive power in transmission networks (mainly synchronouscondensers) which are necessary to safely handle bulk active power transfers resulting from largevariable renewables and the growing electrical energy market.
4.1.3 Frequency and Voltage Control - the Vision of 2030
According to the European targets, the future energy consumption will be fed by a low carbongeneration mix (involving high penetration of technologies such as wind and solar farms), while animportant part of generation will be based on decentralized generators distributed all over thenodes of the power system. In the new power system structure, TSOs will be able to controlsignificantly the lower part of the generation compared to the traditional centralized configuration,and thus they will no longer be able to compensate large deviations in the power balance.Theoretically, even a large power imbalance could be faced with accurate day-ahead predictions ofdecentralized generation and electricity demand of load centres, whether in practice this will bevery difficult due to the intermittent distributed generation profile (depending on weatherconditions). Moreover, increased electricity loads and sources such as EVs and residential PVsystems, will influence the balance between day-ahead production and consumption schedule andwill leave energy markets with higher and less predictable need for balancing power.
In order to face the above mentioned problems the traditional power system centralizedconfiguration (top-down vertical control) will be changed into a bi-directional vertically andhorizontally integrated control scheme, according to the next figure. Specifically, at a local(distribution grid) level, the distributed controls of the various actors are integrated in such a way toreduce the local power imbalance (solve local problems locally), while the different ‘horizontallevels’ support each other to maintain system wide power balance including an exchange ofinformation about the global and local power balance and the related grid constraints on a “need-to-know” basis, together with required control signals such as a desired change in total load,generation or system synchronous inertia. The first statement depicts the horizontal integration,while the second one depicts the vertical integration. The aforementioned scheme originates fromElectra main concept for the future structure of the electrical grids and it can be found n ElectraIRP proposal.
The proper operation of the horizontal Integration control demands appropriate input signals thatreflect the local horizontal power imbalance. These could be the SOC deviation from nominal inlocal energy storage, the price signals that are generated by virtual local energy markets, thepower level deviations from circuit set-points, the voltage level deviations from nominal values, etc.

Project ID: 609687
dd/mm/yyyy Page 60 of118
On the other hand the vertical Integration control operation relies on information and control signalsthat originate from local control schemes. The scope of the individual local control schemes is toreduce the power imbalance within a specific characteristic time-scale. This type of control may bereferred to as “Horizontally-Integrated control schemes”, see Fig 5.
Figure 5: The bi-directional vertically and horizontally integrated power system controlscheme.
The abovementioned power system configuration could be depicted as a combination of connectedtrees of system objectives and functions, decomposing the grid responsibility into cells (subgrids),see Fig 6. Each cell can still rely on imports/exports, but these are treated as ‘fixed’, and the cell isresponsible for maintaining its local power balance at all timescales. Cells will be mapped on ahierarchical location and there may be more than one connection between neighbouring cells.Cells themselves will be configurable as well as the connections between cells and it will bepossible to change them with respect to the allowable coupling limitations. The aforementionedconcept as well as the figure 6 originate from the outcomes of Electra WP3 and WP4. More detailscan be found at Deliverable 3.1, [1].
Figure 6: Future Power system configuration based on the combination cells (web of cellsconcept), [1].

Project ID: 609687
dd/mm/yyyy Page 61 of118
In each cell, there will be only one system operator, which will perform reserve management in asimilar way that TSOs perform for their Control Area or Control Block today. The system operatorshould perform Droop Control Actions both for frequency and voltage deviations and they will beresponsible for restoring frequency and voltage to their nominal values (in an economically optimalmanner). Besides, the cell system operator will be responsible for synchronous inertia control (insmaller scale due to the decreased cell power level). On the other hand it is possible that morethan one Balance Responsible parties (BRPs) are to be involved in a cell.
4.2 Interactions between actors involved in Frequency ControlAs it is already mentioned, the balance between generation and load must always be maintained tokeep the power systems secure. Thus the power systems must be operated with preventativesecurity margins. In other words, a sufficient backup capacity of generation and/or load (the so-called operating reserve) is needed in order to counteract any unforeseen event by substituting thequantity of demand and generation again.
Operating the power system with high amounts of reserves entails more security for the system,but at the same time increases the system operation costs. On the other hand, low amounts ofreserves may cause ad-hoc operations which also increase the operation cost. Furthermore,energy generating units or load providing reserves should be dispatchable within few seconds orsome minutes, thus increasing the necessity for flexibility of power system components. Therefore,an appropriate dimensioning and use of reserves are needed to maintain the system secure andalso avoid unnecessary operation costs.
In order to achieve an economic power system operation, an efficient market design for electricitysupply is required. During the last decade the market activities have increased and changed insidethe European electricity networks. As a result the exchanges between market parties and controlareas have not only increased but altered too. The following is a summary of the main reasonswhich lead to Interactions in frequency control due to the increased market activities insideEuropean electrical grids and the inability of present power systems to solve the ensuing frequencystability problems. Similar interactions will be faced in cell operation too, if the following causes areignored.
The energy market rules and active network management rules in sectors such as the balancingand the starting and stopping of generation are not well coordinated. The electricity marketdevelopment and the continuously increasing number of market participants causes frequencydisturbances at times when tariffs and schedules are being changed. Thus many frequency dropsor peaks are detected at the hourly, half-hourly or quarter-hourly schedule changes between orwith individual control blocks/areas. These frequency disturbances may be due to different controlsettings in control areas and/or different characteristics of the secondary controllers andcorresponding reserves.
For example differences between European countries are observed: at controller type andaccuracy, proportional term – - value, integral term value -T-, and K factor (for measuring theACE).
Inside a country, differences are detected: at reserves type (start-up time, max change in 30sec,ramp rates), the high power gradients due to fast connection or disconnection of some units (likehydro pump-storage), the mismatch between fast and slow generation, (short term unbalances).
The actors involved in Frequency Control and their respective roles may be the following [73]:
Balance Responsible Party (BRP):
BRP interacts with the power production, consumption, markets and the cell operator.

Project ID: 609687
dd/mm/yyyy Page 62 of118
Concerning the energy production, BRP typically operates own production units. Concerning the energy consumption, BRP takes responsibility for the retailers’
consumption and trades energy according to contractual agreements. BRP is balance responsible for minor third party owned production assets. BRP may sell electrical energy at neighboring cells, Balancing responsibility means that the BRP will be held responsible for imbalances in
the energy market. If the BRP delivers ancillary services, it has a full delivery obligation.
Cell System Operator (CSO):
CSO interacts with the BRP and with local controller and the central controller (if any) CSO buys access to manual regulating power by regulation reserve payments to BRP. CSO activates the manual regulating power by communicating with BRP. CSO is responsible for collecting and validating metered settlement data on
transmission level for the BRP. CSO facilitates the financial settlement between ancillary service providers and BRPs to
settle the activation costs of the ancillary services.
Cell Operational Information System (COIS):
COIS sorts and presents the bids accepted by the CSO for the Regulating PowerMarket.
COIS interacts only with the CSO. COIS receives the bids from the CSO. COIS shows the merit order list, which can be separated by price areas. The COIS is jointly operated by the local controller.
Distribution System Operator (DSO):
DSO is responsible for collecting and validating metered settlement data on thedistribution level for the BRP.
The above actors play roles both in technical and market operations. With respect to marketoperations, two important groups of actors are market players and market facilitators. In terms ofthe energy market, the market players are the BRPs and the market facilitator is the cell market. Incase of the ancillary service markets, both the CSO and BRPs are market players. The COIS has afacilitating role, while the DSO does not have a market role as a player or facilitator- only a rolewith respect to settlement as metering responsible.
4.2.1 Interactions between actors involved in Voltage Control
To meet a high quality of supply and the voltage regulation objectives, a hierarchical controlstructure has been developed and organized in three control levels: primary, secondary andtertiary.
This hierarchical control system is widespread along the national HV grid, with the differentcomponents placed in different facilities: the power stations, the regional control centres and thenational control centre.

Project ID: 609687
dd/mm/yyyy Page 63 of118
A control scheme is shown in Figure 7, in which the main components are the following:
AVR – it is the Automatic Voltage Regulator, the primary voltage controller, It controls thevoltage directly at the generator terminals.
PQR – it is the Reactive Power (Q) Regulator of a single power plant, and it is a componentof the secondary voltage control
RVR – it is the Regional Voltage Regulator, it has the goal to control the voltages of thepilot nodes of its electrical region
NVR – The National Voltage Regulator is at the top level of the hierarchical controlstructure.
Figure 7: The scheme of the hierarchical voltages control of a National Transmission Grid.

Project ID: 609687
dd/mm/yyyy Page 64 of118
Figure 8: Time responses in closed loop of the hierarchical voltages control of a nationaltransmission grid.
As shown in the figure 8 each controller sends to the lower level voltage or reactive powerreference values. For stability reasons each control level is separated from the other, the figureshows the closed loop time responses of each one:
2-5 seconds for the AVR of each generator 20-50 seconds for PQR 100-200 seconds for the RVR placed in each Regional Control Centre 400-500 seconds for the NVR which has the goal to optimise the values of the Pilot Node
voltages of the grid.In the following, each voltage control level will be detailed.
4.2.2 Primary Voltage Control
The primary voltage control regulates the voltage of the single alternator and it is realized by theAVR, the Automatic Voltage Regulator, A typical feedback control scheme for a synchronousgenerator is shown in Figure 9.

Project ID: 609687
dd/mm/yyyy Page 65 of118
Figure 9: The AVR Controller.
The Figure 9 outlines the main voltage loop and the additional positive feedback (the PSS, PowerSystem Stabilizers) from active power P and rotor speed . These signals are essential toguarantee the stability of the generator connected to the grid for different operation points, inpresence of disturbances of different nature. The terminal voltage V of a the generator is controlledvia the strength of the magnetic field of the alternator, which is determined by the excitation voltageVf of the exciter, that is the input variable to control the alternator.
It is also necessary, independently of the type of power plant, to introduce the limits of thecapability curve with the maximum and minimum value of the active and reactive power producedand absorbed. The voltage regulations of the generator verify if the generators are violating thereactive limits and if the option of the generated reactive power control is active.
4.2.3 Secondary voltage control
The secondary voltage control level of a transmission grid is constituted by two different regulatorsshown in the Figure 10:
The PQR - the Reactive power regulator - is placed in those power plants which werechosen to regulate the voltage in some defined nodes (called PILOT NODES) of thetransmission grid. The PQR receives the reference value of reactive power from the RVR,the Regional Voltage Regulator, and on the basis of this consignment the PQR controls thereactive power produced by each generator
The RVR - Regional Voltage Regulator - has the goal to define the reference values ofreactive powers necessary to satisfy the constraints of PILOT NODE voltage levels. Thesereference values are sent to the PQRs of the power plants which are under secondaryvoltage control.

Project ID: 609687
dd/mm/yyyy Page 66 of118
Figure 10: The Secondary Hierarchical Voltage Control Structure.
4.2.4 Tertiary voltage control
The highest level in the hierarchical voltage control is the Tertiary level that has the goal tooptimise the values of the voltages in the pilot nodes of the entire national grid in order to minimisethe losses of energy along the transmission grid.
In Figure 11 there is the general schematisation of the interaction of the centralised tertiary voltagecontrol system NVR (National Voltage Regulator) with the other control level.
In order to define the optimal voltages profiles of the pilot nodes with the objective to minimise thelosses on the transmission grid, the NVR uses different algorithms such as a state estimator, anoptimisation algorithm, etc.

Project ID: 609687
dd/mm/yyyy Page 67 of118
Figure 11: Voltage controllers interaction of the HV transmission grid.
4.3 Interactions modelling under normal and emergency situationsUCTE research activities have proven that an increase in quality and/or quantity of secondarycontrol reserve does not improve the frequency quality during uncoordinated ramping, due to therelatively slow (centralised) activation of this reserve. The most effective way of reducing thecritical frequency deviations during schedule ramping is to improve the quality of ramping bydemanding this as far as possible from all acting parties in the same way: generators, loads andbalance responsible parties. This will require corresponding adaptations of present grid codes, andfuture cells operating procedures, in order to create the required rules and necessary enforcementmechanisms.
Cell system operator and the BRPs should intercommunicate not only with the generationcompanies/units inside the cell but also with neighbouring cells, in order to implement rules forestablishing a maximum gradient for total generation output and also for demand (as much aspossible), at the hourly boundaries, considering ramping periods of +/- 5 minutes, to enable theremaining system unbalances (due to modifications of production, consumption and/or exchanges)to be controlled with the Load Frequency Control.
At cell level each system operator and the corresponding BRPs should coordinate with thegenerating companies feeding in their system the power plant schedule changes in such a waythat they avoid as much as possible steep or step-wise changes in generation at hourlyboundaries.

Project ID: 609687
dd/mm/yyyy Page 68 of118
Cells System operators should have to monitor the application of these rules (above a specifiedrelevant size) and implement specific incentives to form the consumption and the production insidetheir cells. At the same time the neighbouring System operators should exchange the aboveinformation between them, in order to not jeopardize subsequent reserve activation. Specifically,an additional load flow in some cell (due to the increased electricity needs of others cells) mayharm theirs scheduled load flow, making them unable to activate a (local) reserve in case of apotential disturbance. Moreover, imbalance accounting should take into account the ramping ratesand re-evaluate the mechanism of fixed prices periods in market environments.
Moreover the synchronous inertia control at the cell level should be re-examined due to thereduction of the rotating mass at the cell level. If this issue is not addressed, the Frequency ControlReserves may be activated more frequently and much faster.
4.4 Model based interfaces for demand response contributorsAn increased growth of decentralized, mostly renewable, production may force a shift to adecentralized way of approaching frequency and voltage control as well. Local distribution grids willbe used more dynamically resulting in more voltage issues. Considering the Sea-of cells concept,the generation units will be smaller and in many cases it will be renewable resources which makethem less suitable for frequency control. For that reason a more important role for participation atthe demand side will be expected for voltage and frequency control in the future.
Today, there are already a number of ways through which consumers can contribute (direct orindirect) to grid stability:
Frequency reserves: consumers can contribute to reserve mechanisms of TSO’s. This canbe done directly (large industrial consumers) of via an aggregator which bundles theflexibility of a group smaller consumers. The main application would be tertiary frequencycontrol, but there are known cases of primary frequency control that utilise consumerresponse.
Electricity markets: by buying electricity on day-ahead and/or intraday market, companiesare motivated to buy more when electricity is cheap (and readily available) and to buy lesswhen electricity is expensive. Trading can done directly (by large companies) or in anaggregated way.
Strategic reserves: this type of reserves exists in Sweden, Finland and Belgium and ismainly used for solving extreme scarcity problems, which prevents the day-ahead marketfrom clearing.
Local balancing solutions: Renewable resources have to pay injection tariffs and grid usagefees can be an major part of the electricity cost. Local consumption of renewable energy(without injection to the grid) can reduce these costs significantly which results in anincentive for increased electricity consumption when a lot of renewable energy is available.This can reduce grid issues at other locations in the grid.
Grid support: Although not widespread, there are known cases where local resources andloads are used in order to solve local congestion issues.
4.4.1 Interface requirements for demand response
Offering grid services is different for a demand response contributor compared to a largegenerator:
Offering grid services is not the core business of the demand response contributor.

Project ID: 609687
dd/mm/yyyy Page 69 of118
100% availability is in most cases is not achievable. Activations times should be limited.
The bottom line is that the demand side can contribute to grid stability, but the contributor’sconstraints are more strict. Managing these constraints and making sure that the constraints arenot violated will be a key element in enabling demand side flexibility to find its way to the market.
Further, it is important for a demand response contributor that interfaces can be used for differentapplications. Today, the interface for a company e.g. offering tertiary reserves is completelydifferent to a company who trades in electricity markets. Identical interfaces would result in markettransparency, market transparency will make it easier for companies to offer their flexibility to themarket parties.
4.4.2 Model Based interfaces
In a “model based interface”, the flexibility user and the flexibility contributor agree on a simplifiedmodel which describes the actual behaviour and constraints of the flexibility resource. The principleand the properties of a model based approach will be explained by means of the followingexample:
Figure 12: Explanation of the model based interface for demand response contributors.
The above Figure 12 represents an installation which is split up in 2 parts:
The first part of the installation (1) contains a lot of flexibility and the output rate of this partis proportional with the electrical power which is consumed in (1)
The second part of the installation (2) has no flexibilityBoth parts of the installation are decoupled by means of a buffer where the intermediate productcan be stored.
In the above figure the following notations are used:
P [kW]: Electrical power consumption of the first part of the installation. ri [ton/h]: production rate of the first part of the installation which feeds into the buffer. ro [ton/h]: production rate of the second part of the installation which leaves the buffer. b [ton]: the actual filling of the buffer. bmin [ton], bmax [ton]: minimum and maximum filling of the buffer. Pmin [kW],Pmax [kW]: minimum and maximum power of the first part of the installation.
The flexibility, present in this installation can be described with a limited number of equations:
ri = P.K with K the production factor of the installation expressed in [ton/kWh] db/dt = ri-ro
and the following constraints:
bmin b bmax Pmin P Pmax

Project ID: 609687
dd/mm/yyyy Page 70 of118
The flexibility resource provides the flexibility user with state information (b), planning (ro) and theconstraints (Pmin, Pmax, bmin, bmax). Based on this limited information, the user gets allinformation needed for the exploitation of the flexibility resource.
Once the interface is in place, there are 2 possible ways of working:
The flexibility user takes control of P and takes care that the constraints are not violated In normal conditions, the flexibility contributor acts according to an agreed “normal
behaviour”. Only when the flexibility user wants deviations from the predefined “normbehaviour”, the flexibility user takes over control.
The agreement on a model based interface between a flexibility user and contributor gives way tomore possibilities compared to switching off a certain amount of power for a contractually agreedtime:
Capacity monitoring: based on the exchanged information, the flexibility user knows theavailable capacity at any moment in time and in its aggregated portfolio. It can monitor theavailability over time and use that information to calculate the remuneration.
Real time capacity planning: The model based interface allows to go a step further thancapacity monitoring. Due to a basic understanding of the underlying process, it is possibleto calculate the future available capacity based on the current state and planned actions.
Rebound control: the activation of flexibility sometimes results in rebound effects. Thismeans that after the demand response event, the flexibility resources try to recover fromthe event. This might result in a temporary higher or lower power consumption which iscalled the “rebound effect”. In a model based interface approach, the flexibility user knowsthe state of the flexibility resource and can estimate how urgent the recovery is. In manycases the recovery can be postponed to a moment in time which is safe for the grid.
Incident anticipation: not all incidents can be predicted (e.g. failure of a power station) butsome incidents don’t occur completely unexpectedly. Examples:
o Peak consumption close to the grid limits on a cold winter day with limitedrenewable resources available.
o Peak production of renewable resources on a bank holiday with limited economicactivity
For this kind of incidents, the flexibility user can decide to anticipate its portfolio in order tocreate extra flexibility in case an event takes place. This approach makes it possible toprepare the same flexibility resource for different types of events (reduce or increaseelectricity consumption).
Multiple actor interface: a model based interface only describes the physical capabilitiesand constraints of a flexibility resource but doesn’t define how the flexibility should be used.That makes the interface suitable for multiple actors in the market.
Bidirectional communication: parameters and constraints do not have to be constant overtime. The flexibility resource can communicate new constraint values or parameters in realtime when an incident occurs.
4.4.3 Hardware abstraction
In the previous section the concept and possibilities of a model based interface are explained. Theshown example, however, is difficult to use in practice because all parameters are very specific tothe application. The fact that the flexibility resource is a buffered process which has parameters

Project ID: 609687
dd/mm/yyyy Page 71 of118
and states as “buffer level” and “production rates” expressed in ton and ton/h on the interface isirrelevant information for the flexibility user.
The original equations and constraints can be converted easily into equations and constraintswhich only contain power and energy. This is shown in the figure below. On the left hand side, allequations are divided by the application specific production factor in order to achieve a set ofequations and constraints which describe relationships between power and energy, see Fig 13.
Abstract equations:
dE/dt[kW] = Pi[kW] - Po[kW]
Abstract constraints:
Emin[kWh] E[kWh] Emax[kWh]
Pmin[kW] P[kW] Pmax[kW]
Original equations:
ri [ton/h]= P[kW].K[ton/kWh]db/dt[ton/h] = ri[ton/h]-ro[ton/h]
Original constraints:
bmin[ton] b[ton] bmax[ton]
Pmin[kW] P[kW] Pmax[kW]
Figure 13: Adaption of the original equations and constraints in power and energy terms.
This conversion is called a hardware abstraction which has two major advantages:
Lots of processes can be mapped to universal energy and power equations which results inan identical interface from the flexibility user point of view.
The specific knowledge of the industrial process is present on the flexibility resource side ofthe interface. On that side, the translation to power and energy parameters can beperformed more readily.
4.4.4 Flexibility categories
In the previous sections, the concept of model based interfaces and hardware abstraction wasintroduced. It is not obvious, however, to map all kinds of flexibility resources on one single genericabstract interface. The actual number of flexibility interfaces needed in order to describe allsources of (demand side) flexibility is still under investigation. In this categorization, a good trade-off between generality and specificity is important: the more generic interfaces are, the moreapplications can use the interface but they can become cumbersome. As a first indication, it isexpected that most demand response contributors can be fitted into 2 to 4 different interfaces.

Project ID: 609687
dd/mm/yyyy Page 72 of118
5 Modelling the conflicts across multiple control boundaries
This section describes the main outcomes of the work conducted under subtask T6.1.3 includingthe definition of controller conflict from a flexible power system perspective, a review of state of theart in power system control conflict and an outline of the methodology for identifying these conflictsduring system operation and their impact on system stability. There are important dependenciesbetween this subtask and subtasks T6.1.1 and T6.1.2 in addition to interactions with other researchwork packages – mainly subtask T4.2.2 (interworking with WP5 and WP6 for monitoring andcontrol functions specification).
Starting with a fundamental assumption that a power system constitutes a high level of controllableflexibility resources, the following main objectives of T6.1.3 are presented:
The determination of direct sources of control conflicts and their extent across controlboundaries in light of system interactions defined by T6.1.2 and detailed frequency andvoltage control use cases developed in WP4.
Quantification of the impact of aforementioned control conflicts on frequency and voltagestability and consequently guiding functional specifications of novel controllers to mitigate ormanage these conflicts under normal and emergency situations.
5.1 Definition and causes of controller conflict
5.1.1 Definition of controller conflict
In order to establish a clear relationship between conflicting behaviour of controllers and the impactof such behaviour on the system frequency and voltage, it is necessary to define a workingdefinition of controller conflict. Thus, the identification and analysis of the phenomenon can befocused on those interactions that are directly relevant to controller interactions. Although factorsindirectly influencing controls into conflicting behaviour (e.g. electricity market rigging), the rationalebehind focussing on controller interactions stems from the ability to directly derive clear functionalspecifications for novel controllers to be developed. To this end, traceability and testing ofrequirements can be achieved readily. Provisions for non-direct factors driving controller conflictcan be made separately in the high level use cases and design specifications.
A simple working definition is proposed in order to define controller conflict and is presented asfollows:
A control conflict is an undesired change of an intended control action as variable in a systemof physical devices as a response to a change in the set point of a controller.
The cause of these undesired changes will be made clearer in the following subsection.
The occurrence of controller conflict implies that oversights in controller development occurespecially in the specification and design stages. Thus, conventional approaches to controllerdevelopment as adopted by power systems specialists may not be entirely suitable. And newcontroller development and testing philosophies may need to be applied, which must take intoaccount the influence of other controllers and global grid parameters. This is not to imply thatcoordinated control schemes are the only suggested solution to controller conflict, but it is toemphasise the importance of a holistic approach to specification, design and testing of controllersfor a highly flexible power system.

Project ID: 609687
dd/mm/yyyy Page 73 of118
5.1.2 State of the art and identification of the causes of controller conflict
Presenting the state of the art and experiences in controller conflict in network operation scenariosprovides for a solid starting point where the problem and its impact on system stability can bebetter understood. To this end, this section summaries the main findings from the literature andfrom participants’ experience in terms of scenarios or examples of controller interactions resultingin conflict. A measure of controller conflict is presented for each example. This can be used as anindicator of the impact of controller conflict on system stability. Suggestions for resolving controllerconflict are also presented, which will inform the development of flexibility control requirements.These examples are presented in Table 14 below.
Table 14: Summary of examples and experiences of controller conflict involving flexibilityresources.
Nature ofcontrol scheme
Interactingcontrollers orparties
Nature of conflict Measure ofconflict
Possibleapproaches toconflictresolution
Distributionsystem energybalancing [73]
Energy balancingcontrols contributedby distributionnetwork andservices providedby prosumers
DSO requires thereduction of powerexchange due tolocal constraintswhile aVPP/aggregatorrequires that morepower is produceddue to favourablemarket price
Violation of localnetworkconstraints
Multi-agentbased coalitionsrepresentingnetwork andprosumerinterests couldbe used
Distributionsystem voltagecontrol [74]
Transformerautomatic tapchanger controland DG active andreactive powercontrol
Conflicting voltagecontrol objectives ofminimizing systemvoltage deviations,while reducing tapchanger operationsand maximizingtransformer and DGutilization
Tap changerhunting orsuboptimalasset utilization
Multi-agentbasedcooperativecontrol schemeto reach a bestcompromisebetween globaland self-objectives atany given time
Distributionsystem voltagecontrol [75]
PV reactive powercontrol and voltageregulator (VR)automatic tapchanger control.
VR tap changerrunaway condition(maximum/minimum tapposition withoutreaching targetvoltage) may ensuemostly duringreverse powerflows due to PV
Violation ofvoltage limits
Performingoptimal reactivepower dispatchto limit tapchangeroperating rangeconsidering inlight of systemconstraints

Project ID: 609687
dd/mm/yyyy Page 74 of118
generation
Local DERvoltagecontrollers [76]
Multiple DG voltagecontrollers
With largequantities and closeproximity of inverterinterfaced DG, DGcontroller andnetworkinteractions cangive rise tocontrolleroscillations andsmall signal stabilityissues
Frequencyinstabilities
Identification ofoscillatorycontributions ofDG and impactof controllerlocation withinthe system totake intoaccount duringdesign anddeployment ofDG andassociatedcontrollers.
Energybalancing [77]
Price responsiveenergy balancinggeneration andload controls
Balancing marketswith relatively longclearing times andshort price signalcommunicationsdelays maydestabilize thesystem where pricesensitive controlsrespond out ofsynch with themarket
Frequencyinstabilities
Reduction ofthe proportionof pricesensitivecontrols
Careful choiceof intervals forpricecommunication
Active networkmanagementusing flexibilityresources [78]
Controller forflexible demand,generation andenergy storage
Conventionaloptimal power flow(OPF) used todispatch theseresources considerconstraints for asingle point in time,as such the effectof resourceconstraints such asenergy storagecapacity/state ofcharge may beignored over time.Thus controlleractions may nottake into accountthese resourcelimitations
Insufficientflexibilityresponse overtime
Inter-temporalvariables (e.g.energy storagestage of charge)should beformulated aspart of a‘dynamic’ OPFsolution

Project ID: 609687
dd/mm/yyyy Page 75 of118
DG control inthermallyconstrainednetworks [79]
Load flow-dependentcurtailment of amaximum of 5% ofthe yearly energyfeed-in to the gridon a per-generatorbasis in maximumload situations
5%-curtailmentaction might collidewith localcontrollers orcontributions toactive powercommitments inVirtual PowerPlants
Violation ofthermalconstraints atnetworkinterfaces
Multi-agent-basedcooperativecontrol or modelpredictivecontrol can beused
Higher levelvoltage control atTSO/DSOinterface[source: iQ-Control project]
Higher-level (iQ)controller forreactive powerbalancing at theHV/MV interface isset to meetcontracted reactivepower set pointsbetween TSO andDSO
iQ-control actionmight conflict withlocal voltagecontrollers
Conflicting set-points fromdifferentcontrollers andvoltage bandviolations
Multi-agent-basedcooperativecontrol or multi-criteriaoptimization canbe used
Frequencycontrol supportfrom DG [80]
DG inverter f/P-control
With largequantities and closeproximity of inverterinterfaced DG, DGcontroller andnetworkinteractions cangive rise tocontrolleroscillations andsmall signal stabilityissues
PLL oscillationof DG invertersand poweroscillations
Multi-agent-basedcooperativecontrol schemeto find a stablemulti-inverterconfiguration oradaptive localcontrol
VPP andancillary servicescontrol [81]
Active powercontrol (VPP-scheduler) andinverter controllerof DER
Activation ofancillary serviceprovision byinverter controller(e.g. voltage controlor activation ofprimary/secondarycontrol power) mayinfluence activepower provision ofDER and thus yielddeviation fromVPP-schedule
Deviation ofactive powerflow fromschedule
Separate DERused for VPPand ancillaryservices toensure thatsystem stabilityis prioritized
Local voltagecontrol of
PV invertercontrollers
PV inverters mayoperate using a
Power quality ofnetwork where
Use ofappropriate

Project ID: 609687
dd/mm/yyyy Page 76 of118
inverter-basedgeneration [10]
reactive powerdroop control basedon localmeasurements,which may result inoscillations inreactive powercontributionbetween adjacentPV inverters
PV is installed damping ratios
Grid congestionmanagement[82]
Multiple controllersof active nodes andparticipantsconnected to thegrid andcontributing to aflexibility market
Possible conflictbetween a widerange of controllersand participants(e.g. VPP, LVcontroller, flexibilityoperator).
Level of gridcongestion
Introduction of a‘traffic’ lightconcept togovern marketfunctionalitybased on gridstate (e.g.normal, sub-optimal,exceedinglimits)
Grid servicesprovided by DER[83]
Controllersassociated with alarge scaledeployment of DER
Multiple gridservices that utilizeDER couldpotentially beconflicting inoperation given thelarge scale of DERdeployment
Varies withnature ofstability issuesintroduced tothe system
Grid servicescan beprioritizedbased on basedonconsiderationsregarding thenature of theservice and thestate of the grid
Flexible demandfor congestionmanagement[84]
Indirect control ofdomestic LVheating load
Increasedelectrification ofloads (heating, EV)may lead tooverload ofdistributiontransformer, andconsequently thenecessity to shedheating loads toalleviate congestionwhich reducescustomers’ qualityof service (i.e.decrease inhousehold
Transformercongestion vs.householdheating (orcomfort) levels
Usage ofhouseholdthermal inertiaas an energybuffer

Project ID: 609687
dd/mm/yyyy Page 77 of118
temperature)
Grid voltagecontrol [source:studies andpracticalexperience withPolish grid]
Automatic tapchanger controland generator AVR
Tap changer andAVR each regulatelocal voltageaccording to setpoints. This mayresult in an overallrise in grid voltage
High reactivepower outputfrom generatorswhile tapchanger is at orclose to its taplimit
Application ofa droopcharacteristicto voltagecontrol
Coordinatedset pointsbetweenAVRs and tapchangers.
Grid voltagecontrol [source:studies andpracticalexperience withPolish grid]
Generators’ voltagecontrollers
Generators in closeproximity and alloperating in voltagecontrol mode resultin some generatorsconsuming reactivepower produced byother generators
Generatorsoperating atvery differentpower factors
Application of adroopcharacteristic tovoltage control
Power oscillationdamping [85]
Power systemstabilizers (PSS),FACTS devicestabilizers (FDS)and responsivegeneratorgovernors
Interactions of anelectromechanicalnature involvingaforementionedstabilizers generallytend to degradesystem dampingparticularly for inter-area oscillationmodes, but mayalso enhancedamping of somelocal-areaoscillation modes.Further interactionsmay ensueinvolvingresponsivegeneratorgovernors whichlead to systemoscillations
Increasing thegain of astabilizer mayimprovedamping of oneinter-areaoscillation modewhile degradethe damping ofa second mode
Proper settingof PSS, FDSand governorparametersbased oncomprehensivesystem analysis
Active powercontrol throughHVDC links [86]
HVDC (LCC type)current/powercontrollers in multi-infeed system
A request toincrease the activepower infeed fromone HVDC linkresult in theconsumption ofreactive power
Multi-infeedinteractionfactor, modalmaximumavailable powerand modalvoltage
Operation ofone of theHVDC links incurrent modeinstead ofpower mode

Project ID: 609687
dd/mm/yyyy Page 78 of118
which depressesthe AC sidevoltage. The DCvoltage in otherHVDC linksbecomesdepressed as aresult of this andconsequently theiractive powerinjection is alsoreduced. Tocounter act this,these links attemptto increase currentdrawn to maintainprevious activepower level whichresults in furthervoltage depressionin an unstablemanner
sensitivity factorare typicallyused tocharacterize thisproblem
Networkcongestionmanagement[87]
Maximum powerpoint tracking(MPPT) of windturbines anddispatchingcenter’s EMS
MPPT operationmaximizes thepower output fromwind turbines, butEMS may curtailwind generation ifthe network iscongested
Curtailment ofwind generation
Utilization ofenergystorage
Use of activenetworkmanagementor wide areacontrol
Grid operating conditions can have a great impact on the development of controller conflicts.Normal, stressed and emergency grid operating states can stimulate the occurrence of controllerconflict in different ways. Protection systems in particular can be prone to performance degradationduring stressed and emergency system conditions. This is because protection systems are gearedtowards dependable operation rather than secure operation, thus resulting in mal-operation whenthe grid is experiencing instabilities [88]. Consequently, the grid becomes more vulnerable tofurther instabilities. It is foreseen that operating the grid in more flexible manner including themaximisation of flexibility resources and asset utilisation may exacerbate such protectionperformance problems. A few examples to illustrate this problem are summarised in Table 15.
Table 15: Impact of grid state on the performance of protection schemes.
Protection schemes affected Nature of conflict Possible approaches toconflict resolution
DG and grid frequency based Disconnection of generation Tuning of non-detection zone

Project ID: 609687
dd/mm/yyyy Page 79 of118
protection including under-frequency, rate of change offrequency and low frequencydemand disconnection [89]
leading to system frequencyexcursion can result in DGfrequency protection trippingdue to very sensitive settingswhich leads to furtherdestabilisation of systemfrequency. Low frequencydemand disconnection (LFDD)protection can be used to avoidfurther system frequency dips.However, if frequencyresponsive demand of furthernet power exporting DG isdisconnected by LFDD, thenthe system will be destabilisedfurther.
of DG loss of mains protection.
Adaptive protection settingstuned for prevailing gridconditions
DG voltage and frequencyprotection [90]
Inappropriate fault ride through(FRT) capabilities can result intheir unnecessarydisconnection during systemdisturbances. For instance, thedisconnection of DG duesystem frequency instabilitiesmay result in increased powerexport to the distributionsystem. Subsequently, avoltage rise may occur whichcan lead to further DGdisconnection.
Improved FRT requirements
It is clear from the examples presented above that the presence of multiple flexibility resources andthe lack of coordination between associated controllers can be a major driver for conflicting controlbehaviour. Some of the most prevalent factors giving rise to controller conflict include:
Contention between two or more controllers over a shared controllable resource; Divergence between local and global (system) control objectives or constraints; Time domain discrepancies between control actions and physical system or device
parameters to be controlled.
Furthermore, the grid operating state can have a direct impact on the manifestation of controllerconflict. This is especially the case when the grid is in a stressed state and controller conflictresults in a further deterioration of the grid’s stability.

Project ID: 609687
dd/mm/yyyy Page 80 of118
5.2 General methodology for controller conflict identification in asystem with high penetration of flexibility resources
Interactions between controllers described using a static framework such as the SGAM1 are notsufficient to tease out the extent of the controller conflict and its impact on grid operation. To thisend, a dynamic model of these interactions is necessary. This section describes the methodologyproposed to construct such a dynamic model for the purposes of extracting conflicting interactionsof interest from the point of view frequency and voltage stability. The methodology is depicted inFigure 14, which also represents a logical sequence of dependencies of subtasks within T6.1. Thedifferent stages of this methodology are detailed below.
Figure 14: General methodology for the identification of controller conflicts.
1 However, using the SGAM one can describe on which levels controllers may interact. Using the SGAM toolbox, also dynamic
processes can be modeled. [mbl1]

Project ID: 609687
dd/mm/yyyy Page 81 of118
5.2.1 Mapping between flexibility resources
The capabilities of the flexibility resources form the core of the dynamic interactions which maylead to controller conflict. These capabilities include resource capacity, time response andlimitations during operating conditions. As such, the information collected from T6.1.1 about thedifferent flexibility resources will be used to characterise their behaviour during normal andemergency conditions.
In a conflict situation, a flexibility resource may exhibit a behaviour that is directly influenced byanother controller or indirectly by the influence of a controller action on the network where theflexibility resource is connected. Distinguishing between these two different sources of behaviourstimulations is important in the development of the mapping between different flexibility resourcesin the form of controller interactions. In other words, the nature of interaction between flexibilityresources and associated controllers will determine suitable pairings between these resources inthe context of conflict identification.
At this stage, the linkage between T6.1.2 and T6.1.3 becomes more prominent as boundaries ofcontrol (or control domains), and consequently interactions can be more formally defined asdiscussed in section 4 of this report. Depending on the controls within each boundary, pairs (orgenerally tuples) of interacting controllers can be identified and further analysed for the presence ofconflicts.
5.2.2 Development of representative control sequences
Key to this stage, is the development of detailed use cases for frequency and voltage control thatdefine the dynamics of interactions between the different controllers. For every pairing identified inthe previous stage, a dynamic scenario is created (or instantiated) where the reaction of eachcontroller is examined in response to stimulations by other controllers or system events as definedby the use case scenarios. These stimulations and corresponding reactions are termed as controlsequences. Multiple control sequences can be defined to aid the discovery of controller conflictsthrough a comprehensive means of simulation.
5.2.3 Identification and classification of controller conflict
Although some controller interactions identified in the previous stage may be classed as conflicting,it may be the case that that impact of these interactions on system stability is non-existent ornegligible. Thus it is important to take into account the system state (and associated operatingconstraints) when assessing the need to address identified conflicts. So, conflicting behaviour maybe classed as acceptable or unacceptable (undesirable) for a given operating scenario. And thisclassification may well change over time with changing operating conditions (e.g. level of flexibilitydeployment, network constraints, normal or emergency operational state, etc.).
One clear way to classify controller conflicts is to divide them into conflicts affecting frequencystability and conflicts affecting voltage stability. These two phenomena are usually analysedseparately, since it is different elements of the power system that take part in voltage andfrequency control, however in complex scenarios these two can be interlinked. This would be thecase particularly in the islanded systems where in case of a large power imbalance (due to e.g.generator tripping) both voltage and frequency would start to decay, but since voltage drop affectsvoltage-sensitive loads, the frequency drop would proceed with a slower pace delayingunderfrequency load shedding, thus not allowing for a basic countermeasure to power imbalance.

Project ID: 609687
dd/mm/yyyy Page 82 of118
Conflicts can also be distinguished based on the location and spread of the conflicting agents:
point-to-point conflict is a conflict between two agents, e.g. a single generator and TSO,often resulting from external constraints, market operation or wrong control parameters;
point-to-group conflict affects a group of elements and a single party like DSO, TSO orAggregator;
group-to-group conflict is a conflict between multiple representatives of two or more groupsof agents.
Based on the above classification conflict severity can be assessed and a solution can be easier tofind.
5.3 Impact of controller conflict on frequency stabilityReferring to the IEEE/CIGRE classification [90] frequency stability is one key aspect of overallpower system stability, beside rotor angle stability and voltage stability. Frequency stability refersto the ability of a power system to maintain steady frequency following a severe system upsetresulting in a significant imbalance between generation and load. Frequency stability can bedivided into short term and long term stability. Depending on the process (-es), which is causingthe frequency excursion, time range can vary from fraction of seconds to several minutes until thesystem reaches an unstable state. Instability that may result occurs in the form of sustainedfrequency swings leading to tripping of generating units and/or loads. Severe upsets generallyresult in large excursions of frequency, power flow, voltage, and other system variables, therebyinvoking the actions of processes, controls and protections. In large interconnected systems largefrequency excursions may be also responsible for splitting the grid into islands. Stability in thiscase is a question of whether or not each island will reach a state of operating equilibrium withminimal unintentional loss of load. Generally, frequency stability problems are associated withinadequacies in equipment responses, poor coordination of control and protection equipment, orinsufficient generation reserve.
From the system point of view it is most important to maintain the system in a stable state in termsof frequency stability keeping up the power generation and consumption equilibrium. An examplefor short term frequency instability is the formation of an undergenerated island with insufficientunderfrequency load shedding such that frequency decays rapidly causing blackout of the islandwithin a few seconds [92]. On the other hand, more complex situations in which frequency stabilityis caused by steam turbine overspeed controls [93] or boiler/reactor protection and controls arelonger term phenomena with the time frame of interest ranging from tens of seconds to severalminutes [94], [95], [96].
During frequency excursions, voltage magnitudes may change significantly, especially for islandingconditions with underfrequency load shedding that unloads the system. Voltage magnitudechanges, which may be higher in percentage than frequency changes, affect the load-generationimbalance [90]. Considering this fact, load shedding may make the situation worse because offollowing increased voltage through system unloading.
5.3.1 Identification of conflict scenarios impacting frequency stability
Requirements for modelling frequency instability

Project ID: 609687
dd/mm/yyyy Page 83 of118
In order to properly analyse and model frequency dynamics, it is crucial to have clearly in mind themain equation that rules this kind of dynamic, the equation of motion:
em e systemdT T Jdt
(2)
where J is the combined synchronous inertia of generators and turbines in the power systems, Tm
and Te the sum of accelerating and braking torques of the generators and loads in the systemand e the system electrical speed (or frequency).
The accelerating torques are determined by the prime movers that drive the generators; dependingon the type of prime movers installed in the power plants, dynamic response may vary significantly:it may range from an extremely fast response such as the one in hydro plant, to a very slow onesuch as the one in nuclear power plant. In case of thermal units, the thermal properties of the boileror of the turbines may heavily affect the ramping capability of power plant as in the case of once-through boiler steam power plant or gas fired power plants. The braking torques depends insteadon the amount of power that is consumed in the system. Both values may be fairly known: thebraking torque depends on the system consumption, which can be estimated quite accurately hourby hour, the accelerating torques depend instead on the power plant dispatch of conventionalpower sources while it may get quite unknown for renewables production.
It is important to be aware of the fact that until few years ago, in a power system dominated byconventional resources, Tm was 100% controllable by power plant owners and indirectly by TSOs.Nowadays the share of controllable Tm is progressively missing due to the fact that more oftenpower systems are running with a high share of renewable, such as wind and PV, uncontrollablesources. It is well known the Danish case where already for several hours a year, local windproduction matches the consumption. It has to be mentioned however that the system is still in areasonable controlled state thanks to the presence of strong interconnections to both the Nordicand the Continental systems. Having this in mind, it may be necessary, in a near future, to be ableto replace the source of frequency controllability, which was once heavily provided by theaccelerating part of that equation (Tm), by the braking part of the equation (Te) that means theconsumption. Demand can in principle provide upward and downward frequency regulation eventhough this may go in contrast with users’ needs. On top of that it has to be mentioned that havingfew, big, certain power plants capable of controlling the system frequency is much morestraightforward and secure rather than having to rely on thousands/millions of small units, whosebehavior, even if potentially driven by market movers, may be unpredictable and unreliable.
Another critical parameter which may not be known a priori is the system rotating inertia. Instead ofusing the physical synchronous inertia J (expressed in kg*m2), it is convenient to refer to the perunit equivalent, often called 2H (expressed in seconds) or decay time. 2H is defined by the ratiobetween the kinetic energy (in Ws) and the base power (in VA):
= 0,5 / (3)
Using the per unit system is much more convenient because it allows to compare easily inertia ofdifferent sizes machines. This is due to the fact that for optimal machines designing reason, theamount of iron and copper in the rotor is always proportional to the amount of power the machinecan handle. Generally, in conventional power plants 2H ranges often between 6 and 10 secondsand therefore power system synchronous inertia is simply the weighted average of all the powerplants connected in the system. Increasing presence of synchronous inertia-less sources (such asPV or full converter wind turbines) or extremely low inertia wind turbines (DFIG wind turbines have

Project ID: 609687
dd/mm/yyyy Page 84 of118
actually a fair amount of synchronous inertia, the MPPT control however can track so quickly thepower output of the machine that in practice any potential inertia contribution of the machine isclose to zero) lead therefore to a sensible reduction of rotating masses in the system, threateningtherefore system stability. It has to be mentioned in this case that the demand cannot help in theinertia response as great part of the load is static and even the rotating one (i.e. asynchronousmachines) have smaller synchronous inertia compared to the one provided by power plants, seeTable 16.
In summary, as in all power systems studies, accurate modelling of power systems components,both generators and loads, is essential. With respect to frequency stability studies, what becomescritical is the evaluation of:
1. amount of synchronous rotating masses in the system,
2. droop values of generators and dynamic response of governors,
3. frequency relays threshold for under/over-frequency protection both for generators but also forsubstations.
Table 16: Model components and their importance.
Model component Component’s importance from voltage stability viewpoint
DG inverter f/P-control With large quantities and close proximity of inverter interfacedDG, DG controller and network interactions can give rise tocontroller oscillations and small signal stability issues. Thiscould lead into PLL-oscillation of DG-inverters which causepower-oscillations. [96]
Active power control inVPP vs. ancillary serviceprovision
Activation of ancillary service provision by inverter controller(e.g. voltage control or activation of primary/secondary controlpower) may influence active power provision of DER and thuscause deviation from VPP-schedule. [97]
Active power controllersof large coal-fired powerplants and wind farms
In order to make room for the production of a wind farm,traditional power plants (such as coal/lignite-fired) need to belimited.Wind generation is inherently variable. Increase of windgeneration is usually balanced by shutting down hydro plantsand reducing coal-fired power plants. Possibility of reducinggeneration of steam turbine is limited by permissible technicalminimum. On the other hand, some generators have to stayconnected to the grid to cover demand in case of rapiddecrease of wind generation.
SPSC (special protectionand supplementarycontrol for deloading andantiswing) andAGC (automatic
When one of the lines connecting a power plant to the powersystem is tripped due to e.g. a fault, the SPSC will recalculatethe maximum allowable power for this power plant that assurestransient stability in case of another fault. The new allowablepower value might mean decreasing power order or even

Project ID: 609687
dd/mm/yyyy Page 85 of118
generation control) tripping of one the generators in operation and a result powerlevel ordered by AGC might not be achieved. [98]
MPPT (maximum powerpoint tracking) in windturbines and thecontroller for externalfrequency support
Frequency support in DFIG (double fed induction machine)wind turbines is obtained by temporary shifting the operatingpoint away from MPPT to drain or store more energy from/intothe rotating mass of the turbine’s rotor. This means that MPPTcannot achieve its goal due to frequency support controlleroperation. [98]
Overfrequency relay fromwind turbines
In case of large overfrequency events, it happens thatoverfrequency relay disconnects wind turbines once thefrequency crosses 50.3 Hz. Turbines started gettingreconnected (providing accelerating power to the system) withthe frequency still well above 50 Hz (but close to 50.3 Hz), asfor example happened during the European systemdisturbance of 4 Nov 2006. [99]
Hydro Power Plants -Speed control underislanding conditions orother isolated modes ofoperation is in conflictwith the governorsettings required for fastloading and unloadingunder normalsynchronous operation
For rapid load changes, it is desirable to have a fast governorresponse. However, the governor settings that result in a fastresponse usually cause frequency instability under system-islanding conditions. Unless properly managed in the frequencycontrol system with proper transient compensation tuning. [100]
5%-controller mightcollide with localcontrollers orcontributions to activepower commitments invirtual power plants(VPP)
Load flow-dependent curtailment of a maximum of 5% of theyearly energy feed-in to the grid on a per-generator basis inmaximum load situations. Conflicting set-points from differentcontrollers, overloading of operation equipment. [101]
Possible control conflicts affecting frequency stability
There is a great variety of processes which can lead into frequency instability situations. Frequencyinstability can be divided into short term and long term stability, where instability can be reached ina fraction of a second or after several minutes. Considering the entire European electric powersystem, there is a broad mix of different controllers with different tasks and responsiblestakeholders. Due to this very complex system, it is obvious that there is a great potential forcontroller conflicts as well as conflicts between stakeholders.
Load shedding for controlling under frequency situations may lead to de-loading of certaintransmission lines. Loss of load in transmission lines determines a reduction of inductive

Project ID: 609687
dd/mm/yyyy Page 86 of118
reactive power consumption which leads to voltage increase and possible tripping of unitsdue to overvoltage protections.
Low frequency protection of small distributed generations (typically 49 or 49.5 Hz) maydetermine disconnection of generation units during a low frequency event threatening thefrequency stabilization of the remaining units providing primary frequency control.
Conflicts between technical and market interests are also possible causes for frequencyand congestion problems, due to a favourable market price at times where the system isheavily loaded. Governmental regulations also influence the operation of the power system,because of the fact that renewable energy sources cannot always be controlled by theDSO/TSO in order to satisfy grid constraints.
Possible provision of frequency response from small size units embedded in MV networks(such as small CHP plants) may lead to over-voltages problem at the generator connectionpoint.
Scenarios 2030+ seen from frequency stability perspective
The permanent balance between generation and consumption of electricity is an importantprerequisite for stable and reliable system operation, which transmission system operators (TSOs)are required to maintain. In order to guarantee to consumers a sufficiently reliable electricitysupply, TSOs keep control power available and provide balancing energy to balancing groups(electricity producers and consumers). There is a close cooperation among TSOs and their controlareas that enables the overall amount of control power required to be minimized. Today primarycontrol, secondary control and minutes reserve is procured in an open, transparent and non-discriminatory control power market in accordance with European legislation. A demand for controlenergy arises if the sum of actual generation differs from the actual load. Differences can arisefrom the load side (e.g. meteorological influences, daily load forecast error) as well as from thegeneration side (e.g. power station failures). Procurement is ensured through competitive biddingon a tender basis in control power markets where a large number of suppliers (generators as wellas consumers) participate. Small suppliers can also participate in the call for tenders via pooling.
Future scenarios considered for 2030+ (being scenarios selected by e-Highway 2050 [118] project)differ from the current situation. From the frequency stability perspective there are the followingfactors which may significantly influence the environment for frequency stability:
New portfolio composition and deployment of generation (weather-dependent small scalegeneration)
Increased responsibility of DSOs for provision of grid stabilizing ancillary services,emerging of Aggregators also providing these services
Large numbers of RES and their capability to take over the role of large synchronousgeneration regarding frequency control and frequency stability issues.
Further development and deployment in power system information and communication technology,common use of real-time reliability analyses – especially forecasting – of various aspects of systemoperations and smart grid technologies will further advance the development presented by e-Highway 2050. Table 17 gives an overview of possible scenarios.

Project ID: 609687
dd/mm/yyyy Page 87 of118
Table 17: Scenario impacts on frequency stability.
Future scenario Influence on frequency stability
Small and Local In this scenario there is a large decentralized generation in distributionnetworks of any voltages from HV by MV to LV and reduced largeconventional synchronous generation in the transmission networks(spinning reserve). In this scenario necessary control power is procuredby conventional (thermal) power plants, albeit at a cost: the requiredfrequency stabilizing reserves increase due to a growing number ofuncertain generation that adds to the uncertain demand. Additionally, theoriginators of this increase in frequency deviations do not themselvescontribute to balancing power procurement.
Large fossil fuel withCCS & Nuclear
This scenario is very close to the present model of system operation andfrequency stability issues are similar to the present ones and thus will behandled accordingly.
Big & Market This scenario is similar to the previous one with little difference on theprocurement of frequency stabilizing reserve energy. However, capacity-affecting phenomena due to the market interaction cannot be excluded.
100% RES In this scenario the classical spinning reserve is almost completelysubstituted by RES that are inverter connected and controlled. Asignificant level of decentralized RES and large “new use” componentshas to be coordinated to provide a reliable and stable system operation.In order to avoid frequency instabilities, overcapacities and some forms of(virtual) storages of significant capacities have to be procured.
Large Scale RES &No emissions
This scenario is similar to the “100% RES” scenario. However, large-scale RES offer the potential of higher reliability (through more efficientforecasting) as well as less small-signal stability issues from inverter-to-inverter oscillations. Nuclear provides some means of spinning reserve,which contributes to the overall frequency stability and provides reliablebackup capacities.
The significant difference between the present situation and the situation foreseen for the years2030+ is the growth of new players that are on the one hand responsible for an increase in controlpower procurement (due to their increased stochastics) but at the same being capable of providingfrequency stabilizing ancillary services themselves. Nowadays operational responsibility is carriedexclusively by TSOs using own and Generator’s resources. DSOs play only a minor role infrequency controlling/stabilizing ancillary services.
It is obvious that participation of large numbers of RES in frequency control will be possible onlywhen a proper level of information exchange and coordination between the players is enabled thatallows for reliable forecasting of these (regionally correlated) ensembles. Of course a successful

Project ID: 609687
dd/mm/yyyy Page 88 of118
coordination is again only possible with the development and deployment of appropriate ICTtechnologies in power systems.
Recent R&D projects have shown that possible conflicts affecting frequency stability may occurwhen large numbers of RES provide frequency proportional responses for primary reserve powerdue to lack of proper coordination among inverters controllers that result in PLLs oscillating againsteach other. This phenomenon is not yet sufficiently taken into account in technical rules andrequirements for pooling strategies/aggregation of RES for this purpose. It cannot be excluded thatprocedures, which are correct for normal system operation will fail in extreme (unbalanced) RESgeneration scenarios. In general, scenarios foreseen for frequency control in 2030+ are muchmore complex than seen today, involving a much larger number of actors responsible for stablesystem operation.
For frequency stabilizing balancing reserve, being provided by potentially less reliable RES, furtherprogress in applications of forecasting methods and wider use of probabilistic methods in theprocurement of renewable-based ancillary services are necessary. Novel concepts of frequencycontrol from RES connected to lower voltage distribution networks need verification concerningtheir adequacy with respect to frequency stability, reliability, efficiency and costs in order to answerthe following questions:
Will the frequency stabilizing balancing power provided by decentralized generation and“new use” component be suitable for safe and reliable system operation?
What are the requirements for additional ICT systems for configuring inverter systems toadequately substitute the classical spinning reserve?
These factors play an important role and have to be taken into account when modelling andanalysing the possibility of control conflicts and oscillations impacting frequency stability.
5.3.2 Approaches to quantifying controller conflict impact on frequencystability
Frequency stability simulation and instability detection methods
Frequency stability simulation and instability detection requires dynamic modelling simulation. Inorder to analyse the stability of the system, a set of appropriate differential equations has to bederived according to the dynamic interactions on a given grid, considering both network andinverter electrical models. These dynamic interactions describe the way energy is transmitted andinjected through a power grid. Mathematical descriptions of these two processes are needed toderive a valid model of the system that might be used for stability simulation and instabilitydetection. The dynamics of RES energy injection depends on the control systems of the inverters.Modelling the inverters can either be done in great depth, considering detailed descriptions of thedifferent blocks that it consists of. However, describing each inverter extensively does notnecessarily provide further information on the stability of the system as a whole. This includes thenonlinearities and switching processes present on the power electronics of the inverter, which arerarely detectable beyond the coupling point. Hence, many times simplified differential modelssuffice. Methods based on eigenvalue calculations can be used to identify the damping of multi-oscillator systems to assess their instability. Methods of continuous power flow are also appliedwidely when investigating these kinds of phenomena.

Project ID: 609687
dd/mm/yyyy Page 89 of118
In order to prevent controller conflicts that could lead to frequency instabilities, the specific systemwith its components and controllers must be investigated. This way, the possibly conflictingbehaviour can be simulated and sufficient control strategies and parametrization of the controllerscan be determined. For example controllers of inverters for primary control reserve can implementmore flexible controller dynamics and/or dynamic control strategies. Simulations to evaluate theseconcepts have to incorporate detailed dynamic models of inverters as well as grid connectionsbetween them in order to take into account transient effects that are relevant to frequency stability.To this end, instabilities due to controller conflicts can be readily inferred from the dynamiccontroller interactions incorporated in the stability assessment.
5.4 Impact of controller conflict on voltage stabilityOverview of voltage stability and instability
According to IEEE/CIGRE classification [90] voltage stability is a subset of overall power systemstability. Similarly to angle stability, voltage stability can be divided into large disturbance and smalldisturbance stability as well as into short term and long term stability. Voltage stability refers to theability of the power system to maintain steady and acceptable voltages at all buses in the systemunder normal and disturbed conditions and depends on the ability of the system to supply theactive and reactive load through the operating grid. Voltage instability that may result occurs in theform of a progressive fall or rise of voltages at some buses which in turn may cause loss of load,generation, transmission lines and other power systems elements. Impact of voltage instability maybe local, which is usually the case of short term phenomena or may be a large area or even asystem one, which is mostly the case of long term phenomena. Voltage stability is often associatedwith angle stability – large disturbance, short term voltage instability is usually the result of angleinstability and long term process leading towards voltage instability will, at some point, cause angleinstabilities.
From the system point of view the most important is the ability to maintain long term voltagestability. Major large power system failures in the last decades were the result of problems with thiskind of stability. Processes leading to instability were triggered by steady growing load and/or bytripping important system elements (generation, transmission lines) in particularly stressed systemconditions due to weather or some unplanned system contingencies. The list of 18 largedisturbances and blackouts presented in [92] contains up to 10 which are associated with longterm voltage stability problems.
The process leading to long term voltage instability can last tens of minutes. At the beginning it isslow – depressing voltages on transmission are observed while voltages in distribution networksare within their ranges thanks to transformer tap changer regulation. The process accelerateswhen sources of reactive power in the transmission system, mainly synchronous generators,exhaust their capabilities, which means that they stop controlling voltage. From this point it is closeto the point when voltage may collapse leading to the blackout of a part of the system.
Long term voltage instability is a complicated process which involves many system componentsand controls as well as interactions among them. It is spanned from EHV transmission to lowvoltage distribution. It usually affects stressed and highly loaded systems both with respect toactive and reactive power. In many cases a human factor involving lack of inadequate dispatchers’counteraction fostered developing of voltage instability. As an area affected by voltage problems

Project ID: 609687
dd/mm/yyyy Page 90 of118
may involve many decision-making centres (TSOs, DSOs, power plants dispatching) the propercounteraction may be hindered or impossible due to inadequate coordination between the parties.
5.4.1 Identification of conflict scenarios impacting voltage stability
Requirements for modelling voltage instability
Identification of conflict scenarios impacting voltage stability, especially long term voltage stability,requires accurate modelling of power system components. Proper reproduction of static anddynamic behaviours of loads presents major difficulties in modelling. Loads have an impact also onother form of stabilities but for voltage stability, especially long term, their impact seems to be morecritical. In addition, load modelling unlike other power system components is not standardized.Modelling of other system components is also more demanding due to significance of variouslimitations which may become prevalent after the power system has entered stressed conditions.For instance, voltage controllers of synchronous machines in a large area have to be modelledtogether with the limiters (field current, generator current, under excitation), which is not usuallyrequired in other kind of studies.
Below, power system components playing an important role in long term voltage instabilitydevelopment are listed and briefly characterized in the voltage stability context, see Table 18.
Table 18: Component’s importance from voltage stability viewpoint.
Modelcomponent Component’s importance from voltage stability viewpoint
Loads A basic load feature for voltage stability is its mainly positive voltagedependence which means that increasing voltage causes increase of load.Among loads particularly important are induction motors which begin toconsume more reactive power below some voltage level and if notdisconnected can stall, which means large reactive power consumption.Commonly used capacitor compensation of induction motors furtheraggravates reactive power imbalance at low voltages. Thermostaticallycontrolled loads which at low voltage are switched on for a longer time toachieve required amount of energy play also significant role in developingvoltage stability threats. Special attention must be given to plant houseloadswhich consist mainly from induction motors, because their disconnection dueto undervoltage usually means power unit tripping.
Transformers withautomaticallycontrolledtap changer
Transformer regulation tries to maintain distribution grid voltages within theirnormal operational range at the cost of lowering voltages in the transmissionnetwork. Taking into account positive voltage dependence of loads it meansthat power consumption in the distribution is restored at the cost of constantlyworsening conditions in the transmission system. Blocking of tap changerregulation is a recognized countermeasure against voltage instability.
Transmission lines
Lightly loaded transmission lines produce reactive power. When the loading ishigh transmission lines start to consume reactive power and the consumptionincreases with the square of the line current. In highly stressed conditions a

Project ID: 609687
dd/mm/yyyy Page 91 of118
possibility of transmission line disconnection due to overcurrent conditionsincreases. Line disconnection worsens conditions for operating lines and maygive rise to cascading of further disconnections.
Largegeneratorsand theircontrols
Nowadays large synchronous generators are critical for maintaining voltagestability due to their capability of fast provision of large reactive power to thetransmission network. Low voltage at generator terminals and high turbinepower which are typical when voltage stability is in danger significantly limitavailable reactive power capabilities of the generator. Large generators areequipped with automatic field current limiters. When a field current limiter isactivated the generator stops regulating voltage. A similar situation applies tothe generator armature current limiters. A generator without voltage regulationwill be tripped if voltages will continue to decline. Generator tripping meansloss of active and reactive powers which have now to be provided by othergenerators. This means that these generators will be more stressed and thusmore prone to eventual tripping, in other words – cascading of generatordisconnections may take place.
Reactive power capabilities of synchronous generator are larger if its step-uptransformer has tap changer control maintaining generator voltage close to itsnominal value.
Synchronouscondensers
Synchronous condensers have better characteristics than synchronousgenerators , which are commonly installed nowadays in systems with largerenewable generation. As the synchronous condenser does not produceactive power its reactive power capabilities can be respectively larger andlimited mainly by a field current limiter which is not so sensitive to decreasingvoltage as a generator current limiter.
Shuntcapacitorbanks
Shunt capacitor banks are commonly used in transmission and distributionsystems for voltage regulation purposes. Due to a capacitive reactive powerdecrease with square of voltage their efficiency is reduced when it is mostneeded. Active shunt devices like SVC and STATCOM also lose theircapabilities for reactive power generation when operating in low voltageconditions. Especially SVC being on its capacitive power generation limitstarts to behave like a shunt capacitor.
LCC HVDC LCC HVDC terminals usually are compensated by shunt capacitors andcapacitance present in AC filters. As it was said earlier reactive powergeneration by capacitor shunts decreasing in square of voltage createsproblems at low voltages. Besides, some modes of converter operation (e.g.constant gamma control in inverter) are associated with an increase ofreactive power consumption at low voltages. Also, of special importance is thepower/voltage instability phenomena, which may occur in low short circuitratio conditions when HVDC link is operated in constant power mode.Increasing power order causes a rise in DC current which results in adecrease of voltage and thus the DC power starts to decrease and thephenomena aggravates.
VSC VSC converters are a fundamental component of STATCOM and VSC-based

Project ID: 609687
dd/mm/yyyy Page 92 of118
converters HVDC links. They provide high controllability of reactive power and voltage,limited by the actual AC voltage and maximum DC voltage. With a decreaseof AC voltage, maximum Q capability also diminishes.
Concentrated windgeneration
According to national grid codes medium and large wind farms consisting ofturbines equipped with inverters usually should have significant capability ofvoltage and reactive power control at the point of connection. That capabilitymay be used at low voltages assuming that the wind turbines are in operation.Activation of wind farm capabilities requires coordination among operators, forinstance regulation of tap changers in transformers supplying distribution gridshould be blocked or limited allowing for voltage decreasing in the distributionnetwork.
Certainly, areas with large wind generation are less prone for voltageinstability. Negative impact of large wind generation on voltage stability maybe seen in other parts of the system due to transmission of bulk power andreduction of large synchronous generation.
Dispersedwind andsolargeneration
Local power generation provide immunity against voltage instability. Sourcesprovided with inverters and able to operate with capacitive reactive power canhave additional positive impact assuming that their capabilities will be used inemergency situation.
Protectiverelaysystems
According to [92] at low voltage conditions there is a possibility ofmaloperation of distance relays (3-rd zone) and overcurrent protections. Themal operations can result in line tripping which deteriorates the situation in ahighly loaded voltage depressed system.
Undervoltage loadshedding
This protection is not commonly used contrary to underfrequency loadshedding. If applied, it is an efficient countermeasure against voltageinstability assuming that voltage in the distribution network is allowed to beproperly decreased.
AutomaticGenerationControl
When voltage stability is in danger, there is always a need for more reactivepower but very often also for more active power. AGC trying to increaseactive power of generating unit may limit significantly its reactive powergeneration capability.
Secondaryvoltageregulation
Secondary voltage regulation uses generator’s AVR (and transformer’s tapchanger regulation if available) to control voltage at selected high voltagebuses in the transmission network instead of generator terminals. In case ofvoltage stability problems the regulated bus is then closer to the area ofeventual low voltages. It means that a generator involved in secondaryvoltage regulation will provide more reactive power than the same generatorcontrolling its terminal voltage. This is certainly positive. Similar effect canhave using voltage control with current compensation which is applied insome systems.

Project ID: 609687
dd/mm/yyyy Page 93 of118
Possible control conflicts affecting voltage stability
A long term process leading to voltage instability has varying speeds and involves many systemcomponents and equipment in a large area. In such an environment conflicts among controls arevery probable. Based on the classification established in section 5.2.3 a few examples are quoted:
An point-to-point or point-to-group example of control conflict is a possible interactionbetween AGC trying to increase the active power of a generator (the action is very likelybecause voltage instability is usually related to a growing load) when the generator currentis close to its limit due to the generator’s large reactive power. Consequently the currentlimiter can be activated and the generator will lose its voltage control capability. Loss ofgenerator voltage controls is a major step towards voltage instability. To avoid the problemthe unit should be disconnected from AGC or even allowed to decrease its active power.
An group-to-group example of conflict among wide area controls can be automaticoperation of tap changers in transformers supplying distribution grids which try to keepproper voltage level in the distribution grid and succeed in this task at a cost of decreasingvoltages in the transmission network. In case of voltage instability risk this will hamperactivation of reactive power reserves available in the distribution grid (the voltage levelstays almost normal) and will not allow for possible undervoltage load shedding.
Another example from this group is a poorly designed secondary voltage control intransmission, which will lead to exhausting reactive reserves in some generators or plantswhile not properly exploiting other generators or plants.
Possible conflicts may also originate from a human factor, for instance dispatching center avoidingdisconnection of loads due to some market prerequisites, which in result may lead to a wide andlarge blackout.
Scenarios 2030+ seen from voltage stability perspective
Currently in most cases TSOs and transmission networks play a dominant role in the voltage andreactive power control. Using capabilities of large synchronous generators, capacitor batteries,shunt reactors and other equipment operating in the transmission the TSO creates conditions formaintaining correct voltages in all distribution network levels. This is realized by transformers withtap changers regulating their lower voltage thanks to access to fast and flexible reserves ofreactive power in the transmission systems.
Future scenarios considered for 2030+ (being scenarios selected by e-Highway 2050 project) differfrom the current situation. From the voltage stability perspective there are the following factorswhich may significantly influence the environment for voltage stability, see Table 19:
New, different from currently prevailing, portfolio and deployment of generation Bulk power AC and DC transfers for large distances Increased responsibility of DSOs for provision of ancillary services, emergence of
aggregators also providing these services Growing role of market Large centralized RES and their capability to take over the role of large synchronous
generation regarding voltage control and voltage stability issues. Further development and deployment in power systems information and communication
technology, common use of real time security analyses of various aspects of systemoperations and smart grid technologies.

Project ID: 609687
dd/mm/yyyy Page 94 of118
Table 19: Scenario impacts on voltage stability.
Future scenario Influence on voltage stability
Small andLocal
In this scenario there is a large amount of decentralized generation indistribution networks of any voltages from HV by MV to LV and reduced largeconventional synchronous generation in the transmission. In this scenario adistribution network cannot count on reactive support from the transmission.Moreover in some conditions it will have to provide reactive support neededfor safe transmission system operation through transformers connecting bothnetworks. It means that distribution grid must have a sophisticated voltagecontrol system including presumably secondary and maybe even tertiaryvoltage control.
Large fossilfuel withCCS & Nuclear
The scenario seems to be close to the present model of system operation andvoltage stability issues will be likely similar to the present ones. The “new use”component present in the scenario will enable substantial degree of voltagecontrol in MV and LV distribution grids so in general immunity against voltageproblems should improve.
Big & Market
The scenario is similar to the previous one but with some significantdifferences for voltage stability –bigger bulk power transmissions for largedistances, less large conventional power plants, more centralized RES andcentralized storage. Big power AC flows and less large synchronousgeneration can create problems for voltage stability. Centralized RES andstorage will in turn have positive impact on the voltage stability because it canbe assumed that the adequate equipment will have equivalent or bettervoltage control characteristics than a synchronous generator in a fossil fuelplant.
100% RES
In this scenario conventional synchronous generation is even more limitedthan in the “Big & Market” scenario in favour of the centralized anddecentralized RES and the centralized storage. Such model of generationinvolves large power transmissions for long distances which if realized by ACmay create voltage stability problems. A significant level of decentralized RESand large “new use” components forms possibility for distribution networks tosupport operation of the transmission network.
Large ScaleRES & Noemissions
From voltage stability issues this scenario is similar to the “100% RES”scenario – there are large power exchanges but lesser amount ofdecentralized and centralized RES which are replaced by nuclear generation.The nuclear generation is less elastic than fossil fuel generation which meansworse reactive power generation capabilities. In this respect nuclear unitsmay be in practice worse than centralized RES. Positive aspect of nucleargeneration is that due to safety reasons new plants are accompanied by largenetwork investments.
The significant difference between the current situation and the situation foreseen for the years2030+ is the appearance of new players in the field of voltage control and reactive powermanagement. Currently, they are almost exclusively TSOs using own and Generator’s resources.

Project ID: 609687
dd/mm/yyyy Page 95 of118
DSOs play a much more modest role in this activity, ancillary services aggregators are not presentyet, moreover voltage and reactive power control are not usually treated as remunerated services.It is obvious that participation of a higher number of players in the field will be effective only thenwhen a proper level of coordination between the players is ensured. Of course a successfulcoordination is impossible without development and deployment in power systems information andcommunication technology. In such scenery it seems quite certain, that possible conflicts affectingvoltage stability may occur mainly due to lack of proper coordination among players in the systemvoltage control and reactive power reserves management which are TSOs, DSOs, Generators andAggregators. Their fields of operation coincide in many points and that usually creates chance ofconflict occurrence. It must be remembered that long term voltage stability is treated almostexclusively in low probable states of system operation which are usually out of range of standardsecurity analyses. It is likely that procedures which are suitable for normal system operation will failin emergency situations.
Conflicts similar to the described earlier for the present power systems will probably also occur inthe future. AGC operation may negatively influence reactive power capabilities of generators.Erroneous settings for tap ratio automatic control can disable activation of reactive powercapabilities of distribution networks, etc.
Generally, the operational landscape foreseen for voltage and reactive power control in 2030+ ismuch more complicated than it is presently. It results basically from changes in load andgeneration but also from increased number of responsible players and an increased emphasis onproper coordination of their activities as well as increased role of information and communicationtechnology.
In the new foreseen power system scenarios, demand and supply regarding reactive power andvoltage control will be more variable and will include much more uncertainty. Effective and safesystem operation, also regarding voltage control and stability issues, will require further progress inapplications of forecasting methods and wider use of probability methods. Besides, new conceptsof voltage regulation which assume use of reactive power sources at all voltage levels needverification of their adequacy with respect to system voltage safety, efficiency and costs in order toanswer the following questions:
Will the reactive power sources provided by decentralized generation and “new use”components be sufficient for safe and effective system operation?
Will there be a need for additional network support in the form of voltage and reactivepower controlling equipment like SVC or STATCOM?
It is obvious that these factors cannot be ignored in modelling and analysing possibility ofoccurrence of control conflicts impacting voltage stability.
5.4.2 Approaches to quantifying controller conflict impact on voltage stability
Voltage stability simulation and instability detection methods
The process leading to long term instability, slow at the beginning, accelerates when the system isbeing more stressed and approaches the point of instability, which may involve equipment outagesdue to low voltage conditions and overloads. It means that model should represent both slow andfast dynamic phenomena. For the slow part of process, sequence of steady states achieved bypower flow solutions can be a useful tool to model degradation of voltages and a growing system

Project ID: 609687
dd/mm/yyyy Page 96 of118
stress. For fast phenomena dynamic simulation is necessary. It should be noticed however thatstatic methods give better insight into the nature of voltage stability and are better suited for use ineveryday operator practice for evaluating voltage stability margins. The static analysis is generallybased on power flow methods and may include for instance calculation of P-V and Q-V curves.There are also methods based on eigenvalue calculations of power flow Jacobian which are usedto identify the buses most threatened with instability, methods of continuous power flow whichenable accurate calculation of instability points and methods based on bifurcation theory used tostudy phenomena close to the point of voltage collapse.

Project ID: 609687
dd/mm/yyyy Page 97 of118
6 Experiences in controller development, implementation anddeployment in demonstration and field test projects
6.1 IntroductionThe following section provides an overview of experiences from the ELECTRA partners regardingthe realization of controllers in demonstration and field test projects. It summarizes best practicesand lessons learned which will provide valuable input for the implementation of control concepts inWP6 and their testing and validation in WP7.
A controller to be implemented and operated in the real power grid has to fulfil specialrequirements concerning reliability, fault tolerance and robustness. These requirements are usuallydefined in a requirement specification (incl. hard- and software issues, functional and not non-functional requirements). This section focuses on design, implementation and validation/testingmethods for digital controllers.
The fulfilment of requirements can be easily proven in test cases (incl. simulation and laboratorybased). Therefore it is logical to develop a validation environment that enables the operation of thedeveloped controller as it is intended to be operated in the field. The following sections describesuch a process from the first conceptual phases through to the final release version until themoment the grid operator allows an unattended operation of the controller, see Fig 15.
Figure 15: Design, implementation and validation process for Smart Grid systems andapplications (simplified view), [110].
6.2 Control algorithm definition and prototypingIn the first step a detailed problem description needs to be defined and ideas of possible solutionsfor the problems have to be collected, which have to be shaped to one or more prototypes of thecontroller algorithm.

Project ID: 609687
dd/mm/yyyy Page 98 of118
It makes sense to create a prototyping environment, because usually the implementation for aspecific target environment requires significant engineering effort, and the process of testing andgaining experiences is much easier and effective in an environment of reduced complexity. Ofcourse this goes along with a reduction in accuracy, so it has to be clearly decided whichcomponents of the environment have to be modelled in which accuracy.
To prove the concept(s), models have to be developed so that the decision can be made if it isworth implementing the controller on a specific target environment, or if the algorithm has to berevised.
6.2.1 Development/collection of environment/plant model
For power grid controller usually the network model is one of the most essential ones. If thenetwork topology has an impact on the control algorithm and strategy, all relevant switching stateshave to be considered in the network models.
Special attention has to be paid for every component which will be controlled. The models for thecontrollable components have to be accurate in an early stage of the development process toavoid problems arising in later stages. Relevant are not just component characteristics, but alsotiming parameters (i.e., non-functional requirements).
Also power/energy profiles of the grid loads and (distributed) generations are necessary.Depending on the function of the controller, it might be necessary to consider power/energyprofiles over a specific timespan (typically one year) to consider load/generation conditionstypically occurring in the grid. A compromise between accuracy and simulation performance isneeded. While for MV grids a time resolution of 10 min is accurate enough, the power flow in LVgrids fluctuates significantly, therefore a time resolution of 1 min is preferable. Furthermore, MVsimulations can be performed with symmetrical power flow, while LV simulations have to beperformed unsymmetrical (4-wire model) at any rate.
Since a one-year-simulation of an LV grid on a time step of one minute could lead to impracticalsimulation times, some typical days should be chosen for LV grid controller developments. Thesedays can be any combination of summer and winter days, of weekdays and work days,Friday/Saturday and Sunday/holiday, and of good, average and bad weather for simulations withPV. This would reduce in such an example the number of simulated days to 18 (i.e., 2 seasons * 3weekdays * 3 weather conditions).
In practice, probably power/energy profiles will not be available for every load in the grid. If themodels are estimated, a proper estimation target might be that the transformer power flow arisingfrom the estimated load profiles matches a measured power profile in active and reactive power.The creation of realistic power profiles should not be underestimated, especially when realisticpower profiles are relevant for a statement about controller efficiency. Any specific information thatis available from the grid loads has to be incorporated into the profiles. Due to the introduction ofsmart meters in Europe, it can be expected to have more detailed and accurate information aboutthe actual load behaviour available in the future.
6.2.2 Development of controller model
If the plant model is finished, the first draft(s) of the model of the controller can be applied to it insimulations. In an iterative process the controller algorithm can be adapted to optimize the

Project ID: 609687
dd/mm/yyyy Page 99 of118
controller behaviour or the control effectiveness. More accurate and detailed models typically leadto better control behaviour (in respect to accuracy, performance as well as the fulfilment of therequirements). At this stage, the chosen modelling language used for the development andmodelling of the control algorithm is a secondary issue. The design of the control strategy(s) andcorresponding algorithm(s) is of more importance. The used design and modelling languageshould therefore support fast prototyping with easy and comfortable debugging functionality.
Finally, a functional specification of the controller has to be created with the first simulation results.
6.2.3 Concept testing and validation
At the end of the prototyping phase, the detailed concept for validating the control behaviour has tobe defined. If applicable, a reference scenario has to be defined (scenario without controller),which will be compared to the scenario where the controller is active. In simulation, the same gridcondition can be repeated arbitrarily and applied to different control strategies. Therefore, theimpact of the developed control strategy(s) can be easily presented by comparing them with thereference scenario, if applicable.
In the field trial, only one scenario can be operated at a time, and situations cannot be repeated.Therefore it is necessary to define a strategy to elicit the impact of the introduced controller.
One possibility is to operate in reference scenario, and switch on the controller and evaluate theimpact of the control actions by analysing the measurements from the field. This is easy tomanage, but it is only one snapshot of many possible situations. It gives no reliable informationabout the long term impact of the controller. Furthermore, it does not demonstrate the long termreliability of the controller and does not show how the controller reacts in exceptional situations.
Therefore it makes sense to define a schedule that defines periodical switching between thescenarios. For example, a daily cycle of the control operation over a time period of one year maygive reliable information about the real impact of the controller on the grid. In this time period,probably many of the typical exceptional situations that can occur in the grid may occur. With theseexperiences the controller matures and the operational risk is minimized.
The execution of the field test phase and the concept of the validation process have to bediscussed at a very early stage, because it is likely that within this discussion new requirements forthe controller arise. These new requirements can be implemented very easily if they areconsidered early, but it will be probably much more costly and engineering effort intensive to retrofitnew functionality into the existing controller framework.
6.3 Controller development and implementationWhen the requirements of the controller are fixed, the algorithm of the prototype can be migratedinto the target environment. While this migration of the algorithm is a simple translation processfrom the prototype language into the target language, the software environment that is requiredaround the algorithm must not be underestimated. The target environment has to focus much moreon robustness, safety and the behaviour in exceptional situations as well as on flexibility. Thecontroller must be customizable and easily configurable, perhaps provide some user interface,some status information and some logging features. The use cases for the network operator haveto be defined, so that it is clear which tasks (configuration, maintenance, etc.) the network operatorwill perform on its own, and which tasks will be done by the manufacturer / developer / solution
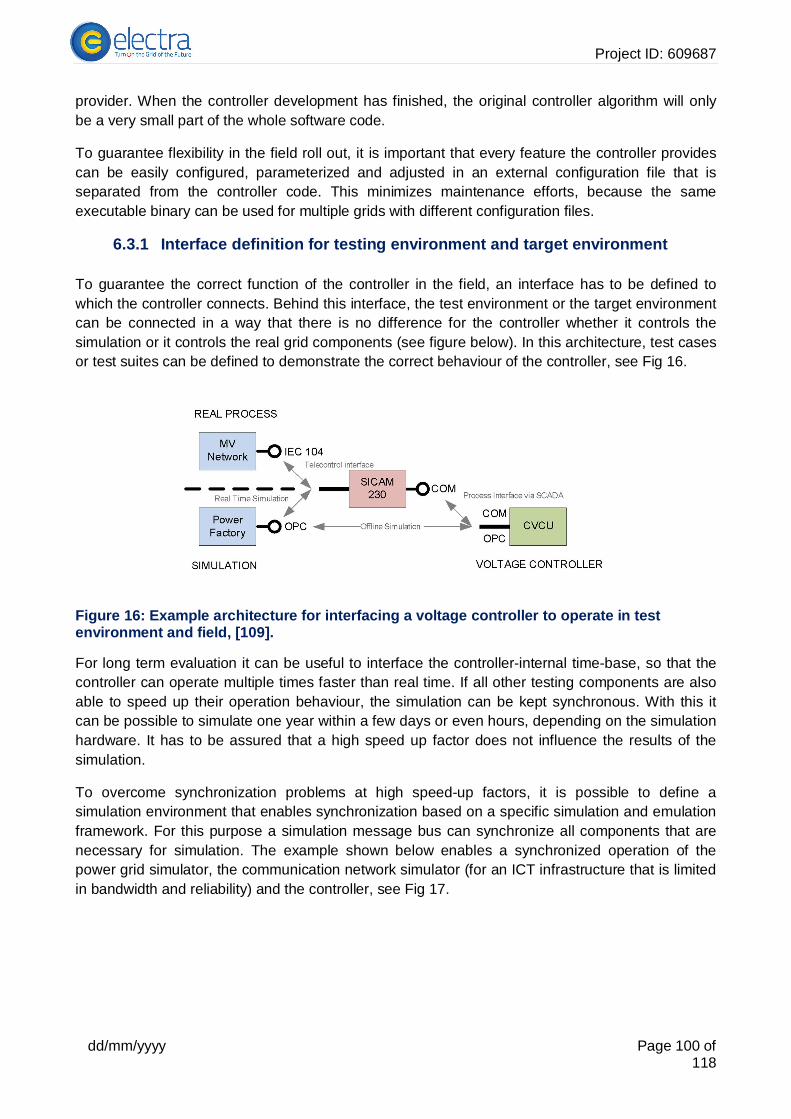
Project ID: 609687
dd/mm/yyyy Page 100 of118
provider. When the controller development has finished, the original controller algorithm will onlybe a very small part of the whole software code.
To guarantee flexibility in the field roll out, it is important that every feature the controller providescan be easily configured, parameterized and adjusted in an external configuration file that isseparated from the controller code. This minimizes maintenance efforts, because the sameexecutable binary can be used for multiple grids with different configuration files.
6.3.1 Interface definition for testing environment and target environment
To guarantee the correct function of the controller in the field, an interface has to be defined towhich the controller connects. Behind this interface, the test environment or the target environmentcan be connected in a way that there is no difference for the controller whether it controls thesimulation or it controls the real grid components (see figure below). In this architecture, test casesor test suites can be defined to demonstrate the correct behaviour of the controller, see Fig 16.
Figure 16: Example architecture for interfacing a voltage controller to operate in testenvironment and field, [109].
For long term evaluation it can be useful to interface the controller-internal time-base, so that thecontroller can operate multiple times faster than real time. If all other testing components are alsoable to speed up their operation behaviour, the simulation can be kept synchronous. With this itcan be possible to simulate one year within a few days or even hours, depending on the simulationhardware. It has to be assured that a high speed up factor does not influence the results of thesimulation.
To overcome synchronization problems at high speed-up factors, it is possible to define asimulation environment that enables synchronization based on a specific simulation and emulationframework. For this purpose a simulation message bus can synchronize all components that arenecessary for simulation. The example shown below enables a synchronized operation of thepower grid simulator, the communication network simulator (for an ICT infrastructure that is limitedin bandwidth and reliability) and the controller, see Fig 17.

Project ID: 609687
dd/mm/yyyy Page 101 of118
Figure 17: Example architecture for synchronizing several components in a co-simulation environment, [110].
6.3.2 Development of validation scenarios and test cases
Based on the interface presented above, test cases can be defined: at a defined input (through thisinterface), a defined output has to be produced by the controller (assuming the controller behaviouris deterministic). These tests are called component interface tests or in this case system tests(black box tests), since the whole functionality is tested through the interface.
Ideally, the test cases should be written prior to the code implementation phase. The definition oftest cases is often deferred, because it is a laborious task with no variety and little results. But infact at the end of the development phase they become very important, and the earlier they areready, the more time can be saved. Even with very good functional specifications, when it comesto the field test phase there will be some small changes necessary in the code, and then it is veryimportant that there is an extensive testing framework available that assures the control function ofall components after a change in the code.
In practice, writing system tests in a scientific project can also be disadvantageous. If there aresevere changes in controller functionality or in the interface definition necessary (due tounexpected findings), it can happen that all system test cases have to be adapted as well. Thesame is for new requirements that turn out to be important at a late stage of the developmentprocess.
Therefore it is also a possibility to write some component tests for smaller components of thecontroller framework. This can reduce the number of system tests. If there are severe changes inthe code, less system tests have to be adapted, and probably many component tests do not needan update.
6.3.3 Controller development
During the controller development process, the test cases give information about the state of theimplementation progress. The less test cases that fail, the more mature the software is. Of course,for software development a revision control software (e.g., subversion, mercurial) should be used.Also an issue and bug tracking system can be useful if more than two people work on the code.

Project ID: 609687
dd/mm/yyyy Page 102 of118
6.3.4 Controller-Hardware-in-the-Loop testing (CHIL)
If the controller development is finished, the tests can be done with the controller operated on thereal field test hardware. This is necessary if the field test hardware is limited in CPU performance,memory, or any other I/O. It is also required if the target executable needs to be compiled for aspecific operating system platform (microcontroller, Linux, etc.). Therefore power grid (and ifnecessary the communication flow) is simulated in the test environment, and the controller isconnected to this testing environment (via TCP/IP for example), see Fig 18.
Figure 18: Example configuration for Controller Hardware in the Loop: Coordinated Simulation of power grid,communication, with the controller operated at the field target hardware, [110].
6.4 Controller deploymentOnce all tests succeed, the controller is ready for deployment in the field environment. In practice,some early stable releases of the controller will be started in the field with suppressed controlleroutputs. This helps to get first experiences of field measurement handling – which can besignificantly different than the received measurements from simulations, depending on theaccuracy of the models.
6.4.1 Open and closed loop operation
It is useful to implement an “open loop” functionality that detains the controller output, so that it canbe manually reviewed and individually decided to be released to the grid. The “open loop” modewill be a meaningful feature for the demonstration of the controller behaviour as long as thecontroller has no functionality implemented that observes the conversion of the sent set values. Inthis case the open loop will influence the behaviour of the controller, because the controller mightreact in a different way and consider some controllable components as unavailable when controlleroutput is not sent to the grid.

Project ID: 609687
dd/mm/yyyy Page 103 of118
Depending of the complexity of the controller and the perception of the system operator, the openloop will be operated for a few days up to several weeks. When the controller works satisfactorily,the open loop will be switched to closed loop.
6.4.2 Acceptance test
An acceptance test, where the controller operation will be presented to the system operator, is agood method to get the system operator’s confidence. During the acceptance test, the systemoperator can make suggestions for which situations and what kind of control actions should bedemonstrated.
Especially when deploying a controller in MV grids, where many thousands of customers areconnected, it may be the case that the system operator is cautious concerning the new solution,and they might have high requirements concerning safety features. A successful acceptance test isnecessary but maybe not sufficient for a start of unattended operation. To get a confidingrelationship to the system operator, a competent appearance during the project is indispensable.
6.4.3 Start of unattended operation
It is absolutely necessary that the system operator gets a confiding relationship to the solution.Otherwise he will reject the solution. When it comes to unattended operation, the solution shouldbe tested sufficiently so that faulty control reactions can be excluded as good as possible. Inpractice it will nevertheless happen that something will go wrong, probably some minor issueswithout having a significant impact on grid supply. Once the system operator gains sufficientconfidence in the solution, some minor issues may be accepted.
6.5 Validation of the developed control concept in field testFinally, at the start of the unattended operation, the procedure of periodic transmission ofmeasurements and logging information must be clarified. At the beginning, a daily datatransmission and analysis of the log-files is necessary. Later this can be performed less frequently(e.g. weekly), and finally if the system is mature, a monthly review of deployed controllerperformance might be suitable.
6.5.1 Analysis of measurement data
It is absolutely necessary that a very user friendly and efficient tool for visualizing and analysingthe log-files is built in parallel to the controller deployment in the field. Once the controller isreleased, there is no possibility for further debugging nor access to the controller’s user interface orconfiguration file. Then it is very important to have a good visualization of what was going on in thegrid.
Although many processes can be automated for analysis of measurement data, it is likely thatthere are some processes that can be checked only manually, since automated data analysis maybe error prone. In this case, it is useful to have a visualization tool that can handle a large amountof data logged over a long period of time with sufficiently high resolution..

Project ID: 609687
dd/mm/yyyy Page 104 of118
6.6 Experiences and lessons learned from demonstration and field testprojects
The following sections list some important points for the development of a controller for powersystems.
6.6.1 Experiences, best practices and lessons learned
The following points briefly summarize important issues which have been discovered duringseveral demo projects:
The control algorithm is only the “core” of the controller, which is a very small part of thewhole code. Requirements like configurability, user interface, measurement pre- and post-processing, robustness and handling of exceptional situations will form the bigger part ofthe software.
It is good practice to analyse the way the nature and the quality of measurement valuesthat will be transmitted to the controller in the real asset in an early stage of the project. Theearlier the following questions can be answered, the better the rollout will work:
o If the measurement values come from the grid transmitted over telecontrol: How oldare time measurement values that are received? Are there significant delays thatcould affect the controller operation?
o Are the received measurements passably synchronous, or are there someheterogeneous transmission latencies?
o How is the behaviour of each measurement value concerning update rate andaveraging period?
o How long does the controller need to wait until the set values are realized by thecontrollable components?
The retrofitting of existing and older grid assets to realise controllability in a new way (forexample retrofitting of reactive power control of DG) is time consuming, costly, and doesnot lead to satisfying results. In contrast, installation of new assets that fulfil the new controlrequirements leads to good results without much effort.
Depending on the complexity of the controller, during the first time of field test roll out, therewill be several issues that need a lot of interaction between controller developers,technology providers and network operators. This phase is very time consuming for allproject partners. Even if significant effort is invested into the modelling and testing of thesystem, this will not prevent a lot of engineering effort when all components are integratedfor the first time in the real grid.
6.6.2 Important points for the ELECTRA developments
In the context of the ELECTRA project and the corresponding controller developments in WP6 aswell as the testing/validation in WP7 especially the following points should be taken into account:
Clearly defined use cases are important for the development of the control strategy and thecontrol algorithm,
Clearly defined functional and non-functional requirements as well as correspondinginterface definitions are essential for a stable and secure operation of the controller,

Project ID: 609687
dd/mm/yyyy Page 105 of118
Clearly defined test/validation cases are important to test and validate the developedcontrol strategies/algorithms as well as the developed controller software,
Usage of reversion control software helps to get overview of the controller softwaredevelopment, helps to track different version of the software development and helps towork together in a team of different developers,
Usage of source code documentation (incl. corresponding tool) should help to documentthe developed code,
Usage of issues and bug tracking software should support the development process, Usage of coding rules for a unified coding style, and Usage of a software development methodology should help to get a better software quality.

Project ID: 609687
dd/mm/yyyy Page 106 of118
7 Conclusions
The different type of flexibility resources, their characteristics, affecting market mechanisms andpotential for aggregation were researched using the survey among project partners. In all, 12partners among WP6 answered to this enquiry. The parameters used to characterise flexibilityinclude the amount of power modulation, the duration, the rate of change, the response time, thelocation, availability, controllability, etc. Views were also received how these parameters willdevelop until 2030 and what are the general trends for development of amount and controllability ofthis resource types. The parameters characterising different flexibility resources provide thetechnical requirements for applicability of these resources for flexible operation of the grid and theirsuitability for frequency and voltage control in the future.
Regarding the flexibility of electricity generation, gas turbines and reciprocating engines can bestarted quickest. The speed of power change is clearly the highest for motors and their minimumpower is low. Also steam and combined power plants can be utilised in the relatively quickincreasing of the electricity production if they are already running and operating under the nominalpower production. Slower power changes are possible also with nuclear power but they cannot becarried out continuously. The regulation characteristics of hydro power are superb in comparison tothe other electricity generation methods. Hydro power assorts best for the regulation purpose,particularly for the high-speed regulation. Hydro power is the most profitable alternative in thehourly control level and quicker regulation. Power plants have remote communication and controlavailability. The technical control characteristics of the combustion motor power plants areinsurmountable in comparison to the other thermal power plants.
The controllability of the nuclear power plants is also taken in the account in the development ofnew reactors, and also the World Nuclear Association (WNA) has given new recommendations forcontrollability of new power plants. Concerning the future trends the nuclear capacity will be indeployed to base load operation and from the control point of view the main priority is the downregulation.
Wind power besides the sun power is increasing most quickly in the world in the coming years. Themodern wind power plants are able to active and reactive power control. In addition of downwardcontrol also the upward control is possible to a certain extent, if the wind generation is firstcurtailed. Upward regulation requires stable wind conditions. The second option for upwardregulation is to exploit momentarily the energy stored in the rotational inertia of the rotor. By thisway the wind power plants can momentarily support the system frequency. PV plants are availablefor voltage control so far but also frequency control is possible in the future. Voltage control isnormally implemented locally by reactive and active power droop control. Availability for outputpower and power factor control is continuous, but depends on solar radiation. PV arrays aresubject to high changes depending on weather conditions. Therefore, these require balancingpower what affects balancing power market and to some extent electricity markets. PV plants havepotential for aggregation to virtual power plants and participation in markets as for examplebalancing markets. Concerning the future trends, PV capacity will increase significantly and thisenables the participation in the frequency and voltage regulation especially for plants connected tomedium voltage level.

Project ID: 609687
dd/mm/yyyy Page 107 of118
Processes where the electricity consumption can be modulated are suitable for demand responsein industry. Industrial loads are normally connected to MV, HV or EHV. They are available forbalancing, voltage control at feeder level and frequency support functions. Frequency controlschemes can be local and also centralized. Power controllability for upwards regulation dependsstrongly on the load conditions, but is typically limited. Downwards regulation is more suitable forfixed load power agreements. The control is subject to constraints. EV batteries can be utilized tobalance power fluctuations caused by the high penetration of intermittent renewable energysources in the transmission system level. In the low voltage network, they are available for primaryfrequency control. The frequency control scheme used is local EV battery discharge ordisconnection of EV during low system frequency events. Concerning power controllability theupwards regulation is limited to 100% of stored energy. Various household appliances canparticipate in demand response in LV network if the device is scheduled for operation with a duetime and for example, the device has a fixed load profile like dishwashers, washing machines,tumble dryers, fridges etc. Their typical sizes are from 100 W to 5 kW. Household devices can beaggregated for voltage control at feeder level and also frequency support. An activation of controlmay result in an unwanted reaction of the unit for some time which is so called rebound effect.
Storage systems can contribute to the frequency and voltage control mechanisms. Charging anddischarging of the storage system at the right moments (response within milli-seconds to seconds)can help to preserve the balance between consumption and generation. Storages can also providesecondary and tertiary frequency control. Conventional battery categories today include the mosttechnologically and commercially mature technologies. , i.e. Lead Acid batteries (PbA) and nickelbased batteries, including Nickel Cadmium (NiCd) and Nickel Metal Hydride (NiMH) batteries.Superconductive magnetic energy storage (SMES) system has fast response and its capability tocontrol active and reactive power makes its potential to stabilise many smart grid applications. Thecharacteristics of supercapacitors are the fast response time in milliseconds, high-energy efficiency(more than 95%), high power density and long shelf and cycle life. Flywheels have high steadyinertia and they can support ancillary services like frequency response, provide short time supportfor spinning reserves and standby reserves. Fast-type ancillary services are not directly relevantapplication areas for typically slow-response type thermal energy storage, but indirectly forexample when installed with local CHP systems, thermal energy storage can participate forproviding ancillary services. Pumped hydro storages (PHS) can provide both up and downregulation and can assist with frequency regulation and voltage control. Due to quick startcapabilities, PHS can provide black starts and provision of spinning and standing reserves. Theyare most suitable for transmission application rather than distribution.
Their main goal of the static shunt compensation devices is to maintain desired voltage level byfeeding the grid with necessary reactive power. FACTS (Flexible AC Transmission Systems) arepower-electronics-based devices that are able to influence such parameters of AC system asimpedances (shunt and series), current, voltage, phase angle and power flow. They are veryeffective in power flow control, voltage control, oscillation damping on various frequencies, voltageand transient stability improvement etc. Dynamic thyristor switched devices will enable gridoperators to not only regulate the voltage level but also dynamically respond to grid operating stateCross-border connections enable each single power system to constitute a part of a largeinterconnected power system thus improving operational stability and economic efficiency. Cross-border connections based on HVDC converter schemes can play an important role in frequencyand voltage support. Besides the voltage band violation problem, three phase voltage unbalanceproblem could also become an important one in the near future, considering the increasingpenetration of PV on separate phases in the LV grid. Tap changing transformers provide a means

Project ID: 609687
dd/mm/yyyy Page 108 of118
of voltage control, typically in the range of ±10%. Phase shifting transformers are speciallydesigned transformers for the purpose of changing voltage angle. When installed in series with aline or a transformer they can effectively control power flow. They are going to be an effectivesolution for minimising congestion problems caused by excessive renewable (uncontrolled)generation.
This report describes appropriate models that characterize the interactions across controlboundaries under normal and emergency situations, introducing suitable data rates and models ofuse by real-time control functions. Boundaries are affected by the electrical grid structure, thedemand and generation characteristics and the market. At first, state of art of the frequency andvoltage control and regulating reserves are described. Nowadays, the power system is controlledvertically by TSO’s and DSO’s. Moreover, TSOs are able to keep the power balance since theycontrol the majority of the total generation in the system. Relatively small distributed generation(e.g. 10% in total) in or near the load centres has little influence on the day-ahead prediction of thesystem load, and therefore little effect on the overall power system control and stability. Thevoltage levels in an electricity network are maintained by reactive power generation provided bydifferent facilities. Depending on the operational state of electricity networks, the energy generationunits, the consumers as well as system components such as lines and transformer, consume orproduce reactive power.
In the future power system scheme, TSOS will be able to control significantly lower part of thegeneration compared to the traditional centralized configuration, and thus they will not be able anymore to compensate large deviations in the power balance. Even theoretically a large powerimbalance could be faced with accurate day-ahead predictions of decentralized generation andelectricity demand of load centers, in practice this will be very difficult due to the intermittentdistributed generation profile. Moreover, increased electricity loads and sources such as EVs andresidential PV systems, will influence the balance between day-ahead production and consumptionschedule and will leave energy markets with higher and less predictable need for balancing power.The traditional power system centralized configuration (top-down vertical control) will changed intoa bi-directional vertically and horizontally integrated control scheme. The abovementioned powersystem configuration could be depicted as a combination of connected trees of system objectivesand functions, decomposing the grid responsibility into cells (subgrids). Each cell can still rely onimports/exports, but these are treated as ‘fixed’, and the cell is responsible for maintaining its localpower balance at all timescales. Cells will be mapped on a hierarchical location and there may bemore than one connection between neighbouring cells. In each cell, there will be only one systemoperator, which will perform reserves management in similar way to the currently that TSOsperform for its Control Area or Control Block. System operator will be responsible to restoringfrequency and voltage to their nominal values.
The actors involved in the future frequency control are balance responsible Party (BRP), cellsystem operator (CSO), cell operational information system (COIS), distribution system operator(DSO). Their respective roles are described and these actors play roles both to technical andmarket operations. To meet a high quality of supply and the voltage regulation objectives, ahierarchical control structure has been developed and organized in three control levels: primary,secondary and tertiary. The main components are the automatic voltage regulator (AVR), thereactive power (Q) regulator (RQR), the regional voltage regulator (RVR), the national voltageregulator (NVR).
Interactions are modelled under normal and emergency situations. Cell system operator and theBRPs should intercommunicate not only with the generation companies/units inside the cell but

Project ID: 609687
dd/mm/yyyy Page 109 of118
also with neighbouring cells, in order to implement rules for establishing a maximum gradient fortotal generation output and as far as possible also for demand, at the hourly boundaries,considering ramping period of +/- 5 minutes, to enable the remaining system unbalances (due tomodifications of production, consumption and/or exchanges) to be controlled with the LoadFrequency Control. Moreover the synchronous inertia control at cell level should be re-examineddue to the reduction of the synchronous rotating mass at cell level. If this issue is not addressed,the frequency control reserves may be activated more frequently and much faster. Considering theSea-of cells concept, the generation units will be smaller and in many cases it will be renewableresources which make them less suitable for frequency control. For that reason a more importantrole for participation at the demand side will be expected for voltage and frequency control in thefuture. The demand side can contribute to grid stability, but the contributor’s constraints are morestrict. Managing these constraints and making sure that the constraints are not violated will be akey element in enabling demand side flexibility to find its way to the market.
The report describes “model based interfaces”, where the flexibility user and the flexibilitycontributor agree on a simplified model which describes the actual behaviour and constraints of theflexibility resource. The principle and the properties of a model based approach are explained bymeans of the some examples. However, they are difficult to use in practice because all parametersare very specific to the application. But the original equations and constraints can be convertedeasily in equations and constraints which only contain power and energy. This conversion is calledhardware abstraction which has some major advantages. The actual number of flexibility interfacesneeded in order to describe all sources of (demand side) flexibility is still under investigation.
With a higher proliferation of flexibility resources and associated controllers, there emerges agreater risk of frequency and voltage instabilities caused by conflicting interactions between theseresources. These undesirable interactions can manifest themselves due discrepancies in thecontroller objectives seen from local and global system perspectives, discrepancies in theoperating time windows of said controllers, or indeed the influence of factors such ascommunications infrastructure performance and system operator errors.
State of the art and system operator experience suggests that conflicting interactions betweencontrollers are already taking place. And their impact ranges from small scale inter-controlleroscillations to larger more disruptive system events. Should uncoordinated flexibility controlbecome more commonplace, it is envisaged that the impact of controller conflicts on grid stabilitycan only become more pronounced.
A number of solutions have been proposed in order to mitigate the impact of controller conflicts.These range from coordinated and distributed control strategies to more rigorous system studiesand design considerations. However, it is unclear how the influence of the dynamic electricitymarkets can be managed to avoid undesirable controller behaviour. It is suggested that that theinfluence of markets can assume a lower priority during emergency situations, however this doesnot guarantee eliminating other adverse market effects during normal operating situations (e.g.market gaming).
Further research work is required in order to quantify the impact of controller conflict on powersystem frequency and voltage stability. The approach to which involved two main tasks. First of allit is necessary to identify the controller interactions that are most likely to cause conflictingbehaviour. This can be readily achieved through a mapping of flexibility of resources andassociated controllers within the SGAM architecture. Secondly, a detailed evaluation of controllerbehaviour through simulation is needed to understand the extent of the impact of aforementionedinteractions on grid stability. For the evaluation to be meaningful from an ELECTRA perspective,

Project ID: 609687
dd/mm/yyyy Page 110 of118
the conducted simulations must adhere to the use cases developed under WP3 and WP4. Themethodology presented in the report for the identification of controller conflict encompasses thesetwo tasks and outlines the necessary pre-requisite work from the rest of the project for formulatingthis key understanding of controller conflict and its impact on grid stability.
The report provides also an overview of experiences from the ELECTRA partners regarding therealization of controllers in demonstration and field test projects. It summarizes best practices andlessons learned which will provide valuable inputs for the implementation of control concepts andtheir testing and validation. The main requirements for controllers are reliability, fault tolerance androbustness. The controller algorithm needs a detailed problem description to be defined and ideasof possible solutions for the problems have to be collected, which have to be shaped to one ormore prototypes of the controller algorithm. For power grid controller usually the network model isone of the most essential ones. If the network topology has an impact on the controller, all relevantswitching states have to be considered in the network models. The models for the controllablecomponents have to be very accurate and very often the power profiles of the grid loads andgenerations are necessary. If the environment model is finished, the first draft(s) of the model ofthe controller can be applied to it in simulations. In an iterative process the controller algorithm canbe adapted to optimize the controller behaviour or the control effectiveness. At the end of theprototyping phase, the detailed concept for validating the effect of the controller has to be defined.If applicable, a reference scenario has to be defined (scenario without controller), which will becompared to the scenario where the controller is active.
When the requirements on the controller are fixed, the algorithm of the prototype can be migratedinto the target environment. To guarantee flexibility in field rollout, it is important that every featurethe controller provides can be easily configured, parameterized and adjusted in an externalconfiguration file that is separated from the controller code. This minimizes maintenance efforts,because the same executable binary can be used for multiple grids with different configurationfiles. To guarantee the correct function of the controller in the field, an interface has to be definedto which the controller connects. Based on the interface, test cases can be defined: At a definedinput (through this interface), a defined output has to be given by the controller (assuming thecontroller behavior is predictive). These tests are called component interface tests or in this casesystem tests (blackbox tests), since the whole functionality is tested through the interface. Duringthe controller development process, the test cases give information about the state of theimplementation progress. The less test cases fail, the more mature the software is. If the controllerdevelopment is finished, the tests can be done with the controller operated on the real field testhardware.
Once all tests succeed, the controller is able for deployment in the field environment. In practice,some early stable releases of the controller will be started in the field with suppressed controlleroutputs. It is useful to implement an “open loop” functionality that detains the controller output, sothat it can be manually reviewed and individually decided to be released to the grid. When thecontroller works satisfactory, the open loop will be switched to closed loop. During the acceptancetest, the system operator can make suggestions which situations and what kind of control actionsshould be demonstrated.
In the final phase, the developed control concept will be validated in the field tests. At the start ofthe unattended operation, the procedure of periodically transmission of measurement- and logginginformation must be clarified. At the beginning, a daily sending and analysis of the log-files isnecessary, later it will come to a weekly interval, and finally if the system is mature, a monthly

Project ID: 609687
dd/mm/yyyy Page 111 of118
rhythm might be suitable. The report describes also what kind of experiences is possible to get andwhat is possible to learn from demonstration and field test projects.

Project ID: 609687
dd/mm/yyyy Page 112 of118
8 References
[1] ELECTRA D3.1 available at www.electrairp.eu[2] http://www.electrairp.eu (ELECTRA IRP web site)[3] Aalto, A., Honkasalo, N., Järvinen, P., Jääskeläinen, J., Raiko, M., Sarvaranta, A. 2012.
Energy Industry and Fingrid Oyj, 2012. How to increase flexibility in the power system. ÅF-Consult Limited, 123 p (in Finnish).
[4] WWW.fingrid.fi; Marttinen, M. 2010. Assessing of the lifetime for excitation system ofhydropower generator. Master of Science thesis. Tampere University of Technology. 54 p.[In Finnish]
[5] 2012 - Dati Statistici sull’Energia Elettrica in ItaliaTerna S.p.A. [In Italian][6] http://www.admie.gr/en/operations-data/registers/generation-unit-register/production-units-
in-units-register/[7] http://www.resoffice.gr/file/reg/stats_static.html[8] Chi-Jen Yang, “Pumped Hydroelectric Storage” (http://people.duke.edu/~cy42/PHS.pdf)[9] Project stoRE: “D5.1 – GREECE Overview of the electricity system status and its future
development scenarios – Assessment of the energy storage infrastructure needs”(http://www.store-project.eu/en_GB/target-country-results)
[10] http://ast.lv/files/ast_files/gadaparskzinoj/PSO_ikgadejais_novertejuma_zinojums_2012.pdf: The transmission system operator's annual assessment report [In Latvian]
[11] http://www.pse.pl - PSE - Polish Power Transmission System Operator[12] http://www.cire.pl - Power Market Information Center[13] Electricty Generation Co. (EÜA ) Installed Capacity and Electricty Generation Data,
Turkish Electricty Transmission Co. Installed Capacity Data, Republic of Turkey EnergyMarket Regulatory Authority; http:/www.emra.org.tr/
[14] Elforsk (2011). Lastföljning I kärnkraftverk – Möjliga effektregleringar for svenskakärnkraftverk utifrån ett internationellt perspektiv. Elforsk rapport.
[15] Polish Nuclear Power Programme – adopted by by Polish Government on January 28th,2014, http://www.mg.gov.pl/files/upload/19990/PPEJ_2014_01_28_po_RM.pdf
[16] Http://www.motiva.fi/myllarin_tuulivoima/windpower%20web/en/tour/wtrb/powerreg.htm[17] http://www.ure.gov.pl/uremapoze/mapa.html[18] http://www.resoffice.gr/file/reg/stats_static.html[19] http://www.desmie.gr/fileadmin/user_upload/Files/news/432011_8.pdf[20] http://www.ypeka.gr/LinkClick.aspx?fileticket=vBWJVY3FdTk%3D&...[21] ENERGINET.DK Technical regulation 3.2.5 for wind power plants with a power output
greater than 11 kW[22] Scenarios – Direcção Geral de Energia e Geologia “Relatório de Monitorização da Segurança de
Abastecimento do Sistema Elétrico Nacional 2013-2030”, Março de 2013.[23] The Impact of Control Technology, T. Samad and A.M. Annaswamy (eds.), 2011.
Available at www.ieeecss.org[24] CCSE Cassa Conguaglio Sistemna Elettrico. http://www.ccse.cc/site/informazioni/servizio-
interrompibilita#_ftnref1[25] M. Yunfei, W. Jianzhong, J. Ekanayake, N. Jenkins, and J. Hongjie, "Primary Frequency
Response From Electric Vehicles in the Great Britain Power System," Smart Grid, IEEETransactions on, vol. 4, pp. 1142-1150, 2013.
[26] W. Kempton and J. Tomi , “Vehicle-to-grid power implementation: From stabilizing thegrid to supporting large-scale renewable energy,” J. Power Sources, vol. 144, no. 1, pp.280–294, Jun. 2005.
[27] W. Kempton and J. Tomic, “Vehicle-to-grid power fundamentals: Calculating capacity and

Project ID: 609687
dd/mm/yyyy Page 113 of118
net revenue,” J. Power Sources, vol. 144, no. 1, pp. 268–279, 2005.[28] Y. Mu, J. Wu, J. Ekanayake, N. Jenkins, and H. Jia, “Primary Frequency Response From
Electric Vehicles in the Great Britain Power System,” Smart Grid, IEEE Transactions on,vol. 4, no. 2. pp. 1142–1150, 2013.
[29] “Low carbon innovation coordination group, Technology Innovation Needs Assessment:Electricity Networks and Storage,” 2012.
[30] C. K. Divya, J. Østergaard, E. Larsen, C. Kern, T. Wittmann, and M. Weinhold,“Integration of electric drive vehicles in the Danish electricity network with high wind powerpenetration,” Eur. Trans. Electr. Power, vol. 20, no. 7, pp. 872–883, 2010.
[31] J. Østergaard, A. Foosnæs, Z. Xu, T. A. Mondorf, C. A. Andersen, S. Holthusen, T. Holm,M. F. Bendtsen, and K. Behnke, “Electric vehicles in power systems with 50% wind powerpenetration: the Danish case and the EDISON programme,” in European ConferenceElectricity & Mobility.
[32] E. Larsen, D. K. Chandrashekhara, and J. Ostergard, “Electric vehicles for improvedoperation of power systems with high wind power penetration,” in Energy 2030Conference, 2008. ENERGY 2008. IEEE, 2009, pp. 1–6.
[33] J. R. Pillai and B. Bak-Jensen, “Integration of Vehicle-to-Grid in the Western DanishPower System,” Sustainable Energy, IEEE Transactions on, vol. 2, no. 1. pp. 12–19,2011.
[34] R. J. Bessa and M. A. Matos, “Economic and technical management of an aggregationagent for electric vehicles: a literature survey,” Eur. Trans. Electr. Power, vol. 22, no. 3,pp. 334–350, 2012.
[35] T. G. San Román, I. Momber, M. R. Abbad, and Á. Sánchez Miralles, “Regulatoryframework and business models for charging plug-in electric vehicles: Infrastructure,agents, and commercial relationships,” Energy Policy, vol. 39, no. 10, 2011.
[36] C. Søndergren, Edison project: Electric Vehicles in Future Market Models. 2011.[37] K. Clement-Nyns, E. Haesen, and J. Driesen, “The Impact of Charging Plug-In Hybrid
Electric Vehicles on a Residential Distribution Grid,” IEEE Trans. Power Syst., vol. 25, no.1, pp. 371–380, Feb. 2010.
[38] O. Sundstrom and C. Binding, “Flexible Charging Optimization for Electric VehiclesConsidering Distribution Grid Constraints,” IEEE Trans. Smart Grid, vol. 3, no. 1, pp. 26–37, 2012.
[39] J. Hu, S. You, M. Lind, and J. Ostergaard, “Coordinated Charging of Electric Vehicles forCongestion Prevention in the Distribution Grid,” Smart Grid, IEEE Trans., vol. 5, no. 2, pp.703–711, 2014.
[40] J. A. P. Lopes, F. J. Soares, and P. M. R. Almeida, “Integration of electric vehicles in theelectric power system,” Proc. IEEE, vol. 99, no. 1, pp. 168–183, 2011.
[41] N. O’ Connel, Q. Wu, J. stergaard, A. Nielsen, Cha S, and Y. Ding, “Electric vehicle(EV) charging management with dynamic distribution system tariff,” in proceeding of 2011ISGT, 2011.
[42] A. Ipakchi, “Demand side and distributed resource management—A transactive solution,”in Power and Energy Society General Meeting, 2011 IEEE, 2011, pp. 1–8.
[43] B. Biegel, P. Andersen, J. Stoustrup, and J. Bendtsen, “Congestion Management in aSmart Grid via Shadow Prices,” in Proceedings of the 8th IFAC Symposium on PowerPlant and Power System Control, 2012.
[44] J. Hu, S. You, C. Si, M. Lind, and J. Østergaard, “Optimization and control method forsmart charging of EVs facilitated by Fleet operator: review and classification,” Int. J.Distrib. Energy Resour., vol. 10, no. 1, pp. 31–56, 2014.
[45] V. Lakshmanan, K. Gudmand-Høyer, M. Marinelli, A. M. Kosek, and P. B. Nørgård,“Energy shift estimation of demand response activation on domestic refrigerators – A fieldtest study,”
[46] Universities Power Engineering Conference (UPEC), 2014 Proceedings of the 49thInternational, pp.1-6, Cluj Napoca, 2-5 Sep. 2014
[47] Department of Energy and Climate Change (2012) “Demand side response in thedomestic sector- a literature review of major trials (Final Report)”, UK.

Project ID: 609687
dd/mm/yyyy Page 114 of118
[48] K. Samarakoon, J. Ekanayake, and N. Jenkins, "Investigation of Domestic Load Control toProvide Primary Frequency Response Using Smart Meters," Smart Grid, IEEETransactions on, vol. 3, pp. 282-292, 2012.
[49] Elisabeth Lemaire, Nicolas Martin, Per Nørgård, Erik de Jong, Roald de Graaf, JasperGroenewegen, Efstathia Kolentini, and Stathis Tselepis, “European White Book on Grid-Connected Storage, DRAFT,” CEA INES, Nov. 2011.
[50] ENTSO-E, “UCTE OH – Policy 1: Load-Frequency Control - Final Version (approved bySC on 19 March 2009).” 2009.
[51] S. Skarvelis-Kazakos, E. Rikos, E. Kolentini, L. M. Cipcigan, and N. Jenkins,“Implementing agent-based emissions trading for controlling Virtual Power Plantemissions,” Electric Power Systems Research, vol. 102, pp. 1–7, Sep. 2013.
[52] W. R. Yang, M. H. Hu, G. W. Jhang, Z. Y. He, K. Y. Huang, C. S. Wang, L. R. Chen, T. Y.Guo, and C. P. Young, “Flywheel energy storage system for voltage sag compensation,”in International Conference on Power Electronics and Drive Systems, 2009. PEDS 2009,2009, pp. 956–961.
[53] Alanen, R., Appetecchi, G., Conte, M., De Jaeger, E., Graditi, G., Jahren, S., Martini, L.,Mazman, M., Micolano, E., Mulder, G., Nielsen, T., Sandu., Svensson., Unur, E., VanBaal, J. 2012. D4.1 Electrical Energy Storage Technology Review. 110 p.
[54] TERNA s.p.a. Sistemi di accumulo di energia di tipo elettrochimico per la gestioneefficiente delle fonti rinnovabili non programmabili - A.C. Tortora, E. Senatore, L. Apicella ,R.Polito (Italian,) - Terna Storage
[55] Deane J.P., B.P. Ó Gallachóir, E.J. McKeogh, 2010, “Techno-economic review of existingand new pumped hydro energy storage plant”, Renewable and Sustainable EnergyReviews 14(4): 1293–1302. doi:10.1016/j.rser.2009.11.015.
[56] National Grid Electricity Transmission, “Fast Reserve Service Description,” 2013.[57] National Grid Electricity Transmission, “Short Term Operating Reserve: General
Description of the Service,” 2014.[58] National Grid, “UK Future Energy Scenarios,” 2014.[59] M. Coppo and R. Turri, “Voltage Management in Unbalanced Low Voltage Networks
Using a Decoupled Phase-Tap-Changer Transformer,” in Power Engineering Conference(UPEC), 2014 49th International Universities , vol., no., pp.1,6, 2-5 Sept., 2014.
[60] Dieter Dohnal: On-Load Tap-Changers For Power Transformers PB 25 2/06 EN – On-loadtap-changers for powertransformers - F0126405 - 09/13 - dp - MaschinenfabrikReinhausen GmbH 2013.
[61] http://www.edsoforsmartgrids.eu/category/position-papers/[62] UCTE OH – Policy 1: Load-Frequency Control.[63] UCTE OH – Policy 3: Operational Security.[64] EDSO for Smart Grids, “Flexibility: The role of DSOs in tomorrow’s electricity market” May
2014, ENTSO-E operation handbook[65] A joint EURELECTRIC – ENTSO-E response paper: “Deterministic frequency deviations –
root causes and proposals for potential solutions”, December 2011[66] Daniel Kirschen, Yann Rebours “A Survey of Definitions and Specifications of Reserve
Services”.[67] UCTE AD-HOC GROUP ‘Frequency Quality Investigation’ Excerpt of the Final Report“.[68] H. F. Illian. 2010. Frequency Control Performance Measurement and Requirements”,
Lawrence Berkley Laboratory. 32 p. http://escholarship.org/uc/item/2d63w2f7#page-3.[69] entso-e, “Continental Europe Operation Handbook”[70] entso-e,“The Harmonised Electricity Market Role Model”, version 2011-01, available at
https://www.entsoe.eu/fileadmin/user_upload/edi/library/role/role-model-v2011-01.pdf[71] EU Commission Task Force for Smart Grids, “Expert Group 3: Roles and Responsibilities
of Actors involved in the Smart Grids Deployment”, EG3 Deliverable 04. April 2011available at http://ec.europa.eu/energy/gas_electricity/smartgrids/doc/expert_group3.pdf
[72] Daniel E. M. Bondy, Lars Henrik Hansen, Kai Heussen, Tarnowski Vestas: “OperationalScenario: Manual Regulating Power”, STRATEGIC PLATFORM FOR INNOVATION ANDRESEARCH IN INTELLIGENT POWER [IPOWER]
[73] P. H. Nguyen, W. L. Kling, and P. F. Ribeiro, "A Game Theory Strategy to Integrate

Project ID: 609687
dd/mm/yyyy Page 115 of118
Distributed Agent-Based Functions in Smart Grids," Smart Grid, IEEE Transactions on, vol.4, pp. 568-576, 2013.
[74] H. E. Z. Farag and E. F. El-Saadany, "A Novel Cooperative Protocol for DistributedVoltage Control in Active Distribution Systems," Power Systems, IEEE Transactions on,vol. PP, pp. 1-1, 2012.
[75] Y. P. Agalgaonkar, B. C. Pal, and R. A. Jabr, "Distribution Voltage Control Considering theImpact of PV Generation on Tap Changers and Autonomous Regulators," Power Systems,IEEE Transactions on, vol. 29, pp. 182-192, 2014.
[76] S. Dahal, N. Mithulananthan, and T. K. Saha, "Assessment and Enhancement of SmallSignal Stability of a Renewable-Energy-Based Electricity Distribution System," SustainableEnergy, IEEE Transactions on, vol. 3, pp. 407-415, 2012.
[77] J. Nutaro and V. Protopopescu, "The Impact of Market Clearing Time and Price SignalDelay on the Stability of Electric Power Markets," Power Systems, IEEE Transactions on,vol. 24, pp. 1337-1345, 2009.
[78] S. Gill, I. Kockar, and G. W. Ault, "Dynamic Optimal Power Flow for Active DistributionNetworks," Power Systems, IEEE Transactions on, vol. 29, pp. 121-131, 2014.
[79] E. Wieben, T. Kumm, E. Hohn, M. Rohr, and M. Stadler, "The 5% Approach as BuildingBlock of an Energy System dominated by Renewables," Proceedings of the 28thConference on Environmental Informatics - Informatics for Environmental Protection,Sustainable Development and Risk Management, 2014.
[80] S. Lehnhoff, T. Klingenberg, M. Blank, M. Calabria, and W. Schumacher, "Distributedcoalitions for reliable and stable provision of frequency response reserve," in IntelligentEnergy Systems (IWIES), 2013 IEEE International Workshop on, 2013, pp. 11-18.
[81] F. Andren, B. Bletterie, S. Kadam, P. Kotsampopoulos, and C. Bucher, "On the Stability oflocal Voltage Control in Distribution Networks with a High Penetration of Inverter-BasedGeneration," Industrial Electronics, IEEE Transactions on, vol. PP, pp. 1-1, 2014.
[82] T. Deutsch, F. Kupzog, A. Einfalt, and S. Ghaemi, "Avoiding Grid Congestions with TrafficLight Approach and the Flexibility Operator," presented at the CIRED Workshop, 2014.
[83] H. Hansen, L. H. Hansen, Jo, x, H. hannsson, H. H. Holm-Hansen, et al., "Coordination ofsystem needs and provision of services," in Electricity Distribution (CIRED 2013), 22ndInternational Conference and Exhibition on, 2013, pp. 1-4.
[84] F. Sossan and M. Marinelli, "An auto tuning substation peak shaving controller forcongestion management using flexible demand," in Power Engineering Conference(UPEC), 2013 48th International Universities', 2013, pp. 1-5.
[85] C. T. 38.02.16, "Technical Brochure on Impact of the Interaction among Power SystemControls," 2000.
[86] Z. Xiaohu and C. Chen, "Maximum available power of multi-infeed hvdc system analysedby sensitivity method," Generation, Transmission & Distribution, IET, vol. 8, pp. 473-479,2014.
[87] S. Gill, G. W. Ault, and I. Kockar, "The optimal operation of energy storage in a wind powercurtailment scheme," in Power and Energy Society General Meeting, 2012 IEEE, 2012, pp.1-8.
[88] E. E. Bernabeu, J. Thorp, and V. Centeno, "Methodology for a Security/DependabilityAdaptive Protection Scheme Based on Data Mining," Power Delivery, IEEE Transactionson, vol. 27, pp. 104-111, 2012.
[89] NGET, "Report of the national grid investigation into the frequency deviation and automaticdemand disconnection that occurred on the 27th May 2008," 2009.
[90] ENTSO-E, "Justification of the FRT- Requirement for Type B Units in the RfG NetworkCode,” meeting with DSO Technical Expert Group," 2012.
[91] “Definition and Classification of Power System Stability”, IEEE/CIGRE Joint Task Force onStability Terms and Definitions, IEEE TRANSACTIONS ON POWER SYSTEMS, VOL. 19,NO. 2, MAY 2004
[92] CIGRE Task Force 38.02.14 Rep., Analysis and Modeling Needs of Power Systems UnderMajor Frequency Disturbances, Jan. 1999.
[93] P. Kundur, D. C. Lee, J. P. Bayne, and P. L. Dandeno, “Impact of turbine generatorcontrols on unit performance under system disturbance conditions,” IEEE Trans. Power

Project ID: 609687
dd/mm/yyyy Page 116 of118
Apparatus and Systems, vol. PAS-104, pp. 1262–1267, June 1985.[94] Q. B. Chow, P. Kundur, P. N. Acchione, and B. Lautsch, “Improving nuclear generating
station response for electrical grid islanding,” IEEE Trans. Energy Conversion, vol. EC-4,pp. 406–413, Sept. 1989.
[95] P. Kundur, “A survey of utility experiences with power plant response during partial loadrejections and system disturbances,” IEEE Trans. Power Apparatus and Systems, vol.PAS-100, pp. 2471–2475, May 1981.
[96] IEEE Committee Report, “Guidelines for enhancing power plant response to partial loadrejections,” IEEE Trans. Power Apparatus and Systems, vol. PAS-102, pp. 1501–1504,June 1983
[97] S. Lehnhoff, M. Blank, T. Klingenberg, M. Calabria, W. Schumacher, “DistributedCoalitions for Reliable and Stable Provision of Frequency Response Reserve – An Agent-based Approach for Smart Distribution Grids”, Proceedings of the IEEE InternationalWorkshop on Intelligent Energy Systems (IWIES), IEEE Press, 2013
[98] A. Nieße, S. Lehnhoff, M. Tröschel, M. Uslar, C. Wissing, H.-J. Appelrath, M.Sonnenschein: „Market-Based Self-Organized Provision of Active Power and AncillaryServices: An Agent-Based Approach for Smart Distribution Grids”, Proceedings of IEEECOMPENG, 2012.
[99] J. Machowski, J. W. Bialek, and J. R. Bumby: “Power system dynamics: stability andcontrol.” Chichester: Wiley, 2008. Y. Wang, X. Zhu, L. Xu, and H. Li, “Contribution of VSC-HVDC connected wind farms to grid frequency regulation and power damping,” in IECON2010-36th Annual Conference on IEEE Industrial Electronics Society, 2010, pp. 397–402.
[100] UCTE - union for the co-ordination of transmission of electricity (now ENTSO-E - EuropeanNetwork of Transmission System Operators for Electricity), “Final Report SystemDisturbance on 4 November 2006,” pp.1-85, 30 Jan 2007.
[101] P. Kundur: “Power System Stability and Control”, p. 1081, 1994[102] E. Wieben, T. Kumm, E. Hohn, M. Rohr, M. Stadler, “The 5% Approach as Building Block
of an Energy System dominated by Renewables”, Proceedings of the 28th EnviroInfo 2014Conference, Oldenburg, Germany, September 10-12, 2014
[103] “Definition and Classification of Power System Stability”, IEEE/CIGRE Joint Task Force onStability Terms and Definitions, IEEE TRANSACTIONS ON POWER SYSTEMS, VOL. 19,NO. 2, MAY 2004
[104] “Recommendations for Defence Plans in the Continental Europe Synchronous Area”ENTSO_E RGCE 2011
[105] “Defence Plan Against Extreme Contingencies” Task Force C2.02.24 CIGRE 2007[106] “Coping with Limits for Very High Penetrations of Renewable Energy” CIGRE 2013 WG
C1/C2/C6.18[107] “Voltage Stability” C. W. Taylor, McGraw-Hill, Inc.1994.[108] F. Andren et al, "A Development and Validation Environment for Real-Time Controller-
Hardware-in-the-Loop Experiments in Smart Grids"; International Journal of DistributedEnergy Resources and Smart Grids, Special Issue on Hardware-in-the-loop Testing,Volume 9 (2013), 1 (2013) January-March 2013; S. 27 - 50.
[109] M. Stifter et al, "DG DemoNet Validation: Voltage Control from Simulation to Field Test",IEEE Innovative Smart Grids Technologies, Manchester, 2011
[110] M. Faschang et al, “Controller Hardware in the Loop Approaches Supporting RapidPrototyping of Smart Low Voltage Grid Control”, IEEE Innovative Smart GridsTechnologies Europe, Istanbul, 2014
[111] B. Bagen, D. Jacobson, G. Lane, and H. M. Turanli, “Evaluation of the performance ofback-to-back HVDC converter and variable frequency transformer for power flow control ina weak interconnection,” in Power Engineering Society General Meeting, 2007. IEEE,2007, pp. 1–6.
[112] F. I. Bakhsh and D. K. Khatod, “Variable Frequency Transformer-State of the art review,”in Energy Efficient Technologies for Sustainability (ICEETS), 2013 InternationalConference on, 2013, pp. 1012–1017.
[113] http://www.mitsubishi-motors.com/publish/pressrelease_en/corporate/2014/news/detail0954.html

Project ID: 609687
dd/mm/yyyy Page 117 of118
[114] Five small variable-frequency transformers with a total power rate of 25 MVA were in useat Neuhof Substation, Bad Sachsa, Germany for coupling power grids of former East andWest Germany between 1985 and 1990.
[115] Langlois Substation in Québec, Canada (45°17 13.76 N 74°0 56.07 W) installed a 100MW variable-frequency transformer in 2004 to connect the asynchronous grids in Québecand the northeastern United States.
[116] AEP Texas installed a 100 MW VFT substation in Laredo, Texas, United States(27°34 13.64 N 99°30 34.98 W) in early 2007. It connects the power systems of ERCOT(in the United States) to CFE (in Mexico). (See The Laredo VFT Project.)
[117] Smaller VFTs are used in large land-based wind turbines, so that the turbine rotationspeed can vary while connected to an electrical distribution grid.
[118] http://www.e-highway2050.eu/e-highway2050/

Project ID: 609687
dd/mm/yyyy Page 118 of118
9 Disclaimer
The ELECTRA project is co-funded by the European Commission under the 7th FrameworkProgramme 2013.
The sole responsibility for the content of this publication lies with the authors. It does notnecessarily reflect the opinion of the European Commission.
The European Commission is not responsible for any use that may be made of the informationcontained therein.