detailed study of the 21 august 2005 debris … the natural hillside near fei ngo shan ... near the...
TRANSCRIPT

DETAILED STUDY OF THE 21 AUGUST 2005 DEBRIS FLOW ON THE NATURAL HILLSIDE
NEAR FEI NGO SHAN SERVICE RESERVOIR
GEO REPORT No. 233
Maunsell Geotechnical Services Limited
GEOTECHNICAL ENGINEERING OFFICE
CIVIL ENGINEERING AND DEVELOPMENT DEPARTMENT
THE GOVERNMENT OF THE HONG KONG
SPECIAL ADMINISTRATIVE REGION

DETAILED STUDY OF THE 21 AUGUST 2005 DEBRIS FLOW ON THE NATURAL HILLSIDE
NEAR FEI NGO SHAN SERVICE RESERVOIR
GEO REPORT No. 233
Maunsell Geotechnical Services Limited
This report is largely based on GEO Landslide Study Report No. LSR 4/2007 produced in June 2007

- 2 -
© The Government of the Hong Kong Special Administrative Region First published, November 2008 Prepared by: Geotechnical Engineering Office, Civil Engineering and Development Department, Civil Engineering and Development Building, 101 Princess Margaret Road, Homantin, Kowloon, Hong Kong.

- 3 -
PREFACE
In keeping with our policy of releasing information which may be of general interest to the geotechnical profession and the public, we make available selected internal reports in a series of publications termed the GEO Report series. The GEO Reports can be downloaded from the website of the Civil Engineering and Development Department (http://www.cedd.gov.hk) on the Internet. Printed copies are also available for some GEO Reports. For printed copies, a charge is made to cover the cost of printing. The Geotechnical Engineering Office also produces documents specifically for publication. These include guidance documents and results of comprehensive reviews. These publications and the printed GEO Reports may be obtained from the Government’s Information Services Department. Information on how to purchase these documents is given on the second last page of this report. R.K.S. Chan
Head, Geotechnical Engineering Office November 2008

- 4 -
FOREWORD This report presents the findings of a detailed study of a landslide (Incident No. 2005/08/0381) that occurred on the natural hillside near the Fei Ngo Shan service reservoir, at about 6 a.m. on 21 August 2005. The major landslide involved a source volume of about 3,350 m³. The debris reached a natural drainage line further downhill and developed into a channelised debris flow. The fast moving debris flow travelled downhill along the drainage line, resulting in complete blockage of the access road to Fei Ngo Shan service reservoir and Fei Ngo Shan Road and deposited on Pak Fa Lam Road, some 290 m (plan distance) from the landslide crown. Four registered man made slopes (Nos. 11NE B/C655, 11NE B/F231, 11NE B/C789 and 11NE B/F234) were affected by the landslide/debris flow. No casualties were reported as a result of the debris flow. The key objectives of the detailed study were to document the facts about the landslide, present relevant background information and establish the probable causes of the failure. The scope of the study comprised desk study, site reconnaissance, detailed field mapping and engineering geological mapping, ground investigation and laboratory testing, together with theoretical engineering analyses. The study also included a brief review of two smaller landslides which occurred in the vicinity of the natural hillside, which provided some insight to the detailed study of the major landslide. Recommendations for follow up actions are presented separately. The report was prepared as part of the 2005 Landslide Investigation Consultancy for landslides occurring in Kowloon and the New Territories in 2005, for the Geotechnical Engineering Office, Civil Engineering and Development Department, under Agreement No. CE 15/2004 (GE). This is one of a series of reports produced during the consultancy by Maunsell Geotechnical Services Limited. Dr. L.J. Endicott Project Director Maunsell Geotechnical Services Limited Agreement No. CE 15/2004 (GE)
Study of Landslides Occurring in Kowloon and the New Territories in 2005 - Feasibility Study

- 5 -
CONTENTS Page No.
Title Page 1 PREFACE 3 FOREWORD 4 CONTENTS 5 1. INTRODUCTION 8 2. THE SITE 9
2.1 Site Description 9
2.2 Water-carrying Services and Other Utilities 9
2.3 Maintenance Responsibility and Land Status 10
2.4 Regional Geology 10
2.5 Geotechnical Area Studies Programme (GASP) 11 3. SITE HISTORY AND PAST INSTABILITY 11
3.1 Site History 11
3.2 Past Instability 11
3.2.1 Natural Terrain Landslide Inventory and Large 11 Landslide Database
3.2.2 Aerial Photograph Interpretation 12
3.2.3 GEO’s Landslide Database 13 4. PREVIOUS ASSESSMENTS AND SLOPE WORKS 13
4.1 Geotechnical Submissions by Kampsax-Kruger Hong Kong 13 between 1978 and 1979
4.2 SIFT, SIRST and Stage 1 Studies 14
4.3 Slope Maintenance Inspections 14 5. THE AUGUST 2005 LANDSLIDES AND POST-FAILURE 15 OBSERVATIONS
5.1 General 15
5.2 Landslide No. 1 15
5.2.1 General 15

- 6 -
Page No. 5.2.2 Source Area (Chainage 0 m to Chainage 42 m) 15
5.2.3 Upper Debris Trail (Chainage 42 m to Chainage 95 m) 16
5.2.4 Mid-portion of Debris Trail (Chainage 95 m to 17 Chainage 228 m)
5.2.5 Lower Debris Trail (Chainage 228 m to Chainage 288 m) 18
5.3 Landslide No. 2 18
5.4 Landslide No. 3 19 6. GEOLOGICAL SETTING OF THE LANDSLIDE SITES 20
6.1 General 20
6.2 Ground Investigation Prior to the Landslides 20
6.3 Ground Investigation Following the Landslides 20
6.4 Laboratory Testing 21
6.5 Geomorphology 21
6.6 Geology 22
6.7 Groundwater Observations 24
6.8 Hydrogeology 25 7. ANALYSIS OF RAINFALL RECORDS 26 8. THEORETICAL SLOPE STABILITY ANALYSES OF 26 LANDSLIDE NO. 1 9. THEORETICAL MODELLING OF THE MOBILITY OF DEBRIS 27 TRAIL OF LANDSLIDE NO. 1 10. DIAGNOSIS OF THE PROBABLE CAUSES OF THE LANDSLIDES 28
10.1 Failure Mode and Sequence of Events 28
10.2 Probable Causes of Landslide No.1 29
10.3 Debris Transport Mechanisms and Mobility 30 11. CONCLUSIONS 31 12. REFERENCES 31 LIST OF TABLES 34 LIST OF FIGURES 37

- 7 -
Page No. LIST OF PLATES 57 APPENDIX A: AERIAL PHOTOGRAPH INTERPRETATION 82 APPENDIX B: SURVEY OF DEBRIS HEIGHT ALONG THE 101 DEBRIS TRAIL APPENDIX C: THEORETICAL DEBRIS MOBILITY ANALYSIS 110 LIST OF DRAWINGS 123

- 8 -
1. INTRODUCTION At about 6 a.m. on 21 August 2005, when the Landslip Warning had been in effect for more than 33 hours, a landslide (Incident No. 2005/08/0381) occurred on the natural hillside near the Fei Ngo Shan service reservoir (Figure 1 and Plates 1 and 2). The landslide (referred to as Landslide No. 1) involved a failure volume of about 3,350 m³ in the source area. The failure developed into a channelised debris flow, which travelled about 290 m and across three roads (viz. an access road to Fei Ngo Shan service reservoir, Fei Ngo Shan Road and Pak Fa Lam Road). Sections of these three roads were blocked and temporarily closed. Four registered man-made slopes (Nos. 11NE-B/C655, 11NE-B/F231, 11NE-B/C789 and 11NE-B/F234) which are located on either side of these road sections, were affected (Figure 2). No casualties were reported as a result of the debris flow. Probably at about the same time, another two smaller landslides (referred to as Landslides Nos. 2 and 3) occurred on the natural hillsides close to Landslide No. 1 (Figure 1). The failure volumes of Landslides Nos. 2 and 3 in the sources areas were about 180 m³ and 110 m³ respectively. The debris from Landslides Nos. 2 and 3 travelled about 70 m and 35 m respectively and came to rest within the natural hillside (Plates 3 and 4). No casualties were reported as a result of the landslides. Following the incident, Maunsell Geotechnical Services Limited (MGSL), the 2005 Landslide Investigation Consultants for Kowloon and the New Territories, with the support of their sub-consultants Ove Arup and Partners Hong Kong Limited (Arup), carried out a detailed study of the landslides for the Geotechnical Engineering Office (GEO), Civil Engineering & Development Department (CEDD), under Agreement No. CE 15/2004 (GE). The key objectives of the detailed study were to document the facts about the largest landslide (Landslide No. 1), present relevant background information and establish the probable causes of the failure. The study also includes a brief review of the two smaller landslides (Landslides Nos. 2 and 3), which may provide insight to the detailed study of Landslide No. 1. Recommendations for follow-up actions are reported separately. This report presents the findings of the landslide study, which comprised the following key tasks:
(a) review of all relevant documents relating to the study area, (b) engineering geological mapping and detailed field
inspections and measurements, (c) aerial photograph interpretation (API), (d) interviewing witnesses to the incident, (e) ground investigation and laboratory testing, (f) analysis of rainfall records, (g) theoretical stability analyses, and (h) diagnosis of the probable causes of the landslide incident.

- 9 -
2. THE SITE
2.1 Site Description Landslide No. 1 occurred on an east-facing natural hillside at Fei Ngo Shan (also known as Kowloon Peak), at an elevation of 365 mPD. The source area of the landslide is about 100 m to the northwest of Fei Ngo Shan service reservoir (Figure 2, Plates 1 and 2). The access road to the Fei Ngo Shan service reservoir is located below the source area of the landslide at an elevation of 318 mPD, about 80 m to the east. Fei Ngo Shan Road and Pak Fa Lam Road are situated further downhill at elevations of 277 mPD and 245 mPD respectively, and about 210 m and 280 m respectively to the east of the landslide site. A drainage line originates on the downhill side of the access road to the Fei Ngo Shan service reservoir and continues downhill, passing through two culverts located beneath Fei Ngo Shan Road and Pak Fa Lam Road (Figure 2). A residential building and garden are located some 280 m to the northeast of Landslide No. 1 source area. The hillside above the access road where the source area of Landslide No. 1 is situated, is slightly vegetated with grass and shrubs, with varying inclination. Above the source area, the natural hillside has an average angle of about 25°. The average angle of the natural hillside within the source area was about 30°. There was a concave break in slope in the upper part of the source area where the original gradient steepens to 38°. The area of the hillside between the toe of the source area and the access road has a gradient of about 22° to 27°. The hillside between the access road and Fei Ngo Shan Road is densely vegetated with mature trees, with a typical inclination of 12°. The gradient of the hillside steepens to about 40° just above Fei Ngo Shan Road. Between Fei Ngo Shan Road and Pak Lam Road, the natural hillside is densely vegetated and inclined at approximately 27° to 30°. There are also man-made slopes located adjacent to the above roads. Slopes Nos. 11NE-B/C655 and 11NE-B/F231 are located respectively on the uphill and downhill sides of the access road to the Fei Ngo Shan service reservoir (Figure 2). Slope No. 11NE-B/C655 is about 76 m long, up to 6 m high and inclined at an angle of 40°. Slope No. 11NE-B/F231 is about 57 m long and up to 6 m high, with a slope angle of 36°. Two other slopes, Nos. 11NE-B/C789 and 11NE-B/F234, are located on the uphill and downhill sides of Fei Ngo Shan Road (Figure 2). Slope No. 11NE-B/C789 is about 55 m long, up to 8 m high and inclined at an angle of 70°, whereas slope No. 11NE-B/F234 is about 50 m long and up to 6 m high, with an inclination of about 35°. Landslide No. 2 occurred at the head of a natural drainage line at an elevation of 428 mPD, which is about 125 m to the west of and above the source area of Landslide No. 1 (Figure 2 and Plate 3). The adjacent natural hillside has a local gradient of about 38° to 45°. Landslide No. 3 occurred at an elevation of 341 mPD and immediately to the south of a northwest-southeast trending spurline, approximately 330 m to the north of Landslide No. 1 source area (Figure 2 and Plate 4). The gradient of the natural hillside adjacent to Landslide No. 3, varies from about 24° near the spurline, to about 38° below the source area. 2.2 Water-carrying Services and Other Utilities According to the information provided by Water Supplies Department (WSD) and

- 10 -
Drainage Services Department (DSD), there are no records of any water-carrying services in close proximity to the three August 2005 landslides. According to the records from WSD, three water pipes are located about 15 m to the south of the debris trail of Landslide No.1. These pipes lead from the Fei Ngo Shan service reservoir to the residential areas situated along Fei Ngo Shan Road and Pak Fa Lam Road (Figure 2). Information provided by CLP Power Ltd. indicates the presence of a 400 kV overhead transmission line in the study area. None of the pylons are located close to the three landslides. 2.3 Maintenance Responsibility and Land Status Based on the information obtained from the Lands Department (Lands D), Landslides Nos. 1, 2 and 3 are situated on unleased and unallocated government land within the Ma On Shan Country Park and Water Gathering Grounds. According to the Slope Maintenance Responsibility Information System (SMRIS) of Lands D, slopes Nos. 11NE-B/C655 and 11NE-B/F231 are under the maintenance responsibility (MR) of WSD, while slopes Nos. 11NE-B/C789 and 11NE-B/F234 are under the MR of the Highways Department (HyD). 2.4 Regional Geology According to the Hong Kong Geological Survey (HKGS) 1:20,000 Solid and Superficial Geology Map Sheet 11 (GCO, 1986), the study area is mostly underlain by lapilli-bearing fine ash tuff of the Shing Mun Formation and no geological faults are present in the vicinity of the three August 2005 landslides (Figure 3). The HKGS 1:100,000 Pre-Quaternary Geology of Hong Kong Map (Sewell et al, 2000) reclassified the volcanic rocks in the study area as being the Mount Davis Formation. According to the HKGS Memoir No. 2 (Strange & Shaw, 1986), the volcanic rock in the study area dips east to east-northeast at an angle of 20° to 30°. A north-trending layer of tuff breccia and pyroclastic breccia, comprising angular to sub-rounded lithic clasts, is shown to be present below part of the debris trail of Landslide No. 1. Close to the toe of the debris trail of Landslide No. 1, fine ash vitric tuff of the Ap Lei Chau Formation is present. A north trending quartzphyric rhyolite dyke is situated about 330 m above and to the west of Landslide No. 1. The 1:20,000 geological map also indicates the presence of debris flow deposits at the toe of the debris trail of Landslide No. 1 and close to the debris trail of Landslide No. 3. According to the HKGS Memoir No. 2, thick accumulations of these colluvial deposits are typically encountered at the base of steep slopes and in the area to the southwest of the three August 2005 landslides. At least 10 m of poorly sorted deposits of sub-angular to rounded volcanic blocks, set in a yellow to light orange-brown clay matrix, exist, with many highly weathered clasts and a well consolidated matrix.

- 11 -
2.5 Geotechnical Area Studies Programme (GASP) Terrain classification data relating to the study area were compiled as part of the Geotechnical Control Office’s (GCO, renamed GEO in 1991) Geotechnical Area Studies Programme (GASP) Report No. IX, East New Territories (GCO, 1998). The data are shown on a series of 1:20,000 scale maps that were used for regional appraisal and strategic planning purposes. The Engineering Geology Map indicates that the hillside on which Landslide No. 1 occurred comprises predominantly pyroclastic rocks with colluvial deposits along and at the toe of the debris trail. The Geotechnical Land Use Map (GLUM) designated the terrain within the natural hillside as generally having extreme geotechnical limitations (GLUM Class IV). The Physical Constraint Map classifies the area of Landslide No. 1 as being “zones of general instability associated with predominantly insitu terrain”, while the debris trail of Landslide No. 1 and its toe area were classified as “zones of colluvium which are subject to overland flow and periodic inundation”. It should be noted that the above maps are not intended for the assessment of local areas, such as the subject hillside, because of the limited resolution of the maps. 3. SITE HISTORY AND PAST INSTABILITY The history of the study area has been determined from an interpretation of the available aerial photographs, together with a review of relevant documentary information and site observations. Detailed observations from the aerial photograph interpretation (API) are presented in Appendix A. 3.1 Site History The earliest available low-level aerial photographs, taken in 1963, show that Fei Ngo Shan Road, the associated cut slopes and Pak Fa Lam Road had already been formed (Figure 4). Several shallow trenches and excavations, probably wartime relics, were also noted within the area uphill of Fei Ngo Shan Road and close to the location of the present-day Fei Ngo Shan service reservoir. Two structures, probably village houses, were noted to the north of Landslide No. 1, just below Fei Ngo Shan Road. A small village with low-rise buildings was also observed below Pak Fa Lam Road, to the southeast of Landslide No. 1. Between 1977 and 1978, a garden with several outhouses and building structures, was constructed to about 200 m northeast of Landslide No. 1, immediately uphill of Pak Fa Lam Road. Construction of Fei Ngo Shan service reservoir and the associated access road and slopes commenced in 1979 and was completed by 1980. There have been no significant changes in the vicinity of the landslide sites since the completion of the above works. 3.2 Past Instability
3.2.1 Natural Terrain Landslide Inventory and Large Landslide Database In 1995, the GEO compiled a Natural Terrain Landslide Inventory (NTLI) from the

- 12 -
interpretation of high-level aerial photographs dating from 1945 to 1994 (Evans et al, 1997; King, 1999). The NTLI database records a total of twelve landslides in the vicinity of the three 21 August 2005 landslides (Figure 5), all of which are recorded as being less than 20 m wide. No NTLI features are identified at the locations of Landslides Nos. 1 and 3. Nine of the landslides are located above Landslide No. 1, including a relict landslide (tag No. 11NEB0010) and a recent landslide (tag No. 11NEB2003) situated at the location of Landslide No. 2. The two landslides closest to Landslide No. 1 (tag Nos. 11NEB0011 and 11NEB0012) were recorded in an area approximately 50 m west of Landslide No. 1 source area. These two landslides are shown as a cluster of multiple events. In 2004, GEO commenced a project to update the NTLI using low-altitude aerial photographs and produced an Enhanced Natural Terrain Landslide Inventory (ENTLI). The ENTLI database records seven landslides (tag Nos. 11NEB0009, 11NEB0010, 11NEB0058, 11NEB0059, 11NEB0060, 11NEB0073 and 11NEB2003) in the vicinity of Landslide No. 2 with tag No. 11NEB0060 coinciding with Landslide No. 2. Another landslide (tag No. 11NEB0053) coincided with Landslide No. 3 (Figure 5). No ENTLI features are identified at Landslide No. 1. The two ENTLI features (tag No. 11NEB0011 and 11NEB0012) near the crown of Landslide No. 1 are marked at similar locations as those previously identified under the NTLI but their positions were shifted to the east, being closer to Landslide No. 1 in the ENTLI. The three 21 August 2005 landslides are not located within the Historical Landslide Catchments (HLC) identified under the ENTLI project. The GEO’s Large Landslide Database (Scott Wilson, 1999) indicates two possible large landslides within the study area (Figure 5). Landslide (tag No. 11NEBL011) is located about 250 m north of Landslide No. 1 and covers the area where Landslide No. 3 occurred. This failure was inferred as debris flow being some 120 m wide and 380 m long. The second large landslide (tag No. 11NEBL007) is located about 300 m to the southwest of Landslide No. 1. 3.2.2 Aerial Photograph Interpretation The source area of Landslide No. 1 was mainly within a rounded, scoop-shaped depression located slightly beneath a truncated spurline and bounded by another two west-east trending spurlines (Plate A4). This depression is likely to be a very old relict landslide which is much more degraded and rounded than other more obvious relict landslide scars nearby. This is particularly apparent in aerial photographs taken after 1981, which show that the source area is overgrown with bushes and is very indistinct as compared with the other, more recent landslide scars in the vicinity. In the 1963 aerial photographs, past landslides were identified on the hillside immediately above Landslide No. 1 and in the vicinity of Landslide No. 2 (Plate A1). Some of these past landslides correlate reasonably well with the data recorded in the NTLI, although it was noted that the positions of a number of the landslides identified in the NTLI do not exactly match those revealed in the API. A number of vegetated and well-defined local topographic depressions are apparent in the 1963 and 1974 aerial photographs. Based on the characteristics and geometries observed, they are interpreted as relict landslides (Plates A1 and A3). Several other reasonably

- 13 -
well-defined depressions, but with more rounded edges, are also apparent and they have been inferred as evidence of degraded relict landslides in the area. In the vicinity of Landslide No. 2, recent landslides were noted in aerial photographs taken in 1974, 1986 and 1998 respectively, and all of these occurred at the heads of the drainage lines (Plates A4, A6 and A8). No evidence of past instability was noted in the vicinity of Landslide No. 3. Although the area forms a larger topographic depression, which was inferred as an ancient large landslide in the Large Landslide Database, no evidence to support such a substantial failure was noted during the API. 3.2.3 GEO’s Landslide Database According to the GEO’s landslide database, six landslide incidents (Incidents Nos. NT82/12, ME89/5/24, ME93/10/1, ME94/7/18, ME94/8/30 and ME97/6/10) were reported in the study area (Figure 5). None of them occurred in the vicinity of the three August 2005 landslides. Five of these incidents (Nos. NT82/12, ME89/5/24, ME93/10/1, ME94/7/18 and ME97/6/10 with failure volumes between 4.5 m³ and >50 m³) occurred on the cut slopes along Fei Ngo Shan Road and Lam Ha Road (Figure 5). The remaining landslide (Incident No. ME94/8/30 with a failure volume of 40 m³) occurred on the hillside above Lam Ha Road and below the Fei Ngo Shan service reservoir (Figure 5). 4. PREVIOUS ASSESSMENTS AND SLOPE WORKS There were no previous engineering works/studies carried out within and in the vicinity of the three August 2005 landslides and their debris trails. Relevant information on previous assessments of the affected man-made slopes is presented in the following sections. 4.1 Geotechnical Submissions by Kampsax-Kruger Hong Kong between 1978 and 1979 Between 1978 and 1979, WSD’s consultants, Kampsax-Kruger Hong Kong (KKHK) submitted a series of geotechnical design reports to the GCO under a project entitled “Improvement of Water Supply to the Area between Fei Ngo Shan and Razor Hill”. The proposed works involved the formation of the Fei Ngo Shan service reservoir and the associated slope works (including slopes Nos. 11NE-B/C655 and 11NE-B/F231) for the WSD access road (Plates 5 and 6). According to the design reports submitted by KKHK to GCO in October and November 1979, the slope works below the source area of Landslide No. 1 comprised cutting to “4:5 (V:H) in completely decomposed volcanic rock” with a slope height of less than 6 m. There was “no evidence of groundwater above the slopes”. Shear strength parameters of c′ = 9 kPa and φ′ = 35° for the completely decomposed volcanic rock were adopted. Groundwater monitoring was carried out between June 1979 and September 1979. The piezometer closest to Landslide No. 1 (in borehole No. BH10 about 100 m to the north of Landslide No. 1) indicated that the highest groundwater level was about 7.1 m below the ground surface.

- 14 -
The construction works were substantially completed in November 1980. A memorandum from GCO to WSD dated 19 February 1981 noted that “the geotechnical checking of works was satisfactory”. 4.2 SIFT, SIRST and Stage 1 Studies In July 1996, under the “Systematic Inspection of Features in the Territory” (SIFT) project initiated by the GEO, slopes Nos. 11NE-B/C655 and 11NE-B/F231 located along the access road to Fei Ngo Shan service reservoir were designated as Class ‘C2’ and ‘B2’ respectively, i.e. slopes that had “been formed or substantially modified after 30.6.78”. Slopes Nos. 11NE-B/C789 and 11NE-B/F234 located along Fei Ngo Shan Road were designated as Class ‘C1’ and ‘B1’ respectively, i.e. slopes “formed or substantially modified before 30.6.78”. In February 1997 under the “Systematic Identification and Registration of Slopes in the Territory” (SIRST) project of the GEO, the above four slopes were inspected by the SIRST Consultants, MGSL. According to the SIRST inspection records, slopes Nos. 11NE-B/C655, 11NE-B/F231 and 11NE-B/F234 were covered by vegetation for about 95 % of the slope area, with the remainder being bare. These slopes were in “fair” condition with “no signs of distress or seepage”. Slope No. 11NE-B/C789 was observed to be in “fair” condition. The Stage 1 Study Report of slope No. 11NE-B/C789 prepared under the SIRST project in February 1997 recorded “reasonable signs of distress” near the crest and mid-portion of the slope, and “soil erosion” near the toe of the slope. “No signs of seepage” were observed and no identifiable failure mechanisms within the rock portion of this slope were recorded. 4.3 Slope Maintenance Inspections In April 2002, Greg Wong & Associates Limited undertook Engineer Inspections (EIs) of slopes Nos. 11NE-B/C655 and 11NE-B/F231 for WSD under Agreement No. CE19/2000. The EI reports indicate “no signs of distress” on these slopes. Based on the findings of the EIs, routine maintenance works, which comprised clearance of debris, re-vegetation of bare surfaces and repair of minor cracks in the surface drains, were recommended for both slopes. In September 2001 and December 2001, MGSL carried out EIs of slopes Nos. 11NE-B/C789 and 11NE-B/F234 for HyD, under Agreement No. CE89/97. No signs of distress were observed on these slopes and no preventive maintenance works were recommended. Routine Maintenance Inspections (RMIs) were undertaken for slope No. 11NE-B/C655 between 2000 and 2002, slope No. 11NE-B/F231 between 1999 and 2002 and in 2004, and slopes Nos. 11NE-B/C789 and 11NE-B/F234 in 2001, 2003 and 2005. The routine maintenance works recommended in the RMIs were minor.

- 15 -
5. THE AUGUST 2005 LANDSLIDES AND POST-FAILURE OBSERVATIONS
5.1 General According to an eye-witness who lives in a house situated along Pak Fa Lam Road and over 200 m from the debris trail of Landslide No. 1, there was a ‘rumbling’ noise around 6.00 a.m. on 21 August 2005. Landslide No. 1 was reported to the Police at 7:00 a.m. on 21 August 2005, at which time the Landslip Warning was in effect. Following the incident, MGSL and Arup carried out an initial inspection on 21 August 2005. 5.2 Landslide No. 1
5.2.1 General Detailed mapping of the landslide site was carried out and the results are presented in Figure 6 and Drawing No. 1 respectively. Based on the pre-failure topographic maps, field observations and API, longitudinal sections of the landslide site have been developed (Figures 7 and 8), where the estimated depths/thicknesses of the erosion and deposition along the debris trail are shown. A detailed description of the landslide is presented in the following sections. 5.2.2 Source Area (Chainage 0 m to Chainage 42 m) The source area of Landslide No.1 is located mainly within a rounded, scoop-shaped depression which is inferred to be the site of a degraded relict landslide (Figure 2, Plates 2 and A4). Aerial photographs taken in 2004 indicate that the source area had a moderately dense vegetation cover of grasses and shrubs (Plate A9). The crown of the landslide was at an elevation of 365 mPD in a natural hillside with varying inclination. Within the source area, the original natural hillside had an average angle of about 30°, with a maximum local gradient of 38°. The landslide scar was up to 42 m long, 25 m to 32 m wide and 3.5 m to 5 m deep, with a volume of about 3,100 m³. There was a small extension immediately above the main landslide scar (Figure 6). The extension comprised an approximately 12 m long by 12 m wide and between 2 m and 3 m deep detachment of soil (Plate 7), with a failure volume of about 250 m³. The total failure volume was therefore estimated to be about 3,350 m³. No substantial tension cracks in the vicinity of or above the extended landslide scar were observed. Material exposed within the main landslide scar comprises residual soil (slightly sandy clayey silt) and completely decomposed tuff (CDT) (sandy clayey silt) overlain by a thin surface layer of colluvium (sandy clayey silt with much gravel and some cobbles and boulders). Some local seepage was observed at the northern side of the main release surface on 21 and 22 August 2005. The material in the scar of the small extension comprises a thin (<1 m thick) layer of colluvium overlying residual soil or completely weathered tuff (slightly sandy silt).

- 16 -
The surface of rupture of the landslide scar was found to be undulating, with much of the exposed surface in the upper part of the scar being formed along a highly persistent relict joint that dips at 41°/086° (Figure 8 and Plate 8). Clay infill, typically between 30 mm and 50 mm thick, was identified on the relict joint surface. The infill was found to be as thick as 100 mm in places. The surface of rupture was most evident on the southern side of the main landslide scar where its dip direction closely matched that of the overlying topography. The extent of the northern side of the main landslide scar appears to have been controlled by a series of relict joints steeply dipping at about 58° towards the south (Plate 9), some of which were found to be slickensided. Several relict joints were also identified below the surface of rupture. The locations and orientations of these relict joints are shown in Drawing No. 1. Most of these joints, which dipped steeply into the slope, were found to be stained with manganese and have thin layers of kaolin infill (Plate 10). No indications of movement such as slickensides were apparent on these relict joint surfaces. An ephemeral drainage line is located approximately 25 m to the north of the landslide source area across a gently undulating hill spur. This drainage line enters a culvert beneath the access road before discharging directly onto the area of the debris trail (Drawing No. 1). 5.2.3 Upper Debris Trail (Chainage 42 m to Chainage 95 m) The upper part of the debris trail extends from the toe of the source area to the access road at an elevation of 318.5 mPD, some 46.5 m below the landslide crown. The gradient of this portion of hillside was between 22° and 27°, and the vegetation cover was predominantly moderately dense grass and shrubs. The landslide caused erosion of additional material of about 25 m³ beneath the source area. This was evident along the northern side of the debris trail where moderately to steeply dipping side scars, about 1 m to 2 m high, were observed. The steeper portions of these side scars formed along relict joint surfaces that were typically manganese stained, polished and occasionally slickensided, similar to those found within the source area. On the southern side of the debris trail, small side scars, up to 1 m high, were observed, although these were less well defined owing to the thicker debris deposited there. Some 2 m to 3 m of landslide debris were deposited within much of this area. The debris deposited was generally thicker on the southern side of the debris trail and it gradually thinned towards an erosion gully that was formed on the northern side of the debris trail (Plate 11). The landslide debris was highly saturated and typically consisted of slightly sandy clayey silt with frequent gravels of highly to moderately decomposed tuff. Several large rafts of unsaturated material were found above the saturated debris described above. The unsaturated material comprised clayey sandy silt with occasional gravels or cobbles that probably originated from the subsequent failure in the extended scar area near the landslide crown. The subsequent failure occurred within residual soil and completely weathered tuff with very few rock fragments. In the absence of any major topographic features, this portion of the debris trail was largely unconstrained and had an average width similar to that of the source area (i.e. about

- 17 -
25 m). When the debris flow intersected the access road, the debris fanned out to a width of about 30 m and deposited up to 2 m of debris (Plate 12). Parts of the man-made slopes Nos. 11NE-C655 and 11NE-B/F231, which are situated above and below the access road respectively, were also affected and covered by the debris. The insitu materials of these two slopes were not exposed and field mapping of their failure scars was not possible. Several erosion gullies formed within the deposited debris, as a result of concentrated runoff from the source area. No seepages were observed in this part of the debris trail at the time of inspection. 5.2.4 Mid-portion of Debris Trail (Chainage 95 m to Chainage 228 m) The mid-portion of the debris trail was situated between the access road at an elevation of 318.5 mPD and Fei Ngo Shan Road at 277.4 mPD. This part of the natural hillside generally is a narrow and shallow valley, densely vegetated with trees. A drainage line, extending from a culvert beneath the access road, runs downhill and comes to a bend at an elevation of about 304 mPD, where the alignment changes to approximately northeast. The gradient of this portion of the hillside is typically about 12° but it increases to about 40° just above Fei Ngo Shan Road. Based on the pre-failure topographic map, the channelisation ratio within the mid-portion of the debris was estimated to be about 5.5 to 10. Debris was deposited to form levees on the north and south sides of the debris trail, with thicknesses of <0.5 m and >1.5 m respectively. The thickness of the levee on the south side of the debris trail was up to 2 m near the bend of the drainage line (Plate 13). ‘Splatter marks’ appeared on the trees situated on both sides of the debris trail. A detailed survey of the ‘Splatter marks’ and debris height was carried out in order to establish the superelevation and velocity (Appendix B). ‘Splatter marks’ of up to a height of about 5.5 m were observed on the trees on the south side of the debris trail (Plate 14), whilst the maximum height of the ‘splatter mark’ on the north side was 3.0 m. The estimated superelevation of the debris was in the order of 10°. Below the bend of the drainage line, the width of the debris trail narrowed to about 15 m as the width of drainage line itself reduced and the ridge bounding its southern side became more prominent. The thickness of debris below the bend in the debris trail appeared more uniform, with thin deposits (<0.5 m) across most of the area and small marginal levee banks of about 0.5 m high on either flank. Following the main depositional phase of the landslide, a number of erosion gullies formed within the landslide debris. The most prominent one ran from the culvert below the access road on the north side of the debris trail along the alignment of the original drainage line (Plate 15). The culvert below the access road was largely buried by debris. After the incident, runoff from uphill that passed through the culvert eroded the debris to expose topsoil at the base of the gully (Plate 16). The presence of an essentially undisturbed topsoil layer suggests that little erosion and scouring of the original ground surface occurred during the incident. Another relatively undisturbed topsoil layer was exposed on a localised steep portion of the northern side of the debris trail (Plate 17). A second reasonably well-defined erosion gully formed on the south side of the debris trail as a result of runoff from the area of natural terrain between the debris trail and the Fei Ngo Shan service reservoir. Towards the lower end of the mid-portion of the debris trail (at Chainage 200 m just

- 18 -
above Fei Ngo Shan Road), the ground topography steepens and several rock outcrops were apparent (Plates 18 and 19). The observed damage to the eastern edge and the surface of Fei Ngo Shan Road (Plate 20) suggests that the debris flow may have entrained some large loose blocks from the rock outcrops that caused this damage before cascading further downhill. About 0.7 m to 1 m thick of debris was deposited on Fei Ngo Shan Road. The debris flow also fanned out slightly on the road (Plate 19). Parts of the man-made slopes Nos. 11NE-C789 and 11NE-B/F234, which are situated above and below Fei Ngo Shan Road respectively, were also affected and covered by debris. The insitu materials of these two slopes were not exposed and field mapping of their failure scars was not possible. 5.2.5 Lower Debris Trail (Chainage 228 m to Chainage 288 m) The lower debris trail developed along another section of the drainage line running between Fei Ngo Shan Road at an elevation of 277.4 mPD and Pak Fa Lam Road at 245.5 mPD (Plate 21). The natural hillside in the vicinity was densely vegetated with trees, with a moderately dense ground cover of grass and shrubs. The gradient of this portion of natural hillside was about 27° to 30°. Most of the debris had been deposited within the upper and mid-portion of the debris trail and it was estimated that the volume of active material within the debris flow entering the lower debris trail probably reduced to about 230 m³. Due to this reduced volume of debris and the steeper gradients within this portion of the natural hillside, it appears that the debris flow was largely transportational, with limited erosion or entrainment. Only a thin layer of about 0.5 m to 1 m of debris was deposited along the lower debris trail. The width of the debris trail narrowed gradually from about 20 m at Fei Ngo Shan Road to about 7 m towards the end of the trail at Pak Fa Lam Road. A large boulder with an estimated volume of about 12 m³ was deposited on Pak Fa Lam Road (Plate 22), and several smaller boulders that travelled in the debris flow appeared to have backed up behind this boulder. 5.3 Landslide No. 2 Landslide No. 2 is located uphill of Landslide No. 1. The landslide scar appeared to be fresh and the landslide probably occurred during the heavy rainfall on 20 and 21 August 2005 (Plate 23). Landslide No. 2 is located at the head of a natural drainage line, along which a debris flow developed. The crown of the landslide scar was located at approximately 428 mPD within natural hillside that is inclined at approximately 38° to 45° (Drawing No. 1). This area of the hillside is covered by light to moderately dense vegetation of shrubs and grass. Based on the 2004 aerial photographs, it appears that the landslide site prior to the incident was similarly vegetated. The landslide scar was 18 m long, 5 m to 10 m wide, with a depth (measured normal to

- 19 -
the ground surface) of about 2 m to 2.5 m. The back scarp was steep, inclined at about 80°. With limited access, no signs of seepage were observed within the landslide scar. The landslide appeared to have involved translational movement rather than rotational movement as in spoon-shaped slip surfaces. The volume of the source is estimated to be approximately 180 m³ and no obvious evidence of entrainment of additional material was apparent. Inspections of the material exposed in the landslide scar revealed that the failure occurred within colluvium (Plate 24). Failure and shear surfaces were identified within a detached raft of material close to the landslide scar, suggesting the possibility of some previous distress within the hillside (Plate 25). The debris trail was constrained within an existing narrow natural drainage line immediately below the source area. The debris trail extended approximately 50 m downhill of the landslide crown, gradually thinning in both width and depth towards the end of the trail. The debris was subsequently reworked and had been washed downhill by a further 20 m. The travel angle of the landslide was approximately 35°. The debris typically comprised clayey, sandy, sub-rounded to sub-angular gravel with frequent sub-angular cobbles and boulders. 5.4 Landslide No. 3 Landslide No. 3 is located on natural hillside above the intersection of the access road and Fei Ngo Shan Road. The landslide scar appeared to be fresh and the landslide probably occurred during the heavy rainfall on 20 and 21 August 2005 (Plate 26). Landslide No. 3 is located immediately to the south of a northwest-southeast trending spurline. A major drainage line is located about 30 m to the south of the landslide scar (Drawing No. 1). The drainage line continues downhill towards the intersection of the access road and Fei Ngo Shan Road. The crown of the source area was located at approximately 341 mPD on a natural hillside that is inclined at about 24° to 38°. The natural hillside in the vicinity was covered with dense vegetation of shrubs and trees. The landslide scar was about 11.5 m long, 9 m to 11 m wide, with a depth (measured normal to the ground surface) of about 1 m to 2.5 m. The angle of the scarp was about 38° to 58°. A 50 mm diameter soil pipe was observed within the western flank. However, no seepage was observed within the landslide scar at the time of inspection. The volume of the landslide was estimated to be approximately 110 m³. Completely decomposed volcanic rock with a surface layer of colluvium, was exposed in the landslide scar. The rupture surface coincides approximately with the boundary between Grade IV/V tuff and stronger underlying Grade III/IV tuff. Exposures of moderately to highly decomposed tuff breccia were observed within the lower portion of the scar. A 0.6 m to 0.8 m wide zone of sub-vertical shears was also observed within the lower portion of the scar. A 4 m to 5 m long tension crack was observed extending northeast from the crown of the failure scar. The crack had opened up to about 30 mm and to a depth of 200 mm to 250 mm (Plate 27).

- 20 -
A small drainage line, which fed into the western end of the landslide crown, was observed. A small erosion channel had been formed within the shallow debris deposits, suggesting post-failure water flows at this location. The landslide extended over a distance of about 35 m and had a travel angle of approximately 26°. 6. GEOLOGICAL SETTING OF THE LANDSLIDE SITES
6.1 General The geology of the site was determined using information from desk and field studies. The desk study comprised a review of all the available data and published geological information, whilst the field study included detailed field mapping and ground investigation (GI). Emergency repair works, including the removal of a large proportion of landslide debris, trimming back and shotcreting of the landslide scars and debris trail, were in progress during the field inspections and mapping. Ground investigation works were carried out after the completion of the emergency repair works. 6.2 Ground Investigation Prior to the Landslides GI works were carried out for the formation of Fei Ngo Shan service reservoir between April and May 1978, and in March 1979 by Lam Construction Company Limited. Nine drillholes from these GIs were sunk in the study area (see Figure 9 for locations of the drillholes). No previous GI works had been carried out in the immediate vicinity of the three August 2005 natural terrain landslides. 6.3 Ground Investigation Following the Landslides Following the completion of emergency repair works on Landslide No. 1, GI works in the areas of Landslides Nos. 1 and 2 were carried out by CEDD’s GI term contractor, DrilTech Ground Engineering Limited, between March 2006 and May 2006. The GI comprised fourteen trial pits (Nos. TP1 to TP10 and Nos. ATP1 to ATP4), six drillholes (Nos. BH1 to BH3 and Nos. QP2 to QP4), one trial trench (No. TT1), three slope strips (Nos. SS1 to SS3) and four vegetation strips (Nos. VS1, VS2A, VS2B and VS3). The locations of the investigation stations are presented in Figure 9. Falling head permeability tests and water absorption packer tests were carried out in drillholes Nos. BH1 and BH3 in various strata. Four infiltration tests were conducted around the scar of Landslide No. 1 to determine the probable rates of infiltration of the near-surface ground mass. A number of insitu density tests were also carried out along the debris trail of Landslide No. 1. Standpipes and piezometers were installed in drillholes Nos. BH1 to BH3, and QP2 to QP4. Automatic groundwater monitoring devices were installed in these piezometers and groundwater levels were monitored between July and September 2006. Four sets of

- 21 -
tensiometers were installed around the Landslide No. 1 area at depths of 0.5 m, 1.0 m and 2.0 m below ground surface, to monitor the soil suction from March to September 2006. 6.4 Laboratory Testing In September 2006, Laboratory Soils and Materials Engineering Co. Ltd. carried out laboratory tests on samples retrieved from the post-failure ground investigation. The laboratory tests included classification and index tests, triaxial tests and direct shear box tests on relict joints/rupture surfaces. A summary of the results from the classification and index tests is presented in Table 1. Figures 10 and 11 show the results of triaxial tests and direct shear box tests respectively. The results of Atterberg Limits tests indicated that both the CDT and colluvium typically comprised clayey silts of intermediate compressibility, with most results plotting relatively close to the ‘A-line’ on the Plasticity Chart. Particle Size Distribution (PSD) tests and sample inspections revealed that the colluvium comprises 40% to 60% silt, whilst the CDT typically contains 50% to 70% silt, with the clay contents of both materials generally being below 25%. The shear strength parameters of the CDT samples interpreted from all the triaxial tests results are c' = 4 kPa and φ' = 36°. If only samples with pre-existing surfaces of weakness, such as relict joints, are considered, the shear strength parameters reduce to c' = 0 and φ' = 34°. Direct shear box tests on samples taken from the suspected rupture surface and relict joints yielded peak shear strength parameters of c' = 8 kPa and φ' = 33° with the residual strength of the samples corresponding to c' = 8 and φ' = 31°. The interpreted shear strength parameters of the residual soil samples are c' = 4 kPa and φ' = 35°, which are marginally lower than those of CDT. The interpreted shear strength parameters of the colluvium are c' = 4 kPa and φ' = 35°. PSD tests were carried out on samples of the landslide debris material. It is noted that the tests could only be carried out on samples free from large cobbles and boulders and that the test results would only provide the distribution of the smaller particles in the landslide debris. The test results indicate that the matrix of the debris comprises slightly clayey sandy silt with little variation throughout the debris depth. 6.5 Geomorphology The geomorphology of the hillside on which the landslide occurred has been determined from the API and is summarised in Plates A3 and A4. The hillside in the vicinity of Landslide No. 1 is hummocky, with major and minor breaks in slope as identified from the API (see Plate A4). The source area of Landslide No.1 is located mainly in a rounded, scoop-shaped depression, with the crown falling just outside and above the depression, where a rounded concave break in slope was observed. Below this depression is a lobe-shaped, bouldery feature which lies at a flatter angle (Plate A4). The scoop-shaped depression is inferred to be the site of a highly degraded relict landslide, and the bouldery lobe below it is inferred to be part of the relict landslide deposit. The

- 22 -
vegetated and relatively rounded boundary of this relict landslide indicates that it is relatively older than the other more sharply defined landslide scars nearby. At the site of Landslide No. 2, more prominent breaks in slope with rills and minor drainage lines are evident from both the API and field mapping, resulting in a hummocky hillside profile in this area. It is also evident from the API that this area of the hillside has been particularly active, with a series of reactivated landslide scars that were observed in the 1974, 1986 and 1998 aerial photographs. Old rafts of debris that were re-vegetated by trees and shrubs were present along the drainage line downhill of this landslide, which provides further evidence of previous instability in this area (Plate 28). Several gullies and erosion scars are also present along the drainage line (Plate 29). Landslide No. 3 is located within a large topographic depression with a well-defined drainage line running along its centre. This topographic depression was identified as a large relict landslide in the Large Landslide Database. The extent of this depression is confined by a curved spurline to its north, trending east at the upper hillside and southeast just above Fei Ngo Shan Road. Based on the field mapping, the drainage line was commonly infilled with surface boulders although no erosion features or relict landslides were identified on the sides of the drainage line. 6.6 Geology Landslide No. 1 occurred within an area of hillside characterised by surface colluvial deposits of approximately 1 m thick, underlain by CDT. The insitu density tests carried out on the colluvium show dry densities between 1.18 Mg/m³ and 1.55 Mg/m³. The CDT typically comprises sandy, clayey silt underlain by a corestone layer which comprises interbedded moderately to highly decomposed tuff (M/HDT) and completely to highly decomposed tuff (C/HDT). The CDT layer was originally up to about 10 m thick near the crest of the landslide scar. Above the landslide scar where drillhole No. BH1 is located, a thicker layer of colluvium (up to 2.6 m) was encountered and several large boulders of moderately decomposed tuff (MDT) were observed within the layer. Up to 23.5 m of CDT was also encountered at the drillhole. The transition from the thin colluvial deposits in the landslide source area to the thicker deposits uphill is marked by a break in slope that defines the upper extent of the minor topographic depression observed in the API. Rockhead is quite deep with Grade II/III weathered tuff typically encountered between 17 m and 25 m (or more) below the existing ground surface. Although no drillholes were sunk below the upper debris trail in the current investigation, based on field mapping, it is anticipated that the thickness of CDT gradually reduces along the debris trail towards the rock outcrops at Chainages 208 and 224. The field mapping identified some persistent, undulating, relict joints dipping out of the slope at approximately 41° to the east (Plate 8), forming the upper part of the surface of rupture. Infilled clay seams were identified on the relict joint surfaces, consisting of brown clay between 50 mm and 100 mm thick. A similar infilled clay layer, some 200 mm thick,

- 23 -
was also identified in trial pit No. TP7. This clay layer was located at a depth of about 1.5 m and dipped 15° to the east-northeast along a slickensided planar joint in the north face (Face B) of the pit (Plates 30 and 31). The same rupture surface also appeared in the south face (Face D) of trial pit No. TP7, with a steeper dip of approximately 35° to the southeast (Plate 32). The clay layer above the undulating, slickensided surface showed evidence of remoulding. The release surface identified in trial trench No. TT1, which was located on the north side of the landslide scar, was found to be poorly defined and irregular, probably reflecting side release movement at the edge of the landslide. Local zones of clay infilled joints dipping at about 70° to the northwest, were also identified in trial pit No. TP2 and slope strips Nos. SS1 and SS2 located within or near the landslide scar. The sub-vertical clay infill in trial pit No. TP2 was up to 20 mm thick (Plate 33). The completely decomposed tuff beneath the failure surface comprised sandy, clayey silt with many impersistent (less than 2 m long) relict joints and veinlets (Plate 34). The joints were frequently slickensided and were planar to undulating with manganese staining and commonly coated with a thin layer (1 mm to 2 mm) of kaolin (Plates 35 and 36). The relict joint shown in Plate 35 is of similar orientation to the clay infilled, slickensided surface of rupture which is located at a higher level in the north face of trial pit No. TP7 (see Plate 30). However, two distinct types of clay infill within the joints in the saprolite have been recognised, which are considered to reflect different degrees of relative movement. The first type is generally typified by only thin (<3 mm thick) deposits of white to buff kaolin with manganese oxide coated joint walls (e.g. Plates 34, 35 and 36). In this case, the kaolin and manganese oxide are considered to be the products of weathering, with slickensiding generally being caused by small accommodation movements due to volume changes as the rock decomposes to saprolite (Campbell & Parry, 2002). The secondary type is generally typified by thicker infills of buff clay comprising remoulded, kaolin-rich material with disseminated fragments of weathered rock (e.g. Plates 8, 31 and 33). In this case, the kaolin-rich material has infilled discontinuities that have progressively dilated due to more pronounced slope movements, which may have been caused by inherent instability and/or stress relief (Campbell & Parry, 2002). An assessment of the joint orientations is presented on a lower hemisphere equal area stereonet (Figure 12). Three major joint sets were identified (16°/078°, 63°/295° and 70°/214°). The joints dipping about 40° to 15° in an easterly direction are generally adverse with respect to stability and appear to have influenced the formation of the surface of rupture of the landslide. The joints dipping steeply into the slope, particularly joint set J2 (Figure 12) which is commonly infilled with clay (see Plate 33), are adversely orientated with respect to the potential for dilation due to stress relief and build-up of cleft water pressure. Moderately to highly decomposed (M/HDT) and completely to highly decomposed (C/HDT) lapilli-bearing, coarse ash crystal tuff, were identified beneath the completely decomposed tuff (Plate 37). One of the moderately to slightly decomposed tuff core samples shows a weak sub-horizontal rock fabric (Plate 38). The orientation of this fabric correlates well with that previously recorded in the area by Strange & Shaw (1986). The ground at Landslide No. 2 comprises mostly colluvium, which consists of slightly sandy clayey silt with some to much angular to sub-angular cobbles and boulders of moderately to highly decomposed tuff. Several different colluvial layers were identified in

- 24 -
this area. At trial pit No. TP9, three layers of colluvium were identified based on differing proportions of cobbles and boulders. The layers did not show discrete depositional layering between them but differences in the matrix composition were identifiable. Landslide No. 3 occurred within insitu weathered tuff. The shear surface was at the interface of the Grades IV/V tuff and Grades III/IV tuff. Tuff breccia in the form of Grade III to IV rock was exposed on the landslide scar where some relict joints with minor amounts of kaolin infill were observed. A 0.6 m to 0.8 m wide sub-vertical shear zone was noted on the east side of the rupture surface. 6.7 Groundwater Observations Monitoring of the piezometers and standpipes installed in drillholes Nos. BH1 to BH3 and drillholes Nos. QP2 to QP4 was carried out between March 2006 and September 2006, with the use of automatic groundwater monitoring devices. The results of the groundwater level monitoring are presented in Figure 13, together with the rainfall records of the nearest GEO raingauge No. K04. The results of the monitoring carried out in March and April 2006 (during the GI) are considered to be representative of the dry-season groundwater levels at the site, given that there was a long dry period preceding the monitoring. These measured levels indicate groundwater tables at depths of 8 m to over 20 m, which typically fall within a zone of corestone development above the rockhead. Groundwater levels were measured by periodic manual monitoring between May and July 2006, and by automatic monitoring devices between August and September 2006. The groundwater levels recorded between May and June 2006 show a rise in groundwater level by 2 m to 3 m across most of the landslide site, with the exception of the groundwater level recorded by the piezometer in drillhole No. QP2 where the groundwater level rose from below the piezometer tip (dry) to over 8 m above the tip level, at about 10.8 m below the ground surface. This rise in groundwater level was associated with the heavy rainfalls at the onset of the 2006 wet season, when several Red and Black Rainstorm Warnings were issued in May and June 2006. The monitoring continued between June and September 2006. During the period, little rainfall was recorded. The groundwater levels generally remained at about 2 m to 3 m above those recorded during the dry season of 2006, with gradual decreases of up to 1 m at the piezometers installed at shallower depths (drillholes Nos. BH2, BH3, QP2, QP3 and QP4). Readings taken in some piezometers during a Red Rainstorm Warning issued on 13 September 2006, when some 327 mm of rainfall were recorded over a 24-hour period at raingauge No. K04, showed a storm response of up to 1.5 m above the general wet season levels and to a depth of 7.5 m in the landslide source area (drillhole No. BH2). The effect of the rainstorm was much more apparent in areas where the groundwater tables were at depths of less than 15 m. Double-ring infiltration tests, falling head permeability tests and water absorption packer tests were carried out in the colluvium/landslide debris, CDT and moderately to highly decomposed tuff. The results of the infiltration tests (Figure 14) indicate that the infiltration

- 25 -
rate for the colluvial deposits could be, at least locally, slightly lower than that of the completely decomposed tuff, possibly as a result of the gravels and cobbles being embedded in a more clayey matrix. The test results also show that the permeability of CDT may vary with depth. The two water absorption packer tests revealed that the underlying fractured rock mass is relatively permeable with a coefficient of permeability between 1.8×10⁻⁵ m/s and 8.8×10⁻⁶ m/s. The results from the monitoring of the tensiometers between 20 March and 21 September 2006 are presented in Figure 15. In general, it was observed that the tensiometers installed at 0.5 m were more responsive to rainfall than those installed at greater depths. The tensiometers installed at 2.0 m depth showed little or no variation in soil suction during and immediately following short periods of rainfall, but the suction started to drop after prolonged periods of rainfall (readings for T4A to T4C in Figure 15 refer). Based on these readings, it is apparent that loss of soil suction near the surface could occur rapidly following rainfall, whilst reductions of suction at greater depths require prolonged periods of rainfall to induce change. 6.8 Hydrogeology The source area of Landslide No. 1 is located within a relatively confined geomorphological setting, being set within a minor topographic depression which is located slightly beneath a truncated spurline and bounded by another two local spurlines. This places the landslide source location within a relatively small drainage catchment. The monitoring of groundwater levels between March and September 2006 has shown the main groundwater table, including stormwater response levels, to be at depths that are significantly lower than the landslide rupture surface. However, it should be noted that the rainfall in 2006 was less severe than that in 2005. Hence, the storm response in 2006 would not necessarily be representative of that in 2005. The geological conditions within the source area largely comprise fine-grained completely decomposed tuff (predominantly silt), with a highly to moderately decomposed corestone bearing layer beneath it. The results of the GI suggest that the interface between the completely weathered material and the corestone bearing layer is undulating and in a chair-shaped profile, and that the bedrock profile beneath this is irregular. A significant hump in the profile of the CDT and H/MDT interface appears to be present immediately beneath the landslide source area (Figure 7). If a perched groundwater table were to develop at the CDT and H/MDT interface due to the contrasting permeabilities, the perched groundwater table would have been likely to be closer to the ground surface in the landslide source area. Site observations made on the day of the landslide (21 August 2005) indicated some seepage on the northern side of the main release surface, the area of which might be affected by perched groundwater. The seepage area also coincided with some local pockets of Grade IV to III rock. Depending on the orientation and subsurface structure of these pockets, their higher permeability might have attracted local groundwater flows from direct infiltration into the ground and, possibly seepage from below and from the drainage line to the north (Drawing No. 1). Infiltration and downhill groundwater flow in this area may have also been inhibited by the presence of a number of steeply dipping clay infilled relict joints, the

- 26 -
low permeability of which could have resulted in local damming of the subsurface groundwater flow and subsequent build-up of groundwater pressures. 7. ANALYSIS OF RAINFALL RECORDS Rainfall data were obtained from the nearest GEO automatic raingauge No. K04, which is located about 800 m to the south of the August 2005 landslide on the roof of Lee Cheung House, Shun Lee Estate (Figure 1). The raingauge records and transmits rainfall data at 5-minute intervals to the GEO and the Hong Kong Observatory (HKO). The daily rainfall recorded by raingauge No. K04 over the month preceding the landslides, together with the hourly rainfall readings for the period between 19 August 2005 and 21 August 2005, are presented in Figure 16. Records from another nearby GEO automatic raingauge No. N08, which is about 1.9 km to the east of the August 2005 landslides, were also examined. The pattern of rainfall recorded at this raingauge was broadly similar to that recorded at raingauge No. K04, although it was slightly less intense at raingauge No. N08. The landslides occurred at approximately 6:00 a.m. on 21 August 2005. The rainstorm preceding the landslides commenced on the evening of 18 August 2005 and continued until the midnight of 21 August 2005. Amber Rainstorm Warnings were hoisted from 7:25 a.m. on 19 August 2005 to midnight on 20 August 2005, and from 8:35 a.m. to 9:10 p.m. on 20 August 2005. The maximum 24-hour and 48-hour rainfall before the landslides was 416 mm and 572 mm respectively. The maximum 1-hour rolling rainfall was recorded as 40 mm between 7:35 p.m. and 8:35 p.m. on 19 August 2005 (Table 2). The rainfall analysis also shows a short period of delay between the end of the main rainstorm at 00:15 a.m. on the 21 August 2005 and the time of failure at approximately 6:00 a.m. on the same day. An analysis of the return periods for various durations of maximum rolling rainfall recorded by raingauge No. K04, with reference to historical rainfall data at the Hong Kong Observatory (Lam & Leung, 1994), shows that a rainfall duration of 12 days before the landslide was the most critical, with a corresponding return period of about 50 years. The return periods were also assessed based on the statistical parameters derived by Evans & Yu (2001) from rainfall data recorded by local raingauge No. K04 between 1984 and 1997. The return periods of the 24-hour and 48-hour rainfall were found to be about 29 years and 24 years respectively (Table 2), which is less than those estimated by the historical rainfall data at the Hong Kong Observatory. The maximum rolling rainfall for the August 2005 rainstorm has been compared with the past significant rainstorms recorded by raingauge No. K04 between 1980 and 2004 (Figure 17). Except for the 48-hour rainfall duration, the 20 August 2005 rainstorm is generally not as severe as the previous significant rainstorms. 8. THEORETICAL SLOPE STABILITY ANALYSES OF LANDSLIDE NO. 1 Theoretical stability analyses were carried out to assist in the diagnosis of the mechanisms and causes of the main landslide (viz. Landslide No. 1). These analyses were

- 27 -
aimed at investigating the likely operative range of shear strength parameters along the failure surface corresponding to different possible groundwater levels at the time of the failure. The information used in these analyses was obtained from the published survey maps, post-failure ground investigation, laboratory tests, together with field observations and measurements. A cross-section of the source area of Landslide No. 1 and the input parameters adopted in the analyses are shown in Figure 18. The pre-failure ground profile within the failed area was established from the 1:1000 survey maps, field observations and measurements. The geological profile of the analysed failure surface was determined from field mapping and ground investigation information. Based on field mapping, the failure surface of Landslide No. 1 was in CDT with clay-infilled relict joints observed (Figure 18). A range of groundwater profiles was assumed in the analyses to simulate the possible groundwater conditions at the time of failure. It is likely that soil suction vanished in the near surface ground mass during the severe rainfall in August 2005 and therefore no suction was allowed for in the stability analysis. The results of the analyses are presented in Figure 18 for shear strength parameters of c' = 2 to 10 kPa and φ' = 30° to 38°. The results indicate that for the likely ranges of shear strength parameters on the failure surface, a groundwater level of about 3 m to 4.5 m below ground surface (i.e. about 2 m to 0.5 m above the rupture surface) would have been sufficient for the failure to occur. With shear strength parameters of c' = 4 kPa and φ' = 36° for CDT that were derived from triaxial tests, a groundwater level of about 4.2 m below ground surface would have been sufficient for failure. With peak shear strength parameters of c' = 8 kPa and φ' = 33° that were derived from direct shear tests for relict joints within the CDT, a groundwater level about 3.9 m below ground surface would have been sufficient for failure. With residual shear strength parameters of c' = 8 kPa and φ' = 31°, a groundwater level about 4.2 m below ground surface would have been sufficient for failure. 9. THEORETICAL MODELLING OF THE MOBILITY OF DEBRIS TRAIL OF
LANDSLIDE NO. 1 Preliminary theoretical analyses of the mobility of the debris trail of Landslide No. 1 were carried out using GEO’s computer program DMM. The results of the analyses were compared with the velocities estimated from field superelevation data and field observations of debris distribution along the debris trail. Details of the analyses are given in Appendix C. The longitudinal section through the landslide adopted for the modelling and the mass balance is presented in Figure 8. The pre-failure slope profile was determined from topographic maps, API and post-failure field observations. The geometry of the rupture surface and ground profile were based on the field observations and results of the ground investigation. Based on the observed debris deposition pattern, the debris flow was largely of open-hillside type, which was only weakly channelised below the WSD access road. A parametric study has been carried out in order to provide a ‘best-fit’ for the debris runout distance, post-failure surface profile and spatial distribution of debris. The velocity profile generated by the debris mobility analyses (Figures C1 and C2) indicates that the debris flow front probably moved with a velocity of between 11 m/s and 12 m/s within the upper debris trail (between the source area and just below the access road at

- 28 -
about Chainage 120). The velocity probably reduced gradually from about 12 m/s to 3 m/s as the debris travelled along the gentler slope gradient between Chainages 120 and 195. Near Chainage 200, i.e. on the approach to Fei Ngo Shan Road, the terrain steepens and the model indicates that the velocity increased slightly to about 5 m/s as the debris flow travelled over the natural hillside before reaching Pak Fa Lam Road where it came to a halt. Based on the debris mobility model, the estimated duration from the initiation of the failure to the final deposition of materials at the debris front was about 55 seconds. The model can provide a reasonable fit for the debris flow event using intermediate parameters between open-hillside failure and channelised debris flow. This appears to be primarily due to the generally broad, open hillside nature of the debris path, which was only weakly channelised at a few places (channelisation ratio between 5 and 20), and the generally gentle inclination of the debris path between Chainages 90 and 200 which resulted in most of the debris being deposited within this section. 10. DIAGNOSIS OF THE PROBABLE CAUSES OF THE LANDSLIDES
10.1 Failure Mode and Sequence of Events Landslide No. 1 principally involved a deep-seated failure (about 5 m deep) within a small drainage sub-catchment situated just beneath a truncated spurline. The landslide rupture surface was partly influenced by the presence of persistent, clay infilled, adversely orientated relict joints within the completely decomposed tuff, which formed a large portion of the surface of rupture, and a number of steeply dipping relict joints that formed lateral release surfaces along the northern side of the landslide scar. It appears that the landslide occurred as a single fast-moving event that first developed as a large open hillside failure which then flowed along the gently sloping, weakly channelised drainage line where a significant amount of debris was deposited. The remaining debris then entered a more confined drainage line towards Fei Ngo Shan Road where the channelisation ratio reduced to about 5. The landslide debris could have become wetted up when the debris merged and mixed with the local concentrated surface water runoff in the drainage line below the access road at about Chainage 100. However, it was observed that the debris deposited immediately below the source area was generally fine grained and highly saturated, suggesting that the debris originating from the source area might have been effectively well wetted up before reaching the drainage line. Hence, it is not certain whether the merging and mixing with the runoff in the drainage line would have significantly altered the mobility of the landslide debris. The secondary failure that resulted in the extension of the landslide scar appears to have occurred soon after the main failure. The debris from the secondary failure was in the form of less saturated rafts resting on top of the main debris. These less saturated rafts were restricted to the debris trail above the access road. Fluvioerosion of the debris trail following the failure exposed several areas of largely undisturbed topsoil beneath the debris. This suggests that only limited scouring and erosion occurred along the debris trail.

- 29 -
The probable causes of Landslide No.1 are presented in Section 10.2. Landslide No. 2 occurred at the head of a natural drainage line and comprised a shallow sliding failure within the colluvial deposits. The landslide debris, which was much coarser than that of Landslide No. 1, travelled downhill and entered a small ephemeral drainage line. The debris stopped mostly along the edge of the drainage line and did not become significantly channelised. The failure was probably triggered by the build-up of a perched groundwater table within the colluvium due to the prolonged and intense rainfall, and possibly erosion at the toe of the source area by concentrated runoff in the drainage line. The presence of pre-existing failure and shear surfaces within the soil at the edge of the landslide scar suggests the possibility of some previous distress within the hillside at this locality. Landslide No. 3 principally involved a translational sliding failure along the interface between the saprolite and the underlying stronger highly to moderately decomposed tuff. Landslide No. 3 might be the result of the development of a perched groundwater table above the interface of the saprolite and the highly to moderately weathered underlying strata, due to the contrast in permeability. 10.2 Probable Causes of Landslide No.1 The rupture surface of Landslide No.1 was largely controlled by persistent, adversely orientated, undulating, clay infilled joints, which were identified in the exposed upper part of the rupture surface and in trial pit No. TP7. Steep, southerly dipping relict joints along the northern side of the landslide scar provided further structural control in the form of lateral release surfaces. Whilst some of the thick, remoulded clay infillings along the rupture surface may have been formed during the August 2005 landslide, the thick, buff clay infills which are also present on the steeply dipping relict joints indicate that significant dilation within the landslide source area may have occurred prior to the August 2005 landslide. The close correlation between the intense rainfall recorded on 19 and 20 August 2005 and the time of the failure suggests that the landslide was probably rain-induced. The results of the theoretical analyses show that with shear strength parameters derived from direct shear box tests for relict joints within the CDT, an elevated groundwater level at about 4 m below ground surface would have been required to initiate the failure. This groundwater level is considerably higher than the highest level recorded during the wet season of 2006 (i.e. some 5 m to 11 m below ground surface), and suggests that other hydrogeological aspects might have played an important role in causing the landslide. The hydrogeological setting and conditions that probably contributed to the landslide include an increase in the degree of soil saturation resulting from the prolonged rainfall throughout the 2005 wet season, possible perching of groundwater or development of seepage pressure (due to non-vertical seepage flow) at the interface between the CDT and underlying layer of interbedded H/MDT and C/HDT, and localised damming of groundwater flow caused by the clay infilled relict joints. The geological profile of the landslide suggests that the transient groundwater conditions were probably highly complex and were possibly more adverse in the vicinity of the landslide source area where the interface between the CDT and H/MDT layer is shallower with a concentration of steeply dipping clay infilled joints.

- 30 -
The results of the rainfall analysis show that there appeared to be a 6 hour delay between the last recorded rainfall at around midnight on 21 August 2005 and the reported time of landslide, viz. at around 6:00 a.m. on the same day. This may suggest the possibility of subsurface seepage from the uphill catchment contributing to water ingress into, and wetting up of, the ground mass at the landslide source area. The monitoring of the tensiometers revealed that changes in soil suction at greater depths only occurred after prolonged periods of rainfall. This slow response of the soil suction may also have played a role in giving rise to the apparent time lag for the landslide, where the rupture surface was relatively deep. However, the possibility that the landslide actually occurred at an earlier time cannot be ruled out. Based on API and field observations, Landslide No. 1 is located within a degraded relict landslide scar. The relatively degraded nature of this scar indicates that this site has experienced less frequent detachments of material than the other, fresher-looking landslide scars in the vicinity (such as the catchment of Landslide No. 2). The relatively lower frequency of detachments at the site of Landslide No. 1 may indicate a progressive deterioration in stability and intermittent, small slope movements over a long period of time which allowed a relatively large volume of potentially unstable material to develop without noticeable detachment. The presence of thick clay infillings along both shallow dipping and steeply dipping discontinuities provides supporting evidence of previous slope movements. In view of the geomorphological setting determined from API, the area is considered to be potentially vulnerable to natural terrain landslides, but it would not necessarily be obvious from API that the site of Landslide No. 1 would be of the same order of susceptibility as the other, more sharply defined, relict landslide scars in the vicinity. However, the presence of thick clay infills within relict discontinuities provides further evidence of inherent instability at the site of Landslide No. 1. No obvious signs of distress or other precursors to the failure were apparent in any of the aerial photographs examined. This is despite the early aerial photographs being taken in 1963 and 1974 when vegetation was sparse and bare ground can be observed. Later aerial photographs show that the site became progressively obscured by vegetation, making it even more difficult to identify any signs of distress. A feature that might be inferred as having the appearance of a tension crack at the location of Landslide No.1 was noted in the 1963 aerial photographs but was later confirmed to be an unpaved footpath by subsequent ground investigations. No other tension cracks or signs of progressive hillside deterioration were identified in the field. It is also noted that in comparison, more precursory features are evident in the general vicinity of Landslide No. 2 where recent and relict landslide activities were observed. The scale of the landslide and debris mobility were actually the combined influence of geomorphology, engineering geology, hydrogeology, surface water hydrology, together with the site setting and topography below the source area. 10.3 Debris Transport Mechanisms and Mobility The debris of Landslide No. 1 mainly comprised completely decomposed tuff, with limited inclusion of colluvium. Some vegetation and trees as well as occasional boulders and corestones were also entrained within the debris along the trail. The total mobilised volume of the landslide debris has been estimated from the field mapping to be about

- 31 -
4,025 m³. This comprises 3,350 m³ of source material which bulked to about 3,850 m³ following detachment, together with some 175 m³ arising from erosion and entrainment. Although the landslide was initiated as an open hillside failure, the debris trail was largely controlled by the topography of the ground surface below the source area, with debris becoming partially constrained by the drainage line that controlled the lateral extent of the flow. The drainage line beneath the access road could have influenced the debris mobility beneath that point, by providing some increased surface water to lubricate the landslide debris. However, it is not certain whether this effect would have significantly altered the mobility of the landslide debris given that the debris close to the source area was mapped in the field to be already highly saturated. It is also not certain whether the debris transport mechanism could have, in part, involved undrained loading of loose and wet material in the drainage line due to impact by the landslide debris that entered the drainage line. The landslide scar extended over a distance of about 290 m and the landslide debris had a travel angle of approximately 22°. This travel angle is similar to other natural terrain channelised debris flows of comparable volume within Hong Kong, which typically have travel angles in the range 20° to 25°. 11. CONCLUSIONS The 21 August 2005 debris flow (Landslide No. 1) that occurred on the natural hillside high on the east-facing flank of Fei Ngo Shan was probably triggered by heavy and prolonged rainfall. The return period of the 48-hour rainfall preceding the landslides (16 years) was not exceptional, but the high antecedent rainfall in the weeks prior to the landslides probably exacerbated the effect of the heavy rainfall on 19 and 20 August 2005, resulting in loss of soil suction and build-up of groundwater pressure probably to a greater depth than that normally experienced within the natural hillside. It is also probable that the hydrogeological setting and conditions of the source area played an important contributory role in causing the failure. The landslide had a source volume of 3,350 m³ and occurred first as an open hillside failure that developed along adverse geological structures within the natural hillside, in particular the clay infilled relict joints. The landslide subsequently developed into a mobile debris flow which travelled about 290 m in total. Relict and recent landslide scars are present on the surrounding hillside, including a very old and degraded scar at the site of Landslide No. 1. Whilst the general area is considered to be potentially susceptible to natural terrain landslides, it would not necessarily be obvious from API that the site of Landslide No. 1 would be of the same order of susceptibility as the other, more sharply defined, relict landslide scars in the vicinity. 12. REFERENCES Ayotte, D., Evans, N. & Hungr, O. (1999). Runout analysis of debris flows and avalanches
in Hong Kong. Proceedings of the Symposium on Slope Stability and Landslides, organised by the Vancouver Geotechnical Society, Vancouver, B.C., Canada, May 1999, pp 39-46.

- 32 -
Campbell, S.D.G. & Parry, S. (2002). Report on the Investigation of Kaolin-rich Zones in Weathered Rocks in Hong Kong. (GEO Report No. 132). Geotechnical Engineering Office, Civil Engineering Department, Government of the Hong Kong SAR, 75 p.
Evans, N.C. & Yu, Y.F. (2001). Regional Variation in Extreme Rainfall Values. (GEO
Report No. 115). Geotechnical Engineering Office, Civil Engineering Department, Government of the Hong Kong SAR, 81 p.
Geotechnical Control Office (1986). Hong Kong and Kowloon: Solid and Superficial
Geology, Hong Kong Geological Survey, Map Series HGM20, Sheet 11, 1:20,000 scale. Geotechnical Control Office, Civil Engineering Services Department, Hong Kong Government, 1 map.
Geotechnical Control Office (1988a). Guide to Rock and Soil Descriptions (Geoguide 3).
Geotechnical Control Office, Civil Engineering Services Department, Hong Kong Government, 186 p.
Geotechnical Control Office (1988b). Geotechnical Area Studeis Programme - East New
Territories (GASP Report No. IX). Geotechnical Control Office, Civil Engineering Services Department, Hong Kong Government, 141 p., plus 4 maps.
Hungr, O. (1995). A model for the runout analysis of rapid flow slides, debris flows, and
avalanches. Canadian Geotechnical Journal, vol. 32, pp 610-623. Hungr, O., Sun, H.W. & Ho, K.K.S. (1999). Mobility of selected landslides in Hong Kong -
Pilot back-analysis using a numerical model. Proceedings of the HKIE Geotechnical Seminar on Geotechnical Risk Management, May 1999, Hong Kong Institution of Engineers, pp 169-175.
King, J. P. (1999). Natural Terrain Landslide Study the Natural Terrain Landslide Inventory.
(GEO report No. 74). Geotechnical Engineering Office, Civil Engineering Department, Government of the Hong Kong SAR, 127 p.
Lam, C.C. & Leung, Y.K. (1994). Extreme Rainfall Statistics and Design Rainstorm
Profiles at Selected Locations in Hong Kong. Technical Note No. 86, Royal Observatory, Hong Kong Government, 89 p.
Lam Construction Co. Ltd. (1978). Fei Ngo Shan Site Investigation Report. Report
prepare for Water Supplies Department, Hong Kong Government. Lam Construction Co. Ltd. (1979). Fei Ngo Shan Site Investigation Report. Report
prepare for Water Supplies Department, Hong Kong Government. Lo, D.O.K. (2000). Review of Natural Terrain Landslide Debris-resisting Barrier Design.
(GEO Report No. 104). Geotechnical Engineering Office, Civil Engineering Department, Government of the Hong Kong SAR, 91 p.

- 33 -
Ng, K.C., Parry, S., King, J.P., Franks, C.A.M. & Shaw, R. (2002). Guidelines for Natural Terrain Hazard Studies. (GEO Report No. 138). Geotechnical Engineering Office, Civil Engineering Department, Government of the Hong Kong SAR, 138 p.
Sewell, R.J., Campbell, S.D.G., Fletcher, C.J.N., Lai, K.W. & Kirk, P.A. (2000). The
Pre-Quaternary Geology of Hong Kong. Hong Kong Geological Survey, Geotechnical Engineering Office, Civil Engineering Department, Government of the Hong Kong SAR, 181 p., plus 4 maps.
Strange, P.J. & Shaw, R. (1986). Geology of Hong Kong Island and Kowloon, (Hong
Kong Geological Survey, Memoir No. 2). Geotechnical Control Office, Civil Engineering Services Department, Hong Kong Government, 134 p.

- 34 -
LIST OF TABLES Table No.
Page No.
1 Summary of Classification and Index Test Results
35
2 Maximum Rolling Rainfall at GEO Raingauge No. K04 for Selected Durations Preceding the 21 August 2005 Landslide and the Estimated Return Periods
36

- 35 -
Table 1 - Summary of Classification and Index Test Results
Particle Size Distribution Material Type Sample Location Depth (m) Sample Type
Gravel (%) Sand (%) Silt (%) Clay (%)LL (%)
PL (%)
PI (%)
Moisture Content (%)
Specific Gravity
0.5 - 1 m Bulk 4 36 45 15 47 23 24 - - TT1 2 - 2.5 m Bulk / Block 3 20 66 11 43 22 21 26 - 0.5 - 1 m Bulk 3 23 59 15 47 23 25 - - TP7 1.5 - 2 m Bulk / Block 1 31 61 7 39 24 14 29 - 0.5 - 1 m Bulk / Block 5 24 51 20 42 21 22 27 - TP4 1.5 - 2 m Bulk 7 23 51 19 50 24 26 - -
TP6 1 - 1.5 m Bulk / Block 7 28 50 15 42 23 19 27 - 0.5 - 1 m Bulk 6 31 47 16 41 23 18 - - ATP1 1 - 1.5 m Bulk 4 28 54 14 43 24 19 - - 0.5 - 1 m Bulk 11 32 42 15 43 24 19 - -
Debris
ATP4 1 - 1.5 m Bulk 15 28 42 15 43 24 19 - - TP1 0.5 - 1 m Bulk / Block 13 20 43 24 57 23 34 25 - TP3 0.5 - 1 m Bulk / Block 8 23 44 25 53 23 30 20 - TP4 2.5 - 3 m Bulk / Block 2 24 66 8 38 22 15 24 2.62 TP5 1 - 1.5 m Bulk / Block 7 30 44 19 46 22 24 25 -
ATP2 0.5 - 1 m Bulk 13 43 38 6 43 22 21 - - 0.5 - 1 m Bulk 6 35 46 13 44 21 23 - - ATP3 1 - 1.5 m Bulk 19 28 38 15 41 20 21 - - 1.5 - 2 m Bulk 18 33 33 16 44 23 21 - - ATP4 2.5 - 2.75 m Bulk 16 28 39 17 46 19 27 - - 0.5 - 1 m Bulk 10 15 48 27 54 25 29 - - 1.5 - 2 m Bulk 8 22 47 23 45 19 26 - - TP9 2.5 - 3 m Bulk 6 22 51 21 48 22 26 - - 0.5 - 1 m Bulk 9 21 51 19 49 20 29 - - 1.5 - 2 m Bulk / Block 5 25 51 19 44 21 22 26 2.59
Colluvium
TP10 2.5 - 3 m Bulk 17 18 49 16 43 20 23 - - 1.5 - 2 m Bulk / Block 1 18 63 18 47 24 23 22 2.62 TP1 2.5 - 3 m Bulk / Block 4 15 65 16 42 24 17 22 2.67 Residual Soil
TP3 1.5 - 2 m Bulk / Block 5 21 54 20 54 23 31 21 2.62 0.5 - 1 m Bulk / Block 3 33 60 4 40 28 12 27 - 1.5 - 2 m Bulk / Block 1 29 68 2 44 24 19 26 2.62 TP2 2.5 - 3 m Bulk / Block 4 34 58 4 Non-plastic 24 2.64
TP3 2.5 - 3 m Bulk / Block 14 25 49 12 46 22 24 23 2.59 TP7 2.5 - 3 m Bulk / Block 3 24 68 5 Non-plastic 24 2.61
0.5 - 1 m Bulk / Block 4 31 63 2 Non-plastic 25 2.64 1.5 - 2 m Bulk 9 23 29 39 64 24 37 - -
CDT
TP8 2.5 - 3 m Bulk / Block 5 22 68 5 Non-plastic 24 2.62

- 36 -
Table 2 - Maximum Rolling Rainfall at GEO Raingauge No. K04 for Selected Durations Preceding the 21 August 2005 Landslide and the Estimated Return Periods
Estimated Return Period (Year)
Duration Maximum
Rolling Rainfall (mm)
End of Period By Lam &
Leung (1994)
By Data of K04 from Evans &
Yu (2001)
5 Minutes 5.0 11:15 a.m. on 20 August 2005 < 2 < 2
15 Minutes 12.0 8:10 p.m. on 19 August 2005 < 2 < 2
1 Hour 40.0 8:35 p.m. on 19 August 2005 < 2 < 2
2 Hours 67.0 9:35 p.m. on 19 August 2005 < 2 < 2
4 Hours 122.0 10:25 p.m. on 19 August 2005 2 2
12 Hours 217.0 5:40 a.m. on 20 August 2005 4 4
24 Hours 416.0 6:10 p.m. on 20 August 2005 17 29
48 Hours 572.0 11:10 p.m. on 20 August 2005 40 24
4 Days 664.0 10:25 p.m. on 20 August 2005 34 13
7 Days 746.0 8:55 p.m. on 20 August 2005 39 18
10 Days 823.5 9:05 p.m. on 20 August 2005 41 15
12 Days 987.5 11:10 p.m. on 20 August 2005 50 15
15 Days 899.0 5:55 a.m. on 21 August 2005 31 9
31 Days 1146.5 10:25 p.m. on 20 August 2005 34 6
Notes: (1) Maximum rolling rainfall was calculated from 5-minute rainfall data. (2) Return periods were derived from Table 3 of Lam & Leung (1994) and using data from
Evans & Yu (2001) with interpolation of rainfall parameters for 10 days and 12 days. (3) According to the eye-witness accounts, the landside occurred at about 6:00 a.m. on
21 August 2005. (4) The nearest GEO raingauge to the landslide site is raingauge No. K04 situated at about
800 m to the south of the landslide site.

- 37 -
LIST OF FIGURES
Figure No.
Page No.
1 Location Plan
38
2 Site Layout Plan
39
3 Regional Geology
40
4 Site History
41
5 Past Instabilities
42
6 Field Mapping of Landslide No. 1 Source Area
43
7 Section A'-A' through Landslide No. 1 Source Area
44
8 Section A-A through Landslide No. 1
45
9 Plan of Ground Investigation Works
46
10 p' - q Plot of Triaxial Test Results
47
11 Direct Shear Box Test Results
48
12 Stereograph of Relict Joints
49
13 Groundwater Monitoring Readings and Daily Rainfall for the Period between 18 March 2006 and 21 September 2006
50
14 Summary of Field Permeability Tests
51
15 Tensiometer Readings and Daily Rainfall between 20 March 2006 and 11 May 2006
52
16 Daily and Hourly Rainfall Recorded at GEO Raingauge No. K04
53
17 Maximum Rolling Rainfall for Previous Major Rainstorms at GEO Raingauge No. K04
54
18 Summary of Theoretical Stability Analyses
55
19 Locations and Directions of Photographs Taken
56

- 38 -
Figure 1 - Location Plan

- 39 -
Figure 2 - Site Layout Plan

- 40 -
Figure 3 - Regional Geology

- 41 -
Figure 4 - Site History

- 42 -
Figure 5 - Past Instabilities

- 43 -
Figure 6 - Field Mapping of Landslide No. 1 Source Area

- 44 -
Figure 7 - Section A'-A' through Landslide No. 1 Source Area

- 45 -
Figure 8 - Section A-A through Landslide No. 1

- 46 -
Figure 9 - Plan of Ground Investigation Works

- 47 -
Figure 10 - p' - q Plot of Triaxial Test Results

- 48 -
Figure 11 - Direct Shear Box Test Results

- 49 -
Figure 12 - Stereograph of Relict Joints

- 50 -
Figure 13 - Groundwater Monitoring Readings and Daily Rainfall for the Period between 18 March 2006 and 21 September 2006

- 51 -
Figure 14 - Summary of Field Permeability Tests

- 52 -
Figure 15 - Tensiometer Readings and Daily Rainfall between 20 March 2006 and 11 May 2006

- 53 -
Figure 16 - Daily and Hourly Rainfall Recorded at GEO Raingauge No. K04

- 54 -
Notes: (1) Rainfall data evaluated from 5-minute readings from GEO Raingauge No. K04 (about 800 m to the south of the site) except rainfall data at 1982 which was evaluated from daily rainfall.
(2) Rolling rainfall of previous rainstorms calculated at GEO Raingauge No. K04 since January 1980 when the raingauge became operational.
Figure 17 - Maximum Rolling Rainfall for Previous Major
Rainstorms at GEO Raingauge No. K04

- 55 -
Figure 18 - Summary of Theoretical Stability Analyses

- 56 -
Figure 19 - Locations and Directions of Photographs Taken

- 57 -
LIST OF PLATES Plate No.
Page No.
1 Oblique Aerial View of the Landslides (Photograph taken on 22 August 2005)
60
2 General View of the Source Area of Landslide No. 1 (Photograph taken on 21 August 2005)
61
3 General View of Landslide No. 2 (Photograph taken on 16 September 2005)
61
4 General View of Landslide No. 3 (Photograph taken on 27 October 2005)
62
5 General View of Site Formation Works for the Fei Ngo Shan Service Reservoir Project (Photograph taken by GCO on 10 May 1979)
62
6 View of Slopes Nos. 11NE-B/C655 and 11NE-B/F231 during Site Formation Works for the Fei Ngo Shan Service Reservoir Project (Photograph taken by GCO on 6 December 1979)
63
7 Extension of Scarp at the Crown of Landslide No. 1 (Photograph taken on 29 August 2005)
64
8 Clay Seam at Basal Release Surface of Landslide No. 1 (Photograph taken on 29 August 2005)
64
9 Steeply Dipping Relict Joints Forming Release Surface at Northern Side of the Scar in the Source Area (Photograph taken on 6 September 2005)
65
10 Kaolin Infilled Relict Joints in the Basal Release Surface (Photograph taken on 29 August 2005)
65
11 View of the Upper Debris Trail (Photograph taken on 29 August 2005)
66
12 Landslide Debris Deposited at the Access Road to Fei Ngo Shan Service Reservoir (Photograph taken on 21 August 2005)
66
13 Debris Levee on Southern Side of the Mid-portion of the Debris Trail (Photograph taken on 7 September 2005)
67

- 58 -
Plate No.
Page No.
14 Splatter Mark on Trees along South Side of the Mid-portion of the Debris Trail (Photograph taken on 21 August 2005)
67
15 Erosion Gully within the Mid-portion of the Debris Trail (Photograph taken on 21 August 2005)
68
16 Relatively Undisturbed Topsoil Exposed at the Base of the Erosion Gully in the Mid-portion of the Debris Trail (Photograph taken on 6 September 2005)
68
17 Relatively Undisturbed Topsoil Exposed in the Northern Side of the Mid-portion of the Debris Trail (Photograph taken on 6 September 2005)
69
18 Steepening of Topography above Fei Ngo Shan Road (Photograph taken on 6 September 2005)
69
19 Landslide Debris Deposited at Fei Ngo Shan Road (Photograph taken on 21 August 2005)
70
20 Repair Works to the Pavement of Fei Ngo Shan Road after the Incident (Photograph taken on 27 October 2005)
70
21 General View of the Lower Debris Trail (Photograph taken on 21 August 2005)
71
22 Large Boulder Deposited at the Distal End of the Landslide Debris on Pak Fa Lam Road (Photograph taken on 22 August 2005)
71
23 General View of Landslide No. 2 (Photograph taken on 16 September 2005)
72
24 Close-up View of the Scarp of Landslide No. 2 (Photograph taken on 16 September 2005)
72
25 Failure and Shear Surfaces on the Scarp of Landslide No. 2 (Photograph taken on 16 September 2005)
73
26 General View of Landslide No. 3 (Photograph taken on 27 October 2005)
73
27 Tension Crack near Crown of Landslide No. 3 (Photograph taken on 27 October 2005)
74

- 59 -
Plate No.
Page No.
28 Old Debris Rafts Deposited along the Drainage Line Downhill of Landslide No. 2 (Photograph taken on 11 April 2006)
75
29 Deeply Incised Gully along the Drainage Line Downhill of Landslide No. 2 (Photograph taken on 11 April 2006)
75
30 Surface of Rupture between Landslide Debris and CDT at Faces A and B of Trial Pit No. TP7 (Photograph taken on 19 April 2006)
76
31 Surface of Rupture with a Slickensided Planar Relict Joint at the Base of the Clay Layer at Face B of Trial Pit No. TP7 (Photograph taken on 19 April 2006)
77
32 Surface of Rupture at Face D of Trial Pit No. TP7 (Photograph taken on 19 April 2006)
77
33 Clay Infill within Completely Decomposed Tuff at Faces A and B of Trial Pit No. TP2 (Photograph taken on 10 April 2006)
78
34 Impersistent, Commonly Manganese Coated and Kaolin Infilled Relict Joints in CDT at Face C of Trial Pit No. TP2 (Photograph taken on 20 April 2006)
79
35 Slickensided Undulating, Manganese Coated and Kaolin Infilled Sub-horizontal Relict Joints at Face A of Trial Pit No. TP 7 (Photograph taken on 19 April 2006)
80
36 Slickensided Planar, Manganese Coated and Kaolin Infilled Relict Joints at Face B of Trial Pit No. TP 7 (Photograph taken on 19 April 2006)
80
37 Large Lapilli Clasts Found Locally at Drillhole No. QP4 (Photograph taken on 31 March 2006)
81
38 Weak Sub-horizontal Fabric Observed in the Core of Moderately Decomposed Lapilli-bearing Coarse Ash Crystal Tuff from Drillhole No. BH2 (Photograph taken on 13 May 2006)
81

- 60 -
Plate 1 - Oblique Aerial View of the Landslides
(Photograph taken on 22 August 2005)
Pak Fa Lam Road
Fei Ngo Shan Road
Access road to Fei Ngo Shan service
reservoir
Summit of Fei Ngo Shan
Landslide No. 1 (Source area)
Landslide No. 2
Debris trail
Fei Ngo Shan service reservoir
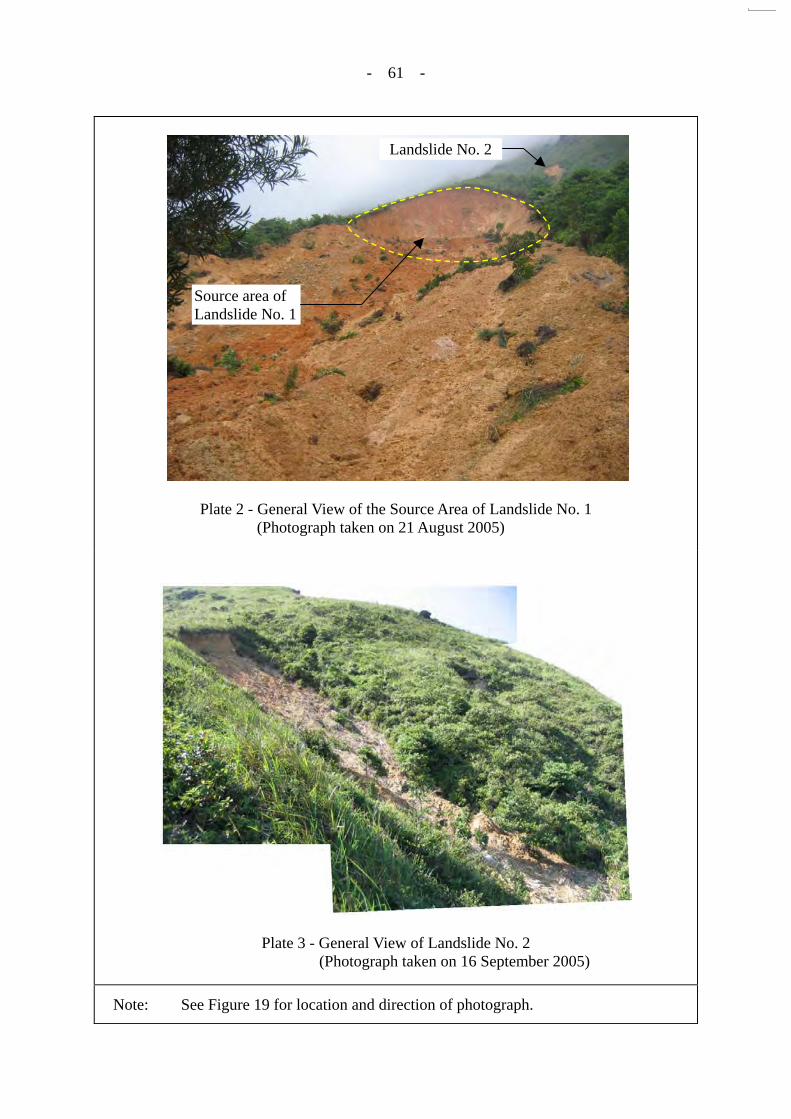
- 61 -
Plate 2 - General View of the Source Area of Landslide No. 1
(Photograph taken on 21 August 2005)
Plate 3 - General View of Landslide No. 2 (Photograph taken on 16 September 2005)
Note: See Figure 19 for location and direction of photograph.
Source area of Landslide No. 1
Landslide No. 2

- 62 -
Plate 4 - General View of Landslide No. 3 (Photograph taken on 27 October 2005)
Plate 5 - General View of Site Formation Works for
the Fei Ngo Shan Service Reservoir Project (Photograph taken by GCO on 10 May 1979)
Note: See Figure 19 for location and direction of photograph.
Fei Ngo Shan service reservoir
Access road
Approximate location of the source area of Landslide No. 1

- 63 -
Plate 6 - View of Slopes Nos. 11NE-B/C655 and 11NE-B/F231 during Site
Formation Works for the Fei Ngo Shan Service Reservoir Project (Photograph taken by GCO on 6 December 1979)
Note: See Figure 19 for location and direction of photograph.
Slope No. 11NE-B/C655
Slope No. 11NE-B/F231
WSD access road

- 64 -
Plate 7 - Extension of Scarp at the Crown of Landslide No. 1 (Photograph taken on 29 August 2005)
Plate 8 - Clay Seam at Basal Release Surface of Landslide No. 1
(Photograph taken on 29 August 2005)
Note: See Figure 19 for location and direction of photograph.
41/086

- 65 -
Plate 9 - Steeply Dipping Relict Joints Forming Release Surface
at Northern Side of the Scar in the Source Area (Photograph taken on 6 September 2005)
Plate 10 - Kaolin Infilled Relict Joints in the Basal Release Surface
(Photograph taken on 29 August 2005)
Note: See Figure 19 for location and direction of photograph.
Steeply dipping relict joints
59/196
Kaolin infilled relict joints dipping into
the hillside

- 66 -
Plate 11 - View of the Upper Debris Trail (Photograph taken on 29 August 2005)
Plate 12 - Landslide Debris Deposited at the Access Road to Fei Ngo Shan Service Reservoir (Photograph taken on 21 August 2005)
Note: See Figure 19 for location and direction of photograph.

- 67 -
Plate 13 - Debris Levee on Southern Side of the Mid-portion of the Debris Trail
(Photograph taken on 7 September 2005)
Plate 14 - Splatter Mark on Trees along South Side of the Mid-portion of the Debris Trail (Photograph taken on 21 August 2005)
Note: See Figure 19 for location and direction of photograph.
1.5 m to 2 m thick debris levee

- 68 -
Plate 15 - Erosion Gully within the Mid-portion of the Debris Trail
(Photograph taken on 21 August 2005)
Plate 16 - Relatively Undisturbed Topsoil Exposed at the Base of the Erosion Gully in the Mid-portion of the Debris Trail (Photograph taken on 6 September 2005)
Note: See Figure 19 for location and direction of photograph.
Discharge from partially buried culvert

- 69 -
Plate 17 - Relatively Undisturbed Topsoil Exposed in the Northern Side of the Mid-portion
of the Debris Trail (Photograph taken on 6 September 2005)
Plate 18 - Steepening of Topography above Fei Ngo Shan Road
(Photograph taken on 6 September 2005)
Note: See Figure 19 for location and direction of photograph.
Exposed topsoil
Erosion gully
Rock outcropsFei Ngo Shan Road (after clearance of
d b i )
Erosion gully

- 70 -
Plate 19 - Landslide Debris Deposited at Fei Ngo Shan Road
(Photograph taken on 21 August 2005)
Plate 20 - Repair Works to the Pavement of Fei Ngo Shan Road after the Incident
(Photograph taken on 27 October 2005)
Note: See Figure 19 for location and direction of photograph.
Rock outcrops
Fei Ngo Shan Road
Repair for possible crater formed by the impact of large boulder

- 71 -
Plate 21 - General View of the Lower Debris Trail (Photograph taken on 21 August 2005)
Plate 22 - Large Boulder Deposited at the Distal End of the Landslide Debris on Pak Fa Lam Road (Photograph taken on 22 August 2005)
Note: See Figure 19 for location and direction of photograph.
Fei Ngo Shan Road

- 72 -
Plate 23 - General View of Landslide No. 2
(Photograph taken on 16 September 2005)
Plate 24 - Close-up View of the Scarp of Landslide No. 2 (Photograph taken on 16 September 2005)
Note: See Figure 19 for location and direction of photograph.

- 73 -
Plate 25 - Failure and Shear Surfaces on the Scarp of Landslide No. 2
(Photograph taken on 16 September 2005)
Plate 26 - General View of Landslide No. 3
(Photograph taken on 27 October 2005)
Note: See Figure 19 for location and direction of photograph.
Failure and shear surfaces

- 74 -
Plate 27 - Tension Crack near Crown of Landslide No. 3
(Photograph taken on 27 October 2005)
Note: See Figure 19 for location and direction of photograph.
Tension crack

- 75 -
Plate 28 - Old Debris Rafts Deposited along the Drainage Line Downhill of Landslide
No. 2 (Photograph taken on 11 April 2006)
Plate 29 - Deeply Incised Gully along the Drainage Line Downhill of Landslide No. 2 (Photograph taken on 11 April 2006)
Note: See Figure 19 for location and direction of photograph.
Drainage lineRe-vegetated, old debris raft

- 76 -
Plate 30 - Surface of Rupture between Landslide Debris and CDT at Faces A and B of Trial Pit No. TP7 (Photograph taken on 19 April 2006)
Note: See Figure 19 for location and direction of photograph.

- 77 -
Clay basal layer Completely decomposed tuff
Landslide debris
Surface of rupture dipping at 35/145
Plate 31 - Surface of Rupture with a Slickensided Planar Relict Joint at the Base of the
Clay Layer at Face B of Trial Pit No. TP7 (Photograph taken on 19 April 2006)
Plate 32 - Surface of Rupture at Face D of Trial Pit No. TP7
(Photograph taken on 19 April 2006)
Note: See Figure 19 for location and direction of photograph.
Clay basal layer
Completely decomposed tuff
Landslide debris
Slickensided planar relict
joint (15/078)

- 78 -
Plate 33 - Clay Infill within Completely Decomposed Tuff at Faces A and B of Trial Pit No. TP2 (Photograph taken on 10 April 2006)
Note: See Figure 19 for location and direction of photograph.

- 79 -
Plate 34 - Impersistent, Commonly Manganese Coated and Kaolin Infilled Relict Joints in
CDT at Face C of Trial Pit No. TP2 (Photograph taken on 20 April 2006)
Note: See Figure 19 for location and direction of photograph.
Impersistent relict joints

- 80 -
Plate 35 - Slickensided Undulating, Manganese Coated and Kaolin Infilled
Sub-horizontal Relict Joints at Face A of Trial Pit No. TP 7 (Photograph taken on 19 April 2006)
Plate 36 - Slickensided Planar, Manganese Coated and Kaolin
Infilled Relict Joints at Face B of Trial Pit No. TP 7 (Photograph taken on 19 April 2006)
Note: See Figure 19 for location and direction of photograph.
15/087
60/289

- 81 -
Plate 37 - Large Lapilli Clasts Found Locally at Drillhole No. QP4
(Photograph taken on 31 March 2006)
Plate 38 - Weak Sub-horizontal Fabric Observed in the Core of Moderately
Decomposed Lapilli-bearing Coarse Ash Crystal Tuff from Drillhole No. BH2 (Photograph taken on 13 May 2006)
Note: See Figure 19 for location and direction of photograph.
Large lapilli clasts found at 18.5 m within moderately decomposed, lapilli-bearing coarse ash crystal tuff
Weak sub-horizontal fabric at 14.52 m to 15.06 m

- 82 -
APPENDIX A
AERIAL PHOTOGRAPH INTERPRETATION

- 83 -
CONTENTS Page No. Title Page 82 CONTENTS 83 A1. DETAILED OBSERVATIONS 84 LIST OF TABLES 88 LIST OF PLATES 90

- 84 -
A1. DETAILED OBSERVATIONS This appendix sets out the detailed observations made from an interpretation of aerial photographs taken between 1963 and 2005. A list of the aerial photographs reviewed is presented in Table A1 and the main observations of API are shown in Plates A1 to A10.
YEAR
KEY OBSERVATIONS
1963 Both Fei Ngo Shan Road and Pak Fa Lam Road have been constructed and several cut slopes are apparent on the uphill side of Fei Ngo Shan Road. A culvert is apparent at Fei Ngo Shan Road, within the drainage line along which the 2005 debris flow occurred. Small rock outcrops are apparent above Fei Ngo Shan Road within the drainage line. Several shallow trenches/dug-outs (wartime relicts) are apparent upslope of Fei Ngo Shan Road and within the area of the current Fei Ngo Shan service reservoir. These are interconnected by a number of unpaved footpaths, and on the lower part of the hillside unpaved roads, some of which also appear to have involved some minor excavation works. Numerous surface boulders, moderate to large in size, are apparent within the area of natural terrain above Fei Ngo Shan Road (Plate A1). Numerous shallow failures are apparent on the hillside above Fei Ngo Shan Road. These landslides are noted to typically occur in clusters of between two and five failures and are generally located at, or near to, the head or on the bank of drainage lines. Several topographic depressions containing drainage lines / ephemeral stream channels are present on the hillside. A detailed observation at the source area of the 2005 Landslide No. 1 is presented in Plate A2. The source area was located at a shallow, scoop-shaped depression at the head of a vague ephemeral drainage line, just north of a major southeast trending ridge. An unpaved footpath follows the ridgeline up the hill and numerous smaller paths are visible extending off. A number of small surface boulders were apparent on the ridgelines surrounding the landslide area. A patch of lighter vegetation cover was apparent just beneath the source area, approximately at the head of the traceable extent of the drainage line. A cluster of three landslide scars is apparent to the southwest of the site of Landslide No. 1, with crown levels slightly higher than Landslide No. 1 and a combined size similar to that of the recent event. Smaller scars are also apparent along the debris trail of these failures, indicating possible reactivation of landslide debris. Whilst a vaguely linear feature is apparent trending across the toe of the NTLI features, this appears to be disturbed ground resulting from probable reactivation of landslide debris and several small slip scars are visible beneath it. A further light coloured approximately linear feature, located immediately north of the landslide cluster, is interpreted as a minor unpaved footpath branching off from the main track up the ridgeline. The vegetation cover above the level of Fei Ngo Shan Road comprises largely ground cover and grasses whilst trees cover the area below Fei Ngo Shan Road.

- 85 -
YEAR
KEY OBSERVATIONS
1963 (Cond’t)
To the northeast of the Landslide No. 1, a low-rise house was observed on the hillsides between Pak Fa Lam Road and Fei Ngo Shan Road, and a few more houses were observed below Pak Fa Lam Road. To the southeast of the Landslide No. 1, Customs Pass was already formed. Some of the valley region further south of Customs Pass was used as agricultural land. Site formation works at Lam Ha Road were observed.
1964 Only the debris trail of the Landslide No. 1 was covered in this set of photographs. No significant change to the natural hillside is visible. To the northeast of the Landslide No. 1, one more low-rise house was built on the natural hillside between Fei Ngo Shan Road and Pak Fa Lam Road. The hillside below the two houses was changed to agricultural terraces.
1974 This is the first set of photographs with full coverage of the 2005 landslides to the hilltop. It is used for interpretation of geomorphology of the study area (Plate A4): • The source area of Landslide No. 1 is located in a shallow, scoop-shaped
depression in a ridgeline, which is very likely a very old relict landslide. However, it is much more degraded and rounded than other more obvious relict landslides nearby and is less distinct than the other, more recent landslide scars.
• The hillside topography is highly irregular. A strong convex break in slope was observed just above Fei Ngo Shan Road, while local ‘micro’ breaks in slope can be observed further upslope, especially in the vicinity of Landslide No. 1.
• Relict landslide scars identified were located at the head or along the drainage lines.
• Four major drainage lines can be observed on this hillside. These drainage line change in directions abruptly. The abrupt change in the direction of drainage lines may be associated with the obstruction by past landslide debris.
• A strong northwest-southeast trending photolineament is apparent (Plate A3). It seems that some of the relict landslides and drainage lines followed this lineament.
• At the hilltop, rock outcrop is exposed. A northeast-southwest photolineament was observed on the outcrop, probably showing the dominant joint set.
A new landslide scar was observed to the north of 2005 Landslide No. 2, probably a reactivated landslide as the scar was already observed in the previous photographs. The density of the vegetation cover on the hillside between Fei Ngo Shan Road and Pak Fa Lam Road has increased and some large trees covered the area. The vegetation also becomes denser for the area above Fei Ngo Shan Road with shrubs and bushes. The portion of Pak Fa Lam Road adjoining Fei Ngo Shan Road was re-aligned to present alignment.

- 86 -
YEAR
KEY OBSERVATIONS
1974 (Cond’t)
To the northeast of the Landslide No. 1 and below Pak Fa Lam Road, more houses were built and the area around the houses was changed to agricultural land. Another new house was built to the south of Landslide No. 1 at the junction of Fei Ngo Shan Road and Pak Fa Lam Road. A TV transmission station located at the hilltop and to the west of Landslide No. 1 was also formed.
1976 No significant change is visible.
1977 Partial coverage and monoscopic view of the study area. No significant change is visible.
1978 Vegetation became denser for the entire natural hillside. No significant change is visible.
1979 Construction of the Fei Ngo Shan service reservoir, including the access road and water tank was in progress. A number of cut and fill slopes have been formed as part of the site formation works. To the south of Landslide No. 1, site formation works at the hillside between Lam Ha Road and Fei Ngo Shan Road were in progress. No significant change to the natural hillside is visible.
1980 Partial coverage and limited stereoscopic view of the study area. Construction of the Fei Ngo Shan service reservoir was still in progress. Site formation works to the south of Landslide No. 1 at Lam Ha Road were completed. No significant change to the natural hillside is visible.
1981 Construction of the Fei Ngo Shan service reservoir was completed (Plate A5). Vegetation cover in the vicinity of the natural hillside above the newly formed service reservoir was light. Some surface boulders are apparent on these areas. No significant change to the natural hillside is visible.
1983 No significant change is visible.
1984 No significant change is visible.
1986 Two landslides were observed in the vicinity of Landslide No. 2, which were open hillside failures. To the south of Landslide No. 1, houses were built at the former site formation site at Lam Ha Road.
1988 The two landslides observed in 1986 were still visible (Plate A6). No significant change is visible.
1989 Partial coverage of the study area.
1991 No significant change is visible. Vegetation was so dense that most boulders on the natural hillside above the access road were obscured.
1992 Partial coverage of the study area. No significant change is visible.

- 87 -
YEAR
KEY OBSERVATIONS
1993 A landslide scar was observed at cut slope No. 11NE-B/C662 above Fei Ngo Shan Road, which is a landslide in 1989 (incident No. ME89/5/24). No significant change to the natural hillside is visible.
1994 No significant change is visible.
1995 Full coverage with monoscopic view. Erection of electricity pylons was in progress. No significant change to the natural hillside is visible.
1996 Full coverage with monoscopic view. Erection of electricity pylons and overhead cables were completed (Plate A7). No significant change to the natural hillside is visible.
1998 Full coverage with monoscopic view. A landslide was observed in the area uphill of the main landslide source area and near landslide No. 2. This appears to be reactivation of a scar first observed in the 1986 aerial photographs.
1999 No significant change is visible.
2000 Full coverage with monoscopic view. No significant change is visible.
2001 Poor view due to obstruction by shadow. No significant change is visible.
2002 No significant change is visible. The landslide scar observed in 1998 was still visible in this year (Plate A8).
2003 Poor view due to obstruction by shadow. No significant change is visible.
2004 No significant change is visible (Plate A9).
2005 The photograph is an oblique aerial photograph of Landslides No. 1 and 2 taken on the day after the failure (Plate A10). Landslide No. 1 was initiated on the edge of an existing shallow topographic depression (Plate A10), abutting an eastward trending ridgeline. Detailed observations of the landslide from fieldwork and geological mapping are given in the report main text. Two additional failure scars are observed to the north of Landslide No. 2, the smaller of which is judged to have occurred in previous years in view of the vegetated nature of the debris material. The larger failure is located close to the head of a small drainage line.

- 88 -
LIST OF TABLES Table No.
Page No.
A1 List of Aerial Photographs Examined
89

- 89 -
Table A1 - List of Aerial Photographs Examined
Date taken Altitude (ft) Photograph Number
1963.02.19 3,900’ Y08531-32, 08558-59 1964.12.27 1,800’ Y10779-80 1974.12.17 4,000’ 10462-63 1976.01.28 4,000’ 12932-33 1977.05.02 3,500’ 18096 1978.12.07 4,000’ 24115-16 1979.11.28 10,000’ 28077-78 1980.04.17 4,000’ 30127-28 1981.11.26 4,000’ 39767-68 1983.01.25 4,000’ 47396-97 1984.03.03 4,000’ 53998-99 1986.09.22 4,000’ A06272-73 1988.10.06 4,000’ A14672-73 1989.07.06 4,000’ A17187-88 1991.09.20 4,000’ A27473-74 1992.04.16 4,000’ A30434-35 1993.11.02 4,000’ A36104-05 1994.05.06 5,000’ A38068-69 1995.07.18 3,500’ CN9908 1996.05.15 4,000’ CN13385-86 1998.10.31 4,000’ CN22200 1999.12.09 8,000’ CN25412-13 2000.09.16 4,000’ CN28201 2001.01.14 4,000’ CN29540-41 2002.08.15 4,000’ CW42325-6 2002.10.25 4,000’ RW01665-6 2003.05.31 4,000’ CW47672-73 2004.09.11 3,000’ CW58996-97 2005.08.23 Oblique aerial photograph taken after the landslide
Note: All aerial photographs are in black and white except for those prefixed with CN, CW or RW.

- 90 -
LIST OF PLATES Plate No.
Page No.
A1 Aerial Photograph Interpretation (1963 photograph)
91
A2 Aerial Photograph Interpretation (Enlarged 1963 photograph)
92
A3 Aerial Photograph Interpretation (1974 photograph)
93
A4 Aerial Photograph Interpretation (Geomorphology using 1974 photograph)
94
A5 Aerial Photograph Interpretation (1981 photograph)
95
A6 Aerial Photograph Interpretation (1988 photograph)
96
A7 Aerial Photograph Interpretation (1996 photograph)
97
A8 Aerial Photograph Interpretation (2002 photograph)
98
A9 Aerial Photograph Interpretation (2004 photograph)
99
A10 Aerial Photograph Interpretation (2005 photograph)
100

- 91 -
Legend:
Plate A1 - Aerial Photograph Interpretation (1963 photograph)
Note: Interpretation carried out using aerial photographs Nos. Y08531 - Y08532.
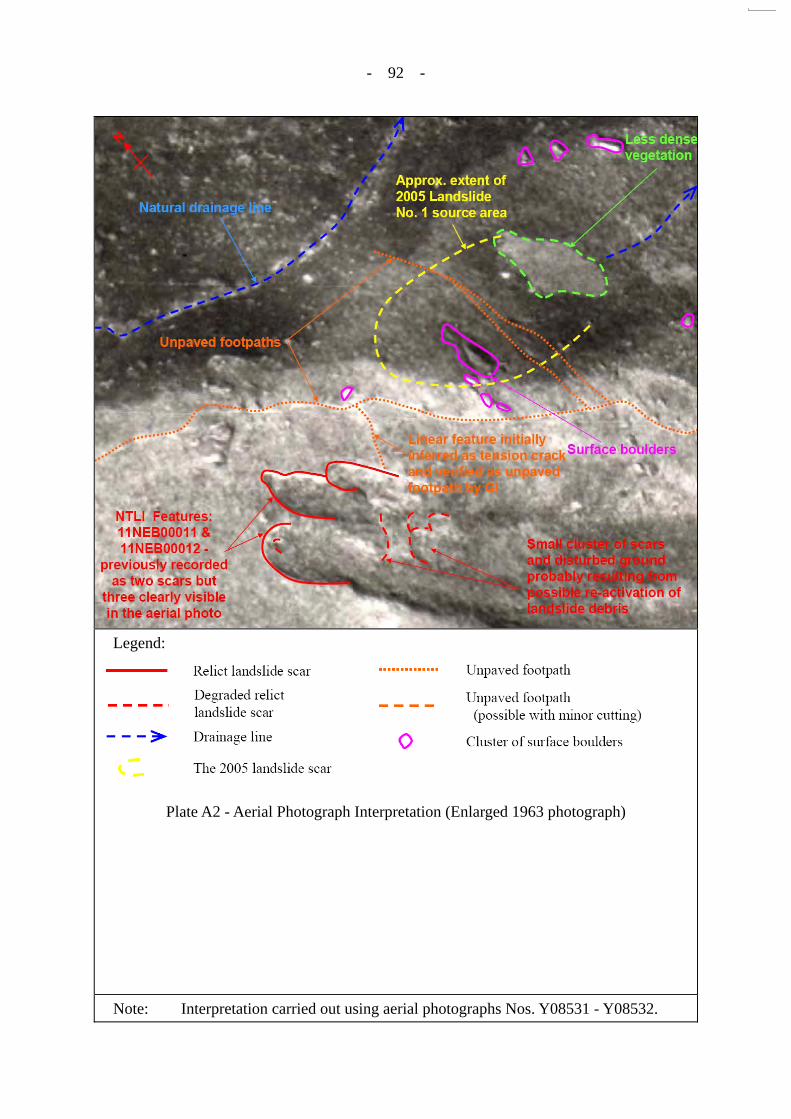
- 92 -
Legend:
Plate A2 - Aerial Photograph Interpretation (Enlarged 1963 photograph)
Note: Interpretation carried out using aerial photographs Nos. Y08531 - Y08532.

- 93 -
Legend:
Plate A3 - Aerial Photograph Interpretation (1974 photograph)
Note: Interpretation carried out using aerial photographs Nos. 10462 - 10463.

- 94 -
Legend:
Plate A4 - Aerial Photograph Interpretation (Geomorphology using 1974 photograph)
Note: Interpretation carried out using aerial photographs Nos. 10462 - 10463.

- 95 -
Legend:
Plate A5 - Aerial Photograph Interpretation (1981 photograph)
Note: Interpretation carried out using aerial photographs Nos. 39767 - 39768.

- 96 -
Legend:
Plate A6 - Aerial Photograph Interpretation (1988 photograph)
Note: Interpretation carried out using aerial photographs Nos. A14672 - 14673.

- 97 -
Legend:
Plate A7 - Aerial Photograph Interpretation (1996 photograph)
Note: Interpretation carried out using aerial photographs Nos. CN13385 - CN13386.

- 98 -
Legend:
Plate A8 - Aerial Photograph Interpretation (2002 photograph)
Note: Interpretation carried out using aerial photographs Nos. RW01665 - RW01666.

- 99 -
Legend:
Plate A9 - Aerial Photograph Interpretation (2004 photograph)
Note: Interpretation carried out using aerial photographs Nos. CW58996 - CW58997.

- 100 -
Legend:
Plate A10 - Aerial Photograph Interpretation (2005 photograph)
Note: Interpretation carried out using oblique aerial photographs taken on 22 August 2005.

- 101 -
APPENDIX B
SURVEY OF DEBRIS HEIGHT ALONG THE DEBRIS TRAIL

- 102 -
CONTENTS Page No. Title Page 101 CONTENTS 102 B1. INTRODUCTION 103 B2. FINDINGS 103 B3. REFERENCES 104 LIST OF TABLES 105 LIST OF FIGURES 108

- 103 -
B1. INTRODUCTION During the field inspections of Landslide No. 1, splatter marks and some remnants of landslide debris were observed reaching heights of 5.5 m on trees located on the flanks within the mid-portion of the debris trail (Figure B1). A survey was carried out on 29 and 30 March 2006 to record the maximum height of the splatter mark/landslide debris as evident on the trees along the debris trail, the findings of which are summarised in Table B1. The aim of the survey was to obtain field estimates of the possible transport mechanisms, mobility and superelevation of the landslide debris as it banked around a curve in the drainage line within the mid-portion of the landslide trail (viz. Chainages 95 to 228). B2. FINDINGS The maximum heights of the splatter mark recorded on the trees, as measured relative to the existing ground level, were used to determine the angle of superelevation at various points along the runout trail. An estimate of the debris velocity was then determined based on these values, with the results summarised in Table B2. The velocity calculations were performed in accordance with the equations proposed by Johnson & Rodine (1984) as follows: For channels with gradients >15° to the horizontal: ŵ = [g × Ψ cos δ tan β]1/2
For channels with gradients <15° to the horizontal: ŵ = [g × Ψ tan β]1/2 where: ŵ = mean velocity δ = gradient of the channel g = acceleration due to gravity β = angle of superelevation Ψ = radius of curvature Based on the field measurements, the velocity of the debris flow at Chainage 117.5 may have been about 7.4 m/s, where the debris entered and followed the pre-existing incised drainage line. The velocity of the debris flow may then have reduced between Chainages 117.5 and 142 from about 7.4 m/s to 5.5 m/s, where the debris spread out and the direction of travel changed, together with a gentler gradient of the drainage line. Between Chainages 142 and 213, the velocity of the debris flow might not have varied significantly (between 6.1 m/s and 4.9 m/s). However, the generally broad and only partially constrained debris trail will mean that the superelevation measurements may be less representative of actual velocities than would be the case if the debris trail was well-channelised. Several sets of analysis were carried out to test a variety of debris parameters and volume of deposition along the debris trail in order to obtain reasonable correlations with the calculated velocities, runout pattern and final debris distribution based on field observations (see Appendix C).

- 104 -
B3. REFERENCES Johnson, A.M., and Rodine, J.R. (1984). Debris flow, in Brunsden, D. and Prior, D.B. (eds.),
Slope Instability, John Wiley & Sons Ltd. pp. 257-361.

- 105 -
LIST OF TABLES Table No.
Page No.
B1 Summary of Debris Height Survey
106
B2 Summary of Angle of Superelevation along Mid-portion of Debris Trail (Chainages 95 to 228)
107

- 106 -
Table B1 - Summary of Debris Height Survey
Tree Reference No.
Approx. Chainage (m)
Debris Height (m)
Splatter Mark Height (m)
Max. Indentation on Tree (mm)
T001 95 3.00 3.50 8 T002 96 2.00 3.00 5 T003 115 2.75 3.25 N/A T004 115 2.20 3.10 5 T005 118 1.65 2.00 ≤2 T006 117.5 2.15 3.40 10 T007 123 0.80 2.00 4 T008 123 1.50 2.95 10 T009 128 1.65 2.30 5 T010 132 1.00 1.65 ≤2 T011 138 1.50 1.92 10 T012 138 2.10 2.70 20 T013 142 1.05 N/A 5 T014 160 1.20 1.55 ≤2 T015 149.5 1.20 2.30 15 T016 155 1.75 3.25 N/A T017 155 2.60 3.60 18 T018 160 3.20 N/A 10 T019 175 No debris height/splatter mark on the tree T020 170 3.10 N/A 5 T021 182 3.20 N/A 5 T022 185 2.80 N/A 10 T023 187 0.80 N/A 12 T024 187.5 1.15 2.50 5 T025 195 1.50 2.00 N/A T026 201 2.10 N/A 25 T027 213 1.10 N/A N/A T028 205 1.95 2.95 10 T029 217 1.80 N/A 10 T030 213 2.60 3.40 12 T031 213 2.05 3.05 8 T032 201 1.45 2.45 5 T033 192 1.70 N/A 12 T034 187.5 2.20 4.45 30 T035 182 1.35 1.70 N/A T036 168 1.90 N/A ≤2 T037 149.5 1.25 2.15 N/A T038 142 2.03 N/A 8 T039 133 3.50 4.50 N/A T040 127 1.45 2.65 ≤2 T041 125 1.30 N/A ≤2 T042 117.5 2.10 N/A ≤2
Notes: (1) N/A denotes no indentation on tree. (2) Highlighted rows indicate those values adopted for determination of debris
superelevation and are considered to be more reliable results.

- 107 -
Table B2 - Summary of Angle of Superelevation along Mid-portion of Debris Trail (Chainages 95 to 228)
Chainage (m)
Width of Channel
(m)
Gradient of Channel
(deg)
Angle of Superelevation
Determined from Splatter Marks (deg)
Radius of Curvature along
Centreline of Trail (m)
Estimated Velocity
(m/s)
CH117.5 30 10 3.7 85 7.4
CH142 41 10 3.5 50 5.5
CH149.5 41 12 3.4 63.3 6.1
CH187.5 18 30 4.9 43 5.6
CH201 15 30 2.5 86 5.6
CH213 15.5 30 1.8 86 4.9
Note: Velocity estimates are based on the method proposed by Johnson & Rodine (1984).

- 108 -
LIST OF FIGURES
Figure No.
Page No.
B1 Location Plan of Trees Surveyed for Debris Height and Splatter Mark
109

- 109 -
Legend:
Note: Base plan is extracted from 1:1000 survey sheets Nos. 11NE-8A and 11NE-8B dated March 2004.
Figure B1 - Location Plan of Trees Surveyed for Debris Height and Splatter Mark

- 110 -
APPENDIX C
THEORETICAL DEBRIS MOBILITY ANALYSIS

- 111 -
CONTENTS Page No. Title Page 110 CONTENTS 111 C1. GENERAL 112 C2. THE MODEL 112 C3. REFERENCES 113 LIST OF TABLES 114 LIST OF FIGURES 116

- 112 -
C1. GENERAL The landslide was back-analysed using the GEO’s computer program DMM. The program simulates the motion of landslide debris as a continuum after detachment using a finite difference solution of the governing dynamic equation in a Lagrangian framework. The flow behaviour of the debris is governed by the rheology of the material. The program models the debris front as a single pulse. Two rheologies, the frictional and Voellmy models, are available in this program. As suggested in Lo (2000), the friction flow and Voellmy flow models were used in this analysis to represent the open hillside and the channelised debris flow phases of the runout respectively. C2. THE MODEL The geometry of the debris trail was determined from topographic map and post-failure field observations. The geometry of the surface of rupture and the ground profile is based on field observations and information from the ground investigation. The location along the debris trail is referenced with respect to the horizontal chainage line as shown in Drawing No. 1. The mass balance profile shown in Figure 8 together with the observed debris deposition pattern indicate that the debris flow was largely of open-hillside type with much deposition taking place along the entire length of the debris path. Several analyses were carried out to test a range of debris parameters and obtain reasonable correlations with runout distance, debris distribution and velocity along the runout trail. The best-fit parameters determined through this back analysis are summarised in Table C1. The debris, with few boulders, was well disintegrated and appeared to be saturated and remoulded from the source area onwards, which favours a model that includes some turbulence. The debris is also very fine, which favours partially undrained behaviour under dynamic loading. Although the debris was slightly topographically confined below the WSD access road, it is not considered that channelisation was a major factor (but see below regarding the possible combined effects of fine debris and weak channelisation). The DMM model gave reasonable correlations with the field estimates of debris thickness, debris distribution, runout and velocity when an apparent friction angle (φa) of 16° is assumed with turbulence varying from ‘negligible’ (i.e. ξ = 10,000 m/s2) at the source area to ‘high’ (i.e. ξ = 500 m/s2) along the debris path. An apparent friction angle of 16° corresponds to a drained friction angle of about 30° if ru = 0.5 is assumed (where ru is defined as the pore pressure ratio). The weak channelisation in combination with the fine and poorly draining nature of the debris was probably responsible for the intermediate nature of the best-fit parameters which lie between those which have been previously used to model coarse, open-hillside flows (φ ~20° to 23° with negligible to slight turbulence) and wet, channelised debris flows (φ ~6° to 11° with high turbulence). The velocity profile generated by the debris mobility analyses (Figures C1 and C2) indicates that the debris flow front probably moved with a velocity of between 11 m/s and 12 m/s within the upper debris trail (between the source area and just below the access road at

- 113 -
about Chainage 120). The velocity probably reduced gradually from about 12 m/s to 3 m/s as the debris travelled along the gentler slope gradient between Chainages 120 and 195. Near Chainage 200, i.e. on the approach to Fei Ngo Shan Road, the terrain steepens and the model indicates that the velocity increased slightly to about 5 m/s as the debris flow travelled over the natural hillside before reaching Pak Fa Lam Road where it came to a halt. Based on the debris mobility model, the estimated duration from the initiation of the failure to the final deposition of materials at the debris front was about 55 seconds. The model can provide a ‘best-fit’ for the debris flow event using an intermediate parameter between open-hillside failure and channelised debris flow. This appears to be primarily due to the generally broad, open hillside nature of the debris path which was only weakly channelised in a few places (channelisation ratio between 5 and 20) and the generally low angle of the debris path between Chainages 90 and 200 which resulted in most of the debris being deposited within this section. Although the correlations of the modelled debris velocity with velocities estimated from superelevation of debris marks observed in the field are not particularly close (Figure C1), it is considered that the generally broad and only partially constrained debris trail will mean that the superelevation measurements may be less representative of the actual velocities than would be the case if the debris trail were well channelised. C3. REFERENCES Ayotte, D. & Hungr, O. (1998). Runout Analysis of Debris Flow and Debris Avalanches in
Hong Kong. University of British Columbia, Report prepare for the Geotechnical Engineering Office, Civil Engineering Department, Government of the Hong Kong SAR, 90 p.
Hungr, O. (1998). Mobility of Landslide Debris in Hong Kong: Pilot Back Analysis using a
Numerical Model. O. Hungr Geotechnical Research Inc. Geotechnical Engineering Office (2004). User Manual for Computer Program “DMM” -
Debris Mobility Model (Spreadsheet Version 1.0). Geotechnical Engineering Office, Civil Engineering and Development Department, Government of the Hong Kong SAR, 28 p. plus 2 appendices.
Lo, D.O.K. (2000). Review of Natural Terrain Landslide Debris-resisting Barrier Design.
Geotechnical Engineering Office, Civil Engineering Department, Government of the Hong Kong SAR, 91 p (GEO Report No. 104).

- 114 -
LIST OF TABLES Table No.
Page No.
C1 Parameters Determined for Theoretical Debris Mobility Analysis
115

- 115 -
Table C1 - Parameters Determined for Theoretical Debris Mobility Analysis
Chainage (m) Model Type Apparent Friction Angle (deg)
Turbulence Coefficient (m/s²)
0-60 Effectively Friction 16 10,000
60-300 Voellmy 16 500

- 116 -
LIST OF FIGURES
Figure No.
Page No.
C1 Debris Velocity and Slope Profile versus Horizontal Chainage
117
C2 Maximum Landslide Velocity versus Time
118

- 117 -
Legend:
Figure C1 - Debris Velocity and Slope Profile versus Horizontal Chainage

- 118 -
Figure C2 - Maximum Landslide Velocity versus Time

- 119 -
DMM Input and output

- 120 -

- 121 -

- 122 -

- 123 -
LIST OF DRAWINGS Drawing No.
1 Detailed Mapping of the 21 August 2005 Landslides on the Natural Hillside near Fei Ngo Shan Service Reservoir


GEO PUBLICATIONS AND ORDERING INFORMATION 土力工程處刊物及訂購資料土力工程處刊物及訂購資料土力工程處刊物及訂購資料土力工程處刊物及訂購資料
A selected list of major GEO publications is given in the next page. An up-to-date full list of GEO publications can be found at the CEDD Website http://www.cedd.gov.hk on the Internet under “Publications”. Abstracts for the documents can also be found at the same website. Technical Guidance Notes are published on the CEDD Website from time to time to provide updates to GEO publications prior to their next revision.
部份土力工程處的主要刊物目錄刊載於下頁。而詳盡及最新的
土力工程處刊物目錄,則登載於土木工程拓展署的互聯網網頁
http://www.cedd.gov.hk 的“刊物”版面之內。刊物的摘要及更新
刊物內容的工程技術指引,亦可在這個網址找到。
Copies of GEO publications (except maps and other publications which are free of charge) can be purchased either by:
讀者可採用以下方法購買土力工程處刊物讀者可採用以下方法購買土力工程處刊物讀者可採用以下方法購買土力工程處刊物讀者可採用以下方法購買土力工程處刊物((((地質圖及免費刊物地質圖及免費刊物地質圖及免費刊物地質圖及免費刊物
除外除外除外除外):):):):
writing to Publications Sales Section, Information Services Department, Room 402, 4th Floor, Murray Building, Garden Road, Central, Hong Kong. Fax: (852) 2598 7482
書面訂購
香港中環花園道
美利大廈4樓402室
政府新聞處
刊物銷售組
傳真: (852) 2598 7482
or 或 − Calling the Publications Sales Section of Information Services
Department (ISD) at (852) 2537 1910 − Visiting the online Government Bookstore at
http:// www.bookstore.gov.hk − Downloading the order form from the ISD website at
http://www.isd.gov.hk and submit the order online or by fax to (852) 2523 7195
− Placing order with ISD by e-mail at [email protected]
− 致電政府新聞處刊物銷售小組訂購 (電話:(852) 2537 1910)
− 進入網上「政府書店」選購,網址為
http://www.bookstore.gov.hk − 透過政府新聞處的網站 (http://www.isd.gov.hk) 於網上遞
交訂購表格,或將表格傳真至刊物銷售小組 (傳真:(852)
2523 7195)
− 以電郵方式訂購 (電郵地址:[email protected])
1:100 000, 1:20 000 and 1:5 000 maps can be purchased from:
讀者可於下列地點購買1:100 000,1:20 000及1:5 000地質圖:
Map Publications Centre/HK, Survey & Mapping Office, Lands Department, 23th Floor, North Point Government Offices, 333 Java Road, North Point, Hong Kong. Tel: 2231 3187 Fax: (852) 2116 0774
香港北角渣華道333號
北角政府合署23樓
地政總署測繪處
電話: 2231 3187
傳真: (852) 2116 0774
Requests for copies of Geological Survey Sheet Reports, publications and maps which are free of charge should be sent to:
如欲如欲如欲如欲索取地質調查報告索取地質調查報告索取地質調查報告索取地質調查報告、、、、其他免費刊物及地質圖其他免費刊物及地質圖其他免費刊物及地質圖其他免費刊物及地質圖,,,,請致函請致函請致函請致函::::
For Geological Survey Sheet Reports and maps which are free of charge: Chief Geotechnical Engineer/Planning, (Attn: Hong Kong Geological Survey Section) Geotechnical Engineering Office, Civil Engineering and Development Department, Civil Engineering and Development Building, 101 Princess Margaret Road, Homantin, Kowloon, Hong Kong. Tel: (852) 2762 5380 Fax: (852) 2714 0247 E-mail: [email protected]
地質調查報告及地質圖:
香港九龍何文田公主道101號
土木工程拓展署大樓
土木工程拓展署
土力工程處
規劃部總土力工程師
(請交:香港地質調查組)
電話: (852) 2762 5380
傳真: (852) 2714 0247
電子郵件: [email protected]
For other publications which are free of charge: Chief Geotechnical Engineer/Standards and Testing, Geotechnical Engineering Office, Civil Engineering and Development Department, Civil Engineering and Development Building, 101 Princess Margaret Road, Homantin, Kowloon, Hong Kong. Tel: (852) 2762 5346 Fax: (852) 2714 0275 E-mail: [email protected]
其他免費刊物:
香港九龍何文田公主道101號
土木工程拓展署大樓
土木工程拓展署
土力工程處
標準及測試部總土力工程師
電話: (852) 2762 5346
傳真: (852) 2714 0275
電子郵件: [email protected]

MAJOR GEOTECHNICAL ENGINEERING OFFICE PUBLICATIONS 土力工程處之主要刊物土力工程處之主要刊物土力工程處之主要刊物土力工程處之主要刊物
GEOTECHNICAL MANUALS
Geotechnical Manual for Slopes, 2nd Edition (1984), 300 p. (English Version), (Reprinted, 2000).
斜坡岩土工程手冊(1998),308頁(1984年英文版的中文譯本)。
Highway Slope Manual (2000), 114 p. GEOGUIDES
Geoguide 1 Guide to Retaining Wall Design, 2nd Edition (1993), 258 p. (Reprinted, 2007).
Geoguide 2 Guide to Site Investigation (1987), 359 p. (Reprinted, 2000).
Geoguide 3 Guide to Rock and Soil Descriptions (1988), 186 p. (Reprinted, 2000).
Geoguide 4 Guide to Cavern Engineering (1992), 148 p. (Reprinted, 1998).
Geoguide 5 Guide to Slope Maintenance, 3rd Edition (2003), 132 p. (English Version).
岩土指南第五冊 斜坡維修指南,第三版(2003),120頁(中文版)。
Geoguide 6 Guide to Reinforced Fill Structure and Slope Design (2002), 236 p.
Geoguide 7 Guide to Soil Nail Design and Construction (2008), 97 p. GEOSPECS
Geospec 1 Model Specification for Prestressed Ground Anchors, 2nd Edition (1989), 164 p. (Reprinted, 1997).
Geospec 3 Model Specification for Soil Testing (2001), 340 p. GEO PUBLICATIONS
GCO Publication No. 1/90
Review of Design Methods for Excavations (1990), 187 p. (Reprinted, 2002).
GEO Publication No. 1/93
Review of Granular and Geotextile Filters (1993), 141 p.
GEO Publication No. 1/2000
Technical Guidelines on Landscape Treatment and Bio-engineering for Man-made Slopes and Retaining Walls (2000), 146 p.
GEO Publication No. 1/2006
Foundation Design and Construction (2006), 376 p.
GEO Publication No. 1/2007
Engineering Geological Practice in Hong Kong (2007), 278 p.
GEOLOGICAL PUBLICATIONS
The Quaternary Geology of Hong Kong, by J.A. Fyfe, R. Shaw, S.D.G. Campbell, K.W. Lai & P.A. Kirk (2000), 210 p. plus 6 maps.
The Pre-Quaternary Geology of Hong Kong, by R.J. Sewell, S.D.G. Campbell, C.J.N. Fletcher, K.W. Lai & P.A. Kirk (2000), 181 p. plus 4 maps. TECHNICAL GUIDANCE NOTES
TGN 1 Technical Guidance Documents