detecting gnss attacks on smartphoneskth.diva-portal.org/smash/get/diva2:678010/fulltext01.pdf ·...
TRANSCRIPT

Detecting GNSS Attacks onSmartphones
A method for detecting attack on GPS signals in Android phones
JALIL SHOKOUH
Master’s Degree ProjectStockholm, Sweden July 2013
XR-EE-LCN 2013:013


A B S T R A C T
There has been a significant growth in Location-Based Services (LBS) on mo-bile applications. These applications provide service to users based on theirgeographical locations. Emergency services, tracking, navigation, advertisingand social networking are examples of them. As the majority of today’s mobilephones are equipped with GPS receivers, GPS positioning has become one ofthe primary methods for obtaining users’ location. Moreover, GPS providesaccurate time service and many applications specially for time synchroniza-tion are relying on GPS. Despite the good accuracy it provides, security is notconsidered from scratch in civilian GPS and its signals are weak, vulnerable tospoofing and prone to jamming. As it has become a more and more valuableresource, malicious agents have also become keener to identify and abuse theweaknesses in order to interrupt users or commit fraud. That is why therehave been continuous alerts about insecurity in civilian GPS in scholarly andacademic publications. A considerable amount of research has been conductedto tackle the problem of insecurity in GPS, but proposed solutions need eitherfundamental changes in GPS signal structure or more sophisticated types ofreceivers. As changes in GPS signal structure need time, money and politicalwill, this work works on a method to detect spoofing of GPS signals based onthe current GPS signal structure and receivers on mobile phones. We cross-check positioning and time information by comparing it with other sourcesof information. GPS positioning data are compared with the user’s positionderived from Wi-Fi positioning and cell positioning and the distance betweenthose is shown to the user. The system also keeps the recent distances and ifthose positions are moving away from each other, it notifies the user about thissuspicious behaviour. Regarding verification of the GPS time, it is comparedwith a time server on the internet. An Android application was designed anddeveloped to implement this method. Then experimental evaluations wereperformed in the urban area of the city of Stockholm. Results show that thesystem can perform positioning with mean value of 50 meter accuracy anddetect simulated spoofing attack. Moreover, it detects the suspicious behaviourif the calculated position and GPS position are gradually moving away fromeach other.
Keywords: GNSS, GPS security, Wi-Fi positioning, Cell positioning, Android
i


A C K N O W L E D G E M E N T S
This is a master’s thesis work that has been conducted in the period of autumn2012 till spring of 2013 under the supervision of professor Panos Papadimitratosin Lab of Communication Networks at KTH, school of Electrical Engineering. Iwant to thank my supervisor for all his support during all the phases of thiswork from the very beginning until the conclusion of the project.
iii

C O N T E N T S
1 Introduction 11.1 Problem Definition . . . . . . . . . . . . . . . . . . . . . . . . . . . 21.2 Contribution . . . . . . . . . . . . . . . . . . . . . . . . . . . . . . . 31.3 Method . . . . . . . . . . . . . . . . . . . . . . . . . . . . . . . . . . 3
1.3.1 Research strategy . . . . . . . . . . . . . . . . . . . . . . . . 41.4 Equipment . . . . . . . . . . . . . . . . . . . . . . . . . . . . . . . . 41.5 Limitations . . . . . . . . . . . . . . . . . . . . . . . . . . . . . . . . 51.6 Thesis Outline . . . . . . . . . . . . . . . . . . . . . . . . . . . . . . 5
2 Background 72.1 History of positioning . . . . . . . . . . . . . . . . . . . . . . . . . 72.2 Global Navigation Satellite System (GNSS) . . . . . . . . . . . . . 72.3 Global Positioning System (GPS) . . . . . . . . . . . . . . . . . . . 102.4 Differential GPS (DGPS) . . . . . . . . . . . . . . . . . . . . . . . . 112.5 Assisted GPS (AGPS) . . . . . . . . . . . . . . . . . . . . . . . . . . 11
3 Related work 133.1 GPS security . . . . . . . . . . . . . . . . . . . . . . . . . . . . . . . 133.2 Positioning . . . . . . . . . . . . . . . . . . . . . . . . . . . . . . . . 14
4 Implementation 174.1 Overview of android applications . . . . . . . . . . . . . . . . . . 17
4.1.1 Android platform . . . . . . . . . . . . . . . . . . . . . . . . 174.1.2 Android Application Architecture . . . . . . . . . . . . . . 194.1.3 Preparing development environment . . . . . . . . . . . . 204.1.4 Database in Android . . . . . . . . . . . . . . . . . . . . . . 21
4.2 System components . . . . . . . . . . . . . . . . . . . . . . . . . . . 214.2.1 Positioning resource . . . . . . . . . . . . . . . . . . . . . . 224.2.2 LocationAPI . . . . . . . . . . . . . . . . . . . . . . . . . . . 224.2.3 Positioning Manager . . . . . . . . . . . . . . . . . . . . . . 27
4.3 Perform Positioning . . . . . . . . . . . . . . . . . . . . . . . . . . . 274.4 Reporting to the user . . . . . . . . . . . . . . . . . . . . . . . . . . 324.5 Checking GPS time . . . . . . . . . . . . . . . . . . . . . . . . . . . 354.6 Preparing for test and evaluation . . . . . . . . . . . . . . . . . . . 36
iv

5 Evaluation 375.1 Evaluation Methodology . . . . . . . . . . . . . . . . . . . . . . . . 375.2 Positioning subsystem evaluation . . . . . . . . . . . . . . . . . . . 38
5.2.1 Offline provider . . . . . . . . . . . . . . . . . . . . . . . . . 385.2.2 OpenCellID . . . . . . . . . . . . . . . . . . . . . . . . . . . 405.2.3 Combain . . . . . . . . . . . . . . . . . . . . . . . . . . . . . 415.2.4 Combination of providers . . . . . . . . . . . . . . . . . . . 41
5.3 GPS position verification subsystem . . . . . . . . . . . . . . . . . 435.4 GPS time check subsystem . . . . . . . . . . . . . . . . . . . . . . . 46
6 Conclusion and Discussion 516.1 Future Work . . . . . . . . . . . . . . . . . . . . . . . . . . . . . . . 51
Bibliography 53
A Appendix 57
B Appendix 61
C Appendix 63
v
L I S T O F F I G U R E S
2.1 Galileo infrastructure. Illustration from [33] . . . . . . . . . . . . . 9
4.1 Android software stack. Picture from android.com . . . . . . . . 184.2 “com.secureGPS.providers.LocationProviders” package . . . . . . 224.3 “cellPositions” table . . . . . . . . . . . . . . . . . . . . . . . . . . . 244.4 Application in learning mode . . . . . . . . . . . . . . . . . . . . . 254.5 “WifiMeasure” table . . . . . . . . . . . . . . . . . . . . . . . . . . 254.6 “CellMeasure” table . . . . . . . . . . . . . . . . . . . . . . . . . . 264.7 Detecting measures by the system . . . . . . . . . . . . . . . . . . 264.8 classes in “come.secureGPS.database” package . . . . . . . . . . . 274.9 System architecture . . . . . . . . . . . . . . . . . . . . . . . . . . . 284.10 Main activity (UI) . . . . . . . . . . . . . . . . . . . . . . . . . . . . 294.11 Positioning process for one round . . . . . . . . . . . . . . . . . . 304.12 Google map activity . . . . . . . . . . . . . . . . . . . . . . . . . . 314.13 Scatter plot and correlation value . . . . . . . . . . . . . . . . . . . 334.14 Validating the GPS time . . . . . . . . . . . . . . . . . . . . . . . . 36
5.1 Distances to GPS position for offline provider . . . . . . . . . . . 395.2 Distances to GPS position for OpenCellID provider . . . . . . . . 405.3 Distances to GPS position for combain provider . . . . . . . . . . 415.4 Distances to GPS position for offline and combain providers . . . 425.5 Correlation coefficient value calculated by system and MATLAB 445.6 Least Square Regression Line before detecting deviation . . . . . 465.7 Least Square Regression Line in time of detecting deviation . . . 475.8 Least Square Regression Line when the system returns to normal
state . . . . . . . . . . . . . . . . . . . . . . . . . . . . . . . . . . . . 485.9 Difference between GPS time and server time . . . . . . . . . . . . 49
C.1 The path that the experiment was carried out . . . . . . . . . . . . 64C.2 Positioning elements for every 15 cycles of checking . . . . . . . . 65C.3 System positioning near T-Centralen metro station . . . . . . . . . 66C.4 System positioning near Bantorget park, Stockholm . . . . . . . . 67C.5 System positioning near Odenplan T-bana, Stockholm . . . . . . 67C.6 System positioning near Vasaparken, Stockholm . . . . . . . . . . 68
vi

L I S T O F TA B L E S
5.1 Evaluation of location providers . . . . . . . . . . . . . . . . . . . 43
vii

A C R O N Y M S
GPS Global Positioning System . . . . . . . . . . . . . . . . . . . . . 1
LBS Location-Based Service . . . . . . . . . . . . . . . . . . . . . . . . 1
VC Vehicular Communication . . . . . . . . . . . . . . . . . . . . . 1
DoT Department of Transportation . . . . . . . . . . . . . . . . . 1
NMA Navigation Message Authentication . . . . . . . . . . . 2
CNAV Civil Navigation . . . . . . . . . . . . . . . . . . . . . . . . . . . . . . . 2
AP Access Point . . . . . . . . . . . . . . . . . . . . . . . . . . . . . . . . . . . 3
IS Information Systems . . . . . . . . . . . . . . . . . . . . . . . . . . 3
SDK Software Development Kit . . . . . . . . . . . . . . . . . . . . . 4
ADT Android Development Tool . . . . . . . . . . . . . . . . . . . . 4
IDE Integerated Development Environment . . . . . . . . 4
GNSS Global Navigation Satellite Systems . . . . . . . . . . . 5
DoD Department of Defense . . . . . . . . . . . . . . . . . . . . . . . . 7
QZSS Quasi-Zenith Satellite System. . . . . . . . . . . . . . . . . .9
IRNSS Indian Regional Navigational Satellite System . 9
GEO Geostationary Earth Orbit . . . . . . . . . . . . . . . . . . . . . 9
ToT Time of Transmission. . . . . . . . . . . . . . . . . . . . . . . . . 10
DGPS Differential GPS . . . . . . . . . . . . . . . . . . . . . . . . . . . . . . 11
SPS Standard Positioning Service . . . . . . . . . . . . . . . . . 10
PPS Precise Positioning Service . . . . . . . . . . . . . . . . . . . 10
C/A Coarse Acquisition . . . . . . . . . . . . . . . . . . . . . . . . . . . 10
SA Selective Availability . . . . . . . . . . . . . . . . . . . . . . . . . 10
SD Selective Denial . . . . . . . . . . . . . . . . . . . . . . . . . . . . . . 10
TTFF Time to First Fix . . . . . . . . . . . . . . . . . . . . . . . . . . . . . . 11
AGPS Assisted GPS . . . . . . . . . . . . . . . . . . . . . . . . . . . . . . . . . 11
VSD Vestigial Signal Defence . . . . . . . . . . . . . . . . . . . . . . 13
TDoA Time Difference of Arrival . . . . . . . . . . . . . . . . . . . . 14
ToA Time of Arrival . . . . . . . . . . . . . . . . . . . . . . . . . . . . . . . 14
ix

AoA Angle of Arrival . . . . . . . . . . . . . . . . . . . . . . . . . . . . . . 14
GUI Graphical User Interface . . . . . . . . . . . . . . . . . . . . . 19
ANR Application Not Responding . . . . . . . . . . . . . . . . . 19
MNC Mobile Network Code . . . . . . . . . . . . . . . . . . . . . . . . 24
MCC Mobile Country Code . . . . . . . . . . . . . . . . . . . . . . . . 24
LAC Location Area Code . . . . . . . . . . . . . . . . . . . . . . . . . . 24
MNC Mobile Network Code . . . . . . . . . . . . . . . . . . . . . . . . 24
SSID Service Set Identification . . . . . . . . . . . . . . . . . . . . . 25
BSSID Basic Service Set Identification . . . . . . . . . . . . . . . 25
RSSI Received Signal Strength Indicator . . . . . . . . . . . 25
DAO Data Access Object . . . . . . . . . . . . . . . . . . . . . . . . . . . 27
IQR Interquartile Range . . . . . . . . . . . . . . . . . . . . . . . . . . . 29
NTP Network Time Protocol . . . . . . . . . . . . . . . . . . . . . . . 35
x

1
1 I N T R O D U C T I O N
There has been a significant growth in using mobile applications in recentyears [31, 32]. Some of them use Location-Based Service (LBS) as a basis for theirfunctionality to provide service to the user based on mobile phone geographicallocation. Emergency services, advertising, fleet management systems and socialnetworking are examples of such applications. Moreover, mobile embeddedunits in Vehicular Communication (VC) systems provide service to the usersbased on positioning information. Global Positioning System (GPS) is one of themethods to acquire location of mobile device. Receiver on the mobile phonereceives data from the GPS satellites and it finds the current position of the user.The GPS signals provide a positioning service with relatively good accuracy,but security is not considered from scratch in civilian GPS [20]. As we have theexperience of personal computers and the internet, at the beginning of suchtechnologies the majority of users were not concerned about security. PCs wereused without antivirus and firewall and internet communications were mostlyin plain text format. As the computers and internet have become inseparablefrom everyday life, having antivirus and firewall on computers and usingsecure forms of communications over the internet is no longer an option but anecessity. Similarly, nowadays, many activities ranging from leisure and culturalactivities to businesses and telecommunications, particularly in terms of timesynchronization, are becoming profoundly dependent on GPS. We have seenfrom the internet experience, the more valuable a resource becomes for people,the keener the malicious agents will be to identify and abuse the weaknessesof that resource, aiming to interrupt users or commit fraud. Having a lookat the research in the field of GPS security, one can recognize the continuousalerts about insecurity in civilian GPS. The report published by US Departmentof Transportation (DoT) in 2001 confirms the weaknesses of civil GPS and itsvulnerability to spoofing [40, 42]. Much research has been conducted to addressthis vulnerability. While some of them need changes in GPS signals structure,there are some methods that strive to do so without need for such changes[25–27]. Nevertheless, GNSSs still do not provide a ready to use civilian protectionservice. Therefore, finding the vulnerabilities of GPS and mitigating them is amust. It goes without saying that secure positioning is one of the challenges inmobile applications as people increasingly rely on it.
2 PROBLEM DEFINITION 1.1
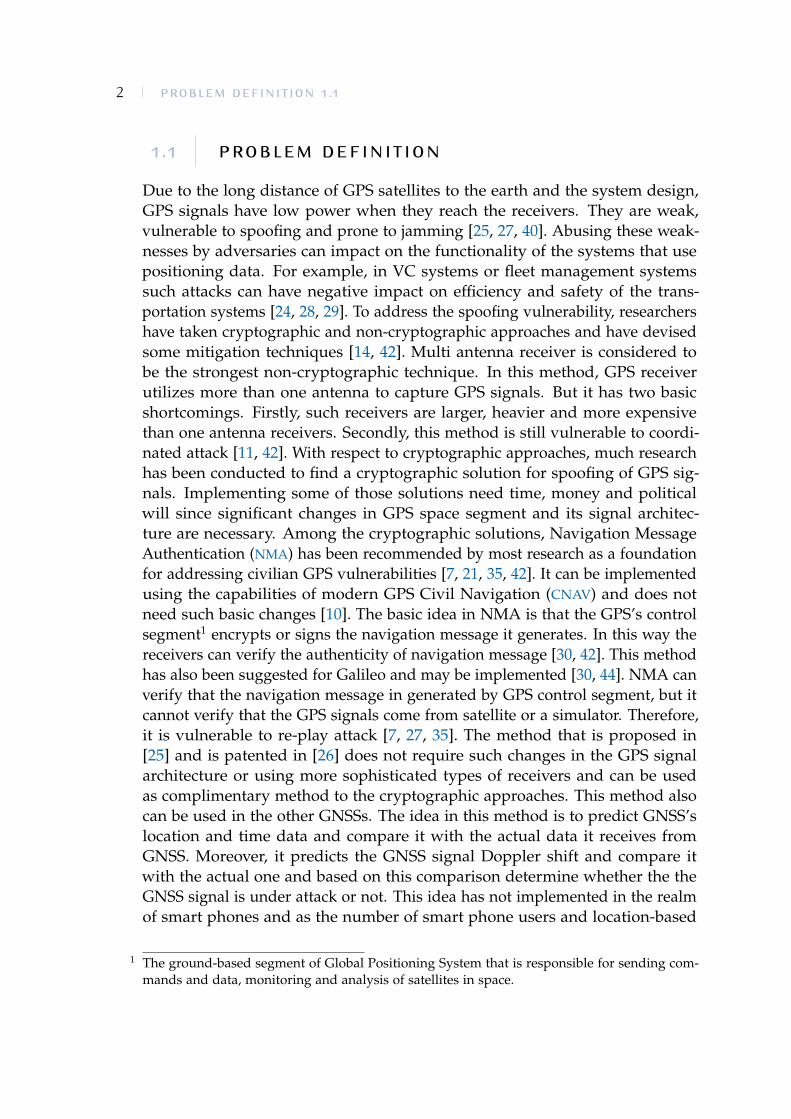
1.1 PROBLEM DEFINITIONDue to the long distance of GPS satellites to the earth and the system design,GPS signals have low power when they reach the receivers. They are weak,vulnerable to spoofing and prone to jamming [25, 27, 40]. Abusing these weak-nesses by adversaries can impact on the functionality of the systems that usepositioning data. For example, in VC systems or fleet management systemssuch attacks can have negative impact on efficiency and safety of the trans-portation systems [24, 28, 29]. To address the spoofing vulnerability, researchershave taken cryptographic and non-cryptographic approaches and have devisedsome mitigation techniques [14, 42]. Multi antenna receiver is considered tobe the strongest non-cryptographic technique. In this method, GPS receiverutilizes more than one antenna to capture GPS signals. But it has two basicshortcomings. Firstly, such receivers are larger, heavier and more expensivethan one antenna receivers. Secondly, this method is still vulnerable to coordi-nated attack [11, 42]. With respect to cryptographic approaches, much researchhas been conducted to find a cryptographic solution for spoofing of GPS sig-nals. Implementing some of those solutions need time, money and politicalwill since significant changes in GPS space segment and its signal architec-ture are necessary. Among the cryptographic solutions, Navigation MessageAuthentication (NMA) has been recommended by most research as a foundationfor addressing civilian GPS vulnerabilities [7, 21, 35, 42]. It can be implementedusing the capabilities of modern GPS Civil Navigation (CNAV) and does notneed such basic changes [10]. The basic idea in NMA is that the GPS’s controlsegment1 encrypts or signs the navigation message it generates. In this way thereceivers can verify the authenticity of navigation message [30, 42]. This methodhas also been suggested for Galileo and may be implemented [30, 44]. NMA canverify that the navigation message in generated by GPS control segment, but itcannot verify that the GPS signals come from satellite or a simulator. Therefore,it is vulnerable to re-play attack [7, 27, 35]. The method that is proposed in[25] and is patented in [26] does not require such changes in the GPS signalarchitecture or using more sophisticated types of receivers and can be usedas complimentary method to the cryptographic approaches. This method alsocan be used in the other GNSSs. The idea in this method is to predict GNSS’slocation and time data and compare it with the actual data it receives fromGNSS. Moreover, it predicts the GNSS signal Doppler shift and compare itwith the actual one and based on this comparison determine whether the theGNSS signal is under attack or not. This idea has not implemented in the realmof smart phones and as the number of smart phone users and location-based
1 The ground-based segment of Global Positioning System that is responsible for sending com-mands and data, monitoring and analysis of satellites in space.
1.2 CONTRIBUTION 3
applications are increasing, this gap has to be bridged.
1.2 CONTRIBUTIONThis work is going to work out a method to detect attacks on GPS signals,without any change in GPS signal structure or GPS receiver on mobile phones,based on the works of [25, 27]. GPS signals are mainly used for two purposes.Firstly, to determine the location of user, and secondly, to obtain the currenttime. One way to verify the correctness of positioning and time information isto compare it with other sources of information. In mobile phones, positioningdata can be compared to the location of the nearby base stations and Wi-FiAccess Point (AP). Based on the location of base stations and Wi-Fi APs, it ispossible to perform positioning and calculate the user’s location. Then, the usercan verify the correctness of GPS positioning data by comparing this calculatedposition and the GPS position. The other issue is verifying GPS time data. Toaddress this issue, time servers on the internet is utilized to obtain precisetime. Comparing it with the time received from the GPS signals, one canverify the correctness of time information. This work is going to determine thefeasibility of this method, and also, develop an android application to performthis verification. This platform was chosen because of its popularity as it has50% of market share [15].
1.3 METHODThis is a study in the realm of Information Systems (IS) and undertakes todevelop a method to detect spoofing attack on GPS signals in a mobile phone.With respect to research paradigms in this field, this work follows the design-science paradigm. Most of the research that follows this paradigm is going tomeet people’s needs and expand their capabilities by developing a new artefact[8, 13]. It is a problem solving approach that firstly identifies the problem andthen develops and evaluates an artefact to solve this problem [8]. As mentionedin section 1.1 the problem here is that the proposed methods for addressingGPS signals vulnerabilities are not applicable to current GPS signals structure.Moreover, if the required changes applied to GPS signal architecture and GPSreceivers; those methods are still vulnerable to other forms of attacks. Therefore,the current methods do not solve the problem of insecurity in GPS.

4 EQUIPMENT 1.4
1.3.1 Research strategy
Johannesson and Perjons in their book A Design Science Primer propose a five-stepmethod to accomplish design science projects. The first step is to explicatethe problem be able to precisely understand it. The next step is to outlineartefact and define its requirements based on the understanding achieved inthe previous step. The artefact in this work is a system that detects spoofingattack on GPS signals received on mobile phone. Regarding the requirements, ithas to calculate user’s position based on nearby base stations and Wi-Fi accesspoints and compute the distance between user’s position and GPS position.Moreover, it has to detect if this distance gradually increases in the recentmovements of the user. Checking the authenticity of GPS time is anotherrequirement. The third step is to design and develop the artefact. In this stepbased on the defined requirements, the system is designed and implementedas an Android application. Part of the system design has a mathematical basis.This type of system design facilitates performing quantitative analysis in theevaluation part [8]. Chapter 4 provides detailed explanation of the design andimplementation of the system. Artefact demonstration is the forth step in thismethod. Having the system designed and developed, the author prepared astable version of system and demonstrated it to the supervisor. The fifth andlast step is evaluating the artefact. There are several methodologies available forevaluating the artefact, namely: observational, analytical, experimental, testingand descriptive [8]. Among them, experimental evaluation suits this research.In this methodology the artefact is evaluated in a controlled environment orusing simulation with artificial data [8]. The author conducts several real-worldexperiments which were designed based on the requirements defined in step2. The artefact was evaluated with respect to base-station positioning andWi-Fi positioning, detecting suspicious behaviour and checking the authenticityof GPS time. During these experiments the system states are logged. Thenquantitative analysis was performed on the gathered data. The positioning partis evaluated in terms of functionality and accuracy. In addition, functionality ofother two requirements is evaluated.
1.4 EQUIPMENTThe application was developed for Android platform and Android SoftwareDevelopment Kit (SDK) for Android 4.0.x was used. Regarding the developmentenvironment Juno version of Eclipse Integerated Development Environment(IDE) in combination with Eclipse Android Development Tool (ADT) plug in wasutilized. In addition, to accomplish this work some online resources were used.Combain and OpenCellID databases of base stations position and Wi-Fi access

1.5 LIMITATIONS 5
points were used since this application needs the position of base stations andWi-Fi AP that the mobile phone connects to. Moreover, to accomplish this worksome hardware were utilized including a GPS-enabled HTC Desire S smartphone for testing and evaluating the application.
1.5 LIMITATIONSAs this work sought to detect spoofing attacks, there is a need to perform thisattack in the test and evaluation phase. This needs GPS spoofing hardware andsoftware, but such device is not available for test and evaluation.The outcomeof spoofing attack is that the GPS receiver returns a position that is not theactual position of user. Therefore, turning off GPS receiver on the mobilephone was the method I chose to emulate spoofing attack. In this way, it showsthe last position it calculated before turning off the GPS which is differentfrom the actual position if the user moves. The other limitation is processingpower and memory capacity of smart phones. In this way, the performance ofthe design and algorithms must be taken into account in system design andimplementation.
1.6 THESIS OUTLINEThe rest of this paper comes as following. The background chapter provides thehistory of positioning systems. Then evolution of Global Navigation SatelliteSystems (GNSS) will be reviewed. Since this work focus on security in GPS,a detail review of GPS architecture and security issues will come. Then, inseparate chapters, the implementation of the system and evaluation of it willcome. At the end, conclusion and discussion will be provided.

7
2 B A C KG R O U N D
2.1 HISTORY OF POSITIONINGFrom the dawn of civilization people have been trying to somehow determinetheir geographical position. The pioneer surveyors in ancient cultures wereastronomers. The stars’ placement was used by them as the foundation forposition calculations. Growth in knowledge of mathematics had a significantcontribution to surveying and triangulation technique became one of mostcrucial means of finding coordinates in distances of thousands of kilometres [9].Progress in technology and launching satellites to the space in mid-twentiethcentury was a turning point in surveying. The idea of satellite navigationemerged as a result of these developments. This method of navigation isobtaining position and velocity which are the required parameters for navigationfrom the signals broadcasted by satellites [17]. Guier and Weiffenbachstate intheir article [6] explain the evolution of Transit navigation system which was thefoundation of current navigation systems. This system consisted of multiplepolar orbiting satellites that propagate signals in two ultra-stable frequencies.These signals carry the orbit parameters of the satellite, and a receiver decodesthese parameters and calculates the position [6].
2.2 GLOBAL NAVIGATION SATELLITE SYSTEM (GNSS)GNSS is a navigation satellite system that globally gives navigation service toits users. In general these systems are composed of three segments. The firstone is the space segment which is a constellation of satellites in the space thattransmit radio-signals to earth. The difference among navigation systems is thenumber of signals that they transmit and the frequency of those signals. Thesecond segment is ground control center which is responsible for managementand maintaining satellites in space, and the third one is the user segment whichuses a receiver to receive the signal and determine his location [17].
There are only two operational GNSSs in the world which are GPS andGLONASS. Both systems provide round the clock service to infinite numberof users everywhere in the world [17]. GPS is a US own satellite navigationsystem, and the US Department of Defense (DoD) in cooperation with some

8 GLOBAL NAVIGATION SATELLITE SYSTEM (GNSS) 2.2
other state entities are responsible for its maintenance. The space segment waslaunched in 1980s and it became operational in 1990s [37]. More informationabout the GPS is coming in section 2.3. GLONASS is the Russian versionof global navigation satellite system. The project is from the Soviet era butcollapse of Soviet Union on the one hand and economic problems of Russianfederation on the other hand postponed the full operation of the project. Finally,it became fully operational with the orbital constellation of 24 satellites in 2011.Regarding the type of signals they transmit, GPS uses only one pair of signalsfor all satellites and therefore the signal frequencies that all satellites radiateare identical, but in GLONASS system each satellite transmits one pair ofsignals with frequencies that are unique to that satellite. Therefore, the satelliteseparation principle is different. In GPS case each satellite is assigned with aunique code while in GLONASS the signal sender is identified using signalfrequency. As a result the, the signal receiving section in GLONASS receivers ismore complicated than GPS one [17]. Primarily, both systems were developedfor military purposes, but both governments opened part of the signals withlower accuracy for civilian and commercial applications.
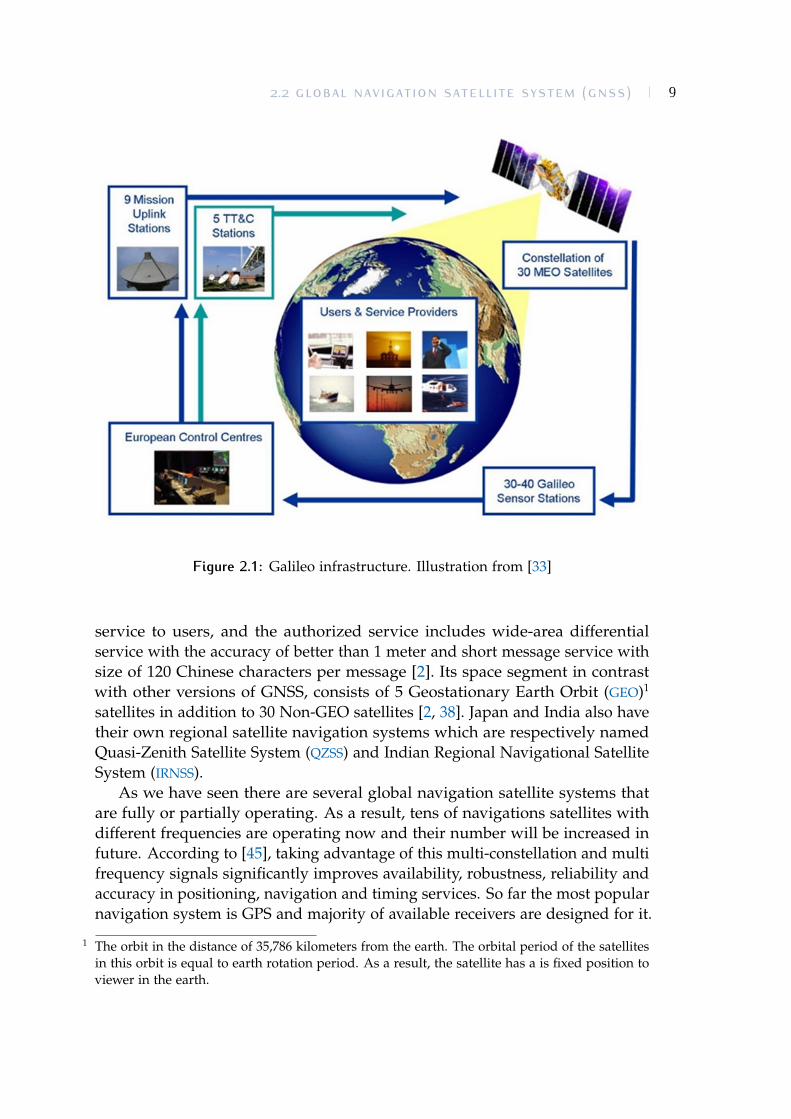
Apart from these operational systems, there are other ongoing attempts fordeveloping and implementing other GNSSs despite the availability of service forunlimited number of users around the globe. Part of the reason is dependencyon foreign nations’ military infrastructure [18]. Therefore European Uniondecided to develop its own GNSS for only civilian applications. The projectis named Galileo and it consists of four phases. Definition and developmentphases have been done and it is in the beginning of deployment phase. Basedon the information on European Commission official website, until the timeof writing this article, four satellites have been launched [34]. The exploitationphase is planned to be accomplished by 2020 [33]. Galileo is going to providebetter precision and availability to its users due to higher number of satellitesin view (six to eight in most places) compared to GPS. Moreover, it is going toprovide better coverage of northern Europe and in general in higher latitudedue to satellites’ placement and inclination [33]. As shown in figure 2.1, thewhole system will consist of a constellation of 30 satellites, 30-40 sensor station,three ground control centers, nine mission uplink station and five telemetry,tracking and command (TT&C) stations [34].
The Chinese have also planned to enter the realm of Global NavigationSatellite Systems and build their own GNSS. The project is called COMPASSand it is expansion of former Chinese regional navigation system, BeiDou [39].The project is in phase II and covering the area of Asia-Pacific and expectedto have global coverage at the end of phase III in 2020 [2, 38]. COMPASS isnot only a navigation system, but it also provides communication and timingservice to its users [23]. The system is designed to provide both open service andauthorized service. Open service includes free positioning, timing and velocity
2.2 GLOBAL NAVIGATION SATELLITE SYSTEM (GNSS) 9
Figure 2.1: Galileo infrastructure. Illustration from [33]
service to users, and the authorized service includes wide-area differentialservice with the accuracy of better than 1 meter and short message service withsize of 120 Chinese characters per message [2]. Its space segment in contrastwith other versions of GNSS, consists of 5 Geostationary Earth Orbit (GEO)1
satellites in addition to 30 Non-GEO satellites [2, 38]. Japan and India also havetheir own regional satellite navigation systems which are respectively namedQuasi-Zenith Satellite System (QZSS) and Indian Regional Navigational SatelliteSystem (IRNSS).
As we have seen there are several global navigation satellite systems thatare fully or partially operating. As a result, tens of navigations satellites withdifferent frequencies are operating now and their number will be increased infuture. According to [45], taking advantage of this multi-constellation and multifrequency signals significantly improves availability, robustness, reliability andaccuracy in positioning, navigation and timing services. So far the most popularnavigation system is GPS and majority of available receivers are designed for it.
1 The orbit in the distance of 35,786 kilometers from the earth. The orbital period of the satellitesin this orbit is equal to earth rotation period. As a result, the satellite has a is fixed position toviewer in the earth.
10 GLOBAL POSITIONING SYSTEM (GPS) 2.3
The next section provides a brief overview of GPS.
2.3 GLOBAL POSITIONING SYSTEM (GPS)As mentioned in previous section, GPS is owned by the United States andinitially designed and developed for military use. In early 1960s the idea ofhaving an accurate navigation system with pinpoint accuracy emerged. Beforethat, the US Navy had designed and developed transit system for submarineand ship navigation but the system was very slow. US Air force has alsodesigned its own navigation system which was faster and more accurate andable to determine altitude in addition to latitude and longitude. To decrease themilitary spending, US Department of Defense decided to concentrate on designand development of a navigation system for all military branches. The resultof these efforts was NAVSTAR Global Positioning System which then namedGPS. The system uses atomic clock that provides very good time accuracy tothe users. Launch of constellation of GPS satellites was finished in 1989 [37]. Ayear later, there was a real test for GPS in Persian Gulf War and it showed thecapabilities and performance of the system[23].
Each GPS signal has a Time of Transmission (ToT) from GPS satellite to GPSreceiver. The receiver measures this time and then calculates its distance fromthe satellite since the signals propagates in speed of light. GPS satellites encodenavigation data such as orbital parameters, time stamp, correction data andother related information into signals which is decoded by the receiver usingmathematical algorithms [16, 20]. GPS signals are encoded in two types of codesnamely Standard Positioning Service (SPS) code and Precise Positioning Service(PPS) or P code. The first type is also known as Coarse Acquisition (C/A) codewhich is available signal for GPS civilian use [9, 17]. Having this informationin combination with distance from at least three satellites, GPS receiver candetermine two-dimensional position [17]. Moreover, signal from four satellites isrequired for three-dimensional position determination [17]. GPS had the featureof Selective Availability (SA) which artificially reduces the accuracy of C/Asignals for civilian users [9, 23]. The accuracy can be increased to 5-10 meters ifthis feature is turned off. In May 2000, the US government announced turningoff the SA, and from the day after civilian GPS users have had access to signalwithout artificial accuracy degrading. The US military started to use SelectiveDenial (SD) instead. This option restricts the GPS availability for unauthorizedaccess in a specific region using ground jammers [9].
In the current design, GPS satellites orbit around the earth in 6 orbital planeswith 4 satellites in each plane. Therefore, GPS has a constellation of 24 satellitesin space. In addition, there are some spare satellites that can be activated in
2.4 DIFFERENTIAL GPS (DGPS) 11
case of operational satellite failure. There are underway programs for launchingnew generations of satellites that provide one more civilian signal in additionto current signals [23].
2.4 DIFFERENTIAL GPS (DGPS)Degrading of GPS accuracy using SA resulted in development of DifferentialGPS (DGPS) solutions to improve positioning accuracy. Despite the SA turningoff in early 2000, evolution of such systems continued to eliminate GPS inherenterrors and consequently achieve a better positioning and navigation accuracy.The principles of DGPS are based on utilizing more than one receiver. Thesystem consists of four components. First component is a set of one or morefixed reference receiver(s) with their accurate position(s) being known. Thesecond one is the rover receiver whose position is going to be calculatedaccurately. The third component is monitoring and control system, and thefourth one is the dedicated data link between the control system and the roverreceiver. Each reference receiver has a GPS receiver and calculates its positionusing GPS signals and sends it to monitoring and control system. Controlsystem receives the calculated position from reference receivers and comparesthem with the known positions of reference receivers. Based on this comparison,it determines the correction vector. Then depending on the system architecture,it either sends the correction vector to the rover receiver through dedicated datalink or receives calculated position from the rover receiver. In the first scenario,the position correction is done by the rover receiver itself while in the secondscenario, monitoring and control system does that. There are several methodsfor differential position correction, but their explanation is beyond the scope ofthis work.
2.5 ASSISTED GPS (AGPS)Assisted GPS (AGPS) is one of the technologies that improves GPS usabilityespecially in the realm of mobile phone networks [46]. AGPS helps receiversto find the accurate position faster by using the data received from mobilenetwork. Providing ephemeris data to the phone by base stations is one ofthe techniques in this method since the mobile network link is faster than thesatellite link. Using this information, AGPS no longer performs the signal searchspace section of positioning procedures. In this way the number of frequenciesthat the GPS receiver must search to determine the satellites in view is reduced.Therefore, this method results in a shorter Time to First Fix (TTFF).There is a
12 ASSISTED GPS (AGPS) 2.5
closer integration between mobile phones and some CDMA networks sincetime reference is obtained from GPS in their wireless communications. Thereare two types of positioning in these networks. The first type is called mobilestation based positioning since the final position is calculated on the mobiledevice while in the second type, the mobile station sends data to a server on thenetwork and this server calculates the final positions and sends back the finalposition to mobile station. The second type is called mobile station assistedpositioning [46]. Another benefit of using AGPS is positional accuracy. Userswho use stand-alone GPS can determine the position with errors up to severalmeters even under open sky conditions [12]. On the other hand, AGPS providesan accuracy of less than one meter.

13
3 R E L AT E D W O R K
There has been research in the field of detecting spoofing attack on GPS signals.These works can be classified in two categories: cryptographic methods andnon-cryptographic ones. Moreover, as performing positioning is the basis forthis method, part of the related works falls into these areas. In this chapterpositioning techniques using Wi-Fi, mobile base stations and other wirelesssignals such as Bluetooth and Infrared will be briefly reviewed.
3.1 GPS SECURITYWith regard to non-cryptographic approach several methods have been pro-posed. Vestigial Signal Defence (VSD) is one of the methods for detectingspoofing attack with a non-cryptographic approach. In each spoofing attemptthe authentic GPS signal must be somehow suppressed by the spoofing device.In this technique a software program tries to distinguish the authentic GPSsignal from the spoofed one and in this way detect the spoofing attack [43].Another non-cryptographic method is multi antenna receivers. In this method,GPS receiver uses several antennas to capture GPS signals from different direc-tions since spoofing devices sends signals normally in one direction. While it isconsidered to be the strongest non-cryptographic approach, it has two majorshortcomings. Firstly, such receivers are large, heavy and relatively expensive,and secondly, this technique is vulnerable to coordinated spoofing attacks [11,42].
While non-cryptographic solutions mostly focus on the receiver’s side, cryp-tographic solutions focus on the satellite’s side. One of those is Spread SpectrumSecurity Codes [35] which is going to be deployed on GPS Block III satellites, butsince the design has been adapting GPS Block III satellites this technique takesseveral years [43]. Another method is NMA. Signing the navigation message bythe control segment is the basis for this technique. In this way the receiver canverify that this message is generated by the Control segment. The drawback ofthis technique is that the receiver cannot determine whether the signal comesfrom the satellite or the spoofing device. Therefore, it is vulnerable to replayattack [7, 35].
There is a complimentary method to the cryptographic methods. It is

14 POSITIONING 3.2
proposed in [25] and [26]. In this method, the term normal mode is defined as theperiod of time in which there is no attack on GNSS signals. The receiver gathersspecific data in this normal mode, and then, it predicts the value of the data inthe future. These values are location information, receiver’s clock and Dopplershift of received GNSS signals. Detecting attack on GNSS signals is achievedby comparing the predicted values and the values received from GNSS. If thedifference is greater than a threshold then the GNSS signal is under attack.Predicting the location is done using Kalman filtering as well as inertial sensorslike altimeters, speedometer and odometer. This location is independent fromthe location obtained from GNSS. Regarding the clock reading, it is obtainedfrom receiver device internal clock. It should be note that the clock is notresynchronized with any other external sources like GNSS signals. In this way,the predicted time based on this clock is compared to the time received fromGNSS. With respect to the Doppler shift, as the GNSS satellites are moving inthe space in their orbital plane, they have a relative motion to the receiver. Itis the source of GNSS signal Doppler shift. The frequency of receiving signalschanges depends on the movement direction of the satellite. As the receivercan calculates the satellite’s velocity and it has the orbital model, the receivingfrequency can be calculated. It is done using Doppler equation. Similar tothe two other parameter, the predicted Doppler shift and the receiving one iscompared and if the difference exceeds a threshold, the receiving signal countedas a fake signal.
3.2 POSITIONINGMuch research has been conducted aiming to utilize wireless signals for po-sitioning purposes. The Active Badge was one of the earliest systems of thiscategory using Infrared signals. It provides service for indoor areas. Individualscarried a badge that sends IR signals periodically every 10 seconds. Receiversinstalled in known locations in the building receive this signal, and in this way,the system locates the person who has this badge [41]. RADAR is another effortaiming at indoor positioning by installing access points in defined locations in abuilding [1]. While these methods provide indoor positioning services, severalmethods have been proposed for outdoor positioning.
While an indoor positioning system includes installing some access pointsin predefined locations, the outdoor one utilizes the access points that wereinstalled by others. It includes Wi-Fi access points and mobile base stations.Therefore, more accurate positioning can be achieved in urban areas that havea higher density of those access points. Proposed methods in these fields usedifferent techniques; for base station based localization, Angle of Arrival (AoA),
3.2 POSITIONING 15
Time of Arrival (ToA) and Time Difference of Arrival (TDoA). Moreover, havingknown the position of neighbouring base stations, one can perform triangulationor trilateration (or multilateration) to calculate the position of the mobile phone.While triangulation requires installing directional antennas to determine theangle between North and the line that connects the locations of mobile phoneand the base station, trilateration seems to be a more feasible technique since itdoes not need that kind of antennas [3]. For Wi-Fi positioning, if the locationof Wi-Fi access points is not available, saving the fingerprints of nearby Wi-Fiaccess points is one of the techniques that can be used. This fingerprint includesthe available APs and their signal strength in given position [3]. The numberof saved fingerprints and its structure depends on the level of accuracy that isgoing to be achieved.


17
4 I M P L E M E N TAT I O N
Our implemention is an Android application. Android is an operating systemfor mobile devices and its design is based on Linux operating system [19].
4.1 OVERVIEW OF ANDROID APPLICATIONSSince the last decade applications on mobile platform have emerged and
became ubiquitous. In 2010 the number of smartphones that were purchasedexceeded the number of PCs [32]. Some factors have contributed to this pop-ularity. One of those is improvement in network coverage and bandwidthservices by telecom companies. Another contributing factor is the emergenceof new generation mobile platforms. Among these platforms, Android hasbecome widely popular and has 50% of market share [15]. As a result, a largenumber of application developers working on developing Android applicationsand have developed nearly five million applications [15]. This section gives anunderstanding of the Android platform in general as well as the features thatwere used in this project in detail.
4.1.1 Android platform
Android is an operating system based on Linux kernel for mobile devices suchas smartphones, tablets, E-reader devices, etc. [19]. Android was the entry ofGoogle in the realm of mobile devices. This operating system was not developedfrom scratch by Google, but it was firstly owned by Android Inc. a company inthe US. Google bought Android Inc. and it took two years until the first stableversion of Android released in 2008. The operating system is open source andwas released under Apache License [19]. Its source code is freely available andevery one can download it. Hence, vendors can customize it and add somefeatures. But regardless of these customizations, developers develop their ownapplications for Android and it runs on all Android devices. That is one of themain advantages of Android.
Android utilizes a Linux kernel as the base of the operating system. Itsarchitecture is in the form of a software stack in which different layers togetherprovide functionality for the mobile device. Figure 4.1 shows this stack and

18 OVERVIEW OF ANDROID APPLICATIONS 4.1
Figure 4.1: Android software stack. Picture from android.com
the different layers inside it. As shown in this figure, Linux kernel is located atthe very bottom of this stack. This layer is in contact with the device hardware.In this way any access to hardware components such as GPS, camera, Blue-tooth, etc. is handled through this layer. Above the Linux kernel, Middlewarelayers are located which include Libraries, Android Runtime and ApplicationFramework. These layers provide the main features of Android. Ordinary An-droid applications are mostly written in Java programming language and runon a specialized virtual machine. Android Runtime contains the componentsneeded for running these applications. It comprises core Java libraries thatis used in time of running the applications. Moreover, the specialized virtualmachine which is called Dalvik is included in Android Runtime. This virtualmachine has a special design to be used in Android OS and runs the appswith consideration of mobile devices’ limitations such as low CPU and Memorycapability. In addition to Java core libraries, Android provides a set of librariesthat is used in application development. For example, SQLite library helpsdevelopers to implement applications that utilize relational databases. Storingand retrieving the data from the database is one of the features of this projectand this library was used for the implementation of this part. There is a layer

4.1 OVERVIEW OF ANDROID APPLICATIONS 19
on top of these libraries that consists of some higher level components aimingto expose Androids’ features to programmers. This layer is called ApplicationFramework. The applications layer is located on top of this layer and includesuser installed applications as well as some pre-installed applications on thedevice such as the browser, contacts, voice dial, etc. Developers use the compo-nents in middleware layers to develop their applications. The next two sectionsprovides an explanation of an Android application’s architecture as well aspreparing development environment for developing Android applications.
4.1.2 Android Application Architecture
Each Android application consists of several components that together forman application. These components are activity, service, content providers andbroadcast receivers. Depending on the requirements, developers use some orall of these components in their applications. As with many applications inother operations systems, Android applications have to have a user interface tointeract with users. The application’s Graphical User Interface (GUI) in Androidis called Activity. The responsibility of an activity is to show the system statusto the user as well as getting input data from him. An application can have oneor more activities. An example of an activity in Android OS is the contact pagethat shows contacts’ information to the user or allows the user to edit a specificcontact.
It is possible that part of an application does not need interaction with theuser. Android provides the capability for developers to use a component whichis called service and to run that part of application as a service. Services alsogive developers the ability to provide functionality for other applications. Eachservice is run on the application’s main process. In every application there maybe some time-consuming operations. This happens as result of I/O or networkcommunications or performing the tasks that need huge computations. TheAndroid platform prevents running the applications that are not adequatelyresponsive. In such cases Android stops the application and shows ApplicationNot Responding (ANR) dialog. To avoid such situations, developers can useAndroid services but they have to spawn a new thread and run the serviceon this newly created thread. Android provides a fruitful solution usingAsyncTask class which not only runs the task in a separate thread but it alsoprovides easy access to the application’s main thread for performing any UIupdate as the background thread finishes its work. Moreover, Android alsoprovides a more sophisticated mechanism for background processes calledIntentService. Depending on the system design that such a service is going toserve one activity or multiple activities or even other applications, developerschoose between these solutions. Developers also can utilize Java concurrent

20 OVERVIEW OF ANDROID APPLICATIONS 4.1
programming facilities and run those time-consuming tasks on separate threadsusing Java Thread class and Runnable interface, but Android recommends usingits solutions.
As an operation system, Android has to notify running applications aboutimportant changes in system status. These conditions can be a change in thetime zone or entering a low-battery state. To do that, it uses a broadcastingmechanism and propagates this message in the system. Applications have toregister broadcast receiver components to be able to receive such messages.Moreover, this mechanism can be used by developers to broadcast messagesand communicate with other applications. User defined services also can sendmessages and light weight results of their operations to other applications orthe activities in the application using this mechanism. Despite fruitfulnessof broadcasting mechanism, there are some efficiency and security concernsregarding this capability. Firstly, managing broadcast operations puts overheadon the system especially if the number of them increases. Secondly, the abilityof receiving other applications’ broadcasts may raise security issues. To improvethe efficiency and alleviate security concerns, Android has defined a type ofbroadcast that is only reachable within the application.
Content provider is the standard way of providing and transmitting datafrom one process or application to other processes or applications. The datacan be on file system or can be retrieved from SQLite database. Each contentprovider acts like a server, encapsulates the data and sends it to receivingrequests. Developers are able to have security in the data using the mechanismsthat content providers provide. The receiving application acts as a client andopens the data to use it. A good example of content providers in Android iscontacts’ information. Other applications can request the contacts stored on thephone and show them to the user. Voice over IP applications use this feature toload the contact from the phone to the application.
It is necessary for every Android application to declare the components ituses in a manifestation file called AndroidManifest.xml. This information is nec-essary for Android OS to be able to run the application and Developers declarethis information in XML format. In addition to the components, applicationdeclares the required permissions for running the application. Some of the APIsthat Android provides is protected and needs permission for access. Examplesof those API are system storages, network connections, Internet access, etc. Thisinformation tells the user that which kinds of actions this application may doprior to installing. Users based on these permissions and the application vendordecides whether to install the application or not.

4.1 OVERVIEW OF ANDROID APPLICATIONS 21
4.1.3 Preparing development environment
For the implementation part, Eclipse IDE together with Android SDK underUbuntu, Linux platform was used. The easiest way to make the developmentenvironment ready is to download Android ADT bundle and extract it toa custom location. This bundle is an Eclipse IDE integrated with AndroidSDK. After that all the necessary packages can be installed using Android SDKmanager. This work uses Android 4.2 and Google API (API 17) as the baselibrary for development. The applications run on a physical HTC phone insteadof an emulator since testing the application needs scanning neighbouring basestations and wireless access points. In order to do that in the Android manifestfile the application is declared as “debuggable”. Moreover, USB debugging onthe phone is enabled.
The next step is to make the phone detectable on Eclipse. In order to make itso, USB configuration rules for HTC phones are added to the file 51-android.rulesin the /etc/udev/rules.d path. This rule for HTC device is:
SUBSYSTEM=="usb", ATTRidVendor=="0bb4", MODE="0666", GROUP="plugdev"
As we can see "0bb4" is the vendor ID for HTC devices, the MODE valuedesignates permissions in accessing the device. In the end, permission for thisfile is changed using the command below:
chmod a+r /etc/udev/rules.d/51-android.rules
Now, the development environment is ready to start the implementation.
4.1.4 Database in Android
As discussed in section 4.1.1, Android provides a set of libraries in its softwarestack that can be used in application development. One of those libraries isSQLite. Developers enjoy the full support of this database by Android and use itto implement applications that interact with relational databases [36]. Simplicityis the main goal of this database and that is why it suits mobile platforms likeAndroid. SQLite do not have a server like other database engines and store allof its data in a file on the disk [4]. Storing and retrieving data from the databaseis part of this project and SQLite database was utilized for that part. Detailedinformation about that can be found in section 4.2.2.

22 SYSTEM COMPONENTS 4.2
4.2 SYSTEM COMPONENTSTo accomplish the implementation part, several lower level components weredesigned and implemented. Prior to the explanation of system design, a de-scription of lower level components is needed. This section provides descriptionof these components.
4.2.1 Positioning resource
As discussed earlier, the basic idea in this work is to check the GPS data withother sources of information. In this work, these sources are called positioningresource which is an entity that helps us to perform positioning. As it is anabstract concept it was defined as a Java interface. In this project there are twoimplementations for this interface: base stations and Wi-Fi access points. Theclass Cell represents a base station and the class Wifi represents a Wi-Fi accesspoint and both of them implement the positioning resource interface. The sourcecode of these entities can be found in Appendix A.
4.2.2 LocationAPI
The objects of Cell and Wifi classes are used to perform positioning. The locationof each positioning resource object is found using another component. Thiscomponent in this work is called LocationAPI. As it is an abstract concept itis defined as a Java interface (See Appendix A). Every implementation of thisinterface returns the position of a given positioning resource. In this interface,getLocation method receives a positioning resource as the argument and returnsthe location of that. Every implementation of this interface acts as a positioningprovider. Three different implementations for this interface have been donenamely Combain, OpenCellID and the offline database. Each of them may supportboth types of positioning resources or just one of them. For each positioningresource which can be a Wi-Fi AP or a mobile base station, the system sends itto the LocationAPI and receives its location. If the API does not support the typeof positioning resource or does not have its location in its database, it sendsback null as return value. All the classes that are related to the LocationAPIare located in the package com.secureGPS.providers.LocationProviders (figure 4.2).The user can enable/disable providers and work only with preferred ones.The class LocationAPIManager is responsible for keeping information aboutavailable providers, their keys and enabling/disabling them. The following isthe description of the location providers I used in this project.

4.2 SYSTEM COMPONENTS 23
Figure 4.2: “com.secureGPS.providers.LocationProviders” package
Combain
Combain is a Swedish company based in Lund and provides positioning serviceto customers. The company has a rich database of base stations and Wi-Fi APslocations, but since it is a commercial database, using the service is not free ofcharge. As it supports both base stations and Wi-Fi APs, I asked them if I canuse their database for this research project and they accepted to give me accessto their database with limited number of queries and one query per second.The LocationAPI interface for this provider is implemented as a Java class namedCombain which includes all the required methods to send a request and retrievethe results as well as the methods that must be overridden as it implements theLocationAPI interface. More information about the company and its services canbe found on their web site http://www.combain.com.
OpencellID
It is an open source project aiming to create a comprehensive database of basestations’ locations around the world. People can use the database for free andalso contribute to it. OpencellID supports only base stations and its databaseis not as rich as Combain’s. It is also online and the system interacts withthem using internet connection. Moreover, OpencellID releases its databasewith the latest update every day in the form of a text file. These data are usedin the next location provider. The LocationAPI interface for this provider isimplemented as a Java class named OpencellID. All the necessary methods tosend a request and retrieve the results as well as the methods that must beoverridden as it implements LocationAPI interface are defined in this class. Moreinformation about OpenCellId and its services can be found on the project website http://www.opencellid.org.

24 SYSTEM COMPONENTS 4.2
Offline provider
Both the location providers that have been described so far are online. Thissystem also utilizes an offline provider using a database that is stored on themobile device. This provider has the capability of detecting and storing newpositioning resources and their positions in the database. As mentioned earlier,OpencellID releases its database in the form of a text file. This informationis used in the offline provider. Since the size of the file is too large, thebase stations that are located in Sweden were extracted from it. Then, toimprove the performance and ease the access to the data, the necessary fieldsfor positioning in the file was converted to a Sqlite database and kept ina table called cellPositions. Figure 4.3 shows the table fields. In this table,the identifications of the base station together with the position of that arerecorded. The identifications are Mobile Country Code (MCC), Mobile NetworkCode (MNC), Location Area Code (LAC) and cellID. The position is inserted inthe data base in the form of latitude and longitude.
Figure 4.3: “cellPositions” table
In addition to this table, the offline provider utilizes a method that enablesit to expand its database and provide positioning service in places that it couldnot provide before. It has a learning capability in the way that can detect nearbybase stations and Wi-Fi access points and store their location in the databaseif there are available and trusted GPS signals. Users can enjoy this capabilityby setting the application to work in the learning mode from the option menu.Figure 4.4 shows the application view in the learning mode. In this mode, itshows current GPS position as well as statistics about the collected data. Whenthe user pushes the starts capture button, information about nearby base-stationsand Wi-Fi access points is captured and added to database. This information isshown at the bottom of the page. This procedure is repeated periodically in thetime intervals that can be set in system setting menu. This mode also providesthe capability for the user to contribute to OpenCellID database by uploadingthe gathered cell data.

4.2 SYSTEM COMPONENTS 25
Figure 4.4: Application in learning mode
For each positioning resource that the system detects, a record comprising itsidentification as well as its position will be created. The position is in the formof latitude and longitude. I term this record measure. Wi-Fi measures and base-stations measures are stored in two different tables in the database respectivelyWifiMeasure and CellMeasure. The figures 4.5 and 4.6 are those tables. The fieldsCellMeasure table is similar to the CellPositions table. The latitude and longitudefields here is the latitude and longitude of the position that the measured iscaptured. In the WifiMeasure table the identifications of the Wi-Fi AP togetherwith the latitude and longitude of the position that the measured is captured arerecirded. The identifications are Service Set Identification (SSID), Basic ServiceSet Identification (BSSID) and Received Signal Strength Indicator (RSSI).
Figure 4.5: “WifiMeasure” table

26 SYSTEM COMPONENTS 4.2
Figure 4.6: “CellMeasure” table
The signals of these positioning resources propagate in an area and availablein all the locations in that area. As a result, for each positioning resource severalmeasures can be inserted to the database. The location of a base-station oraccess point is derived from all the available measures for that positioning re-source. When offline provider receives a request of positioning for a positioningresource, it retrieves all the available measures for that positioning resourceand calculates the mean value of their latitudes as well as their longitudes.These mean values become the latitude and longitude of calculated position forthat positioning resource. Offline provider returns back to this position as itsresponse to the request. Figures 4.7 shows how the system detects the measuresrelated to one positioning resource and calculates its position based on thosemeasures. It goes without saying that the more measures the user captures for
Figure 4.7: Detecting measures by the system
a positioning resource, the better positioning service the offline provider canprovide. But, unlimited number of measures for a positioning resource resultsin a bigger database. This will consequently impact the system performance.Therefore, finding an optimal solution helps to have a good positioning with

4.2 SYSTEM COMPONENTS 27
lower load on the database. Since the range of Wi-Fi signals is limited, itsposition can be identified with few measures. This fact helps to have a policy forstoring Wi-Fi measures in database and prevent the size of the database frombecoming too large. The system stores maximum three measures for a Wi-FiAP and with a minimum distance of 20 meters from each other. The minimumdistance policy prevents the system from storing redundant measures. Withrespect to base stations, as their signal range is up to several hundred metersthere is no limitation for the number of measures but they cannot be closer than50 meters.
Figure 4.8: classes in “come.secureGPS.database” package
The offline provider is implemented using Sqlite database which is widelyused in Android applications that use the database. Moreover, it uses DataAccess Object (DAO) to access the data in the database. The location of API forthis provider is implemented as a Java class named OfflineLocationProvider whichincludes all the required methods for retrieving data from the database as well asthe methods that must be overridden as it implements the LocationAPI interface.In addition, the classes that are used in creating, storing and retrieving data arelocated in com.secureGPS.database package (Figure 4.8). The offline provider usesthese classes to perform its tasks.
4.2.3 Positioning Manager
Major positioning tasks are done by this component. After extracting positionsfrom the location providers, the positioning manager takes the responsibilityof aggregating these positions, removing outliers and calculating the position.This component is defined as a Java interface and an implementation for that isprovided. Each implementation of the positioning manager has to implementalgorithms for aggregating the positions, removing outliers and position calcu-lation based on positioning resources’ positions. The algorithms for performing

28 PERFORM POSITIONING 4.3
these tasks will be explained in upcoming sections.
4.3 PERFORM POSITIONINGHaving known the system components and their functionalities, it is time tounderstand how the system checks the authenticity of GPS signals. The systemarchitecture is shown in figure 4.9. When the user runs the application, the mainactivity appears in the screen (Figure 4.10). The user starts the system operationby clicking the Start checking button. At this time a timer starts and periodicallytriggers the checking process. The system by default runs this service every10 seconds and this time can be changed by user in the system settings. Thechecking process is implemented as an Android IntentService which runs in aseparated thread than the application main thread.
Figure 4.9: System architecture

4.3 PERFORM POSITIONING 29
Figure 4.10: Main activity (UI)
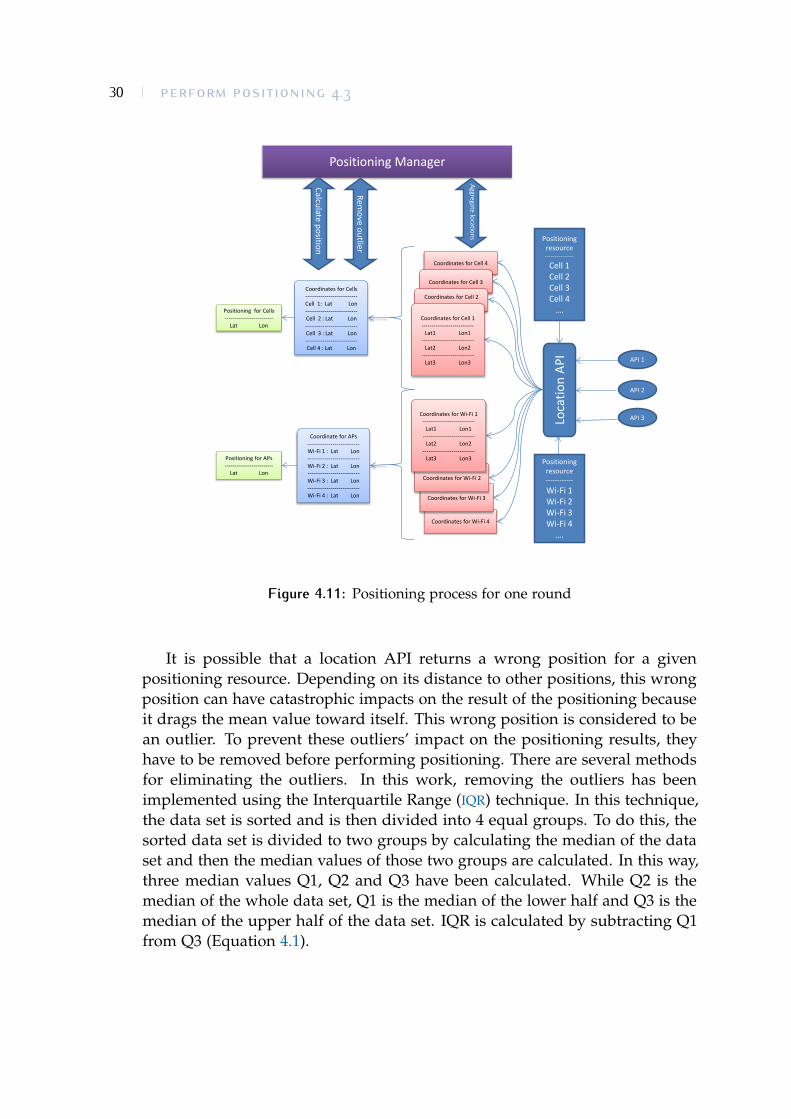
This implementation makes the application UI responsive. This service isimplemented in SpoofCheckService class which extends the IntentService class.In this way each time that timer triggers a cycle of checking, an instance ofSpoofCheckService is created and run, and when its operation finishes its threaddies. After the execution, it broadcasts the result of positioning. To use theresults of this service, a receiver in the main application UI is registered toreceive this data and report it to the user. Therefore, in each cycle a chain ofoperations is launched. Figure 4.11 depicts one round of positioning process inthe IntentService.
Upon triggering the service, it gathers the data about the nearby base stationsand Wi-Fi APs using Android built in APIs. As they are positioning resources,the system extracts their positions from location APIs. The user can selectinvolving location provider(s) in the system setting menu. Since each locationof the API may return a different location for a given positioning resourcethe system keeps the data for each positioning resource in a table and thenaggregates them. These tables are shown in red in figure 4.11. Aggregatingthose positions is the positioning manager’s task. To aggregate the locations,the positioning manager calculates the average of the latitude and longitudeof all available locations for a given positioning resource and fixes the locationfor that positioning resource. The fixed position is kept in another list. Eachtype of positioning resource has its own list of fixed positions. As the systemutilizes two kinds of positioning resources, there are two separate lists of Wi-Filocations and cells locations. These lists are shown in green in figure 4.11.
30 PERFORM POSITIONING 4.3
Loca
tion
API API 1
API 2
API 3
Coordinates for Cell 4
Positioning resource ---------------
Cell 1 Cell 2 Cell 3 Cell 4
….
Positioning resource ------------ Wi-Fi 1 Wi-Fi 2 Wi-Fi 3 Wi-Fi 4
….
Coordinates for Cell 3
Coordinates for Cell 2
Coordinates for Wi-Fi 4
Coordinates for Wi-Fi 3
Coordinates for Wi-Fi 2
Coordinates for Cells --------------------------- Cell 1: Lat Lon --------------------------- Cell 2 : Lat Lon --------------------------- Cell 3 : Lat Lon --------------------------- Cell 4 : Lat Lon
Coordinate for APs --------------------------- Wi-Fi 1 : Lat Lon --------------------------- Wi-Fi 2 : Lat Lon --------------------------- Wi-Fi 3 : Lat Lon --------------------------- Wi-Fi 4 : Lat Lon
Positioning Manager
Remove outlier
Aggregate locations
Calculate position
Coordinates for Wi-Fi 1 ---------------------------
Lat1 Lon1 ---------------------------
Lat2 Lon2 ---------------------------
Lat3 Lon3
Positioning for Cells -------------------------
Lat Lon
Positioning for APs -------------------------
Lat Lon
Coordinates for Cell 1 ---------------------------
Lat1 Lon1 ---------------------------
Lat2 Lon2 ---------------------------
Lat3 Lon3
Figure 4.11: Positioning process for one round
It is possible that a location API returns a wrong position for a givenpositioning resource. Depending on its distance to other positions, this wrongposition can have catastrophic impacts on the result of the positioning becauseit drags the mean value toward itself. This wrong position is considered to bean outlier. To prevent these outliers’ impact on the positioning results, theyhave to be removed before performing positioning. There are several methodsfor eliminating the outliers. In this work, removing the outliers has beenimplemented using the Interquartile Range (IQR) technique. In this technique,the data set is sorted and is then divided into 4 equal groups. To do this, thesorted data set is divided to two groups by calculating the median of the dataset and then the median values of those two groups are calculated. In this way,three median values Q1, Q2 and Q3 have been calculated. While Q2 is themedian of the whole data set, Q1 is the median of the lower half and Q3 is themedian of the upper half of the data set. IQR is calculated by subtracting Q1from Q3 (Equation 4.1).

4.3 PERFORM POSITIONING 31
IQR = Q3−Q1 (4.1)
To determine the outliers an upper bound and a lower bound are set using theinterquartile range (Equations 4.2 and 4.3).
Lowerbound = Q1− 1.5 ∗ (IQR) (4.2)
Upperbound = Q3+ 1.5 ∗ (IQR) (4.3)
For each positioning resource, separate bounds for latitudes and longitudeswere calculated and positions that their latitude or longitude or both of themare outside these boundary values were considered to be outlier and removed.At this stage, two lists of positions that their outliers have been removed areavailable, one for Wi-Fi APs and one for mobile base-stations. Positioningalgorithm applies to these lists.
Wi-Fi access point
Base station
Wi-Fi positioning
Base station positioning
Figure 4.12: Google map activity
Positioning manager performs positioning for each set of the positioningresources and calculates two separate positions for Wi-Fi access points and

32 REPORTING TO THE USER 4.4
base stations. In this work, positioning is done by calculating the mean valueof latitudes and longitudes of the positions in the list. Calculating a separateposition for Wi-Fi APs improves the accuracy. If the Wi-Fi positioning isavailable and it is in a reasonable distance from the base station positioningpoint, the location that is derived from the Wi-Fi positioning will be chosen asthe ultimate result of positioning.
Finishing a cycle of positioning, the Intentservice has to return the resultsand update the UI. In addition to the main application UI (Figure 4.10), the usercan view the system status visually in the Google map activity(Figure 4.12).Since the Intentservice does not know to which activity it has to send the results,it utilizes the Android broadcasting facility and broadcasts the result. On theother side, each activity that is in foreground registers a receiver and capturesthe results. The intent service utilizes the local broadcast manager facility inAndroid platform to do that. It puts two positioning results as well as theposition of the involved positioning resources in a package and broadcaststhem.
This package can be received everywhere in the application that a receiverhas been registered for. When each of the main UI or map activity starts, itregisters a receiver for capturing those packages. Then it unpacks the dataand shows them to the user. All the positioning resources and the calculatedpositions based on cells and Wi-Fi access points are shown in the Google mapactivity of the application. The orange towers are the serving and neighbouringbase stations. Wi-Fi access points and the calculated position for them areshown in blue and the calculated position for base stations is shown in red.
4.4 REPORTING TO THE USERThe main functionality of this system is detecting correctness of the GPS dataand reporting to the user. The user receives two kinds of report regardingGPS positioning from the system. Firstly, its distance to the GPS position byperiodically calculating the user position based on base-station positioning andWi-Fi positioning, and secondly, by detecting the suspicious trends in thosedistances in the recent comparisons. If the system realizes that user’s distanceis increasing during recent cycles of checking, it counts it as a suspicious trend.In the other words the GPS location is moving away from the user position.The user can periodically see the distance to the GPS position on the mainapplication UI in the time interval s/he sets in the application setting. Moreover,the system notifies the user if it finds a suspicious trend.
The first step in finding such suspicious behaviour in the user’s movementsis to calculate the user position and its distance to GPS position. If the Wi-Fi

4.4 REPORTING TO THE USER 33
positioning is available, it will be counted as the user’s position because it ismore accurate than base-station positioning. Otherwise base-station positioningvalue will be the user’s position. Then the distance between the user and theGPS position is calculated using latitude and longitude of those. The systemstores the recent distance values in a list as a window for finding a trend.
The second step is to find a trend in which the user’s distance to theGPS position increases in recent cycles of system checking. To find suchpattern, Pearson product-moment correlation coefficient was used. It finds thecorrelation between the user’s distance from the GPS position and the passageof time. The formula of calculating the correlation coefficient between variablesX and Y is shown in equation 4.4. In this equation Xi and Yi are respectivelythe values of variables X and Y in each sample and n is the number of samples.In addition, X and Y are the means of those variables.
r =
∑ni=1(Xi − X)(Yi − Y)√∑n
i=1(Xi − X)2∑n
i=1(Yi − Y)2
(4.4)
The value of the correlation coefficient is between -1 and 1 including theseboundary values. The positive correlation shows that in the recent periodicalchecking the distance between the GPS position and user position is increasingin overall. The negative correlation shows the opposite. The figure 4.13 showsan example of positive and negative correlation for two imaginary sets of datain the scatter diagram.
Figure 4.13: Scatter plot and correlation value
As we can see, the positive correlation does not necessarily mean that forevery distance its value is greater than the previous one, but there is an overallincrement over the time. Moreover, a line of best fit for the values can be drawnin the diagram. This line can be described in the form of the equation below:

34 REPORTING TO THE USER 4.4
Y = m ∗ X+ b (4.5)
Regression analysis is used to infer this fitting equation from scatter values.This type of analysis employs statistical methods to deduce this equation[5]. In this way, this is sometimes described as regression function and thecorresponding line is called least square regression line. In this equation m isthe slope of regression line and b is the intercept. What is important for us isthe slope of regression line which is the rate of change in the distance variableper second. To calculate the slope we need the standard deviation of X and Y aswell as the correlation value as it shown in equation 4.6.
m = r× σX
σY(4.6)
The standard deviation for variables X and Y are calculated using theseformulas:
σX =
√∑ni=1(Xi − X)2
n(4.7)
σY =
√∑ni=1(Yi − Y)
2
n(4.8)
If the correlation value is near 1 or -1 it will show that the line can beperfectly fitted to the values in the diagram. In other words, the linear equationshown on the diagram can perfectly explain the relationship between time anddistance variables. The correlation value of greater than 0.7 and less than -0.7 isconsidered to be a strong correlation. As the system keeps ten recent distancevalues and the time of its calculation, it can compute the correlation coefficientand the slope of regression line. If it finds a strong positive correlation then thedistance between the GPS position and user position is increasing with the rateof m. This is considered to be a suspicious trend in GPS data.
There may be outliers in the input data. When it comes to least squireanalysis, as it has been known widely, the outliers can significantly impact theresults [5]. Therefore the outliers must be removed prior to applying abovecalculations. The method I chose here was to remove the outliers based on thequartiles and interquartile range. In this method the upper bound and lowerbound for acceptable data are set and each value that is above upper bound orbelow upper bound is considered to be an outlier. This method has also beenused for removing the outliers in positioning resource positions and explainedin detail in section 4.3.
In practice, GPS positioning is not very accurate and over time its valueis changing even if the user doesn’t move. If these changes satisfy the aboveconditions, the system detects it as suspicious behaviour while there actually is

4.5 CHECKING GPS TIME 35
not any suspicious behaviour. To avoid considering these changes as suspicioustrend, a minimum value for the overall change in distance values needs to beset. From the author’s experience in testing the application, the GPS inaccuracyis up to 250 meters. Moreover, the author considers 50 meters inaccuracy forWi-Fi positioning. As a result, the minimum value of the overall change in thedistance variable becomes 300 meters. In cell positioning case, the accuracy isconsidered to be 250 meters, and as a result, the minimum value of the overallchange in the distance variable becomes 500 meters.
The question that should be answered here is how many recent distancevalues should be kept to be able to detect this suspicious trend. The windowsize has to fulfil two requirements. Firstly, the widow has to be in a size thatenough number of distance values is available for the system to be able to findsuch a trend. In other word, the user has to be able to pass at least 300 metersin the time of filling the window. Secondly, large window size effects on thevalue of correlation coefficient and subsequently detection suspicious trend.Therefore, it should not be very large. Regarding the first requirement, the fasterthe user moves, the smaller the window size can meet the first requirement. Asa result, the minimum size in low speeds has to be found. It was decided to setwalking speed as the lowest speed for system functioning. Research shows thatpeople walked an average speed of 1.4 m/s [22]. Therefore, people pass 300meters in approximately 215 seconds. Adding 35 seconds to cover unforeseensituations it becomes 250 second. Therefore, the window size was selected to be25 as checking cycles are performed every 10 seconds.
4.5 CHECKING GPS TIMEGPS signals carry time information in addition to positioning data. This timethe data can be under spoofing attack or may be altered during attack on thepositioning data. To verify the authenticity of the obtained time from the GPS,one can compare it with time servers on the internet. Fortunately, current timedata can be obtained from these servers with a reasonable accuracy. The KTHtime server on ntp1.kth.se was chosen as the time server for this work. Access totime servers in done through Network Time Protocol (NTP) described in RFC1305. There is an implementation for NTP in the Apache’s Commons project ofusing datagram packets which is used in this project. The NTPClient class inthe package com.secureGPS.core uses this implementation to obtain time datafrom KTH time server.
Having obtained the server time, the application receives the time fromthe GPS system (provider) and it compares it with the time server data. Thedifference of maximum 3 seconds between these two sources is accepted as
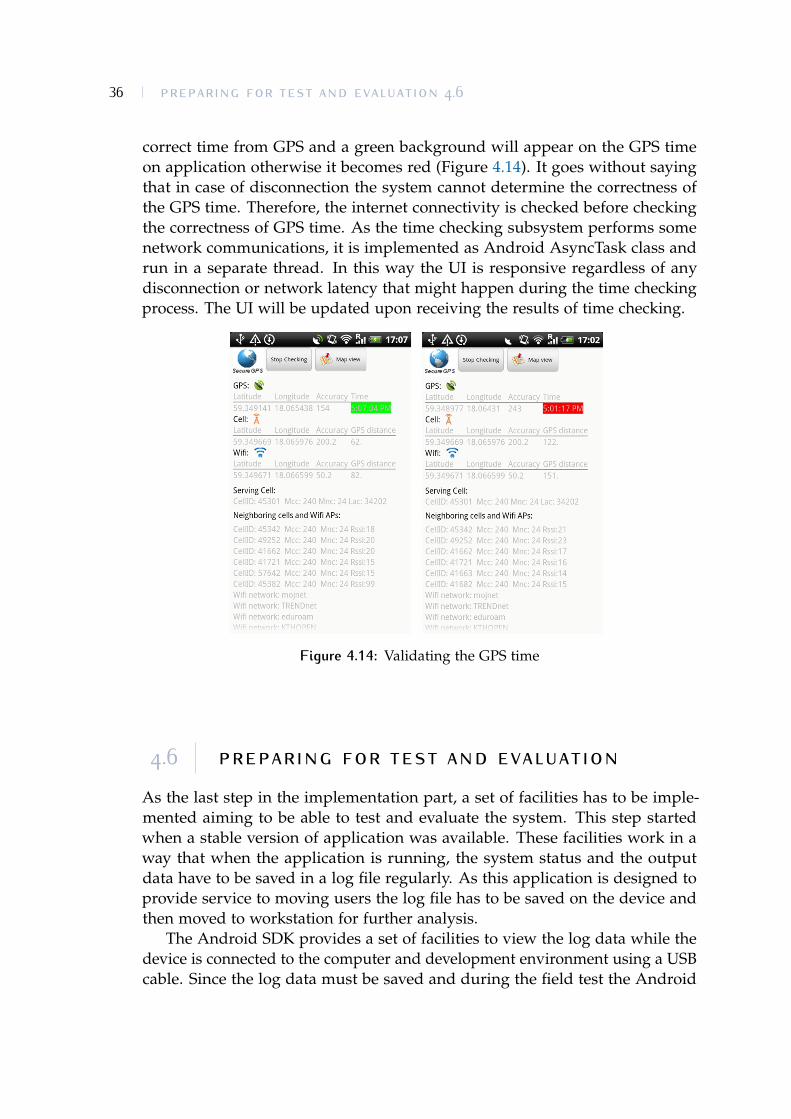
36 PREPARING FOR TEST AND EVALUATION 4.6
correct time from GPS and a green background will appear on the GPS timeon application otherwise it becomes red (Figure 4.14). It goes without sayingthat in case of disconnection the system cannot determine the correctness ofthe GPS time. Therefore, the internet connectivity is checked before checkingthe correctness of GPS time. As the time checking subsystem performs somenetwork communications, it is implemented as Android AsyncTask class andrun in a separate thread. In this way the UI is responsive regardless of anydisconnection or network latency that might happen during the time checkingprocess. The UI will be updated upon receiving the results of time checking.
Figure 4.14: Validating the GPS time
4.6 PREPARING FOR TEST AND EVALUATIONAs the last step in the implementation part, a set of facilities has to be imple-mented aiming to be able to test and evaluate the system. This step startedwhen a stable version of application was available. These facilities work in away that when the application is running, the system status and the outputdata have to be saved in a log file regularly. As this application is designed toprovide service to moving users the log file has to be saved on the device andthen moved to workstation for further analysis.
The Android SDK provides a set of facilities to view the log data while thedevice is connected to the computer and development environment using a USBcable. Since the log data must be saved and during the field test the Android

4.6 PREPARING FOR TEST AND EVALUATION 37
phone is not connected to the computer, the capability of logging data to afile has to be added to the system using a logging framework. Among theseframeworks, Log4j from Apache is widely used for logging purposes in Java.Using this framework in Android is problematic since it uses some classes inJava that are not supported in Android. Android-logging-log4j project providesthe capability of using Log4j in Android development. To log the data thislibrary was used. It inserts the log data into device’s external storage and afterperforming field test this file can be used for further analysis.

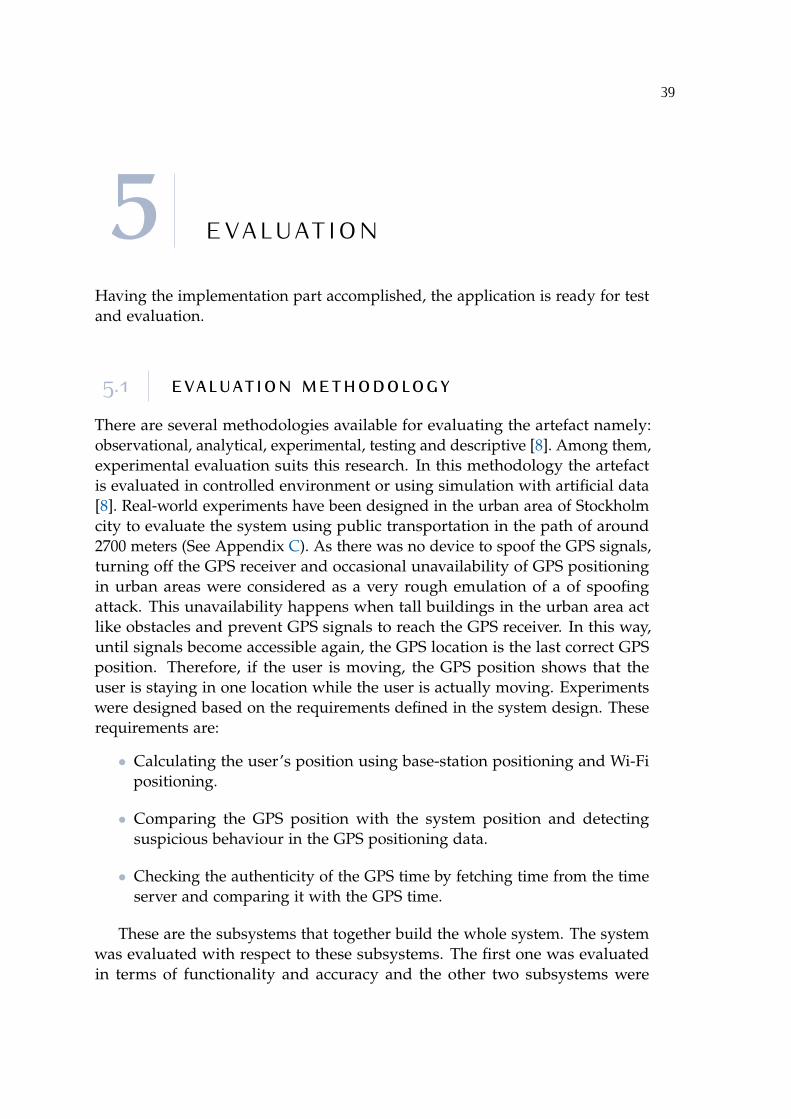
39
5 E VA L U AT I O N
Having the implementation part accomplished, the application is ready for testand evaluation.
5.1 EVALUATION METHODOLOGYThere are several methodologies available for evaluating the artefact namely:observational, analytical, experimental, testing and descriptive [8]. Among them,experimental evaluation suits this research. In this methodology the artefactis evaluated in controlled environment or using simulation with artificial data[8]. Real-world experiments have been designed in the urban area of Stockholmcity to evaluate the system using public transportation in the path of around2700 meters (See Appendix C). As there was no device to spoof the GPS signals,turning off the GPS receiver and occasional unavailability of GPS positioningin urban areas were considered as a very rough emulation of a of spoofingattack. This unavailability happens when tall buildings in the urban area actlike obstacles and prevent GPS signals to reach the GPS receiver. In this way,until signals become accessible again, the GPS location is the last correct GPSposition. Therefore, if the user is moving, the GPS position shows that theuser is staying in one location while the user is actually moving. Experimentswere designed based on the requirements defined in the system design. Theserequirements are:
• Calculating the user’s position using base-station positioning and Wi-Fipositioning.
• Comparing the GPS position with the system position and detectingsuspicious behaviour in the GPS positioning data.
• Checking the authenticity of the GPS time by fetching time from the timeserver and comparing it with the GPS time.
These are the subsystems that together build the whole system. The systemwas evaluated with respect to these subsystems. The first one was evaluatedin terms of functionality and accuracy and the other two subsystems were

40 POSITIONING SUBSYSTEM EVALUATION 5.2
evaluated with respect to functionality. During these experiments the systemstates are logged. Then quantitative analysis was performed on the gathereddata. By checking these subsystems the functionality of the whole system canbe evaluated. The evaluation procedures for each of these systems will bediscussed in detail in the following sections.
5.2 POSITIONING SUBSYSTEM EVALUATIONAs we have seen from the implementation part, the positioning subsystem isthe most complicated subsystem. It is responsible for detecting nearby basestations and Wi-Fi access points, fetching their positions from the set of locationproviders, removing the outliers, aggregating the positions and performingthe positioning. Moreover, when the system works in the learning mode, itis responsible for collecting measures and saving them in the offline database.Final deliverables of this subsystem are the positions it calculates as Wi-Fipositioning and cell positioning. As discussed earlier, if Wi-Fi positioningis available the system recognizes it as the user position otherwise the userposition is the base-station positioning. Then one can evaluate the accuracyof positioning the subsystem by comparing the user position with the GPSposition in a safe environment.
To evaluate the accuracy of this positioning, a number of experiments havebeen conducted to compare user position with the actual position taken fromthe GPS. In these experiments, the functionality of system using differentlocation providers was tested. In each case the system calculates the distancebetween those two positions based on latitude and longitude of each. Theselatitudes and longitudes were also recorded in the log file. To check whetherthe system calculates the distance correctly or not, it was calculated again inMATLAB using latitudes and longitudes recorded in the log file. Comparingthese results shows that the system calculates the distance correctly in everycase. Moreover, the accuracy of those provides were tested using a Matlabscript (See Appendix B). Table 5.1 shows the result of these experiments. Thefollowing sections are descriptions of the experiments for each provider.
5.2.1 Offline provider
An experiment has been conducted to evaluate the functionality and perfor-mance of the offline provider. This experiment has been carried out by takingbus number 53 from Roslagsgatan bus station to the central station in the cityof Stockholm on May 07, 2013. During this experiment, the GPS position andthe user’s position in the form of latitude and longitude as well as the distance
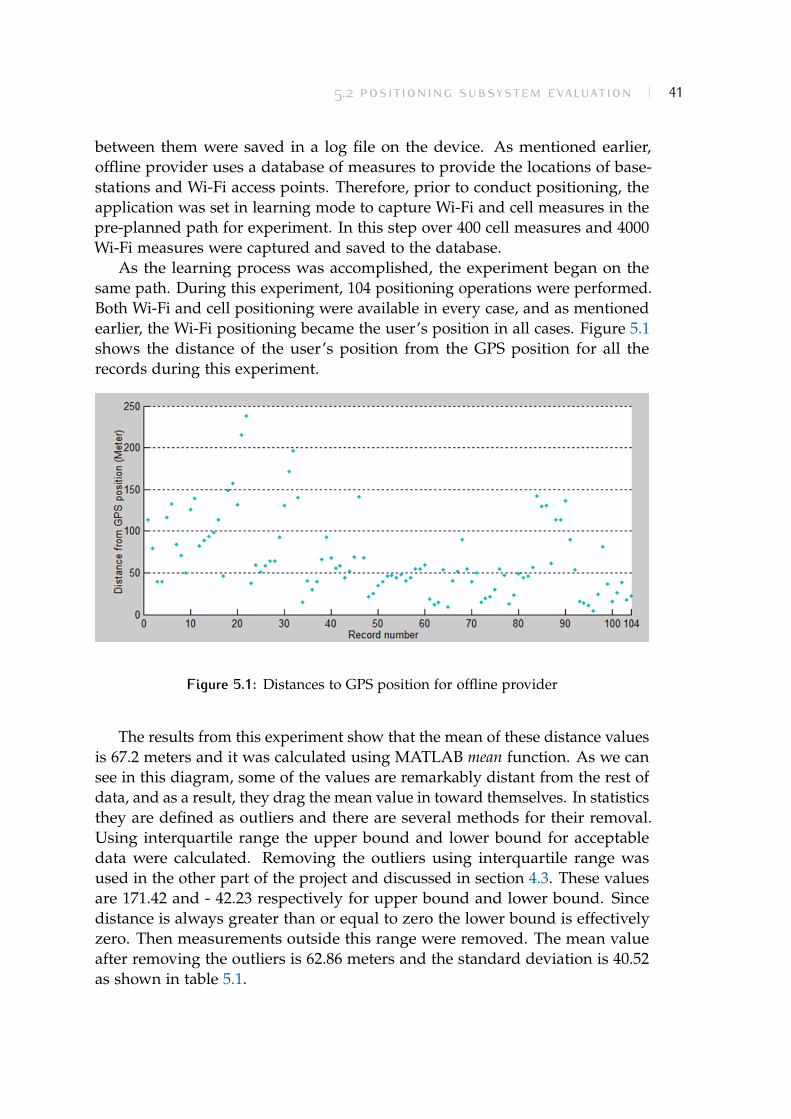
5.2 POSITIONING SUBSYSTEM EVALUATION 41
between them were saved in a log file on the device. As mentioned earlier,offline provider uses a database of measures to provide the locations of base-stations and Wi-Fi access points. Therefore, prior to conduct positioning, theapplication was set in learning mode to capture Wi-Fi and cell measures in thepre-planned path for experiment. In this step over 400 cell measures and 4000Wi-Fi measures were captured and saved to the database.
As the learning process was accomplished, the experiment began on thesame path. During this experiment, 104 positioning operations were performed.Both Wi-Fi and cell positioning were available in every case, and as mentionedearlier, the Wi-Fi positioning became the user’s position in all cases. Figure 5.1shows the distance of the user’s position from the GPS position for all therecords during this experiment.
Figure 5.1: Distances to GPS position for offline provider
The results from this experiment show that the mean of these distance valuesis 67.2 meters and it was calculated using MATLAB mean function. As we cansee in this diagram, some of the values are remarkably distant from the rest ofdata, and as a result, they drag the mean value in toward themselves. In statisticsthey are defined as outliers and there are several methods for their removal.Using interquartile range the upper bound and lower bound for acceptabledata were calculated. Removing the outliers using interquartile range wasused in the other part of the project and discussed in section 4.3. These valuesare 171.42 and - 42.23 respectively for upper bound and lower bound. Sincedistance is always greater than or equal to zero the lower bound is effectivelyzero. Then measurements outside this range were removed. The mean valueafter removing the outliers is 62.86 meters and the standard deviation is 40.52as shown in table 5.1.

42 POSITIONING SUBSYSTEM EVALUATION 5.2
In addition, the Android platform provides the accuracy of the GPS positionfor developers. The GPS accuracy for each positioning was recorded in thelog file. By finding the relationship between the GPS accuracy and its distanceto the user’s position, one can determine whether the low accuracy of GPSpositioning impacts the results or not. Calculating the correlation coefficientbetween these variables, I found that there is a weak correlation between theaccuracy of GPS position and the distance variable in this experiment. Thisvalue for this experiment is -0.1 which counted as a weak correlation.
5.2.2 OpenCellID
The other experiment has been made to evaluate the performance of OpenCellIDprovider. Since this is an online provider, the mobile device must be ableto connect to the internet to be able to send requests and receive responsesfrom the server. This experiment was carried out from the central station toRoslagsgatan bus station by taking bus number 53 on May 07, 2013. The samedata as the previous experiment was recorded on the log file, and in the end, 97positioning records were saved. As the OpenCellID database only stores base-station locations, all the positioning was based on cell positioning. Figure 5.2shows the distance of the user’s position from the GPS position for all therecords during this experiment. To analyse the data, the outliers were removedusing the same technique as the previous section. Upper bound and lowerbound for the accepted data respectively are 567.5 and -140.7. The mean valuefor the user distance from the GPS position after removing the outliers is 221.36meters and the standard deviation is 120 as shown in table 5.1.
Figure 5.2: Distances to GPS position for OpenCellID provider

5.2 POSITIONING SUBSYSTEM EVALUATION 43
5.2.3 Combain
The other experiment was carried out to evaluate the Combain provider. Com-bain is an online provider and mobile phone retrieved the positions from itsdatabase through internet connection. This experiment was carried out fromThe central station to Roslagsgatan bus station by taking the bus number 53 onMay 08, 2013. The same data as the previous one were recorded to the logfile. During this experiment 94 records were logged. Base station positioningwas available in all the records while in 12 records the Wi-Fi positioning wasnot available and the base-station positioning value was counted as the user’sposition. Figure 5.3 shows the distance of the user’s position from the GPSposition for all the records during this experiment. Upper bound and lowerbound for accepted data respectively are 175.7 and –74.9 respectively and theywere calculated using the interquartile range technique. The mean value for theuser distance from the GPS position after removing the outliers is 49.75 metersand the standard deviation is 44.05 52 as shown in table 5.1. In addition, theuser’s distance in 57 out of 94 records is less than 50 meters and in 75 records isless than 100 meters from the GPS position.
Figure 5.3: Distances to GPS position for combain provider
5.2.4 Combination of providers
The system has the capability to use all or a combination of providers. The usercan enable using the location provider(s) in the setting activity. An experimenthas been conducted to evaluate the system when it uses more than one provider.

44 POSITIONING SUBSYSTEM EVALUATION 5.2
As discussed earlier, OpenCellID data for the country of Sweden has alreadybeen loaded into system database and its data will be used when the offlineprovider is enabled. Therefore, to carry out this experiment the offline andCombain provider were enabled.
This experiment was carried out in the same path as the other experimentsfrom the central station to Roslagsgatan bus station by taking the bus number53 on May 09, 2013 and the same data were recorded to the log file. Duringthis experiment 55 records were logged. Both Wi-Fi and cell positioning wereavailable in every case, and as mentioned earlier, Wi-Fi positioning became theuser’s position in all cases. Figure 5.4 shows the distance of the user’s positionfrom the GPS position for all the records during this experiment. Upper boundand lower bound for accepted data respectively are 181.9 and –47.7 and it wascalculated using the interquartile range technique. The mean value for the userdistance from the GPS position after removing the outliers is 69.63 meters andthe standard deviation is 41.8152 as shown in table 5.1.
Figure 5.4: Distances to GPS position for offline and combain providers
Table 5.1 shows the results of experiments that have been conducted toevaluate the location providers that have been used in this project.

5.3 GPS POSITION VERIFICATION SUBSYSTEM 45
Offline Combain OpenCellID CombinationMean 62.86 49.75 221.36 69.63
Standard Deviation 40.52 44.05 120 41.81Lower bound -42.2 -74.9 -140.7 -47.7Upper bound 171.4 175.7 567.5 181.9
Maximum 171.2 169.4 548.1 172.5Minimum 4.7 3.14 37.8 9
Table 5.1: Evaluation of location providers
5.3 GPS POSITION VERIFICATION SUBSYSTEMThe main task of this subsystem is to verify the GPS position by comparing itwith the system positioning as well as detecting suspicious behaviour in theGPS positioning data. The comparison task was evaluated during previousexperiments in evaluating the positioning subsystem. The user can see itsposition based on GPS, Wi-Fi and base-station positioning and the distancebetween them on the main screen or on the map view. Then (s)he can visuallycompare those positions and check the correctness of the GPS position.
The other task is to evaluate finding GPS suspicious behaviour as the GPSprovided location gradually moves away from the user position determinedby other sources over time. If the system detects such behaviour, it reports thebehaviour to the user. The approach for performing this evaluation is that welog all the related data for finding such trend, and then using another calculationin Matlab, we determine that the system has reported correctly or not. In eachcycle of checking, the system logs whether the system has reported or not. Inaddition, the correlation coefficient and the slope of least squire regression linethat the system calculates in each cycle as well as the type of positioning (Wi-Fior base-station positioning) are recorded. As the author did not have accessto spoofing devices to spoof the GPS signals, occasional unavailability of GPSsignals in the urban area and turning off the GPS receiver were considered asspoofing of GPS signals.
As discussed in section 4.4 the system investigates such suspicious behaviourin the last 25 cycles of positioning. As the related data are recorded in log file,it is possible to evaluate the functionality of the system regarding this case. Theevaluation was done using MATLAB software. The related records to this partwere extracted from the log file and copied to MATLAB as a matrix variable. AMATLAB script reads all the user distance values from the matrix and calculatesits own correlation coefficient and the slope of least squire regression line (seeAppendix B). Then if the there is a strong correlation between user distance and
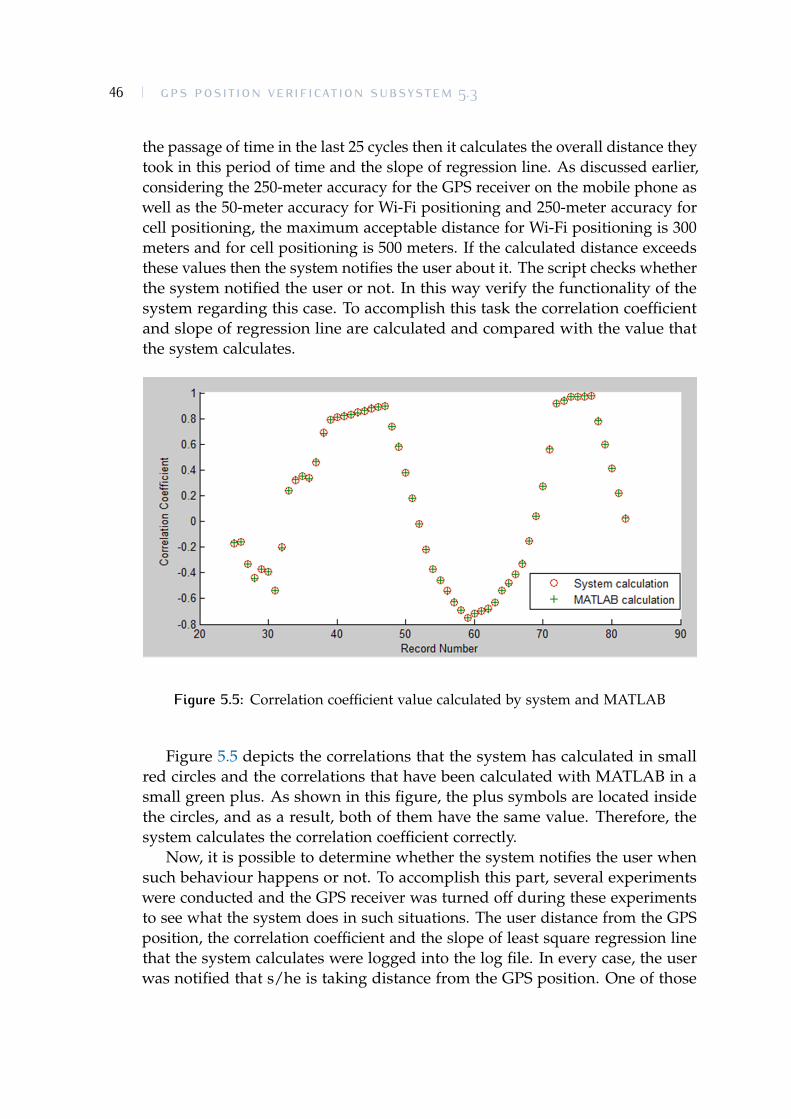
46 GPS POSITION VERIFICATION SUBSYSTEM 5.3
the passage of time in the last 25 cycles then it calculates the overall distance theytook in this period of time and the slope of regression line. As discussed earlier,considering the 250-meter accuracy for the GPS receiver on the mobile phone aswell as the 50-meter accuracy for Wi-Fi positioning and 250-meter accuracy forcell positioning, the maximum acceptable distance for Wi-Fi positioning is 300meters and for cell positioning is 500 meters. If the calculated distance exceedsthese values then the system notifies the user about it. The script checks whetherthe system notified the user or not. In this way verify the functionality of thesystem regarding this case. To accomplish this task the correlation coefficientand slope of regression line are calculated and compared with the value thatthe system calculates.
Figure 5.5: Correlation coefficient value calculated by system and MATLAB
Figure 5.5 depicts the correlations that the system has calculated in smallred circles and the correlations that have been calculated with MATLAB in asmall green plus. As shown in this figure, the plus symbols are located insidethe circles, and as a result, both of them have the same value. Therefore, thesystem calculates the correlation coefficient correctly.
Now, it is possible to determine whether the system notifies the user whensuch behaviour happens or not. To accomplish this part, several experimentswere conducted and the GPS receiver was turned off during these experimentsto see what the system does in such situations. The user distance from the GPSposition, the correlation coefficient and the slope of least square regression linethat the system calculates were logged into the log file. In every case, the userwas notified that s/he is taking distance from the GPS position. One of those

5.3 GPS POSITION VERIFICATION SUBSYSTEM 47
experiments is analysed in this part.This experiment was carried out in the same path as the other experiments
from Roslagsgatan bus station to the central station by taking the bus number 53on May 13, 2013. System was set to perform positioning using 5 base-stationsand 5 Wi-Fi APs every 10 seconds. The GPS receiver was turned off after200 seconds from starting the experiment. It took 19 rounds of positioningthe system detected that the GPS position and the user’s position are takingdistance from each other. After that the system notified the user about thisbehaviour in every round. Then GPS receiver was turned on. When the GPSposition was fixed, it took two rounds of checking that the system stoppednotifying the user. The system states during this experiment are shown infollowing figures.
As mentioned earlier, the system keeps a window of 25 latest distances.Figure 5.6 depicts the values in this window in green colour from the tenthcycle to 35th cycle as well as the line fitted to these values. As shown in thisfigure the slope of this line is 0.35 and correlation coefficient is 0.31. As eachcycle takes 10 seconds, the passage of time for each window is 240 seconds.As a result, passing 300 meters needs at least a slope of 1.25. The correlationcoefficient is less than 0.7 and is not a strong correlation. Therefore, none of theconditions was satisfied.
Figure 5.7 depicts values in the window in red colour when for the firsttime the system detects suspicious behaviour in the 39th cycle. A line fitted tothe data in this window using MATLAB’s “basic fitting” tools. As shown theslope of this line is 1.4 which is equal to the slope that the system calculatedin the log file. The correlation coefficient was also calculated with MATLABand it was equal to system’s calculation. As the correlation is strong and theslope is more than 1.25, the system notifies the user. The bus has a stop duringthis experiment from the 25th to 31th cycles. This shows that the system findssuspicious behaviour even when the user does not move in time period ofaround 60 seconds during the experiment.
The GPS was off 7 cycles after the detection of that incident and continuouslywas notifying the user. After that it was turned on and its position was fixed,and subsequently, the distance value went in the normal range again. It took20 seconds that the system detected the user’s position is not taking distancefrom the GPS position and stopped notifying the user. Figure 5.8 depicts thesystem state at this time. As shown the correlation coefficient value is less than0.7 which is not a strong correlation.

48 GPS TIME CHECK SUBSYSTEM 5.4
Figure 5.6: Least Square Regression Line before detecting deviation
5.4 GPS TIME CHECK SUBSYSTEMThe functionality of this system was checked during previous experiments thathave been conducted. As mentioned in the implementation chapter the systemperforms time checking if internet connection is available. Each time the systemconnects to the time server and performs checking the time, a record containingthe system time, GPS time, server time and the result of checking is inserted tothe log file.To evaluate this subsystem, logged data from experiments in section5.3 were used. It is possible to distinguish the GPS unavailability periods byaggregating time checking records with positioning records. Comparing theresult of time checking with availability of the GPS shows that in all cases theGPS is available, GPS time has been confirmed to be correct by the system.Moreover, the system has rejected the correctness of GPS time in every casethat the GPS is unavailable. During those experiments 377 records regardingchecking the GPS time were gathered. Figure 5.9 depicts the difference betweenthe GPS time and server time in those records. The intervals that the GPS wasavailable were shown using MATLAB’s stair chart in red. This diagram shows

5.4 GPS TIME CHECK SUBSYSTEM 49
Figure 5.7: Least Square Regression Line in time of detecting deviation
that time from the time server is slightly different from the GPS time when theGPS is available. Moreover, it shows that when GPS is unavailable, the timedifference increases in every record by 10 seconds. This is because the checkingservice is run every 10 seconds as mentioned in previous section.

50 GPS TIME CHECK SUBSYSTEM 5.4
Figure 5.8: Least Square Regression Line when the system returns to normal state
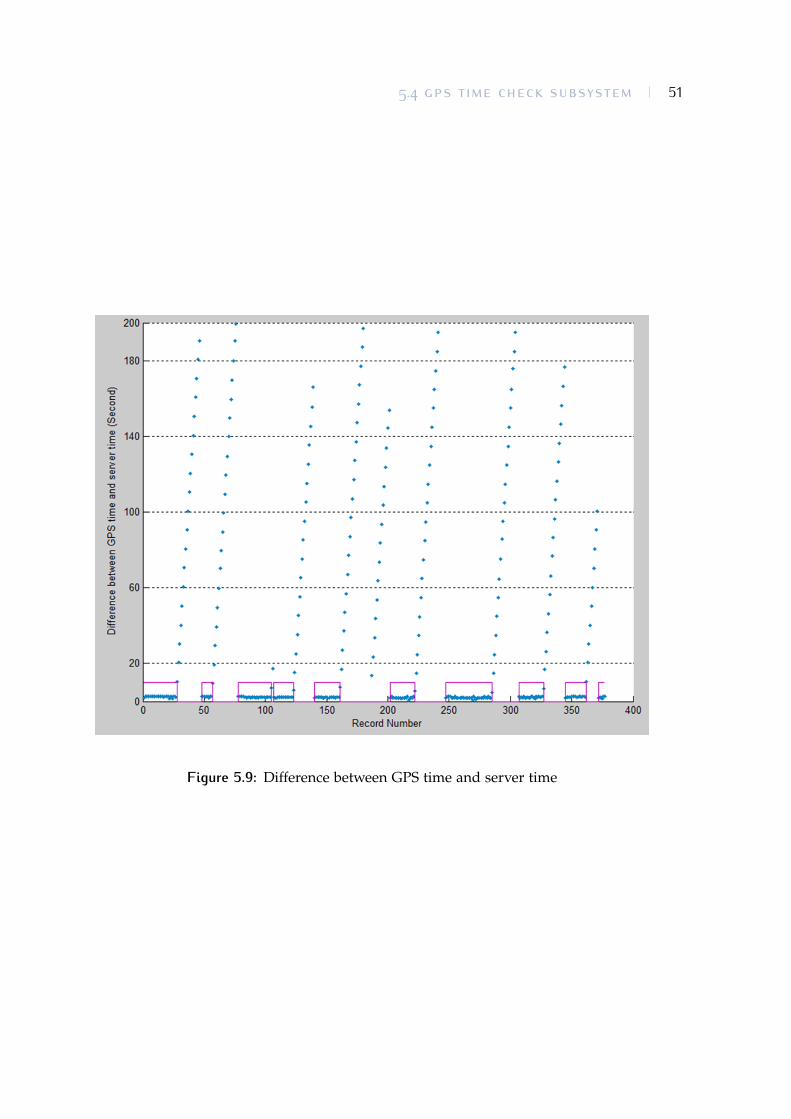
5.4 GPS TIME CHECK SUBSYSTEM 51
Figure 5.9: Difference between GPS time and server time


53
6 C O N C L U S I O N A N D D I S C U S S I O N
As we have seen in the evaluation chapter, all the three subsystems of our imple-mentation were evaluated. Based on the system evaluation, Wi-Fi positioningis considerably more accurate than positioning using base-stations, and thesystem has a better functionality when it uses the providers with Wi-Fi positionservices. In addition, both offline and Combain providers have an acceptableaccuracy and the use of their combination does not improve the accuracy. Theuser can choose between them based on the situation. If the user is going touse the system several times in the same path, then it is recommended that(s)he learns the system and then uses the offline database. But if (s)he wants touse it in new paths then Combain provides a significantly better service thanOpenCellID, as only in 16 cases the user’s distance from GPS position is lessthan 100 meters. With regard to the detecting suspicious behaviour, the systemdetect it with the constraint of atleast 300 meter movement. But, it only works ifthe user constantly take distance from GPS position. In the other words, if theuser in part of his/her movement moves toward the GPS position the systemcannot detect spoofing attack. In addition, if the attacker keeps the distanceto the user less than 300 meters during the movement, the attack cannot bedetected by the system. Regarding the time verification subsystem, it detectsthe incorrectness of the GPS time in all simulated spoof attacks. Therefore,authenticity of GPS time can be verified using this subsystem.
In conclusion, the system can verify both the GPS positioning and time datausing the current the GPS signal architecture and ordinary GPS receivers onmobile phones. In this way, users can check the authenticity of GPS signals anduse location based applications on their mobile phones.
6.1 FUTURE WORKVerifying the authenticity of GPS signals is one of the challenges in usinglocation-based applications in mobile phones. The evaluation results show thatthe system can verify that, but the functionality and performance of the systemcan be improved. One way to improve the system can be utilizing more locationproviders. Due to fruitful design of the system, new providers can be pluggedin to the system easily by implementing the LocationAPI interface. Moreover,
54 FUTURE WORK 6.1
several algorithms in different components of the system are used. It includesalgorithms for performing Wi-Fi and cell positioning, removing the outliersand storing data in the offline database. One avenue for future research isimproving these algorithms. For example, in the positioning part factors likesignals’ angle of arrival, time of arrival or time difference of arrival can be takeninto account in positioning. The other avenue for future research is predictingthe next location of the user in his movement. Apart from GPS receiver, smartphones have some other sensors that can be utilized for this purposes.Thesesensors are accelerometers, gyroscopes, magnetometers and rotational vectorsensors. The device acceleration in X, Y and Z axes can be measured usingaccelerometer sensor. In addition, magnetic field sensor data can be combinedwith the accelerometer data to find the direction of the device. In this way it ispossible to predict the next user’s location based on the user’s movement pathand the direction of device. Moreover, the system can detect major changes indevice direction by keeping the recent device directions. in this way change inuser’s path is detectable and a better prediction of the next user’s location canbe made.

B I B L I O G R A P H Y
[1] P. Bahl and V. N. Padmanabhan. “RADAR: An in-building RF-based userlocation and tracking system”. In: INFOCOM 2000. Nineteenth Annual JointConference of the IEEE Computer and Communications Societies. Proceedings.IEEE. Vol. 2. Ieee. 2000, pp. 775–784 (cit. on p. 14).
[2] R Chengqi. “Development of the BeiDou Navigation Satellite System”.In: Global Navigation Satellite Systems. Report of the Joint Workshop of theNational Academy of Engineering and the Chinese Academy of Engineering.Washington, DC. 2012 (cit. on pp. 8, 9).
[3] W. Ching, R. J. Teh, B. Li, and C. Rizos. “Uniwide WiFi based position-ing system”. In: Technology and Society (ISTAS), 2010 IEEE InternationalSymposium on. IEEE. 2010, pp. 180–189 (cit. on p. 15).
[4] Distinctive Features Of SQLite. 2013. url: http : / / www . sqlite . org /different.html (visited on 05/29/2013) (cit. on p. 21).
[5] D. Z. Goodson. Mathematical methods for physical and analytical chemistry.Wiley, 2011 (cit. on pp. 33, 34).
[6] W. H. Guier and G. C. Weiffenbach. “Genesis of satellite navigation”. In:Johns Hopkins APL technical digest 19.1 (1998), p. 15 (cit. on p. 7).
[7] G. W. Hein, F. Kneissl, J.-A. Avila-Rodriguez, and S. Wallner. “Authenti-cating GNSS Proofs against Spoofs”. In: Part 2 (2007), pp. 71–78 (cit. onpp. 2, 13).
[8] A. R. Hevner, S. T. March, J. Park, and S. Ram. “Design science in infor-mation systems research”. In: MIS quarterly 28.1 (2004), pp. 75–105 (cit. onpp. 3, 4, 37).
[9] B. Hofmann-Wellenhof, H. Lichtenegger, and E. Wasle. GNSS–GlobalNavigation Satellite Systems: GPS, GLONASS, Galileo & more. Springer, 2007(cit. on pp. 7, 10).
[10] T. E. Humphreys, J. Bhatti, and B. Ledvina. “The GPS Assimilator: amethod for upgrading existing GPS user equipment to improve accuracy,robustness, and resistance to spoofing”. In: Proceedings of the ION GNSSConference. 2010 (cit. on p. 2).
[11] T. E. Humphreys et al. “Assessing the spoofing threat: Developmentof a portable GPS civilian spoofer”. In: Proceedings of the ION GNSSInternational Technical Meeting of the Satellite Division. 2008 (cit. on pp. 2,13).
55
56 BIBLIOGRAPHY
[12] S. Ji et al. “Potential benefits of GPS/GLONASS/GALILEO integrationin an urban canyon–Hong Kong”. In: Journal of Navigation 63.04 (2010),pp. 681–693 (cit. on p. 12).
[13] P. Johannesson and E. Perjons. A Design Science Primer. 2012 (cit. on p. 3).
[14] J. Juang. “Analysis of global navigation satellite system position deviationunder spoofing”. In: Radar, Sonar & Navigation, IET 3.1 (2009), pp. 1–7(cit. on p. 2).
[15] H. K. Kalutarage, P. Krishnan, and S. A. Shaikh. “Android Revolution”.In: ITNOW 55.1 (2013), pp. 36–37 (cit. on pp. 3, 17).
[16] P. Kashyap, A. Samant, P. K. Sagiraju, and D. Akopian. “An assistedGPS support for GPS simulators for embedded mobile positioning”. In:IS&T/SPIE Electronic Imaging. International Society for Optics and Photon-ics. 2009, 72560G–72560G (cit. on p. 10).
[17] G. Krüger, R. Springer, and W. Lechner. “Global navigation satellitesystems (GNSS)”. In: Computers and Electronics in Agriculture 11.1 (1994),pp. 3–21 (cit. on pp. 7, 8, 10).
[18] W. Lechner and S. Baumann. “Global navigation satellite systems”. In:Computers and Electronics in Agriculture 25.1 (2000), pp. 67–85 (cit. on p. 8).
[19] W.-M. Lee. Beginning Android 4 application development. Wrox, 2012 (cit. onp. 17).
[20] S. Lo et al. “Signal Authentication, a secure civil GNSS for today”. In:inside GNSS 4.5 (2009), pp. 30–39 (cit. on pp. 1, 10).
[21] S. C. Lo and P. K. Enge. “Authenticating aviation augmentation systembroadcasts”. In: Position Location and Navigation Symposium (PLANS), 2010IEEE/ION. IEEE. 2010, pp. 708–717 (cit. on p. 2).
[22] B. J. Mohler et al. “Visual flow influences gait transition speed and pre-ferred walking speed”. In: Experimental Brain Research 181.2 (2007), pp. 221–228 (cit. on p. 35).
[23] S. Pace et al. The global positioning system: assessing national policies. Tech.rep. DTIC Document, 1995 (cit. on pp. 8, 10).
[24] P. Papadimitratos. “"On the road" - Reflections on the Security of Vehic-ular Communication Systems”. In: Proceedings of the IEEE InternationalConference on Vehicular Electronics and Safety (ICVES. Columbus, OH, USA,2008, pp. 359–363 (cit. on p. 2).
[25] P. Papadimitratos and A. Jovanovic. “GNSS-based Positioning: Attacksand countermeasures”. In: Military Communications Conference, 2008. MIL-COM 2008. IEEE. IEEE. 2008, pp. 1–7 (cit. on pp. 1–3, 13).

BIBLIOGRAPHY 57
[26] P. Papadimitratos and A. Jovanovic. Method to secure GNSS based locationsin a device having GNSS receiver. US Patent 8,159,391. 2012 (cit. on pp. 1, 2,13).
[27] P. Papadimitratos and A. Jovanovic. “Protection and fundamental vulner-ability of GNSS”. In: Satellite and Space Communications, 2008. IWSSC 2008.IEEE International Workshop on. IEEE. 2008, pp. 167–171 (cit. on pp. 1–3).
[28] P. Papadimitratos. “Security and Privacy Mechanisms for Vehicular Net-works”. In: Vehicular Networking: Automotive Applications and Beyond 2(2010), p. 105 (cit. on p. 2).
[29] P. Papadimitratos et al. “Vehicular communication systems: Enabling tech-nologies, applications, and future outlook on intelligent transportation”.In: Communications Magazine, IEEE 47.11 (2009), pp. 84–95 (cit. on p. 2).
[30] O. Pozzobon, C. Wullems, and K. Kubic. “Secure tracking using trustedGNSS receivers and Galileo authentication services”. In: Journal of GlobalPositioning Systems 3.1-2 (2004), pp. 200–207 (cit. on p. 2).
[31] D. Quercia et al. “Recommending social events from mobile phone loca-tion data”. In: Data Mining (ICDM), 2010 IEEE 10th International Conferenceon. IEEE. 2010, pp. 971–976 (cit. on p. 1).
[32] R. Rayarikar, S. Upadhyay, and P. Pimpale. “SMS Encryption using AESAlgorithm on Android”. In: International Journal of Computer Applications50.19 (2012) (cit. on pp. 1, 17).
[33] Satellite navigation Programme. 2012. url: http://ec.europa.eu/enterprise/policies/satnav/galileo/programme/index_en.htm (visited on 10/21/2012)(cit. on pp. 8, 9).
[34] Satellite navigation Why Galileo? 2012. url: http : / / ec . europa . eu /enterprise/policies/satnav/galileo/why/index_en.htm (visitedon 10/21/2012) (cit. on p. 8).
[35] L. Scott. “Anti-spoofing & authenticated signal architectures for civil nav-igation systems”. In: Proceedings of the 16th International Technical Meetingof the Satellite Division of the Institute of Navigation (ION GPS/GNSS 2003).2003, pp. 1543–1552 (cit. on pp. 2, 13).
[36] Storage Options. 2013. url: http://developer.android.com/guide/topics/data/data-storage.html#db (visited on 05/29/2013) (cit. onp. 21).
[37] A. Theiss, D. C. Yen, and C.-Y. Ku. “Global Positioning Systems: an analy-sis of applications, current development and future implementations”. In:Computer Standards & Interfaces 27.2 (2005), pp. 89–100 (cit. on pp. 8, 10).

58 BIBLIOGRAPHY
[38] S. Tian, G. Li, J. Chang, and Z. Li. “COMPASS Augmentation UsingLEO Telecommunication Satellites”. In: Communications and IntelligenceInformation Security (ICCIIS), 2010 International Conference on. IEEE. 2010,pp. 192–195 (cit. on pp. 8, 9).
[39] S. Tian et al. “Research on Receiver Autonomous Integrity Monitoring inLEO satellites-augmented Compass”. In: Signal Processing, Communicationsand Computing (ICSPCC), 2011 IEEE International Conference on. IEEE. 2011,pp. 1–5 (cit. on p. 8).
[40] J Volpe. “Vulnerability assessment of the transportation infrastructurerelying on the global positioning system”. In: (2001) (cit. on pp. 1, 2).
[41] R. Want, A. Hopper, V. Falcão, and J. Gibbons. “The active badge locationsystem”. In: ACM Transactions on Information Systems (TOIS) 10.1 (1992),pp. 91–102 (cit. on p. 14).
[42] K. Wesson, M. Rothlisberger, and T. Humphreys. “Practical cryptographiccivil GPS signal authentication”. In: Navigation 59.3 (2012), pp. 177–193(cit. on pp. 1, 2, 13).
[43] K. Wesson, D. Shepard, and T. Humphreys. “Straight talk on anti-spoofing”.In: GPS World (2012) (cit. on p. 13).
[44] C. Wullems, O. Pozzobon, and K. Kubik. “Signal authentication andintegrity schemes for next generation global navigation satellite systems”.In: Proceedings of the European Navigation Conference GNSS, 2005. 2005 (cit.on p. 2).
[45] Y. Yang et al. “Contribution of the Compass satellite navigation system toglobal PNT users”. In: Chinese Science Bulletin 56.26 (2011), pp. 2813–2819(cit. on p. 9).
[46] P. A. Zandbergen and S. J. Barbeau. “Positional accuracy of assisted gpsdata from high-sensitivity gps-enabled mobile phones”. In: Journal ofNavigation 64.03 (2011), pp. 381–399 (cit. on pp. 11, 12).
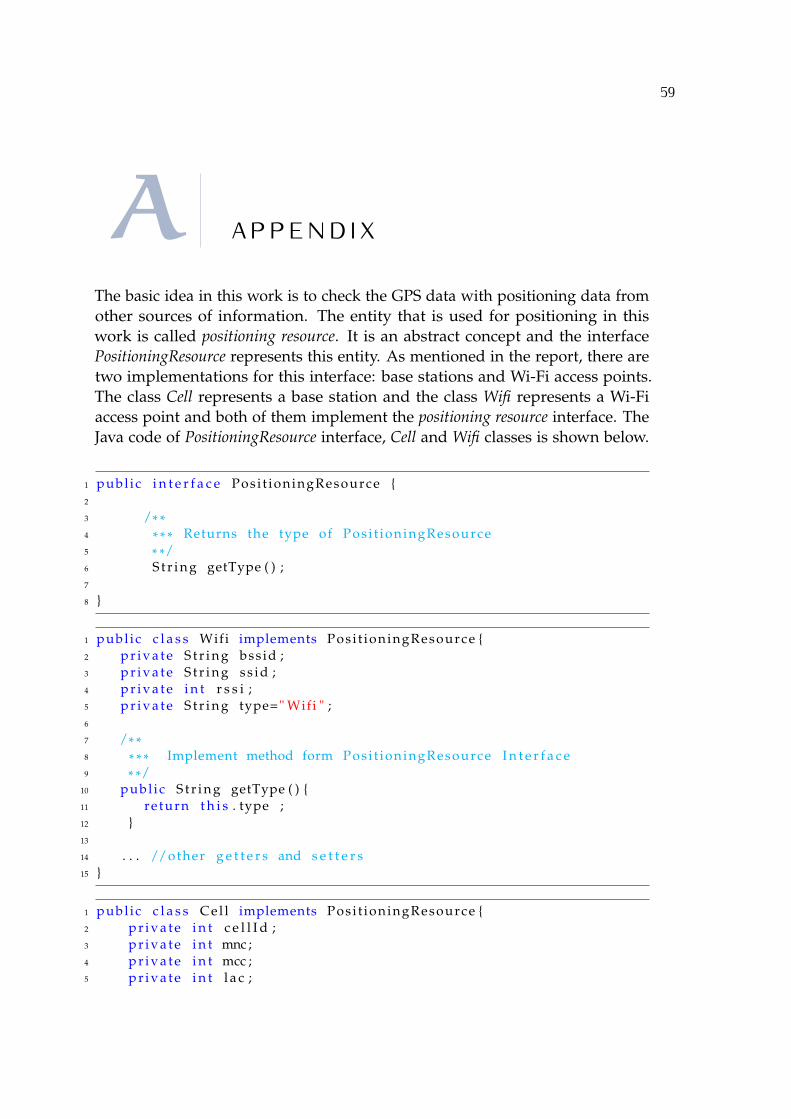
59
A A P P E N D I X
The basic idea in this work is to check the GPS data with positioning data fromother sources of information. The entity that is used for positioning in thiswork is called positioning resource. It is an abstract concept and the interfacePositioningResource represents this entity. As mentioned in the report, there aretwo implementations for this interface: base stations and Wi-Fi access points.The class Cell represents a base station and the class Wifi represents a Wi-Fiaccess point and both of them implement the positioning resource interface. TheJava code of PositioningResource interface, Cell and Wifi classes is shown below.
1 publ ic i n t e r f a c e Pos i t ioningResource {2
3 /* *4 * * * Returns the type of Pos i t ioningResource5 * */6 S t r i n g getType ( ) ;7
8 }
1 publ ic c l a s s Wifi implements Pos i t ioningResource {2 p r i v a t e S t r i n g bss id ;3 p r i v a t e S t r i n g s s i d ;4 p r i v a t e i n t r s s i ;5 p r i v a t e S t r i n g type=" Wifi " ;6
7 /* *8 * * * Implement method form Posi t ioningResource I n t e r f a c e9 * */
10 publ ic S t r i n g getType ( ) {11 re turn t h i s . type ;12 }13
14 . . . //other g e t t e r s and s e t t e r s15 }
1 publ ic c l a s s C e l l implements Pos i t ioningResource {2 p r i v a t e i n t c e l l I d ;3 p r i v a t e i n t mnc ;4 p r i v a t e i n t mcc ;5 p r i v a t e i n t l a c ;

60 APPENDIX A
6 p r i v a t e i n t padding ;7 p r i v a t e i n t r s s i ;8 p r i v a t e S t r i n g type=" C e l l " ;9
10 /* *11 * * * No−arg c o n s t r u c t o r f o r the c l a s s C e l l12 * */13 publ ic C e l l ( ) {14
15 }16
17 /* *18 * * * Constructor f o r the c l a s s C e l l19 * */20 publ ic C e l l ( i n t c e l l I d , i n t locationAreaCode , i n t
mobileCountryCode , i n t mobileNetworkCode ) {21 super ( ) ;22 t h i s . c e l l I d = c e l l I d ;23 t h i s . l a c = locationAreaCode ;24 t h i s . mcc = mobileCountryCode ;25 t h i s . mnc = mobileNetworkCode ;26 }27
28 /* *29 * * * Implement method form Posi t ioningResource I n t e r f a c e30 * */31 publ ic S t r i n g getType ( ) {32 re turn t h i s . type ;33 }34
35 . . . //other g e t t e r s and s e t t e r s36
37 }
The location of each positioning resource (Cell or Wifi) is found using anothercomponent called LocationAPI. It is an abstract concept and is defined as aJava interface. Every implementation of this interface returns the position ofa given positioning resource. In this interface, getLocation method receives apositioning resource as the argument and returns its location. The return value ofthis method is an object of CustomLocation class. This class extends the AndroidLocation class and add some necessary fields that are used in this projects.for example the originResource field that helps to identify from which type oflocation resources (Wifi or Cell) this object is originated.
Each implementation of this interface is called positioning provider. Combain,OpenCellID and the offline database are the three different implementations forthis interface. Each of them may support both types of positioning resources orjust one of them. Below is the definition of LocationAPI interface.

A APPENDIX 61
1 publ ic i n t e r f a c e LocationAPI {2 /* *3 * * * Returns the name of t h i s LocationAPI4 * */5 S t r i n g getName ( ) ;6
7 /* *8 * * * Returns t rue i f t h i s LocationAPI i s enabled9 * * * @return True i f t h i s LocationAPI i s enabled , f a l s e
otherwise10 * */11 boolean isEnabled ( ) ;12
13 /* *14 * * * Returns t rue i f t h i s LocationAPI i s onl ine15 * * *16 * @return True i f t h i s LocationAPI i s online , f a l s e otherwise17 * */18 boolean isOnl ine ( ) ;19
20 /* *21 * * * Returns t rue i f t h i s LocationAPI support the input
resource type22 * * * @return True i f t h i s LocationAPI support the input
resource type , f a l s e otherwise23 * */24 boolean isSupport ( Pos i t ioningResource resourceType ) ;25
26 /* *27 * * * Returns the l o c a t i o n of l o c a t i o n resource i n d i c a t e d by the
a t t r i b u t e s28 * * * s p e c i f i e d in the resource i n s t a n c e .29 * * * @param resource l o c a t i o n resource information30 * * * @return The l o c a t i o n of the resource , or n u l l i f no31 * * * l o c a t i o n could be determined .32 * */33 CustomLocation getLocat ion ( Context contex , Pos i t ioningResource
resource , S t r i n g key ) ;34 }


63
B A P P E N D I X
As discussed in chapter 5, the accuracy of positioning subsystem was evaluatedby conducting a number of experiments to compare user’s position with theposition taken from the GPS. In this way the system was tested with respectto the functionality of different location providers that were used. In each casethe system calculates the distance between those two positions. The data waslogged in to a file and then moved to a matlab matrix variable called logData. AMatlab script was used to calculate the mean value of those distances. More-over, the outliers was removed and then variance and standard deviation wascalculated. Below is that script.
1 s t a r t =1 %F i r s t record2 f i n i s h =55 %Last record3 Y=logData ( s t a r t : f i n i s h , 8 ) % Column 8 i s the d i s t a n c e values4
5 % Ca lc u la t i n g 3 q u a n t i l e s of the data6 quants= q u a n t i l e ( logData ( s t a r t : f i n i s h , 8 ) , 3 )7 iqrValue= i q r ( logData ( s t a r t : f i n i s h , 8 ) )8
9 % Ca lc u la t i n g upperBound and lowerBound10 upperBound=quants ( 3 ) +( iqrValue * 1 . 5 )11 lowerBound=quants ( 1 ) −( iqrValue * 1 . 5 )12
13 % Removing o u t l i e r s14 j =115 while j <= f i n i s h16 i f Y( j ) >upperBound || Y( j ) <lowerBound17 Y( j ) = [ ]18 j = j −119 f i n i s h = f i n i s h −120 end21 j = j +122 end23 % Ca lc u la t i n g variance , standard deviat ion , minimum and maximum24 var iance=var (Y)25 sdev=std (Y)26 maximum=max(Y)27 minimum=min (Y)28 averageDistance=mean(Y)

64 APPENDIX B
Moreover as discussed in chapter 5 the functionality of system with respectto detecting suspicious behaviour was evaluated. To do that the data from thoseexperiments was moved to Matlab and then evaluated using a script.
1 s t a r t =1 %F i r s t record2 f i n i s h =63 %Last record3
4 % S t a r t i n g from 25 th record5 f o r i = s t a r t +24: f i n i s h6 windowSize=257
8 % The time values in X a x i s9 X = [ 1 0 ; 2 0 ; 3 0 ; 4 0 ; 5 0 ; 6 0 ; 7 0 ; 8 0 ; 9 0 ; 1 0 0 ; 1 1 0 ; 1 2 0 ; 1 3 0 ; 1 4 0 ; 1 5 0
10 ; 1 6 0 ; 1 7 0 ; 1 8 0 ; 1 9 0 ; 2 0 0 ; 2 1 0 ; 2 2 0 ; 2 3 0 ; 2 4 0 ; 2 5 0 ]11
12 % S e l e c t i n g the l a s t 25 d i s t a n c e values13 Y=logData ( i −24: i , 8 )14
15 % Ca lc u la t i n g 3 q u a n t i l e s of the data16 quants= q u a n t i l e ( logData ( i −24: i , 8 ) , 3 )17 iqrValue= i q r ( logData ( i −24: i , 8 ) )18
19 % Ca lc u la t i n g upperBound and lowerBound20 upperBound=quants ( 3 ) +( iqrValue * 1 . 5 )21 lowerBound=quants ( 1 ) −( iqrValue * 1 . 5 )22
23 % Removing o u t l i e r s24 j =125 while j <= windowSize26 i f Y( j ) >upperBound || Y( j ) <lowerBound27 Y( j ) = [ ]28 X( j ) = [ ]29 j = j −130 windowSize=windowSize−131 end32 j = j +133 end34
35 R= c o r r c o e f (X , Y) % Ca l cu la t in g c o r r e l a t i o n c o e f f i c i e n t r36 logData ( i , 1 6 ) =R( 1 , 2 ) %I n s e r t i n g the r value to the matrix37 p = p o l y f i t (X , Y , 1 ) % C al c u l a t i ng the slope of r e g r e s s i o n l i n e38 logData ( i , 1 7 ) = p ( 1 )39 logData ( i , 1 9 ) = i40 end

65
C A P P E N D I X
In this appendix some of the screen shots from one of the experiments areprovided. This experiment has been conducted to see the functioning of thesystem. During that, the Wi-Fi APs and base stations that have involved duringpositioning are logged. Moreover, The Wi-Fi positioning and the base stationpositioning based on those positioning resources as well as GPS positioninghave been logged. This Experiment has been carried out in the same pathof experiments in evaluation chapter (chapter 5) from the central station toRoslagsgatan bus station by taking bus number 53 (Figure C.1).
Due to large number of elements, showing all the elements described abovein one picture does not give a good view. Figure C.2 shows the involvedpositioning elements for every 15 cycles of checking or every 150 seconds.Figures C.3 to C.6 depict the calculated positions and the involved positioningresources in some parts of the path.

66 APPENDIX C
Figure C.1: The path that the experiment was carried out
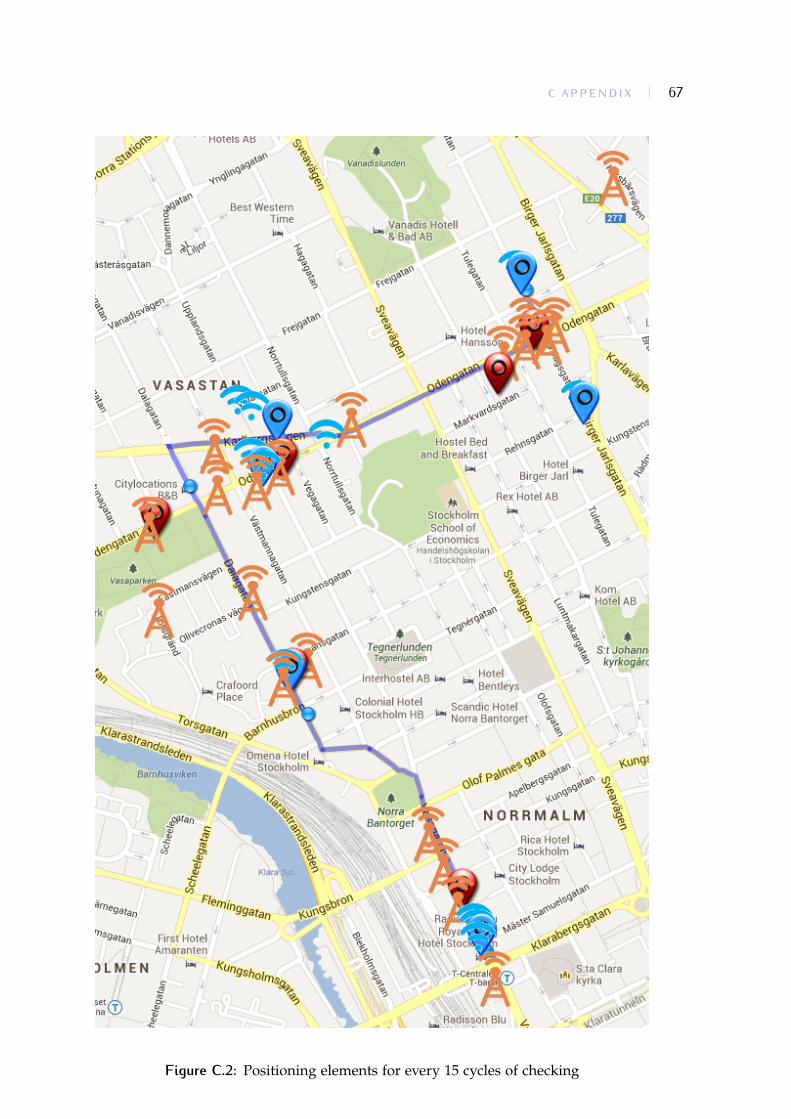
C APPENDIX 67
Figure C.2: Positioning elements for every 15 cycles of checking
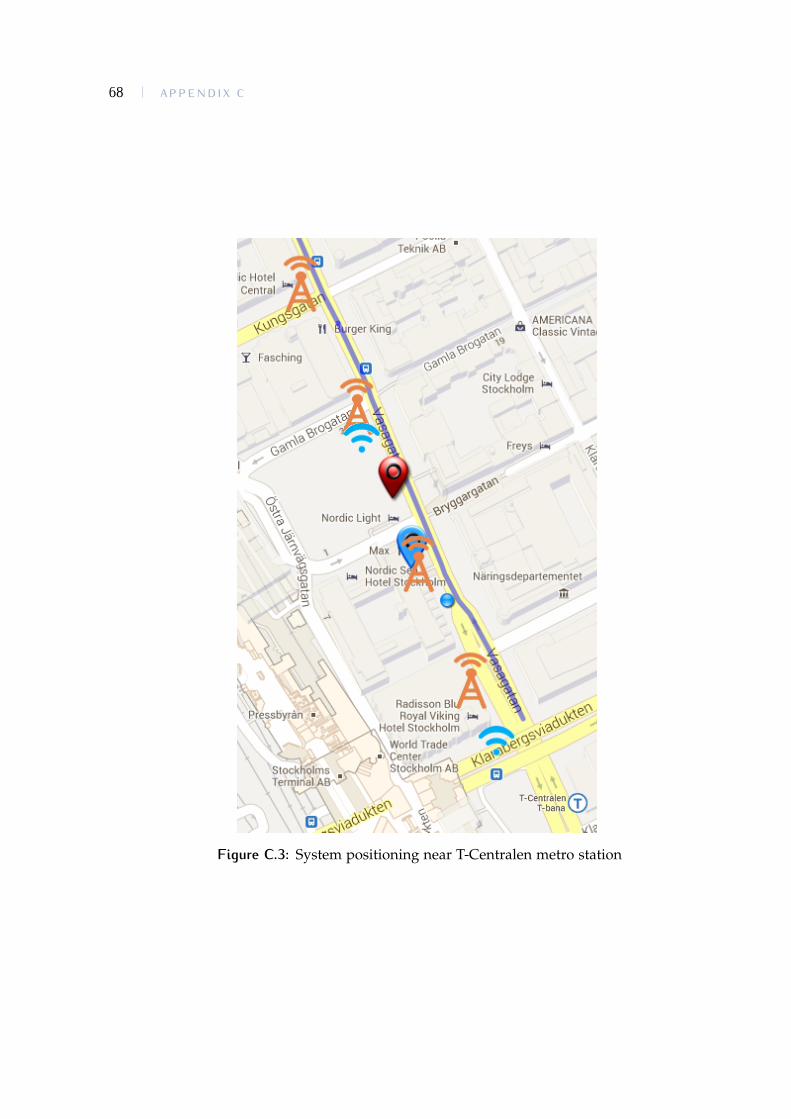
68 APPENDIX C
Figure C.3: System positioning near T-Centralen metro station

C APPENDIX 69
Figure C.4: System positioning near Bantorget park, Stockholm
Figure C.5: System positioning near Odenplan T-bana, Stockholm
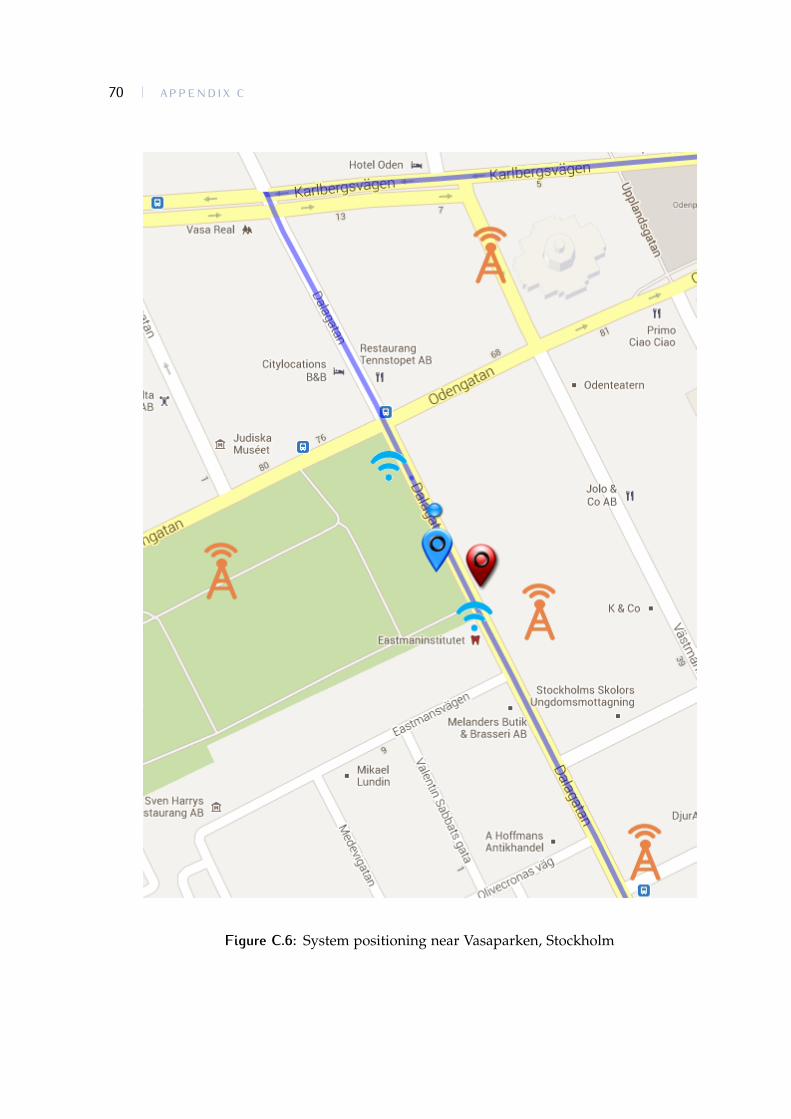
70 APPENDIX C
Figure C.6: System positioning near Vasaparken, Stockholm