detecting topological patterns in complex networks sergei maslov brookhaven national laboratory
Post on 18-Dec-2015
219 views
TRANSCRIPT

Detecting topological patterns in complex
networks
Sergei MaslovBrookhaven National Laboratory

Networks in complex systems Complex systems
Large number of components They interact with each other All components and/or interactions are different
from each other (unlike in traditional physics) 104 types of proteins in an organism,106 routers,
109 web pages, 1011 neurons The simplest property of a complex system:
who interacts with whom? can be visualized as a network
Backbone for real dynamical processes

Why study the topology of complex networks?
Lots of easily available data: that’s where the state of the art information is (at least in biology)
Large networks may contain information about basic design principles and/or evolutionary history of the complex system
This is similar to paleontology: learning about an animal from its backbone

Plan of my lectures Part 1: Bio-molecular (protein) networks
What is a protein network? Degree distributions in real and random networks Beyond degree distributions: How it all is wired
together? Correlations in degrees How do protein networks evolve?
Part 2: Interplay between an auxiliary diffusion process (random walk) and modules and communities on the Internet and WWW

Collaborators: Biology:
Kim Sneppen – U. of Copenhagen Kasper Eriksen – U. of Lund Koon-Kiu Yan – Stony Brook U. Ilya Mazo – Ariadne Genomics Iaroslav Ispolatov – Ariadne Genomics
Internet and WWW: Kasper Eriksen – U. of Lund Kim Sneppen – U. of Copenhagen Ingve Simonsen – NORDITA Koon-Kiu Yan – Stony Brook U. Huafeng Xie –City University of New York

Postdoc position Looking for a postdoc to work in my
group at Brookhaven National Laboratory in New York starting Fall 2005
Topic - large-scale properties of (mostly) bionetworks (partially supported by a NIH/NSF grant with Ariadne Genomics)
E-mail CV and 3 letters of recommendation to: [email protected]
See www.cmth.bnl.gov/~maslov

Protein networks Nodes – proteins Edges – interactions between proteins
Metabolic (all metabolic pathways of an organism) Bindings (physical interactions) Regulations (transcriptional regulation, protein modifications) Disruptions in expression of genes (remove or overexpress
one gene and see which other genes are affected) Co-expression networks from microarray data (connect genes
with similar expression patterns under many conditions) Synthetic lethals (removal of A doesn’t kill, removal of B
doesn’t kill but removal of both does) Etc, etc, etc.

Sources of data on protein networks Genome-wide experiments
Binding – two-hybrid high throughput experiments
Transcriptional regulation – ChIP-on-chip, or ChIP-then-SAGE
Expression, disruption networks – microarrays Lethality of genes (including synthetic lethals):
Gene knockout – yeast RNAi –worm, fly
Many small or intermediate-scale experiments Public databases: DIP, BIND, YPD (no longer
public), SGD, Flybase, Ecocyc, etc.

MAPK signalingInhibition of apoptosis
Images from ResNet3.0 by Ariadne Genomics

Pathway network paradigm shift
Pathway Network

Transcription regulatory networks
Bacterium: E. coli3:2 ratio
Single-celled eukaryote:
S. cerevisiae; 3:1 ratio

Data from Ariadne Genomics
Homo sapiens
Total: 120,000 interacting protein pairs extracted from PubMed as of 8/2004

Degree (or connectivity) of a node – the # of neighbors
DegreeK=4
DegreeK=2

Directed networks havein- and out-degrees
Out-degreeKout=5
In-degreeKin=2

How many transcriptional regulators are out there?

Fraction of transcriptional regulators in bacteria
from Stover et al., Nature (2000)

Complexity of regulation grows with complexity of
organism
NR<Kout>=N<Kin>=number of edges NR/N= <Kin>/<Kout> increases with N <Kin> grows with N
In bacteria NR~N2 (Stover, et al. 2000) In eucaryots NR~N1.3 (van Nimwengen,
2002) Networks in more complex
organisms are more interconnected then in simpler ones

Complexity is manifested in Kin distribution
E. coli vs H. sapiens

Figure from Erik van Nimwegen, TIG 2003

Table from Erik van Nimwegen, TIG 2003

Protein-protein binding (physical interaction)
networks

Two-hybrid experiment
To test if A interacts with B create two hybridsA* (with Gal4p DNA-binding domain) and B* (with Gal4p activation domain)
High-throughput: all pairs among 6300 yeast proteins are tested: Yeast: Uetz, et al. Nature (2000), Ito, et al., PNAS (2001); Fly: L. Giot et al. Science (2003)
Gal4-activated reporter gene, say GAL2::ADE2Gal4-binding domain
A* B*

Protein binding network in yeast

Protein binding networks
Two-hybrid nuclear
Database (DIP) core set
S. cerevisiae

Degree distributions in random and real networks

Degree distribution in a random network
Randomly throw E edges among N nodes
Solomonoff, Rapaport, Bull. Math. Biophysics (1951)Erdos-Renyi (1960)
Degree distribution – Poisson
K~ with no hubs(fast decay of N(K))
( ) exp( )!
2 /
K
N K NK
K E N

Degree distribution in real protein networks
Histogram N(K) is broad: most nodes have low degree ~ 1, few nodes – high degree ~100
Can be approximately fitted with N(K)~K- functional formwith ~=2.5
H. Jeong et al. (2001)10
010
110
210
310
-4
10-2
100
102
104
x-2.5

Network properties of self-binding proteins
AKA homodimers
I. Ispolatov, A. Yuryev, I. Mazo, SMq-bio.GN/0501004.

There are just TOO MANY homodimers
• Null-model • Pself ~<k>/N• Ndimer=N Pself
= <k>• Not surprising ashomodimers have many functional roles

Network properties around homodimers

Fly: two-hybrid data Human: database data
Likelihood to self-interact vs. K
Pself~0.05, Pothers~0.0002 Pself~0.003, Pothers~0.0002

What we think it means? In random networks pdimer(K)~K2 not ~K like our
empirical observation K is proportional to the “stickiness” of the
protein which in its turn scales with the area of hydrophobic residues on the surface # copies/cell its popularity (in datasets taken from a database) Etc.
Real interacting pairs consists of an “active” and “passive” protein and binding probability scales only with the “stickiness” of the active protein
“Stickiness” fully accounts for higher than average connectivity of homodimers

Propagation of signals and perturbations in networks

Naïve argument An average node has <K> first neighbors,
<K><K-1> second neighbors, <K><K-1><K-1> third neighbors
Total number of neighbors affected is 1+<K> + <K><K-1> +<K><K-1><K-1> +…
If <K-1> 1 a perturbation starting at a single node MAY affect the whole network

Where is it wrong? Probability to arrive to a node with
K neighbors is proportional to K! The right answer: <K(K-1)>/<K>
1 a perturbation would spread
Correlations between degrees of neighbors would affect the answer

How many clusters? If <K(K-1)>/<K> >> 1 there is one “giant”
cluster and few small ones. If <K(K-1)>/<K> 1 small clusters have a broad (power-law) distribution
Perturbation which affects neighbors with probability p propagates if p<K(K-1)>/<K> 1
For scale-free networks P(K)~K- with <3, <K2>= perturbation always spreads in a large enough network
Problem 2: For a given p and how large should be the network for the perturbation to spread

Amplification ratios
• A(dir): 1.08 - E. Coli, 0.58 - Yeast • A(undir): 10.5 - E. Coli, 13.4 – Yeast• A(PPI): ? - E. Coli, 26.3 - Yeast
Problem 3: derive the above formula for directed networks

Beyond degree distributions:How is it all wired together?

Central vs peripheral network architecture
central(hierarchical)
peripheral(anti-
hierarchical)From A. Trusina, P. Minnhagen, SM, K. Sneppen, Phys. Rev. Lett. (2004)
random

Correlation profile Count N(k0,k1) – the number of links
between nodes with connectivities k0 and k1
Compare it to Nr(k0,k1) – the same property in a random network
Qualitative features are very noise-tolerant with respect to both false positives and false negatives


Correlation profile of the protein interaction network
R(k0,k1)=N(k0,k1)/Nr(k0,k1) Z(k0,k1) =(N(k0,k1)-Nr(k0,k1))/Nr(k0,k1)
Similar profile is seen in the yeast regulatory network


Correlation profile of the yeast regulatory network
R(kout, kin)=N(kout, kin)/Nr(kout,kin) Z(kout,kin)=(N(kout,kin)-Nr(kout,kin))/ Nr(kout,kin)

Some scale-free networks may appear similar
In both networks the degree distribution is scale-free P(k)~ k- with ~2.2-2.5

But: correlation profiles give them unique identities
InternetProtein interactions

How to construct a proper random network?

Randomization of a network
given complex network random

Basic rewiring algorithm
Randomly select and rewire two edges
Repeat many times
• R. Kannan, P. Tetali, and S. Vempala, Random Structures and Algorithms (1999)
• SM, K. Sneppen, Science (2002)

Metropolis rewiring algorithm
Randomly select two edges Calculate change E in “energy function”
E=(Nactual-Ndesired)2/Ndesired
Rewire with probability p=exp(-E/T)
“energy” E “energy” E+E
SM, K. Sneppen:cond-mat preprint (2002),Physica A (2004)

How do protein networks evolve?

Gene duplication
Pair of duplicated proteins
2 Shared interactionsOverlap=2/5=0.4
Pair of duplicated proteins
5 Shared interactionsOverlap=5/5=1.0
Right after duplication
After some time

Yeast regulatory network
SM, K. Sneppen, K. Eriksen, K-K. Yan, BMC Evolutionary Biology (2003)

100 million years ago

Protein interaction networksSM, K. Sneppen, K. Eriksen, K-K. Yan, BMC Evolutionary Biology (2003)

Why so many genes could be deleted without any
consequences?

Possible sources of robustness to gene deletions
Backup via the network (e.g. metabolic network could have several pathways for the production of the necessary metabolite)
Not all genes are needed under a given condition (say rich growth medium)
Affects fitness but not enough to kill Protection by closely related
homologs in the genome

Protective effect of duplicates
Gu, et al 2003Maslov, Sneppen,
Eriksen, Yan 2003
Yeast Worm
Maslov, Sneppen, Eriksen, Yan 2003
Z. Gu, … W.-H. Li, Nature (2003)
Maslov, Sneppen, Eriksen, Yan BMC Evol. Biol.(2003)

Summary There are many kinds of protein networks Networks in more complex organisms are more
interconnected Most have hubs – highly connected proteins Hubs often avoid each other (networks are anti-
hierarchical) There are many self-interacting proteins.
Probability to self-interact linearly scales with the degree K.
Networks evolve by gene duplications Robustness is often (but not always) provided by
gene duplicates

Part 2

Modules in networks and how to detect them using the Random walks/diffusion
K. Eriksen, I. Simonsen, SM, K. Sneppen, PRL (2003)

What is a module? Nodes in a given module (or
community group or functional unit) tend to connect with other nodes in the same module Biology: proteins of the same function
or sub-cellular localization WWW – websites on a common topic Internet – geography or organization
(e.g. military)

Do you see any modules here?

Random walkers on a network
Study the behavior of many VIRTUAL random walkers on a network
At each time step each random walker steps on a randomly selected neighbor
They equilibrate to a steady state ni ~ ki (solid state physics: ni = const)
Slow modes allow to detect modules and extreme edges

Matrix formalism
ˆ( 1) ( )
1/ if j iˆ0 otherwise
i ij jj
j
ij
n t T n t
KT
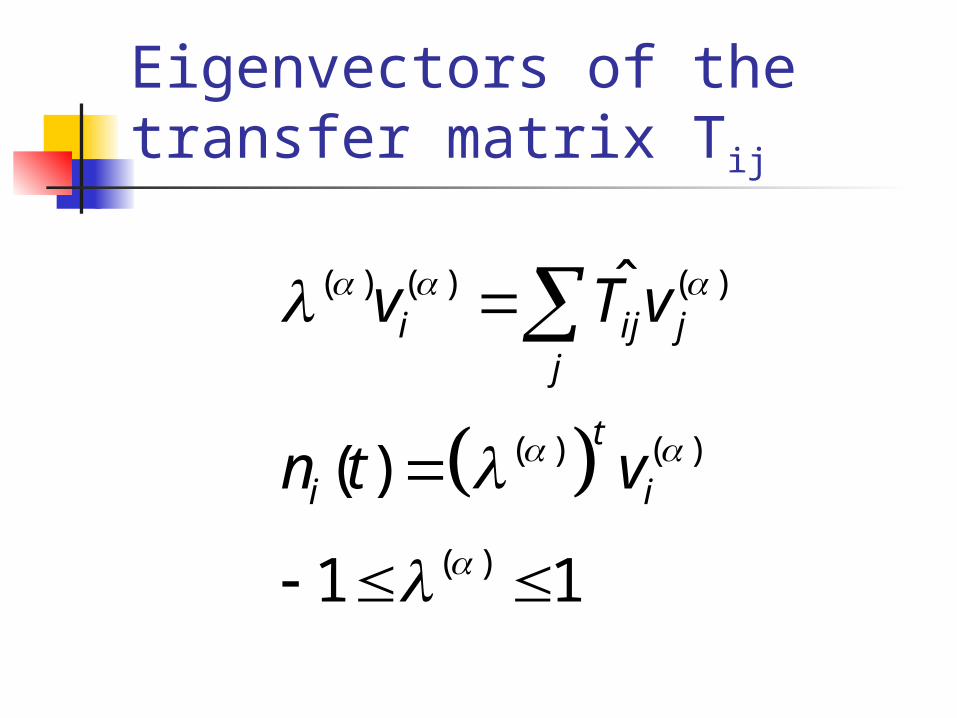
Eigenvectors of the transfer matrix Tij
( ) ( ) ( )
( ) ( )
( )
ˆ
( )
1 1
i ij jj
t
i i
v T v
n t v

US Military
Russia

2 0.9626 RU RU RU RU CA RU RU ?? ?? US US US US ?? (US Department of Defence)
3 0.9561 ?? FR FR FR ?? FR ??
RU RU RU ?? ?? RU ??
4 0.9523 US ?? US ?? ?? ?? ?? (US Navy)
NZ NZ NZ NZ NZ NZ NZ
5. 0.9474 KR KR KR KR KR ?? KR
UA UA UA UA UA UA UA

Hacked site


How Modules in the WWW influence Google ranking
H. Xie, K.-K. Yan, SM, cond-mat/0409087

How Google works? Too many hits to a typical query: need to rank One could rank the importance of webpages by Kin, but:
Too democratic: It doesn’t take into account importance of webpages sending links
it’s easy to trick and artificially boost the rank Google’s solution: simulate the behavior of many
“random surfers” and then count the number of hits for every webpage
Popular pages send more surfers your way the Google weight is proportional to Kin weighted by popularity
Surfer get bored following links use =0.15 for random jumps without any links
Last rule also solves the problem that some pages have no out-links

Mathematics of the Google Google solves a self-consistent Eq.:
Gi ~ j Tij Gj - find principal eigenvector
Tij= Aij/Kout (j) Model with random jumps:
Gi ~ (1-)j Tij Gj + j Gj

How do WWW communities (modules) influence the Gi?
Naïve argument: communities tend to “trap” random surfers they should increase the Google ranking of nodes in the community

log
10(G
c/G
w)
Ecc
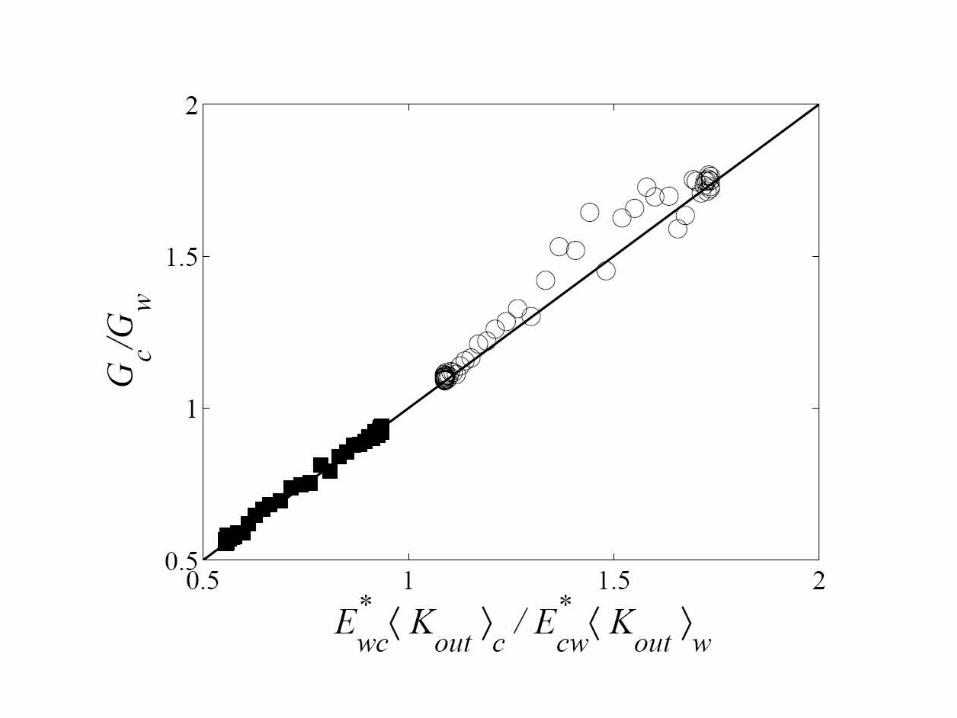
Test of a naïve argument
Naïve argument is completely wrong!

EccEww

Gc – average Google rank of pages in the community; Gw – in the outside world Ecw Gc/<Kout>c – current from C to W must be equal to: Ewc Gw/<Kout>w – current from W to C
Gc /Gw depends on the ratio between Ecw and Ewc – the number of edges (hyperlinks) between the community and the world


Networks with artificial communities To test let’s generate a scale-free
network with an artificial community of Nc pre-selected nodes
Use metropolis algorithm with H=-(# of intra-community nodes) and some inverse temperature
Detailed balance:

Collaborators:
Kim Sneppen – Nordita + NBI Kasper Eriksen –Lund U. Ingve Simonsen – U. of Trondheim
Huafen Xie – City University of NY Koon-Kiu Yan - Stony Brook U.

Summary
Diffusion process and modules (communities) in a network influence each other
In the “hardware” part of the Internet – the network of routers (Autonomous systems) -- diffusion allows one to detect modules and extreme edges
In the “software” part – WWW communities affect Google ranking in a non-trivial way

THE END