detecting voids under pavements: update on …docs.trb.org/prp/10-2738.pdf · detecting voids under...
TRANSCRIPT

DETECTING VOIDS UNDER PAVEMENTS: UPDATE ON THE DOD APPROACH
L.J. Malvar, PhD, PE
Naval Facilities Engineering Service Center 1100 23rd Avenue, Port Hueneme, CA 93043
805-982-1447, Fax 805-982-1074 [email protected]
12 November 2009
Word Count 7052
1
TRB 2010 Annual Meeting CD-ROM Paper revised from original submittal.
1
2
3 4 5 6 7 8 9
10 11 12 13 14 15
ABSTRACT
Several accidents involving aircraft punching through airfield pavements prompted the Navy to develop a technology for void detection. Initially, a successful void detection survey was completed at a Naval Air Station where several voids were generated by leakage of large underground drainpipes. Various methods were used such as internal videotaping of the pipes, heavy weight deflectometer (HWD) testing, ground penetrating radar (GPR), and dynamic cone penetrometer (DCP) testing. A state-of-the-art review was also completed to assess all existing technology applicable to void detection under pavements. However, the optimum technology (visual inspection, HWD, and DCP) still presented limitations in terms of availability and speed of data acquisition, requiring prioritization of the work. A risk analysis was then completed, establishing work prioritization within each airfield and providing a prioritization of all U.S. Navy and Marine Corps airfield pavements. An Interim Policy and Technical Guidance (IP&TG) was issued on 23 March 2000 to establish the developed void detection methodology. This is now included as an appendix in Department of Defense Unified Facilities Criteria UFC 3-260-03 and routinely applied at all 70 major Navy and Marine Corps airfields. This paper summarizes the methodology used and presents some recent field cases.
1
TRB 2010 Annual Meeting CD-ROM Paper revised from original submittal.

INTRODUCTION 1
2 3 4 5 6 7 8 9
10 11 12 13
14
15 16 17 18 19 20 21 22 23 24 25 26
29
31 32
34 35 36
38
40 41 42 43 44
45
46
47 48
In May 1999, the front gear of a T-34C aircraft fell into a 12-inch deep hole that formed in a taxiway at Naval Air Station (NAS) Pensacola. This pavement failure was due to local base and subgrade erosion from a leaking drainpipe under the taxiway. The Naval Facilities Engineering Service Center (NAVFAC ESC) and the Naval Facilities Engineering Command (NAVFAC) Southern Division were tasked to determine the extent of potential voids near all drainpipes under the runways, taxiways, and aprons [1]. In addition, NAVFAC ESC was tasked to assess the available current technology for void detection under pavements, determine the optimum methodology, and prepare guidance for proactive detection of voids to prevent future similar failures [2]. To reduce the cost of the assessments, a risk analysis was completed, establishing work prioritization within each airfield, and providing a prioritization of all Navy and Marine Corps airfield pavements [3]. The methodology does not distinguish between an actual void and a weak area, since only their effect on load-carrying capacity is of interest. This paper details the current optimum void detection methodology and shows some actual field applications.
OPTIMUM VOID DETECTION METHODOLOGY
A review of the state-of-the-art non-destructive technologies applicable to void detection under airfield pavements was completed [2], including: (1) Electromagnetic (Ground Penetrating Radar, Microwave and Millimeter Wave, Infrared Thermography, Magnetic Fields, Electrical Resistivity/Conductivity, Spontaneous Potential, and including Visual Inspections – since the visible spectrum can be used to detect pavement problems at the surface), (2) Transient Load (Seismic Waves, Impact-Echo, Heavy Weight Deflectometer, Rolling Deflectometers, Vibratory Loading Systems, Rolling Dynamic Deflectometer, Ultrasound, Acoustic Reflection Sounding, Acoustic Emission, Audible Acoustic Reflection Sounding), and (3) Others, such as Video Taping, Quasi-Static Load-Deflection Devices, Gravitational, and Soil Penetration techniques, the latter including Dynamic Cone Penetrometer (DCP), Electronic Cone Penetrometer (ECP), and Standard Penetration Test (SPT).
The experience of many Government agencies, State Departments of Transportation, academia, and private firms on all available applicable techniques was also gathered and summarized. The following were conclusions derived from this knowledge:
1. No single technique is currently capable of providing a complete solution to the void detection problem. 27
2. A combination of technologies can, however, provide a cost-effective, reliable methodology to minimize the 28 potential for accidental airfield pavement failure due to subsurface voids.
3. The optimum technology combination at the current time is a combination of visual, Heavy Weight 30 Deflectometer (HWD), and DCP techniques, which can be completed by a single operator. The DCP can be replaced by an ECP or an SPT, but these techniques require additional manpower.
4. Complementary technologies include video taping and ground penetrating radar (GPR). Video taping can 33 detect pipe failures indicative of potential void problems, and even detect actual voids. GPR is very useful for determining pavement layer thickness (for use in HWD structural evaluation), and location of drainpipes (assuming favorable low conductivity subgrade characteristics), but is not very reliable when detecting voids.
5. Promising technologies include Rolling Weight Deflectometer, High Speed Deflectograph, Rolling Dynamic 37 Deflectometer, and Infrared Thermography.
6. In some cases, for example when the area to investigate is large, using the HWD to perform a thorough 39 coverage may not be possible. In that case, it is recommended that: (1) the HWD be used at any critical location within the area of concern, (2) the GPR be used to complete coverage of the area in an attempt to identify subsurface anomalies (assuming soil characteristics allow its use), (3) the HWD be used again at the discrete locations where the GPR identifies anomalies, and (4) DCP (or ECP or SPT) testing be completed where weaknesses were confirmed by the HWD.
UNIFIED FACILITY CRITERIA
From the above information, an Interim Technical Guidance was developed and approved by the Naval Facilities Engineering Command on 23 March 2000. It was updated in 2009 and included as an appendix in the draft update
2
TRB 2010 Annual Meeting CD-ROM Paper revised from original submittal.
1 2 3
4
5 6 7 8 9
10 11 12 13 14 15 16 17 18 19 20 21 22
to the Tri-Service Department of Defense Unified Facilities Criteria UFC 3-260-03 [4]. Its recommendations are summarized below.
Visual Inspection
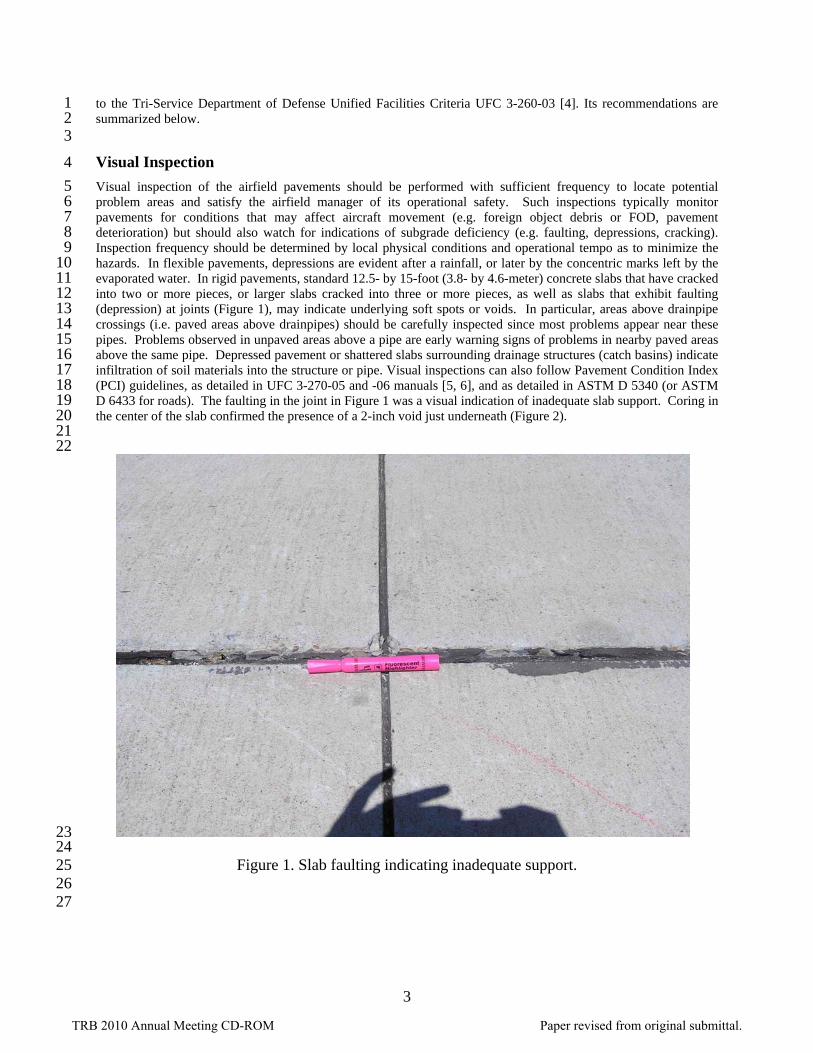
Visual inspection of the airfield pavements should be performed with sufficient frequency to locate potential problem areas and satisfy the airfield manager of its operational safety. Such inspections typically monitor pavements for conditions that may affect aircraft movement (e.g. foreign object debris or FOD, pavement deterioration) but should also watch for indications of subgrade deficiency (e.g. faulting, depressions, cracking). Inspection frequency should be determined by local physical conditions and operational tempo as to minimize the hazards. In flexible pavements, depressions are evident after a rainfall, or later by the concentric marks left by the evaporated water. In rigid pavements, standard 12.5- by 15-foot (3.8- by 4.6-meter) concrete slabs that have cracked into two or more pieces, or larger slabs cracked into three or more pieces, as well as slabs that exhibit faulting (depression) at joints (Figure 1), may indicate underlying soft spots or voids. In particular, areas above drainpipe crossings (i.e. paved areas above drainpipes) should be carefully inspected since most problems appear near these pipes. Problems observed in unpaved areas above a pipe are early warning signs of problems in nearby paved areas above the same pipe. Depressed pavement or shattered slabs surrounding drainage structures (catch basins) indicate infiltration of soil materials into the structure or pipe. Visual inspections can also follow Pavement Condition Index (PCI) guidelines, as detailed in UFC 3-270-05 and -06 manuals [5, 6], and as detailed in ASTM D 5340 (or ASTM D 6433 for roads). The faulting in the joint in Figure 1 was a visual indication of inadequate slab support. Coring in the center of the slab confirmed the presence of a 2-inch void just underneath (Figure 2).
23 24 25 26 27
Figure 1. Slab faulting indicating inadequate support.
3
TRB 2010 Annual Meeting CD-ROM Paper revised from original submittal.

1
2 3 4
5
6 7 8 9
10 11 12 13 14 15 16 17 18 19 20 21 22 23 24 25 26 27 28
32 33 34
38 39
Figure 2. Two-inch deep void under slab center.
HWD Testing
The HWD is an impact load device, which applies a single-pulse transient load of about 20 to 30 milliseconds of duration. This trailer-mounted device applies a dynamic force to the pavement surface by dropping a weight onto a set of rubber cushions which in turn transfer the load to the pavement through a 17.7-inch (45-cm) diameter plate. The drop height can be varied from 0 to 15.7 inches (40 cm) to produce forces from 9,000 to 60,000 lbf (40 to 267 kN). While the terms HWD and falling weight deflectometer (FWD) are often used interchangeably, the FWD usually produces lower loads, in the order of 1,500 to 27,000 lbf (7 to 120 kN). Load is measured with a load cell at the center of the plate. Typically, seven velocity gages are used to measure pavement velocities and determine corresponding deflections. These gages (D1 through D7) are located at 0, 15, 24, 36, 48, 60, and 72 inches (0, 38, 61, 91, 122, 152, and 183 cm) from the load point to capture the deflection basin. The advantage of this method is that the results can be directly related to a load carrying capacity for the pavement, e.g., using the aircraft classification number / pavement classification number (ACN/PCN) approach [4, 7, 8]. The disadvantage of this method is that tests can only be completed at a limited number of discrete locations, and each test covers only an area about 5 feet (1.5 meters) in radius, or less. Hence in the search for voids or pavement weaknesses, tests must be conducted on 10-foot (3-meter) grids, and the testing becomes very labor intensive. If visual inspection suggests concern, further evaluation using a HWD should be performed. The HWD will establish the effect of any subgrade weakness (or void) on the load-carrying capacity of the pavement. For the Navy, HWD evaluations have been performed by the local NAVFAC regional Facilities Engineering Command (FEC) with support from NAVFAC ESC. Periodic testing with a HWD is also recommended at all pipe crossings. This HWD testing is typically completed at the same time as the standard pavement classification number (PCN) structural evaluation cycle, as described in Reference [4]. The following procedure using the heavy weight deflectometer (HWD) was developed by NAVFAC ESC for void detection in limited critical areas [1, 2, 3]. In general data are collected above drainpipes (where most problems arise), and the data collection procedure for asphalt pavements was as follows: Follow each drainpipe every 10 feet but offset to right by 10 feet (3 meters) (line 1) 29 Follow each drainpipe and test above the pipe every 10 feet (3 meters) (line 2) 30 Follow each pipe again but offset to left by 10 feet (3 meters) (line 3) 31
Hence, three sets of readings are obtained for each distance along the pipe. The 10-foot (3-meter) distance was chosen because it is expected that the HWD cannot sense pavement deficiencies beyond about a 5-foot (1.5-meter) radius. For concrete pavements, the procedure is similar: Follow each drainpipe and test at the center of each slab to the left of the slab above the pipe (line 1) 35 Follow each drainpipe and test at the center of each slab above the pipe (line 2) 36 Follow each drainpipe and test at the center of each slab to the right of the slab above the pipe (line 3). 37
Because Navy slabs are usually 12.5 by 15 feet (3.8 by 4.6 meters), a slightly different grid is obtained. To allow for direct comparison between slabs, tests are only carried out at the center of each slab. If the pipe falls
4
TRB 2010 Annual Meeting CD-ROM Paper revised from original submittal.

just under a joint, only 2 lines are completed, on either side of the drainpipe. If the slabs are not aligned with the drainpipe, offset sets of 3 slabs are evaluated (left, above, and right of the pipe).
1 2 3 4 5 6 7 8 9
10 11 12
14
21 22 23 24 25 26 27 28 29 30 31 32 33 34 35 36 37 38 39 40 41 42 43 44 45 46 47 48 49 50 51 52 53
At each test location a set of seven deflections is obtained, D1 though D7, where D1 is under the load point. Once the data is gathered, the impact stiffness modulus (ISM) can be used to assess the pavement’s relative strength at each drop location. The ISM reflects the local pavement stiffness under the load point, and is found by dividing the load by D1, and is often referred to as ISM1. Similarly, the load can be divided by the other deflections, to give ISM2 = Load/D2, and so on, up to ISM7 = Load/D7. This is of interest since D1 usually reflects mostly the state of the pavement itself, whereas D7 reflects mostly the state of the subgrade. Using D1 alone is not sufficient to successfully detect voids under the pavement. The ISM1 through ISM7 values along the drainpipes can be plotted and analyzed. They can also be normalized (by dividing each value by the highest value along the drain pipe) to determine relative effects of pavement weaknesses on each sensor.
Once the plots are completed, the following rules can be followed to determine potentially weak areas: For asphalt pavements, an absolute ISM1 value below about 300 kips/inch (52.5 MN/m) is of concern (or 13
represents a weak pavement) For concrete pavements, an absolute ISM1 value below 1000 kips/inch (175 MN/m) is of concern 15 An absolute ISM7 value below 3000 kips/inch (525 MN/m) is of concern 16 A relative ISM decay indicates an unexpected weakness. 17 A weakness in ISM 1 indicates it is shallow. 18 A weakness in ISM 7 indicates it is deep (from 3 to 20 feet, or about 1 to 6 m). 19 A weakness in both ISM 1 and ISM 7 indicates a general lack of support. 20
The absolute values were derived empirically from the extensive database, or from previously established relationships. For example, if the California Bearing Ratio (CBR) of the soil is calculated as a function of the subgrade modulus (E) in pounds per square inch [9] as:
CBR = E/1500
and the subgrade modulus (in psi) is given as a function of the deflection (in thousands of an inch) measured at an offset distance of 72 inches (183 cm) (this is at D7) and normalized to 25,000 pounds (111 kN) [9]:
98737.0782.59304 DE then the CBR corresponding to an ISM7 value of 3000 kips/inch (525 MN/m) is calculated to be about 4.9%. This validates the choice of 3000 kips/inch as a threshold value, since CBR values below 5% correspond to low and ultra low subgrades. Direct correlation with field problems also validated this threshold.
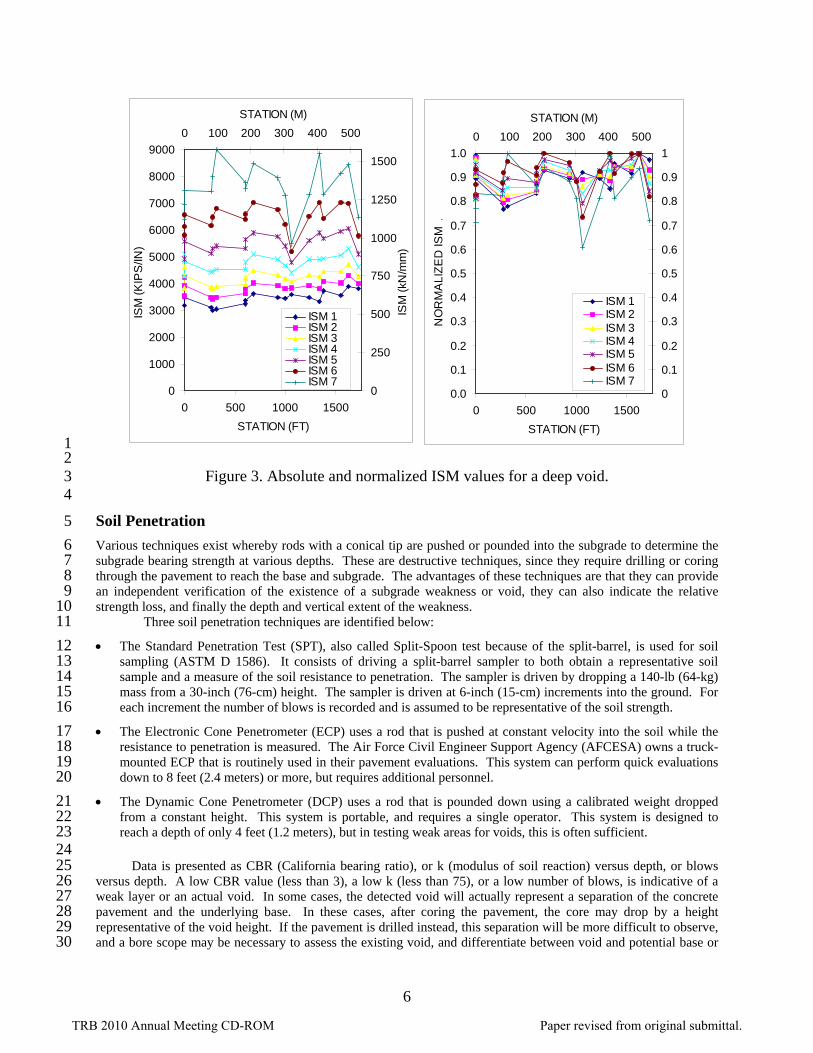
The HWD data does indicate if the potential void, or subgrade weakness, is shallow or deep. It can be seen in Figure 3 that at station 1,060 feet (323 meters), the value of ISM1 is not affected, but the values of ISM4 to ISM7 show a significant loss of stiffness, when compared with the rest of the data above that drain pipe – this is an example of a deep void being created near the pipe.
Figure 4 shows a case where ISM1 to ISM4 exhibit more decay than ISM5 to ISM7 at station 10. This is indicative of a shallow weakness in the subgrade. These guidelines have proven very successful in determining voids and weak or loose soils under pavements using the HWD [1]. Other void detection methodologies using the HWD have been attempted [2], but they either are more complex or do not appear as reliable.
When coverage of large areas is required (e.g., where karst formations are prevalent), the current HWD technology may not always be able to provide a cost-efficient solution. A risk analysis study indicated that for runways, two lines (10 feet, or 3 m, on either side of the runway centerline) can be covered with the HWD and be cost effective. Along each line, for asphalt pavements longitudinal testing should be completed at 10-foot (3-meter) spacings (20-foot, or 6-m, spacings for preliminary assessments), and for Portland cement concrete pavements longitudinal testing should be completed at each slab center at 15-foot (4.6-meter) spacing, for Navy airfields. The remainder of the runway is less likely to be used, and can be assessed using a less reliable but faster technique, such as the GPR.
HWD testing is currently performed at all 70 major Navy and Marine Corps bases approximately every 10 to 12 years, depending on the void formation potential based on prior assessments.
5
TRB 2010 Annual Meeting CD-ROM Paper revised from original submittal.
0.0
0.1
0.2
0.3
0.4
0.5
0.6
0.7
0.8
0.9
1.0
0 500 1000 1500
STATION (FT)N
OR
MA
LIZ
ED
ISM
.
0
0.1
0.2
0.3
0.4
0.5
0.6
0.7
0.8
0.9
1
0 100 200 300 400 500
STATION (M)
ISM 1ISM 2ISM 3ISM 4ISM 5ISM 6ISM 7
0
1000
2000
3000
4000
5000
6000
7000
8000
9000
0 500 1000 1500
STATION (FT)
ISM
(K
IPS
/IN)
0
250
500
750
1000
1250
1500
0 100 200 300 400 500
STATION (M)
ISM
(kN
/mm
)
ISM 1ISM 2ISM 3ISM 4ISM 5ISM 6ISM 7S i 8
1 2 3 4
5
6 7 8 9
10 11
13 14 15 16
18 19 20
22 23 24 25 26 27 28 29 30
Figure 3. Absolute and normalized ISM values for a deep void.
Soil Penetration
Various techniques exist whereby rods with a conical tip are pushed or pounded into the subgrade to determine the subgrade bearing strength at various depths. These are destructive techniques, since they require drilling or coring through the pavement to reach the base and subgrade. The advantages of these techniques are that they can provide an independent verification of the existence of a subgrade weakness or void, they can also indicate the relative strength loss, and finally the depth and vertical extent of the weakness.
Three soil penetration techniques are identified below:
The Standard Penetration Test (SPT), also called Split-Spoon test because of the split-barrel, is used for soil 12 sampling (ASTM D 1586). It consists of driving a split-barrel sampler to both obtain a representative soil sample and a measure of the soil resistance to penetration. The sampler is driven by dropping a 140-lb (64-kg) mass from a 30-inch (76-cm) height. The sampler is driven at 6-inch (15-cm) increments into the ground. For each increment the number of blows is recorded and is assumed to be representative of the soil strength.
The Electronic Cone Penetrometer (ECP) uses a rod that is pushed at constant velocity into the soil while the 17 resistance to penetration is measured. The Air Force Civil Engineer Support Agency (AFCESA) owns a truck-mounted ECP that is routinely used in their pavement evaluations. This system can perform quick evaluations down to 8 feet (2.4 meters) or more, but requires additional personnel.
The Dynamic Cone Penetrometer (DCP) uses a rod that is pounded down using a calibrated weight dropped 21 from a constant height. This system is portable, and requires a single operator. This system is designed to reach a depth of only 4 feet (1.2 meters), but in testing weak areas for voids, this is often sufficient.
Data is presented as CBR (California bearing ratio), or k (modulus of soil reaction) versus depth, or blows versus depth. A low CBR value (less than 3), a low k (less than 75), or a low number of blows, is indicative of a weak layer or an actual void. In some cases, the detected void will actually represent a separation of the concrete pavement and the underlying base. In these cases, after coring the pavement, the core may drop by a height representative of the void height. If the pavement is drilled instead, this separation will be more difficult to observe, and a bore scope may be necessary to assess the existing void, and differentiate between void and potential base or
6
TRB 2010 Annual Meeting CD-ROM Paper revised from original submittal.

1 2 3 4 5 6
7
8 9
10 11 12 13 14 15 16
17
18 19 20 21 22 23 24 25 26 27 28 29 30 31 32 33 34 35 36 37 38 39 40
41
42 43 44 45 46 47 48 49
subgrade damage from drilling. Prior to testing, it will be necessary to insure that no other buried utilities are present. Weak areas revealed by the HWD should be further tested to determine the depth of the weakness and the potential damage, in order to determine the type of repair needed. This can be completed using a DCP, ECP, or SPT, or by video taping.
Video Taping
Video taping the interior of drainpipes is recommended when the presence of voids is suspected from visual inspection and/or HWD readings at or near pipe crossings. Video taping will help pinpoint the location of potential problem areas and define the required maintenance and repair. Typical damage includes pipe cracking/deterioration and joint leaks. Accumulations of fines near the leaks are a good indicator of a loss of subgrade material, and possibly subgrade strength. In some cases, actual voids beyond joint and pipe breaks have been observed [1]. However, it has been shown that this method may not identify all weak pavement areas [1], and it cannot determine the loss of load carrying capacity at the identified locations. Hence video taping is often used as a complementary technique.
Ground Penetrating Radar
GPR works by transmitting a short radar pulse, typically from the transient voltage pulse from an overloaded avalanche transistor. The pulse reflection is measured, and is dependent on the soil’s electrical conductivity. Objects or areas in the ground with different electrical properties will reflect the pulse differently, and appear as anomalies. Soil penetration depends on soil type and antenna type. Soil moisture, as well as high clay soils, will quickly attenuate the radar signal and decrease its performance (i.e. dry sandy soils are best). High frequency antennas, in the order of 1 to 2 GHz, produce the best resolution (i.e., can find small objects), but can only penetrate a few inches. Low frequency antennas, in the order or 10 to 200 MHz, can penetrate tens to hundreds of feet, depending on soil conditions, but may not be able to locate small objects or small diameter pipes. For airfield pavements, where the depths of interest vary from 1 to 20 feet, two antennas may be required, one around 900 MHz and one around 200 MHz. GPR systems can generate a real time continuous record of soil cross sections, with a given depth and width. The raw signal can also be postprocessed to better identify anomalies. In any case, proper interpretation of GPR output requires considerable operator experience and is an art as well as a science.
GPR results, however, cannot be directly related to load carrying capacity, as is done with the HWD. The GPR can identify areas that are different, i.e. anomalies in the pavement, but cannot quantify their impact on the load capacity, e.g. it cannot indicate if the area is relatively weaker or stronger. Also, the GPR will not penetrate significantly through clays or wet soils, limiting its applicability. A survey of GPR users indicated that it was a useful tool only between 25% and 75% of the time. Hence the GPR cannot be used as a reliable tool to predict weak areas and should not be used by itself for void detection
On the other hand, the advantage of the GPR resides in its ability to process a large amount of data quickly (covering a large area while producing a real time output), and in its ability to pinpoint drainpipe locations (as well as estimate pavement thickness). Anomalies found with the GPR alone will need to be verified with the HWD and the DCP, or via video taping.
Complementary Methods
Alternate non-destructive techniques were evaluated: they are not believed to be as effective as the aforementioned tools in determining the existence of voids, but can be used as complementary tools. For example, acoustic reflection sounding has been used by ASTM D 4580 to find delaminations in concrete bridge decks. Similarly, in some instances, a person walking alongside the HWD could hear a difference in the sound of the pavement spanning a shallow void, in particular with thin concrete pavements. This should be noted to bring attention to the potential of a void just under the slab during coring or drilling. Once coring or drilling has been completed, the use of a bore scope has also been helpful in assessing the existence of such voids.
7
TRB 2010 Annual Meeting CD-ROM Paper revised from original submittal.
VERIFICATION OF HWD PREDICTION METHODOLOGY 1
2 3 4 5 6 7 8 9
10
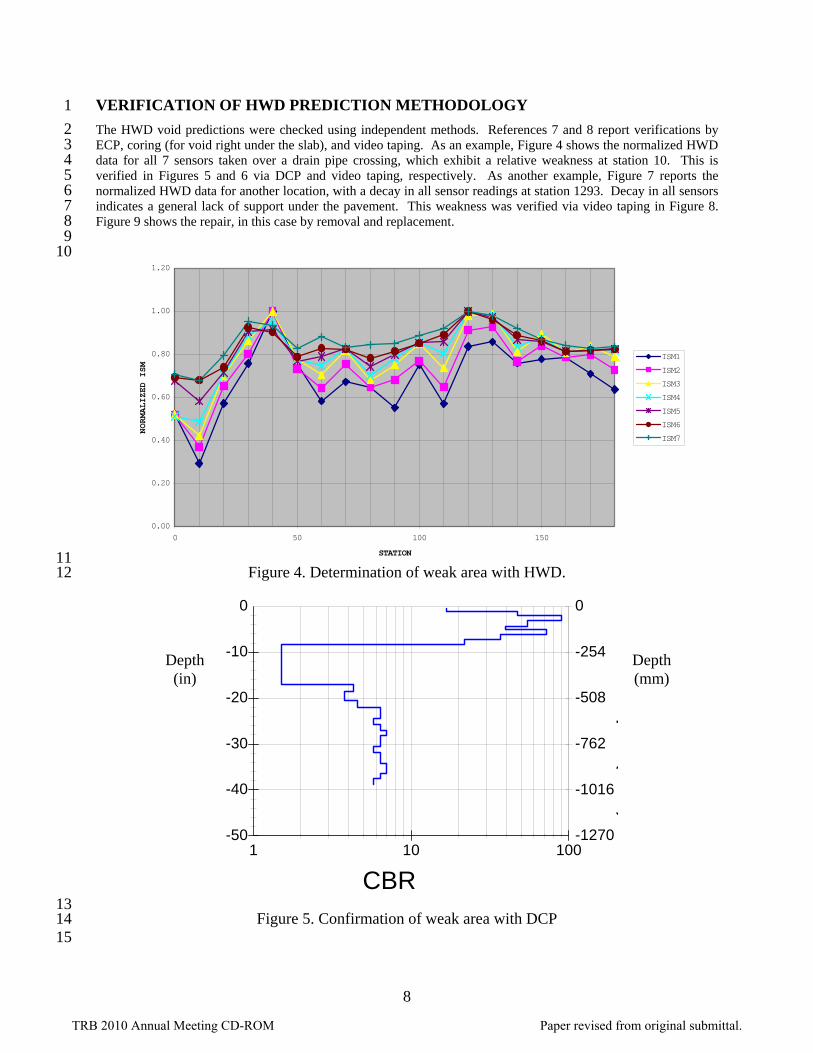
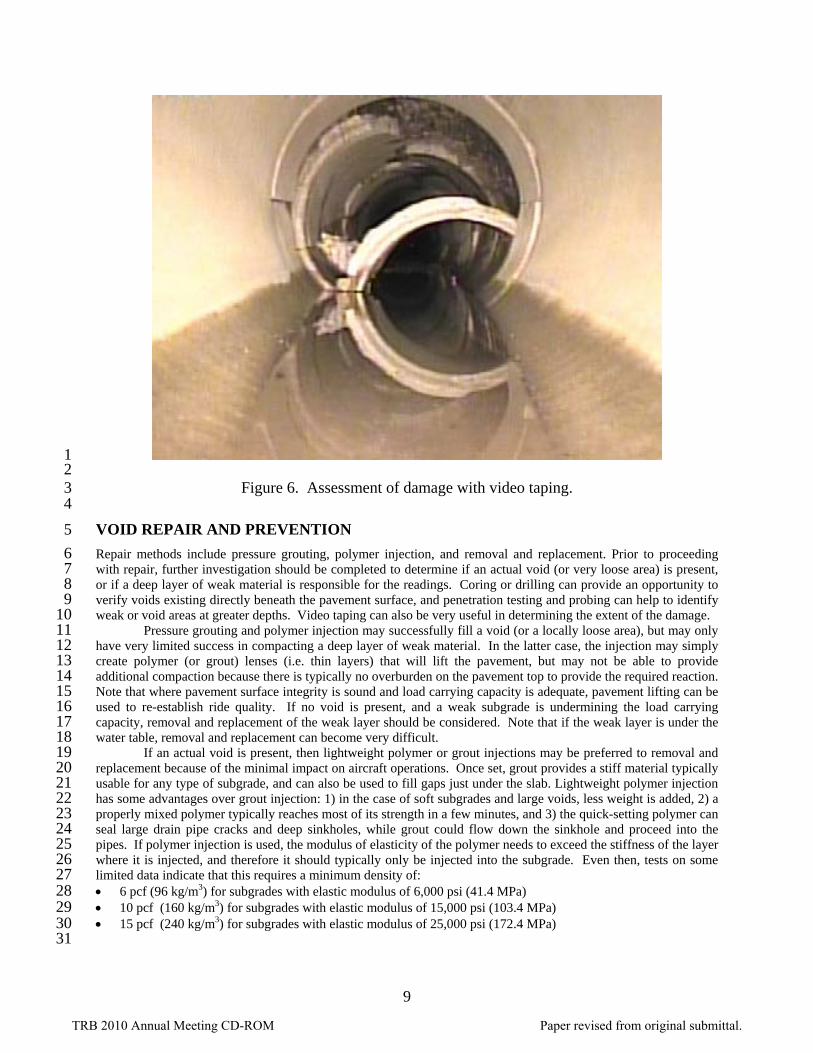
The HWD void predictions were checked using independent methods. References 7 and 8 report verifications by ECP, coring (for void right under the slab), and video taping. As an example, Figure 4 shows the normalized HWD data for all 7 sensors taken over a drain pipe crossing, which exhibit a relative weakness at station 10. This is verified in Figures 5 and 6 via DCP and video taping, respectively. As another example, Figure 7 reports the normalized HWD data for another location, with a decay in all sensor readings at station 1293. Decay in all sensors indicates a general lack of support under the pavement. This weakness was verified via video taping in Figure 8. Figure 9 shows the repair, in this case by removal and replacement.
0.00
0.20
0.40
0.60
0.80
1.00
1.20
0 50 100 150
STATION
NORMALIZED ISM
ISM1
ISM2
ISM3
ISM4
ISM5
ISM6
ISM7
11 12
13 14 15
Figure 4. Determination of weak area with HWD.
Figure 5. Confirmation of weak area with DCP
Depth (in)
Depth (mm)
CBR
-10
-20
-30
-40
-50
0
1 10010
0
-254
-508
-1270
-1016
p(
)
-762
8
TRB 2010 Annual Meeting CD-ROM Paper revised from original submittal.
1 2 3 4
5
6 7 8 9
10 11 12 13 14 15 16 17 18 19 20 21 22 23 24 25 26 27
31
Figure 6. Assessment of damage with video taping.
VOID REPAIR AND PREVENTION
Repair methods include pressure grouting, polymer injection, and removal and replacement. Prior to proceeding with repair, further investigation should be completed to determine if an actual void (or very loose area) is present, or if a deep layer of weak material is responsible for the readings. Coring or drilling can provide an opportunity to verify voids existing directly beneath the pavement surface, and penetration testing and probing can help to identify weak or void areas at greater depths. Video taping can also be very useful in determining the extent of the damage.
Pressure grouting and polymer injection may successfully fill a void (or a locally loose area), but may only have very limited success in compacting a deep layer of weak material. In the latter case, the injection may simply create polymer (or grout) lenses (i.e. thin layers) that will lift the pavement, but may not be able to provide additional compaction because there is typically no overburden on the pavement top to provide the required reaction. Note that where pavement surface integrity is sound and load carrying capacity is adequate, pavement lifting can be used to re-establish ride quality. If no void is present, and a weak subgrade is undermining the load carrying capacity, removal and replacement of the weak layer should be considered. Note that if the weak layer is under the water table, removal and replacement can become very difficult.
If an actual void is present, then lightweight polymer or grout injections may be preferred to removal and replacement because of the minimal impact on aircraft operations. Once set, grout provides a stiff material typically usable for any type of subgrade, and can also be used to fill gaps just under the slab. Lightweight polymer injection has some advantages over grout injection: 1) in the case of soft subgrades and large voids, less weight is added, 2) a properly mixed polymer typically reaches most of its strength in a few minutes, and 3) the quick-setting polymer can seal large drain pipe cracks and deep sinkholes, while grout could flow down the sinkhole and proceed into the pipes. If polymer injection is used, the modulus of elasticity of the polymer needs to exceed the stiffness of the layer where it is injected, and therefore it should typically only be injected into the subgrade. Even then, tests on some limited data indicate that this requires a minimum density of: 6 pcf (96 kg/m3) for subgrades with elastic modulus of 6,000 psi (41.4 MPa) 28 10 pcf (160 kg/m3) for subgrades with elastic modulus of 15,000 psi (103.4 MPa) 29 15 pcf (240 kg/m3) for subgrades with elastic modulus of 25,000 psi (172.4 MPa) 30
9
TRB 2010 Annual Meeting CD-ROM Paper revised from original submittal.

If lightweight polymer or grout injection is not available or feasible, then pavement and base removal and replacement can be considered, down to the prescribed depth. When pipe deterioration is extensive, internal pipe repair, jacketing, or pipe replacement should be considered.
1 2 3 4
SD J-11, 0+14C, 5+76R, 11+22L
0.20.30.40.50.60.70.80.9
1
0 200 400 600 800 1000 1200 1400 1600
STATION (FT)
NO
RM
AL
IZE
D IS
M
ISM 1ISM 2ISM 3ISM 4ISM 5ISM 6ISM 7
5 6 7
Figure 7. Determination of weak area with HWD.
8 9
10 11
Figure 8. Assessment of damage with video taping.
10
TRB 2010 Annual Meeting CD-ROM Paper revised from original submittal.

1 2 3 4
5
6 7 8 9
10 11 12 13 14
15
16 17 18 19 20
21
23 24
26
28 29
Figure 9. Repair by removal and replacement.
CONCLUSIONS
A review of all applicable void detection technologies was completed to determine an optimum methodology to detect voids, or weak zones, under airfield pavements. The current optimum technology includes a combination of visual inspection, HWD, and DCP testing. Complementary tools such as GPR and videotaping are useful in locating the pipes and inspecting them. The HWD predictions were verified using several other techniques, such as ECP, SPT, DCP, coring, and videotaping. This optimum technology is applied only to limited, critical areas, such as above drainpipes, and along the runway centerline. This technology is now included as an appendix in the latest draft of Department of Defense Unified Facilities Criteria UFC 3-260-03. The ongoing void detection program at all major Navy and Marine Corps bases has allowed for the detection and repair of numerous voids and weak areas.
ACKNOWLEDGMENTS
The reported assessments and repairs were completed by the Navy Pavement Team, in particular NAVFAC Southwest, Southeast, and Atlantic. Support by the Tri-Service Pavement Team in developing and implementing this technology is also acknowledged. The airfield pavement void detection program is sponsored by Commander, Navy Installations Command, and Commandant of the Marine Corps.
REFERENCES
1. Malvar, L.J., Lesto, J., Cline, G., Beverly, W. Airfield Pavement Void Detection, NAS Pensacola. Site Specific 22 Report SSR-2534-SHR, Naval Facilities Engineering Service Center, Port Hueneme, CA, December 1999 (limited distribution).
2. Malvar, L.J., Cline, G. Airfield Pavement Void Detection Technology. Special Publication SP-2081-SHR, 25 Naval Facilities Engineering Service Center, Port Hueneme, CA, April 2000 (limited distribution).
3. Malvar, L.J., Cline, G. Risk Analysis for Void Detection under Airfield Pavements. Special Publication SP-27 2095-SHR, Naval Facilities Engineering Service Center, Port Hueneme, CA, September 2000 (limited distribution).
11
TRB 2010 Annual Meeting CD-ROM Paper revised from original submittal.

12
4. Headquarters, Department of the Army, Air Force and Navy. Airfield Pavement Evaluation. Unified Facilities 1 Criteria UFC 3-260-03, Washington, DC, April 2001 (http://www.wbdg.org). 2
5. Headquarters, Department of the Army, Air Force and Navy. Paver Concrete Surfaced Airfields Pavement 3 Condition Index (PCI). Unified Facilities Criteria UFC 3-270-05, Washington, DC, March 2001 4 (http://www.wbdg.org). 5
6. Headquarters, Department of the Army, Air Force and Navy. Paver Asphalt Surfaced Airfields Pavement 6 Condition Index (PCI). Unified Facilities Criteria UFC 3-270-06, Washington, DC, March 2001 7 (http://www.wbdg.org). 8
7. Malvar, L.J., Cline, G.D. Void Detection under Airfield Pavements. Pavement Evaluation 2002, Roanoke, VA, 9 21-25 October 2002. 10
12
14
8. Malvar, L.J., Cline, G.D. Detecting Voids under Asphalt and Concrete Pavements. Transportation Systems 11 2004, Fort Lauderdale, FL, March 2004.
9. Alexander, D. Technical Manual Nondestructive Procedures for Airfield Pavement Evaluation – Draft. US 13 Army Corps of Engineers, Waterways Experiment Station, December 1994.
TRB 2010 Annual Meeting CD-ROM Paper revised from original submittal.