detection and localization of traffic lights using …
TRANSCRIPT
DETECTION AND LOCALIZATION OF TRAFFIC LIGHTS USING YOLOV3 AND
STEREO VISION
Wael Omar1*, Impyeong Lee1, Gyuseok Lee1, Kang Min Park1
1 Dept. of Geoinformatics, University of Seoul, Seoul, Republic of Korea – (uosgrad2018009, iplee, ys96000,)@uos.ac.kr, [email protected]
Commission II, WG II/ 1
KEY WORDS: traffic lights, detection, localization, convolutional neural network, stereo vision.
ABSTRACT:
This paper focus on traffic light distance measurement using stereo camera which is a very important and challenging task in image
processing domain, where it is used in several systems such as Driving Safety Support Systems (DSSS), autonomous driving and traffic
mobility. In this paper, we propose an integrated traffic light distance measurement system for self-driving based on stereo image
processing. Therefore, an algorithm to spatially locate the detected traffic light is required in order to make these detections useful. In
this paper, an algorithm to detect, classify the traffic light colours and spatially locate traffic light are integrated. Detection and colours
classification are made simultaneously via YOLOv3, using RGB images. 3D traffic light localization is achieved by estimating the
distance from the vehicle to the traffic light, by looking at detector 2D bounding boxes and the disparity map generated by stereo
camera. Moreover, Gaussian YOLOv3 weights based on KITTI and Berkeley datasets has been replaced with the COCO dataset.
Therefore, a detection algorithm that can cope with mislocalizations is required in autonomous driving applications. This paper
proposes an integrated method for improving the detection accuracy and traffic lights colours classification while supporting a real-
time operation by modelling the bounding box (bbox) of YOLOv3. The obtained results show fair results within 20 meters away from
the sensor, while misdetection and classification appeared in further distance.
1. INTRODUCTION
Our transportation system must be autonomous to avoid
accident scenarios. The vehicles should have eyes, not real
eyes, but cameras for these things to happen. Traffic lights are
also one of these important objects. Since the drivers are often
wrong in complying with the rules of traffic light, traffic lights
detection is considered to be very important because they are
a part of public safety.
A variety of algorithms have been used for traffic signs and
lights as well. Ultimately, integrating different methods,
detection, color recognition and distance calculation, into one
system is essential for an autonomous vehicle for safety
reason. Safety is not only for drivers and passengers but also
for pedestrians, other vehicles and two-wheelers. In order to
be widely accepted, safety issues must be resolved to the full
satisfaction of the people. Self-driving vehicles are now part
of our transport network. The fast development of automotive
technology focuses on giving us the best safety features and
Automated Driving Systems (ADS) in vehicles can handle the
entire work of driving when the person wants the vehicle to
switch to an auto-driving mode or when the person is unsure
of driving. Self-driving vehicles and trucks that drive us will
become a reality instead of us driving them. Object detection
is necessary to achieve all these things.
Object detection is now commonly used as a major software
system in self-driving cars for the detection of objects such as
pedestrians, cars, traffic lights etc. The scenario is even worse
in cases of drunk driving, where the driver would lose control
* Corresponding author
and hit other vehicles and will not stop at the traffic lights,
leading to major accidents and even death.
De Charette et al (Raoul de Charette, 2009)suggested a three-
step procedure. spotlight detection is executed in the grey level
image by using top hat morphological operator to highlight
high-intensity spots.
Mu et al (G. Mu, 2015)proposed an image processing
approach that converts the image color from red green blue
(RGB) to hue-saturation value (HSV). Potential areas were
then identified by scanning the scene using transcendental
colour threshold with prior knowledge of the image. Finally, it
was identified the location of the traffic lights using the
Oriented Gradients (HOG) and Support Vector (SVM)
functionalities. But before doing the traffic light classification
YOLOv3 predicts an object score for each bounding box.
Therefore, a detection algorithm that can cope with mis-
localizations is required in autonomous driving applications.
This algorithm was applied for improving the detection
accuracy while supporting a real-time operation of YOLOv3,
which is the most representative of one-stage detectors, with a
Gaussian parameter and redesigning the loss function (Lee J.
C.-J., 2019).
2. RELATED WORK
Traffic lights usually have startling colours so drivers can
easily see them. These colours make them easily detectable
using color filters (Fleyeh, 2004), however, these approaches
require manual tuning of the thresholds for colour filtering,
resulting in a difficult task because illumination and weather
The International Archives of the Photogrammetry, Remote Sensing and Spatial Information Sciences, Volume XLIII-B2-2020, 2020 XXIV ISPRS Congress (2020 edition)
This contribution has been peer-reviewed. https://doi.org/10.5194/isprs-archives-XLIII-B2-2020-1247-2020 | © Authors 2020. CC BY 4.0 License.
1247

conditions will affect the colors. Furthermore, traffic lights
have different orientation in horizontal or vertical.
Much research is taking place in the field of autonomous
vehicle manufacturing, such as the detection by these vehicles
of traffic lights and road signs. These vary with the techniques
used, with regard to the environment and the cars to be used.
Ozcelik et al proposed A Vision Based Traffic Light Detection
and Intelligent Vehicle Recognition Approach (Ozcelik,
2017). Images are taken using a camera, and processing to
detect the traffic is performed stepwise. The color of the traffic
light is easily identified through the classification model
Support Vector Machines (SVM), which is a machine learning
algorithm prepared beforehand, after the location of the traffic
lights is determined in the image. Muller et al have proposed
Detecting Traffic Lights through Single Shot Detection
technique which performs object proposals creation and
classification using a single CNN (Müller, 2018).
A deep learning approach was proposed to Traffic Lights by
detection, tracking, and classification (Behrendt, 2017). This
proposed methodology provides a stable system consisting of
a detector, tracker, and classifier depending on deep learning,
stereo vision, and vehicle odometry that considers traffic lights
in real-time.
Li et al proposed a "Traffic Light Recognition Technique" for
the Complex Scene with Fusion Detections (Li, 2018). Saini
et al proposed a Vision-Based Traffic Light Detection and
State Recognition Technique for Autonomous Vehicles (Saini,
2017). It provides a vision-based technique for detecting
traffic light structure using CNN that is based on a state
recognition method that is considered to be reliable under
different illumination and weather conditions. Shi et al.
proposed the Adaptive Background Suppression Filter Real-
Time Traffic Light Detection (Shi, 2016).
Hamdi et al have proposed an ANN Real-Time
Implementation classification system for road signs (Hamdi,
2017). This system provides a real-time algorithm to classify
traffic signs by way of a driver alert system and recognize
them. A traffic sign recognition system using hybrid descriptor
features and an artificial neural network classifier has been
suggested by Abedin et el (Abedin, 2016).
Many methodologies for traffic light detection are presented
in the research works mentioned here. But due to the presence
of different drawbacks these methodologies are also
hampered. The systems presented fail to consider a wide
variety of data sets for both training and testing, which can be
considered to scale the systems accuracy.
3. PROPOSED INTEGRATED SYSTEM
The proposed integrated system aims to detect, localize, and
measure the distance between the camera and traffic light
while performing real time traffic lights recognition. This can
be achieved by implementing machine learning and image
classification techniques. Artificial Neural Networks,
Convolution Neural Networks and in specific, are one of the
most accurate methods in order to achieve the desired result.
Figure 1. shows the flow of integrated system
CNNs have recently become popular because of their speed
and precision in detecting objects. A popular CNN object
detector is Faster R-CNN, which consists of two CNNs: the
first one proposes input image regions of interest, and the
second one refines and classifies those regions. In (Zuo, 2017),
a plain Faster R-CNN was used to detect traffic signs in this
research, but the detector struggled because signs are
commonly a small part of the image, making the detection task
more difficult.
A modified Faster R-CNN was developed in (Wang, 2018),
resulting in a more efficient process for detecting signs of
traffic signs. Although it has a great performance, having two
detection and classification stages makes the processing
slower if it was one stage.
One stage detectors are faster because they propose regions
and at the same time classify them as high-speed detectors,
such as OverFeat (Sermanet, 2013), SSD (Liu, et al., 2016)
and YOLO (J. Redmon, 2016), (Redmon, 2016), (Redmon,
2018). A simultaneous SSD-based traffic signal detection and
classification method is presented in (Lee H. S., 2018), which
results in high accuracy; however, its main drawback is that
each image with a resolution of 533x300 is processed in 0.126
seconds.
The modified YOLOv2 achieved 0,017 seconds per image
608x608 with a processing rate of 0,017 seconds, maintaining
a high level of precision in the detection of traffic signs (J.
Zhang, 2017). This shows that YOLOv2 can be used in the
detection of traffic lights as well and that YOLOv3 has
improved its function extractor and network architecture
(lowering its processing speed), thus providing traffic lights
detention tasks using YOLOv3 better accuracy but rather
slower results.
3.1 Detection
YOLOv3 is a real-time detector and classifier based on CNN
that has great performance in detecting small objects and is a
perfect choice for this task due to the usual size of the traffic
lights. But because YOLOv3 uses the sum of the squared error
loss for bbox, it results with noisy data. However, utilize new
model that cope with the loss function of bbox makes the
model more robust against the noisy environment. Therefore,
Gaussian YOLOv3 can obtain the uncertainty of bbox for
every detection object in an image (Lee J. C.-J., 2019). By
utilizing Gaussian YOLOv3, an improvement in the mean
average precision (mAP) by 3.09 and 3.5 on the KITTI and
The International Archives of the Photogrammetry, Remote Sensing and Spatial Information Sciences, Volume XLIII-B2-2020, 2020 XXIV ISPRS Congress (2020 edition)
This contribution has been peer-reviewed. https://doi.org/10.5194/isprs-archives-XLIII-B2-2020-1247-2020 | © Authors 2020. CC BY 4.0 License.
1248
Berkeley deep drive (BDD) datasets, respectively. This
pretrained model has been selected as it is capable of real-time
detection at faster than 42 frames per second (fps) and shows
a higher accuracy than previous approaches with a similar fps.
Therefore, the proposed algorithm is the most suitable
pretrained model for autonomous driving applications and
localize traffic light position (Jiwoong Choi, 2019).
The performance of the selected pretrained model using the
KITTI validation set compared to YOLOv3, the Gaussian
YOLOv3 mAP improves by 3.09, with a detection speed of
43.13 fps, allowing real-time detection with a slight variation
from YOLOv3. Gaussian YOLOv3 is 3.93 fps faster than
RFBNet (Songtao Liu, 2018), which has the fastest operating
speed in previous studies with the exception of YOLOv3,
although Gaussian YOLOv3's mAP exceeds RFBNet
(Songtao Liu, 2018) by more than 10.17.
3.2 Localization
The 2D position of the traffic lights acquired during the
detection phase does not provide enough information for an
autonomous vehicle to make a decision. A method for
obtaining their depth is required to locate traffic light
correctly, which means that the decision-making algorithm
receives more information and therefore improves
autonomous driving. Although CNNs have been included with
the neural detection network for the estimation of the
monocular camera depth (I. Laina, 2016), (L. He, 2018), (D.
Eigen, 2014), it will slow the entire procedure; because
computer resources are distributed. Therefore, the optimal
solution is an end-to-end CNN which detects and predicts at
the same time the distance from the vehicle; however, this
cannot be trained because no data set with traffic light
boundary boxes and their distance is available.
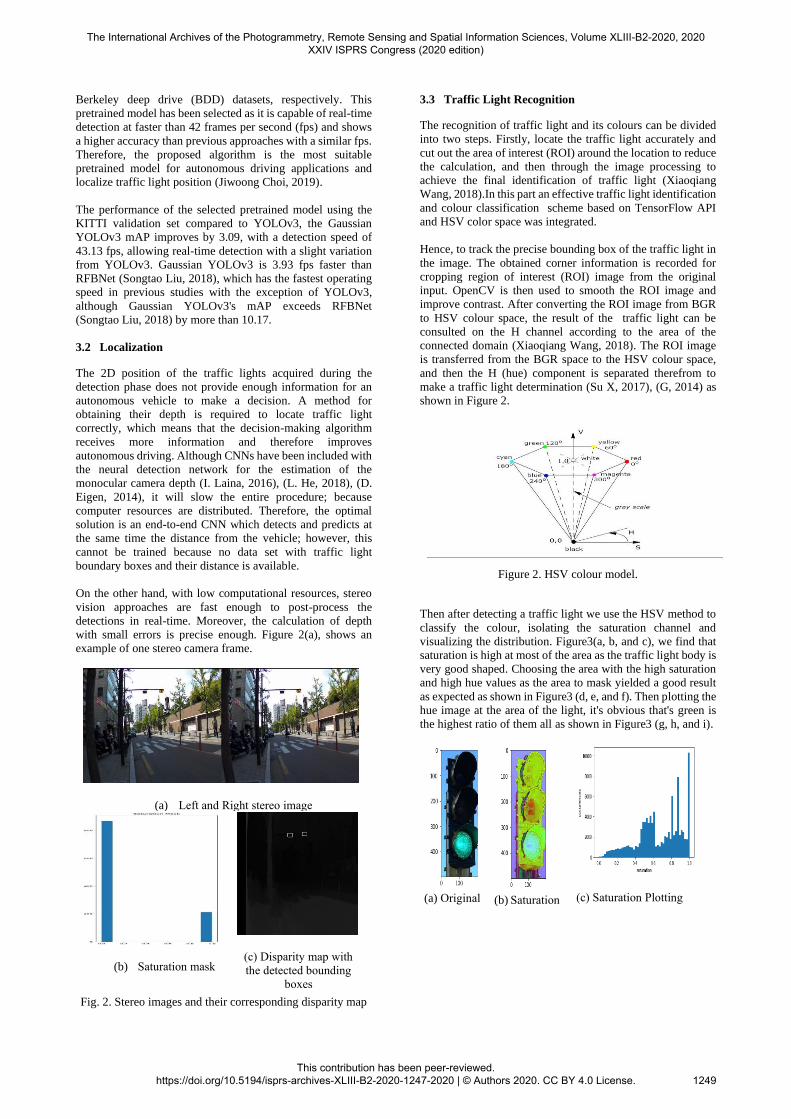
On the other hand, with low computational resources, stereo
vision approaches are fast enough to post-process the
detections in real-time. Moreover, the calculation of depth
with small errors is precise enough. Figure 2(a), shows an
example of one stereo camera frame.
(a) Left and Right stereo image
(b) Saturation mask
(c) Disparity map with
the detected bounding
boxes
Fig. 2. Stereo images and their corresponding disparity map
3.3 Traffic Light Recognition
The recognition of traffic light and its colours can be divided
into two steps. Firstly, locate the traffic light accurately and
cut out the area of interest (ROI) around the location to reduce
the calculation, and then through the image processing to
achieve the final identification of traffic light (Xiaoqiang
Wang, 2018).In this part an effective traffic light identification
and colour classification scheme based on TensorFlow API
and HSV color space was integrated.
Hence, to track the precise bounding box of the traffic light in
the image. The obtained corner information is recorded for
cropping region of interest (ROI) image from the original
input. OpenCV is then used to smooth the ROI image and
improve contrast. After converting the ROI image from BGR
to HSV colour space, the result of the traffic light can be
consulted on the H channel according to the area of the
connected domain (Xiaoqiang Wang, 2018). The ROI image
is transferred from the BGR space to the HSV colour space,
and then the H (hue) component is separated therefrom to
make a traffic light determination (Su X, 2017), (G, 2014) as
shown in Figure 2.
Figure 2. HSV colour model.
Then after detecting a traffic light we use the HSV method to
classify the colour, isolating the saturation channel and
visualizing the distribution. Figure3(a, b, and c), we find that
saturation is high at most of the area as the traffic light body is
very good shaped. Choosing the area with the high saturation
and high hue values as the area to mask yielded a good result
as expected as shown in Figure3 (d, e, and f). Then plotting the
hue image at the area of the light, it's obvious that's green is
the highest ratio of them all as shown in Figure3 (g, h, and i).
(a) Original
(b) Saturation
(c) Saturation Plotting
The International Archives of the Photogrammetry, Remote Sensing and Spatial Information Sciences, Volume XLIII-B2-2020, 2020 XXIV ISPRS Congress (2020 edition)
This contribution has been peer-reviewed. https://doi.org/10.5194/isprs-archives-XLIII-B2-2020-1247-2020 | © Authors 2020. CC BY 4.0 License.
1249
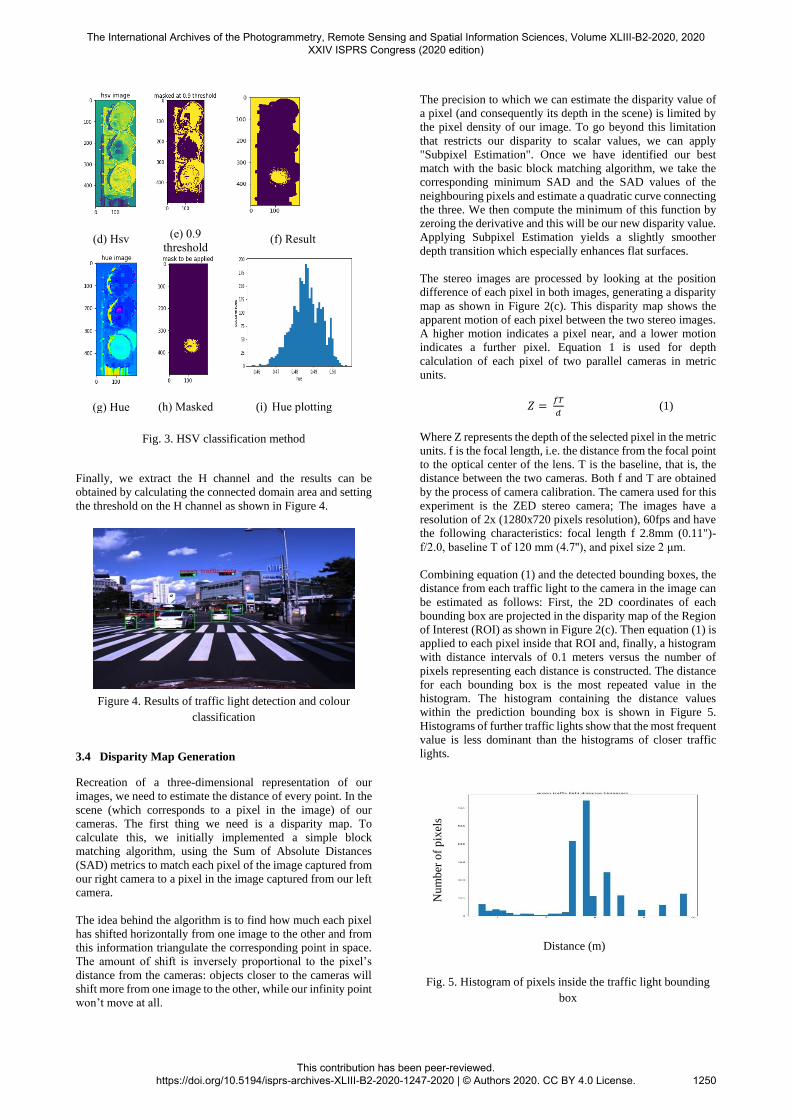
(d) Hsv
(e) 0.9
threshold
(f) Result
(g) Hue
(h) Masked
(i) Hue plotting
Fig. 3. HSV classification method
Finally, we extract the H channel and the results can be
obtained by calculating the connected domain area and setting
the threshold on the H channel as shown in Figure 4.
Figure 4. Results of traffic light detection and colour
classification
3.4 Disparity Map Generation
Recreation of a three-dimensional representation of our
images, we need to estimate the distance of every point. In the
scene (which corresponds to a pixel in the image) of our
cameras. The first thing we need is a disparity map. To
calculate this, we initially implemented a simple block
matching algorithm, using the Sum of Absolute Distances
(SAD) metrics to match each pixel of the image captured from
our right camera to a pixel in the image captured from our left
camera.
The idea behind the algorithm is to find how much each pixel
has shifted horizontally from one image to the other and from
this information triangulate the corresponding point in space.
The amount of shift is inversely proportional to the pixel’s
distance from the cameras: objects closer to the cameras will
shift more from one image to the other, while our infinity point
won’t move at all.
The precision to which we can estimate the disparity value of
a pixel (and consequently its depth in the scene) is limited by
the pixel density of our image. To go beyond this limitation
that restricts our disparity to scalar values, we can apply
"Subpixel Estimation". Once we have identified our best
match with the basic block matching algorithm, we take the
corresponding minimum SAD and the SAD values of the
neighbouring pixels and estimate a quadratic curve connecting
the three. We then compute the minimum of this function by
zeroing the derivative and this will be our new disparity value.
Applying Subpixel Estimation yields a slightly smoother
depth transition which especially enhances flat surfaces.
The stereo images are processed by looking at the position
difference of each pixel in both images, generating a disparity
map as shown in Figure 2(c). This disparity map shows the
apparent motion of each pixel between the two stereo images.
A higher motion indicates a pixel near, and a lower motion
indicates a further pixel. Equation 1 is used for depth
calculation of each pixel of two parallel cameras in metric
units.
𝑍 = 𝑓𝑇
𝑑 (1)
Where Z represents the depth of the selected pixel in the metric
units. f is the focal length, i.e. the distance from the focal point
to the optical center of the lens. T is the baseline, that is, the
distance between the two cameras. Both f and T are obtained
by the process of camera calibration. The camera used for this
experiment is the ZED stereo camera; The images have a
resolution of 2x (1280x720 pixels resolution), 60fps and have
the following characteristics: focal length f 2.8mm (0.11")-
f/2.0, baseline T of 120 mm (4.7''), and pixel size 2 μm.
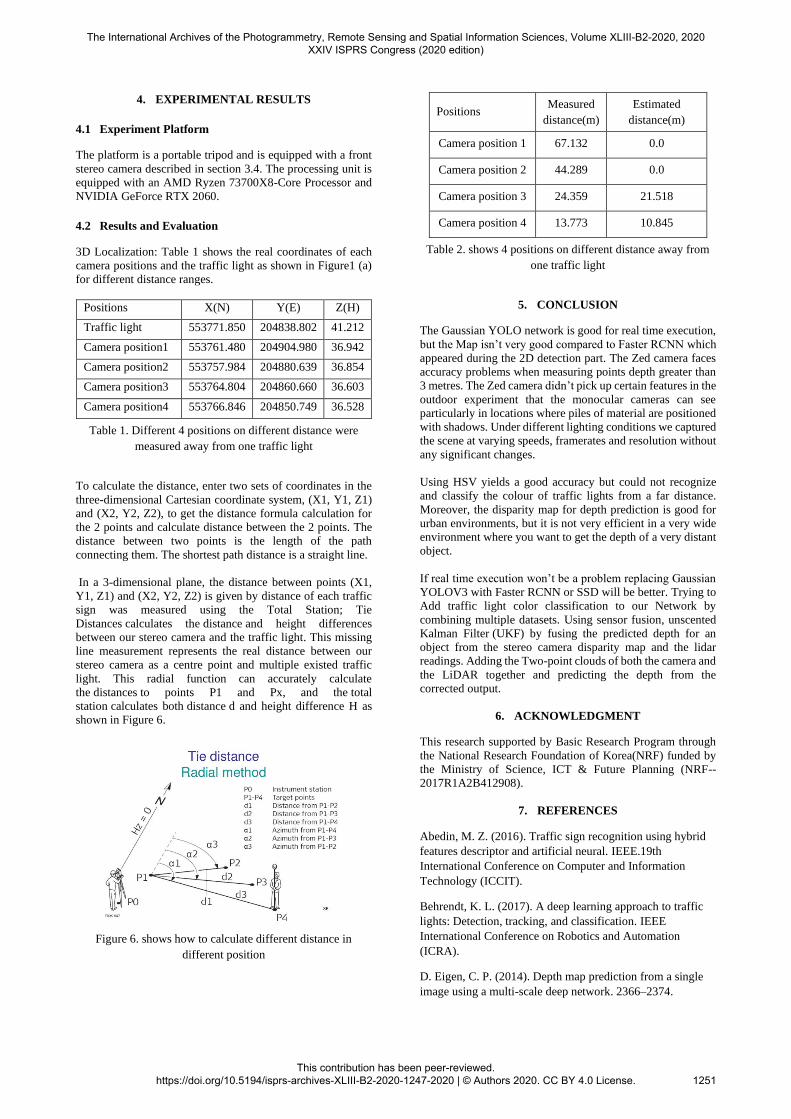
Combining equation (1) and the detected bounding boxes, the
distance from each traffic light to the camera in the image can
be estimated as follows: First, the 2D coordinates of each
bounding box are projected in the disparity map of the Region
of Interest (ROI) as shown in Figure 2(c). Then equation (1) is
applied to each pixel inside that ROI and, finally, a histogram
with distance intervals of 0.1 meters versus the number of
pixels representing each distance is constructed. The distance
for each bounding box is the most repeated value in the
histogram. The histogram containing the distance values
within the prediction bounding box is shown in Figure 5.
Histograms of further traffic lights show that the most frequent
value is less dominant than the histograms of closer traffic
lights.
Fig. 5. Histogram of pixels inside the traffic light bounding
box
Nu
mb
er o
f p
ixel
s
Distance (m)
The International Archives of the Photogrammetry, Remote Sensing and Spatial Information Sciences, Volume XLIII-B2-2020, 2020 XXIV ISPRS Congress (2020 edition)
This contribution has been peer-reviewed. https://doi.org/10.5194/isprs-archives-XLIII-B2-2020-1247-2020 | © Authors 2020. CC BY 4.0 License.
1250
4. EXPERIMENTAL RESULTS
4.1 Experiment Platform
The platform is a portable tripod and is equipped with a front
stereo camera described in section 3.4. The processing unit is
equipped with an AMD Ryzen 73700X8-Core Processor and
NVIDIA GeForce RTX 2060.
4.2 Results and Evaluation
3D Localization: Table 1 shows the real coordinates of each
camera positions and the traffic light as shown in Figure1 (a)
for different distance ranges.
Positions X(N) Y(E) Z(H)
Traffic light 553771.850 204838.802 41.212
Camera position1 553761.480 204904.980 36.942
Camera position2 553757.984 204880.639 36.854
Camera position3 553764.804 204860.660 36.603
Camera position4 553766.846 204850.749 36.528
Table 1. Different 4 positions on different distance were
measured away from one traffic light
To calculate the distance, enter two sets of coordinates in the
three-dimensional Cartesian coordinate system, (X1, Y1, Z1)
and (X2, Y2, Z2), to get the distance formula calculation for
the 2 points and calculate distance between the 2 points. The
distance between two points is the length of the path
connecting them. The shortest path distance is a straight line.
In a 3-dimensional plane, the distance between points (X1,
Y1, Z1) and (X2, Y2, Z2) is given by distance of each traffic
sign was measured using the Total Station; Tie
Distances calculates the distance and height differences
between our stereo camera and the traffic light. This missing
line measurement represents the real distance between our
stereo camera as a centre point and multiple existed traffic
light. This radial function can accurately calculate
the distances to points P1 and Px, and the total
station calculates both distance d and height difference H as
shown in Figure 6.
Figure 6. shows how to calculate different distance in
different position
Positions Measured
distance(m)
Estimated
distance(m)
Camera position 1 67.132 0.0
Camera position 2 44.289 0.0
Camera position 3 24.359 21.518
Camera position 4 13.773 10.845
Table 2. shows 4 positions on different distance away from
one traffic light
5. CONCLUSION
The Gaussian YOLO network is good for real time execution,
but the Map isn’t very good compared to Faster RCNN which
appeared during the 2D detection part. The Zed camera faces
accuracy problems when measuring points depth greater than
3 metres. The Zed camera didn’t pick up certain features in the
outdoor experiment that the monocular cameras can see
particularly in locations where piles of material are positioned
with shadows. Under different lighting conditions we captured
the scene at varying speeds, framerates and resolution without
any significant changes.
Using HSV yields a good accuracy but could not recognize
and classify the colour of traffic lights from a far distance.
Moreover, the disparity map for depth prediction is good for
urban environments, but it is not very efficient in a very wide
environment where you want to get the depth of a very distant
object.
If real time execution won’t be a problem replacing Gaussian
YOLOV3 with Faster RCNN or SSD will be better. Trying to
Add traffic light color classification to our Network by
combining multiple datasets. Using sensor fusion, unscented
Kalman Filter (UKF) by fusing the predicted depth for an
object from the stereo camera disparity map and the lidar
readings. Adding the Two-point clouds of both the camera and
the LiDAR together and predicting the depth from the
corrected output.
6. ACKNOWLEDGMENT
This research supported by Basic Research Program through
the National Research Foundation of Korea(NRF) funded by
the Ministry of Science, ICT & Future Planning (NRF--
2017R1A2B412908).
7. REFERENCES
Abedin, M. Z. (2016). Traffic sign recognition using hybrid
features descriptor and artificial neural. IEEE.19th
International Conference on Computer and Information
Technology (ICCIT).
Behrendt, K. L. (2017). A deep learning approach to traffic
lights: Detection, tracking, and classification. IEEE
International Conference on Robotics and Automation
(ICRA).
D. Eigen, C. P. (2014). Depth map prediction from a single
image using a multi-scale deep network. 2366–2374.
The International Archives of the Photogrammetry, Remote Sensing and Spatial Information Sciences, Volume XLIII-B2-2020, 2020 XXIV ISPRS Congress (2020 edition)
This contribution has been peer-reviewed. https://doi.org/10.5194/isprs-archives-XLIII-B2-2020-1247-2020 | © Authors 2020. CC BY 4.0 License.
1251

Fleyeh, H. (2004). Color detection and segmentation for road
and traffic signs. Cybernetics and Intelligent Systems, 2004
IEEE Conference, 809-814.
Fleyeh, H. (2005). Road and traffic sign color detection and
segmentation a fuzzy approach. 124-127.
G, R. H. (2014). Automatic Tracking of Traffic Signs Based
on HSV C. International Journal of Engineering Research
and Technology.
G. Mu, Z. X. (2015). Traffic light detection and recognition
for autonomous vehicles. The Journal of China Universities
of Posts and Telecommunications, 50-56.
Hamdi, S. e. (2017). Road signs classification by ANN for
real-time implementation. IEEE International Conference on
Control, Automation and Diagnosis (ICCAD). .
I. Laina, C. R. (2016). Deeper depth prediction with fully
convolutional residual networks in 3D Vision (3DV). Fourth
International Conference IEEE, 239-248.
J. Redmon, S. D. (2016). “You only look once: Unified, real-
time object detection,”. IEEE conference on computer vision
and pattern recognition,, 779-788.
J. Zhang, M. H. (2017). “A real-time chinese traffic sign .
detection algorithm based on modified yolov2,”, vol. 10, no.
4, p. 127,.
Jiwoong Choi, D. C.-J. (2019). Gaussian YOLOv3: An
Accurate and Fast Object Detector Using Localization
Uncertainty for Autonomous Driving. The IEEE International
Conference on Computer Vision, 502-511.
L. He, G. W. (2018). Learning depth from single images with
deep neural network embedding focal length. IEEE
Transactions on Image Processing.
Lee, H. S. (2018). “Simultaneous traffic sign detection and
boundary estimation using convolutional neural network,.
IEEE Transactions on Intelligent Transportation Systems.
Lee, J. C.-J. (2019). Gaussian YOLOv3: An Accurate and
Fast Object Detector Using Localization Uncertainty for
Autonomous Driving. IEEE.
Li, X. e. (2018). Traffic light recognition for complex scene
with fusion detections. IEEE Transactions on Intelligent
Transportation Systems .
Liu, W., Anguelov, D., Erhan, D., Szegedy, C., Reed, S., Fu,
C.-Y., & Berg, A. C. (2016). SSD: Single Shot MultiBox
Detector. Lecture Notes in Computer Science, 21-37.
Müller, J. a. (2018). Detecting traffic lights by single shot
detection. 21st International Conference on Intelligent
Transportation Systems (ITSC). IEEE.
Ozcelik, C. T. (2017). A vision-based traffic light detection
and recognition approach for intelligent vehicles.
International Conference on Computer Science and
Engineering (UBMK). IEEE.
Raoul de Charette, F. N. (2009). Traffic light recognition
using image processing compared to learning processes.
IEEE/RSJ International Conference on Intelligent Robots and
Systems, 333-338.
Redmon, J. F. (2016). Yolo9000: Better, faster, stronger.
arXiv.
Redmon, J. F. (2018). “Yolov3: An incremental
improvement,”. arXiv.
Saini, S. e. (2017). An efficient vision-based traffic light
detection and state recognition for autonomous vehicles.
IEEE Intelligent Vehicles Symposium (IV).
Sermanet, P. D. (2013). Overfeat: Integrated recognition,
localization and detection using convolutional networks.
arXiv preprint.
Shi, Z. Z. (2016). Real-time traffic light detection with
adaptive background suppression filter. IEEE Transactions
on Intelligent Transportation Systems , 690-700.
Songtao Liu, D. H. (2018). Receptive field block net for
accurate and fast object detection. In Proceedings of the
European Conference on Computer Vision (ECCV), 385-
400.
Su X, C. X. (2017). HSV color space and adaptive shape
support window based local stereo matching algorithm. J.
Laser & Optoelectronics, 1-13.
T.-Y. Lin, P. D. (2017). “Feature pyramid networks for
object detection.,”. CVPR, vol. 1, p. 4,.
Wang, J. L. (2018). Real-time traffic sign recognition based
on efficient cnns in the wild. IEEE Transactions on
Intelligent Transportation Systems, 1-10.
Wei Liu, D. A.-Y. (2016). Ssd: Single shot multibox detector.
in European conference on computer vision,, 21-37.
Xiaoqiang Wang, X. C. (2018). Design of traffic light
identification scheme based on TensorFlow and HSV color
space. Journal of Physics.
Z. Zuo, K. Y. ( 2017). Traffic Signs Detection Based on
Faster R-CNN. IEEE 37th International Conference on
Distributed Computing Systems Workshops (ICDCSW),
Atlanta, 286-288.
Zuo, Z. Y. (2017). Traffic signs detection based on faster r-
cnn. IEEE 37th International Conference on Distributed
Computing Systems Workshops (ICDCSW), Atlanta, GA,
286-288.
The International Archives of the Photogrammetry, Remote Sensing and Spatial Information Sciences, Volume XLIII-B2-2020, 2020 XXIV ISPRS Congress (2020 edition)
This contribution has been peer-reviewed. https://doi.org/10.5194/isprs-archives-XLIII-B2-2020-1247-2020 | © Authors 2020. CC BY 4.0 License.
1252