detection of chemical additives in...
TRANSCRIPT

1
UGC SPONSORED MINOR RESEARCH PROJECT
ON
DETECTION OF CHEMICAL ADDITIVES IN BRANDED
MILK BY ULTRASONIC METHOD
UGC Reference No.: 47-453/12(WRO)
By
P.D. WANKAR R. L. CHANDANKHEDE
M.Sc., Ph. D. M.Sc., M. Phil.
Principle Investigator Co- Investigator
Department of Physics
Jankidevi Bajaj College of Science
Wardha - 442001
2015
2
Report of the work done
Objectives of Project:
Experimentation involving Ultrasonic waves are extensively used to examine certain
physical properties of the material in liquid as well as solid systems in basic science. Ultrasonic
wave are used to extract information on the behavior of the microscopic particle of matter. In
medical science the waves are used to determine structure and behaviour of bio-molecules.
The objective of the proposed work is to determine the various acoustic parameters like ultrasonic
velocity, adiabatic compressibility, Rao’s constant, acoustical impedance etc. in pure and
adulterated milk. Comparison of thermo-acoustical properties of pure and adulterated milk can
easily help us to detect the adulterated milk and comparing with standard adulterant properties,
the substance added as adulterant can be detected.
Work done so far, results achieved, publication:
i) All the data required has been obtained
ii) Basic parameters like ultrasonic velocity, density and viscosity were measured
experimentally.
iii) Different thermo acoustical parameters of milk and mixture were calculated with the
help of mathematically calculation..
iv) The necessary graphs have been drawn
v) Results have been obtained, work is completed.
vi) One research papers based on above topics will be communicated for publication to
“ Kamla Nehru Journal of Science and Technology.”, India.
Whether the Objectives were achieved: ---------- Yes the objectives of the project were
achieved.
Achievements from the project:
i) A necessary experimental arrangement has been developed in the laboratory.
ii) By performing the experiment, different acoustical and thermo-acoustical
parameters of milk and milk with additives are determined.
iii) The data for acoustical and thermo acoustical parameters were prepared and
different graphs were drawn between concentration and parameters to analyzed the
adulteration in the milk.

3
Summary of Project
Milk has traditionally been an important part of Indian diet, particularly for children,
pregnant women, patients and senior citizens. For all of these categories, adulterated milk can be
lethal, if not fatal. Our innocent population is at a big risk; the rising graph of cancers and kidney
failures could well be sourced to inedible milk.
Adulteration of foodstuffs is a menace, which saps the vitality of common man. One of
the commonly adulterated food is milk and milk products. Recent media reports reveal that many
brands of milk commercially available in Kerala contain chemical additives such as sodium
carbonate (Na2CO3), sodium bicarbonate (NaHCO3), formalin (HCHO) etc. These are added to
milk as neutralizers to preserve it for longer time and to prevent curdling. The continuous use of
such milk may cause health hazards to the society. Since the frequency and quantity of milk
consumed by infants and children are much more compared to adults, the health risk is more to
them.
All ingredients are generally regarded as inedible by the human body, but our native
adulterers are happily feeding India’s cow-worshipping, milk-loving population this amazing
diet.
Ours is a fast growing population. There is a huge, unending demand for food items and
milk products. Criminals who want to make quick money are freely engaged in adulteration
activities without fear of law and without conviction by courts of law.
A survey by the Indian Council for Medical Research (ICMR) warned that milk from 12
states had excessive pesticide residues, toxic metals and fungal particles which could lead to
serious cancerous effects on the human body. According to Dr R.S. Khanna, managing director,
Rajasthan Cooperative Dairy Federation, in a survey of more than 200 villages in a Rajasthan
district, adulterated milk with vegetable fat, detergents, urea, salt and other elements were found
in about 41 villages. Nirma, allegedly, was the preferred detergent adulterant. Apparently, the
brand's smell and texture merged well with milk. Another survey is under way at the National
Dairy Research Institute at Karnal in Haryana on the extent of adulteration.
According to Dr Anil Saxena, food scientist with the Delhi-based Food Research and
Analysis Centre (FRAC), urea increases the nitrogen content in milk which ultimately
determines the protein content. But urea makes milk acidic, so a dash of caustic soda is added to
neutralise the acidity. Chemicals like formalin are used primarily for preservation. The use of
urea and soap solution in milk, says Saxena, is harmful for the stomach and intestines while the
use of caustic soda could lead to skin diseases and even be carcinogenic.
The Government is of the view that the situation is under control with self-regulation in
cooperatives and random checking of samples apart from regular checks by food inspectors in
districts. However, at most places there are not enough officials to take samples and test them.

4
But these tests can only determine the quantity of fat and SNF content in milk, while only very
well-equipped and sophisticated laboratories will be able to detect the presence of urea, caustic
soda or detergents.
Some state governments and larger milk agencies are taking steps to fight the menace. But
unless synthetic milk is tackled on a war footing, notions about the sanctity of milk will have to
be changed.
Experimental and Instrumentation
Instrumentation has played a key role in scientific investigations. The art of
measurement is a wide discipline in both engineering and science, encompassing the area of
detection, acquisition control and analysis of data. It involves the precise measurement and
recording of physical, chemical or optical parameters and plays vital role in every branch of
scientific research and industrial process interacting basically with control system, process
instrumentation and data reduction.
Recent advances in electronic, physics, material science and other branches of science and
technology have resulted in the development of many sophisticated and precision measuring
devices and systems, catering to varied measurement problem in such discipline as science &
technology, space, medicine and industry in general.
During the last four decades, the measuring techniques have improved considerably, meeting
the exacting demands of scientists, engineers and technologists.
1. Ultrasonic cell:
The ultrasonic cell is a double walled stainless steel cell with silver plated surfaces. The
capacity of ultrasonic cell is about 15 ml. The cell has an outer shell through which water is
circulated. Piezoelectric crystal of resonant frequency 5 MHz is fixed at the bottom of the cell.
The experimental liquid is kept in the cell; the standing waves are formed between
reflector and transducer.
2. Digital Ultrasonic Pulse Echo Velocity Meter (Model No : (VCT – 70 A) :
Automatic ultrasonic attenuation recorder (AUAR-102) is highly sensitive instrument
used to measure ultrasonic velocity in solids and liquids. With the help of digital Ultrasonic
Pulse Echo velocity Meter (Model No: VCT – 70 A) purchased from Vi Microsystems Pvt. Ltd.
Chennai, the ultrasonic velocity of the liquid is measured automatically.
In this technique a burst of ultrasonic energy is introduced into the experimental sample
under study.

5
The ultrasonic velocity is measured automatically and all the values of velocities
are displayed by card reader on Laptop purchased under MRP scheme by interfacing with VCT-
70 A. The accuracy of ultrasonic velocity measurements was ± 0.1m/s.
3. Thermo Bath:
A special thermostatic arrangement was done for determination of different parameters
at different temperatures. The measurements of ultrasonic velocity, density and viscosity were
measured at different temperatures and concentrations. The constant temperature water bath low
temperature (LAB HOSP) purchased from Lab- Hosp Corporation Guregaon (E) MUMBAI
under this scheme. This water bath is fully automatic with temperature sensors. The temperature
is controlled automatically by thermostat at any point from room temperature 50
above the
ambient to 99.90C having the accuracy of ±1
0C.
4. Density Measurement:
Density is measured by using specific gravity bottle and electronic balance.
The densities of the experimental liquids were measured by using the following relation.
Density of liquid (ρ) = Mass of liquid
Volume of liquid
The density of water is taken from the literature. The measurements were made in the
temperature of 298K. The masses were measured by a digital balance Contech Make Mumbai
with accuracy of ± 0.001 gm. The accuracy in density measurements was 0.001Kg/m3.
5. Viscosity Measurement:
Ostwald's viscometer is the simplest, accurate and widely used viscometer. We have
used Ostwald's viscometer to determine the viscosity in liquids owing to its versatility.
Prior to the measurement, the viscometer was calibrated with the help of standard and pure
liquids viz. acetone, alcohol etc. The temperature of water bath was maintained constant for long
time within an accuracy of ±10C. The time of falling of the liquid between viscometer marks is
measured using an electronic digital timer. The viscosity was determined by using the following
relation:
ηl = ηw 𝑥 (𝑡𝑙
𝑡𝑤 𝑥
𝜌 𝑙
𝜌𝑤)
Where, ηl, ρl, tl are respectively the viscosity, density and time of flow for experimental
liquids. ηw, ρw and tw are the corresponding quantities for double distilled water.
The data on viscosity of water was taken from literature. The measurements were made for the
temperature298 K. The accuracy in viscosity measurements was ± 0.1 %.
Whole assembly of experimental setup is shown in Figure.
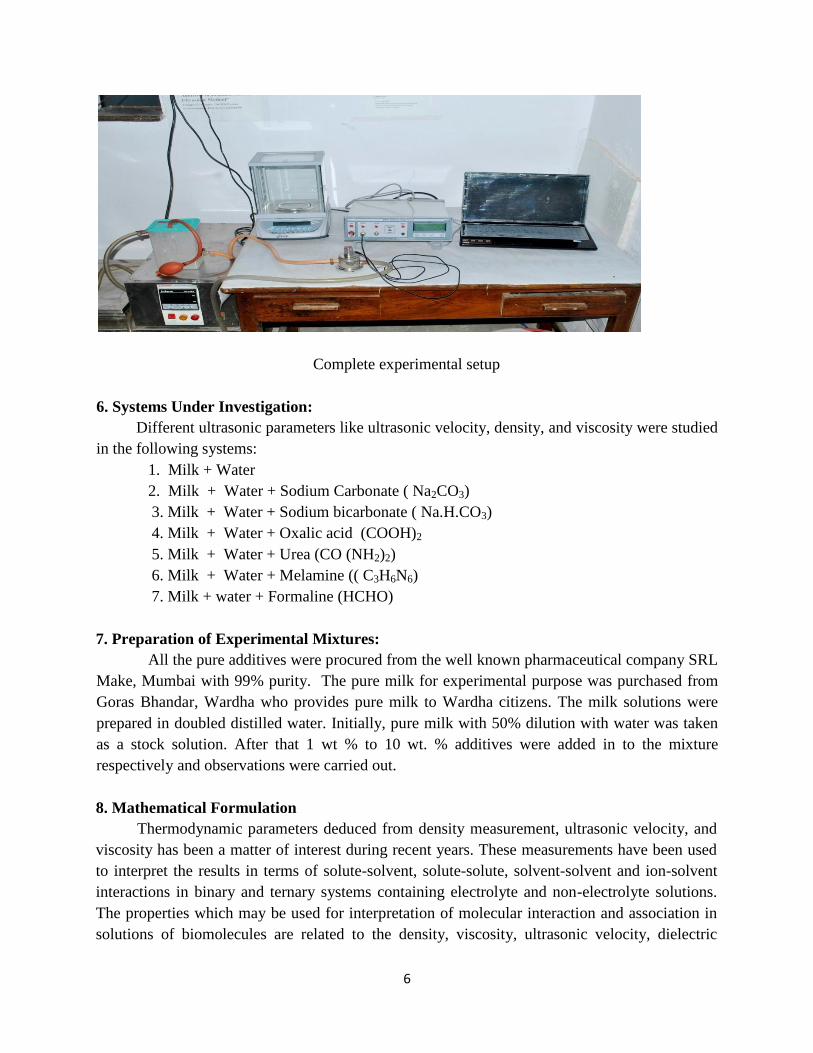
6
Complete experimental setup
6. Systems Under Investigation:
Different ultrasonic parameters like ultrasonic velocity, density, and viscosity were studied
in the following systems:
1. Milk + Water
2. Milk + Water + Sodium Carbonate ( Na2CO3)
3. Milk + Water + Sodium bicarbonate ( Na.H.CO3)
4. Milk + Water + Oxalic acid (COOH)2
5. Milk + Water + Urea (CO (NH2)2)
6. Milk + Water + Melamine (( C3H6N6)
7. Milk + water + Formaline (HCHO)
7. Preparation of Experimental Mixtures:
All the pure additives were procured from the well known pharmaceutical company SRL
Make, Mumbai with 99% purity. The pure milk for experimental purpose was purchased from
Goras Bhandar, Wardha who provides pure milk to Wardha citizens. The milk solutions were
prepared in doubled distilled water. Initially, pure milk with 50% dilution with water was taken
as a stock solution. After that 1 wt % to 10 wt. % additives were added in to the mixture
respectively and observations were carried out.
8. Mathematical Formulation
Thermodynamic parameters deduced from density measurement, ultrasonic velocity, and
viscosity has been a matter of interest during recent years. These measurements have been used
to interpret the results in terms of solute-solvent, solute-solute, solvent-solvent and ion-solvent
interactions in binary and ternary systems containing electrolyte and non-electrolyte solutions.
The properties which may be used for interpretation of molecular interaction and association in
solutions of biomolecules are related to the density, viscosity, ultrasonic velocity, dielectric

7
constant, refractive index, internal pressure, free volume etc. The present chapter deals with the
detailed mathematical formulations used for illustrating ultrasonic and thermodynamic
parameters obtained from ultrasonic and viscometric studies.
Formulation of Ultrasonic & Thermo-acoustical parameters:
Ultrasonic and Thermo-acoustical parameters can be calculated using following formulae.
1. Adiabatic Compressibility (βa):
βa = 1/ U2. ρ
Where, U - Ultrasonic velocity, ρ- Density of liquid
2. Acoustic Impendance (Z):
Z = U . ρ
3. Free Length (Lf ):
Lf = Kj . βa1/2
Where, Kj –Temperature dependent constant (199.5 x 10⁻⁸
),
βa - Adiabatic compressibility
4. Surface tension (σ):
σ = 6.63 x 10- 4
ρ . U1/2
5. Relaxation time (τ):
τ = 4/3 βa. η
6. Relative Association (RA):
RA = (ρ /ρo) x (U / Uo)1/3
Microsoft Excel application software is used for evaluating these parameters and
Plotting the graphs.
Tables 1 to 7:
Ultrasonic and related thermo acoustical parameters, calculated at different concentration
8
of following mixtures are given in the respective tables from 1 to 7:
1. Milk + Water,
2. Milk + Water + Sodium Carbonate ( Na2CO3)
3. Milk + Water + Sodium bicarbonate ( Na.H.CO3)
4. Milk + Water + Oxalic acid (COOH)2
5. Milk + Water + Urea (CO (NH2)2)
6. Milk + Water + Melamine (( C3H6N6)
7. Milk + water + Formaline (H.CH.O)
The variation of ultrasonic and other related thermo-acoustical parameters with Wt %
concentrations of the mixtures of Milk + Water, Milk + Water + Sodium Carbonate, Milk +
Water + Sodium bicarbonate, Milk + Water + Oxalic acid ,Milk + Water + Urea, Milk + Water +
Melamine, and Milk + water + Formaline are represented in the Tables 1 to 7.
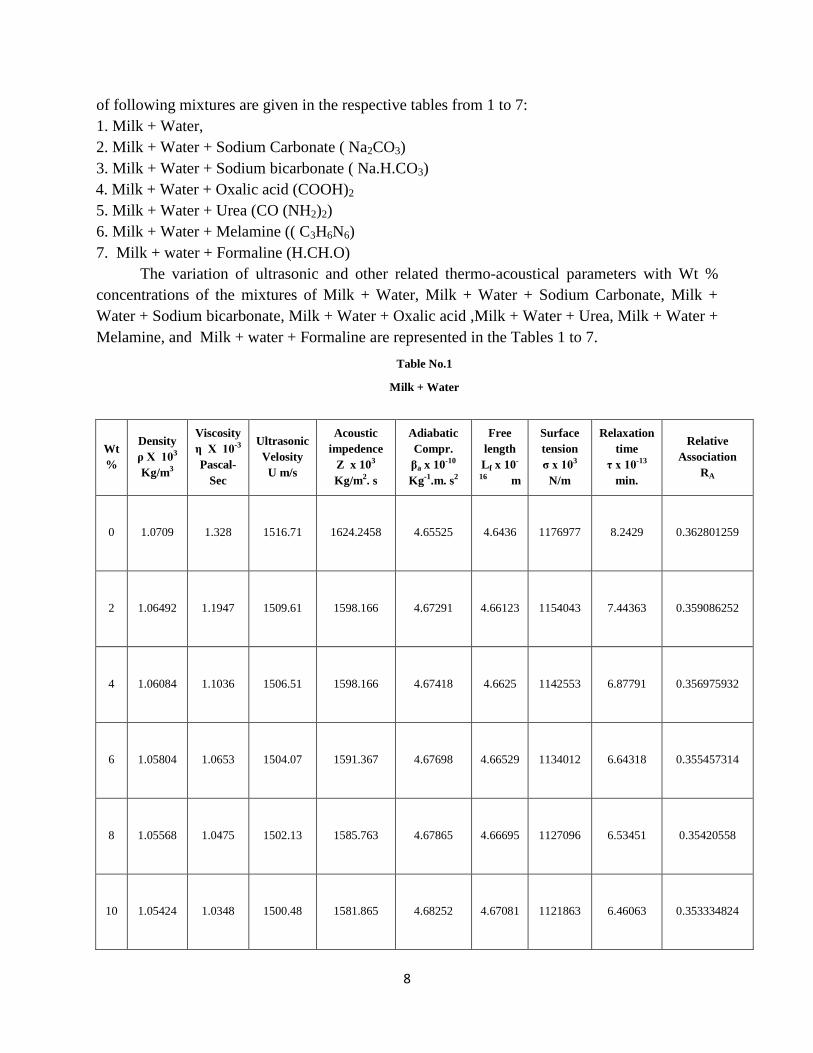
Table No.1
Milk + Water
Wt
%
Density
ρ X 103
Kg/m3
Viscosity
η X 10-3
Pascal-
Sec
Ultrasonic
Velosity
U m/s
Acoustic
impedence
Z x 103
Kg/m2. s
Adiabatic
Compr.
βa x 10-10
Kg-1.m. s2
Free
length
Lf x 10-
16 m
Surface
tension
σ x 103
N/m
Relaxation
time
τ x 10-13
min.
Relative
Association
RA
0 1.0709 1.328 1516.71 1624.2458 4.65525 4.6436 1176977 8.2429 0.362801259
2 1.06492 1.1947 1509.61 1598.166 4.67291 4.66123 1154043 7.44363 0.359086252
4 1.06084 1.1036 1506.51 1598.166 4.67418 4.6625 1142553 6.87791 0.356975932
6 1.05804 1.0653 1504.07 1591.367 4.67698 4.66529 1134012 6.64318 0.355457314
8 1.05568 1.0475 1502.13 1585.763 4.67865 4.66695 1127096 6.53451 0.35420558
10 1.05424 1.0348 1500.48 1581.865 4.68252 4.67081 1121863 6.46063 0.353334824
9
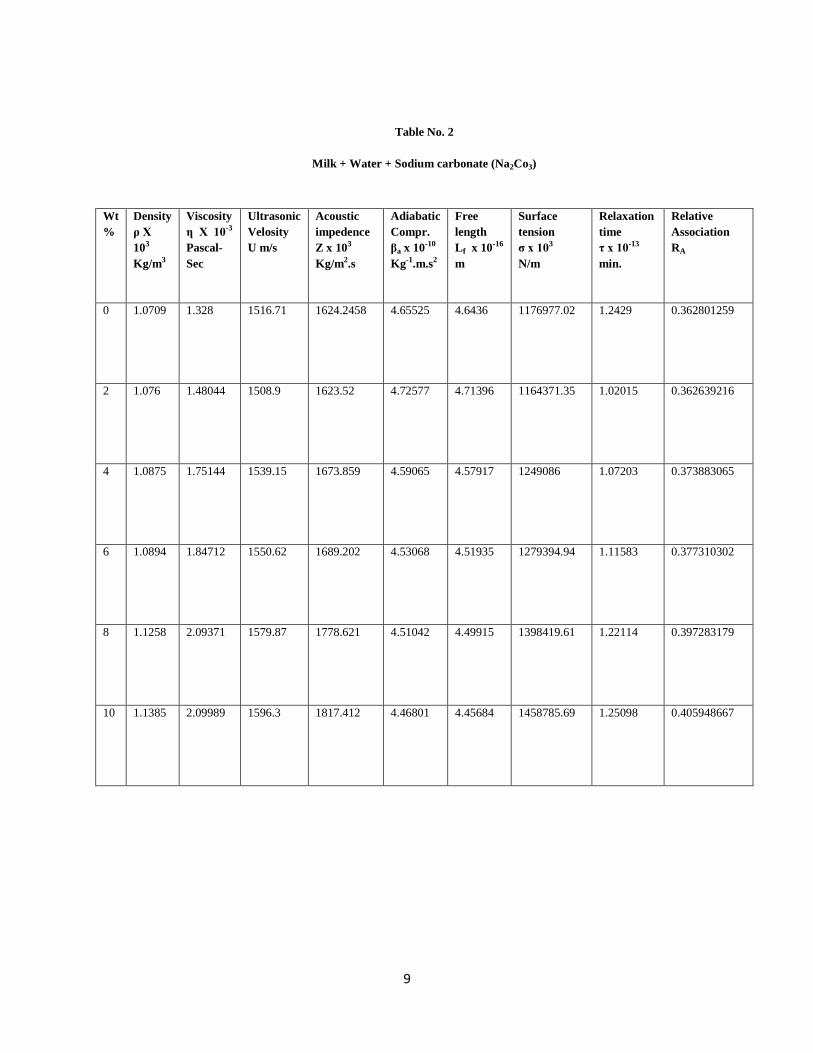
Table No. 2
Milk + Water + Sodium carbonate (Na2Co3)
Wt
%
Density
ρ X
103
Kg/m3
Viscosity
η X 10-3
Pascal-
Sec
Ultrasonic
Velosity
U m/s
Acoustic
impedence
Z x 103
Kg/m2.s
Adiabatic
Compr.
βa x 10-10
Kg-1.m.s2
Free
length
Lf x 10-16
m
Surface
tension
σ x 103
N/m
Relaxation
time
τ x 10-13
min.
Relative
Association
RA
0 1.0709 1.328 1516.71 1624.2458 4.65525 4.6436 1176977.02 1.2429 0.362801259
2 1.076 1.48044 1508.9 1623.52 4.72577 4.71396 1164371.35 1.02015 0.362639216
4 1.0875 1.75144 1539.15 1673.859 4.59065 4.57917 1249086 1.07203 0.373883065
6 1.0894 1.84712 1550.62 1689.202 4.53068 4.51935 1279394.94 1.11583 0.377310302
8 1.1258 2.09371 1579.87 1778.621 4.51042 4.49915 1398419.61 1.22114 0.397283179
10 1.1385 2.09989 1596.3 1817.412 4.46801 4.45684 1458785.69 1.25098 0.405948667
10
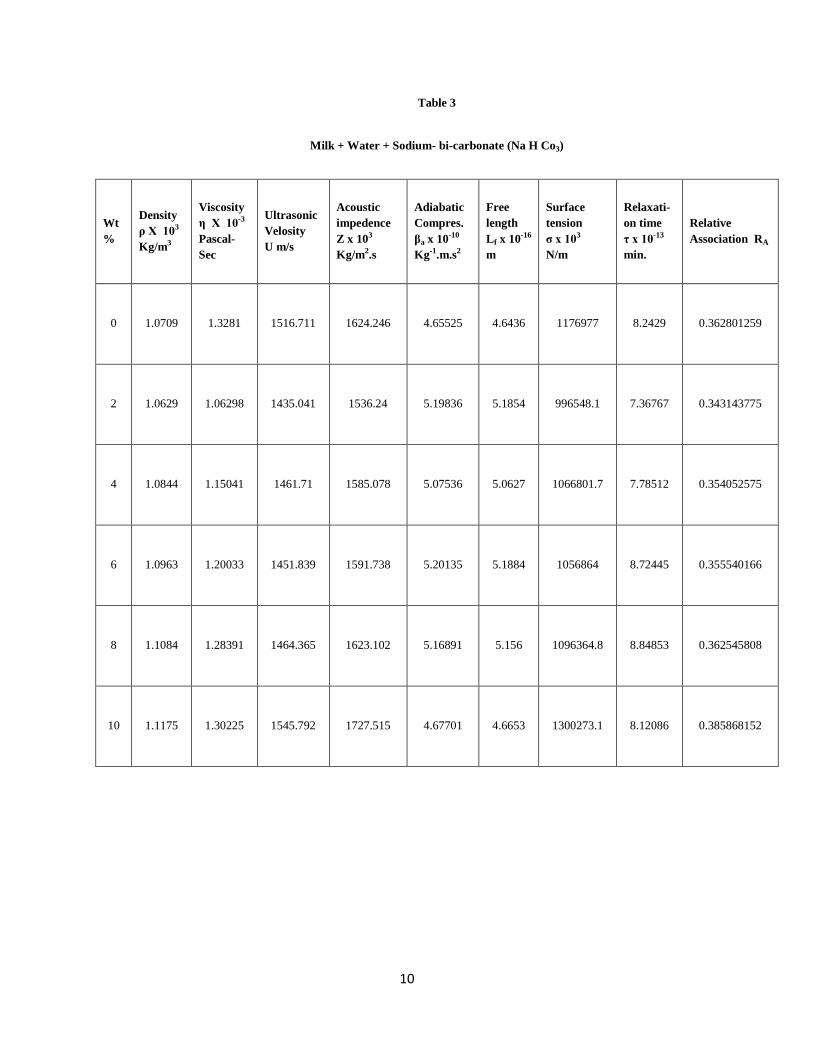
Table 3
Milk + Water + Sodium- bi-carbonate (Na H Co3)
Wt
%
Density
ρ X 103
Kg/m3
Viscosity
η X 10-3
Pascal-
Sec
Ultrasonic
Velosity
U m/s
Acoustic
impedence
Z x 103
Kg/m2.s
Adiabatic
Compres.
βa x 10-10
Kg-1.m.s2
Free
length
Lf x 10-16
m
Surface
tension
σ x 103
N/m
Relaxati-
on time
τ x 10-13
min.
Relative
Association RA
0 1.0709 1.3281 1516.711 1624.246 4.65525 4.6436 1176977 8.2429 0.362801259
2 1.0629 1.06298 1435.041 1536.24 5.19836 5.1854 996548.1 7.36767 0.343143775
4 1.0844 1.15041 1461.71 1585.078 5.07536 5.0627 1066801.7 7.78512 0.354052575
6 1.0963 1.20033 1451.839 1591.738 5.20135 5.1884 1056864 8.72445 0.355540166
8 1.1084 1.28391 1464.365 1623.102 5.16891 5.156 1096364.8 8.84853 0.362545808
10 1.1175 1.30225 1545.792 1727.515 4.67701 4.6653 1300273.1 8.12086 0.385868152

11
Table 4
Milk + Water + Oxalic Acid (COOH)2
Wt
%
Density
ρ X 103
Kg/m3
Viscosity
η X 10-3
Pascal-
Sec
Ultrasonic
Velosity
U m/s
Acoustic
impedence
Z x 103
Kg/m2.s
Adiabatic
Compres.
βa x 10-10
Kg-1.m. s2
Free
length
Lf x 10-16
m
Surface
tension
σ x 103
N/m
Relaxatio
n time
τ x 10-13
min.
Relative
Association
RA
0 1.0709 1.328 1516.711 1624.2458 4.65525 4.6436 1176977 8.2429 0.362801
2 1.0608 1.02127 1484.59 1574.79 4.81287 4.8008 1093320 6.55365 0.351755
4 1.0674 1.09545 1501.251 1602.435 4.7361 4.7243 1137621.2 6.91754 0.35793
6 1.0737 1.20525 1507.198 1618.309 4.72662 4.7148 1158010.6 7.59567 0.361475
8 1.0784 1.46549 1502.576 1620.378 4.77647 4.7645 1152390.8 9.33316 0.361937
10 1.0842 2.62162 1493.529 1619.344 4.86069 4.8485 1137828.9 1.69905 0.361706

12
Table 5
Milk + Water + Urea (CO(NH2)2)
Wt
%
Density
ρ X 103
Kg/m3
Viscosity
η X 10-3
Pascal-
Sec
Ultrasonic
Velocity
U m/s
Acoustic
impedence
Z x 103
Kg/m2.s
Adiabatic
Compres.
βa x 10-10
Kg-1.m.s2
Free
length
Lf x 10-16
m
Surface tension
σ x 103
N/m
Relaxati-
on time
τ x 10-13
min.
Relative
Association
RA
0 1.0709 1.32810 1516.711 1624.2458 4.65525 4.6436 1176977.016 8.2429 0.3628013
2 1.0624 1.05425 1503.277 1597.081 4.70121 4.68946 1136882.691 2.60834 0.3567337
4 1.0678 1.13821 1522.312 1625.584 4.60757 4.59635 1186659.279 3.99296 0.3631001
6 1.0762 1.27682 1552.115 1670.076 4.46647 4.4553 1267344.001 6.80384 0.3730381
8 1.0884 1.68099 1561.251 1699.266 4.46522 4.45406 1304719.867 7.85214 0.3795581
10 1.0961 2.3916 1571.11 1721.937 4.44015 4.42905 1338877.634 8.41587 0.384622
13
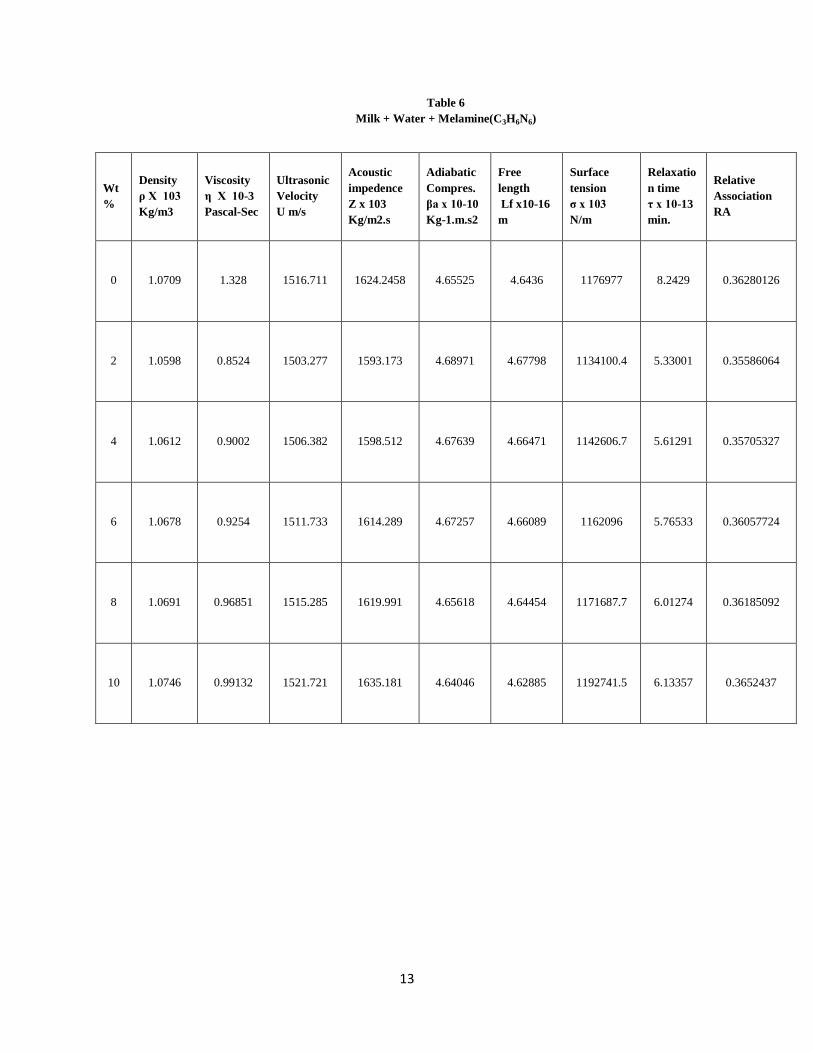
Table 6
Milk + Water + Melamine(C3H6N6)
Wt
%
Density
ρ X 103
Kg/m3
Viscosity
η X 10-3
Pascal-Sec
Ultrasonic
Velocity
U m/s
Acoustic
impedence
Z x 103
Kg/m2.s
Adiabatic
Compres.
βa x 10-10
Kg-1.m.s2
Free
length
Lf x10-16
m
Surface
tension
σ x 103
N/m
Relaxatio
n time
τ x 10-13
min.
Relative
Association
RA
0 1.0709 1.328 1516.711 1624.2458 4.65525 4.6436 1176977 8.2429 0.36280126
2 1.0598 0.8524 1503.277 1593.173 4.68971 4.67798 1134100.4 5.33001 0.35586064
4 1.0612 0.9002 1506.382 1598.512 4.67639 4.66471 1142606.7 5.61291 0.35705327
6 1.0678 0.9254 1511.733 1614.289 4.67257 4.66089 1162096 5.76533 0.36057724
8 1.0691 0.96851 1515.285 1619.991 4.65618 4.64454 1171687.7 6.01274 0.36185092
10 1.0746 0.99132 1521.721 1635.181 4.64046 4.62885 1192741.5 6.13357 0.3652437

14
Table 7
Milk + Water + Formaline (HCHO)
Wt
%
Density
ρ X 103
Kg/m3
Viscosity
η X 10-3
Pascal-
Sec
Ultrasonic
Velocity
U m/s
Acoustic
impedence
Z x 103
Kg/m2.s
Adiabatic
Compres.
βa x 10-10
Kg-1.m.s2
Free
length
Lf x 10-16
m
Surface
tension
σ x 103
N/m
Relaxation
time
τ x 10-13
min.
Relative
Association RA
0 1.0709 1.328 1516.71 1624.2458 4.65525 4.6436 1176977 8.2429 0.362801259
2 1.0573 0.92287 1501.18 1587.224 4.69183 4.68011 1126711 5.77327 0.35453195
S4 1.0588 0.93948 1506.79 1595.388 4.66347 4.65181 1140990 5.84167 0.356355449
6 1.0598 0.9412 1511.03 1601.445 4.64191 4.63031 1151770 5.82529 0.357708275
8 1.0636 0.94976 1514.57 1610.912 4.63658 4.62499 1164018 5.87152 0.359820224
10 1.0648 0.95697 1517.42 1615.753 4.62439 4.61283 1171924 5.90053 0.360904271
15
Results and Discussions
The pure milk contains proteins, fats, vitamins, minerals and carbohydrates etc. Casein is
major protein present in the milk (3. 2%) (Figure 1). It is a dispersed in the form of large of tiny
solid particles, which do not settle but remain in suspension.These particles are called as
micelles and dispersion of micelles in the milk is referred as colloidal suspension. The building
blocks of all proteins are the amino acids. It is rich source of nitrogen.
Figure 1- Structure of casein
The fat (3.4%) and fat soluble vitamins are also present in the milk in the form of emulsion.
Triglyceride is a important part of fats (Figure 2). On hydrolysis, it gives glycerol and higher
fatty acids.
Figure 2- Structure of triglycerides
The principle carbohydrate (4.7%) in the milk is lactose which is known as milk sugar. On
hydrolysis, it gives glucose and galactose (Figure 3).
Figure 3- Structure of lactose
System 1 : ( Milk + Water )
From the Table data 1, it is seen that, the density, viscosity and ultrasonic velocity
decreases linearly with increase the % of water in the pure milk. The ultrasonic velocity, density
and viscosity is a function of added water in the pure milk. It is seen that by adding water to the
pure cow milk, there is a reduction in ultrasonic velocity, density and viscosity of solution with
respective to pure milk because water has a lower viscosity than milk The decrease in the density

16
and viscosity indicates that there is decrease in the intermolecular forces between proteins
molecules present in the milk . The value of ultrasonic velocity decreases due to weak interaction
between the milk component and water molecule.
Figure 4 - Nature of water with milk
Similar trends are also found in the value of surface tension, relaxation time and relative
association i.e. as concentration of water molecule increases from 2 wt % to 10 wt %, the value
of respective parameters are decreasing linearly which are presented in Table 1.
Lower values of surface tension with increasing concentration is responsible for weak
interaction in the mixture which is due to hydrophobic nature of protein and fat molecules
present in milk while decreasing values of relaxation time occurs due to less time of molecule to
relax in a free state that in the range of 10-13
second and also decreasing value of relative
association shows that as concentration of water molecule increases suddenly, solvent structure
breaks up and there is less interaction between protein molecules and water molecules.
The acoustical impedance decreases non-linearly with addition of water in the pure milk which is
indicated in the data. This is due to the breaking of bonds present in the milk protein and
represents weak interactions between solute-solute components present in the solution.
The values of adiabatic compressibility and intermolecular free length increases nonlinearly with
increasing the concentration of water molecule due to weak interaction. As water is added in the
pure milk, proteins get solvated and hence intermolecular forces of attraction becomes weak due
to splitting of milk proteins.
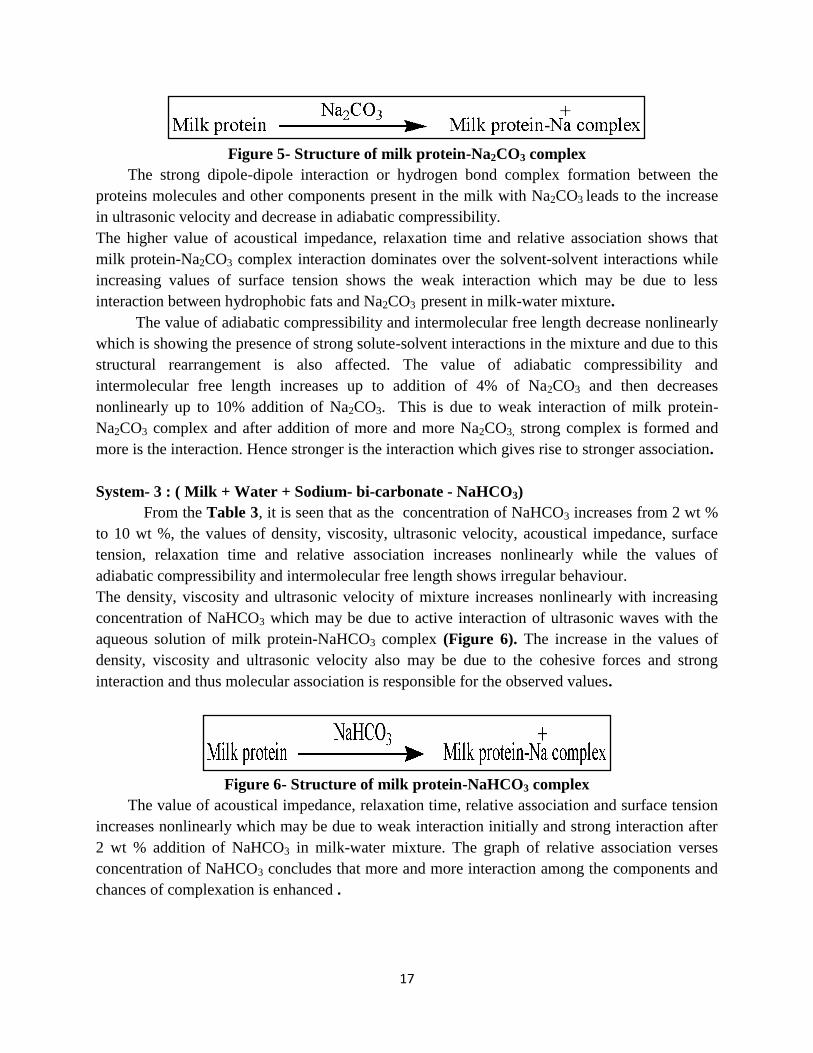
System 2 : ( Milk + Water + Sodium Carbonate- Na2CO3 )
As the concentration of sodium carbonate (Na2CO3) increases from 2 wt % to 10 wt %, the
values of density, viscosity, ultrasonic velocity, acoustical impedance, surface tension, relaxation
time and relative association increases nonlinearly shown in data of Table 2 while the values of
adiabatic compressibility and intermolecular free length decreases nonlinearly. As Na2CO3 is
salt, it ionizes in milk and water mixture and forms milk protein-Na2CO3 complex. Hence values
of density, viscosity and ultrasonic velocity increases with respective to the pure milk which may
be due to active interaction of ultrasound waves with the aqueous solution of milk protein-
Na2CO3 complex and also decrease in adiabatic compressibility indicates the enhancement of the
bond strength .
17
Figure 5- Structure of milk protein-Na2CO3 complex
The strong dipole-dipole interaction or hydrogen bond complex formation between the
proteins molecules and other components present in the milk with Na2CO3 leads to the increase
in ultrasonic velocity and decrease in adiabatic compressibility.
The higher value of acoustical impedance, relaxation time and relative association shows that
milk protein-Na2CO3 complex interaction dominates over the solvent-solvent interactions while
increasing values of surface tension shows the weak interaction which may be due to less
interaction between hydrophobic fats and Na2CO3 present in milk-water mixture.
The value of adiabatic compressibility and intermolecular free length decrease nonlinearly
which is showing the presence of strong solute-solvent interactions in the mixture and due to this
structural rearrangement is also affected. The value of adiabatic compressibility and
intermolecular free length increases up to addition of 4% of Na2CO3 and then decreases
nonlinearly up to 10% addition of Na2CO3. This is due to weak interaction of milk protein-
Na2CO3 complex and after addition of more and more Na2CO3, strong complex is formed and
more is the interaction. Hence stronger is the interaction which gives rise to stronger association.
System- 3 : ( Milk + Water + Sodium- bi-carbonate - NaHCO3)
From the Table 3, it is seen that as the concentration of NaHCO3 increases from 2 wt %
to 10 wt %, the values of density, viscosity, ultrasonic velocity, acoustical impedance, surface
tension, relaxation time and relative association increases nonlinearly while the values of
adiabatic compressibility and intermolecular free length shows irregular behaviour.
The density, viscosity and ultrasonic velocity of mixture increases nonlinearly with increasing
concentration of NaHCO3 which may be due to active interaction of ultrasonic waves with the
aqueous solution of milk protein-NaHCO3 complex (Figure 6). The increase in the values of
density, viscosity and ultrasonic velocity also may be due to the cohesive forces and strong
interaction and thus molecular association is responsible for the observed values.
Figure 6- Structure of milk protein-NaHCO3 complex
The value of acoustical impedance, relaxation time, relative association and surface tension
increases nonlinearly which may be due to weak interaction initially and strong interaction after
2 wt % addition of NaHCO3 in milk-water mixture. The graph of relative association verses
concentration of NaHCO3 concludes that more and more interaction among the components and
chances of complexation is enhanced .

18
The nonlinear behaviour of adiabatic compressibility and intermolecular free length
indicates weak interaction at lower concentration while after 6 wt %, the interaction becomes
strong which may be due to colloidal formation of milk components in the milk-water mixture.
System- 4 : ( Milk + Water + Oxalic acid (COOH)2 )
The trends of all the acoustical parameter related to the Milk + Water + Oxalic acid
(COOH)2 system are represented in the Table 4 .
It is found that the value of density and viscosity increases nonlinearly with increasing
concentration of oxalic acid from 2 wt % to 10 wt %. This increase in density and viscosity may
be due to addition of oxalic acid which causes the medium to be denser, while the value of
ultrasonic velocity increases up to 6 wt % addition of oxalic acid but for higher concentration
ultrasonic velocity decreases. The initially increase in ultrasonic velocity may be due to higher
interaction of milk proteins with oxalic acid forming micelle i.e. coagulated proteins (Figure 7)
in the suspension but later decrease in ultrasonic velocity may be weakening of interaction due to
higher concentration of oxalic acid.
The value of acoustical impedance and relative association increase nonlinearly after 2%
concentration of oxalic acid moiety. This is because of stronger interaction of milk proteins and
oxalic acid molecules which suppressed the solute-solute and solvent-solvent interaction.
Figure 7- Reaction of Oxalic acid and Milk proteins
While the values of adiabatic compressibility, intermolecular free length, surface tension,
relaxation time Table 4 shows nonlinear behaviour. This nonlinear nature may be due to more
concentration of oxalic acid which affects the nature of solute and solvent. From the data of
intermolecular free length it is seen that after 6 wt % addition of oxalic acid, the interaction
becomes weak as the value continuously increasing. The intermolecular free length increases on
decrease of ultrasonic velocity and vice-versa.
System-5 : ( Milk + Water + Urea (CO(NH2)2)
It is seen that there is nonlinear increase in values of density, viscosity, ultrasonic velocity,
acoustical impedance, relaxation time, surface tension and relative association and decrease in
the values of adiabatic compressibility and intermolecular free length with increasing
concentration of urea from 2 wt % to 10 wt % which are represented by the Table 5.
Addition of urea to the milk and water mixture which gives the foam to the milk (Figure 8).
So due to the addition of urea to the milk, the medium becomes more and more dense and
viscous. This may causes the increase in density, viscosity and ultrasonic velocity which shows
the strong association and dipole-dipole interaction between the component molecules present in
the Milk-Water-Urea mixture .
Figure 8 - Reaction of Urea and Milk
19
The value of acoustical impedance, relaxation time, relative association and surface
tension show that all these values increases nonlinearly which may be due to weak interaction at
initially and strong interaction after 2 wt % addition of urea in milk-water mixture. The graph of
relative association verses concentration of urea suggests that more and more interaction among
the components molecules observed .
The value of adiabatic compressibility and intermolecular free length decrease nonlinearly
which shows the presence of strong and significant interactions in the mixture.
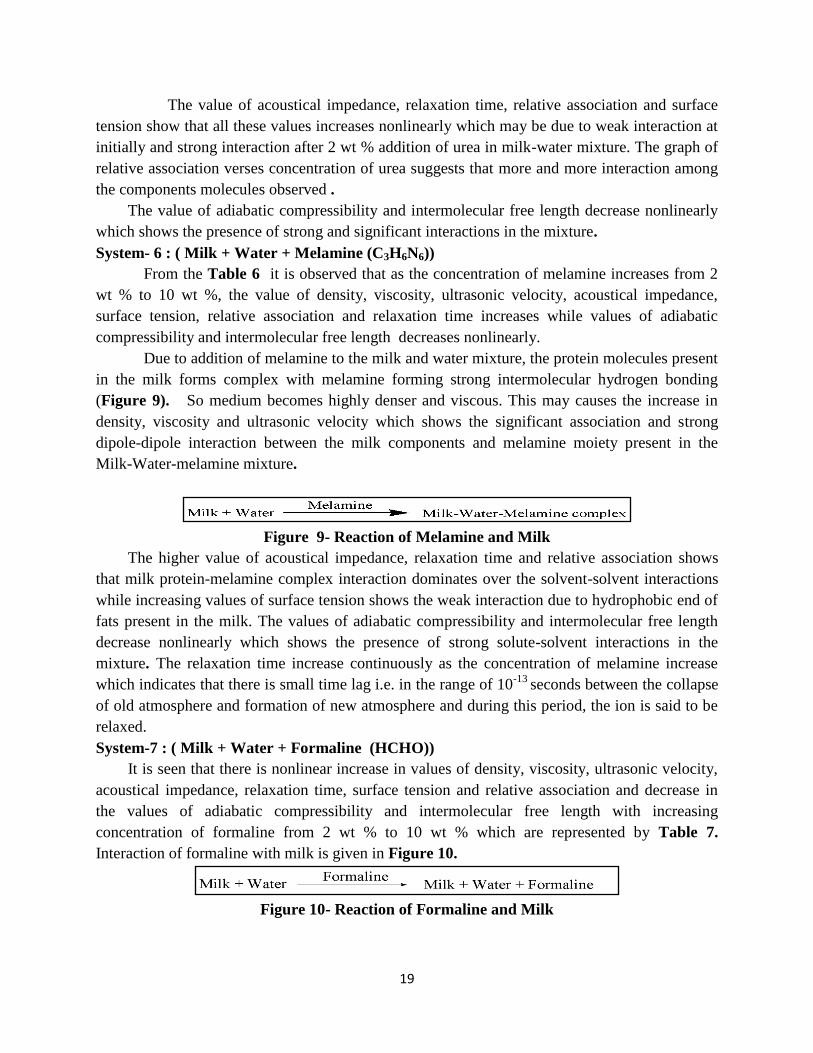
System- 6 : ( Milk + Water + Melamine (C3H6N6))
From the Table 6 it is observed that as the concentration of melamine increases from 2
wt % to 10 wt %, the value of density, viscosity, ultrasonic velocity, acoustical impedance,
surface tension, relative association and relaxation time increases while values of adiabatic
compressibility and intermolecular free length decreases nonlinearly.
Due to addition of melamine to the milk and water mixture, the protein molecules present
in the milk forms complex with melamine forming strong intermolecular hydrogen bonding
(Figure 9). So medium becomes highly denser and viscous. This may causes the increase in
density, viscosity and ultrasonic velocity which shows the significant association and strong
dipole-dipole interaction between the milk components and melamine moiety present in the
Milk-Water-melamine mixture.
Figure 9- Reaction of Melamine and Milk
The higher value of acoustical impedance, relaxation time and relative association shows
that milk protein-melamine complex interaction dominates over the solvent-solvent interactions
while increasing values of surface tension shows the weak interaction due to hydrophobic end of
fats present in the milk. The values of adiabatic compressibility and intermolecular free length
decrease nonlinearly which shows the presence of strong solute-solvent interactions in the
mixture. The relaxation time increase continuously as the concentration of melamine increase
which indicates that there is small time lag i.e. in the range of 10-13
seconds between the collapse
of old atmosphere and formation of new atmosphere and during this period, the ion is said to be
relaxed.
System-7 : ( Milk + Water + Formaline (HCHO))
It is seen that there is nonlinear increase in values of density, viscosity, ultrasonic velocity,
acoustical impedance, relaxation time, surface tension and relative association and decrease in
the values of adiabatic compressibility and intermolecular free length with increasing
concentration of formaline from 2 wt % to 10 wt % which are represented by Table 7.
Interaction of formaline with milk is given in Figure 10.
Figure 10- Reaction of Formaline and Milk

20
As the concentration of formaline increases, the value of density and viscosity increases
due to nature of medium to become more denser and property of formaline to form strong
hydrogen bond with water present in the milk . The strong dipole-dipole interaction or hydrogen
bond complex formation between the proteins molecules and other components present in the
milk with Na2CO3 leads to the increase in ultrasonic velocity and decrease in adiabatic
compressibility.
The data from Table 7 shows the value of acoustical impedance, relaxation time, relative
association and surface tension increases nonlinearly which may be due to weak interaction at
initially and shows strong interaction after 2 wt % addition of formaline in milk-water mixture.
The relaxation time increase continuously as the concentration of formaline increases which
shows that there is time where ions present in the mixture is said to be more relaxed. The value
of adiabatic compressibility and intermolecular free length nonlinearly which shows the presence
of strong solute-solvent interactions in the mixture.
Conclusion:
On adding additives such as water, sodium carbonate (Na2CO3), sodium-bi-carbonate
(NaHCO3), oxalic acid (COOH)2, urea (CO(NH2)2, melamine (C3H6N6) and formaline (HCHO)
in the pure cow milk, it is observed that the values of density, viscosity and ultrasonic velocity
of pure milk changes i.e. increases linearly with respective to that of the pure milk. The increase
in the values of parameters on addition of various additives to pure milk may be due to increase
in solute-solvent interactions.
The data produced in this work and the results obtained can be used as reference to detect the
adulterant and indentify the various additives used as adulterant in locally available milk and
different branded milk.