detection of circumstellar material in a normal type ia ...fpatat/science/sn06x/preprint.pdf ·...
TRANSCRIPT

Detection of circumstellar material in a normal Type IaSupernova
F. Patat1∗, P. Chandra2,3, R. Chevalier2, S. Justham4, Ph. Podsiadlowski4, C. Wolf4,A. Gal-Yam5, L. Pasquini1, I.A. Crawford6, P.A. Mazzali7,8, A.W.A. Pauldrach9
K. Nomoto10, S. Benetti11, E. Cappellaro11, N. Elias-Rosa7,12, W. Hillebrandt7,D.C. Leonard13, A. Pastorello14, A. Renzini11, F. Sabbadin11, J.D. Simon5, M. Turatto11
1European Southern Observatory, K. Schwarzschild Str.2, 85748, Garching b. Munchen, Germany2University of Virginia, Dept. of Astronomy, PO Box 400325, Charlottesville, VA 22904, USA
3 Jansky Fellow, National Radio Astronomy Observatory4Dept. of Astrophysics, University of Oxford, Oxford OX1 3RH, UK
5Astronomy Department, MS 105-24, California Institute of Technology, Pasadena, CA 91125,USA6School of Earth Sciences, Birkbeck College London, Malet Street, London WC1E 7HX, UK
7Max-Planck-Institut fur Astrophysik, K. Schwarzschild Str.1, 85748, Garching b. Muenchen, Germany8INAF-Osservatorio Astronomico, v. Tiepolo 11, 34131 Trieste, Italy
9Institut fur Astronomie und Astrophysik der Ludwig-Maximilians-Universitat, 81679 Munich, Germany10Dept. of Astronomy, University of Tokyo, Bunkyo-ku, Tokyo 113-0033, Japan
11INAF-Osservatorio Astronomico, v. Osservatorio 5, 35122 Padova, Italy12Universidad de La Laguna, Av. Astrofısico Fransisco Sanchez s/n, E-38206, La Laguna, Tenerife, Spain
13Department of Astronomy, San Diego State University, San Diego, California 92182, USA14Astrophysics Research Centre, Queen’s University Belfast, BT7 1NN, UK∗To whom correspondence should be addressed. E-mail: [email protected]
ACCEPTED FOR PUBLICATION INSCIENCE
(Submitted on March 26, 2007 - Accepted on June 29, 2007)
1

Type Ia supernovae are thought to be thermonuclear explosions of accreting
white dwarfs that reach a critical mass limit. Despite their importance as cos-
mological distance indicators, the nature of their progenitors has remained
controversial. Here we report the detection of circumstellar material in a nor-
mal Type Ia supernova. The expansion velocities, densities and dimensions
of the circumstellar envelope indicate that this material was ejected from the
progenitor system. The relatively low expansion velocities appear to favor a
progenitor system where a white dwarf accretes material from a companion
star which is in the red-giant phase at the time of explosion.
Due to their extreme luminosities and high homogeneity, Type Ia Supernovae have been
used extensively as cosmological reference beacons to trace the evolution of the Universe(1,
2). However, despite significant recent progress, the nature of the progenitor stars and the
physics which govern these powerful explosions have remained very poorly understood(3, 4).
In the presently favored single-degenerate model, the supernova progenitor is a white dwarf
in a close binary accreting from a non-degenerate companion(5); the white dwarf explodes in
a thermonuclear explosion when it approaches the Chandrasekhar limit. A direct method for
investigating the nature of the progenitor systems of Type Ia supernovae (hereafter SNe Ia) is to
search for signatures of the material transferred to the accreting white dwarf in the circumstellar
material (CSM). Previous attempts have aimed at detecting the radiation which would arise
from the interaction between the fast moving SN ejecta and the slow moving CSM in the form
of narrow emission lines(6), radio(7) and X-ray emission(8). The most stringent upper limit to
the mass loss rate set by radio observations is as low as 3×10⁻⁸ solar masses per year (M� yr−1)
for an assumed wind velocity of 10 km s−1 (7). Two remarkable exceptions are represented by
two peculiar SNe Ia, SN 2002ic and SN 2005gj, which have shown extremely pronounced
hydrogen emission lines(9, 10), that have been interpreted as a sign of strong ejecta-CSM
2
interaction(11). However, the classification of these supernovae as SNe Ia has recently been
questioned(12), and even if they were SN Ia, they are unlikely to account for normal Type Ia
explosions(7) that, so far, lack any signature of mass transfer from a hypothetical donor. Here,
we report direct evidence of CSM in a SN Ia that has shown a normal behavior at X-ray, optical
and radio wavelengths.
SN 2006X was discovered in the Virgo Cluster spiral galaxy NGC 4321(13). A few days
later, the object was classified as a normal Type Ia event occurring 1 – 2 weeks before maximum
light, which was affected by substantial extinction(14). Prompt Very Large Array (VLA) ob-
servations have shown no radio source at the SN position(15), establishing one of the deepest
and earliest limits for radio emission from a Type Ia, and implying a mass-loss rate of less than
a few 10−8 M� yr−1 (for a low wind velocity of 10 km s−1). The SN was not visible in the
0.2–10 keV X-rays band down to the SWIFT satellite detection limit(8).
We have observed SN 2006X with the Ultraviolet and Visual Echelle Spectrograph mounted
at the European Southern Observatory 8.2m Very Large Telescope. Observations were carried
out on four different epochs, which correspond to days−2, +14, +61 and +121 with respect
to B-band maximum light. Additionally, a fifth epoch (day +105) was covered with the High
Resolution Echelle Spectrometer mounted at the 10m Keck telescope(16). The most remark-
able finding from our data is the clear evolution seen in the profile of the Na I D lines (5889.95,
5895.92A). In fact, besides a strongly saturated and constant component, arising in the host
galaxy disk (see section S2, Fig. S1), a number of features spanning a velocity range of about
100 km s−1 appear to vary significantly with time (Fig. 1, Fig. S2). SN 2006X is projected onto
the receding side of the galaxy, and the component of the rotation velocity along the line of sight
at the apparent SN location is about +75 km s−1 (17), which coincides with the strongly satu-
rated Na I D component, the saturated Ca II H&K lines, and a weakly saturated CN vibrational
band (0-0) (Fig. 2, Fig. S1). This and the lack of time evolution proves that the deep absorption
3
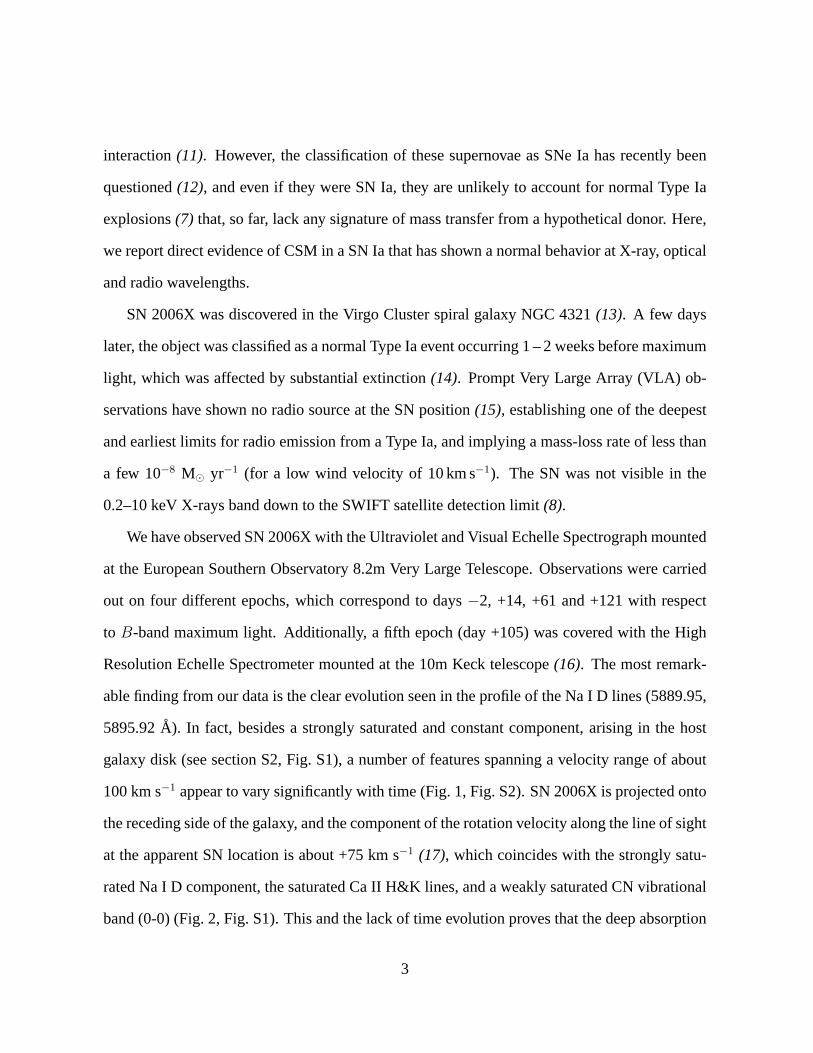
Figure 1: Time evolution of the Sodium D2 component region as a function of elapsed timesinceB-band maximum light. The heliocentric velocities have been corrected to the rest-frameusing the host galaxy recession velocity. All spectra have been normalized to their continuum.In each panel, the dotted curve traces the atmospheric absorption spectrum.
4
arises within the disk of NGC 4321 in an interstellar molecular cloud (or system of clouds) that
is responsible for the bulk of the reddening suffered by SN 2006X (see text S2).
In contrast, the relatively blue-shifted structures of the Na I D lines show a rather complex
evolution. The number of features, their intensity and width are difficult to establish. Nev-
ertheless, for the sake of discussion, four main components, which we will indicate as A, B,
C and D, can be tentatively identified in the first two epochs (Fig. 2). Components B, C and
D strengthen between day−2 and day +14 while component A remains constant during this
time interval. The situation becomes more complicated on day +61: components C and D
clearly start to decrease in strength, but component B remains almost constant and component
A becomes definitely deeper and is accompanied by a wide absorption that extends down to a
rest-frame heliocentric velocityvh ' −50 km s−1 (Fig. 1, Fig. S2). After this epoch there is no
evidence of evolution, and component A remains the most intense feature up to the last phase
covered by our observations, more than four months after the explosion.
Variable interstellar absorption on comparably short timescales has been claimed for some
Gamma Ray Bursts (GRB), and it has been attributed by some authors to line-of-sight geomet-
rical effects, due to the fast GRB expansion coupled to the patchy nature of the intervening
absorbing clouds(18). Our data clearly show that despite the marked evolution in the Na I D
lines, Ca II H&K components do not change with time (see Fig. 2, Fig. S3 and the discussion in
sections S3 and S4). Therefore, in the case of SN 2006X, transverse motions in the absorbing
material and line-of-sight effects due to the fast SN photosphere expansion (typically 104 km
s−1) can be definitely excluded, since they would cause variations in all absorption features.
For this reason we conclude that the Na I features seen in SN 2006X, arising in a number
of expanding shells (or clumps), evolve because of changes in the CSM ionization conditions
induced by the variable SN radiation field. In this context, the different behavior seen in the
Na I and Ca II lines is explained in terms of the lower ionization potential of Na I (5.1 eV,
5
corresponding to 2417A) with respect to Ca II (11.9 eV, corresponding to 1045A), their dif-
ferent recombination coefficients and photoionization cross sections coupled to a UV-deficient
radiation field (see text S4). Regrettably, not much is known about the UV emission of SNe
Ia shortwards of 1100A (8, 19). From a theoretical point of view, a severe UV line blocking
by heavy elements like Fe, Co and Mg is expected(20). An estimate of the Na I ionizing flux,
SUV , can be derived from a synthetic spectrum of a Type Ia SN at maximum light(21), and this
turns out to beSUV ∼5×1050 photons s−1. One can verify that this flux is largely sufficient to
fully ionize Na I up to rather large distancesri ∼5×1018 cm.
Nevertheless, since the recombination timescaleτr must be of the order of 10 days, this
requires an electron densityne as large as 105 cm−3 ( see section S4). Given the low abundance
of any other element, such a high electron density can be produced only by partial hydrogen
ionization. Due to the severe line blocking suffered by Type Ia SNe(20), the flux of photons
capable of ionizing H is very small (∼4×1044 photons s−1) and this imposes that the gas where
the Na I time-dependent absorptions arise must be confined within a few 1016 cm from the SN
(see text S4). In a SN of this type, the flux in the 1120–2640A band decreases by a factor
of ten in the first two weeks after maximum light(8, 19). Since at a distance of∼1016 cm
from the SN the ionization timescaleτi for Na I is much shorter thanτr, the ionization fraction
grows with time following the increase of the UV flux during the pre-maximum phase, while
after maximum it decreases following the recombination timescale. This would explain the
overall growth of the blue components’ depth, as shown by our data, in terms of an increasing
fraction of neutral Na, while the different evolution of individual components would be dictated
by differences in the densities and distances from the SN. Moreover, once all the Na II has
recombined (which should happen within a fewτr, i.e. ∼1 month), there should be no further
evolution, in qualitative agreement with the observations. Additionally, since the flux of photons
that can ionize Ca II is more than four orders of magnitude less than in the case of Na I (see
6

section S4), the corresponding ionization fraction is expected to be of a few per cent only.
Therefore, the recombination of Ca III to Ca II does not produce measurable effects on the
depth of Ca II H&K lines, as it is indeed observed (see text S3).
The H mass (M(H)) contained in the shells generating the observed absorptions can be es-
timated from our observations after making some conservative assumptions. The Na I column
densityN(NaI) deduced from the most intense feature (D, day +14) isN(NaI) ' 1012 cm−2.
Assuming that the material generating this component is homogeneously distributed in a thin
spherical shell with radius1017 cm, a solar Na/H ratio (log Na/H=−6.3) and complete Na re-
combination, an upper limit to the shell mass can be estimated asM(H) ≤ 3 × 10⁻⁴ M� (this
value is reduced by a factor 100 for material at about 1016 cm, the most likely distance for com-
ponents C and D; see below). Even in the case of complete ionization, such a H mass would
produce an Hα luminosity of∼4×1034 erg s−1, which is two orders of magnitude below the
3-sigma upper limits set by our observations at all epochs (Table S2) and by any other SN Ia
observed so far(6). Therefore, the absence of narrow emission lines above the detection limit
is not in contradiction with the presence of partially ionized H up to masses of the order of 0.01
M�.
However, photo-ionization alone cannot account for the fact that not all features increase
in depth with time (Fig. 2). In fact, on day +61, components C and D turn back to the same
low intensity they had on day−2. One possible explanation is that the gas is re-ionized by
some other mechanism, like the ejecta-CSM interaction. In this case, the absorbing material
generating components C and D must be close enough to the SN so that the ejecta can reach it
in about one month after the explosion (∼1016 cm for maximum ejecta velocities of 4×10⁴ km
s−1). Similarly, in order not to be reached by the ejecta more than four months after, A, B and
the broad high-velocity components must arise at larger distances (>5×1016 cm). This scenario
is not ruled out by the lack of radio emission from SN 2006X(15). In fact, in the light of our
7

Figure 2: Evolution of the Na I D2 and Ca II K line profiles between day−2 (black), day +14(red) and day +61 (blue, Na I D2 only). The vertical dotted lines mark the four main variablecomponents at−3 (A), +20 (B), +38 (C) and +45 (D) km s−1. For comparison, the upper panelshows theR(0), R(1) andP (1) line profiles of the (0-0) vibrational band of the CNB2Σ−X2Σ.The velocity scale refers to theR(0) transition (3874.608A). Color coding is as for the othertwo panels.
8
current understanding of the ejecta-CSM interaction mechanism(22), the presence of similar
shells with masses smaller than a few 10−4 M�, cannot be excluded by radio non-detections of
SNe Ia in general(7). Our findings are consistent with upper limits on the radio flux set by our
VLA observations, obtained about 10 months after the explosion (see section S1), which are
comparable to the best upper limits set on the radio luminosity of other normal SNe Ia(7).
If we adopt the velocity of the CN lines as indicative of the host galaxy rotation component
along the line of sight at the SN location, then our observations provide solid evidence of CSM
expanding at velocities that span a range of about 100 km s−1 (Fig. 2).
The most important implication of these observations is that they show that this circumstellar
material was ejected from the progenitor system in the recent past. For instance, with a shell
radius of 1016 cm and a wind velocity of∼50 km s−1, the material would have been ejected some
50 years before the explosion. This almost certainly rules out a double-degenerate scenario for
SN 2006X, where the supernova would have been triggered by the merger of two CO white
dwarfs. In this case, no significant mass loss would be expected in the phase immediately
preceding the supernova. Thus, a single-degenerate model is the favored model for SN 2006X,
where the progenitor accreted from a non-degenerate companion star.
Mean velocities for the circumstellar material of∼50 km s−1 are comparable to those re-
ported for the winds of early red giant (RG) stars(22); velocities matching our observations
are also expected for late subgiants. The observed material is moving more slowly than would
be expected for winds from main sequence donor stars or from compact helium stars. Of the
two major formation channels proposed for SN Ia with a non-degenerate donor star(23), these
wind velocities seem more consistent with the shorter-period end of the ”symbiotic” formation
channel. The observed structure of the circumstellar material could be due to variability in the
wind from the companion RG; considerable variability of RG mass loss is generally expected
(24).
9
An alternative interpretation of these distinct features is that they arise in the remnant shells
of successive novae, which can create dense shells in the slow moving material released by the
companion(25, 26). This seems to require an aspherical shell geometry in order to match the
observed low velocities (see S6 for further details). Not only might this be expected a priori
(27), observations of the 2006 outburst of RS Ophiuchi show that there is an equatorial density
enhancement which strongly restrains the expansion of the nova shell(28, 29, 30).
One crucial issue is whether what we have seen in SN 2006X represents the rule or is rather
an exceptional case. Other cases of SNe Ia showing negative velocity components are known,
like SN 1991T and SN 1998es (see Fig. S5 and the discussion in S5). Unfortunately, multi-
epoch high-resolution spectroscopy is not available for these objects (to our knowledge, the
SN 2006X data set is unique in this respect), and therefore time variability cannot be demon-
strated. Nevertheless, the data clearly show components approaching the observer at velocities
which reach at least 50 km s−1 with respect to the deep absorption that we infer to be produced
within the disks of the respective host galaxies. This, and the fact, that SN 2006X has shown no
optical, UV and radio peculiarity whatsoever, supports the conclusion that what we have wit-
nessed for this object is common to normal SN Ia, possibly all of them, even though variations
due to different inclinations of the line of sight with respect to the orbital plane may exist.
References and Notes
1. A.G. Riesset al., Astron. J.116, 1009 (1998).
2. S. Perlmutteret al., Astrophys. J.517, 565 (1999).
3. D. Branch, M. Livio, L.R. Yungelson, F. Boffi, E. Baron,Publ. Astr. Soc. Pac.107, 1019 (1995).
4. W. Hillebrandt, J.C. Niemeyer,Annu. Rev. Astron. Astrophys.38, 191 (2000).
5. J. Whelan, I. Iben,Astrophys. J.186, 1007 (1973).
6. S. Mattilaet al., Astron. Astrophys.443, 649 (2005).
7. N. Panagiaet al., Astrophys. J., 469, 396 (2006).
8. S.I. Immleret al., Astrophys. J.648, L119 (2006).
9. M. Hamuyet al., Nature424, 651 (2003).
10
10. G. Alderinget al., Astrophys. J., 650, 510 (2006).
11. The sub-luminous SN Ia 2005ke has shown an unprecedented X-ray emission, which has been interpretedas the signature of a possible weak ejecta-CSM interaction(8). Nevertheless, this finding and the strongUV emission might be related to the nature of this SN.
12. S. Benettiet al., Astrophys. J., 653, L129 (2006).
13. S. Suzuki, M. Migliardi, IAU Circ.8667(2006).
14. R. Quimby, P. Brown, C. Gerardy, CBET421(2006).
15. C.J. Stockdaleet al., CBET396(2006).
16. Materials, Methods, Text and Figures are available as supporting material onScienceonline.
17. R.J. Rand,Astrophys. J.109, 2444 (1995).
18. H. Haoet al., Astrophys. J.659, L99 (2007).
19. N. Panagia,Supernova 1987A: 20 Years after: Supernovae and Gamma-Ray Bursters, S. Immler, R. Mc-Cray and K.W. Weiler, Eds. (AIP Conf. Proc., 2007), in press; preprint available online (http://arxiv.org/abs/0704.1666).
20. W.A. Pauldrachet al., Astron. Astrophys.312, 525 (1996).
21. R.A. Chevalier, C. Fransson,Supernovae and Gamma-Ray Bursters, K. Weiler, Ed. (Lecture Notes inPhysics, vol. 598, Springer Verlag, New York, 2003), pp.171-194.
22. P.G. Judge, R.E. Stencel,Astrophys. J.371, 357 (1991).
23. I. Hachisu & M. Kato,Astrophys. J.558, 323 (2001).
24. L.A. Willson,Ann. Rev. Astron. Astrophys.38, 573 (2000).
25. I. Hachisu, M. Kato,Astrophys. J.558, 323 (2001).
26. W.M. Wood-Vasey, J.L. Sokoloski,Astrophys. J.645, L53 (2006).
27. I. Hachisu, M. Kato, K. Nomoto,Astrophys. J.522, 487 (1999).
28. T.J. O’Brienet al., Nature 442,279 (2006).
29. M.F. Bodeet al., Astrophys. J.652, 629 (2006).
30. M.F. Bode,et al., Astrophys. J., in press; preprint available online (http://arxiv.org/abs/0706.2745).
31. We wish to thank K. Krisciunas for providing us with the information about the photometric evolutionof SN 2006X. We acknowledge Katrien Steenbrugge, Francesca Primas, Michael Wood-Vasey, RomanoCorradi, Gary J. Ferland, Peter van Hoof, Fabio Bresolin and Christopher Stockdale for useful discussions.We particularly thank M.F. Bode for sharing some results on RS Oph before publication. This work isbased on observations made with ESO Telescopes at Paranal Observatory, obtained under Run IDs 276.D-5048, 277.D-5003 and 277.D-5013. Some of the data presented herein were obtained at the W.M. KeckObservatory, which is operated as a scientific partnership among the California Institute of Technology,the University of California and the National Aeronautics and Space Administration. This work made useof the Very Large Array telescope of the National Radio Astronomy Observatory, which is operated byAssociated Universities, Inc. under a cooperative agreement with the National Science Foundation.
11
Supporting Online Material
S1. Materials and Methods
We have observed SN 2006X on 5 epochs spanning about 4 months (Table S1). High res-olution spectra were obtained with the European Southern Observatory’s (ESO) Very largeTelescope (VLT) on Cerro Paranal (Chile), equipped with the Ultraviolet and Visual EchelleSpectrograph (UVES)(S1), and with the Keck I Telescope equipped with the High ResolutionEchelle Spectrometer (HIRES)(S2). For UVES we have used the 390+580 setting, which cov-ers simultaneously three wavelength ranges (3290-4500A, 4780-5740A and 5830-6800A), witha full width half maximum (FWHM) resolution of 7 km s−1. In the case of HIRES, we haveused a setting optimized for the NaI D region, that covers the wavelength range 3900-8350Awith a FWHM resolution of 6.8 km s−1. UVES data have been reduced using the UVES DataReduction Pipeline(S3), while HIRES data have been processed using standard procedures forEchelle spectra. Wavelength calibration has been achieved using Thorium-Argon lamps. Thefinal RMS accuracy is about 0.15 km s−1. The wavelength scale was corrected to the rest-frameadopting a host galaxy recession velocity of 1571 km s−1 (S4). To compensate for the Earth’smotion, a heliocentric velocity correction has been applied to the data (Table S1). The effect ofatmospheric lines has been checked using a spectroscopically featureless bright star (HR 3239)observed with the same instrumental setup as for the science data. The spectral region of inter-est turns out to be essentially free of telluric features. Therefore, the broad absorption visiblestarting with day +61 and reachingvh ∼ −70 km s−1 is real and not affected by atmosphericlines. Na I column densities have been estimated fitting Voigt line profiles with VPFIT(S5).Finally, epochs have been computed fromB maximum light, which took place on February 20,2006(S6).
In order to set upper limits to Hα and He I 5876A luminosities (Table S2), the UVES spectrahave been calibrated by means of a reference response function. Since the observations havebeen obtained under sky transparency conditions that ranged from clear/photometric (epochs−2, +14, and +121) to thin cirrus (+61), taking into account the high instrument stability, theexpected flux calibration accuracy is of the order of 20-30%. To the best of our knowledge, theupper limits on Hα and He I 5876A presented here are the latest ever published. The signal-to-noise ratio on the continuum in the Na I D lines region ranges from∼70 (day−2) to∼20 (day+121).
To confirm the low mass of CSM estimated from the Na I observations, we have observedSN 2006X with the Very Large Array(S8), in the C configuration, at 6 cm (4.8 GHz) on Novem-ber 17 and at 3.6 cm (8.4 GHz) on November 20, 2006, corresponding to +270 and +273 daysafterB maximum light, respectively. The SN was not detected at both wavelengths, and the 2SD limits are 0.07 mJy and 0.09 mJy for the two bands respectively(S9), which are comparableto the best limits available so far(S10). At the epoch sampled by our observations, the SN ejectahave reached a distance of∼1017 cm from the explosion site. Our upper limits on the radio flux
12

UT Date Phase Instrument/Telescope Total Integration Time Heliocentric Correction(2006) (days) (seconds) (km s−1)18/02 −2 UVES/VLT 4175 +14.606/03 +14 UVES/VLT 8940 +7.222/04 +61 UVES/VLT 15025 −15.406/06 +105 HIRES/KECK 3600 +5.025/06 +121 UVES/VLT 15025 −28.0
Table S1: High resolution spectroscopic observations of SN 2006X. Phase refers toB-bandmaximum light, attained on February 20, 2006(S6)
constrain the corresponding CSM mass to be smaller than a few 10−3 solar masses (M�), whichis fully consistent with the estimates deduced from the observed Na I absorptions. Very similarupper limits have been set for standard SN Ia events like SN 1981B, 1989M, 1998bu and 1992A(S10).
From the low resolution spectroscopic data that we have obtained in parallel to the highresolution data set discussed in this paper, we confirm the results of the early classificationspectroscopy (S11). SN 2006X appears to be a normal Ia, very similar to SN 2002bo(S12), withsomewhat higher photospheric velocities. The derivation of photometric parameters is hinderedby a rather strong reddening (E(B − V ) >1.1) and an anomalous extinction law (RV <2).However, the decline rate, the light and color curve shapes and the absolute magnitude arewithin the range of normal Type Ia SNe(S6).
S2. The interstellar material
The apparent position of SN 2006X is very close to a spiral arm of NGC 4321, which isinclined by 28 degrees with respect to the line of sight(S13). Due to the relatively high extinc-tion (S11), the SN most likely exploded within or behind the disk of the host galaxy. Moreover,the SN is projected onto the receding side of the galaxy, and the component of the rotationvelocity along the line of sight at the apparent SN location is about 75 km s−1 (S4, S13), whichcoincides with the strongly saturated Na I D component (Fig. S1). This suggests rather un-equivocally that the time-invariant, very deep absorptions arise within the disk of NGC 4321.The equivalent widths of the Na I D lines, measured in the first epoch spectrum, are 670±5 and625±4 mA for the D2 and D1 components respectively. The implied total Na I column density,estimated fitting multiple Voigt line profiles with VPFIT(S5), is as large aslog N ∼14.3. Fora Milky Way-like dust mixture this would turn into a color excessEB−V ∼1.1 (S14). More-over, the CN lines clearly visible in our first two spectra atvh=73.6±1.0 km s−1 (weightedaverage of the two epochs) have an unprecedented depth (see also ref.S15). On the first epochspectrum the equivalent widths for the three lines are:EW [R(0)]=91±2, EW [R(1)]=60±3andEW [P (1)]=42±3 mA that, after correcting for saturation effects, correspond to column
13
Phase Hα He I 58767 km s−1 50 km s−1 7 km s−1 50 km s−1
−2 2.2 16.0 2.4 17.0+14 1.1 8.0 1.1 7.6+61 0.6 4.0 0.6 4.4+121 0.3 2.2 0.4 2.6
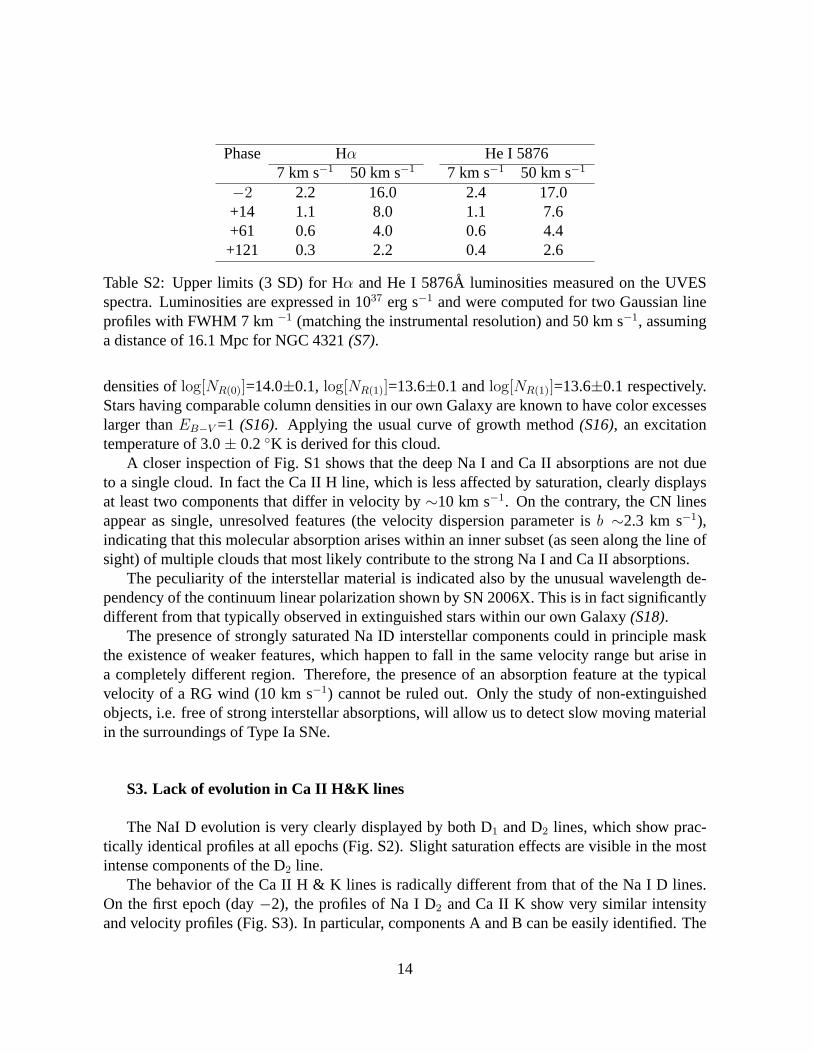
Table S2: Upper limits (3 SD) for Hα and He I 5876A luminosities measured on the UVESspectra. Luminosities are expressed in 1037 erg s−1 and were computed for two Gaussian lineprofiles with FWHM 7 km−1 (matching the instrumental resolution) and 50 km s−1, assuminga distance of 16.1 Mpc for NGC 4321(S7).
densities oflog[NR(0)]=14.0±0.1, log[NR(1)]=13.6±0.1 andlog[NR(1)]=13.6±0.1 respectively.Stars having comparable column densities in our own Galaxy are known to have color excesseslarger thanEB−V =1 (S16). Applying the usual curve of growth method(S16), an excitationtemperature of 3.0± 0.2 ◦K is derived for this cloud.
A closer inspection of Fig. S1 shows that the deep Na I and Ca II absorptions are not dueto a single cloud. In fact the Ca II H line, which is less affected by saturation, clearly displaysat least two components that differ in velocity by∼10 km s−1. On the contrary, the CN linesappear as single, unresolved features (the velocity dispersion parameter isb ∼2.3 km s−1),indicating that this molecular absorption arises within an inner subset (as seen along the line ofsight) of multiple clouds that most likely contribute to the strong Na I and Ca II absorptions.
The peculiarity of the interstellar material is indicated also by the unusual wavelength de-pendency of the continuum linear polarization shown by SN 2006X. This is in fact significantlydifferent from that typically observed in extinguished stars within our own Galaxy(S18).
The presence of strongly saturated Na ID interstellar components could in principle maskthe existence of weaker features, which happen to fall in the same velocity range but arise ina completely different region. Therefore, the presence of an absorption feature at the typicalvelocity of a RG wind (10 km s−1) cannot be ruled out. Only the study of non-extinguishedobjects, i.e. free of strong interstellar absorptions, will allow us to detect slow moving materialin the surroundings of Type Ia SNe.
S3. Lack of evolution in Ca II H&K lines
The NaI D evolution is very clearly displayed by both D1 and D2 lines, which show prac-tically identical profiles at all epochs (Fig. S2). Slight saturation effects are visible in the mostintense components of the D2 line.
The behavior of the Ca II H & K lines is radically different from that of the Na I D lines.On the first epoch (day−2), the profiles of Na I D2 and Ca II K show very similar intensityand velocity profiles (Fig. S3). In particular, components A and B can be easily identified. The
14
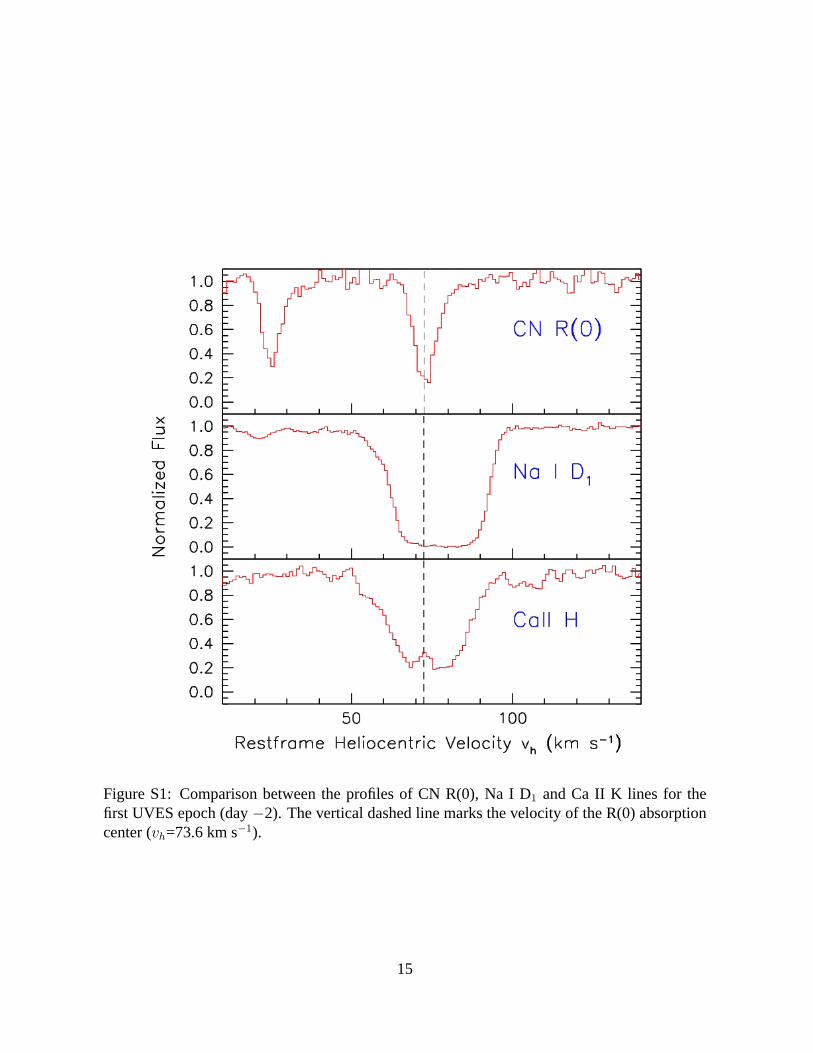
Figure S1: Comparison between the profiles of CN R(0), Na I D1 and Ca II K lines for thefirst UVES epoch (day−2). The vertical dashed line marks the velocity of the R(0) absorptioncenter (vh=73.6 km s−1).
15

differences become dramatic at the second epoch (day +14), when Ca II K remains practicallyunchanged while Na I D2 develops deep absorptions for components B, C and D. The signal-to-noise ratio in the Ca II region is lower, but a variation similar to that taking place for the Na Ilines would have been definitely detected, at least for components B, C and D. Due to the SNfading and its spectral evolution, the continuum in the Ca II H&K region becomes very weak astime goes by, making the detection of the K line more and more difficult. Even heavily binningour third epoch data (day +61), the signal-to-noise ratio achieved on the resulting profile isnot sufficient to draw any firm conclusion (Fig. S3). At later epochs, due to the very low SNcontinuum, the H&K lines could not be detected.
Geometric effects related to the fast expansion of the radiation ring and the consequentchange in the covering factor coupled to the patchy structure of the intervening absorbingclouds, have been advocated to explain the time variability claimed for some Gamma Ray Bursts(GRB) (S19, S20). What emerges from this analysis is that a Ca II H&K evolution at the levelseen in the Na I D lines can be definitely excluded. In turn, this rules out transverse motions orline-of-sight effects as responsibles for the evolution observed in SN 2006X.
S4. The location of the absorbing material in SN 2006X
After sodium is ionized by the SN radiation field, which drops quickly after maximum light(S21), it starts recombining with a time scaleτr which depends on the electron number densityne and the radiative recombination coefficientβ: τr = (ne β)−1. Given the time scale ofthe observed changes in the NaID features, we estimateτr ∼10 days, which impliesne ∼ 105
cm−3 for β '5×10⁻¹² cm3 s−1 (S22). Such an high electron density can only come from partialionization of hydrogen. Therefore, the maximum distance for the gas where the time-variableNaI features arise is dictated by the ability of the SN to ionize hydrogen, i.e. by the fluxSUV ofphotons at wavelengths shorter than 912A, times the duration∆tSN of the UV emitting phase.
An upper limit to the number of hydrogen atoms that are ionized is therefore given by thetotal number of ionizing photons,SUV ∆tSN , which in turn must be equal toVH ne, with VH
being the volume of the layer responsible for the varying absorption. Thus, an upper limit tothis volume is given by:
VH ≤SUV ∆tSN
ne
. (S1)
Assuming that the absorbing material is confined within a thin shell of thickness∆r (with∆r � rH), the maximum radius of such a shell is:
rH ≤[
SUV ∆tSN
4π ne ∆r/r
]1/3
. (S2)
UsingSUV = 4.4×1044 photons s−1, the value derived from the synthetic spectrum at max-imum light (S23), and a light curve width of∆tSN= 20 days, one getsrH ≤4×1015 cm for
16
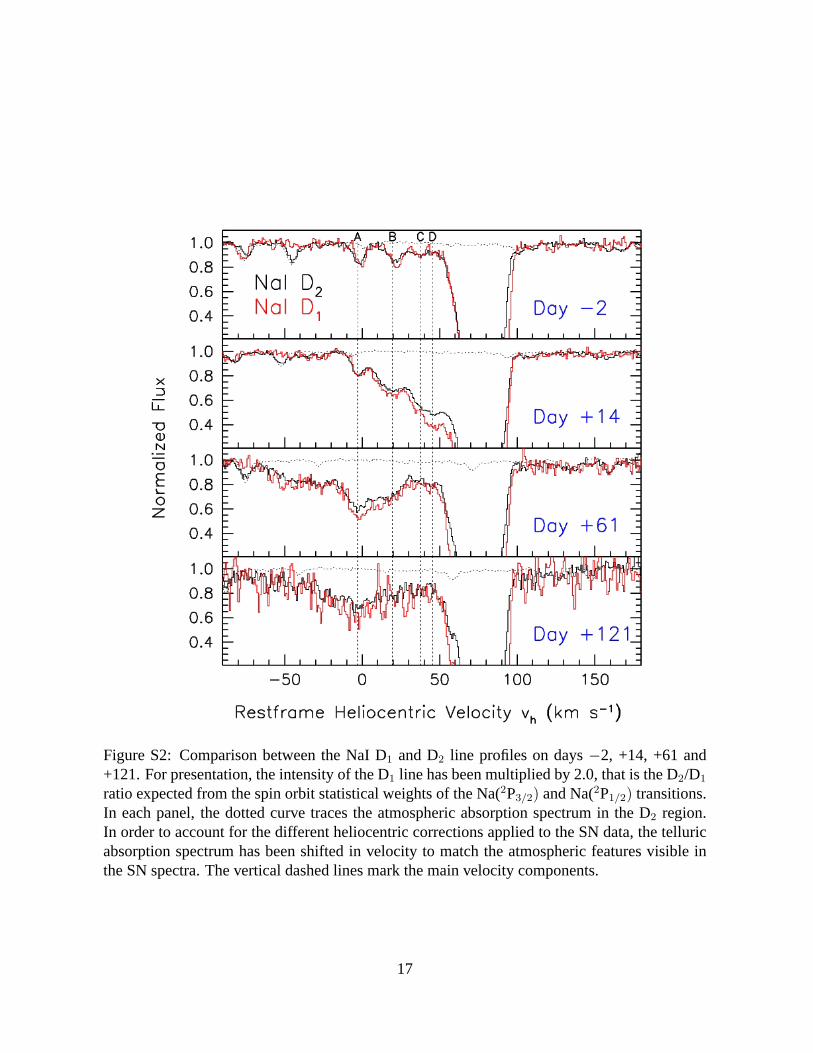
Figure S2: Comparison between the NaI D1 and D2 line profiles on days−2, +14, +61 and+121. For presentation, the intensity of the D1 line has been multiplied by 2.0, that is the D2/D1
ratio expected from the spin orbit statistical weights of the Na(2P3/2) and Na(2P1/2) transitions.In each panel, the dotted curve traces the atmospheric absorption spectrum in the D2 region.In order to account for the different heliocentric corrections applied to the SN data, the telluricabsorption spectrum has been shifted in velocity to match the atmospheric features visible inthe SN spectra. The vertical dashed lines mark the main velocity components.
17
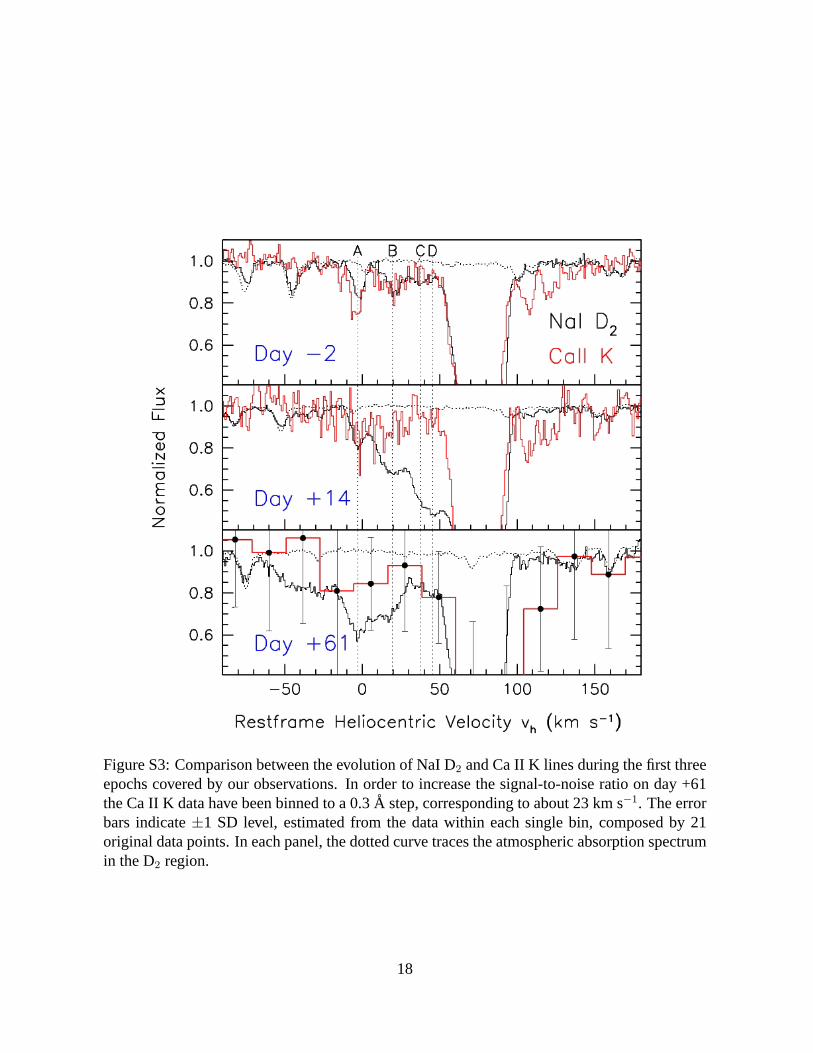
Figure S3: Comparison between the evolution of NaI D2 and Ca II K lines during the first threeepochs covered by our observations. In order to increase the signal-to-noise ratio on day +61the Ca II K data have been binned to a 0.3A step, corresponding to about 23 km s−1. The errorbars indicate±1 SD level, estimated from the data within each single bin, composed by 21original data points. In each panel, the dotted curve traces the atmospheric absorption spectrumin the D2 region.
18

ne=105 cm−3 and∆r/r=0.01. The largest uncertainty in estimatingrH comes from the totalfluence of ionizing photons (SUV ∆tSN ). In fact, the synthetic spectrum we have used is a bestfit to an HST spectrum of SN 1992A extending down to about 1600A and obtained 6 days pastmaximum light and(S24), i.e. when the UV flux has significantly dropped(S21). Nevertheless,thanks to the cubic root dependency on it, even a 103 times higher fluence would result in anupper limit of∼5×1016 cm. This clearly demonstrates that the material responsible for thetime-variable features is confined well within the circum-stellar domain.
This creates a very marked distinction between Type Ia SNe and GRBs, for some of whichtime-dependent UV absorption features have been claimed(S19, S20, S25). In fact, GRBsand their early after-glows have a very strong X-ray/UV radiation field, so that all possiblecircumstellar gas is completely ionized. For instance, GRB 021004 was shown to be able tocompletely ionize the interstellar material out to about 100 pc (∼3×1020 cm) (S19), while forGRB 060418 the ionization was found to reach∼1.7 kpc (∼5×1021 cm) (S25).
As far as calcium is concerned, we note that the flux of photons capable of ionizing Ca IIcomputed from the synthetic spectrum(S23)is∼3.5×1046 photons s−1. This is more than fourorders of magnitude smaller than the corresponding Na I ionizing flux. As a consequence, theionization fraction of Ca II is significantly smaller and hence, as it recombines, no detectableeffect on the depth of Ca II H&K lines is expected, as shown by the observations (see S3 andFig. S3). The same mechanism has been proposed to explain the inter-stellar line variabilityobserved in galactic stars which, due to the much lower densities, takes place on timescales ofyears to decades(S26).
An alternative explanation for the presence of expanding shells in the immediate surround-ings of SN 2006X is that they have been lost by a nearby star, physically not related to theprogenitor system but close enough to be influenced by the SN radiation field. In fact, shellsexpanding with velocities up to several tens of km s−1 are known to be present, for instance,around many galactic OB associations(S26). Since the material has to be relatively close to theSN in order to be influenced by its UV radiation, this alternative scenario requires that the SNexploded within a cluster or a star association.
In order to study the immediate surroundings of the explosion site, we have used a deep pre-explosion image obtained with the ESO-VLT FOcal Reducer and low dispersion Spectrograph(FORS1),(S28). Observations were performed on May 12, 1999 in theR passband(S28),with an exposure time of 600 seconds and a seeing of 0.8 arcsec (FWHM), corresponding toa limiting magnitudeR ∼24.0 (5 SD level) at the SN location (Fig. S4, left panel). To bettercharacterize the SN environment, we have searched the Hubble Space Telescope Archive forhigh resolution imaging. The only suitable data we could find were obtained with the AdvancedCamera for Surveys (ACS),(S29)on May 21, 2006(S30)in high resolution mode (0.027 arcsecpixel−1) with the F435W (1480 seconds), F555W and F775W (1080 seconds) filters. In orderto increase the signal-to-noise ratio, the three images have been registered and stacked (Fig. S4,right panel). The resulting image reveals a wealth of resolved objects, which can be identifiedas red, blue super-giants, groups of O stars and OB associations, with typical sizes of∼100 pc.All such associations and stellar groups (like those marked with labels A and B on the ACS
19
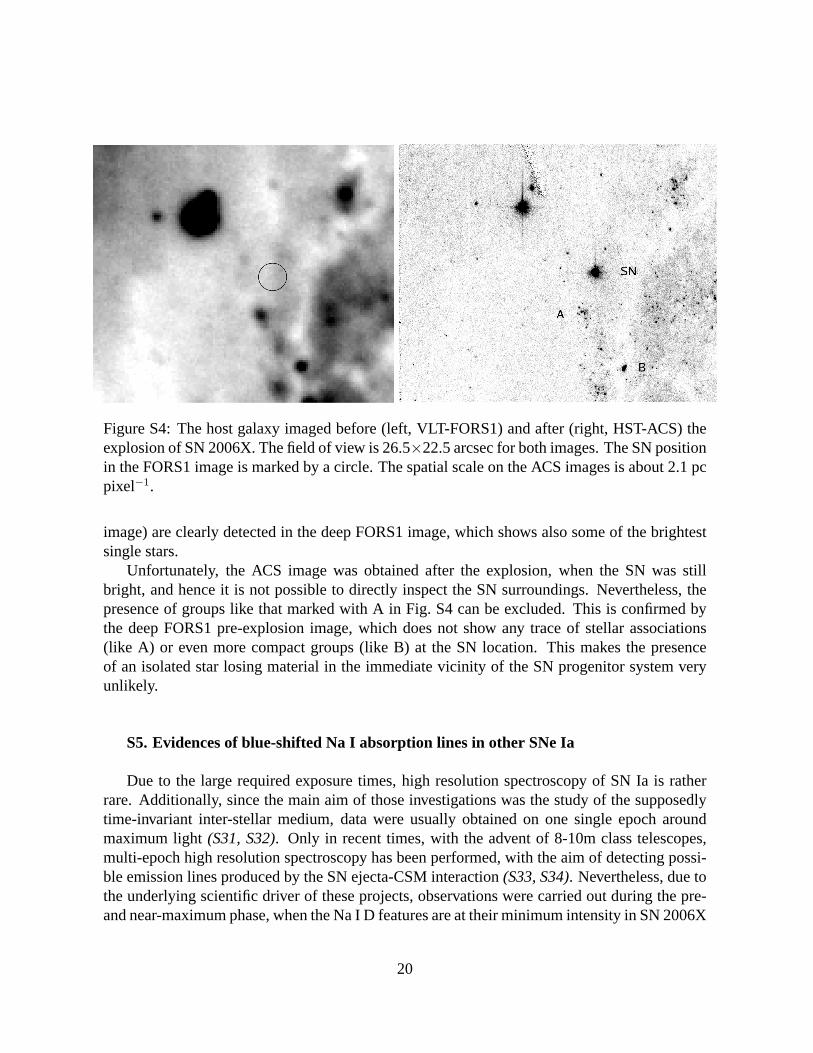
Figure S4: The host galaxy imaged before (left, VLT-FORS1) and after (right, HST-ACS) theexplosion of SN 2006X. The field of view is 26.5×22.5 arcsec for both images. The SN positionin the FORS1 image is marked by a circle. The spatial scale on the ACS images is about 2.1 pcpixel−1.
image) are clearly detected in the deep FORS1 image, which shows also some of the brightestsingle stars.
Unfortunately, the ACS image was obtained after the explosion, when the SN was stillbright, and hence it is not possible to directly inspect the SN surroundings. Nevertheless, thepresence of groups like that marked with A in Fig. S4 can be excluded. This is confirmed bythe deep FORS1 pre-explosion image, which does not show any trace of stellar associations(like A) or even more compact groups (like B) at the SN location. This makes the presenceof an isolated star losing material in the immediate vicinity of the SN progenitor system veryunlikely.
S5. Evidences of blue-shifted Na I absorption lines in other SNe Ia
Due to the large required exposure times, high resolution spectroscopy of SN Ia is ratherrare. Additionally, since the main aim of those investigations was the study of the supposedlytime-invariant inter-stellar medium, data were usually obtained on one single epoch aroundmaximum light(S31, S32). Only in recent times, with the advent of 8-10m class telescopes,multi-epoch high resolution spectroscopy has been performed, with the aim of detecting possi-ble emission lines produced by the SN ejecta-CSM interaction(S33, S34). Nevertheless, due tothe underlying scientific driver of these projects, observations were carried out during the pre-and near-maximum phase, when the Na I D features are at their minimum intensity in SN 2006X
20

(Fig. S1). For example, the spectra of SN 2001el, observed some days before maximum light,do not show any clear signs of Na I D blue components. Interestingly, they do show at least twoblue components in the Ca II H profile at∼ −18 and−34 km s−1 with respect to the deep Na ID absorption(S33).
In the course of our long term nearby SN monitoring, we had the chance to obtain highresolution spectroscopy of two SN Ia, namely SN 1991T(S35)and SN 1998es(S36). Bothspectra are unpublished. SN 1991T was observed on Jun 08, 1991 (day +40) with the ESO1.4m Coude Auxiliary Telescope (CAT) equipped with the Coude Echelle Spectrograph(S37),while the spectrum of SN 1998es was obtained on Nov 24, 1998 (day−1) with the ESO 1.5mtelescope equipped with the Fiber-fed Extended Range Optical Spectrograph(S38). The Na I Dline profiles of these two objects are remarkably similar to that of SN 2006X (Fig. S5). Besidesa strong absorption, which is most likely generated within the disk of the host galaxy, some bluecomponents are clearly visible.
To the best of our knowledge, the only other SN for which a data set somewhat similarto that of SN 2006X has been obtained is the core-collapse, Type IIn SN 1998S(S39). Highresolution spectroscopy of this object has revealed a number of Na I D components within thehost galaxy, the bluest of which (vh ∼ −100 km s−1) deepened significantly during the 19days spanned by the two epochs available, implying a Na I column density increase of about1 dex. This fact, together with the detection of time-evolving narrow H and He P-Cyg profilesat the same Na I velocity, was interpreted as a signature of the outflows from the super-giantprogenitor of SN 1998S, arising in a dense shell, expanding at about 50 km s−1 (S39, S40).
S6. The CSM structure around SN 2006X: swept-up nova shells?
A possible interpretation of the distinct features in the CSM is that they arise in the remnantshells of successive novae(S41). The recurrent ejection of a few 10−7 M� of H at velocities of∼4000 km s−1 can create dense shells in the slow moving material released by the companion,evacuating significant volumes around the progenitor system(S42). This explanation requiresthat the high-velocity nova ejecta have, by sweeping up the stellar wind of the donor star, beenslowed down to speeds several times lower than the asymptotic shell velocities seen, for in-stance, in RS Ophiuchi, i.e.∼ 300 km s−1 (S43, S44). For SN 2006X, if we assume that theobserved shells have all been swept up in the energy-conserving phase(S45), and if we take anupper limit of the wind-mass loss rate from the companion,Mwind, as 10−7 M� yr−1 from theradio observations, we obtain an upper limit on the mass ejected in each nova outburst:
Mnova < 2× 10⁻⁸ M�Mwind
10−7M� yr−1
(Vshell
75 km s−1
)2 ( Vnova
1000 km s−1
)−2 ∆tnova
10 yr, (S3)
whereM andV refer to mass and velocity, and the subscriptsnova andshell refer to the massejected in each nova outburst and the shell formed as the nova ejecta sweep up the wind, whilst∆tnova represents the nova recurrence time.
21

Figure S5: Comparison between the Sodium D2 line profiles for three SN Ia: 1991T (upper),1998es (middle) and 2006X (lower). For the sake of clarity, spectra have been arbitrarily shiftedin the horizontal direction in order to place the center of the strongest D2 component at zerovelocity.
22
Although this value is around an order of magnitude smaller than might be expected from re-cent nova calculations, we note that the ejecta mass is a steeply decreasing quantity as the whitedwarf approaches explosion(S41, S46). In addition, the estimate above assumes that the windfrom the companion is spherically symmetric. If the wind is concentrated towards the orbitalplane, and if we are observing the shell structure close to the orbital plane, the shells in our line-of-sight would be slowed down more than in the spherically symmetric case. The discrepancywould be further reduced if the nova shell is mainly slowed down in the momentum-conservingphase rather than the energy-conserving phase, which is made more likely in this asymmet-ric case where the mass is concentrated in the orbital plane. Exactly such an axisymmetricgeometry and rapid deceleration is suggested by recent observations of RS Oph(S47).
Indeed, the fact that there is neutral Na around the progenitor of SN 2006X requires cool ma-terial and suggests that the shell must have cooled down sufficiently and be in the momentum-conserving phase.
If the recurrent nova interpretation requires an aspherical geometry, then this implies thatthe apparent shell structure with the velocities we have observed would only be seen in SNeIa which are observed close to the orbital plane of the system. This may be a useful futurediscriminant for this model. We also suggest that this interpretation is made more satisfyingif the loss of the strong Na line at∼40 km s−1 (components C and D in Fig. 2) is due to theinteraction of the supernova ejecta with that nova shell, as that places a useful scale on thedistance of the shell from the supernova. As a typical SN velocity of∼104 km s−1 is some 250times faster than the shell, the interaction after 1 month corresponds to a recurrence time of∼25yr, which is a plausible value. The actual recurrence time could well be less, as that shell is notguaranteed to be the innermost shell, merely the innermost visible one.
As a check on the consistency of this model, we can combine our inferred electron densityof ne ∼ 105 cm−3 with the dimensions of the nova shell to produce an estimate of the mass ofthe shell:(
Mshell
M�
)∼ 1.0× 10⁻⁷
(0.1
X
) (∆r
1013 cm
) (ne
105 cm−3
) (rshell
1015 cm
)2
, (S4)
where, somewhat arbitrarily, we have taken a shell thickness (∆r) that is∼ 1% of the radiusof the shell. Our greatest uncertainty is probably contained within the ionisation fractionX,which is needed to obtain the mass per free electron, though the quadratic dependence onrshell
alone leads to considerable uncertainty in the estimate ofMshell. Note that we have assumed theshell is spherical; a wind concentrated in the equatorial plane may be∼ 10 times less massive.
If we assume that the mass in the shell is dominated by mass swept up from the wind (i.e.Mwind � Mnova) and then take the shell radius to be the product of the recurrence time and shellvelocity we can write:(
Mwind
M�/yr
)∼ 2.5× 10⁻⁸
(0.1
X
) (∆r
1013 cm
) (ne
105 cm−3
) (vshell
50 km/s
)2 (∆tnova
10 yr
), (S5)
The wind loss rate derived in this way is consistent with our expectation in Equation S3.
23
References
S1. H. Dekkeret al., Proc. SPIE4008, 534 (2000).
S2. S. Vogtet al., Proc. SPIE2198, 362 (1994).
S3. P. Ballesteret al., The Messenger101, 31 (2000).
S4. R.J. Rand,Astrophys. J.109, 2444 (1995).
S5. VPFIT has been developed by R.F. Carswell and can be freely downloadedat http://www.ast.cam.ac.uk/∼rfc/vpfit.html
S6. K. Krisciunas, private communication.
S7. L. Ferrareseet al., Astrophys. J.464, 568 (1996).
S8. The Very Large Array telescope of the National Radio Astronomy Observatory is operated by AssociatedUniversities, Inc. under a cooperative agreement with the National Science Foundation.
S9. P. Chandra, R. Chevalier, F. Patat,ATel954(2006).
S10. N. Panagiaet al., Astrophys. J.469, 396 (2006).
S11. R. Quimby, P. Brown, C. Gerardy, CBET421(2006).
S12. S. Benettiet al., Mon. Not. R. Astron. Soc.348, 261 (2004).
S13. B. Canzian, R.J. Allen,Astrophys. J.479, 723 (1997).
S14. L.M. Hobbs,Astrophys. J.191, 381 (1974).
S15. J.T. Lauroesch, A.P.S. Crotts, J. Meiring, P. Kulkarni, D.E. Welty, D.G. York, CBET421(2006).
S16. R.M. Crutcher,Astrophys. J.288, 604 (1985).
S17. D.M. Meyer, M. Jura,Astrophys. J.297, 119 (1985).
S18. L. Wang, D. Baade, F. Patat, J.C. Wheeler,CBET396(2006).
S19. D. Lazzati, R. Perna, J. Flasher, V.V. Dwarkadas, F. Fiore,Mon. Not. R. Astron. Soc.372, 1791 (2006).
S20. H. Haoet al., Astrophys. J.659, L99 (2007).
S21. N. Panagia,Supernova 1987A: 20 Years after: Supernovae and Gamma-Ray Bursters, S. Immler, R. Mc-Cray and K.W. Weiler, Eds. (AIP Conf. Proc., 2007), in press; preprint available online (http://arxiv.org/abs/0704.1666).
S22. D.A. Verner, G.J. Ferland, K.T. Korista,Astrophys. J.465, 487 (1996).
S23. W.A. Pauldrachet al., Astron. Astrophys.312, 525 (1996).
S24. R.P. Kirshneret al., Astrophys. J.415, 589 (1993).
S25. P.M. Vreeswijket al., Astron. Astrophys., in press; preprint available online (http://arxiv.org/pdf/astro-ph/0611690).
S26. I.A. Crawford,Mon. Not. R. Astron. Soc.328, 1115 (2001).
S27. I. Appenzelleret al., The Messenger94, 1 (1998).
S28. Data were obtained with ESO Telescopes at the Paranal Observatory under programme ID 063.H-0650(A),P.I. B. Leibundgut.
24

S29. C. Pavlovskyet al., Advanced Camera for Surveys Instrument Handbook for Cycle 16, Version 7.1 (STScI,Baltimore, 2006).
S30. Images were retrieved from the data archive at the Space Telescope Institute. STScI is operated by theassociation of Universities for Research in Astronomy, Inc. under the NASA contract NAS 5-26555. Datawere originally obtained by A. Crotts et al.
S31. S. D’odoricoet al., Astron. Astrophys.215, 21 (1989).
S32. R.J. Cumminget al., Mon. Not. R. Astron. Soc.283, 1355 (1996).
S33. J. Sollermanet al., Astron. Astrophys.429, 559 (2005).
S34. S. Mattilaet al., Astron. Astrophys.443, 649 (2005).
S35. M.M. Phillipset al., Astron. J.103, 1632 (1992).
S36. S. Jha, P. Garnavich, P. Challis, R.P. Kirshner,IAU Circ., No. 7054 (1998).
S37. D. Enard,Proc. SPIE331, 232 (1982).
S38. A. Kauferet al., The Messenger95, 8 (1999).
S39. D.V. Bowen, K.C. Roth, D.M. Meyer, J.C. Blades,Astrophys. J.536, 225 (2000).
S40. A. Fassiaet al., Mon. Not. R. Astron. Soc.325, 907 (2001).
S41. I. Hachisu, M. Kato,Astrophys. J.558, 323 (2001).
S42. W.M. Wood-Vasey, J.L. Sokoloski,Astrophys. J.645, L53 (2006).
S43. S.R. Pottash,Bull. Astr. Inst. Netherlands19, 227 (1967).
S44. R.M. Hjellminget al., Astrophys. J.305, L71 (1986).
S45. L. Sedov,Similarity and Dimensional Methods In Mechanics(Academic Press, New York, 1959).
S46. O. Yaron, D. Prialnik, M.M. Shara, A. Kovetz,Astrophys. J.623, 398 (2005).
S47. T.J. O’Brienet al., Nature 442,279 (2006).
25