detection of milk adulteration
TRANSCRIPT
Detection of milk adulteration
Marlene Ransborg Pedersen Per Waaben Hansen Steve Holroyd
Arla Foods GCO R&D Foss Analytical A/S Fonterra Research Centre
June 2012
2 Outline
The economic adulteration of milk/risks
Targeted and untargeted FTIR models for detecting
adulteration
Describe project
Results and conclusions
3
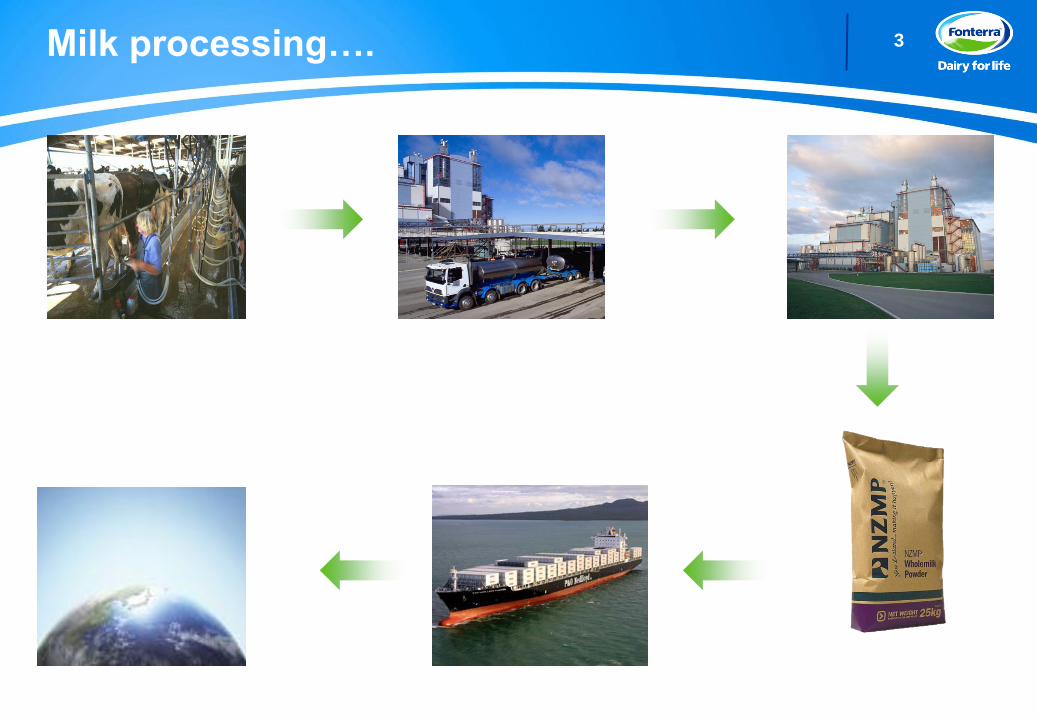
Milk processing….
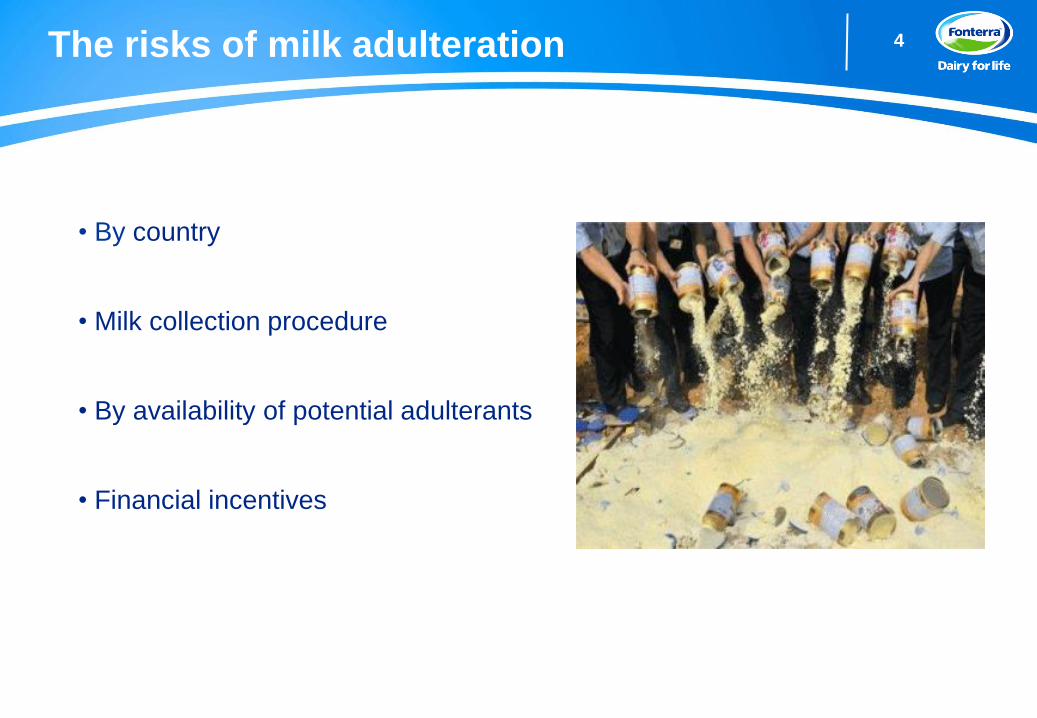
4 The risks of milk adulteration
• By country
• Milk collection procedure
• By availability of potential adulterants
• Financial incentives
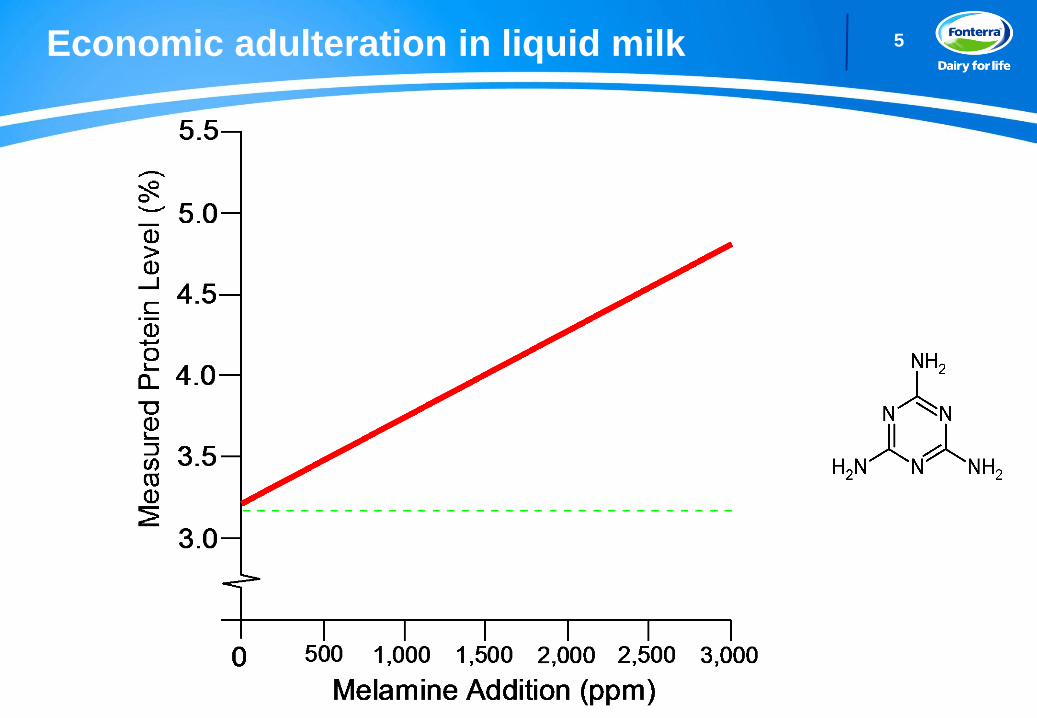
5 Economic adulteration in liquid milk
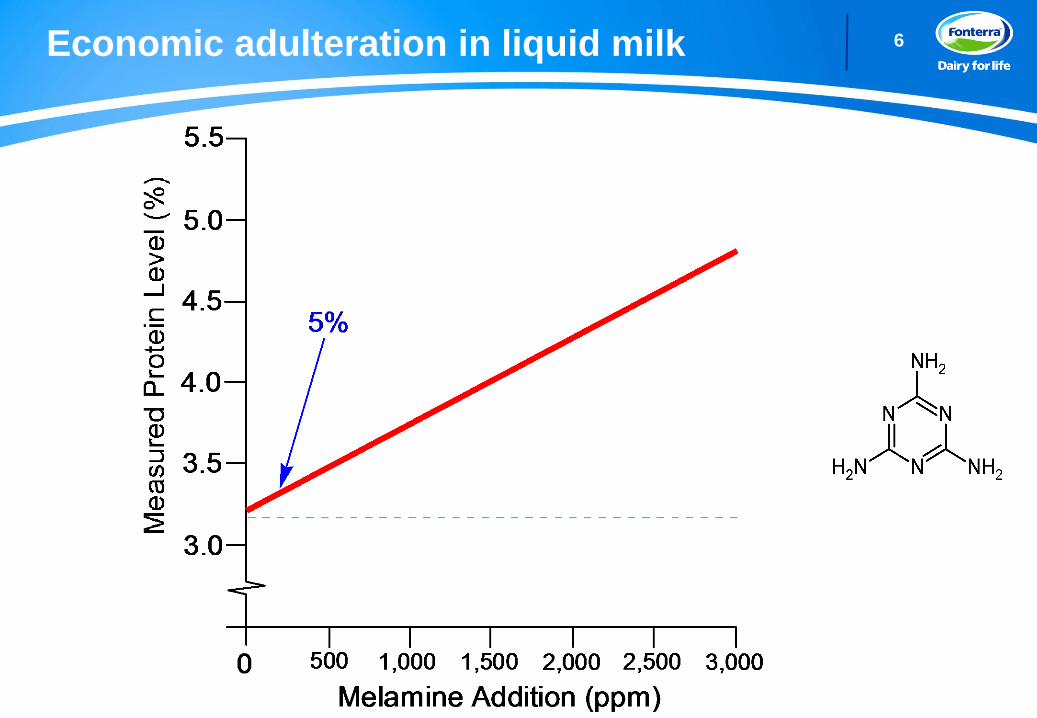
6 Economic adulteration in liquid milk
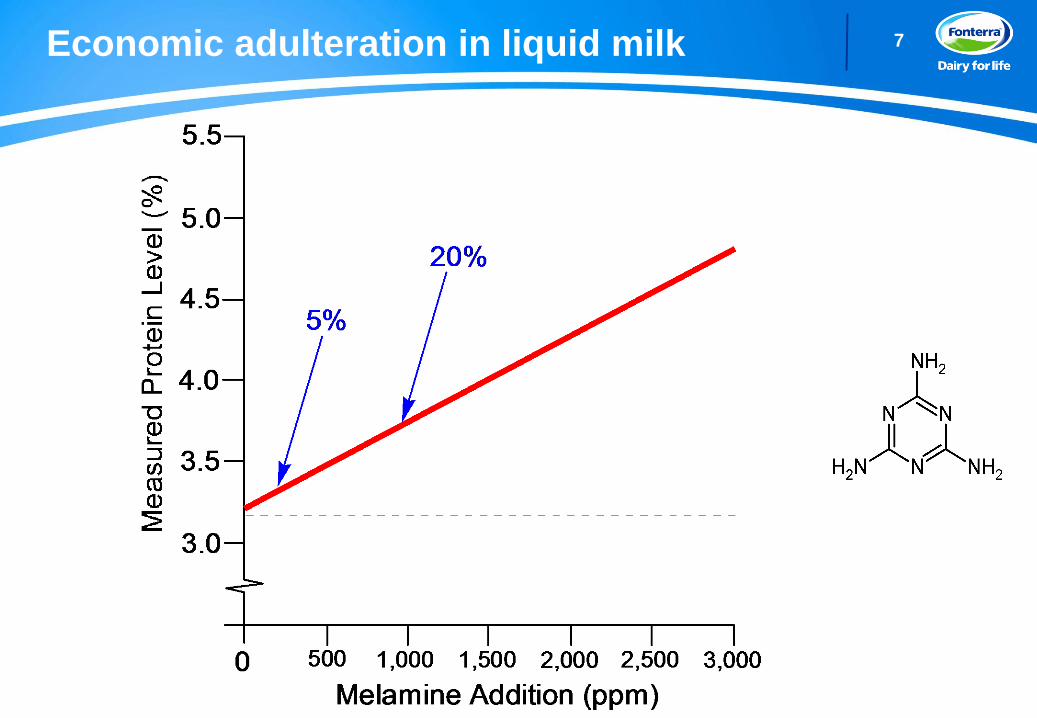
7 Economic adulteration in liquid milk
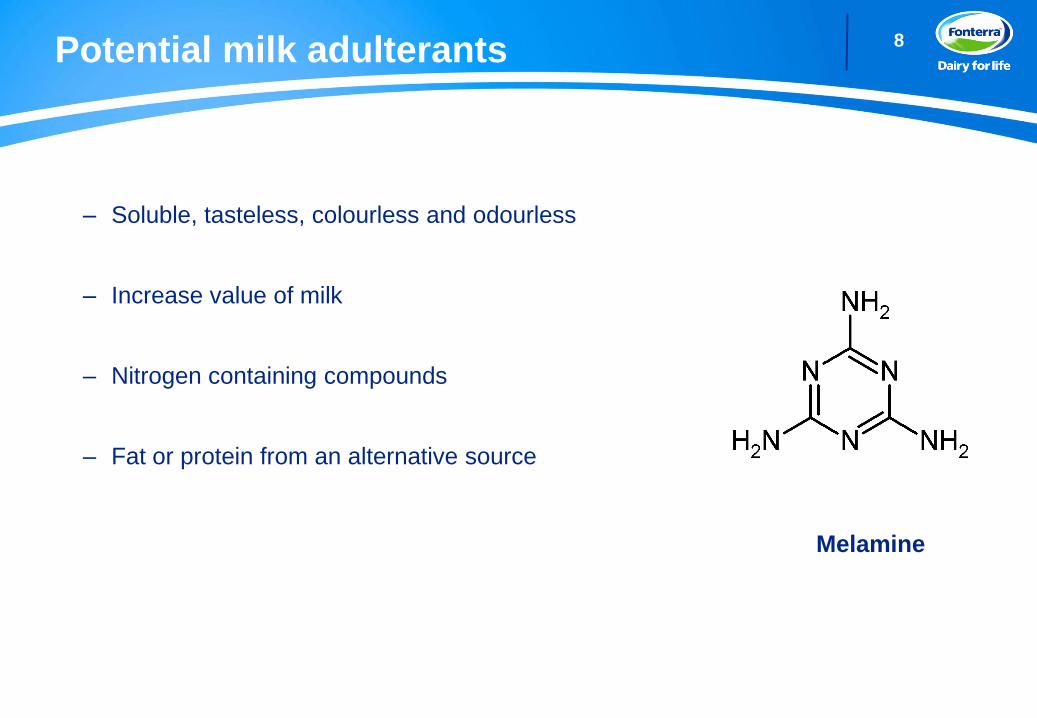
8 Potential milk adulterants
Chemicals with high nitrogen content
– Soluble, tasteless, colourless and odourless
– Increase value of milk
Cheap substitutes
– Nitrogen containing compounds
– Fat or protein from an alternative source
Adulteration may often be with a complex chemical
“cocktail”
Any adulteration poses a significant food safety risk
Melamine
9 Important factors in detecting adulteration
• Optimum sampling protocol location
– Cost, ability to sample, impact on customers and
business
• Best technique
– Speed, cost, accuracy, sensitivity, reliability
• Response to detection
– Business decision based on risk
“Infrared spectroscopy has strong potential”
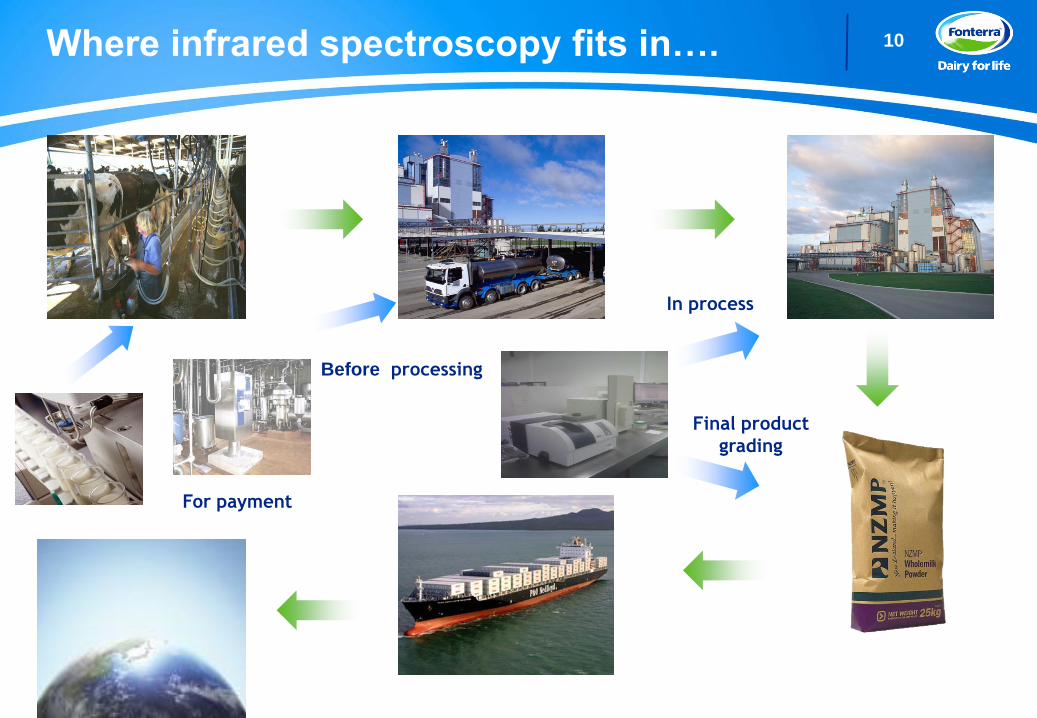
10
Where infrared spectroscopy fits in….
Final product
grading
In process
Before processing
For payment
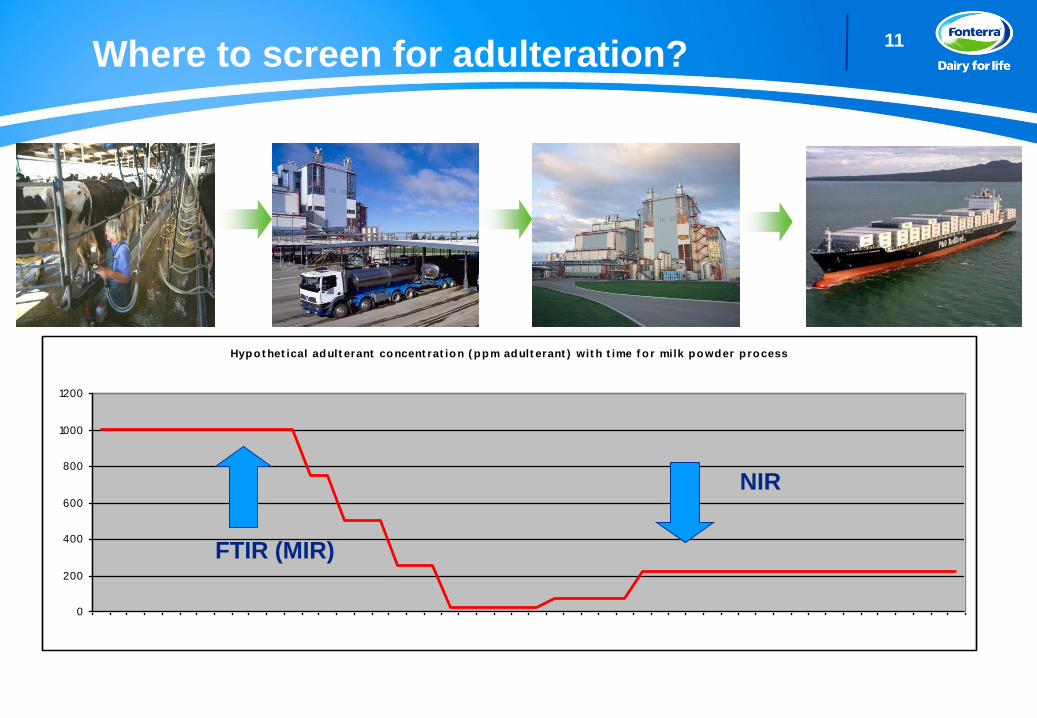
11 Where to screen for adulteration?
Hypot het ical adult erant concent rat ion ( ppm adult erant ) wit h t ime f o r milk powder p rocess
0
200
400
600
800
1000
1200
1 3 5 7 9 11 13 15 17 19 21 2 25 27 2 31 3 35 37 3 41 4 45 47 4
FTIR (MIR)
NIR
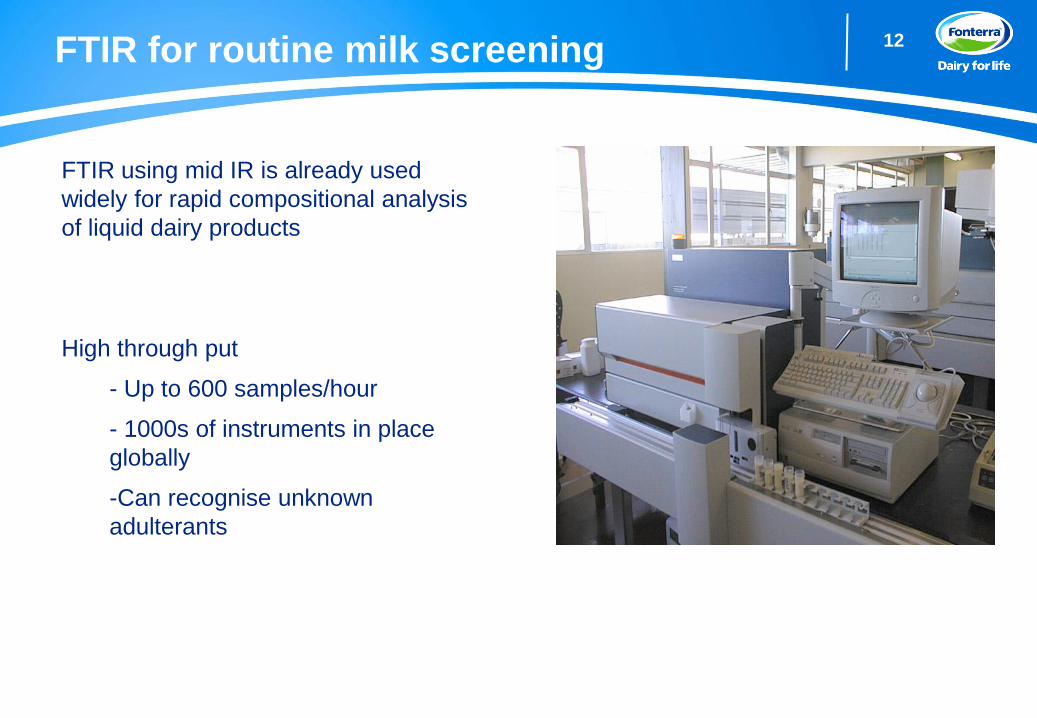
12
FTIR using mid IR is already used
widely for rapid compositional analysis
of liquid dairy products
High through put
- Up to 600 samples/hour
- 1000s of instruments in place
globally
-Can recognise unknown
adulterants
FTIR for routine milk screening
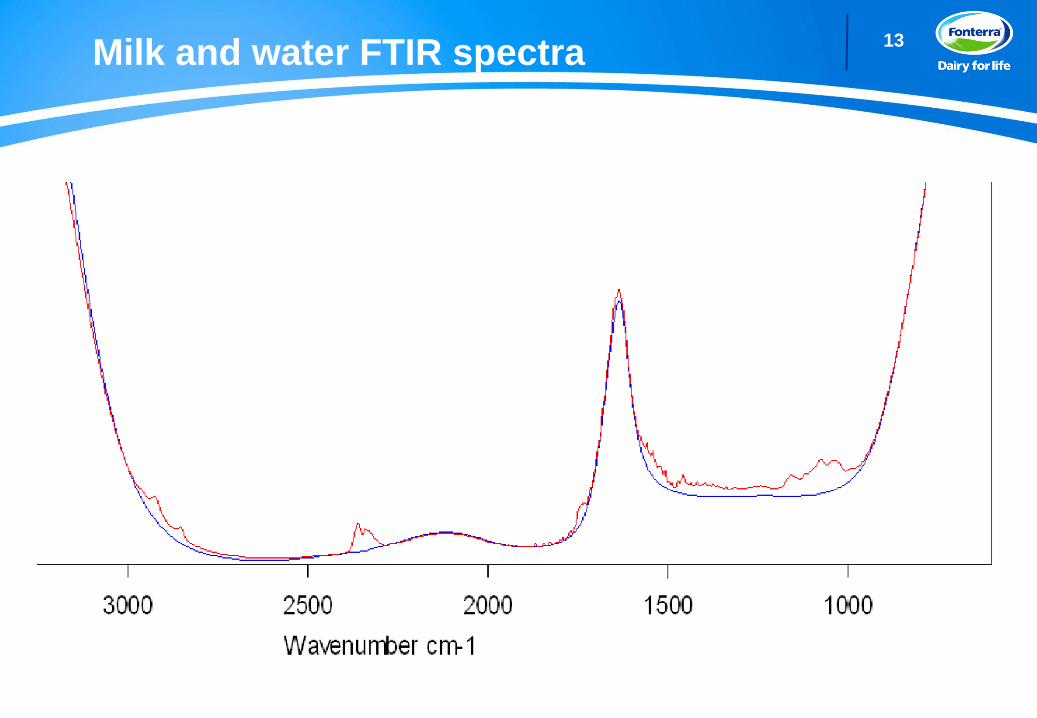
13 Milk and water FTIR spectra
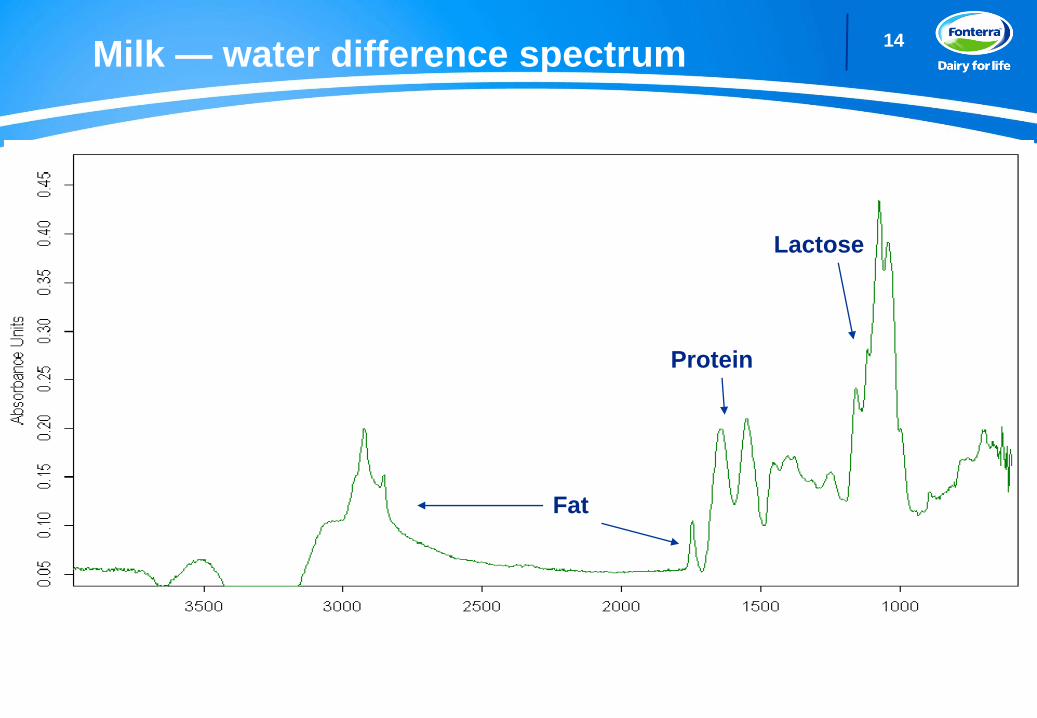
14 Milk — water difference spectrum
Fat
Protein
Lactose
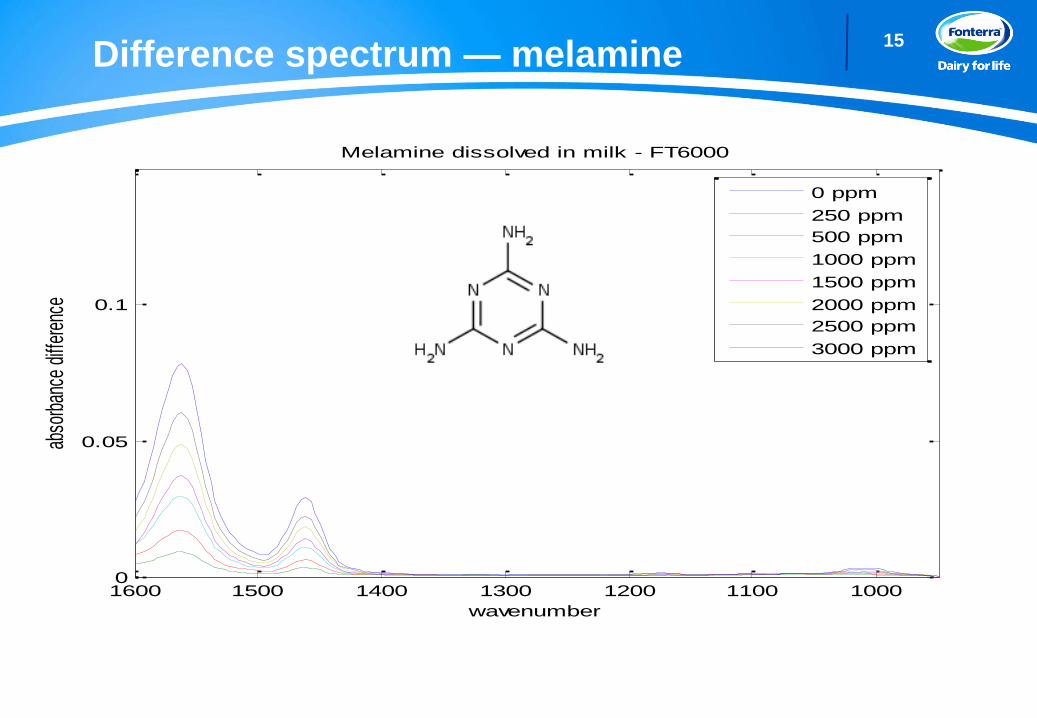
15 Difference spectrum — melamine
10001100120013001400150016000
0.05
0.1
wavenumber
abso
rban
ce d
iffer
ence
Melamine dissolved in milk - FT6000
0 ppm
250 ppm
500 ppm
1000 ppm
1500 ppm
2000 ppm
2500 ppm
3000 ppm
16 Project scope
Create an FTIR-based tool that can:
– Be capable of detecting economic
adulteration of milk supply with a
range of known and currently
unknown adulterants
– Non-dairy fat and protein not in
scope
– Understand performance in
different areas of the world
– Be part of a wider system
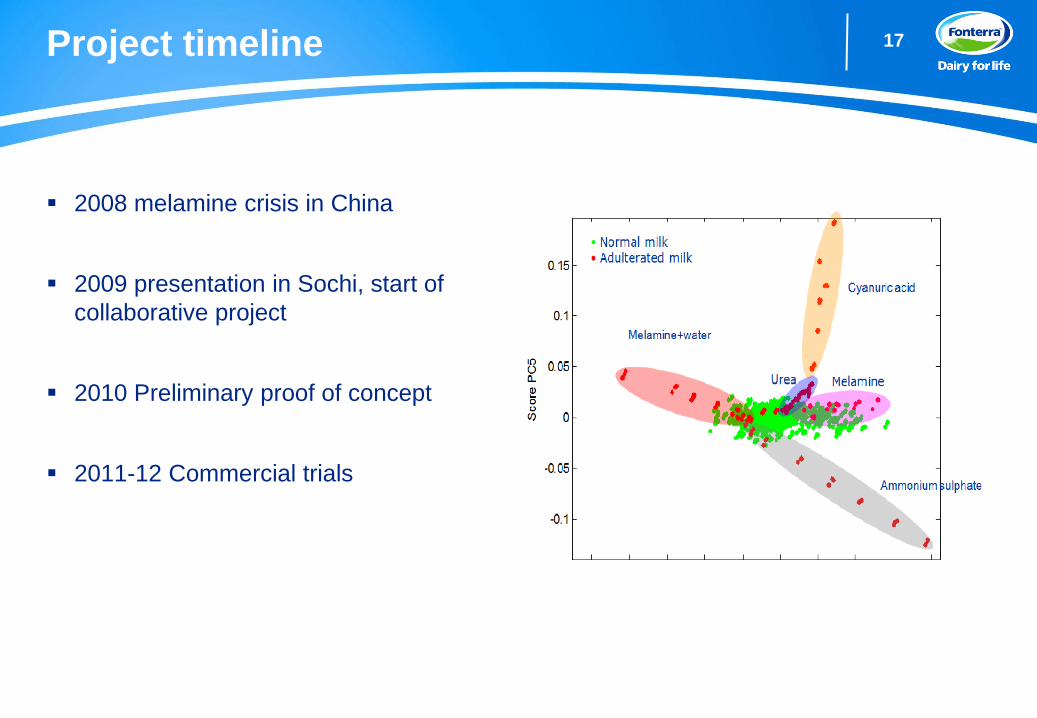
17 Project timeline
2008 melamine crisis in China
2009 presentation in Sochi, start of
collaborative project
2010 Preliminary proof of concept
2011-12 Commercial trials
18 Targeted and untargeted analyses
Traditional FTIR applications are quantitative – they “target” specific compounds such
as fat ands protein
Based on spiking experiments we can construct such calibrations for a range of
potential adulterants
An additional approach is to create qualitative calibrations to create “untargeted
models” capable of detecting an adulterant to a certain concentration
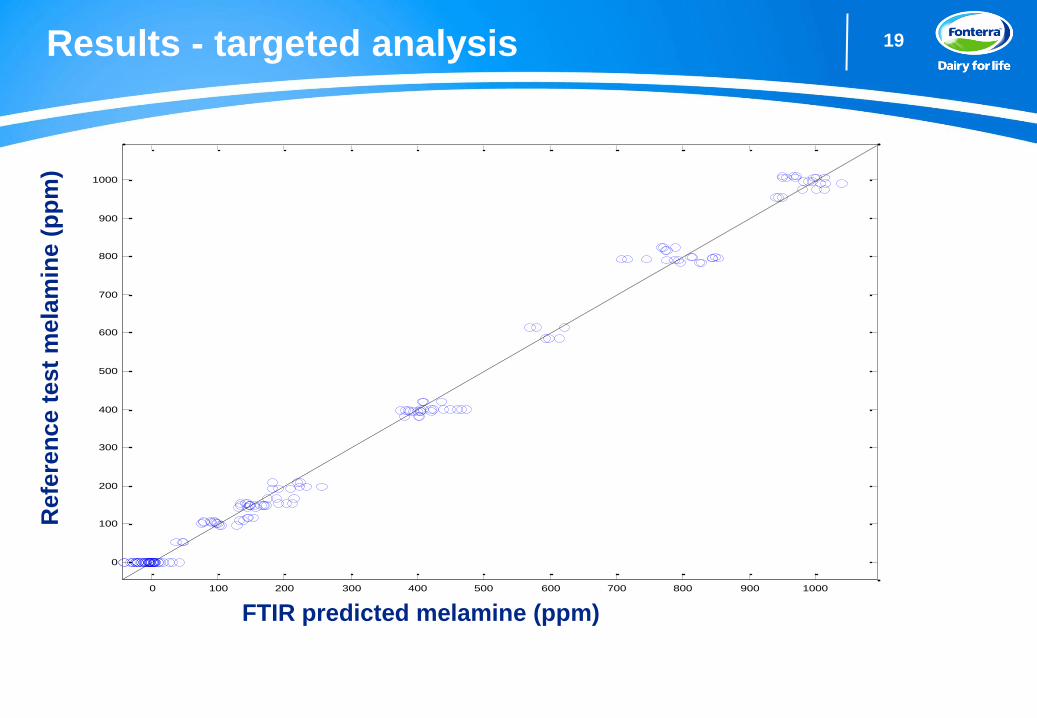
19 Results - targeted analysis
C:\valhalla\MSCFT2\PCA\DK\New Folder\pre0
0 100 200 300 400 500 600 700 800 900 1000
0
100
200
300
400
500
600
700
800
900
1000
RMSEP=28.111 SEP=28.158 SEPCorr=28.237 SDrep=12.757 Mean=338.09
Predicted (Melamine F/C=9/22)
Act
ual
57 samples in 3 replicates
%CV: RMSEP=8.31 SEP=8.33 SEPCorr=8.35 SDrep=3.77
Slope: 1.0013
Intcpt: -1.8636
r: 0.9969
Bias : -1.4116
FTIR predicted melamine (ppm)
Refe
ren
ce t
est
mela
min
e (
pp
m)
20 Untargeted analysis
Only information from ”normal” unadulterated milk is
needed to create a model
An “adulteration score” is calculated for each
sample that is higher as the sample becomes more
adulterated
With the current generation of FTIR instruments, a
melamine LoD (Limit of Detection) that is sufficient
to detect potential adulterants at economic levels is
obtained
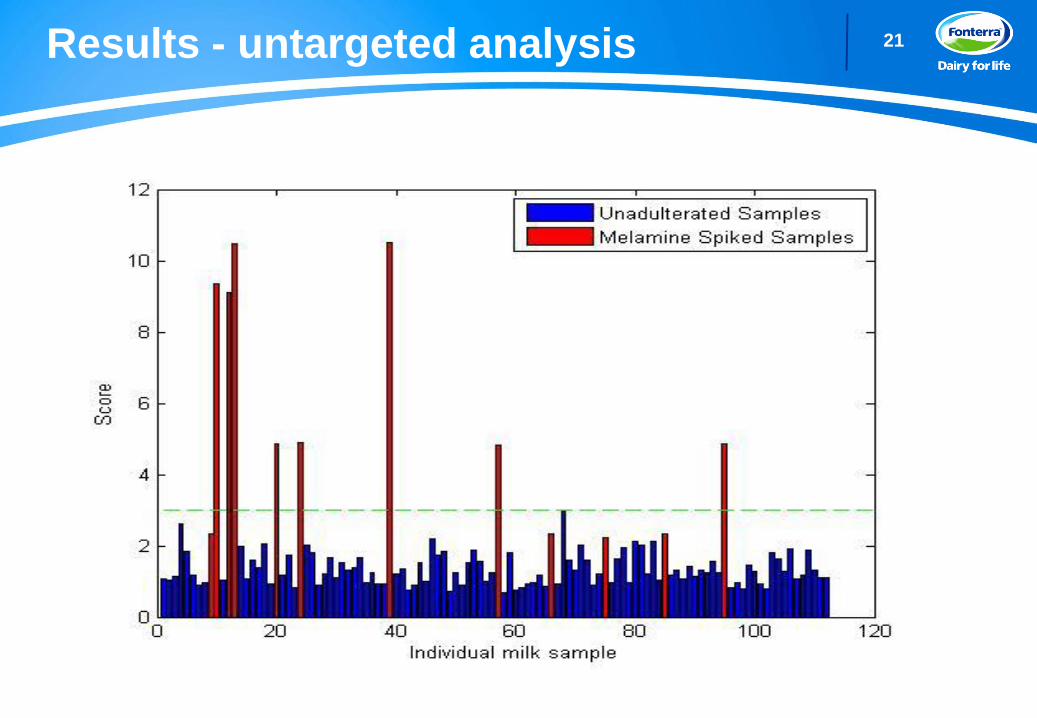
21 Results - untargeted analysis
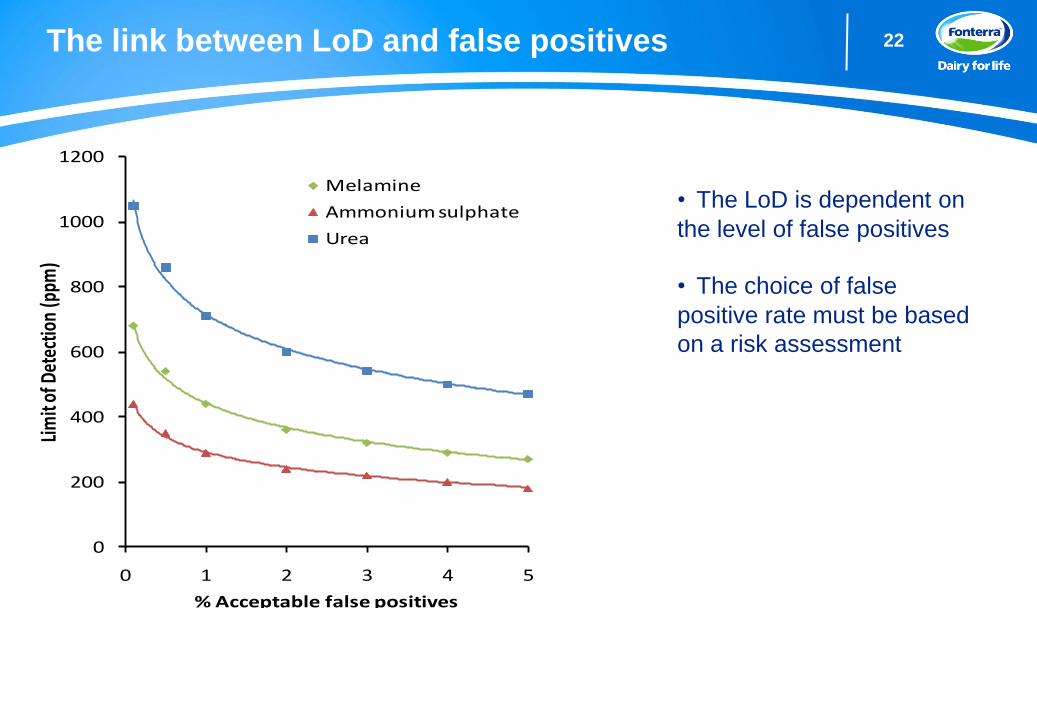
22 The link between LoD and false positives
0
200
400
600
800
1000
1200
0 1 2 3 4 5
Lim
it of
Det
ectio
n (p
pm)
% Acceptable false positives
Melamine
Ammonium sulphate
Urea
• The LoD is dependent on
the level of false positives
• The choice of false
positive rate must be based
on a risk assessment
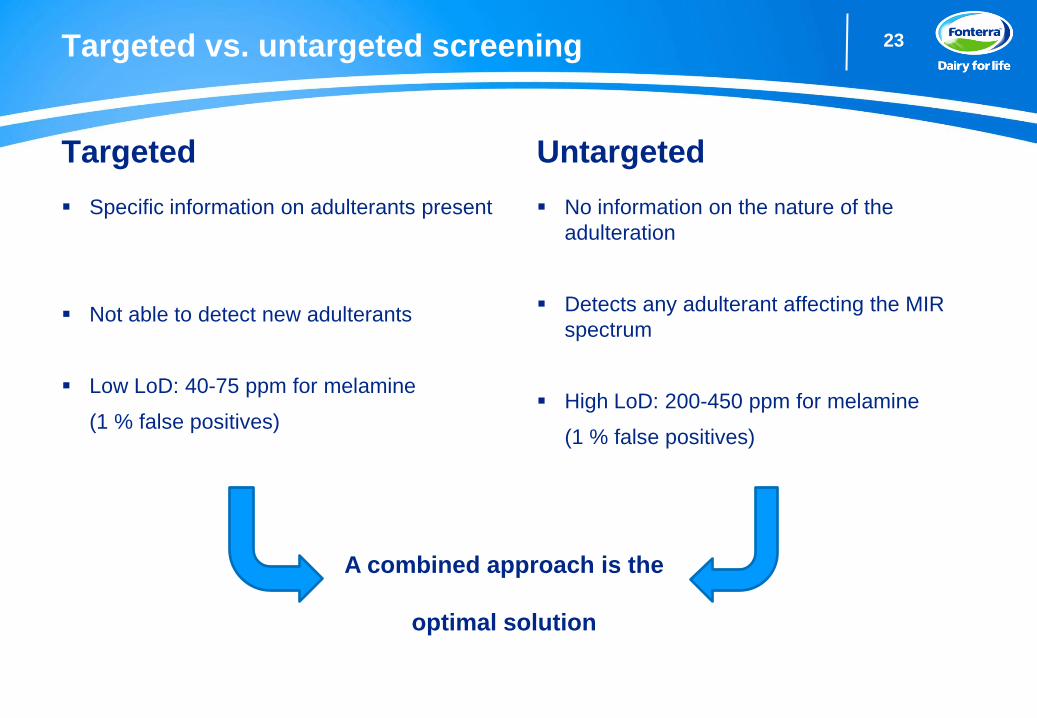
23 Targeted vs. untargeted screening
Targeted
Specific information on adulterants present
Not able to detect new adulterants
Low LoD: 40-75 ppm for melamine
(1 % false positives)
Untargeted
No information on the nature of the
adulteration
Detects any adulterant affecting the MIR
spectrum
High LoD: 200-450 ppm for melamine
(1 % false positives)
A combined approach is the
optimal solution
24
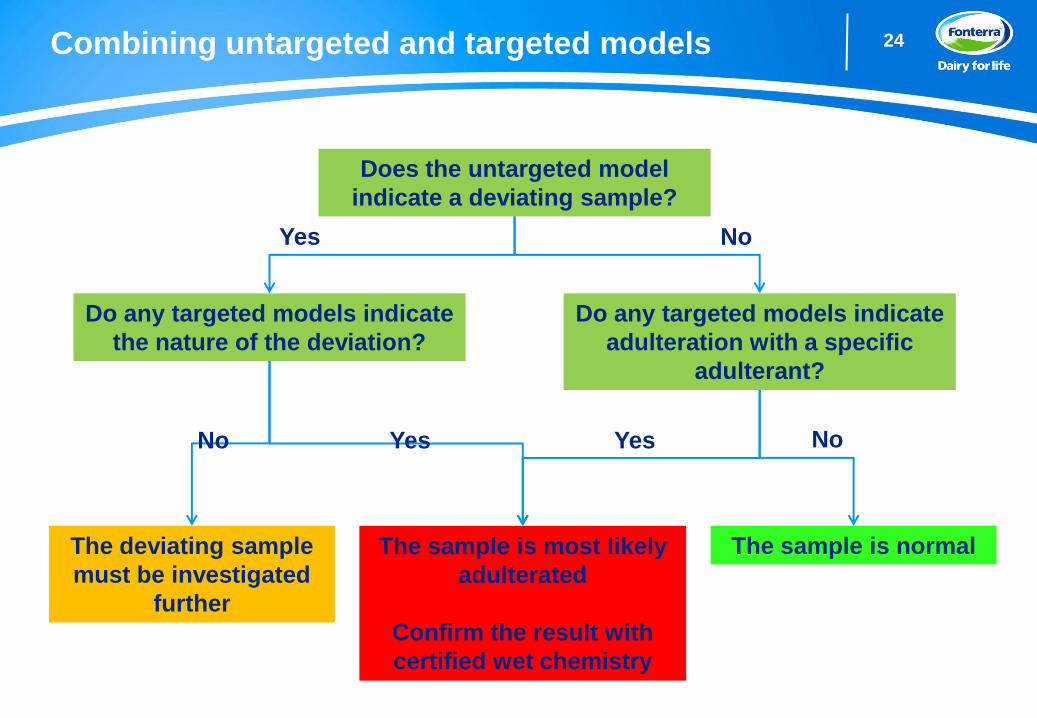
Combining untargeted and targeted models
Does the untargeted model
indicate a deviating sample?
Do any targeted models indicate
the nature of the deviation?
The sample is most likely
adulterated
Confirm the result with
certified wet chemistry
Do any targeted models indicate
adulteration with a specific
adulterant?
No Yes
Yes Yes
The deviating sample
must be investigated
further
The sample is normal
No No
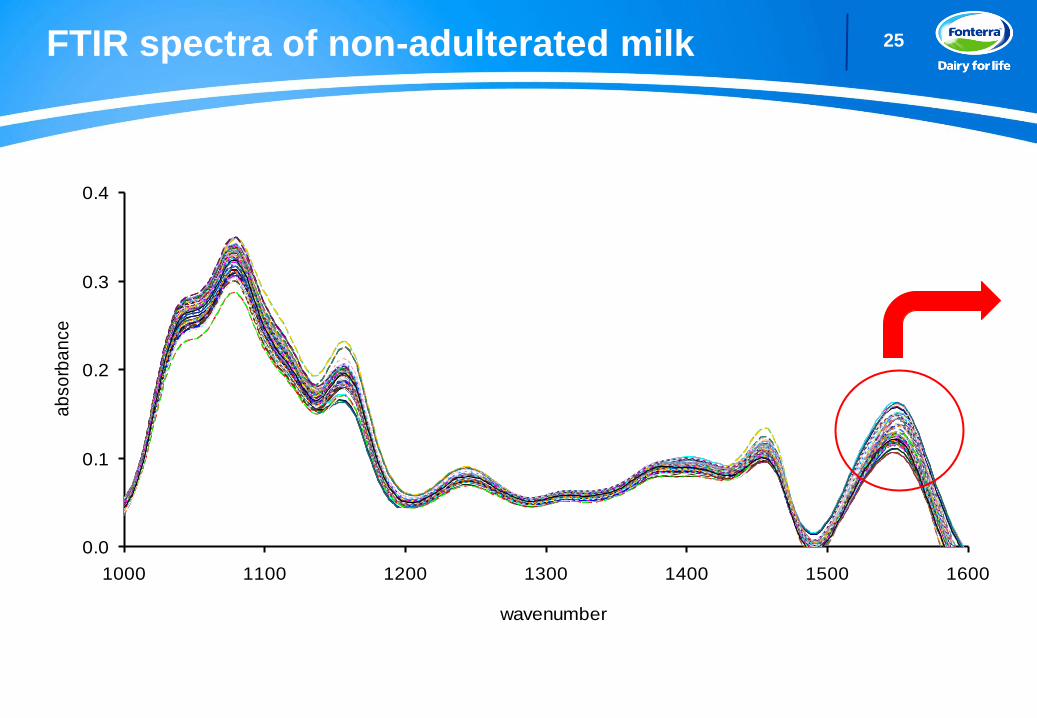
25 FTIR spectra of non-adulterated milk
0.0
0.1
0.2
0.3
0.4
1000 1100 1200 1300 1400 1500 1600
wavenumber
ab
so
rba
nce
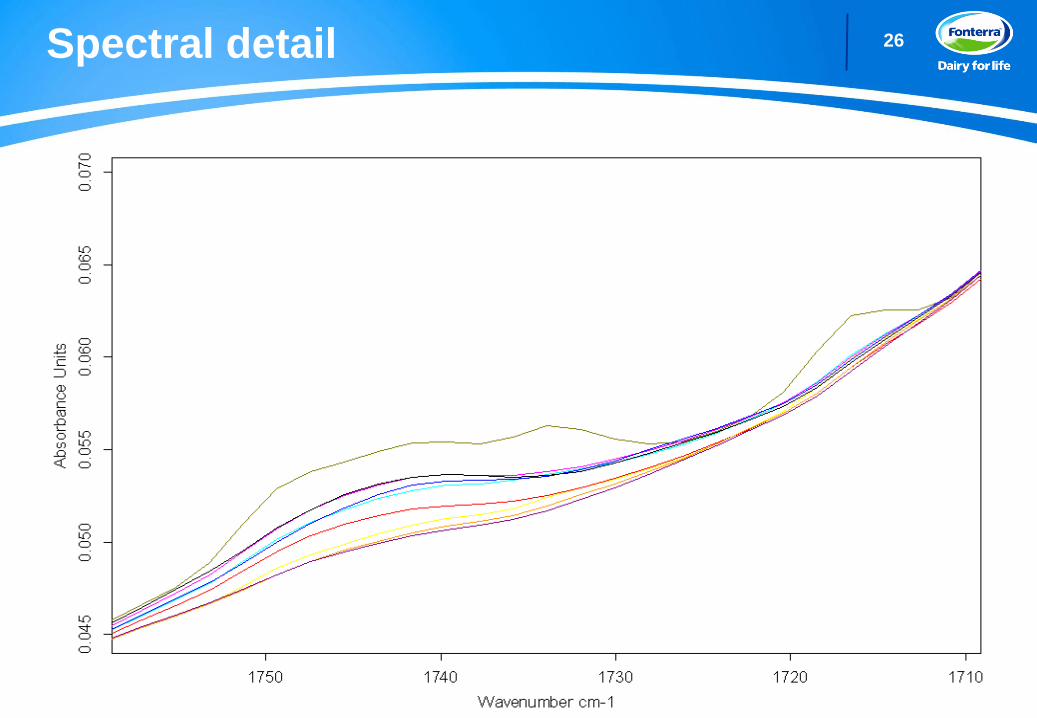
26 Spectral detail
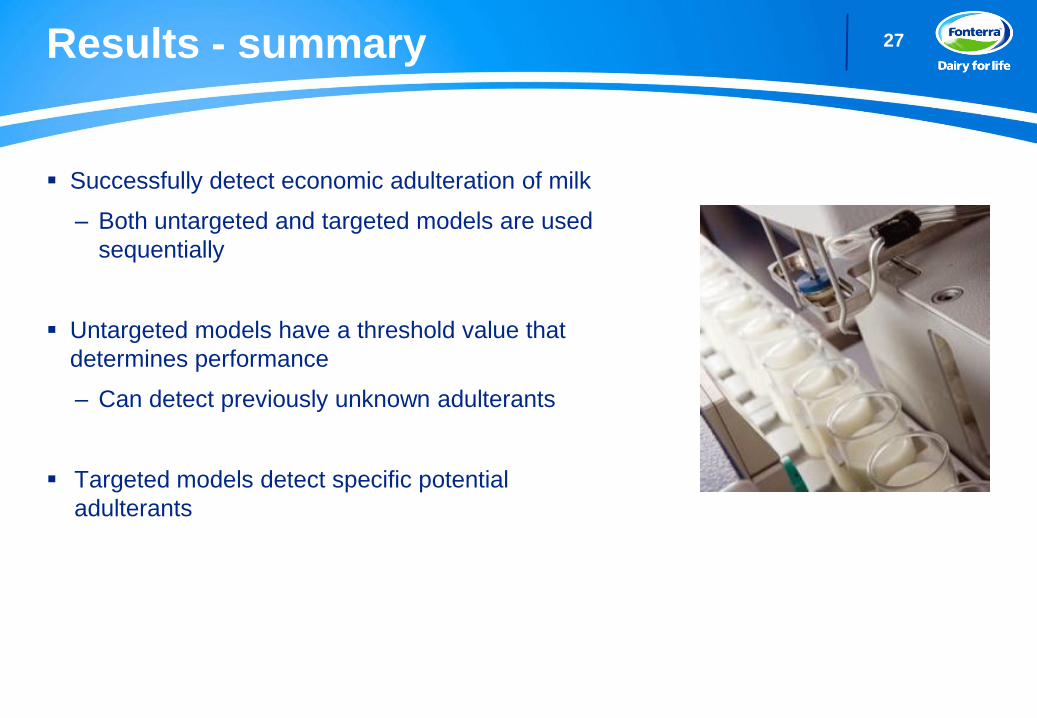
27 Results - summary
Successfully detect economic adulteration of milk
– Both untargeted and targeted models are used
sequentially
Untargeted models have a threshold value that
determines performance
– Can detect previously unknown adulterants
Targeted models detect specific potential
adulterants
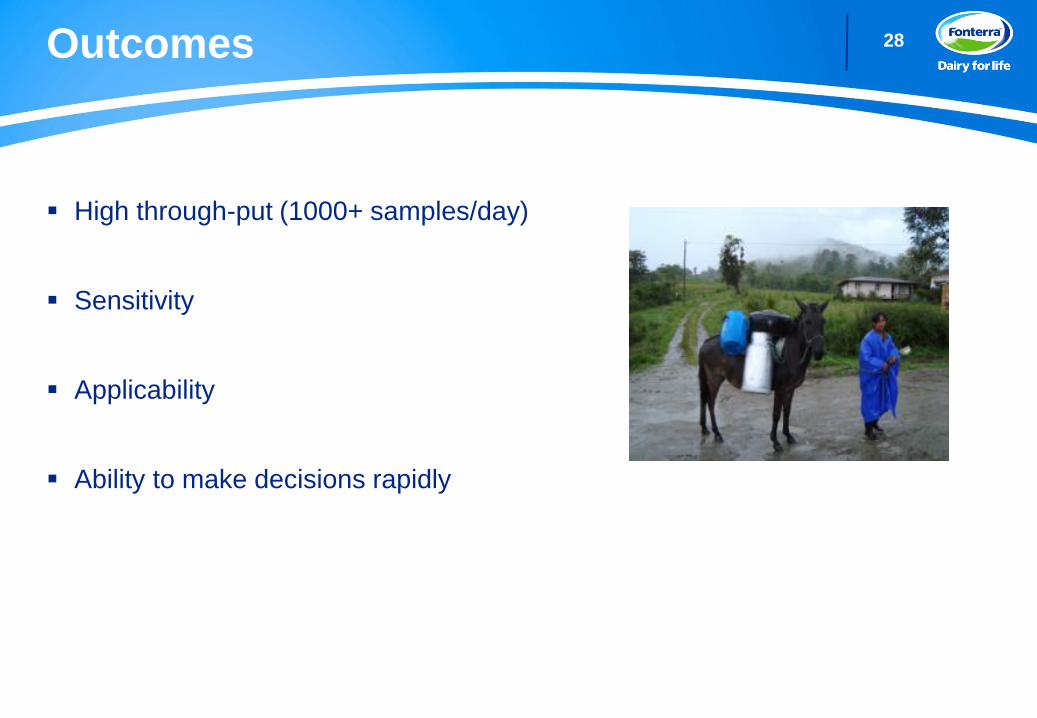
28 Outcomes
High through-put (1000+ samples/day)
Sensitivity
Applicability
Ability to make decisions rapidly
29 Current status
Both targeted and untargeted models have been created based on over 10,000
samples of farm milk samples from Scandinavia, New Zealand and China
Selective spiking experiments and other detection technologies (LC/MS/MS) have
been used to both develop and validate the FTIR models performance
The models are currently undergoing test trials in several locations globally
30
Month Year
Questions