detection of synchronous eeg events using channelsum
TRANSCRIPT

Detection of Synchronous EEG Events using ChannelSum/Difference Mode and JTFA
Detection of Synchronous EEG Events using ChannelSum/Difference Mode and JTFA
T. F. Collura May 16, 2005
The BrainScape is designed to provide a 3-dimensional time/frequency representation of EEG signals, using a combination of frequency analysis, spline interpolation, and color-doded representation of signal amplitude. In a single display, typically 1 minute of EEG is displayed, with frequency as the horizontal axis, amplitude as the vertical axis, and time as the “z” axis. When a signal appears within a defined frequency band and has a “waxing” phase, then it appears as a color change on the display, with a 3-dimensional representation of both its size and its time behavior. It is thus possible to see waxing and waning, and relationships between channels, in a visually clear format. When Sum/Difference channel mode is used, the two signals viewed are transformed into their sum and difference signals, and displayed in the usual manner. When this is done, signals that are synchronous in both channels will emerge in the sum signal, and will tend to be small or invisible in the difference signal. IN the BrainMaster, the signals can be viewed (and trained) in either the conventional 2-channel mode, or in the Sum/Difference channel mode. When playing back EEG data, it is possible to view it in either the conventional 2-channel format, or in the Sum/Difference format. This makes it possible to make playbacks in both modes, and view the comparison. The visual differences between the 2-channel BrainScapes and the Sum/Difference BrainScapes make it clearly evident when there is synchronous activity in any band. In the following examples. Synchronous activity is evident in all bands. In addition to the expected alpha and related component bands, we are able to see synchronous high beta and gamma activity when it appears. It can be shown that Sum and Difference signals are sensitive to both the amplitude and the phase of any signals that may be shared between the two sites. If signals are large and in phase, they will reinforce in the sum, and will be cancelled in the difference. The amplitude of the resulting sum and difference signals is thus an indicator of the degree of amplitude and phase similarity in the two channels. When the sum and difference signals are subjected to a frequency analysis, it is possible to separate the synchronous from the independent EEG activity in all frequency bands, using the BrainScape display. The following plots are derived from a playback of a BrainMaster MINI-Q session (eyes closed) with 1-minute samples from each pair of sites. They illustrate the use of Sum/Difference channel analysis and the BrainScape display in interpreting recordings from 6 pairs of sites, being: Fz/Cz, F3/F4, C3/C4, P3/P4, T3/T4, and O1/O2, with linked ear reference. In each pair, it is possible to discern which activity is dominant at each site, and which activity is common between the sites. I wish to acknowledge valuable discussions with Siegfried and Sue Othmer, and with Bill Mrklas and Terri Mrklas Collura, which have helped to stimulate and clarify the development and analysis of these methods. BrainScape is a trademark of BrainMaster Technologies, Inc.
May 16, 2005 page 1 of 7 © T. F. Collura

Detection of Synchronous EEG Events using ChannelSum/Difference Mode and JTFA
Fz and Cz in Standard 2-Channel Mode: The overall symmetry in the signal is evident, and rhythmic theta and alpha are visible. There is also a small amount of activity in the beta bands, and a very small amount of gamma activity.
Fz and Cz in Sum/Difference Channel Mode: It is now clear the extent to which the energy is synchronous, versus independent. For example, the right (difference) channel is almost entirely quiet above 30 Hz, yet the left (sum) channel is very active in this entire range. This indicates that this activity is almost entirely synchronous between Fz and Cz.
May 16, 2005 page 2 of 7 © T. F. Collura
Detection of Synchronous EEG Events using ChannelSum/Difference Mode and JTFA
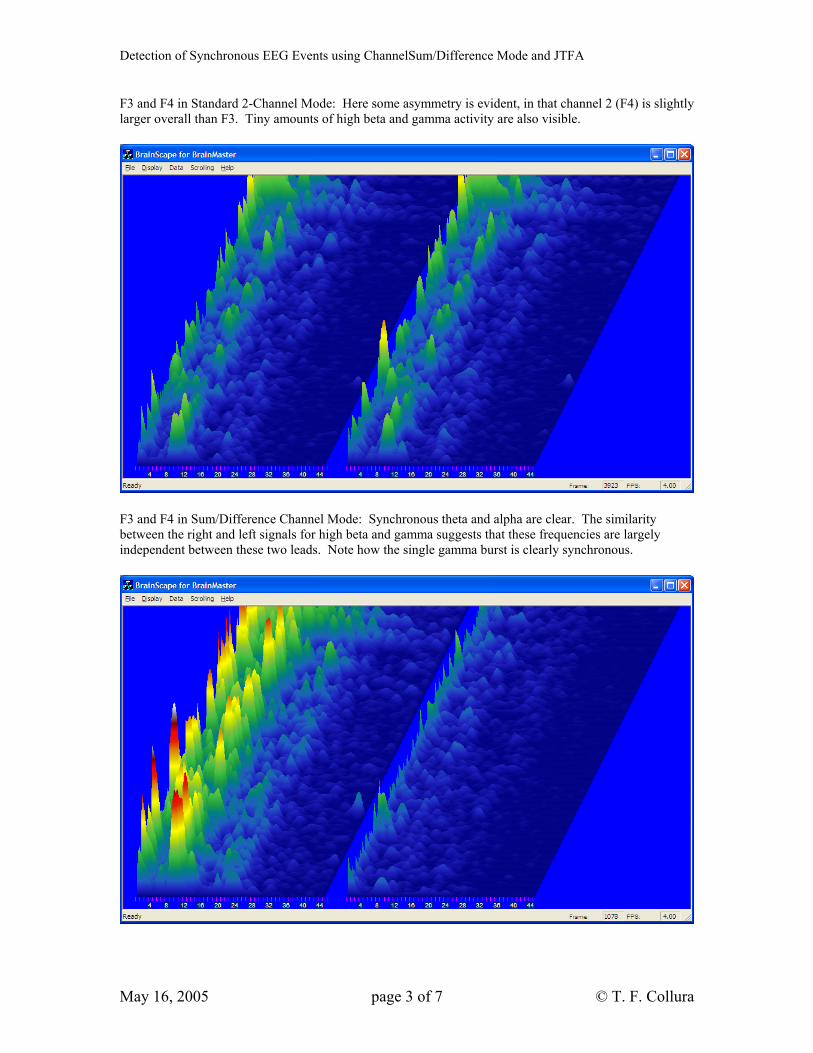
F3 and F4 in Standard 2-Channel Mode: Here some asymmetry is evident, in that channel 2 (F4) is slightly larger overall than F3. Tiny amounts of high beta and gamma activity are also visible.
F3 and F4 in Sum/Difference Channel Mode: Synchronous theta and alpha are clear. The similarity between the right and left signals for high beta and gamma suggests that these frequencies are largely independent between these two leads. Note how the single gamma burst is clearly synchronous.
May 16, 2005 page 3 of 7 © T. F. Collura
Detection of Synchronous EEG Events using ChannelSum/Difference Mode and JTFA
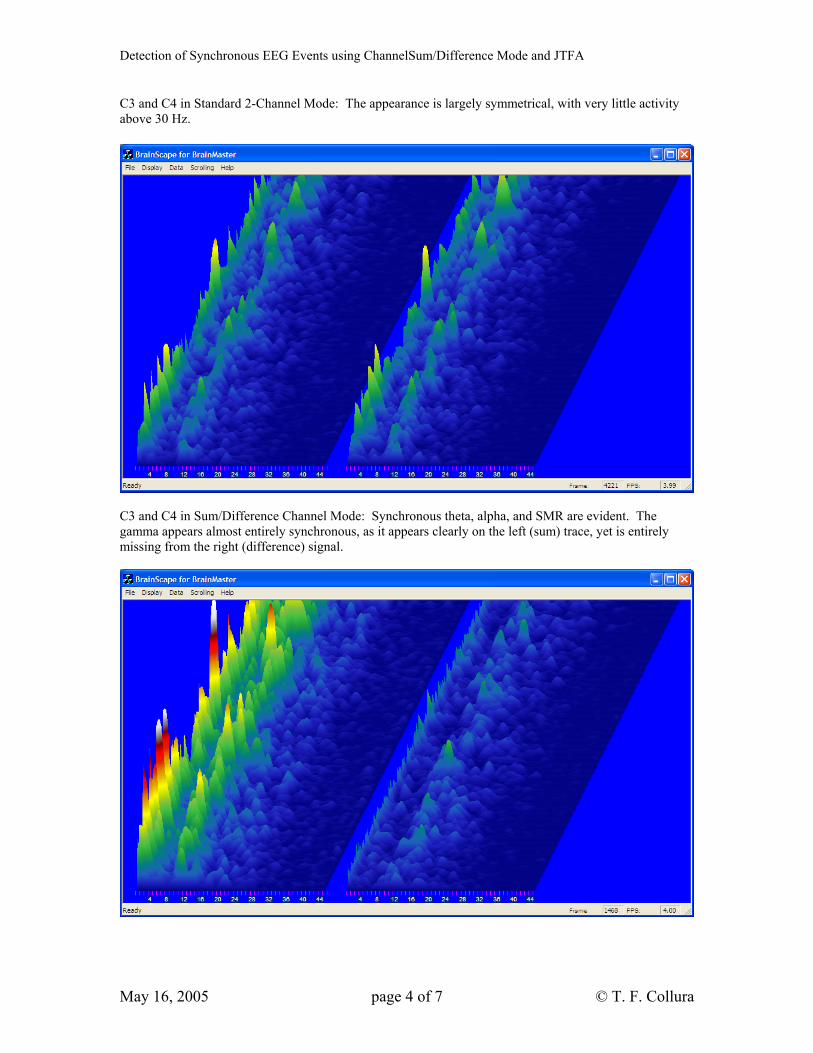
C3 and C4 in Standard 2-Channel Mode: The appearance is largely symmetrical, with very little activity above 30 Hz.
C3 and C4 in Sum/Difference Channel Mode: Synchronous theta, alpha, and SMR are evident. The gamma appears almost entirely synchronous, as it appears clearly on the left (sum) trace, yet is entirely missing from the right (difference) signal.
May 16, 2005 page 4 of 7 © T. F. Collura
Detection of Synchronous EEG Events using ChannelSum/Difference Mode and JTFA
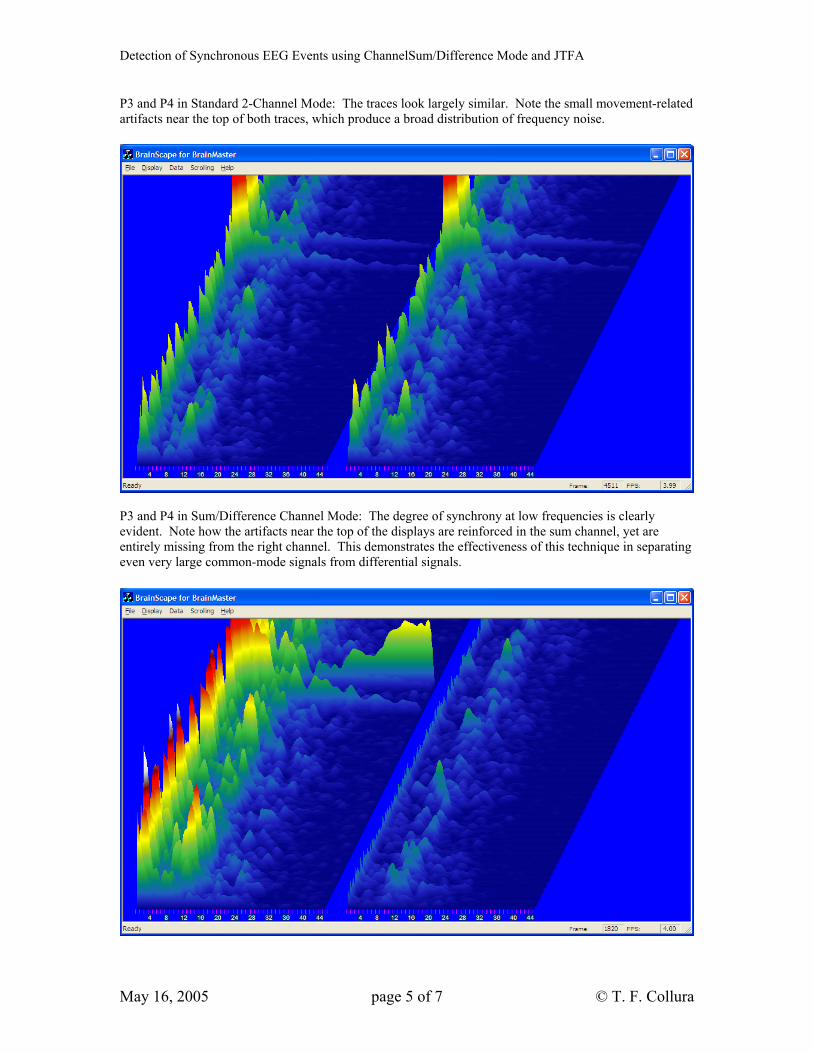
P3 and P4 in Standard 2-Channel Mode: The traces look largely similar. Note the small movement-related artifacts near the top of both traces, which produce a broad distribution of frequency noise.
P3 and P4 in Sum/Difference Channel Mode: The degree of synchrony at low frequencies is clearly evident. Note how the artifacts near the top of the displays are reinforced in the sum channel, yet are entirely missing from the right channel. This demonstrates the effectiveness of this technique in separating even very large common-mode signals from differential signals.
May 16, 2005 page 5 of 7 © T. F. Collura
Detection of Synchronous EEG Events using ChannelSum/Difference Mode and JTFA
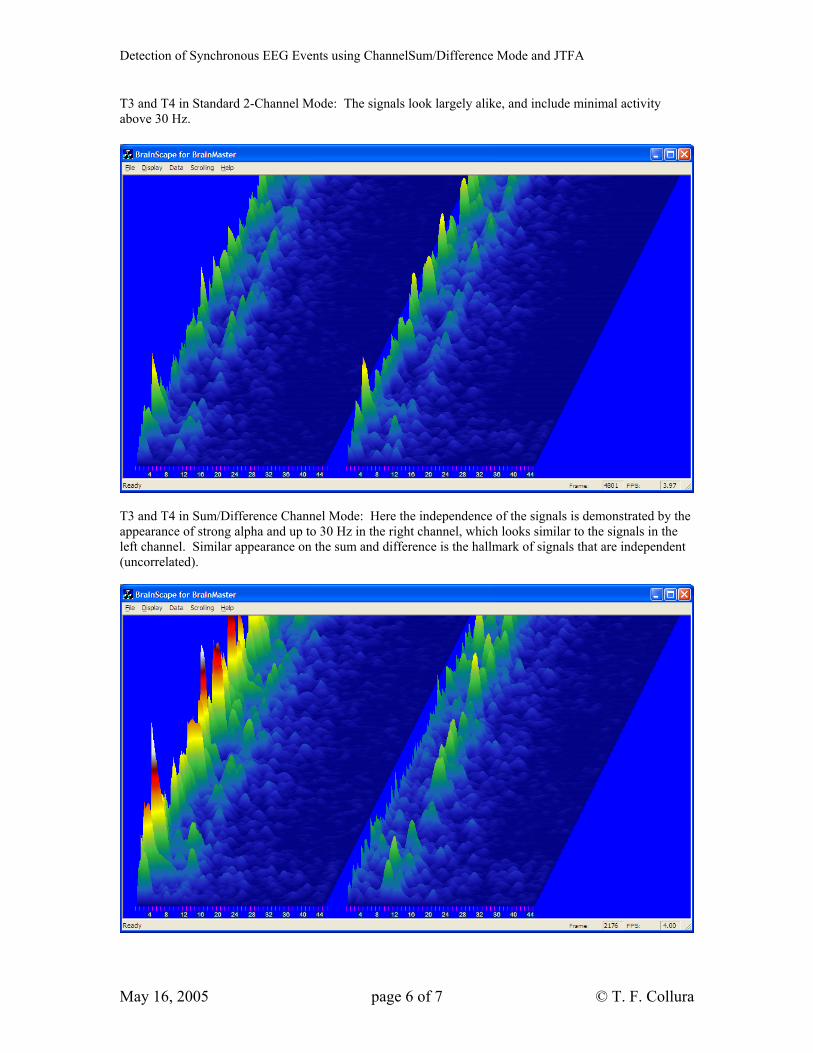
T3 and T4 in Standard 2-Channel Mode: The signals look largely alike, and include minimal activity above 30 Hz.
T3 and T4 in Sum/Difference Channel Mode: Here the independence of the signals is demonstrated by the appearance of strong alpha and up to 30 Hz in the right channel, which looks similar to the signals in the left channel. Similar appearance on the sum and difference is the hallmark of signals that are independent (uncorrelated).
May 16, 2005 page 6 of 7 © T. F. Collura
Detection of Synchronous EEG Events using ChannelSum/Difference Mode and JTFA
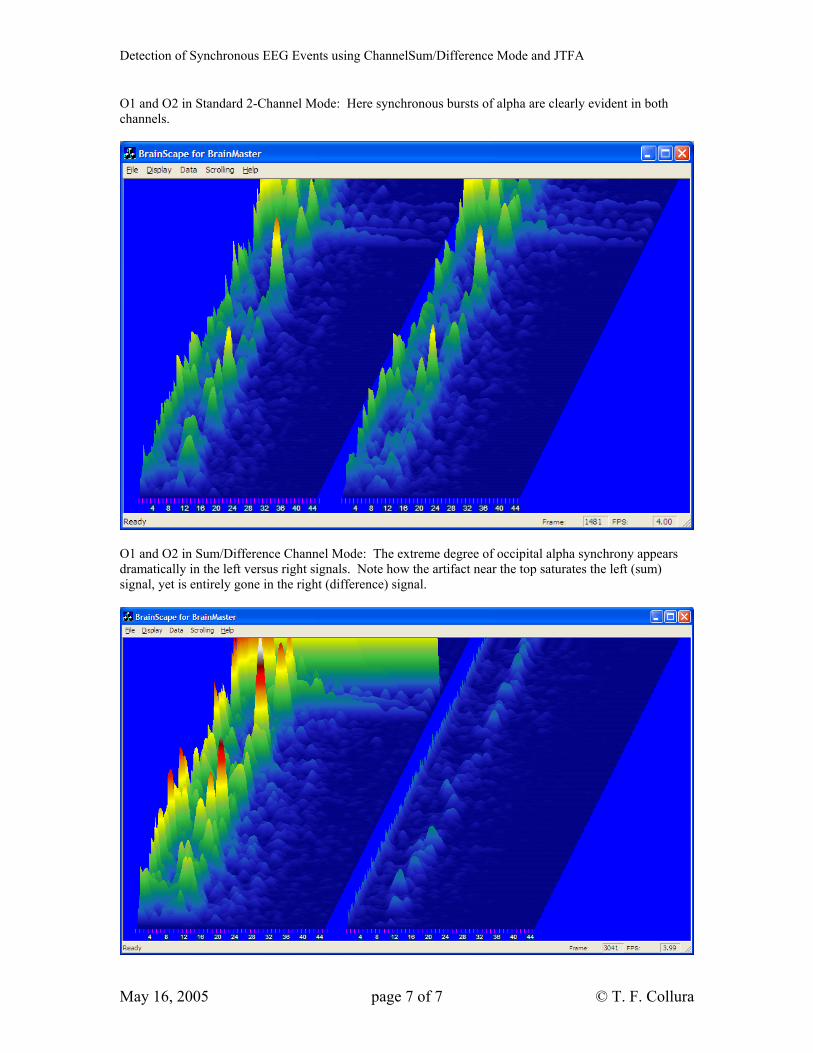
O1 and O2 in Standard 2-Channel Mode: Here synchronous bursts of alpha are clearly evident in both channels.
O1 and O2 in Sum/Difference Channel Mode: The extreme degree of occipital alpha synchrony appears dramatically in the left versus right signals. Note how the artifact near the top saturates the left (sum) signal, yet is entirely gone in the right (difference) signal.
May 16, 2005 page 7 of 7 © T. F. Collura