detection wavelength tuning and dark current modeling for
TRANSCRIPT

Detection Wavelength Tuning and Dark current modeling for
GaAs/AlGaAs Quantum Well Infrared Photodetectors using MATLAB and
Synopsys ISE TCAD
Sameer Shah1,2, M Thirumavalavan1,2, RanjayLaha1,2, A. T. Kalghatgi1, S. B. Krupanidhi21 Central Research Laboratory, Bharat Electronics Limited,
Bangalore-560013, India2 Materials Research Centre, Indian Institute of Science, Bangalore

Simulation Overview• Band Structure
– E Vs k– E Vs z– Subbands
• eigenvalues, eigenfunctions• Optical simulation
– Absorption coefficient due to intraband transitions– Optical generation rate
Simulation can be used to design a QWIP structure: x, Lw, Lb, ND, Nw, device geometry
Detection wavelength tuning involves simulation of Band structure by changing x and Lw
• Electrical simulation- Dark I-V Characteristics

Software Tools used for Simulation
• MATLAB• MATHEMATICA• Synopsys ISE TCAD

Band Structure Calculation• Band Structure Calculation using k.p method which
includes strain and many-body effects with its 4x4, 6x6, or 8x8 Hamiltonian matrix
• Subbands in Square wells can be calculated by using 1D Schrodinger solver to calculate eigenfunctions and eigenvalues

Optical Device SimulationOptical device simulation is split into two distinct
models that are calculated simultaneously at each DC bias point.
1. Optical ray trace or FDTD using real component of refractive index (n) to calculate the Electric field and hence the optical intensityat each grid point
2. Absorption or photogeneration model using the imaginary component of refractive index (k) to calculate carrier concentration at each grid point.

Design device structure • FDTD solver solves Maxwell’s equations to calculate Electric field at
each grid point inside the device. Direction of electric field vector with respect to growth direction as well as electric field intensity are calculated. Can be used to simulate optical generation due to ITtransitions and hence design C-QWIP and Diffraction Grating coupled QWIPs.
• Ray Tracing can be used to simulate 450 edge-coupled QWIPs• Contains extensive library of optical properties (n, k) of materials.
Optical properties can also be specified as tabular data. Absorption coefficient values are based on interband transitions.
• TCL scripting language is incorporated. Can be used to extend the capabilities of Synopsys ISE TCAD. Useful for calculation of absorption coefficient due to intraband transitions.
Calculation of Conduction SubbandEnergy levels for an
AlGaAs/GaAs/AlGaAs structure

Theory
• Analytical solution of Schrodinger Equation for Square well potential was used
• The transcendental equations were solved using FindRoot function of Mathematica
• Parameters:– Al mole fraction: x– Well width: Lw– Well depth: V = ∆Ec

For energy level E1:
222 * πNLEcm w
w <⎟⎠⎞
⎜⎝⎛∆
⎟⎠⎞
⎜⎝⎛=
2tan*
*w
w
b Lkkmmα
2
*2 Emk w=
For energy level E2:
⎟⎠⎞
⎜⎝⎛=
2cot*
*w
w
b Lkkmmα
20
* )(2 EVmb −=α
λchEEE ⋅
=−=∆ 12
0.76cE x∆ =
0* )0835.00665.0( mxmb +=
0* 0065.0 mmw =
xxEg 247.1424.1)( +=
xxEg 247.1)( =∆
gc EE ∆=∆ 67.0

Eigenvalues for a AlGaAs/GaAs/AlGaAs structure
( Mathematica calculations )• For x=0.45, Lw = 100 A0
342V meV=
32.29 meV
128.76 meV
280.63 meV280.63 meV
464.07 meV

Eigenvalue and Eigenfunctioncalculation using Synopsys ISE
TCAD• Synopsys ISE TCAD was used to
numerically solve 1D Schrodinger equation for AlGaAs/GaAs/AlGaAs square well
• The structure was drawn in DEVISE (Structure editor) and DESSIS (device simulator) was used to solve Schrodinger equation

Device Structure after meshing (AlGaAs/GaAs/AlGaAs)
x=0.45, Lw=100 A0, Lb=200 A0, ND = 1018 /cm3

Eigenfunctions of Square Well

Eigenvalues of Square Well

Comparison of Eigenvalues calculated using Mathematica and ISE TCAD
Energies (meV) Mathematica ISE TCADV 360 373.26E1 32.69 31.001E2 130.42 124.3E3 285.47 275.38
• The results match well• A more precise match can be achieved by
tuning material parameters in ISE TCAD with experimental values (Band gap or Electron affinity, effective mass, etc.)

Calculation of absorption coefficient due to intrabandtransitions in GaAs/AlGaAs
QWIPS
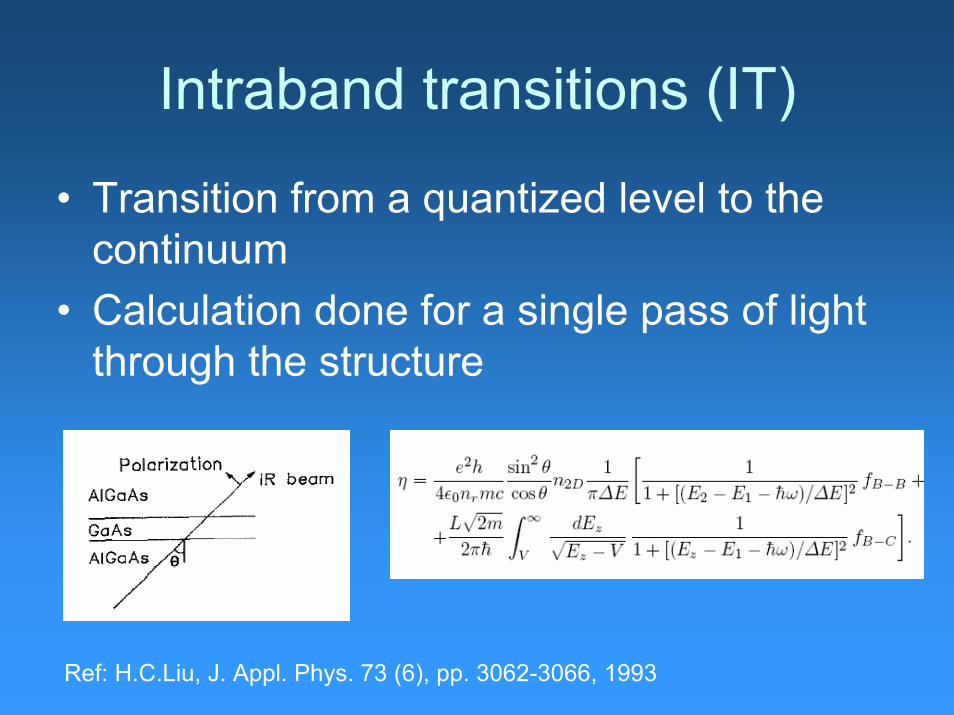
Intraband transitions (IT)
• Transition from a quantized level to the continuum
• Calculation done for a single pass of light through the structure
Ref: H.C.Liu, J. Appl. Phys. 73 (6), pp. 3062-3066, 1993

Calculation of absorption coefficient due to intraband transitions (IT)
Calculate Eigenenergies, eigenfunctions
Calculate BB and BC oscillator strengths, fBB, fBC
Calculate absorption efficiency, ηin out
in
I II
η−
=
cos( )=wL
η θα Calculate absorption coefficient

Absorption coefficient as a function of wavelength for x=0.3, Lw = 65 A0
(MATLAB calculation)

Lw = 60 A0

Lw (Angstrom) Peak detection wavelength (micron)
60 7.7
65 8.3
Peak detection wavelength can be tuned by using proper x and Lwvalues

Simulation of optical generation rate using Synopsys ISE TCAD

Theory

Possible tool flow for QWIP simulation using Synopsys TCAD

Example of optical generation using Synopsys ISE TCAD
(interband transitions)
Optical generation due to Intraband transition is yet to be implemented usingthe suggested tool flow

Simulation of Dark Current-Voltage (I-V)Characteristics

Models
• Thermionic Emission (TE)• Thermally assisted Tunneling (TAT)• Sequential Resonant Tunneling (SRT)
• SRT can be neglected for wide barriers. TE and TAT are important at QWIP operating temperatures of 77 K

Simulation of Dark Current1.
2.
2.A
2.B
3.
e Electronic chargeA area of the QWIP
µ mobility of electronF Applied fieldνs saturation velocity
Ref: S. R. Andrews and B. A. Miller, J. Appl. Phys., 70 (2), pp. 9931003, 1991

Comparison of Dark current curves (MATLAB)
Experimental Plot
Theoretical Plot
A = 9e-8 /m2
Well width = 40e-10 mBarrier width = 305e-10 mx = 0.29n0 = 1e18 /cm 3
No. of wells = 50Mobility = 1000 cm 2 /V sSaturation velocity= 5e6 cm/s Ref: B. F. Levine, J. Appl. Phys. 74 (8), R1, 1993

Conclusions• Energy levels in a GaAs/AlGaAs quantum well
were calculated using MATHEMATICA and ISE TCAD. There is a close match between both the results
• Detection wavelength can be tuned by varying Al mole fraction and well width
• Absorption coefficient due to IT transitions in QWIP structure were calculated using MATLAB
• Capability of Synopsys ISE TCAD to calculate optical generation rate and hence design a QWIP structure was discussed.
• Dark current simulation was carried out

Acknowledgement
1. Prof. H. C. LiuInstitute of Microstructural Sciences, National Research Council, Ottawa, Canada
2. Dr. Biju Jacob,Senior Application Engineer,Optoelectronics Device simulation,Synopsys TCAD Team