detectors for bunch length measurement and beam loss monitoring
DESCRIPTION
Detectors for bunch length measurement and Beam loss monitoring. Anne Dabrowski (on behalf of all involved) Northwestern University CTF3 Collaboration meeting January 2007. 1/24. A. Dabrowski, January 16 2007. Overview Northwestern CTF3 Activities. Drive Beam Injector. PETS Line - PowerPoint PPT PresentationTRANSCRIPT

Detectors for bunch length measurement
and Beam loss monitoring
Anne Dabrowski(on behalf of all involved)Northwestern University
CTF3 Collaboration meetingJanuary 2007
A. Dabrowski, January 16 20071/24

Overview Northwestern CTF3 Activities
A. Dabrowski, January 16 2007
Drive Beam Injector
Drive Beam Accelerator
PETS Line
30 GHz source Stretcher
Delay Loop TL1 (2006)
CR (2007)
TL2
(2007)
CLEX
(2008)
30 GHz tests
RF photo-injector test
(2006-2007)
‘Gallery’
Timing & 100MHz ADC’s
0-2kVPower supply
Cables Patch Panel
Beam position monitor
Acceleratingstructure
Quadrupoles
e-
‘Tunnel’
Beam Loss Monitoring
Pickup for Bunch Length Measurement
2/24

Outline
• RF pickup for bunch length measurement
– Principle of the measurement – Report on activities during 2006
• Hardware designed, installed & tested• Electronics• Software
– Results of data taking in the Fall NEW NEW– Future improvements to setup
• Beam loss Monitoring
– Reminder: devices installed and fully instrumented since 2003
– Ongoing work in optimization of setup
A. Dabrowski, January 16 20073/24

A. Dabrowski, January 16 2007
Principle of the measurement
The RF-pickup detector measures the power spectrum of the electromagnetic field of the bunch
Picked-up using rectangular waveguide connected to the beam pipe, followed by a series of down-converting mixing stages and filters.
For a given beam current, the larger the power spectrum amplitude, the shorter the bunch length.
4/24
22
)( e
Solid: σt = 1 ps
Dash: σt = 2 ps
Dash-dot: σt = 3 ps
Pow
er
Sp
ectr
um
[a
.u.]
Pow
er
Sp
ectr
um
[a
.u.]
Freq [GHz]
Freq [GHz]

A. Dabrowski, January 16 2007
• Advantages– Non-intercepting / Non destructive– Easy to implement in the beam line– Relatively low cost (compared to streak camera and RF
deflector)– Relatively good time resolution (ns) follow bunch
length within the pulse duration– Measure a single bunch or a train of bunches– Relative calibration within measurements
• Short comings in the calibration– Beam position sensitive– Sensitive to changes in beam current
• At CTF3, the RF deflector and/or a streak camera can provide an excellent cross calibration of device
Advantages of the RF-Pickup
5/24

A. Dabrowski, January 16 2007
Goal: Improve on the RF-Pickup installed in CTF2
– Increase maximum mixing frequency reach to max beam frequency signal at 170 GHz sensitivity to bunch length measurements of 0.3ps
• (CTF2 the maximum frequency was 90 GHz)• NWU purchased + commissioned D-band waveguide
components & mixer
– Spectral analysis by single shot FFT analysis from a large bandwidth waveform digitizer
• NWU Purchased & commissioned fast Acqiris digitizing card
– Design a ceramic/diamond RF window for good vacuum and transmission at high frequency
• First design complete, machining in progress testing to follow
Goal of new RF-pickup installation in CTF3
C. Martinez et al, CLIC note 2000-020
6/24

A. Dabrowski, January 16 2007
New hardware installed CTF3
CT-line, BPR and single WR-28 waveguide to transport the signal to the gallery (~20 m)
7/24
•Filters, and waveguide pieces separate the signal from the beam into 4 frequency-band detection stages•Series of 2 down mixing stages at each detection station
Analysis station gallery
1
2
3
4

Electronics for Acquisition
A. Dabrowski, January 16 2007
Acqiris DC282 Compact PCI Digitizer
4 channels
2 GHz bandwidth with 50 Ω standard front end
2-8 GS/s sampling rate
8/24
Mounted in the same VME crate as the 30 GHz conditioning team’s cards
Signals from Acqiris scope visible in control room using OASIS Viewer software

DAQ and Analysis code
• Software:– Data acquisition
controlled by a Labview program, with built in matlab FFT analysis routine.
– Code to extract the bunch length in real time written.
A. Dabrowski, January 16 20079/24
Raw Signal
FFT Signal
Analysed FFT Signal
Labview interface

Slide showing how bunch compression is doneSlide showing how bunch compression is done
• Add plot to show where Klystron 15 is, and how bunch compression is done by changing the phase
A. Dabrowski, January 16 2007
CT
.BH
D 0
510
CT
.BP
M 0
515
CT
. WC
M 0
525
CT
.VV
S 0
512
CT
.QD
D 0
520
CT
.QF
D 0
530
CT
. PH
M 0
560
CT
.MT
V 0
550
CT
S.M
TV
060
5
CT
.BH
E 0
540
Dum
p
Dump
CT
.DH
D05
05
CD
.DH
L 01
01
CD
.BP
M 0
105
CD
.VP
I 010
4
CT
.BP
R 0
532
10/24

Typical raw and FFT pickup signals
A. Dabrowski, January 16 200711/24
Example, LO 6100 MHz, phase MKS15 355 degrees, 06-12-2006

Bunch length measurement I, Dec 2006
A. Dabrowski, January 16 200712/24
• Data analysed using a self calibration procedure, by means of Chi square minimization.
• -Check with Hans about error bars
preliminary
Maximum of FFT vs phase MKS15

Possible improvement of Setup: RF Window
Material Thickness Epsilon
Al203 window 3.35 ± 0.07 mm 9.8
CVD diamond window 0.500 ± 0.005 mm (~6 at 30 GHz measured @ CERN by Raquel)
A. Dabrowski, January 16 2007
@ 90 GHz through Al203 λ is effectively ~ 1 mm
Although obtain Good signal in December commissioning of RF-pickup ; Al203 window not optimized for good transmission at high frequencies designed a thin (0.5mm) diamond window with lower εr.
•Design prototype for diamond window completed.
•Brazing Test successful
•Machining of window in progress RF properties and test in machine to follow.0.5mm
rf
c
14/24

Summary: Bunch Length detector
A. Dabrowski, January 16 2007
• RF-pickup has been successfully installed in the CT line in CTF3– First bunch length measurement made as a function of
phase on MKS15!– The Mixer & filter at 157 GHz was tested and works well.– The new acquires data digitizing scope successfully installed
and online analysis and DAQ code tested and working.– Self calibration procedure stable
Possible improvements to the setup:
• Improved RF diamond window for high frequencies is being machined and brazed and will be installed for future tests.
• An additional filter at 140 GHz, can provide additional flexibility in the detection of high frequency mixing stage
15/24

Beam Loss monitoring
A. Dabrowski, January 16 2007
‘Gallery’
Timing & 100MHz ADC’s
0-2kVPower supply
Cables Patch Panel
Beam position monitor
Acceleratingstructure
Quadrupoles
e-
‘Tunnel’
•Full setup since 2003
•3 detectors (SICs) installed per girder, with a cross calibration with Faraday cup
•Goal: To provide additional information along the girder that the BPM can’t provide
•Electronics with 2 gain ranges (x10 difference)
16/24

Reminder Beam Loss Monitoring on Linac
A. Dabrowski, November 24 200417/24
• Beam Loss Monitoring setup of Small Ionization Chambers and Faraday cups provides additional monitoring information complementary to BPM’s – Used at CTF3 since commissioning in 2003 (see talk 2004
collaboration meeting)– Setup sensitive to ‰ of the beam loss along the girder
(sensitivity increases with a loss of timing resolution)
• Revisited system over the Fall 2006. – Modify electronics - Increased input impedance to gain
additional sensitivity– Tested a Pre-Amplifier directly mounted onto the chamber
was tested (supplied by Jim Crisp at Fermilab Beams division lot of experience building electronics for beam current monitors).
– Assembled and tested Cherenkov fiber coupled to a Photomultiplier

Typical signals: Calibration Plateau
Calibration Plateau for chambers (SIC) filled with He or Ar gas taken in the CTF3 machine, normalized to the Faraday cup
Linear response between Chamber and Faraday cup
Calibration Factor ~ 6 depending on beam loss shower shape
A. Dabrowski, January 16 2007
Length of Plateau greater for Ar as expected. He breaks down at > 450 V
18/24
Time (ns)
Bias Voltage (V)
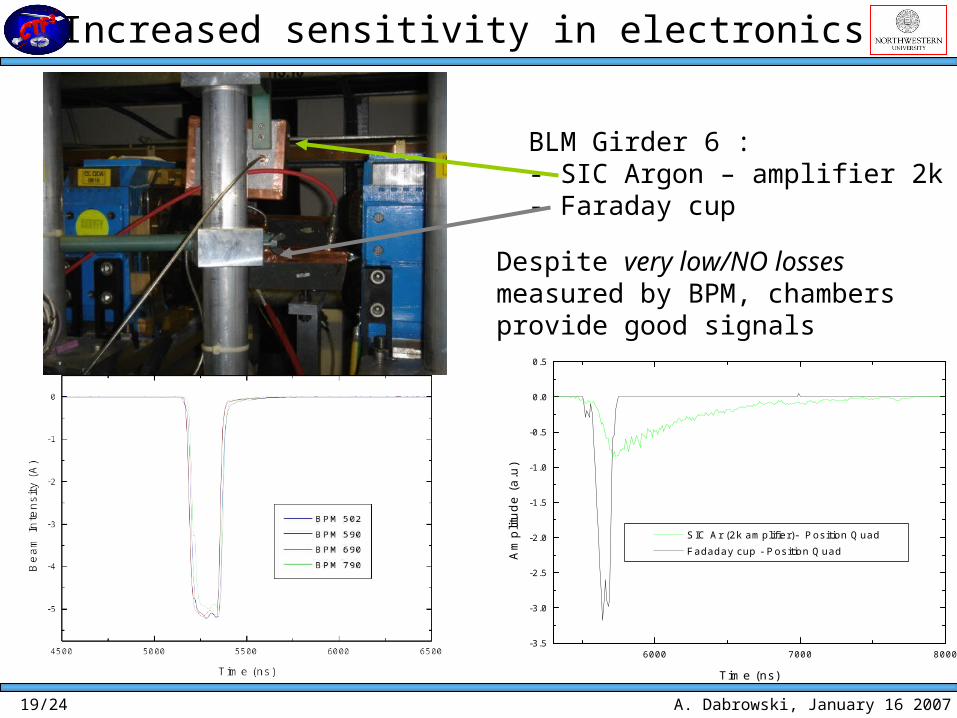
Increased sensitivity in electronics
A. Dabrowski, January 16 200719/24
BLM Girder 6 :- SIC Argon – amplifier 2k- Faraday cup
6000 7000 8000-3.5
-3.0
-2.5
-2.0
-1.5
-1.0
-0.5
0.0
0.5
SIC Ar (2k amplifier)- Position Quad Fadaday cup - Position QuadA
mpl
itude
(a.
u)
Time (ns)
Despite very low/NO losses measured by BPM, chambers provide good signals

Testing of Pre-amplifier
A. Dabrowski, January 16 200720/24
BLM Girder 5 :- SIC Argon – Fermilab pre-amplifier- Faraday cup
Shielded Pre-amplifier mounted directly to chamber improves sensitivity: additional modification to be made in the future to
decrease decay time of the amplifier. Principle is encouraging

Test Cherenkov fiber coupled to a Photomultiplier
BLM Girder 7:-Cherenkov fiber – PMT- no amplifier
BLM Girder 6:-SIC He (2k amp) – 1st Cavity
-SIC Ar (2k amp) – QUAD
-Faraday Cup (2k amp) - Quad
• Cherenkov fiber coupled to a PMT provides flexible and fast response BLM.
• Fused silica fiber supposed to be radiation hard up to 1Grad
A. Dabrowski, January 16 200721/24

Conclusions
A. Dabrowski, November 24 2004
Beam Loss Monitoring:
Chambers are sensitive to beam loss along the girder …. Additional monitoring complementary to BPM has been used since 2003 In regions of very low loss, additional sensitivity can be obtained with loss of time resolutionA pre-amplifier connected directly to the chamber tested and provides additional sensitivityA Cherenkov fiber when coupled to a PMT, can also be used as a beam loss detector.
Bunch Length Measurement:
Successful commissioning of the full detector in December 2006
Possible minor improvements to setup in future: Modifications to RF-window Additional filter at 140 GHz implemented in setup
22/24

Acknowledgements
A. Dabrowski, November 24 2004
RF-pickup acknowledgements must be made to:
•Hans Braun and Thibaut Lefevre for advising and collaboration in the design of the system•Alberto Rodriguez for assistance and advice in the Labview Acquisition and DAQ•Roberto Corsini, Peter Urschuetz, Frank Tecker and Steffen Doebert assistance in general, and in particular for the machine setup of the bunch compression scan to do the first measurement.•Stephane Degeye for Aquiris card installation•Jonathan Sladen and Alexandra Andersson general consultation•Erminio Rugo and Frank
23/24

A. Dabrowski, January 16 2007
Backup Slides

A. Dabrowski, January 16 2007
Why is this measurement needed?
• Optical radiation• Streak camera -------------------- xxxxxxx xxxxxxx > 200fs• Non linear mixing ----------------- xxxxxxx xxxxxxx Laser to RF jitter : 500fs• Shot noise frequency spectrum -- xxxxxxx xxxxxxx Single bunch detector
• Coherent radiation• Interferometry ------------------- xxxxxxx xxxxxxx• Polychromator --------------------- xxxxxxx xxxxxxx
• RF Pick-Up -------------------------------- xxxxxxx xxxxxxx xxxxxxx > 500fs
• RF Deflector ----------------------------- xxxxxxx xxxxxxx xxxxxxx
• RF accelerating phase scan -------------- xxxxxxx xxxxxxx xxxxxxx High charge beam
• Electro Optic Method• Short laser pulse ------------------ xxxxxxx xxxxxxx xxxxxxx Laser to RF jitter : 500fs• Chirped pulse ---------------------- xxxxxxx xxxxxxx xxxxxxx > 70fs
• Laser Wire Scanner ---------------------- xxxxxxx xxxxxxx xxxxxxx Laser to RF jitter : 500fs
1 n! Limitations
Performances of Bunch Length detectors Performances of Bunch Length detectors (table thanks to Thibaut Lefevre, CERN)(table thanks to Thibaut Lefevre, CERN)

Bunch length measurement II
A. Dabrowski, January 16 200713/24
Two scans, at different LO setting, give consistent results for bunch length measurement as a function of phase
preliminary