determinant eng
DESCRIPTION
1sTRANSCRIPT
The Determinants of Student Performance in Indonesian Public Primary Schools: the Role of Teachers and Schools
The findings, views, and interpretations published in this report are those ofthe authors and should not be attributed to the SMERU Research Institute or any of the agencies providing financial support to SMERU. For further information, please contact SMERU, Phone: 62-21-31936336; Fax: 62-21-31930850; E-mail: [email protected]; Web: www.smeru.or.id
Daniel Suryadarma
Asep Suryahadi
Sudarno Sumarto
(SMERU Research Institute)
F. Halsey Rogers
(World Bank)
December 2004
Working Paper

The Determinants of Student Performance in Indonesian Public Primary Schools: the Role of Teachers and Schools
Daniel Suryadarma
Asep Suryahadi
Sudarno Sumarto
(SMERU Research Institute)
F. Halsey Rogers
(World Bank)
SMERU Research Institute
Jakarta
December 2004

The Determinants of students performance in Indonesian public primary schools: the role of teachers and schools/Daniel Suryadarma et al. – Jakarta: SMERU Research Institute, 2004. – ii, 35p.; 31 cm. – SMERU Working Paper. – ISBN 979-3872-02-0
1. Suryadarma, Daniel i. Education – Primary school 2. Suryahadi, Asep ii. Students assessment 3. Sumarto, Sudarno iii. Teacher absenteeism 4. Rogers, F. Halsey
371.26/DDC 21

SMERU Research Institute, December 2004 i
TABLE OF CONTENTS
ABSTRACT ii I. INTRODUCTION 1
A. Measuring the Quality of Education 1 B. Background on Education Policy in Indonesia 2 C. Purpose of Study 3
II. DATA 5 III. LITERATURE REVIEW 7 IV. THE MODEL AND DESCRIPTIVE STATISTICS 9
A. The Model 9 B. The Possibilities of Bias 11 C. Data Summary of Math Scores 12 D. Data Summary of Dictation Test Scores 13 E. Private School Performance 13
V. RESULTS 14 VI. CONCLUSION 20 REFERENCES 22 APPENDICES 25
SMERU Research Institute, December 2004 ii
The Determinants of Student Performance in Indonesian Public Primary Schools: the Role of Teachers and Schools
Daniel Suryadarma Asep Suryahadi
Sudarno Sumarto (SMERU Research Institute)
F. Halsey Rogers*
(World Bank)
ABSTRACT
In this paper we investigate the determinants of student performance in mathematics and dictation tests among fourth-grade school children in Indonesia. We use a unique dataset of school and student information that was collected in a nationally representative survey of 110 public schools in 8 Indonesian provinces in 2003. Using an OLS regression technique that compensates for heteroskedasticity, we conduct separate sets of student-level regressions for three performance variables: math scores, dictation scores and combined scores. We found that student performance is strongly influenced by individual variables, teacher variables and school variables. Among the significant variables are the education level of parents; student-teacher ratio; quality of school facilities and teacher absence rate. We also discuss the policy implications of the results.
Key words: absenteeism; primary school; achievement.
The authors would like to thank Wenefrida Widyanti for her research assistance, Nina Toyamah, Akhmadi and Syaikhu Usman for their comments and suggestions as well as Chris Stewart for editing the draft report.

SMERU Research Institute, December 2004 1
I. INTRODUCTION Over recent decades there has been a massive effort by developing countries, sometimes with assistance from international aid agencies, to put their children in school. Educational attainment, especially primary education, is perceived as one of the main vehicles to improve living standards in developing countries and to spur on nation-wide economic growth. Given the vast resources invested in education, understanding what factors and investments most efficiently improve student learning is of crucial importance. This paper takes a first step toward that goal in the case of Indonesia. Surprisingly, given Indonesia’s size and importance, few studies have investigated the determinants of student achievement. In this paper, we use a new unique nationally representative dataset that includes not only student performance data, from math and dictation tests that we administered, but also data on the students’ teachers and schools. The results are cross-sectional and hence cannot easily be used to establish causal relationships, but they do highlight some potentially important correlations between performance and the factors that may be amenable to policy interventions.
A. Measuring the Quality of Education After achieving success in universal primary education, the next logical step would be to evaluate other aspects of schooling, particularly the quality of schools and teaching. One way of determining the quality of teaching in schools is by looking at the intermediate outcome of student performance (Sanders, 1999). There are several ways to evaluate a student’s “quality” attributable to formal education, but the most tractable indicator is how he or she performs in tests (World Bank, 2003). There are, howevers, important caveats to using testing as a measure the quality of schooling : students’ “output quality” depends very much on their input quality. Strong performance may simply reflect the student’s innate ability or prior preparation, rather than the school’s contribution. So in other words, gauging the quality of schools depends on measuring how much learning value is added to a student who enrolls in a particular school. In order to establish how much value is added, we need data on student performance prior to entering a particular school or grade, but in this study, we lack baseline pre-enrollment test scores. We do include some variables that are likely to capture some aspects of student preparation or ability, but with this cross-sectional data, our primary focus will be on establishing correlations to assist in understanding student performance in Indonesia. As we do so, we should keep in mind our underlying interest in value-adding. As mentioned above, there is an absolute advantage of using tests as an indicator of school quality: it is an objective indicator. This is especially true in government-administered tests at a national level, because schools or teachers cannot give a student high or low marks based on personal preferences or for other purposes such as securing extra funding or increasing school prestige. Test results are also highly reliable, because each student will get the result that corresponds to his or her abilities, especially abilities that are taught and trained in formal educational

SMERU Research Institute, December 2004 2
institutions. Moreover, national standardized tests enable the government to objectively evaluate one school’s level of quality relative to other schools in other provinces around the country. There are, however, also disadvantages with using tests as an evaluation tool: teachers may be tempted to teach to the test and ignore subjects that are not tested (World Bank, 2003). This is especially true if the test dates and materials are already known in advance. Moreover, there can still be attempts to manipulate results. Thirdly, student-specific skills such as family background and socioeconomic conditions, access to facilities and inherent skills are perceived and have been proven in some studies to have significant roles in determining a student’s performance in tests. B. Background on Education Policy in Indonesia Indonesia has two kinds of public primary schools. The first is called Madrasah Ibtidaiyah Negeri (MIN). MIN schools are overseen by the Ministry of Religious Affairs and use a curriculum designed by the department that is based on Islam; in other words, MI schools are religious schools. The second category of schools are non-MI schools, or regular public schools, to avoid any confusion due to diverse names given to these schools. Two of the more popular names for regular public schools are SDN (Sekolah Dasar Negeri or Public Primary Schools) and SD Inpres (SD Instruksi Presiden or Presidential Instruction Primary Schools).2 Regular schools are supervised by the Ministry of National Education, and they use a more secular curriculum; religion is only one of the courses, rather than serving as the curriculum’s foundation. In addition to these two categories of public schools, Indonesia also has private primary schools, known as SDS (Sekolah Dasar Swasta) and MIS (Madrasah Ibtidaiyah Swasta). In January 2001 the government enacted a major regional autonomy law, which has had a substantial impact on the education sector. From an organizational standpoint, since 2001, regular public schools have been controlled and supervised by district governments, although they are still using the curriculum designed by the Ministry of National Education at the national level. By contrast, the religious (MI) public schools are still under the same organizational structure as prior to 2001. Moreover, education decentralization means that school management has been handed down directly to the schools themselves, officially called Manajemen Berbasis Sekolah (School-based Management). This means individual schools have the authority to manage the available facilities, manage human resources affairs and involve stakeholders in the delivery of education. This new initiative is supported by two new independent institutions: Dewan Pendidikan (Education Boards), which operate at
2 SD Inpres is a name given to schools that were constructed during a massive national school building campaign in the 1970s, based on President Soeharto’s instruction, which explains the origin of the moniker “Presidential Instruction”. Around 60,000 primary schools were built around the country in that era. The effect of this policy is discussed in Duflo (2001).

SMERU Research Institute, December 2004 3
the kabupaten/kota level, and Komite Sekolah (School Committees), which conduct activities at the school level.3 By developing-country standards, basic education is widespread in Indonesia. In 1984 the government implemented a 6-year Compulsory Education program for the first time, which proved highly successful: by 1988, 99.6% of children were either enrolled in primary schools or had finished the six years of compulsory education (Government of Indonesia, 1997/1998). In 1994, the Compulsory Education program was renamed the Basic Education Program and was extended into a 9-year program, which requires students to remain in school until they graduate from junior high school (or grade 9). The target had been to put everybody aged 6 to 15 in school by 1998, but the economic crisis of 1997 led the government to shift the target date to 2008. Then in 2000 the government ratified UNESCO’s Education for All 2015 program that was signed in Dakar, which commits Indonesia to reduce adult illiteracy by 5% and provide basic education for all children by 2015 (Sudjarwo, 2003). In 2003, the Indonesian House of Representatives (DPR) passed a new National Education System law, replacing legislation that had taken effect in 1989.4 C. Purpose of Study Between late 2002 and early 2003, there were heated discussions on the National Education System law as it was being debated in parliament, and one of the more popular topics was the poor performance of Indonesian students. What was missing from these arguments however, was the evidence to support claims regarding the lack of quality among students, especially quantitative evidence; the proof of whether a link exists between student quality and teaching quality in Indonesia, as has been proven in other countries; and, if the link does exist, what kind of influence teaching quality has on student quality. This paper explores the determinants of performance in tests of Indonesian fourth-grade students in public schools in detail, and gauges how decisive factors like teacher quality and school facilities are in determining test results, compared to student-specific factors such as parents’ level of education. Since this paper only aims to provide a basic explanation of the determinants of student performance, the best this paper can do is explain whether student performance is a good indicator of the quality of a school and teaching and, if teacher quality and school facilities are significant, what policy measures can be taken by stakeholders to improve student performance.
3 Although both bodies have generic names, these are the official names. Dewan Pendidikan is the body that enables the community where schools are located to participate and assume responsibilities in school management and policies. Although they work with government agencies, they are independent and have their own authority according to the laws in their specific regions. As already mentioned, they operate at the kabupaten/kota level. On the other hand, Komite Sekolah operate at the school level, and they have similar functions to BP3 (for an explanation of BP3, see section IV). See http://www.dewanpendidikan.or.id for more details (note – this website is in Indonesian). 4 This new law, UU No. 20/2003, replaced UU No. 2/1989. While the legislation changed, the government regulations that govern its implementation have not been replaced; and as a result, the new law operates under the same government regulations as previously.

SMERU Research Institute, December 2004 4
It should be stressed that while it tries to identify the major correlates of student performance, this paper does not pass judgment on whether quality of schools and teaching in Indonesia is “acceptable”, relative to potential or to international standards.5 Also, since the data were collected through a survey conducted in 2003 and no studies using similar instruments were conducted before 2001, this study cannot conclude whether the quality of education has changed, for better or for worse, due to decentralization.6 Another contribution of this analysis is that in addition to the usual explanatory variables, we include the teacher absence rate. Only a handful of recent studies regarding teacher absenteeism have tried to include teacher absence as an explanatory variable, because until recently good data on absenteeism was unavailable. This variable may provide us with valuable insight regarding the determination of student performance. Other than this paper, we only found one recent paper on this topic: Mohandas (2000), which discusses performance in junior secondary schools, in addition to an older paper (Johnstone & Jiyono, 1983).7 Thus, this is the first paper to our knowledge in at least two decades that provides the correlates of student performance in primary schools in Indonesia. The rest of the paper is organized as follows. Chapter II discusses the survey where data was collected. Chapter III provides a literature review of determining student achievement. Chapter IV explains the model used for this investigation and data summary. Chapter V discusses the results. Chapter VI provides conclusions and policy implications.
5 It is subject to debate whether there exists an acceptable level or not in measuring quality of education. 6 The regional autonomy laws were enacted in 2001, which among other things transferred budget allocation authority, including health and education spending, to local governments. 7 Other older papers include Elley (1976), Mangindaan et al. (1978), and Moegiadi et al. (1979) that were referenced in Mohandas (2000).
SMERU Research Institute, December 2004 5
II. DATA The data for this study were collected through a health and education provider survey conducted by the World Bank in cooperation with SMERU Research Institute. The main objective of the survey was to collect data on the condition of primary schools and public health centers. The survey was part of a multicountry survey that also included Bangladesh, Ecuador, India, Peru, and Uganda. The survey had three objectives: to document every health and education provider-related issue; to gain an understanding of the differences in the characteristics between districts as well as between primary schools and public health centers; and to allow assessments of the differences in quality and quantity of service delivery across countries, with the focus on the impact of regional autonomy, public participation, labor policies and income. Data collection in Indonesia took place during two separate rounds, in October 2002 and February 2003. Each school was visited twice to improve the accuracy of the estimates on variables (such as teacher absence), as well as to gauge the similarity of the responses from the two visits, thus giving us a better understanding of the nature of the existing problems. In Indonesia, as in the other countries in the study, the sample was a stratified, clustered, nationally representative random sample. The Indonesia data were collected from eight provinces chosen randomly: Banten, West Java, Central Java, East Java, Bengkulu, Riau, West Nusa Tenggara (NTB) and Southern Sulawesi. After stratification of the country into four regions, a total of 10 districts were chosen randomly on a probability-proportionate-to-population basis: five urban districts (Cilegon, Bandung, Surakarta, Pasuruan and Pekanbaru) and five rural districts (Gowa, Lombok Tengah, Rejang Lebong, Magelang and Tuban). In each district, 10 villages were chosen at random, and in the chosen villages up to three primary schools were surveyed at random with at least one private and one public school being included. For public health centers, 10 were chosen at random from each district. The questionnaire in the survey aimed to obtain information at three levels: the facility level, individual level and national level. The facility level included the size of the facility; number of employees; operating hours; employees’ activities when visited by the enumerators; types of services available (for public health centers); remoteness; public participation; average education level of the patients and students’ parents; supervision; financial condition; employees’ education background and the availability of supporting facilities. At the individual level, the survey covered means of transportation used by the employees to get to the facilities; the relationship between the employee and the surrounding area; employees’ rank in the facilities; demographic characteristics; mother tongue and ethnic background; work-related education; marital status and number of children; other sources of income; work experience; salary payment method; his or her motivation for choosing a particular occupation and their level of satisfaction. Lastly, at the national level the questionnaire included the different positions in the facility, number of employees and qualifications; tolerated absenteeism level among employees; policies regarding
SMERU Research Institute, December 2004 6
appointment, placement and transfer of employees; employees’ participation in facility management; private sector service and condition of private facilities; reward and sanction systems; stakeholder participation in policies and employees’ union. The student-performance data used for this paper were collected during the second visit to each school in February 2003. Enumerators administered a brief interview and test to a randomly selected sample of 10 students from the fourth grade in 110 public schools, yielding a total sample of 1,089 students. Almost all schools had only one fourth-grade cohort. Although there might be warranted suspicion that the students did not take the tests seriously due to their irrelevance for the students’ grades in school, the enumerators reported and documented that the students seemed to take the tests very seriously. The test instruments are in Appendix 5. This analysis only includes government schools (SDN and MIN), in part because most primary schools across the country are government-run, so students in government-run schools can serve as the best proxy for the country.8 Moreover, government-run schools generally have similar organizational structures and are subject to a strict standardized national curriculum; these commonalities may make it easier to distinguish the effects on performance of differences in school management and family background factors. More explanation regarding the data is available in section IV.2 and IV.3.
8 According to data released in 2003 by the Department of National Education, 93% of primary school students are enrolled in public schools (DNE, 2003).
SMERU Research Institute, December 2004 7
III. LITERATURE REVIEW
Many studies have related student performance to various aspects of education such as the quality of a school, quality of teaching, teacher remuneration, class size and student gender, to mention several widely used factors. The main problem in relating these aspects is that the non-measurable outputs may be as important as the measurable ones. There are also some concerns about the fact that students are taught by more than one teacher, making it difficult to link the performance of a particular student to a particular teacher (Kingdon & Teal, 2002). A study on schools in India investigated the relationship between performance-related pay and student achievement (Kingdon & Teal, 2002), addressing the important issue of endogeneity in the relationship between pay and achievement. In the study, the writers discussed two issues: an earnings function for teacher’s pay and a production function for student achievement. The authors found strong evidence that performance-related pay in the private sector impacts on student achievement, but no evidence of a similar cause-effect relationship in public schools. A study in OECD countries on the role of deviations in students’ characteristics to their performance showed that students whose parents (especially mothers) have high school certificates or higher qualifications perform better than their peers (OECD, 2001). Family affluence is also a very decisive factor, although students in less affluent families in some OECD countries perform better than the OECD average (OECD, 2001). The study itself discussed many other differences in student characteristics and background that may contribute to differences in student performance such as gender, family socioeconomic status, culture, language spoken at home and family structure. Another comparative study on public schools among states in the United States found that in Tennessee, smaller class sizes contribute positively to student learning, particularly in fields like elementary reading (Darling-Hammond, 2000). The studies on class size are not limited to public schools, as another study found that there is a consistent negative relationship between student-teacher ratio and the average examination results in UK private schools (Graddy & Stevens, 2003). A study in secondary schools in Bangladesh however, (Asadullah, 2002) found an insignificant positive sign on the class size variable in determining student achievements using both OLS and IV regressions. The author concluded by suggesting that a reduction in class size is not useful in a developing country like Bangladesh. Moreover, other studies on class sizes found that small class sizes are either not significant or even detrimental to student performance (Hanushek, 1995; Angrist & Lavy, 1999; Urquiola, 2001; and Hoxby, 2000a). In addition, a review of 277 econometric studies further emphasized the inconsistency of the effect of class size on achievement when it stated that 28% of the studies report statistically significant estimates but 13% of those report a statistically significant negative sign (Jones, 2001).

SMERU Research Institute, December 2004 8
Other studies stated that teachers are the most important influence on student progress, even more important than socioeconomic status and school location (Archer, 1999 and Armentano, 2003) that found that teacher qualifications are more important than class size. One study (Darling-Hammond, 2000) concluded that measures of teacher preparation and certification are by far the strongest correlates of student achievement in reading and mathematics. Another important and generally consistent finding is that girls usually perform better than boys. This result is true for developing countries like Malawi (UNICEF, 2003), where UNICEF interviewed teachers regarding performance of female students, and more developed countries like Australia and New Zealand (Buckingham, 1999 and 2003). According to the study in Australia, this is related to the fact that boys’ performance has been declining over the past decade while girls’ performance has improved. Australian girls are now 11% more likely than boys to complete grade 12, and in the 1998 New South Wales HSC the average mark for girls was higher than boys in 64 out of 70 subjects. Moreover, boys’ scores tend to be clustered at the top and the bottom while girls’ are closer to the middle. Another statistical investigation by the same author (Buckingham, 2003) offered some explanations by mentioning that there is a diminishing presence of men in boys’ daily lives; and the fact that there has been a ‘feminization’ of schools in Australia for the past two decades, which means that curriculum and assessments now suit girls more than boys. There are also several studies that discussed peer effects on student achievement. The results indicate that peer achievements have a positive effect on achievement growth. On the other hand, the variance in their achievements appears to have no effect (Hanushek et al., 2001). Another study (Hoxby, 2000b) that used two methods in looking at the effects of peers with different gender and racial groups in Texan primary schools also found that students are affected by the performance of their peers. For instance, the study found evidence that both male and female test scores in math and reading improve by increasing the share of females in a class. On the other hand, the effects of an increase in a racial group in a class are not as convincing as gender with only one or two race groups being significant, and peers in the same racial group experience the effects highest. Moreover, this study also found that racial origin of peer achievement is not important, except within racial groups. As we already mentioned in section I.3, we found only one recent paper on this topic that was written using Indonesian data. Mohandas (2000) used the result of 1997 TIMSS (Third International Mathematics and Science Study) instruments in measuring the mathematics and science achievements of junior secondary students. The paper found that the sex (boys constantly outperformed girls), age and background of students were significant student-level determinants of achievement. The other paper (Johnstone & Jiyono, 1983), which tested student achievement in language and mathematics in rural and semiurban Yogyakarta, found that background is more important than students’ individual characteristics and attitudes towards school, and family encouragement is more important than family wealth or socioeconomic conditions. Furthermore, out-of-school factors were found to affect language scores most and math scores least, which means teacher absence should have a greater effect on mathematics than language aptitude.
SMERU Research Institute, December 2004 9
IV. THE MODEL AND DESCRIPTIVE STATISTICS A. The Model The model for student performance adopted in this study follows a common firm production function, which was also used by Kingdon & Teal (2002). Appendix 1 documents the description of the variables.
Ln Sij = α0 + α1 Gij + α2 QP
ij + α3 Ln QT
j + α4 Ln QS
j + α5 Ln FS
j + uij
where Sij is the score in math and dictation tests of the ith student in the jth school, and it is determined by Gij, the sex of a student; QP
ij, a matrix of the characteristics of a student’s parents; QT
j, a matrix of the teacher’s characteristics in the jth school; QS
j, a matrix of the quality of the jth school; and FS
j, any fees received by the jth school from both the government and the parents; while uij is the error term in the model. District variables are added into the model to serve as an indicator of whether there are fundamental differences among districts. Sij consists of three types of scores - math, dictation and a combination of both - and they will be estimated individually. The tests, which consisted of the same set of questions for each student, were administered by our enumerators. The first figure is SCOREMATH, which is the raw score from the math test that consisted of thirteen basic problems (addition, subtraction, multiplication, division). The second figure is SCOREWORD, which is the raw score from the dictation test. The third one is PERFORMANCE, which is simply the average of the SCOREMATH and SCOREWORD for each student. QP
ij is made up of a student’s mother’s and father’s highest level of educational attainment dummy variables, whether the student takes extracurricular courses or lessons, and whether the parents have met the teacher in the past six months. Public school teachers are supposed to meet with parents at least once every four months, but meetings can occur more frequently if the parents and teachers are active attendants of school committee (BP3) and other similar meetings. On the other hand, there are parents who do not see their children’s teachers for years or, in some extreme cases, ever. The purpose of meetings is to maintain communication and exchange information that can be beneficial to student performance. Thus, QP
ij = [FATHER UNSPECIFIED EDUCATION; FATHER DID NOT COMPLETE SIXTH GRADE; FATHER COMPLETED SIXTH GRADE; FATHER COMPLETED JUNIOR HIGH SCHOOL; FATHER COMPLETED HIGH SCHOOL OR ABOVE; MOTHER UNSPECIFIED EDUCATION; MOTHER DID NOT COMPLETE SIXTH GRADE; MOTHER COMPLETED SIXTH GRADE; MOTHER COMPLETED JUNIOR HIGH SCHOOL; MOTHER COMPLETED HIGH SCHOOL OR ABOVE; TEACHER HAS MET PARENTS; STUDENT TAKES EXTRA COURSES].
SMERU Research Institute, December 2004 10
QT
j is the teachers’ characteristics. ABS_RATE_TOTAL, is the teacher absence rate; AVG_EXPERIENCE and AVG_EXPERIENCE_SQ are the average years of experience of teachers in the school and the average years of experience squared; PROP_PERM_TEACHER is the proportion of permanent teachers in the school which, in public schools, usually means civil servants; PROP_TEACHER_OTHJOBS is the proportion of teachers who have other occupations; PROP_FEMALE_TEACHER is the proportion of female teachers; PROP_TEACHER_DISS is the proportion of teachers who are dissatisfied with their salary; PROP_TEACHER_ABOVE_SPG is the proportion of teachers who have teacher training beyond secondary high school. In Indonesia, teacher training starts at secondary high school, or Teacher Training Schools (SPGs). People who wish to become teachers go to SPGs instead of regular high schools. Teachers who are trained only at SPGs are only licensed to teach in elementary schools. Although government regulations require teachers to have at least attended SPGs, in some parts of the country this regulation is waived due to teacher shortages.8 Thus, QT
j=[ABSENCE RATE TOTAL; AVERAGE EXPERIENCE; AVERAGE EXPERIENCE SQUARED; PROP PERMANENT TEACHER; PROP TEACHER WITH OTHER JOBS; PROP FEMALE TEACHER; PROP TEACHER DISSATISFIED; PROP TEACHER ABOVE SECONDARY LEVEL EDUCATION] QS
j is the condition and characteristics of the school. MAIN_LANG_INDO indicates whether the official school language is Indonesian; MAIN_LANG_DIFF indicates whether the official school language is different from the mother tongue of the majority of students; AVG_CLASS_SIZE is the average size of the classes where the test was administered (in this case fourth grade); STUDENT_PER_TEACHER is the student-teacher ratio in the school and STUDENT_PER_TEACHER_SQ its square (so it is not only for the fourth grade); LIBRARY_AVAIL indicates whether there is a functional library at the school; binomial variables to indicate whether the school has the following infrastructure: paved road, toilets, electricity, a playground, maps and charts, and a staff room; TEACHER_MEET, which is also a binomial variable to indicate whether there has been a staff meeting in the past 6 months. So QS
j=[MAIN SCHOOL LANGUAGE INDONESIAN; MAIN SCHOOL LANGUAGE DIFFERENT THAN STUDENT; AVERAGE CLASS SIZE; STUDENT PER TEACHER RATIO; STUDENT PER TEACHER RATIO SQUARED; LIBRARY AVAILABLE; PAVED ROAD WITHIN SCHOOL; PAVED ROAD ONE HUNDRED METERS FROM SCHOOL; PAVED ROAD ONE KM FROM SCHOOL; HAS TOILET; HAS ELECTRICITY; HAS MAPS; HAS PLAYGROUND; HAS STAFFROOM; TEACHER MEETING REGULARLY]. FS
j is the fees related to the school. It has three variables: AMOUNT_RECEIVED, which is the amount of government funds received by the school in the 2001/2002 school year, measured in millions of rupiah; TOTAL_FEES, which consists of exam fees and other fees charged to each student, normalized to monthly average in thousands of rupiah; and MONTHLY_BP_FEE, which is some form of compulsory membership fee for parents to take part in the BP3, which is comprised of parents and 8 Recently, SPGs were abolished as the requirement for teachers has been increased to a 2-year teaching diploma.

SMERU Research Institute, December 2004 11
teachers, and its duty is to oversee school activities. The BP3 fee is normalized to a monthly average in thousands of rupiah. Thus FS
j=[GOVERNMENT TRANSFER; TOTAL FEES CHARGED TO STUDENTS; MONTHLY BP FEE]. In theory, one might expect any effects of transfers and fees to be mediated by the teacher and school quality variables, if the fees affect student performance primarily by allowing purchase of better inputs into the educational process. We include fees however, because some dimensions of quality are without doubt unobservable or at least immeasurable, and fees seem likely to correlate with these dimensions and therefore with student performance. Furthermore, including the three sources of funds separately may provide a test of which type of accountability is most effective in inducing strong performance by the school - accountability to government agencies, to individual “clients”, or to school organizations.9 B. The Possibilities of Bias Other studies have documented potential bias-generating issues in this kind of investigation. One potential bias stems from the potential correlation of student performance with unobservables. One such unobservable is the student’s ability to learn or educability. This variable is difficult to measure accurately, even if some sort of aptitude test is available (it is not in our data), but it is certainly an important element in the educational production function. Omitting it will therefore introduce bias if the variable is correlated with other regressors, such as parental education or income (Graddy & Stevens, 2003). To try to address this problem, we include several variables that are likely to correlate with student educability - parental educational attainment; whether the student takes extracurricular lessons; and parental attention to the student’s progress. Various potential sources of endogeneity could bias our econometric results. One such source is parental choice of school for their children. If that choice (or the applicants’ choice of school) is correlated with characteristics that are observed by parents or school administrators but not by the econometrician, then the analysis may incorrectly attribute to the school or teachers’ performance effects that actually stem from individual characteristics. Kingdon (1996) attempted to control for selectivity of students into private and public schools in India and found that the selectivity term was only weakly significant when there were no controls for any school or teacher variables. It is possible that this result would also hold in the Indonesian context; however, we know of no studies testing this proposition. Endogenous student assignment to classes could similarly be a source of bias, if students are assigned based on unmeasured characteristics correlated with performance. As already mentioned above, however, most schools surveyed only have a single fourth-grade cohort. In any event, our data on teacher characteristics are not class-specific, but are averages for each school. While taking averages will reduce our ability to distinguish teacher effects from noise, it should eliminate this potential source of bias. 9 See World Bank (2003) for a summary of different mechanisms of accountability in service delivery.
SMERU Research Institute, December 2004 12
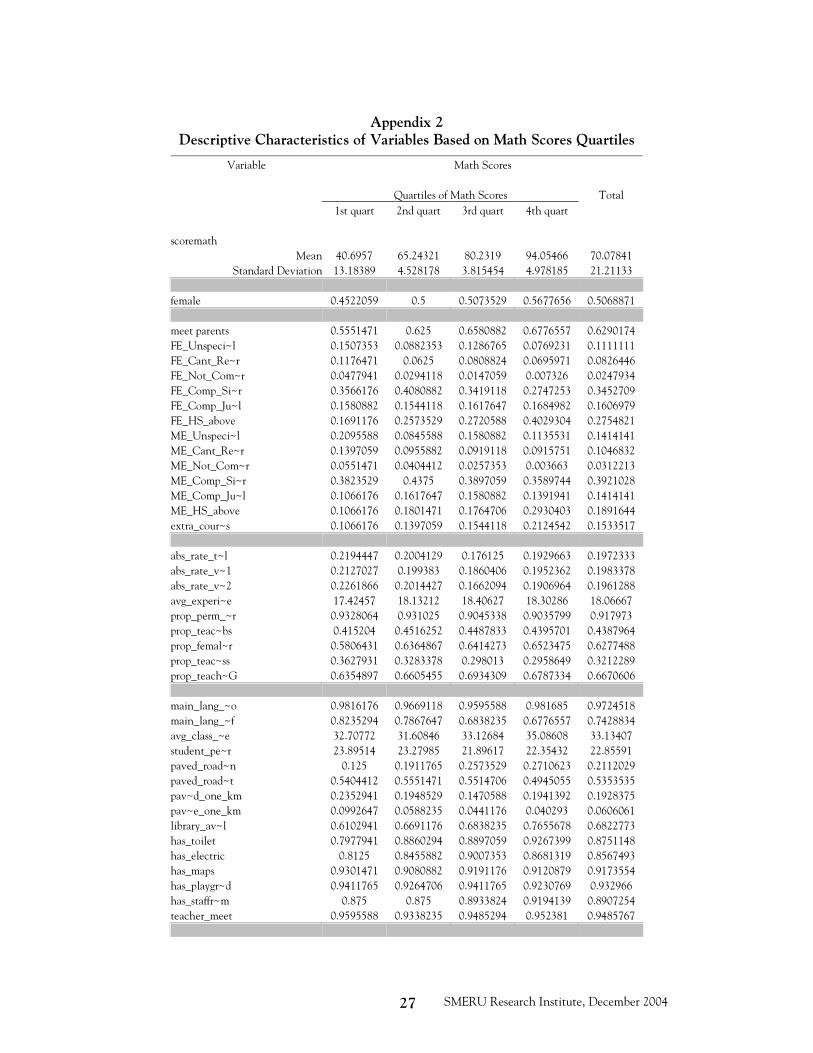
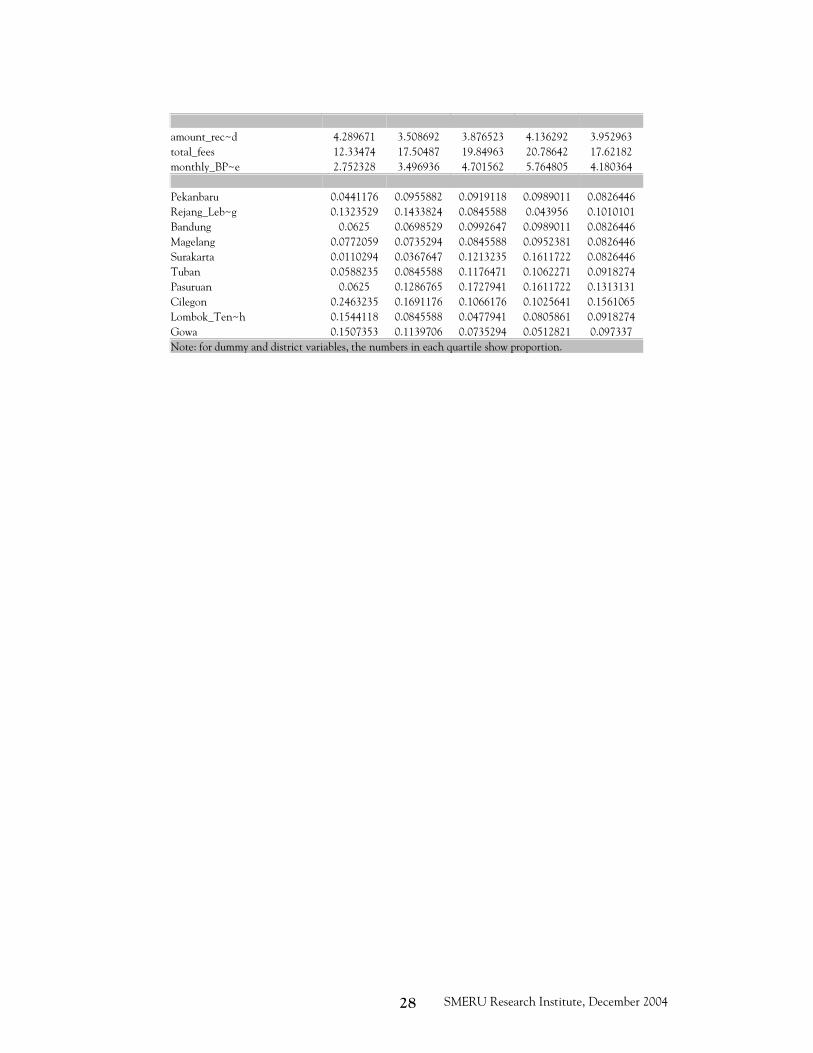
Another potential source of bias is the possibility that parents enroll their children in extracurricular classes or tutoring - so that the measured public-schooling inputs do not capture all formal educational inputs. The direction of this bias is not easy to predict; poor-performing students may be sent to tutoring to get remedial attention, but it is also possible that high-ability students with motivated parents receive tutoring to compensate for inadequacies in public schooling. In this case, we did collect information on tutoring from the students, which should help to reduce this source of bias. Nevertheless, we recognize that this variable also serves as a proxy for parental income - in that only parents who are relatively affluent can afford to enroll their children in extracurricular classes - and as an indirect measurement of parental attention. So while including this variable seems important, interpreting it will require caution. In summary, in light of the bias issues we have mentioned above and the measures we have taken to accommodate them, we are reasonably confident of the robustness of our results. C. Data Summary of Math Scores In this section, we divide the student test scores into quartiles and look at the characteristics of the schools, students and teachers of each quartile. Appendix 2 documents this exercise for math scores. The highest score in the math test was 100 while the lowest score was 0. The actual length of the math test varied from 5 to 21 minutes, based on the amount of time the students spent finishing the test. Unsurprisingly, and consistent with evidence from other countries, this new evidence from Indonesia shows that the average level of education of fathers increases with the test-score quartiles (from lowest to highest). In the first quartile, most fathers only have a primary school certificate, while in the fourth quartile most fathers have at least a high school certificate. In addition, the proportion of fathers who have a high school certificate continues to rise in higher quartiles. In the bottom quartile, only 17% of fathers have a high school certificate, while in the top quartile 40% of fathers do. The same pattern is true for mothers: although the majority of mothers in all quartiles completed only primary school, the percentage of mothers who have a high school certificate increased from 10% in the first quartile to 29% in the fourth quartile. Other variables which correlate with performance include gender, infrastructure, source of funds and parental involvement variables. Girls are over represented among high scorers: 56% of students in the highest quartile are girls, compared with 45% in the lowest quartile. The proportion of female teaching staff also increases with student performance, from 58% in the first quartile to 65% in the fourth quartile. While some indicators of the quality of school facilities do not vary much across quartiles, others such as the existence of a library and toilets also increase between the first quartile and the fourth quartile. In addition, although the amount of transfers received from the government is relatively equal for all quartiles of students, the schools of higher-quartile students charge higher BP3 and school fees. Finally, more parents of the children who performed better in the math test had met teachers in the two to six months prior to the test.

SMERU Research Institute, December 2004 13
D. Data Summary of Dictation Scores Appendix 3 summarizes the dictation test scores. Those scores range from 0 to 100, while the time that students took to complete the test ranged between 2 and 39 minutes. The findings on (bivariate) correlates of dictation test scores are broadly consistent with the findings for the math test, in terms of trends in the movement between quartiles. The main difference is in government transfers: schools with more children who performed well in the dictation test received significantly more funds. Schools of students in the higher quartiles are also more likely to have electricity. Another finding from the data is that students in higher quartiles attend schools with fewer teachers who have other occupations. The average class size (for fourth-grade classes) and the pupil-teacher ratio (for the school) both show that, in terms of simple correlations, students whose scores are in higher quartiles are in schools that have more students in a class or, other words, more students per teacher. E. Private School Performance Although we focus on public primary schools, it is useful to compare their results with private schools. Our data on private school students consist of 319 students from 35 schools. The comparison between both schools for both tests is in Table 1.
Table 1. A Comparison of Performance between Private and Public Primary Schools
Test Mean Std. Dev. Min Max
Private School Mathematics 72.53 22.18 7.7 100 Dictation 86.28 20.87 0 100 Public School Mathematics 70.08 21.21 0 100 Dictation 84.56 21.93 0 100 Mean Difference Mathematics 2.45* Dictation 1.72 note: * significant at 5%.
On average, students in private schools perform better than their counterparts in public schools, although the only significant difference is in math performance. Furthermore, the mean differences are only slight, less than 3 points on a 0-100 scale. This indicates that there is no significant difference in performance between public and private schools. The limited number of observations however, prevent us from analyzing private schools further.

SMERU Research Institute, December 2004 14
V. RESULTS To estimate the model, we used OLS regression with the standard errors adjusted for heteroskedasticity using school clusters. The estimations were carried out for each test type. The results of the estimations are provided in Table 2.
Table 2. Correlates of Student Performance OLS Results with Robust Error
Mathematics Dictation Average Performance
Score Score Score
Sex
Female 0.085** 0.282*** 0.107***
[0.041] [0.094] [0.033]
Parents Quality and Attention
Teacher has met parents -0.013 -0.032 0.005
[0.041] [0.087] [0.035]
Father unspecified education 0.061 0.27 0.11
[0.111] [0.233] [0.105]
Father did not complete sixth grade 0.08 0.406 0.22*
[0.118] [0.358] [0.114]
Father completed sixth grade 0.078 0.335 0.172
[0.119] [0.242] [0.110]
Father completed junior high school 0.004 0.302 0.087
[0.147] [0.256] [0.144]
Father completed high school or above 0.093 0.314 0.148
[0.129] [0.269] [0.124]
Mother unspecified education 0.167 0.042 0.146
[0.118] [0.172] [0.098]
Mother did not complete sixth grade 0.137 0.333* 0.142
[0.152] [0.194] [0.099]
Mother completed sixth grade 0.267** 0.086 0.183*
[0.130] [0.167] [0.107]
Mother completed junior high school 0.285** 0.25 0.224**
[0.136] [0.182] [0.112]
Mother completed high school or above 0.33*** 0.348** 0.255**
[0.123] [0.165] [0.103]
Student takes extra courses 0.002 0.036 0.019
[0.042] [0.080] [0.039]
Teacher Quality and Condition
School teacher absence rate -0.072** 0.06 -0.046
[0.031] [0.083] [0.029]
Average teacher experience -0.899 -1.547 -0.78
[0.576] [1.935] [0.591]
Average teacher experience squared 0.201* 0.297 0.156
[0.118] [0.382] [0.120]
Proportion of permanent teachers -0.426** 1.295* -0.119
[0.172] [0.711] [0.177]
Proportion of teachers with other jobs -0.061** -0.028 -0.048*
[0.030] [0.058] [0.026]
SMERU Research Institute, December 2004 15
Mathematics Dictation Average
Performance
Score Score Score
Proportion of female teachers -0.156** 0.066 -0.076
[0.060] [0.130] [0.054]
Proportion of dissatisfied teachers -0.002 -0.03 -0.006
[0.014] [0.036] [0.014]
Proportion of teachers with above secondary-level education -0.021 0.007 0.009
[0.052] [0.112] [0.061]
School Condition and Characteristics
Main school language Indonesian 0.133* 0.761*** 0.252***
[0.074] [0.205] [0.069]
Main school language different than student -0.028 -0.329*** -0.097**
[0.049] [0.118] [0.040]
Average class size -0.143 -0.28 -0.173*
[0.108] [0.205] [0.095]
Pupil-teacher ratio 1.807*** 0.971 1.495**
[0.679] [1.749] [0.610]
Pupil-teacher ratio squared -0.282** -0.154 -0.231**
[0.108] [0.283] [0.097]
Paved road within school grounds 0.074 -0.456 -0.025
[0.140] [0.332] [0.135]
Paved road less than one hundred meters from school 0.134 -0.515 0.001
[0.128] [0.328] [0.127]
Paved road less than one kilometer from school 0.118 -0.637* -0.022
[0.131] [0.324] [0.141]
Library available at school 0.008 -0.152 -0.011
[0.057] [0.169] [0.060]
Has toilets 0.173** 0.253 0.158**
[0.080] [0.196] [0.075]
Has electricity 0.084 0.057 0.084
[0.086] [0.184] [0.081]
Has maps -0.135 -0.767 -0.252
[0.146] [0.511] [0.173]
Has a playground -0.168** -0.462*** -0.198***
[0.065] [0.173] [0.065]
Has a staff room 0.001 0.329 0.084
[0.086] [0.204] [0.078]
Regular teacher meetings 0.29** 0.684** 0.308**
[0.121] [0.335] [0.139]
Fees
Government transfer -0.004 0.019 -0.002
[0.012] [0.034] [0.012]
Total student fees -0.001 -0.01 -0.006
[0.013] [0.032] [0.012]
Monthly BP3 fee 0.038 -0.037 0.037
[0.026] [0.045] [0.026]

SMERU Research Institute, December 2004 16
Mathematics Dictation Average
Performance
Score Score Score
District Dummies
Pekanbaru 0.477*** 1.304** 0.515***
[0.159] [0.541] [0.181]
Rejang Lebong 0.33** 1.164** 0.361**
[0.157] [0.513] [0.179]
Bandung 0.214 1.377** 0.304*
[0.156] [0.540] [0.177]
Magelang 0.189 0.572 0.169
[0.190] [0.554] [0.191]
Surakarta 0.504*** 1.419** 0.474**
[0.168] [0.574] [0.190]
Tuban 0.408*** 1.602*** 0.524***
[0.149] [0.538] [0.168]
Pasuruan 0.406** 1.485** 0.432**
[0.164] [0.584] [0.185]
Cilegon 0.18 1.141* 0.303*
[0.147] [0.591] [0.182]
Lombok Tengah 0.036 0.838 0.236
[0.193] [0.526] [0.200]
Constant 1.31 4.225 2.206**
[1.111] [3.020] [1.020]
Observations 1089 1089 1089
R-squared 0.16 0.17 0.19
Note: Robust standard errors in brackets * significant at 10%; ** significant at 5%; *** significant at 1% Non-dummy variables are in log form Estimation using all three test results shows that female students performed significantly better on our test, confirming the unconditional relationship revealed in the quartile comparisons. The education level of fathers, while it has positive coefficients, does not significantly correlate to performance. By contrast, the education level of mothers appears to matter: Students whose mother completed any level of education performed significantly better in math than students with illiterate mothers, and those whose mothers completed high school performed significantly better on the dictation test. This finding is consistent with the existence of a strong inter-generational education link found in many other countries, although there is still controversy on its reasons between education spillover (e.g. Chevalier, 2003) and genetics (e.g. Black et al., 2003).
SMERU Research Institute, December 2004 17
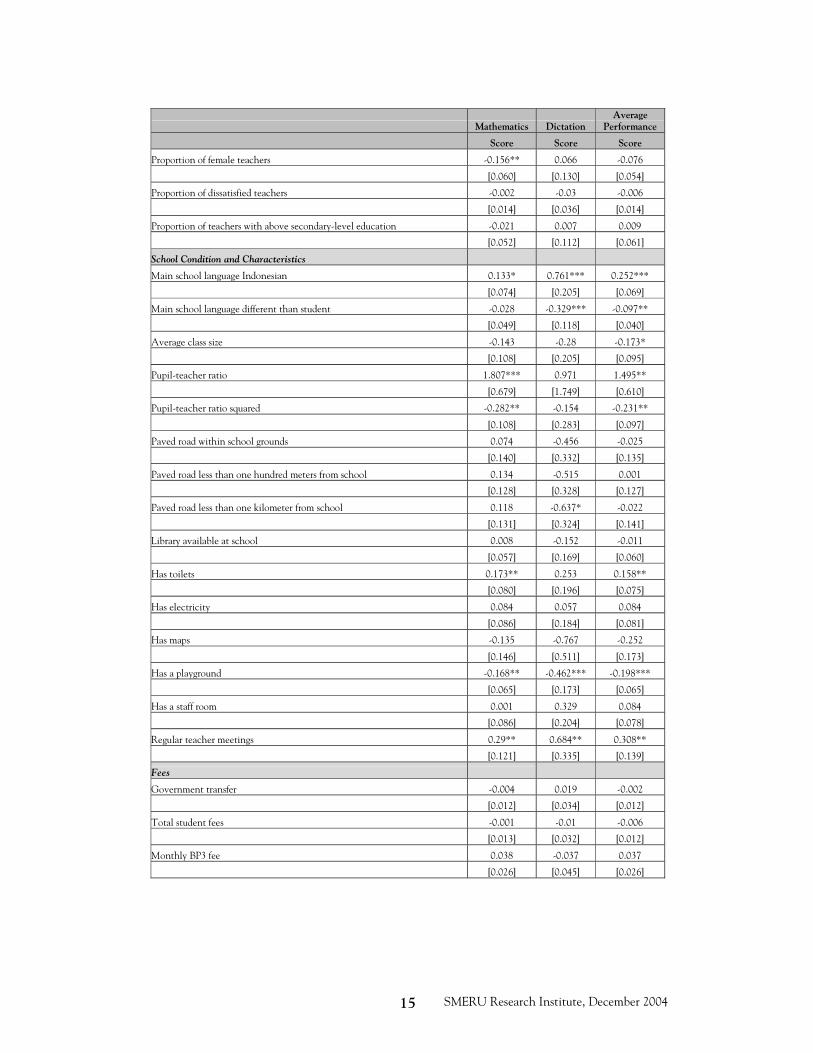
Several teacher characteristics correlate with performance. First, teacher absence significantly and negatively correlates with student performance on the math test, though not on the dictation test.10 Remembering that the regressor is the average absence rate for the school, the effect of absence of the child’s own teacher would presumably be much larger, although there were not enough observations over time to calculate the absence rate for 4th-grade teachers with any precision. This suggests that the absence of teachers from math-related subjects must be taken seriously. It may also point to a difference in the teacher’s role in developing a child’s mathematical and language skills. The dictation test only consisted of sentences being dictated, and students have more opportunities to acquire language skills (less so for math skills) outside of school, from parents and others. Because of the lack of data on teacher absence rates in the past, this is one of the first studies to verify empirically a link between teacher absenteeism and student performance.11 Other teacher variables also emerge as significant correlates. One is teacher experience: the significant quadratic teacher experience term in the math regressions suggests that experience may have an increasing marginal return over at least some range. Another, more ambiguous relationship is with a teacher’s contract status. The proportion of permanent teachers in schools is significant in both regressions, but with opposite effects: it negatively correlates with math scores but positively (although weakly) correlates with dictation scores. Hence, the overall correlation of the proportion of permanent teachers with average performance is insignificant. The outside employment of teachers also appears to matter. Attending a school with a higher proportion of teachers with a second job negatively correlates with math performance. (The correlation with dictation scores is also negative, but insignificant.) One obvious possibility is that this relationship is causal; teachers who moonlight cannot concentrate fully on teaching and hence do not teach their students as well. Other explanations are also possible, but it is a useful step forward to establish a correlation. Finally, the proportion of female teachers in a school has a negative and significant correlation with math performance. (The correlation with dictation performance is insignificant.) A simplistic interpretation of our results would be that females make better students but poorer teachers in math-related subjects, but the story is more complex than that. In Appendix 4, we segregate male and female students and run math performance regressions separately for each sub-sample. The results show that the proportion of female teachers does not correlate with the performance of female students but negatively and significantly correlates with male students’ performance. We leave the investigation of this phenomenon for future studies.
10 This is in accordance with Johnstone & Jiyono (1983) study in section III. 11 Others include Habyarimana et al. (2004) for Zambia and Kremer et al. (2004) for India.
SMERU Research Institute, December 2004 18
We turn now to school conditions and characteristics. First, the language used in the school was correlated with test performance. Students at schools that use Indonesian12 as their official language of instruction perform significantly better in all three dependent variables, even with the various controls that we have included. It is not surprising that these students performed better on the dictation test, given that it was conducted in Indonesian, but they also achieved significantly higher math scores. Along the same lines, students attending schools where instruction is in a different language from their mother tongue also received significantly lower scores on the dictation test. Math scores were however, not influenced by this second language variable; presumably because of the universality of numerical symbols. Another set of school variables relates to class size. One such measure that we included is the average fourth-grade class size. This variable has a negative and significant coefficient in the total-score regression (although the effect is insignificant for the separate math and dictation regressions), providing some support for the presumption that large classes have detrimental effects on student performance. A second measure is the pupil-teacher ratio for the school, calculated based on the total number of teaching staff (both permanent and contract teachers) and total enrollment reported by the principal. Surprisingly, the pupil-teacher ratio has a positive correlation with math test scores (and overall performance), while its square has a negative correlation. Simple calculations using the point estimates suggest that the student-teacher ratio that is associated with the highest overall performance is 25 - which is slightly higher than the actual average ratio for any of the student-performance quartiles reported in Appendix 2. This result is at odds with the usual assumption that lower pupil-teacher ratios always improve learning outcomes. A third set of school variables measures the accessibility to the school. The accessibility measure included in the regressions is proximity to a paved road, which may serve as a summary measure for the cost of transportation and travel to the school. This variable gives mixed results, for example, students at more accessible (or less remote) schools have higher average math scores, but lower average dictation scores. Fourth, in terms of school facilities, students at schools with at least one functioning toilet performed better on the math test. Interestingly, the effect is significant for girls, but not for boys. This is consistent with evidence from Bangladesh and elsewhere, where it has been argued that availability of toilets is particularly important in increasing the number of girls enrolled and their educational attainment (World Bank, 2001). The other significant facility variable is the availability of a playground, which is negatively correlated with performance. Since we do not have any data to further investigate the negativity of having a playground, we leave this for future studies.
12 The official language of Indonesia, sometimes also referred to as Bahasa Indonesia.

SMERU Research Institute, December 2004 19
Finally, in terms of school management, students at schools with recent staff meetings received higher scores on both the math and dictation tests. This result is simply suggestive at this point, but one interpretation might be that schools managed more actively by their principals - or, alternatively, those managed in a more participatory way - tend to perform better. Interestingly, none of the finance variables (transfers and fees) yielded significant coefficients. This means that although money is important, it is more important to ensure that it is spent on things that are significant for improving student performance.13
13 Toyamah and Usman (2004) showed that 95% of the government budget for education is earmarked to pay teachers’ salaries, leaving virtually nothing for other expenditures.

SMERU Research Institute, December 2004 20
VI. CONCLUSION This paper estimates empirically the determinants of student performance in public schools in Indonesia, using a nationally representative sample of fourth graders. We modeled performance using a common firm production function model, and ran three sets of regressions using three different dependent variables: each student’s math score, dictation score, and the combined average score. The data for this study came from a survey of schools in ten districts in eight provinces, selected through stratified clustered random sampling at the national level, which was conducted by the SMERU Research Institute and World Bank in 2002-2003. All three sets of estimations yielded broadly similar results. One interesting finding is that higher teacher absence significantly correlates with poorer student performance in the math test and the average score. Because prior studies lacked access to data on teacher absence in Indonesia, this correlation has not been observed before. While our data does not allow us to establish causality, this result is consistent with the view that teacher absenteeism is either a cause or a symptom of problems related to service delivery in the education sector. A companion paper using this dataset explores in detail the extent and possible causes of teacher absenteeism, with a view to suggesting policies that might reduce the absenteeism rate (Rogers et al., 2004) and increase the quality of schooling. Among student-specific variables, the significant predictors of performance are the child’s sex - with girls scoring higher - and the education levels of parents. The positive correlation with parental education is consistent with results from other countries, but still useful in underlining the future spillovers from investment in the human capital of one generation. In general, the teacher and school characteristics variables which correlate with performance met our expectations, such as the negative coefficients of the proportion of teachers who have other occupations, class size, and the different languages at school and at home, and the positive coefficients of functioning toilets. There are however, other interesting results, such as the negative correlation between a student’s dictation ability and proportion of permanent teachers and the mixed results on the coefficients of facilities variables like proximity to paved roads and the existence of playgrounds. Another result that should be reiterated is the non-monotonicity of the correlation with pupil-teacher ratio. If we could interpret this result causally, it would suggest that too few students in a class might be as detrimental as too many, and that the optimal ratio is in between. While intriguing, this result clearly requires further exploration. It is possible that the effect of pupil-teacher ratios on performance is actually monotonically negative, but that low ratios are correlated with unmeasured variables that worsen student performance. We have tried to account for such variables here, which include the remoteness of the school, but we cannot guarantee that we have succeeded fully.

SMERU Research Institute, December 2004 21
Another interesting result is the insignificance of the fees variables. This implies that any effect of financial support in improving student performance is mediated entirely by the school and teacher characteristics variables included in the regression. Of course, it makes sense that money should be important if, and only if, it is used to enhance the quantity and quality of schools and teachers; but what is interesting is the relatively small number of regressors that apparently captured these quantity and quality dimensions effectively. By contrast, it is also surprising to see that indicators like the proportion of teachers above SPG is insignificant in all specifications and the proportion of teachers dissatisfied with their salaries is also insignificant. This means that teachers who are dissatisfied with their salaries provide the same level of input to student performance as the satisfied ones. In addition, teachers who have training above the SPG level do not provide any significantly better improvement in student performance than those only of SPG level or below. Our results highlight several policies for raising student achievement that may warrant further investigation. One is improving school facilities, and not just those directly related to pedagogy. Girls at schools with functioning toilets have significantly higher scores, in a result that echoes findings in South Asia linking toilet facilities to the number of girls enrolled and their educational attainment. Second, it is likely that reducing teacher absence would raise student performance. We recognize that poor performance and high absenteeism may both stem from the same underlying factors, such as poor school management and unmotivated students, but the effect persists even when we include proxies for those factors. Third, reducing the incidence of teachers’ outside employment may improve their students’ performance. Fourth, there is no robust evidence, after controlling for absence,14 that schools with more permanent teachers (as opposed to contract teachers) perform better. This finding might encourage experimentation with greater use of contract teachers, on the condition that their high absenteeism rate is significantly lowered. Finally, the results provide some evidence that pupil-teacher ratios below the current average level are not associated with better performance, ceteris paribus; it is worth exploring further the possibility that educational resources might better be spent elsewhere. This analysis is a first attempt at understanding the degree and sources of variation in student performance in Indonesia, and further work is clearly necessary. First, there are a number of other variables that should be tested for correlation with performance once the data become available. For example, other student-specific variables that seem likely to improve performance include: the student’s time allocation (to work and study) outside school (even if this is somewhat endogenous); parental financial or tutoring assistance for students; and the number of siblings and birth order. Second, our data were cross-sectional, it would be ideal to be able to retest the same students and generate a panel dataset, so that we could investigate the correlates of educational value-added. As we have reiterated above, there is still much work to be done before we can obtain an adequate knowledge of how to increase the quality of education in Indonesia. We hope, however, that this paper has made a useful initial contribution.
14 Non-regular teachers have higher absenteeism rates than regular teachers in Indonesia (Rogers et al., 2004).
SMERU Research Institute, December 2004 22
REFERENCES Ahmad, Alia. 2003. “Inequality in the Access to Education and Poverty in
Bangladesh.” Part of the Access to Secondary Education and Poverty Reduction in Bangladesh project.
Angrist, Joshua and Victor Lavy. 1999. “Using Maimonides’ Rule to Estimate the
Effect of Class-size on Scholastic Achievement,” Quarterly Journal of Economics, 114(3), pp.1047-84.
Archer, J. 1999. “Sanders 101”. Education Week, 17(23), pp.24. Armentano, Dominick. 2003. “Let’s Re-think Class-size Amendment”. Cato
Institute, Washington D.C. http://www.cato.org/cgi-bin/scripts/printtech.cgi/dailys/08-10-03.html
Asadullah, M Niaz. 2002. “Class Size and Student Achievement in Developing
Countries: Evidence from Bangladesh”. Paper to the METU International Conference in Economic VI, Turkey.
Black, S.E., P.J. Devereux, and K.G. Salvanes. 2003. “Why the Apple Doesn’t Fall
Far: Understanding the Intergenerational Transmission of Human Capital”, NBER Working Paper no. 10066. National Bureau of Economic Research, Cambridge, MA.
Buckingham, Jennifer. 1999. “The Puzzle of Boys’ Educational Decline: A Review of
the Evidence”. Issue Analysis No. 9. Buckingham, Jennifer. 2003. “Let’s Make a Start to Fix Boy Troubles.” The Centre for
Independent Studies Executive Highlights No. 162. Published in The New Zealand Herald 26 November 2003.
Chevalier, A. 2003. “Parental Education and Child’s Education: A Natural
Experiment”, mimeo. Dublin: Institute for the Study of Social Change, University College Dublin.
Darling-Hammond, L. 2000. “Teacher Quality and Student Achievement: A Review
of State Policy Evidence”. Educational Policy Analysis Archives, 8(1). Department of National Education of the Republic of Indonesia. 2003. Proyeksi
Pendidikan (TK, SLB, SD, SLTP, SM, PT, dan PLS) Tahun 2002/2003. Pusat Data dan Informasi Pendidikan, Badan Penelitian dan Pengembangan, Departemen Pendidikan Nasional, Jakarta.
Duflo, Esther. 2001. “Schooling and Labor Market Consequences of School
Construction in Indonesia: Evidence from An Unusual Policy Experiment.” American Economic Review, 94(1), pp. 795-813.

SMERU Research Institute, December 2004 23
Ferreira, Pedro and Samuel de Abreu Pessôa. 2002. “Can the Cost of Education
Explain the Poverty of Nations? Measuring the Impact of Factors Taxation and Life Expectancy on Income Differences.” University of Pennsylvania Center for Analytic Research in Economics and the Social Science Working Paper #02-04. University of Pennsylvania, Philadelphia.
Government of Indonesia. 1997/1998. Petunjuk Pelaksanaan Wajib Belajar Pendidikan
Dasar Sembilan Tahun [Guidance on the Implementation of Compulsory Nine-year Basic Education]. Government of Indonesia, Jakarta.
Graddy, Kathryn and Margaret Stevens. 2003. “The Impact of School Inputs on
Student Performance: An Empirical Study of Private Schools in the United Kingdom”. mimeo. University of Oxford, Oxford.
Habyarimana, James, Jishnu Das, Stefan Dercon, and Pramila Krishnan. 2004. "Sense
and Absence: Absenteeism and Learning in Zambian Schools." World Bank: Washington, DC.
Hanushek, Eric, John F. Kain, Jacob M. Markman, and Steven G. Rivkin. 2001.
“Does Peer Ability Affect Student Achievement?” National Bureau of Economic Research Working Paper No. 8502. National Bureau of Economic Research, Cambridge.
Hanushek, Eric. 1995. “Interpreting Recent Research on Schooling in Developing
Countries”. World Bank Research Observer, 10(2), pp. 227-246. Hoxby, Caroline. 2000a. “The Effects of Class Size on Student Achievement: New
Evidence from Population Variation”. The Quarterly Journal of Economics, 115(4), pp. 1239-1285.
Hoxby, Caroline. 2000b. “Peer Effects in the Classroom: Learning from Gender and
Race Variation”. NBER Working Paper No. 7867, 1-54. National Bureau of Economic Research, Cambridge.
Jones, Anthony. 2001. “Recent Findings in the Economics of Education Reform and
Prospective Work at the Jim Self Center On The Future” mimeo. Johnstone, James and Jiyono. 1983. “Out-of-school Factors and Educational
Achievement in Indonesia.” Comparative Education Review, 27(2), pp. 278-295.
Kingdon, Geeta. 1996. “The Quality and Efficiency of Public and Private Schools: A
Case Study of Urban India.” Oxford Bulletin of Economics and Statistics, 58(1), pp 55-80.
Kingdon, Geeta and Francis Teal. 2002. “Does Performance Related Pay for Teachers
Improve Student Performance? Some Evidence From India.” Centre for the Study of African Economies Series Ref: WPS/2002—06.

SMERU Research Institute, December 2004 24
Kremer, Michael, Karthik Muralidharan, Nazmul Chaudhury, Jeffrey Hammer, and F. Halsey Rogers. 2004. "Teacher Absence in India." World Bank, Washington DC.
Mohandas, Ramon. 2000. “Report on the Third International Mathematics and
Science Study (TIMSS).” National Institute for Research and Development of the Ministry of National Education, Jakarta. mimeo.
OECD. 2001. Knowledge and Skills for Life: First Results from the OECD Programme for
International Student Assessment (PISA) 2000. Rogers, F Halsey, Asep Suryahadi, Sudarno Sumarto, Syaikhu Usman, Nazmul
Chaudhury, Jeffrey Hammer, Michael Kremer, and Karthik Muralidharan. 2004. "Measuring and Understanding Teacher Absence in Indonesia." World Bank, Washington DC.
Sanders, W. 1999. “Teachers, teachers, teachers!” Blueprint Magazine No. 4. Sudjarwo. 2003. Draft I: Kebijakan Penanggulangan Kemiskinan yang Terfokus,
Terintegrasi dan Sinergi Serta Berkelanjutan Untuk Mencapai Sasaran Pendidikan Untuk Semua 2015 [Draft I : Focused, Integrated, Synergic, and Sustainable Poverty Reduction Policy to Achieve the Target of Education for All]. Jakarta.
Toyamah, Nina and Syaikhu Usman. 2004. “Alokasi Anggaran Pendidikan di Era
Otonomi Daerah: Implikasinya terhadap Pengelolaan Pelayanan Pendidikan Dasar.” [Education Budget Allocation in the Era of Regional Autonomy: Its Implications on Basic Education Service Management] Laporan Lapangan SMERU. Lembaga Penelitian SMERU, Jakarta.
UNICEF. 2003. “Making Progress on Girls Education in Malawi”. Teachers Talking
About Learning. http://www.unicef.org/teachers/. Urquiola, Miguel. 2001. “Identifying Class-size Effect in Developing Countries:
Evidence from Rural Schools in Bolivia”. World Bank, Washington D.C. World Bank. 2003. World Development Report 2004: Making Services Work for Poor
People. World Bank, Washington D.C.
SMERU Research Institute, December 2004 25
APPENDICES

SMERU Research Institute, December 2004 26
Appendix 1 Variables Description
Dependent Variables scoremath score in mathematics test scoreword score in words test performance average score of mathematics and words test Sex female dummy of sex. 0 = male, 1 = female Parents Quality and Attention meet parents dummy of whether teachers have met parents within the past 6 months FE_Cannot_Read dummy that has the value of 1 if the father cannot read FE_Unspecified_Edu_Level dummy that has the value of 1 if the father education level is unknown FE_Not_Comp_SixGr dummy that has the value of 1 if the father education level is below primary level FE_Comp_SixGr dummy that has the value of 1 if the father finished primary level education FE_Comp_Jun_School dummy that has the value of 1 if the father finished junior high level education FE_HS_above dummy that has the value of 1 if the father finished high school or above ME_Cannot_Read dummy that has the value of 1 if the mother cannot read ME_Unspecified_Edu_Level dummy that has the value of 1 if the mother education level is unknown ME_Not_Comp_SixGr dummy that has the value of 1 if the mother education level is below primary level ME_Comp_SixGr dummy that has the value of 1 if the mother finished primary level education ME_Comp_Jun_School dummy that has the value of 1 if the mother finished junior high level education ME_HS_above dummy that has the value of 1 if the mother finished high school or above extra_courses dummy of whether the student is taking extracurricular courses Teacher Quality and Condition abs_rate_total total absence rates for teachers in a school avg_experience average experience of teachers in a school in years prop_perm_teacher proportion of permanent teachers in a school prop_teacher_othjobs proportion of teachers who have other occupations prop_female_teacher proportion of female teachers prop_teacher_diss proportion of teachers who are dissatisfied with salary prop_teacher_above_SPG proportion of teachers who are above SPG School Condition and Characteristics main_lang_indo dummy of whether school official language is Indonesian main_lang_diff dummy of whether school official language is different from majority of students' mother tongue avg_class_size average size of fourth grade class in a school student_per_teacher student per teacher ratio in a school paved_road_within dummy of whether there is paved road within school complex paved_road_one_hun_met dummy of whether there is paved road within one hundred meters from school paved_road_one_km dummy of whether there is paved road between one hundred meters and one kilometer library_avail dummy of whether a library is available in school has_toilet dummy of whether school has one functioning toilet has_electric dummy of whether school has access to electricity has_maps dummy of whether school has maps and charts has_playground dummy of whether school has playground has_staffroom dummy of whether school has staffroom teacher_meet dummy of whether staff meeting has occurred within the past 6 months Fees amount_received amount of government transfer received in 2001/2002 total_fees average monthly fees for exam and other fees charged to students monthly_BP_fee average monthly BP fee
SMERU Research Institute, December 2004 27
Appendix 2 Descriptive Characteristics of Variables Based on Math Scores Quartiles
Variable Math Scores
Quartiles of Math Scores Total 1st quart 2nd quart 3rd quart 4th quart
scoremath
Mean 40.6957 65.24321 80.2319 94.05466 70.07841 Standard Deviation 13.18389 4.528178 3.815454 4.978185 21.21133
female 0.4522059 0.5 0.5073529 0.5677656 0.5068871 meet parents 0.5551471 0.625 0.6580882 0.6776557 0.6290174 FE_Unspeci~l 0.1507353 0.0882353 0.1286765 0.0769231 0.1111111 FE_Cant_Re~r 0.1176471 0.0625 0.0808824 0.0695971 0.0826446 FE_Not_Com~r 0.0477941 0.0294118 0.0147059 0.007326 0.0247934 FE_Comp_Si~r 0.3566176 0.4080882 0.3419118 0.2747253 0.3452709 FE_Comp_Ju~l 0.1580882 0.1544118 0.1617647 0.1684982 0.1606979 FE_HS_above 0.1691176 0.2573529 0.2720588 0.4029304 0.2754821 ME_Unspeci~l 0.2095588 0.0845588 0.1580882 0.1135531 0.1414141 ME_Cant_Re~r 0.1397059 0.0955882 0.0919118 0.0915751 0.1046832 ME_Not_Com~r 0.0551471 0.0404412 0.0257353 0.003663 0.0312213 ME_Comp_Si~r 0.3823529 0.4375 0.3897059 0.3589744 0.3921028 ME_Comp_Ju~l 0.1066176 0.1617647 0.1580882 0.1391941 0.1414141 ME_HS_above 0.1066176 0.1801471 0.1764706 0.2930403 0.1891644 extra_cour~s 0.1066176 0.1397059 0.1544118 0.2124542 0.1533517 abs_rate_t~l 0.2194447 0.2004129 0.176125 0.1929663 0.1972333 abs_rate_v~1 0.2127027 0.199383 0.1860406 0.1952362 0.1983378 abs_rate_v~2 0.2261866 0.2014427 0.1662094 0.1906964 0.1961288 avg_experi~e 17.42457 18.13212 18.40627 18.30286 18.06667 prop_perm_~r 0.9328064 0.931025 0.9045338 0.9035799 0.917973 prop_teac~bs 0.415204 0.4516252 0.4487833 0.4395701 0.4387964 prop_femal~r 0.5806431 0.6364867 0.6414273 0.6523475 0.6277488 prop_teac~ss 0.3627931 0.3283378 0.298013 0.2958649 0.3212289 prop_teach~G 0.6354897 0.6605455 0.6934309 0.6787334 0.6670606 main_lang_~o 0.9816176 0.9669118 0.9595588 0.981685 0.9724518 main_lang_~f 0.8235294 0.7867647 0.6838235 0.6776557 0.7428834 avg_class_~e 32.70772 31.60846 33.12684 35.08608 33.13407 student_pe~r 23.89514 23.27985 21.89617 22.35432 22.85591 paved_road~n 0.125 0.1911765 0.2573529 0.2710623 0.2112029 paved_road~t 0.5404412 0.5551471 0.5514706 0.4945055 0.5353535 pav~d_one_km 0.2352941 0.1948529 0.1470588 0.1941392 0.1928375 pav~e_one_km 0.0992647 0.0588235 0.0441176 0.040293 0.0606061 library_av~l 0.6102941 0.6691176 0.6838235 0.7655678 0.6822773 has_toilet 0.7977941 0.8860294 0.8897059 0.9267399 0.8751148 has_electric 0.8125 0.8455882 0.9007353 0.8681319 0.8567493 has_maps 0.9301471 0.9080882 0.9191176 0.9120879 0.9173554 has_playgr~d 0.9411765 0.9264706 0.9411765 0.9230769 0.932966 has_staffr~m 0.875 0.875 0.8933824 0.9194139 0.8907254 teacher_meet 0.9595588 0.9338235 0.9485294 0.952381 0.9485767
SMERU Research Institute, December 2004 28
amount_rec~d 4.289671 3.508692 3.876523 4.136292 3.952963 total_fees 12.33474 17.50487 19.84963 20.78642 17.62182 monthly_BP~e 2.752328 3.496936 4.701562 5.764805 4.180364 Pekanbaru 0.0441176 0.0955882 0.0919118 0.0989011 0.0826446 Rejang_Leb~g 0.1323529 0.1433824 0.0845588 0.043956 0.1010101 Bandung 0.0625 0.0698529 0.0992647 0.0989011 0.0826446 Magelang 0.0772059 0.0735294 0.0845588 0.0952381 0.0826446 Surakarta 0.0110294 0.0367647 0.1213235 0.1611722 0.0826446 Tuban 0.0588235 0.0845588 0.1176471 0.1062271 0.0918274 Pasuruan 0.0625 0.1286765 0.1727941 0.1611722 0.1313131 Cilegon 0.2463235 0.1691176 0.1066176 0.1025641 0.1561065 Lombok_Ten~h 0.1544118 0.0845588 0.0477941 0.0805861 0.0918274 Gowa 0.1507353 0.1139706 0.0735294 0.0512821 0.097337 Note: for dummy and district variables, the numbers in each quartile show proportion.

SMERU Research Institute, December 2004 29
Appendix 3 Descriptive Characteristics of Variables Based on Dictation Scores Quartiles
Variable Dictation Scores Quartiles of Dictation Scores Total 1st quart 2nd quart 3rd quart 4th quart
scoreword
Mean 54.83047 88.27614 95.76185 99.32845 84.5628Standard Deviation 25.94424 2.965011 1.599187 1.191486 21.93969
female 0.4264706 0.4742647 0.5514706 0.5750916 0.5068871 meet parents 0.5955882 0.6286765 0.6213235 0.6703297 0.6290174FE_Unspeci~l 0.0992647 0.0992647 0.1323529 0.1135531 0.1111111FE_Cant_Re~r 0.1507353 0.0625 0.0551471 0.0622711 0.0826446FE_Not_Com~r 0.0330882 0.0330882 0.0220588 0.010989 0.0247934FE_Comp_Si~r 0.3492647 0.4375 0.2904412 0.3040293 0.3452709FE_Comp_Ju~l 0.1727941 0.1580882 0.1764706 0.1355311 0.1606979FE_HS_above 0.1948529 0.2095588 0.3235294 0.3736264 0.2754821ME_Unspeci~l 0.0992647 0.1286765 0.1727941 0.1648352 0.1414141ME_Cant_Re~r 0.1360294 0.1029412 0.0992647 0.0805861 0.1046832ME_Not_Com~r 0.0477941 0.0367647 0.0147059 0.025641 0.0312213ME_Comp_Si~r 0.4558824 0.4595588 0.3455882 0.3076923 0.3921028ME_Comp_Ju~l 0.1397059 0.1323529 0.1433824 0.1501832 0.1414141ME_HS_above 0.1213235 0.1397059 0.2242647 0.2710623 0.1891644extra_cour~s 0.0625 0.1433824 0.1875 0.2197802 0.1533517 abs_rate_t~l 0.19557 0.1956644 0.2045956 0.1931182 0.1972333abs_rate_v~1 0.1944927 0.2044785 0.2023026 0.1921001 0.1983378abs_rate_v~2 0.1966474 0.1868503 0.2068886 0.1941362 0.1961288avg_experi~e 18.18899 18.01937 18.09909 17.95962 18.06667prop_perm_~r 0.9221383 0.9309075 0.9128812 0.9060091 0.917973prop_teac~bs 0.4710445 0.4389298 0.4285807 0.4167117 0.4387964prop_femal~r 0.5666197 0.6207452 0.6512413 0.6722253 0.6277488prop_teac~ss 0.3710442 0.3259678 0.2907369 0.2972548 0.3212289prop_teach~G 0.6012502 0.643984 0.6993319 0.723469 0.6670606 main_lang_~o 0.9705882 0.9558824 0.9705882 0.992674 0.9724518main_lang_~f 0.8897059 0.8051471 0.6433824 0.6336996 0.7428834avg_class_~e 29.94669 30.38787 35.75 36.43956 33.13407student_pe~r 22.28399 22.30033 23.27491 23.5618 22.85591paved_road~n 0.1139706 0.1727941 0.2867647 0.2710623 0.2112029paved_road~t 0.5661765 0.5919118 0.4632353 0.5201465 0.5353535pav~d_one_km 0.2132353 0.1691176 0.2095588 0.1794872 0.1928375pav~e_one_km 0.1066176 0.0661765 0.0404412 0.029304 0.0606061library_av~l 0.6029412 0.6654412 0.7205882 0.7399267 0.6822773has_toilet 0.8161765 0.875 0.8970588 0.9120879 0.8751148has_electric 0.7316176 0.8382353 0.9007353 0.956044 0.8567493has_maps 0.9080882 0.9338235 0.9044118 0.9230769 0.9173554has_playgr~d 0.9779412 0.9338235 0.9044118 0.9157509 0.932966has_staffr~m 0.8676471 0.9080882 0.8933824 0.8937729 0.8907254teacher_meet 0.9191176 0.9669118 0.9558824 0.952381 0.9485767

SMERU Research Institute, December 2004 30
amount_rec~d 2.782289 3.997748 4.385346 4.643929 3.952963total_fees 13.80276 17.45977 18.35625 20.85662 17.62182monthly_BP~e 2.461918 3.414553 5.40144 5.438919 4.180364 Pekanbaru 0.0477941 0.0588235 0.0955882 0.1282051 0.0826446Rejang_Leb~g 0.1617647 0.1176471 0.0772059 0.047619 0.1010101Bandung 0.0220588 0.0551471 0.1066176 0.1465201 0.0826446Magelang 0.1764706 0.0919118 0.0477941 0.014652 0.0826446Surakarta 0.0110294 0.0441176 0.1507353 0.1245421 0.0826446Tuban 0.0330882 0.0992647 0.1029412 0.1318681 0.0918274Pasuruan 0.1066176 0.1727941 0.1360294 0.1098901 0.1313131Cilegon 0.1433824 0.1617647 0.1470588 0.1721612 0.1561065Lombok_Ten~h 0.1397059 0.1139706 0.0514706 0.0622711 0.0918274Gowa 0.1580882 0.0845588 0.0845588 0.0622711 0.097337Note: for dummy and district variables, the numbers in each quartile show proportion.
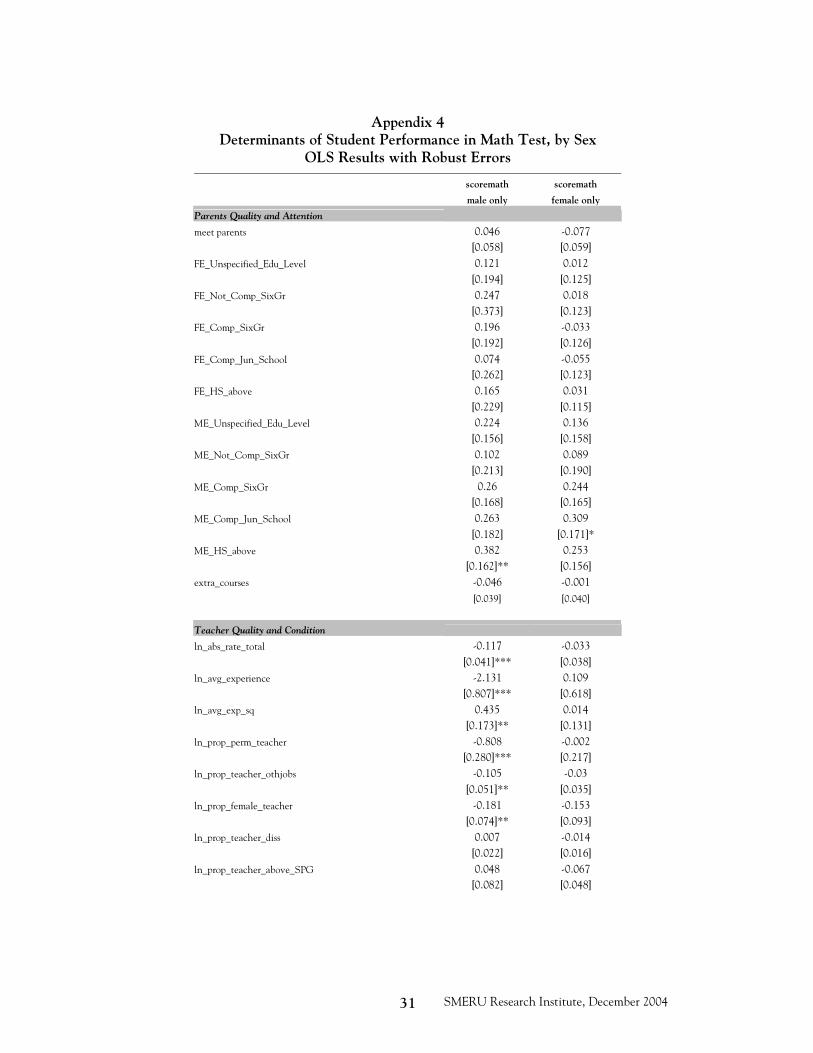
SMERU Research Institute, December 2004 31
Appendix 4 Determinants of Student Performance in Math Test, by Sex
OLS Results with Robust Errors
scoremath scoremath
male only female only
Parents Quality and Attention
meet parents 0.046 -0.077 [0.058] [0.059] FE_Unspecified_Edu_Level 0.121 0.012 [0.194] [0.125] FE_Not_Comp_SixGr 0.247 0.018 [0.373] [0.123] FE_Comp_SixGr 0.196 -0.033 [0.192] [0.126] FE_Comp_Jun_School 0.074 -0.055 [0.262] [0.123] FE_HS_above 0.165 0.031 [0.229] [0.115] ME_Unspecified_Edu_Level 0.224 0.136 [0.156] [0.158] ME_Not_Comp_SixGr 0.102 0.089 [0.213] [0.190] ME_Comp_SixGr 0.26 0.244 [0.168] [0.165] ME_Comp_Jun_School 0.263 0.309 [0.182] [0.171]* ME_HS_above 0.382 0.253 [0.162]** [0.156] extra_courses -0.046 -0.001 [0.039] [0.040]
Teacher Quality and Condition
ln_abs_rate_total -0.117 -0.033 [0.041]*** [0.038] ln_avg_experience -2.131 0.109 [0.807]*** [0.618] ln_avg_exp_sq 0.435 0.014 [0.173]** [0.131] ln_prop_perm_teacher -0.808 -0.002 [0.280]*** [0.217] ln_prop_teacher_othjobs -0.105 -0.03 [0.051]** [0.035] ln_prop_female_teacher -0.181 -0.153 [0.074]** [0.093] ln_prop_teacher_diss 0.007 -0.014 [0.022] [0.016] ln_prop_teacher_above_SPG 0.048 -0.067 [0.082] [0.048]

SMERU Research Institute, December 2004 32
School Condition and Characteristics
main_lang_indo 0.05 0.093 [0.141] [0.088] main_lang_diff -0.002 -0.01 [0.070] [0.060] ln_avg_class_size -0.357 0.145 [0.146]** [0.187] ln_student_per_teacher 3.075 1.569 [0.876]*** [0.980] ln_stu_teach_sq -0.483 -0.258 [0.138]*** [0.150]* paved_road_within 0.109 -0.056 [0.192] [0.148] paved_road_one_hun_met 0.115 0.045 [0.179] [0.138] paved_road_one_km 0.161 -0.006 [0.188] [0.141] library_avail 0.06 -0.065 [0.082] [0.061] has_toilet 0.044 0.334 [0.117] [0.100]*** has_electricity 0.07 0.13 [0.122] [0.133] has_maps -0.233 -0.097 [0.215] [0.137] has_playground -0.225 -0.028 [0.128]* [0.069] has_staffroom 0.077 -0.095 [0.120] [0.101] teacher_meet 0.502 0.084 [0.230]** [0.086]
Fees
ln_amount_received -0.027 0.008 [0.018] [0.013] ln_total_fees -0.019 0.008 [0.018] [0.018] ln_monthly_BP_fee 0.099 -0.038 [0.040]** [0.033]
District Dummies
Pekanbaru 0.513 0.54 [0.254]** [0.202]*** Rejang_Lebong 0.316 0.401 [0.231] [0.193]** Bandung 0.132 0.422 [0.219] [0.186]** Magelang -0.023 0.368 [0.284] [0.197]* Surakarta 0.422 0.706 [0.241]* [0.215]*** Tuban 0.392 0.476 [0.208]* [0.184]**

SMERU Research Institute, December 2004 33
District Dummies
Pasuruan 0.322 0.646 [0.228] [0.216]*** Cilegon 0.134 0.314 [0.196] [0.201] Lombok_Tengah 0.122 -0.057 [0.323] [0.234]
Constant 1.46 -0.165 [1.382] [1.306]
Observations 537 552 R-squared 0.22 0.19 Robust standard errors in brackets
* significant at 10%; ** significant at 5%; *** significant at 1%
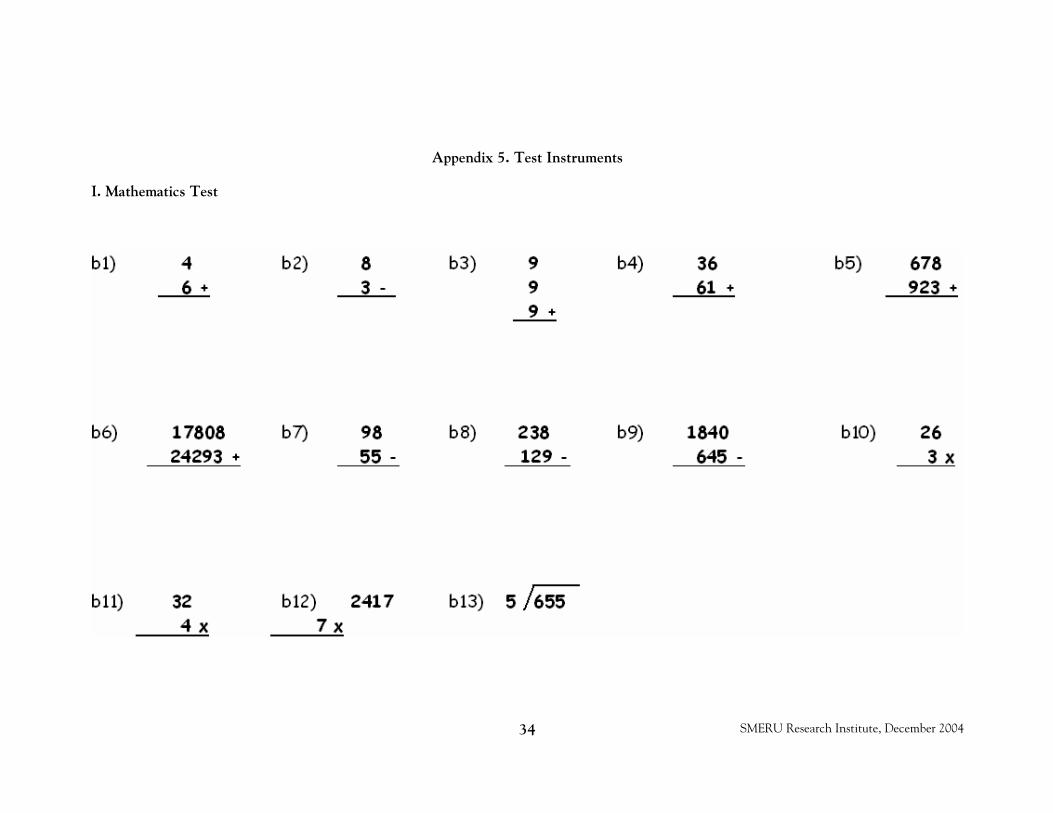
SMERU Research Institute, December 2004 34
Appendix 5. Test Instruments
I. Mathematics Test

SMERU Research Institute, December 2004 35
II. Dictation Test
This test consists of a dictation of these sentences (in Bahasa Indonesia):
Mengapa tanaman menjadi kering tanpa air? Manusia membutuhkan makanan dan air supaya menjadi kuat dan sehat, begitu juga tanaman. Tanaman hijau menggunakan air untuk membuat makanannya. Tanaman yang tidak mendapat air akan layu dan menjadi kering.