determinants of chronic energy deficiency and overweight...
TRANSCRIPT
Philippine Journal of Science146 (1): 47-63, March 2017ISSN 0031 - 7683Date Received: ?? Feb 20??
Key words: chronic energy deficiency, double burden of malnutrition, Filipino mothers, maternal health, maternal undernutrition, maternal overnutrition, obesity, overweight
Determinants of Chronic Energy Deficiency and Overweight/Obesity Among Non-Pregnant Mothers
19 Years and Older in the Philippines
Nutritional Assessment and Monitoring Division Food and Nutrition Research Institute, Department of Science and Technology
Bicutan, Taguig City, Philippines
*Corresponding author: [email protected]
Eva A. Goyena*, Ma. Lynell Valdeabella-Maniego, and Mildred O. Guirindola
The study aimed to identify household and maternal characteristics associated with chronic energy deficiency (CED) and overweight/obesity among non-pregnant mothers 19 years old and above in the Philippines. Cross-sectional analysis of the “2011 Updating of the Nutritional Status of Filipino Children and Other Population Groups”, a nationwide nutrition survey conducted by the Food and Nutrition Research Institute of the Department of Science and Technology (FNRI-DOST), was done using descriptive, bivariate and logistic regression analyses. Results showed that overweight/obesity prevalence (Body Mass Index/BMI)>25.0 kg/m2) was three-folds higher (31.2%) than CED (BMI<18.5) prevalence (10.0%). Single mothers (adjusted Odds Ratio/aOR 1.52, 95% CI=1.13-2.05), mothers with live-in status (aOR 1.39, 95% CI=1.15-1.66) and 19- to 29-year-old mothers (aOR 1.22, 95% CI=1.01-1.48) were more likely to have CED than their counterparts from other marital and age groups. On the other hand, the risk of becoming overweight/obese was found to be higher for mothers 40 years and older (aOR 1.26, 95% CI=1.06-1.50), had at least elementary education (aOR 1.23, 95% CI=1.04-1.45 ), from the richest wealth quintile (aOR 1.44; 95% CI=1.20-1.72) and from households with less than five members (aOR 1.17; 95% CI=1.05-1.32) than their counterparts in other age, educational attainment, wealth quintile and household size groups. The study provides evidence on the emerging double burden of malnutrition among Filipino mothers based on BMI classification. These findings may provide insights to strategies and advocacies that promote healthy lifestyle to improve the nutritional status of Filipino mothers.
INTRODUCTIONThe nutritional status of a mother has profound health effects that span throughout the human life stage, highlighting its importance as an indicator of her overall health and survival, a predictor of pregnancy outcome and fetal growth and an influencing factor in subsequent
early childhood survival, growth and development (Black et al. 2013). Maternal undernutrition, indicated by a body mass index (BMI) less than 18.5 kg/m2, short stature and micronutrient deficiencies, is associated with short and long term consequences, including increased risk of complications during delivery, higher risk of giving birth to small-for-gestational-age (SGA) infants, higher risk of childhood stunting in the first year of life, increased
47
risk of childhood infections (e.g., diarrhea, pneumonia and measles), impaired cognitive development, lower educational attainment, diminished work capacity and economic productivity (Black et al. 2008) and increased susceptibility to obesity and chronic non-communicable diseases (NCDs) in adult life (Victora et al. 2008). On the other end of the spectrum, maternal overweight/obesity (BMI≥25.0 kg/m2) can lead to maternal and fetal complications during pregnancy, delivery and post-partum (Van Lieshout et al. 2011), including pre-eclampsia (Tarloni et al. 2009; Tsoi et al. 2010; Sohlberg et al. 2012) and higher risk of gestational diabetes, metabolic syndrome and cardiovascular disease (O’ Sullivan 1982). In the post-partum period, obese women are more likely to have delayed or failed lactation and greater weight retention than women of normal weight (Temple and Murphy 2010).
Globally, the consequences of poor maternal nutritional status are reflected in the high maternal and child mortality and morbidity. More than 3.5 million mothers and children less than 5 years of age die unnecessarily each year due to the underlying cause of undernutrition, mostly in Asia and Sub-Saharan Africa (Black et al. 2008; Senbanjo et al. 2013). In Asia, maternal undernutrition continues to be neglected, contributing to the high overall rate of low birth weight (LBW), which tops other world regions in both percentage and absolute number of live births affected from 18% in 2005 to 30% in 2010 (Black et al. 2008; Black et al. 2013; Chaparro et al. 2014).
In the Philippines, where the double burden of malnutrition (DBM) is a major public health concern, the increasing prevalence of overweight and obesity has exceeded the rate of maternal CED from 2008 to 2013 (FNRI-DOST 2015a). Despite some progress, maternal anemia with low hemoglobin (<11 g/dL) remains a public health problem affecting pregnant (24.6%) and lactating women (16.7%) (FNRI-DOST 2013a). Iodine deficiency disorders (IDD) based on median urinary iodine excretion (UIE) and the proportion of population with median UIE of less than 50 mg/dL indicate mostly insufficient iodine nutrition among pregnant and lactating mothers (FNRI-DOST 2013b). Of all seven Southeast Asian countries, the Philippines has the highest level (21%) of low birth weight infants (Chaparro et al. 2014), underlining the significant role of maternal nutritional status before and during pre-natal period in the development of malnourished children.
In Asia Pacific countries, including the Philippines, addressing DBM and its complications caused primarily by changes in dietary pattern faces serious challenges (WHO 2014). In response, the Philippine government through the Department of Health (DOH) has recently developed the Strategic Framework for Comprehensive Nutrition Implementation 2014-2025 to ensure substantial
and sustainable public health impacts of identified set of interventions and approaches across the human life course, including improving maternal nutrition (DOH 2014). The strategic framework also aids in meeting the 2nd Sustainable Development Goal (SDG), set by the United Nations Standing Committee on Nutrition in 2015, which aims to end hunger, achieve food security and improve nutrition. Moreover, the strategic framework is aligned with the six Global Targets of the World Health Assembly (WHO-WHA 2014) endorsed in 2012, and with all political declarations on the Prevention and Control of Non-communicable Diseases in 2011, including campaign movements on Scaling Up Nutrition and the First One Thousand Days. Currently, four major policies and programs are in place to address poor maternal health and nutrition, namely: (1) Implementing Health Reforms for Rapid Reduction of Maternal and Neonatal Mortality (AO 2008-0029) through maternal, newborn and child health and nutrition or MNCHN services (2) micronutrient supplementation program (AO 2010-0010) to provide iron-folic acid to women of reproductive age, vitamin A to postpartum women and iodine capsules to pregnant women in their first trimester to combat micronutrient deficiencies affecting mostly pregnant and lactating mothers; (3) DOH National Healthy Lifestyle Program, with the campaign movement “Pilipinas Go4Health” started in 2013 to promote healthy lifestyle, including healthy diet and nutrition across the life course, to reduce the prevalence of non-communicable diseases (NCDs), particularly cardiovascular diseases, cancers, diabetes and chronic obstructive pulmonary diseases; (4) development of the integrated NCD prevention and control program framework, which includes the provision of comprehensive services along the continuum of care, evidenced-based program management, primary health care approach and community-based implementation (DOH 2010).
In the Philippines, assessment studies that identify the risk factors associated with CED and overweight/obesity among non-pregnant mothers 19 years and older and with children 0-5 years old, particularly those using national representative samples, are scarce. Most of the available information from national survey data focus only on the trends, with no in-depth analysis on the causes of CED and overweight/obesity among female adults 19 years old and over. Based on data from the 2008, 2011 and 2013 national surveys, the FNRI-DOST found that CED prevalence has been declining at 12.9%, 10.7% and 10.5%, respectively (FNRI-DOST 2015). Meanwhile, overweight/obesity rates increased from 30.1% in 2008 to 34.4% in 2013 (FNRI-DOST 2015a). In this context, this study aimed to identify the household and maternal characteristics associated with CED and overweight/obesity among non-pregnant mothers 19 years old and
Goyena et al.: Determinants of maternal chronic energy deficiency and overweight/obesity
Philippine Journal of ScienceVol. 146 No. 1, March 2017
48
above in the Philippines. Study results shall provide insights for maternal health promotion strategies toward accelerating progress in achieving global and national maternal, neonatal and child health and nutrition targets.
MATERIALS AND METHODS
Sampling procedures and study designThis study is an analysis of secondary data from the “2011 Updating of Nutritional Status of Filipino Children and Other Population Groups,” a periodic population-based, cross-sectional survey started in 1989/1990 and conducted every three years in between the National Nutrition Survey (NNS) of the FNRI-DOST. The Updating Surveys mainly collect anthropometric measurements using various indices to provide updated information on the nutritional status of Filipino children and other population groups for use in assessing the severity and magnitude of malnutrition (FNRI-DOST 2012).
The 2011 Updating Survey utilized the list of sampled households from the 2003 Master Sample (MS) of the Philippine Statistics Authority (PSA) constructed from the 2000 Labor Force Survey. The detailed description of the sampling design used in the 2003 MS (Ericta and Fabian 2009) and in the 2011 Updating Survey can be found elsewhere (FNRI-DOST 2012). The MS employed a stratified multi-stage design covering all 17 regions in the country, which served as primary strata as defined by the Philippine Government through Executive Orders 36 and 131. Each region was further stratified according to geographic groupings, referred to as sub-strata, namely: provinces, highly urbanized cities and independent component cities. A province is the largest unit in the political structure of the Philippines with a varying number of municipalities and component cities depending on geographic size, with the barangay as the smallest unit. Meanwhile, a city can be classified as highly urbanized if its population is at least 200,000 and its minimum latest annual income is Php 50 million ($1.07 million). A component city, on the other hand, does not meet the criteria of a highly urbanized city or an independent city, and is under the province in which they are geographically located. For each geographic group, sub-stratification (tertiary strata) was again performed with respect to socio-economic variables related to poverty. From each level of the tertiary strata, the population was divided into a set of barangays or geographically adjacent barangays based on the 2000 Census of Population and Housing. Sampling of barangays were done using a systematic sampling with probability proportional to estimated size sampling (PPES). At the first stage of sampling, primary sampling units (PSUs) were selected, where PSU refers to a barangay
or contiguous barangays with at least 500 households. The second stage of selection involved systematic sampling of 3,178 Enumeration Areas (EAs) from the PSUs, each having 150 to 200 households. The last stage involved the selection of 38,894 households from the EAs as the ultimate sampling units. All eligible mothers with children 0-5 years old in each eligible household were interviewed using a structured questionnaire. For this study, however, only mothers 19 years old and above with children 0-5 years old were included in data analysis, primarily because teenage mothers might face different health risks.
Ethical ConsiderationThe protocol employed in this study involving secondary data analysis was reviewed and approved by the FNRI Institutional Ethics Review Committee of the DOST in August 2012. Information on the objectives and principles of the 2011 Updating Survey were given to the mothers before soliciting their oral and written consent to participate in the survey.
Study Variables
Dependent variablesMaternal BMI was considered as the dependent variable, which is calculated as weight in kg divided by height in m2 (kg/m2). BMI was categorized as CED (<18.5 kg/m2), normal (18.5-24.99 kg/m2), overweight (25.0-29.9 kg/m2) and obese (≥30.0 kg/m2) based on WHO cut-off (WHO 1995). A trained anthropometric researcher measured mothers’ weight to the nearest 0.1 kg using DetectoTM beam balance weighing scale with 160 kg capacity (Otex, USA) and height to the nearest 0.1 cm using the SECATM
microtoise (Model 206, Deutschland, Hamburg Germany). Weight and height measurements were collected following a standard anthropometric procedure (Jelliffe and Jelliffe 1989). Two measurements each for weight and height were collected, and the means of the two anthropometric measurements were calculated and used in the analysis. The distribution of the measurements of height and weight, including age, was checked during manual and machine validation and processing for data inconsistencies.
Independent VariablesHousehold visits were conducted to collect information through face-to-face interviews with mothers using a structured questionnaire via the electronic data collection system (e-DCS) in the netbooks developed and validated by FNRI-DOST (2012).
Maternal Socio-Demographic Characteristics. Most variables under the socio-demographic domain fell under two or more categorical variables: i) maternal age, calculated in years, was categorized as <20, 20-39, >40,
Goyena et al.: Determinants of maternal chronic energy deficiency and overweight/obesity
Philippine Journal of ScienceVol. 146 No. 1, March 2017
49
ii) maternal highest level of education: no schooling; elementary; high school; college and above; iii) marital status: single, currently married, widowed, separated and live-in; iv) maternal working status: not working (respondents were not earning cash) and working (respondents were earning cash during the time of survey); v) place of residence: urban residents, defined as respondents living in an urban area while rural residents were those living in an rural area as specified by the national census of the PSA; v) household size: ≤ 5 persons or > 5 persons; vi) source of drinking water, categorized as improved sources (protected well or spring, communal faucet system or stand post or waterworks system and bottled water) or not improved sources (unprotected dug well or spring, tanker truck/cart with drum and surface water); and vii) type of toilet facility, classified as no facility (bush/field, wrap and throw), water–sealed (pour/flush to septic tank) or not water-sealed (without septic tank, pit latrine).
Household Socio-Economic Status. Proxy measures of relative wealth of households were used to construct the index of household wealth status using principal component analysis. These were based on the type of housing materials used on floor, roof and wall, household water access and toilet facility and household ownership on selected assets such as appliances (TV, radio, refrigerator, etc.), vehicles (car, bicycle, etc.) and electricity connection (FNRI-DOST 2015b). Household wealth index was categorized into five quintiles (poorest, poor, middle, rich and richest).
Household Food Security. Household food security was assessed using the validated Radimer/Cornell hunger and food insecurity items, which was modified, translated and pre-tested for its applicability in the Philippine setting during the pilot study of the Updating Survey (FNRI-DOST 2012). Using ten questions regarding difficulties experienced in securing food needs for the past three months from the date of interview, households were described as food insecure if they answered “yes” to at least one of the four household food insecurity items.
Maternal Reproductive Status . The maternal reproductive status assessed were (1) parity or number of live births in the mother’s lifetime, categorized into four: 1, 2-3, 4-5 and ≥6; (2) age at first pregnancy: <20, 20-39 and ≥40; (3) maternal physiological status, categorized into non-lactating if mothers were not breastfeeding or have stopped breastfeeding her child and lactating if mothers were breastfeeding her child during the time of survey irrespective of duration.
Maternal Healthcare Practices. Health care services received by mothers refer to those administered during pregnancy with the youngest child, including prenatal
care, timing of first prenatal visit, number of prenatal visits and post-natal care after giving birth. Responses to questions on maternal health practices included the following: (1) prenatal care: with or without prenatal care from health facility; (2) timing of first prenatal visit: within first, second or third trimester; (3) postnatal care participation: with or without post-natal care.
Statistical Analysis
Statistical analyses were performed using Stata statistical software package (version 13.0, 2013, StataCorp, College Station, TX). Primary outcome variables were maternal CED and maternal overweight/obese. Overweight and obesity were combined to ensure adequate size for the regression analysis. Descriptive analysis was done first to present the overall profile of mothers in relation to their socio-demographic, economic and reproductive characteristics including their maternal health practices across BMI categories namely, CED, normal BMI and overweight/obesity (Table 1). Bivariate analysis was then performed to describe the association between the socio-demographic, economic, reproductive and maternal health practices of mothers with BMI categories (Tables 2-3). Rao-Scott chi-square tests were used in the bivariate analysis to test the association of dependent variables (CED and overweight/obese) with independent variables having nominal or ordinal type of data. Lastly, multivariate logistic regression analysis was performed to model the regression coefficients of the outcome variable. Using a backward stepwise analysis, all independent variables were included in the model to assess the association between independent variables and BMI across classifications. Adjusted Odds Ratio (aOR) were calculated at 95% confidence interval (CI) to indicate the probability that a mother of an exposed group will have CED or become overweight/obesity relative to the probability that a mother of an unexposed group (reference group) will develop the same. Dummy variables were created for categorical variables and were considered reference categories, which were included in the bivariate and regression models. Detection of multicollinearity between variables was done by checking the extremely high values of standard errors. Independent variables with multicollinearity were excluded in the multivariate logistic regression analysis. Sample weighting factor was applied to account for the cluster design used in the sampling procedure, thus removing potential bias due to unequal selection probabilities. P-values less than 0.05 were considered statistically significant in all tests performed.
Goyena et al.: Determinants of maternal chronic energy deficiency and overweight/obesity
Philippine Journal of ScienceVol. 146 No. 1, March 2017
50
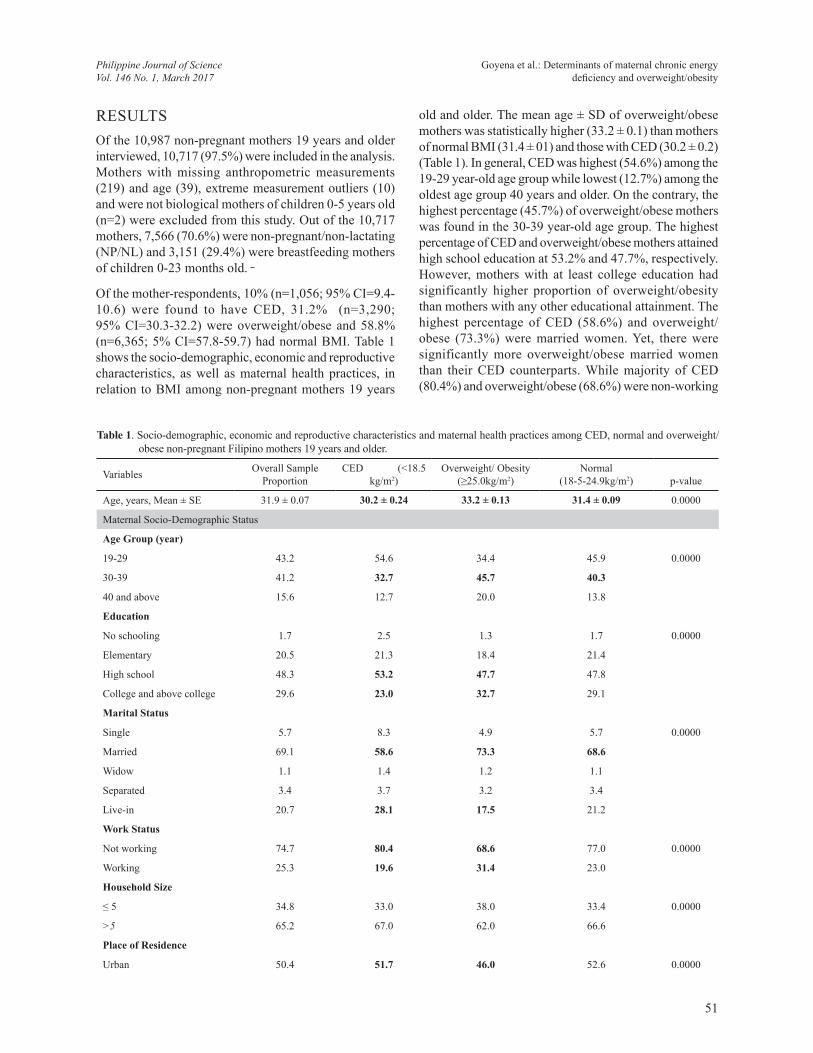
RESULTSOf the 10,987 non-pregnant mothers 19 years and older interviewed, 10,717 (97.5%) were included in the analysis. Mothers with missing anthropometric measurements (219) and age (39), extreme measurement outliers (10) and were not biological mothers of children 0-5 years old (n=2) were excluded from this study. Out of the 10,717 mothers, 7,566 (70.6%) were non-pregnant/non-lactating (NP/NL) and 3,151 (29.4%) were breastfeeding mothers of children 0-23 months old.
Of the mother-respondents, 10% (n=1,056; 95% CI=9.4-10.6) were found to have CED, 31.2% (n=3,290; 95% CI=30.3-32.2) were overweight/obese and 58.8% (n=6,365; 5% CI=57.8-59.7) had normal BMI. Table 1 shows the socio-demographic, economic and reproductive characteristics, as well as maternal health practices, in relation to BMI among non-pregnant mothers 19 years
old and older. The mean age ± SD of overweight/obese mothers was statistically higher (33.2 ± 0.1) than mothers of normal BMI (31.4 ± 01) and those with CED (30.2 ± 0.2) (Table 1). In general, CED was highest (54.6%) among the 19-29 year-old age group while lowest (12.7%) among the oldest age group 40 years and older. On the contrary, the highest percentage (45.7%) of overweight/obese mothers was found in the 30-39 year-old age group. The highest percentage of CED and overweight/obese mothers attained high school education at 53.2% and 47.7%, respectively. However, mothers with at least college education had significantly higher proportion of overweight/obesity than mothers with any other educational attainment. The highest percentage of CED (58.6%) and overweight/obese (73.3%) were married women. Yet, there were significantly more overweight/obese married women than their CED counterparts. While majority of CED (80.4%) and overweight/obese (68.6%) were non-working
Table 1. Socio-demographic, economic and reproductive characteristics and maternal health practices among CED, normal and overweight/obese non-pregnant Filipino mothers 19 years and older.
Variables Overall SampleProportion
CED (<18.5 kg/m2)
Overweight/ Obesity(≥25.0kg/m2)
Normal(18-5-24.9kg/m2) p-value
Age, years, Mean ± SE 31.9 ± 0.07 30.2 ± 0.24 33.2 ± 0.13 31.4 ± 0.09 0.0000
Maternal Socio-Demographic Status
Age Group (year)
19-29 43.2 54.6 34.4 45.9 0.0000
30-39 41.2 32.7 45.7 40.3
40 and above 15.6 12.7 20.0 13.8
Education
No schooling 1.7 2.5 1.3 1.7 0.0000
Elementary 20.5 21.3 18.4 21.4
High school 48.3 53.2 47.7 47.8
College and above college 29.6 23.0 32.7 29.1
Marital Status
Single 5.7 8.3 4.9 5.7 0.0000
Married 69.1 58.6 73.3 68.6
Widow 1.1 1.4 1.2 1.1
Separated 3.4 3.7 3.2 3.4
Live-in 20.7 28.1 17.5 21.2
Work Status
Not working 74.7 80.4 68.6 77.0 0.0000
Working 25.3 19.6 31.4 23.0
Household Size
≤ 5 34.8 33.0 38.0 33.4 0.0000
>5 65.2 67.0 62.0 66.6
Place of Residence
Urban 50.4 51.7 46.0 52.6 0.0000
Goyena et al.: Determinants of maternal chronic energy deficiency and overweight/obesity
Philippine Journal of ScienceVol. 146 No. 1, March 2017
51
Rural 49.6 48.4 54.0 47.4
Type of Toilet Facility
No toilet 11.5 14.4 9.3 12.1 0.0000
Water-sealed 80.0 74.0 83.5 79.1
Not water-sealed 8.6 11.7 7.2 8.8
Source of drinking water
Not improved 29.7 26.4 33.5 28.2 0.0000
Improved 70.3 73.6 66.5 71.8
Household Socio-Economic Status
Wealth index quintile
1 (poorest) 22.4 29.2 16.1 24.7 0.0000
2 19.9 23.5 17.7 20.4
3 20.4 21.2 20.6 20.1
4 20.4 17.2 22.2 19.9
5 (richest) 17.0 9.0 23.4 14.9
Food Security Status
Food secured 28.4 19.7 33.2 27.3 0.0000
Not food secured 71.6 80.3 66.8 72.7
Reproductive Status
Parity (No. of Children)
1 26.9 31.3 24.6 27.4 0.0001
2-3 39.1 36.7 41.8 38.1
4-5 20.3 18.3 21.0 20.3
At least 6 13.7 13.7 12.7 14.2
Physiological Status
Non Lactating 71.8 63.9 82.8 67.3 0.0000
Lactating 28.2 36.1 17.2 32.7
Age at First Pregnancy
<20 8.0 13.0 7.7 7.4 0.0000
20-39 82.3 79.6 80.6 83.6
at least 40 9.7 7.5 11.8 9.0
Maternal Health Practices
Prenatal Care Participation
Without PrNC 5.7 8.5 4.7 5.7 0.0001
With PrNC 94.3 91.6 95.3 94.3
Timing of first prenatal Visit
1st trimester 62.2 56.6 63.3 62.6 0.0072
2nd trimester 33.9 39.3 33.0 33.5
3rd trimester 3.8 4.1 3.7 3.9
Postnatal Care Participation
Without postnatal care 56.5 64.3 49.9 58.6 0.0000
With postnatal care 43.5 35.7 50.1 41.4
Significant association at < 0.05; statistically significant differences across BMI classification in bold
Table 1 continuation . . .
Goyena et al.: Determinants of maternal chronic energy deficiency and overweight/obesity
Philippine Journal of ScienceVol. 146 No. 1, March 2017
52
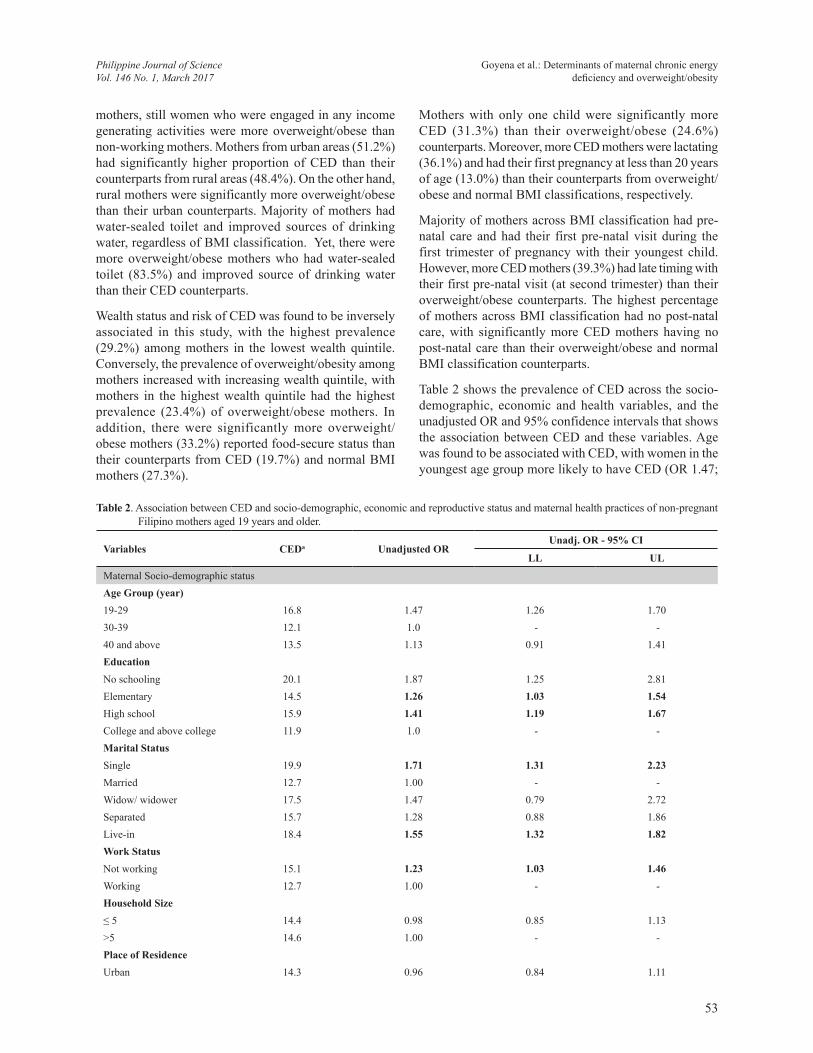
Table 2. Association between CED and socio-demographic, economic and reproductive status and maternal health practices of non-pregnant Filipino mothers aged 19 years and older.
Variables CEDa Unadjusted ORUnadj. OR - 95% CI
LL UL
Maternal Socio-demographic statusAge Group (year)19-29 16.8 1.47 1.26 1.7030-39 12.1 1.0 - -40 and above 13.5 1.13 0.91 1.41Education No schooling 20.1 1.87 1.25 2.81Elementary 14.5 1.26 1.03 1.54High school 15.9 1.41 1.19 1.67College and above college 11.9 1.0 - -Marital Status Single 19.9 1.71 1.31 2.23Married 12.7 1.00 - -Widow/ widower 17.5 1.47 0.79 2.72Separated 15.7 1.28 0.88 1.86Live-in 18.4 1.55 1.32 1.82Work Status Not working 15.1 1.23 1.03 1.46Working 12.7 1.00 - -Household Size ≤ 5 14.4 0.98 0.85 1.13>5 14.6 1.00 - -Place of ResidenceUrban 14.3 0.96 0.84 1.11
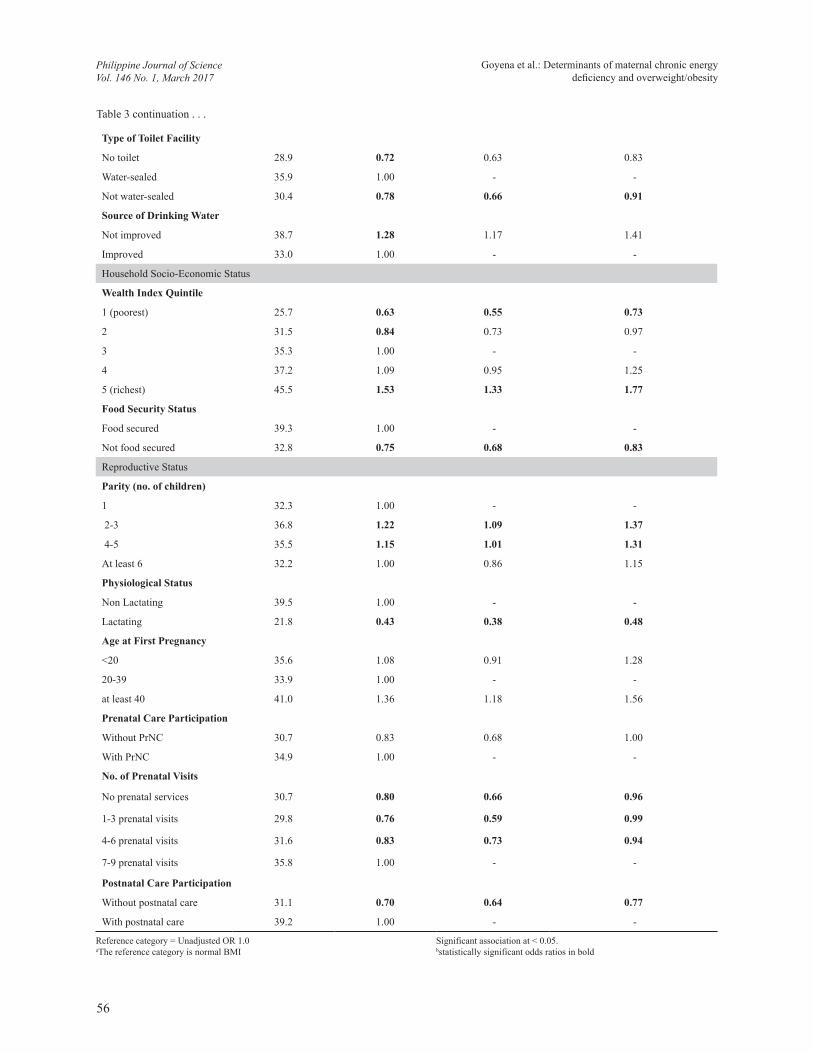
mothers, still women who were engaged in any income generating activities were more overweight/obese than non-working mothers. Mothers from urban areas (51.2%) had significantly higher proportion of CED than their counterparts from rural areas (48.4%). On the other hand, rural mothers were significantly more overweight/obese than their urban counterparts. Majority of mothers had water-sealed toilet and improved sources of drinking water, regardless of BMI classification. Yet, there were more overweight/obese mothers who had water-sealed toilet (83.5%) and improved source of drinking water than their CED counterparts.
Wealth status and risk of CED was found to be inversely associated in this study, with the highest prevalence (29.2%) among mothers in the lowest wealth quintile. Conversely, the prevalence of overweight/obesity among mothers increased with increasing wealth quintile, with mothers in the highest wealth quintile had the highest prevalence (23.4%) of overweight/obese mothers. In addition, there were significantly more overweight/obese mothers (33.2%) reported food-secure status than their counterparts from CED (19.7%) and normal BMI mothers (27.3%).
Mothers with only one child were significantly more CED (31.3%) than their overweight/obese (24.6%) counterparts. Moreover, more CED mothers were lactating (36.1%) and had their first pregnancy at less than 20 years of age (13.0%) than their counterparts from overweight/obese and normal BMI classifications, respectively.
Majority of mothers across BMI classification had pre-natal care and had their first pre-natal visit during the first trimester of pregnancy with their youngest child. However, more CED mothers (39.3%) had late timing with their first pre-natal visit (at second trimester) than their overweight/obese counterparts. The highest percentage of mothers across BMI classification had no post-natal care, with significantly more CED mothers having no post-natal care than their overweight/obese and normal BMI classification counterparts.
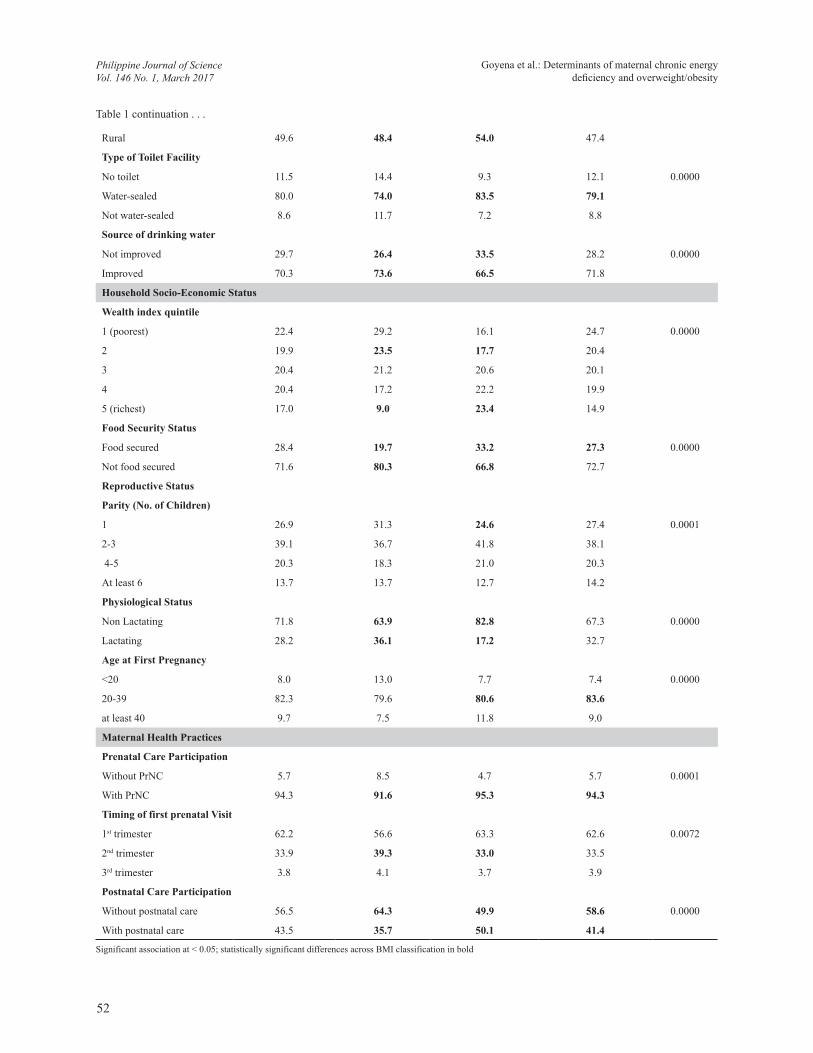
Table 2 shows the prevalence of CED across the socio-demographic, economic and health variables, and the unadjusted OR and 95% confidence intervals that shows the association between CED and these variables. Age was found to be associated with CED, with women in the youngest age group more likely to have CED (OR 1.47;
Goyena et al.: Determinants of maternal chronic energy deficiency and overweight/obesity
Philippine Journal of ScienceVol. 146 No. 1, March 2017
53

Table 2 continuation . . .
Rural 14.8 1.00 - -Type of Toilet FacilityNo toilet 16.8 1.27 1.05 1.53Water-sealed 13.7 1.00 - -Not water-sealed 18.5 1.42 1.16 1.75Source of drinking waterNot improved 13.7 0.91 0.78 1.07Improved 14.9 1.00 - -Household Socio-Economic StatusWealth Index Quintile 1 (poorest) 16.8 1.12 0.93 1.362 16.4 1.09 0.89 1.343 15.2 1.00 - -4 12.8 0.82 0.65 1.035 (richest) 9.3 0.57 0.43 0.76Food Security Status Food secured 10.9 1.00 - -Not food secured 15.8 1.53 1.29 1.82Reproductive StatusParity (no. of children) 1 16.3 1.00 - - 2-3 14.1 0.84 0.71 0.99 4-5 13.3 0.79 0.65 0.96At least 6 14.0 0.84 0.68 1.04Physiological StatusNon Lactating 13.9 1.00 - -Lactating 15.8 1.16 1.01 1.34Age at First Pregnancy<20 23.0 1.85 1.49 2.2920-39 13.9 1.00 - -at least 40 12.4 0.87 0.68 1.12Maternal Health PracticesPrenatal Care Participation Without PrNC 20.2 1.53 1.21 1.94With PrNC 14.2 1.00 - -Timing of first prenatal visit1st trimester 13.0 1.00 - -2nd trimester 16.3 1.30 1.12 1.503rd trimester 14.8 1.16 0.82 1.65Postnatal Care ParticipationWithout postnatal care 15.7 1.27 1.10 1.47With postnatal care 12.8 1.00 - -Reference category = Unadjusted OR 1.0aThe reference category is normal BMI
Significant association at < 0.05.bstatistically significant odds ratios in bold
95% CI=1.26-1.70) than among mothers in the 30-39 age group. Compared to mothers with at least college-level education, mothers with no schooling (OR 1.87; 95% CI=1.25-2.81) or have reached elementary (OR 1.26; 95% CI=1.03-1.54) and high school (OR 1.41; 95%
CI=1.19-1.67) were more likely to have CED. Single (OR 1.71; 95% CI=1.31-2.23) and live-in mothers (OR 1.55; 95%CI=1.32-1.82) were more likely to suffer from CED than married mothers. Meanwhile, non-working mothers (OR 1.23; 95% CI=1.03-1.46) were more likely
Goyena et al.: Determinants of maternal chronic energy deficiency and overweight/obesity
Philippine Journal of ScienceVol. 146 No. 1, March 2017
54
to have CED than working mothers. Mothers without water-sealed toilet facility (OR 1.42; 95% CI=1.16-1.75) and have no toilet at all (OR 1.27; 95% CI=1.05-1.53) have higher odds of suffering from CED than mothers with water-sealed toilet facility. The prevalence of CED increases with decreasing wealth index, with CED prevalence observed to be highest (16.8%) among the poorest mothers while lowest (9.3%) among mothers in the richest wealth quintile. Similarly, CED prevalence was significantly higher in food-insecure households (15.8%, p-value<0.000), where the likelihood of mothers having CED was higher (OR 1.53; 95% CI=1.29-1.82) than with food-secure households. No significant differences were found in CED prevalence between rural and urban mothers and between households with 5 or fewer members and those with more than 5 members (p-value>0.05).
Lactating mothers (OR 1.16; 95%CI= 1.01-1.34) were more likely to have CED than non-lactating mothers.
Mothers who had their first pregnancy at age less than 20 years old had higher prevalence of CED (23.0%) than mothers who had their first pregnancy at an older age. Furthermore, mothers who had no pre-natal (OR 1.53; 95%CI=1.21-1.94) and post-natal (OR 1.27; 95%CI=1.10-1.47) check-ups and who had late timing with their first pre-natal visit (OR 1.30; 95%CI=1.12-1.50) (at second trimester) were significantly more likely to have CED than mothers who had maternal health care during pregnancy with their youngest child.
The associations between overweight/obesity and socio-demographic, economic and reproductive status and health practices of Filipino mothers from the bivariate analysis are presented in Table 3. Mothers in the older age group (40+years) (OR 1.28; 95% CI=1.13-1.44) were more likely to become overweight/obese than the reference group (30-39 years). On the other hand, mothers in the younger age group (19-29 years) (OR 0.66; 95% CI=0.60-0.73) were
Table 3. Association between overweight/obesity and socio-demographic, economic and reproductive status and maternal health practices of non-pregnant Filipino mothers aged 19 years and older.
Variables Overweight/ obesitya Unadjusted OR
Unadj. OR - 95% CI
LL UL
Maternal Socio-Demographic Status
Age Group (year)
19-29 28.5 0.66 0.60 0.73
30-39 37.6 1.00 - -
at least 40 43.5 1.28 1.13 1.44
Education
No schooling 28.9 0.68 0.49 0.94
Elementary 31.4 0.77 0.68 0.87
High school 34.6 0.89 0.80 0.98
College and above college 37.4 1.00 - -
Marital Status
Single 31.4 0.81 0.66 0.99
Married 36.2 1.00 - -
Widow/ widower 35.6 0.98 0.64 1.49
Separated 33.0 0.87 0.68 1.12
Live-in 30.5 0.77 0.69 0.87
Work Status
Not working 32.1 0.65 0.59 0.72
Working 42.0 1.00 - -
Household Size
≤5 37.6 1.22 1.11 1.34
>5 33.1 1.00 - -
Place of residence
Urban 31.8 0.77 0.70 0.84
Rural 37.7 1.00 - -
Goyena et al.: Determinants of maternal chronic energy deficiency and overweight/obesity
Philippine Journal of ScienceVol. 146 No. 1, March 2017
55
Type of Toilet Facility
No toilet 28.9 0.72 0.63 0.83
Water-sealed 35.9 1.00 - -
Not water-sealed 30.4 0.78 0.66 0.91
Source of Drinking Water
Not improved 38.7 1.28 1.17 1.41
Improved 33.0 1.00 - -
Household Socio-Economic Status
Wealth Index Quintile
1 (poorest) 25.7 0.63 0.55 0.73
2 31.5 0.84 0.73 0.97
3 35.3 1.00 - -
4 37.2 1.09 0.95 1.25
5 (richest) 45.5 1.53 1.33 1.77
Food Security Status
Food secured 39.3 1.00 - -
Not food secured 32.8 0.75 0.68 0.83
Reproductive Status
Parity (no. of children)
1 32.3 1.00 - -
2-3 36.8 1.22 1.09 1.37
4-5 35.5 1.15 1.01 1.31
At least 6 32.2 1.00 0.86 1.15
Physiological Status
Non Lactating 39.5 1.00 - -
Lactating 21.8 0.43 0.38 0.48
Age at First Pregnancy
<20 35.6 1.08 0.91 1.28
20-39 33.9 1.00 - -
at least 40 41.0 1.36 1.18 1.56
Prenatal Care Participation
Without PrNC 30.7 0.83 0.68 1.00
With PrNC 34.9 1.00 - -
No. of Prenatal Visits
No prenatal services 30.7 0.80 0.66 0.96
1-3 prenatal visits 29.8 0.76 0.59 0.99
4-6 prenatal visits 31.6 0.83 0.73 0.94
7-9 prenatal visits 35.8 1.00 - -
Postnatal Care Participation
Without postnatal care 31.1 0.70 0.64 0.77
With postnatal care 39.2 1.00 - -
Reference category = Unadjusted OR 1.0aThe reference category is normal BMI
Significant association at < 0.05.bstatistically significant odds ratios in bold
Table 3 continuation . . .
Goyena et al.: Determinants of maternal chronic energy deficiency and overweight/obesity
Philippine Journal of ScienceVol. 146 No. 1, March 2017
56
less likely to become overweight/obese. Compared to mothers with at least college-level education, mothers with no schooling (OR 0.68; 95% CI=0.49-0.94), or have reached elementary (OR 0.77; 95% CI=0.68-0.87) and high school education (OR 0.89; 95% CI=0.80-0.98) were less likely to become overweight/obese. By marital status, single mothers (OR 0.81; 95% CI=0.66-0.99) and live-in mothers (OR 0.77; 95% CI=0.69-0.87) were less likely to become overweight and obese than married mothers. Meanwhile, working mothers showed a higher prevalence of overweight/obesity (42.0%) than mothers who were not engaged in any income generating activities (OR 0.65; 95% CI=0.59-0.72). Mothers from households with 5 or fewer members (OR 1.22; 95% CI=1.11-1.33) were more likely to become overweight/obese than mothers from larger households. Moreover, mothers in rural areas have significantly higher prevalence of overweight/obesity (37.7%) than mothers in urban areas.
Mothers in the richest quintile (OR 1.53; 95% CI=1.33-1.77) were more likely to be overweight/obese than mothers in lower wealth quintiles (OR 0.75; 95% CI=0.68-0.83). Similarly, mothers from food secure
households (39.3%) had significantly higher prevalence of overweight/obesity than food-insecure mothers (32.8%).
Mothers with two-to-three and four-to-five children were found to have 1.22 and 1.15 odds of being overweight/obese, respectively. Lactating mothers (OR 0.43; 95% CI=0.38-0.48) have significantly less likelihood of becoming overweight/obese than non-lactating mothers. Mothers who first conceived at age 40 and above have significantly greater likelihood (OR 1.36; 95% CI= 1.18-1.56) of being overweight/obese than mothers who had their first pregnancy at 20-39 years of age. Mothers without (OR 0.80; 95% CI=0.66-0.96) and with lesser number of pre-natal visits of 1-3 (OR 0.76; 95% CI=0.59-0.99) and of 4-6 visits (OR 0.83; 95% CI=0.73-0.94) were less likely to become overweight/obese than mothers with 7-9 pre-natal visits. Similarly, mothers with no post-natal care after giving birth with the youngest child (OR 0.70; 95% CI=0.64-0.77) were less likely to become overweight/obese than mothers who had post-natal care.
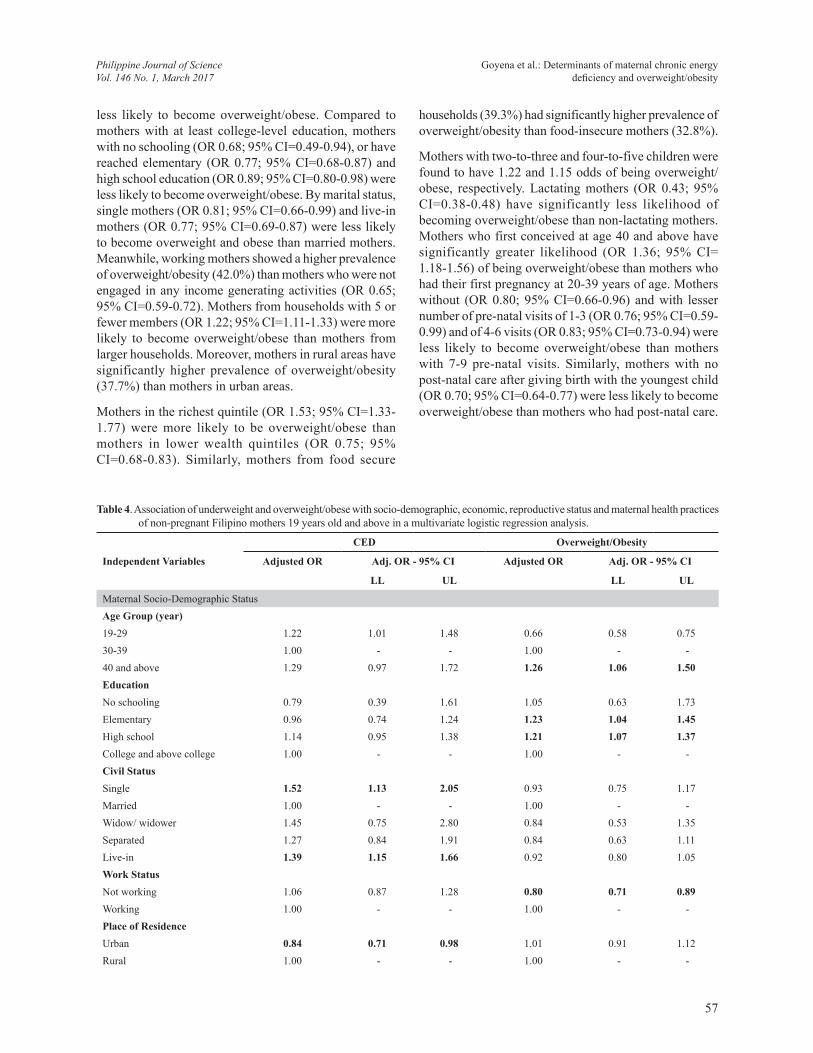
Table 4. Association of underweight and overweight/obese with socio-demographic, economic, reproductive status and maternal health practices of non-pregnant Filipino mothers 19 years old and above in a multivariate logistic regression analysis.
Independent Variables
CED Overweight/Obesity
Adjusted OR Adj. OR - 95% CI Adjusted OR Adj. OR - 95% CI
LL UL LL UL
Maternal Socio-Demographic StatusAge Group (year) 19-29 1.22 1.01 1.48 0.66 0.58 0.7530-39 1.00 - - 1.00 - -40 and above 1.29 0.97 1.72 1.26 1.06 1.50Education No schooling 0.79 0.39 1.61 1.05 0.63 1.73Elementary 0.96 0.74 1.24 1.23 1.04 1.45High school 1.14 0.95 1.38 1.21 1.07 1.37College and above college 1.00 - - 1.00 - -Civil StatusSingle 1.52 1.13 2.05 0.93 0.75 1.17Married 1.00 - - 1.00 - -Widow/ widower 1.45 0.75 2.80 0.84 0.53 1.35Separated 1.27 0.84 1.91 0.84 0.63 1.11Live-in 1.39 1.15 1.66 0.92 0.80 1.05Work Status Not working 1.06 0.87 1.28 0.80 0.71 0.89Working 1.00 - - 1.00 - -Place of ResidenceUrban 0.84 0.71 0.98 1.01 0.91 1.12Rural 1.00 - - 1.00 - -
Goyena et al.: Determinants of maternal chronic energy deficiency and overweight/obesity
Philippine Journal of ScienceVol. 146 No. 1, March 2017
57
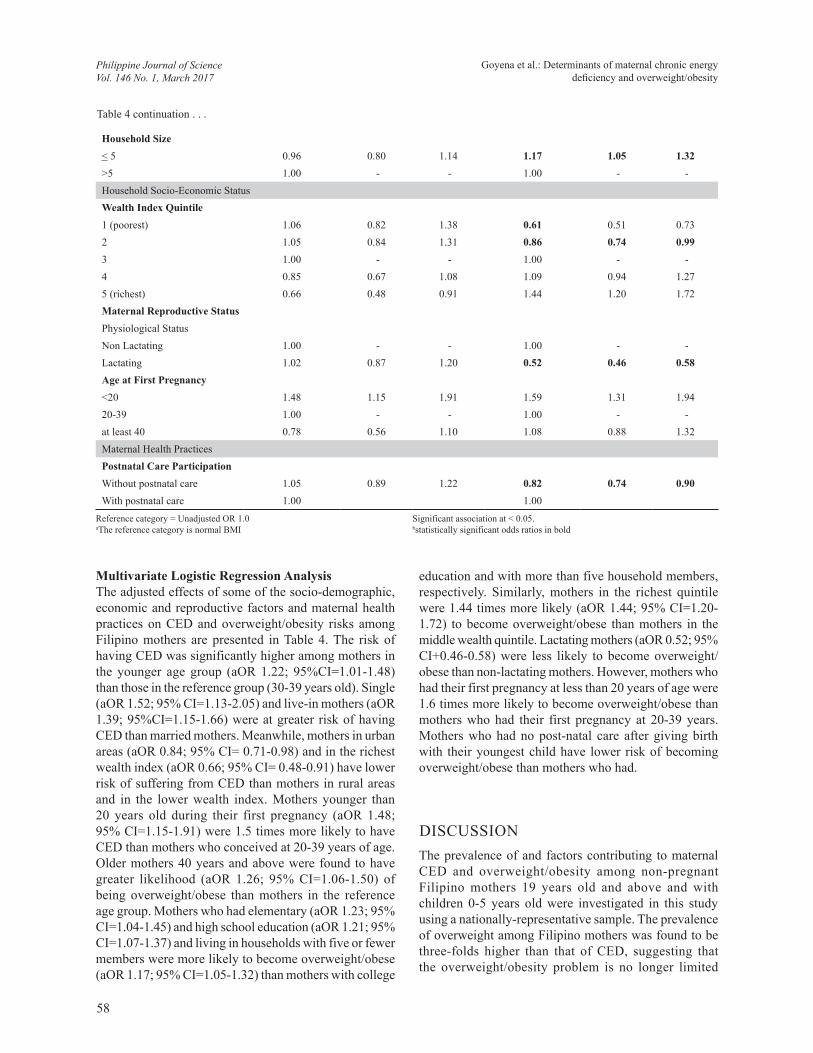
Household Size < 5 0.96 0.80 1.14 1.17 1.05 1.32>5 1.00 - - 1.00 - -Household Socio-Economic StatusWealth Index Quintile1 (poorest) 1.06 0.82 1.38 0.61 0.51 0.732 1.05 0.84 1.31 0.86 0.74 0.993 1.00 - - 1.00 - -4 0.85 0.67 1.08 1.09 0.94 1.275 (richest) 0.66 0.48 0.91 1.44 1.20 1.72Maternal Reproductive StatusPhysiological Status Non Lactating 1.00 - - 1.00 - -Lactating 1.02 0.87 1.20 0.52 0.46 0.58Age at First Pregnancy<20 1.48 1.15 1.91 1.59 1.31 1.9420-39 1.00 - - 1.00 - -at least 40 0.78 0.56 1.10 1.08 0.88 1.32Maternal Health PracticesPostnatal Care ParticipationWithout postnatal care 1.05 0.89 1.22 0.82 0.74 0.90With postnatal care 1.00 1.00
Reference category = Unadjusted OR 1.0aThe reference category is normal BMI
Significant association at < 0.05.bstatistically significant odds ratios in bold
Table 4 continuation . . .
Multivariate Logistic Regression AnalysisThe adjusted effects of some of the socio-demographic, economic and reproductive factors and maternal health practices on CED and overweight/obesity risks among Filipino mothers are presented in Table 4. The risk of having CED was significantly higher among mothers in the younger age group (aOR 1.22; 95%CI=1.01-1.48) than those in the reference group (30-39 years old). Single (aOR 1.52; 95% CI=1.13-2.05) and live-in mothers (aOR 1.39; 95%CI=1.15-1.66) were at greater risk of having CED than married mothers. Meanwhile, mothers in urban areas (aOR 0.84; 95% CI= 0.71-0.98) and in the richest wealth index (aOR 0.66; 95% CI= 0.48-0.91) have lower risk of suffering from CED than mothers in rural areas and in the lower wealth index. Mothers younger than 20 years old during their first pregnancy (aOR 1.48; 95% CI=1.15-1.91) were 1.5 times more likely to have CED than mothers who conceived at 20-39 years of age. Older mothers 40 years and above were found to have greater likelihood (aOR 1.26; 95% CI=1.06-1.50) of being overweight/obese than mothers in the reference age group. Mothers who had elementary (aOR 1.23; 95% CI=1.04-1.45) and high school education (aOR 1.21; 95% CI=1.07-1.37) and living in households with five or fewer members were more likely to become overweight/obese (aOR 1.17; 95% CI=1.05-1.32) than mothers with college
education and with more than five household members, respectively. Similarly, mothers in the richest quintile were 1.44 times more likely (aOR 1.44; 95% CI=1.20-1.72) to become overweight/obese than mothers in the middle wealth quintile. Lactating mothers (aOR 0.52; 95% CI+0.46-0.58) were less likely to become overweight/obese than non-lactating mothers. However, mothers who had their first pregnancy at less than 20 years of age were 1.6 times more likely to become overweight/obese than mothers who had their first pregnancy at 20-39 years. Mothers who had no post-natal care after giving birth with their youngest child have lower risk of becoming overweight/obese than mothers who had.
DISCUSSIONThe prevalence of and factors contributing to maternal CED and overweight/obesity among non-pregnant Filipino mothers 19 years old and above and with children 0-5 years old were investigated in this study using a nationally-representative sample. The prevalence of overweight among Filipino mothers was found to be three-folds higher than that of CED, suggesting that the overweight/obesity problem is no longer limited
Goyena et al.: Determinants of maternal chronic energy deficiency and overweight/obesity
Philippine Journal of ScienceVol. 146 No. 1, March 2017
58
to developed countries as was generally believed. The co-existence of under- and overnutrition among Filipino mothers can be framed in the perspective of the ongoing “nutrition transition” observed in low- and middle-income countries (LMIC). Pedro et. al (2006) reported that the Philippine dietary pattern follows an increasing intake of fats and oil, sugar and syrup, meat and processed meat products and other cereals and cereal products (including bread and bakery products, noodles and snack food made from wheat flour) along with declining fruit and vegetable consumption due to increasing urbanization, coupled with the effects of increasing globalization of the food market. Similarly, among women of reproductive age in Indonesia, overweight/obesity prevalence (32.9%) was almost four times higher than CED prevalence (12.0%) (FANTA 2014). At the population level, women are mostly affected by the double burden of malnutrition, with more countries, either rich or poor, having higher overweight than underweight prevalence (Shrimptom 2013).
In this study, most of the socio-demographic and economic factors that determine the risk of CED and overweight/obesity among mothers were consistent with other findings in Asian (Gouda and Prusty 2014; Mendez et al. 2005) and African countries (Doku and Neupane 2015; Dinsa et al. 2012). For instance, younger mothers 19-29 years of age are most likely to have CED while older mothers 40 years and above were at greater risk of becoming overweight/obese than women in the middle or older age groups. The effect of age on the nutritional status of women can be well-explained by the declining metabolic rate due to reduction in fat-free mass (Lazzer et al. 2010; St-Onge and Gallagher 2010), along with decreasing physical activity, as age increases. Thus, the energy requirement among older groups is lower than the younger age groups, with even regular or usual eating potentially leading to weight gain. A higher prevalence of maternal CED was observed among less educated and poorest mothers than among mothers who attained higher education and belong to the richest quintile. Low maternal education and low economic status as measured by wealth index limit the ability of mothers to access available resources for the improvement of their own nutritional status and that of their families (Senbanjo et al. 2013). Similarly, a positive significant association between wealth index and prevalence of obesity/overweight among mothers was observed, consistent with other studies (Popkin 2006; Parizkova et al. 2007) where economically well-off families were found to be more likely to adopt a sedentary lifestyle and eat more energy-dense food, predisposing them to overnutrition. Moreover, mothers with higher educational attainment were found to be more likely to become overweight/obese (Table 3), corroborating the finding of other studies that women with higher education are more likely to have better job opportunities, helping
them to be more self-dependent, which could then lead to improvement in their socio-economic status (Gouda and Prusty 2014; NDHS 2008). This confirms the observation that non-working mothers are more likely to have CED while working mothers were at greater risk of becoming overweight/obese. Moreover, educated women have more opportunities to improve their standard of living, which leads to less physical activity and greater access to energy-dense food, resulting in increased likelihood of overweight/obesity (Popkin 2006). However, in developed countries, overweight is more prevalent among women in the lower income level and among the less educated (Monteiro et al. 2004) suggesting that more obesogenic foods, and televisions become more widely accessible and available to the poor.
In terms of physiological status, lactating mothers were more likely to have CED than non-lactating mothers, since the energy and nutritional requirements of lactating mothers are greater than non-lactating mothers. Several scholars have ascribed this to maternal depletion of nutrients caused by inadequate food intake and/or increased physical activity, wherein nutrient reserves are inadequate to compensate for the additional requirements of breastfeeding, making the mother more vulnerable to undernutrition (Haileslassie 2013). On the other hand, mothers who started having children at a young age (less than 20 years) and with parity of 2 to 3 children have higher risk of becoming overweight. According to Luke and Brown (2007), the increased overweight/obesity risk is generally caused by higher age, along with declining physical activity that may lead to weight retention after giving birth and accumulated weight gain in between pregnancies. In addition, mothers with no pre- and post-natal check-ups, and had late timing of pre-natal check-up during pregnancy with the youngest child have significantly higher risk of having CED based on bivariate analysis. These associations, however, were no longer evident after adjusting the effects in the regression analysis.
Similarly, married women were found to be more likely to become overweight/obese as shown in the logistic regression. Gneezy and Shafrin (2009) explained that exiting the dating period decreases one’s incentive to maintain one’s appearance, leading to an increase in body weight. Meanwhile, single or live-in mothers showed the highest risk of having CED. Gneezy and Shafrin (2009) asserted that women who cohabitate but are not married will gain the least amount of weight since the probability that the relationship will dissolve is the highest, which will compel individuals to maintain their appearance and body weight.
Overweight/obesity among mothers in urban areas has been widely acknowledged, the results of this study
Goyena et al.: Determinants of maternal chronic energy deficiency and overweight/obesity
Philippine Journal of ScienceVol. 146 No. 1, March 2017
59
also indicate that the burden is also a challenge in rural areas. Mothers in rural areas were found to have higher prevalence of overweight/obesity than in urban areas, consistent with studies on urban-rural differences and nutritional status where rural overweight was observed to be substantial in 18 countries at ≥20% prevalence rate (Mendez et al. 2005). Possibly, this is the influence of greater economic access to food and could be an indicator of rural development, wherein residents of areas officially designated as rural may have better access to infrastructure and services that facilitate a more “urbanized” lifestyle, such as access to energy-dense food and motorized transportation, in turn increasing the risk of obesity (Mendez et al. 2005). Over time, energy-dense but nutrient-poor foods like processed foods are a lot cheaper and accessible than healthy foods which are becoming common and norm among lower income groups in rural areas (Tzioumis E and Adair LS 2014). This probably contributes to the increased overweight/obesity among mothers in the rural areas.
Overweight and obesity are important underlying causes of NCDs, including hypertension, diabetes, some types of cancer and cardiovascular diseases (WHO 2014). CED among mothers, meanwhile has direct effects on their health, particularly on nutritional anemia and other micronutrient deficiencies, contributing to maternal and child mortality (Black et al. 2008). Furthermore, maternal CED may have short and long term effects on fetal development, which has been associated with higher risk of giving birth to small-for-gestational-age (SGA) infants. This could increase the risk of childhood stunting in the first year of life that could lead to increased susceptibility to obesity as well as chronic diseases in adult life (Victora et al. 2008), thereby perpetuating the intergenerational problem of malnutrition (WHO 2005). Hence, the coexistence of overweight/obesity and CED among Filipino mothers deserves urgent public attention. Study results indicate a higher prevalence of overweight/obesity than CED among mothers, which may likely link child undernutrition to adult overweight, as the fetal origins hypothesis suggests (Barker 2001; Popkin et al. 1996). Survey results also show that persistent child undernutrition comprising underweight, stunting and wasting (FNRI-DOST 2015) may have contributed to the burden of overweight among Filipino women.
Given the cross-sectional nature of the study design, where data is collected at a single point in time, study results only reflect associations and causality cannot be inferred. Moreover, no information on dietary intake, biomarkers, physical activity and even lifestyle are included that could help better understand the variations on the prevalence and factors of CED and overweight/obesity among mothers. In addition, other contributory factors may have been
excluded in the analysis of the study. No associations were also observed among dietary and hygienic practices of mothers regarding both CED and overweight/obesity, which can be attributed to the limitations of self-reporting such as under- and over-reporting, and thus were not presented in this paper. Despite these limitations, the strength of this study lies in its use of a large, national and population-based survey with a high response rate (97.0%) among eligible respondents. Also, the survey conducted employed standard equipment and techniques of measurements by trained researchers. Results can therefore be generalized to characterize the entire country and can also be compared with other countries.
CONCLUSIONSThis study reveals the coexistence of under- and overnutrition among Filipino mothers. Prevalence of overweight/obesity was found to exceed undernutrition by one third of the population of Filipino women 19 years old and above. Maternal CED is significantly influenced by relatively young age, single or live-in marital status. Meanwhile, maternal overweight/obesity is associated with older age group, higher educational attainment, highest wealth index, household size fewer than 5 persons and younger age at first pregnancy.
In light of these findings, the absence of policies simultaneously addressing the pockets of undernutrition, along with the growing problem of overnutrition, that affect Filipino women may result in disparate overweight/obesity- and CED-related morbidity and mortality. Results of this study may provide insights on the risk factors of DBM among Filipino women, which may aid in focusing maternal health interventions and promotion strategies towards improving their nutritional status, and consequently breaking the intergenerational cycle of malnutrition in the country.
ACKNOWLEDGMENTSFUNDING SUPPORT: This study was funded by the Philippine Center for Health Research and Development of the Department of Science and Technology (PCHRD-DOST). ACKNOWLEDGMENT: Dr. Jocelyn A. Juguan, who initiated the project collaboration, and Ms. Rovea Ernazelle Austria, the project staff, are greatly acknowledged. The authors also thank the participants, hired field researchers and all the hardworking community health and nutrition workers involved in the 2011 Updating Survey.
Goyena et al.: Determinants of maternal chronic energy deficiency and overweight/obesity
Philippine Journal of ScienceVol. 146 No. 1, March 2017
60
REFERENCESBARKER DJP. 2001. The fetal origins of adult disease: No
longer just a hypothesis and may be critically important in South Asia. BMJ 322: 375-376. Accessed from http://www.aipro.info/drive/File/The%20fetal%20origins%20of%20adult%20disease.pdf on April 16, 2016.
BLACK RE, ALLEN LH, BHUTTA ZA, CAULFIELD LE, DE ONIS M, EZZATI M, MATHERS C, RIVERA J. 2008. Maternal and child undernutrition: Global and regional exposures and health consequences. The Lancet Series 371: 243-257. Accessed at http://www.thelancet.com/pdfs/journals/lancet/PIIS0140-6736(07)61690-0.pdf on April 12, 2016.
BLACK RE, VICTORA CG, WALKER SP, BHUTTA ZA, CHRISTIAN P, DE ONIS M, EZZATI M, G R A N T H A M - M C G R E G O R S , K AT Z J , MARTORELL R, UAUY R. 2013. Maternal and child undernutrition and overweight in low-income and middle-income countries. The Lancet Series 382: 427-451. Accessed at http://www.thelancet.com/pdfs/journals/lancet/PIIS0140-6736(13)60937-X.pdf on March 12, 2016.
CHAPARRO C. OOT L, SETHURAMAN K. 2014. Overview of the nutrition situation in seven countries in Southeast Asia. Washington, DC: FHI 360/FANTA.18p. Accessed at http://www.fantaproject.org/sites/default/files/download/Southeast-Asia-Nutrition Overview-Apr2014.pdf on April 10, 2016.
DINSA GD, GORYAKIN Y, FURNAGALLI E, SUHRCKE M. 2012. Obesity and socio- economic status in developing countries: a systematic review. Obes Rev 13(11):1067-1079.
DOKU DY, NEUPANE S. 2015. Double burden of malnutrition: Increasing overweight and obesity and stall underweight trends among Ghanian women. BioMed Central 15:670 doi 10.1186/s12889-015-2033-2036.
[DOH] DEPARTMENT OF HEALTH ADMINISTRATIVE ORDER (AO) No. 2010 s. 0010. Revised policy and guide on micronutrient supplementation to support the achievement of 2015 MDG targets to reduce under-five and maternal deaths and address micronutrient needs of the population groups. Bldg. I, San Lazaro Compound, Sta. Cruz, Manila, Philippines. 14p. Accessed from http://www.doh.gov.ph/sites/default/files/publications/DOH_Annual_Report2013.pdf
[DOH] DEPARTMENT OF HEALTH. 2014. Strategic framework for comprehensive nutrition implementation plan 2014-2025. Bldg. I, San Lazaro Compound, Sta. Cruz, Manila, Philippines. p. 1-4.
ERICTA C, FABIAN EMMA. 2009. A documentation of the Philippines’ family income and expendi ture survey. Philippine Institute for Development Studies. Discussion Paper Series No. 2009-18.
[FANTA-USAID] FOOD AND NUTRITION TECHNICAL ASSISTANCE- UNITED STATES AGENCY INTERNATIONAL DEVELOPMENT. 2014. Overview of the nutrition situation in the seven countries in Southeast Asia. Accessed at http://www.fantaproject.org/sites/default/files/download/Southeast-Asia-Nutrition-Overview-Apr2014.pdf on April 10, 2016.
[FDA] FOOD AND DRUG ADMINISTRATION.1995. Republic Act No. 8172. An act p r o m o t i n g s a l t iodization nationwide and for related purposes.
[FNRI-DOST] FOOD AND NUTRITION RESEARCH INSTITUTE-DEPARTMENT OF SCIENCE AND TECHNOLOGY. 2012. Philippine nutrition facts and figures 2011. Bicutan, Taguig City, Metro Manila, Philippines: Food and Nutrition Research Institute-Department of Science and Technology.
[FNRI-DOST] FOOD AND NUTRITION RESEARCH INSTITUTE-DEPARTMENT OF SCIENCE AND TECHNOLOGY. 2015a. Philippine nutrition facts and figures 2013. Anthropometric survey. FNRI Bldg., Bicutan, Taguig City, Metro Manila, Philippines. p. 53-54.
[FNRI-DOST] FOOD AND NUTRITION RESEARCH INSTITUTE-DEPARTMENT OF SCIENCE AND TECHNOLOGY. 2015b. Philippine nutrition facts and figures 2013. Overview. FNRI Bldg., Bicutan, Taguig City, Metro Manila, Philippines. p. xxvii.
[FNRI-DOST] FOOD AND NUTRITION RESEARCH INSTITUTE-DEPARTMENT OF SCIENCE AND TECHNOLOGY. 2013a. Flyers of 8th National Nutrition Survey: Nutritional status of mothers (pregnant, lactating, non-pregnant and non-lactating with 0-36 months old children. FNRI Bldg., Bicutan, Taguig City, Metro Manila, Philippines.
[FNRI-DOST] FOOD AND NUTRITION RESEARCH INSTITUTE-DEPARTMENT OF SCIENCE AND TECHNOLOGY. 2013b. Flyers of 8th National Nutrition Survey: Iodine deficiency disorders in the Philippines: UIE Levels. FNRI Bldg., Bicutan, Taguig City, Metro Manila, Philippines.
[FNRI-DOST] FOOD AND NUTRITION RESEARCH INSTITUTE-DEPARTMENT OF SCIENCE AND TECHNOLOGY. 2015. Flyers on National Nutrition Summit: MDGs by 2015: Did Juan hit the targets? Presented during the Nutrition Summit held on February 16, 2016 at Crowne Plaza Galleria Ortigas, Metro Manila, Philippines.
Goyena et al.: Determinants of maternal chronic energy deficiency and overweight/obesity
Philippine Journal of ScienceVol. 146 No. 1, March 2017
61
GNEEZY U, SHAFRIN J. 2009. Why does getting married make you fat? Incentives and appearance maintenance. San Diego: Rady School of Management, University of California. 26p. Accessed from http://jasonshafrin.com/papers/Marriage.pdf on October 12, 2016.
GOUDA J, PRUSTY RK. 2014. Overweight and obesity among women by economic stratum in urban India. J Health Popul Nutr 32(1):79-88. Accessed from https://www.ncbi.nlm.nih.gov/pmc/articles/PMC4089075/ on October 12, 2016.
HAILESSLASSIE K, MALAGUETA A, GIRMA A. 2013. Feeding practices, nutritional status, and associated factors of lactating women in Samre Woreda, South Easthern Zone of Tigray, Ethiopia. Nutr J 12:28.
JELLIFFE DERRICK BRIAN and JELLIFEE PATRICE EF. 1989. Community nutritional assessment: With special reference to lee technically developed countries. Oxford Medical Publications. Oxford University Press.
LAZZER S, BEDOGNI G, LAFORTUNA C, MARAZZI N, BUSTI C, GALLI R, DE COL A, AGOSTO F, SARTORIO A. 2010. Relationship between BMR, gender, age and body composition in 8,780 white obese subjects. Obesity Research Journal 18(1) Accessed from http://onlinelibrary.wiley.com/doi/10.1038/oby.2009.162/full on October 14, 2016.
LUKE B, BROWN M. 2007. Elevated risk of pregnancy complications and adverse outcomes with increasing maternal age. Human Reproduction 22(5):1264-1272.
MENDEZ MA, MONTEIRO CA AND POPKIN BM. 2005. Overweight exceeds underweight women in most developing countries. Am J Clin Nutr 81:714-721.
MONTEIRO CA, CONDE WL, LU B, POPKIN BM.2004. Obesity and inequalities in health in the developing world. Int J Obes Rela Metab Disord 28:1181-1186 [PubMed 15211362].
MONTEIRO CA, D’A BENICIO MH, CONDE WL, POPKIN BM. 2000. Shifting obesity trends in Brazil. Eur J Clin Nutr 54:342-346.
[NSO] NATIONAL STATISTICS OFFICE AND ICF MACRO. 2009. National demographic health survey 2008. Calverton Maryland: National Statistics Office and ICF Macro.
O’ SULLIVAN JB. 1982. Body weight and subsequent diabetes mellitus. JAMA 248:949-52. Accessed at http://www.ncbi.nlm.nih.gov/pubmed/7097963 on April 1, 2016.
PARIZKOVA J, CHIN M-K, CHIA M, YANG J. 2007. An international perspective on obesity, health and physical activity: Current trends and challenges in China and
Asia. J Exerc Sci Fit 5(1): 7-23. Accessed from http://journals.plos.org/plosone/article?id=10.1371/journal.pone.0105469. On October 12, 2016.
PEDRO MRA, BENAVIDEZ RC, BARBA CVC. 2006. Dietary changes and their health implications in the Philippines. Food and Nutrition Research Institute-DOST, General Santos Avenue, Bicutan, Taguig City, Manila, Philippines. p. 20-23.
POPKIN BM, RICHARDS MK AND MONTEIRO CA. 1996. Stunting is associated with overweight in children of four nations that are undergoing the nutrition transition. The Journal of Nutrition: 126(12): 3009-3016.
POPKIN BM. 2006. Global nutrition dynamics: the world is shifting rapidly toward a diet linked with noncommunicable diseases. Am J Clin Nutr 84:289-98. Accessed from http://ajcn.nutrition.org/content/84/2/289.full.pdf.
SENBANJO I, OLAYIWOLA I, AFOLABI W, SENBANJO O. 2013. Maternal and child under- nutrition in rural and urban community of Lagos State, Nigeria: the relationship and risk factors. Biomedical Central. 6: 283. Accessed at http://www.ncbi.nlm.nih.gov/pmc/articles/PMC3725170/pdf/1756-0500-6-286.pdf on April 16, 2016
SHRIMPTOM R. 2013. Nutrition capacity development: a practice framework. Public Health Nutrition. p. 1-7. doi:10.1017/S1368980013001213. Accessed from http://wphna.org/wp-content/uploads/2013/05/CB-Shrimpo-paper-as-published.pdf. on October 12, 2016.
SOHLBERG S, STEPHANSSON O, CNATTINGUIS S, WIKSTROM AK. 2012. Maternal body mass index, height and risk of peeclampsia. Am J Hypertens 25:120-125. Accessed at http://www.ncbi.nlm.nih.gov/pubmed/21976280 on April 1, 2016.
ST-ONGE MP, GALLAGHER D. 2010. Body composition changes with aging: The cause or the result of alterations in metabolic rate and macronutrient oxidation? National Institute of Health 6(2): 152-155. doi:10.1016/j.nut.2009.07.004.Accessed from https://www.ncbi.nlm.nih.gov/pmc/articles/PMC2880224/pdf/nihms201762.pdf.
TARLONI MR, BELTRAN AP, HORTA BL, NAKAMURA MU, ATALLAH AN, MORON AF, VALENTE O. 2009. Prepregnancy BMI and the risk of gestational diabetes: a systematic review of literature with meta-analysis. Obes Rev 10:194-203; Accessed at http://www.ncbi.nlm.nih.gov/pubmed/19055539 on April 1, 2016.
TEMPLE R, MURPHY H. 2010. Type 2 diabetes in
62
pregnancy- an increasing problem. Best Prac Res Clin Endocrinol Metwab 24:591-603 Accessed at http://www.sciencedirect.com/science/article/pii/S1521690X10000576 on April 1, 2016.
TSOI E, SHAIKH H, ROBINSON S, TEO TG. 2010. Obesity in pregnancy: A major healthcare issue. Postgrad Med J 86:617-23. Accessed at http://www.ncbi.nlm.nih.gov/pubmed/20971713 on April 1, 2016.
TZIOIMIS E, ADAIR LS, 2014. Childhood dual burden of under and over-nutrition in low-and middle-income countries: a critical review. National Institutes of Public Health. Food Nutr Bull 35(2): 230-243.
VAN LIESHOUT RJ, TAYLOR VH, BOYLE MH. 2011. Pre-pregnancy BMI and pregnancy obesity and neurodevelopment outcomes in offspring: A systematic review. Obes Rev 12:e548-59. Accessed at http://www.ncbi.nlm.nih.gov/pubmed/21414129 on A p r i l 1 , 2016.
VICTORA GC, ADAIR L, FALL C, HALLAL PC, MARTORELL R, RICHTER L, SACHDEV HS. 2008. Maternal and child undernutrition: Consequences for adult health and human capital. Lancet Series 371: 340-357. Accessed at http://www.thelancet.com/pdfs/journals/lancet/PIIS0140-6736(07)61692-4.pdf on April 12, 2016.
[WHO] WORLD HEALTH ORGANIZATION. 1995. Physical status: The use and interpretation of anthropometry. Report of a WHO Expert Committee. WHO Technical Report Series 854. Geneva. Accessed from http://apps.who.int/bmi/index.jsp?introPage=intro_3.html on April 19, 2016.
[WHO] WORLD HEALTH ORGANIZATION. 2007. Maternal Mortality in 2005: Estimates developed by WHO, UNICEF, UNFPA and the World Bank. Accessed from http://www.who.int/whosis/mme_2005.pdf on April 16, 2016.
[WHO] WORLD HEALTH ORGANIZATION. 2014. Global status report on non-communicable diseases. Attaining the nine global non-communicable diseases targets; a shared responsibility”. Geneva, Switzerland: WHO Press. 302p.
[WHO-WHA] WORLD HEALTH ORGANIZATION- WORLD HEALTH ASSEMBLY. 2014. Global Target 2025 to improve maternal, infant and young child nutrition. WHO website at http://www.who.int/nutrition/en/. Accessed last October 16, 2016
Goyena et al.: Determinants of maternal chronic energy deficiency and overweight/obesity
Philippine Journal of ScienceVol. 146 No. 1, March 2017
63