determinants of competitiveness of the indian auto … paper 201.pdfdeterminants of competitiveness...
TRANSCRIPT
Determinants of Competitiveness of the
Indian Auto Industry
Badri Narayanan G.Pankaj Vashisht
January 2008
INDIAN COUNCIL FOR RESEARCH ON INTERNATIONAL ECONOMIC RELATIONS
Working Paper No. 201
Contents
Foreword ............................................................................................................................. i
Executive Summary .......................................................................................................... ii
1. Literature Review ..................................................................................................... 1 1.1 Introduction ......................................................................................................... 1 1.2 Literature Review ................................................................................................ 2
1.2.1 Global Comparisons ................................................................................... 3 1.2.2 Policy Environment and Evolution of Indian Auto Industry ....................... 4 1.2.3 Productivity ................................................................................................. 7 1.2.4 Aspects Related to Supply Chain and Industrial Structure ......................... 7 1.2.5 Technology and Other Aspects ................................................................. 10
1.3 Contributions of the Study ................................................................................ 13
2. Supply Side Features of Indian Auto Sector ........................................................ 14 2.1 Organised Auto Sector in India ......................................................................... 14 2.2 Unorganised Auto Sector in India ..................................................................... 22 2.3 Conclusions ...................................................................................................... 26
3. Aspects related to Domestic Demand .................................................................... 28 3.1 Sales of Automobiles ........................................................................................ 28 3.2 Price Indices of Automobiles ............................................................................ 35 3.3 Conclusions ....................................................................................................... 37
4. India’s Trade in Automobile and Components .................................................... 38 4.1 Exports from India ............................................................................................ 38 4.2 Imports to India ................................................................................................. 44 4.3 Conclusions ....................................................................................................... 49
5. Global Comparisons ............................................................................................... 50 5.1 Production ......................................................................................................... 50 5.2 Export Performance of Selected Countries ....................................................... 53 5.3 Tariff Structure .................................................................................................. 56 5.4 Free Trade Agreements: The case of Indo-Thai FTA ....................................... 56 5.5 Conclusions ....................................................................................................... 59
6. Field Survey ............................................................................................................. 60 6.1 Objectives ......................................................................................................... 60 6.2 Market Structure and Competitiveness ............................................................. 60
6.2.1 Market Structure ...................................................................................... 60 6.2.2 Aspects of Competitiveness ...................................................................... 61
6.3 Employment-related Aspects ............................................................................ 64 6.4 Capacity Utilisation .......................................................................................... 66 6.5 Aspects Related to Supply Chain ...................................................................... 67 6.6 Production-related Constraints .......................................................................... 69
6.6.1 Transport Infrastructure ........................................................................... 69 6.6.2 Power ........................................................................................................ 70
2
6.6.3 Labour ....................................................................................................... 70 6.6.4 Materials ................................................................................................... 70 6.6.5 Taxation and Incentives ............................................................................ 70 6.6.6 Environment .............................................................................................. 71 6.6.7 Other Constraints ...................................................................................... 71
6.7 Strategies of Different Firms ........................................................................... 71 6.7.1 Strategies of OEMs ................................................................................... 71 6.7.2 Strategies of Auto-component Firms ........................................................ 72
6.8 Policy Measures ................................................................................................ 73 6.9 Conclusions ....................................................................................................... 74
7. Policy Framework Surrounding the Indian Auto Sector .................................... 76 7.1 Evolution of the Policy Framework .................................................................. 76 7.2 Emission and Safety Standards ......................................................................... 79 7.3 Inter-State Differences in Policies .................................................................... 80
7.3.1 Tax Policies ...................................................................................................... 80 7.3.2 Subsidies .......................................................................................................... 80 7.3.3 Other Provisions .............................................................................................. 81
7.4 Conclusions ....................................................................................................... 81
8. Impact of Fiscal and Trade Policies on the Indian Auto Sector ......................... 82 8.1 Excise and Customs Duties ............................................................................... 82 8.2 Effective Rates of Protection ........................................................................... 84 8.3 Conclusions ....................................................................................................... 86
9. Econometric Analysis: Policies and Strategies ..................................................... 87 9.1 Technical Efficiency and its Determinants: Stochastic Frontier Analysis ........ 87 9.2 Determinants of Cost Competitiveness: Panel Data Analysis .......................... 89 9.3 Determinants of Market Shares ........................................................................ 91 9.4 Implications for Policies and Strategies ............................................................ 93
10. Policy Recommendations ...................................................................................... 102
References ...................................................................................................................... 106
Appendix 1: Supply Side Features .............................................................................. 109
Appendix 2: India’s Trade of Auto Products ............................................................. 125
Appendix 3: Field Survey ............................................................................................. 131
Appendix 4: Econometric Analysis ............................................................................. 140
List of Tables
Table 2.1.1: Recent Annual Average Growth Rates in Indian Auto Industry .................. 15 Table 2.1.2: Comparison of Growth Rates in Emoluments and Labour Productivity ...... 16 Table 2.1.3: Import Content of Indian Auto Industry ....................................................... 21 Table 2.2.1: Annual Average Growth Rates in Unorganised Auto Sector: 1994-95 to
2000-01 .......................................................................................................... 23 Table 2.2.2: Performance of Unorganised Auto Sector .................................................... 23 Table 2.2.3: Comparison of Organised and Unorganised Auto Sectors ........................... 24 Table 2.2.4: Comparison of Growth rates of Organised and Unorganised Sectors: 1994-95
to 2005-06 ...................................................................................................... 25 Table 3.1.1: Growth Rates in Auto Sales (in %, based on Number of Vehicles sold) ..... 31 Table 4.1.1: Growth Rates of Aggregate Auto Exports (in %, based on value in Rs. lakh
at constant prices, base 1993-94) ................................................................... 39 Table 4.1.2: Growth Rates of Exports of Different Vehicle Segments (in %, based on
value in Rs. lakh at constant prices, base 1993-94) ....................................... 39 Table 4.1.3: Growth Rates of Exports of Different Auto-component Categories (in %,
based on value in Rs. lakh at constant prices, base 1993-94) ........................ 40 Table 4.1.4: Growth Rates of Region-wise Auto Exports (in %, based on value in Rs. lakh
at constant prices, base 1993-94) ................................................................... 42 Table 4.1.5 : Growth Rates of Region-wise Vehicle Exports (in %, based on value in Rs.
lakh at constant prices, base 1993-94) ........................................................... 42 Table 4.1.6: Growth Rates of Region-wise Auto-Component Exports (in %, based on
value in Rs. lakh at constant prices, base 1993-94) ....................................... 43 Table 4.2.1: Growth Rates in Imports of Vehicles and Components (in %, based on value
in Rs. lakh at constant prices, base 1993-94) ................................................. 45 Table 4.2.2: Segment-wise Growth Rates in Imports of Vehicles (in %, based on value in
Rs. lakh at constant prices, base 1993-94) ..................................................... 45 Table 4.2.3: Category-wise Growth Rates in Imports of Auto-components (in %, based on
value in Rs. lakh at constant prices, base 1993-94) ....................................... 46 Table 4.2.4: Growth Rates of Region-wise Auto-component Imports to India (in %, based
on value in Rs. lakhs at constant prices, base 1993-94). ............................... 48 Table 5.1.1: Region-wise Production of Motor Vehicles (in Number) ............................ 50 Table 5.1.2: Region-wise Production of Passenger Cars .................................................. 51 Table 5.1.3: Region-wise Production of Buses and Coaches ........................................... 52 Table 5.1.4: Region-wise Production of Light Commercial Vehicles .............................. 52 Table 5.1.5: Region-wise Production of Heavy Trucks .................................................... 53 Table 5.3.1: Comparison of Tariff Structure of Auto Products in Different Countries
(2004-05). ...................................................................................................... 56 Table 5.4.1: Indo-Thai Trade in Auto-Components in the recent years (in Rs. lakh,
Current Prices). .............................................................................................. 57 Table 5.4. 2: Vehicle Possession in Different Countries .................................................. 59 Table 6.2.1: Cost Composition of Firms Covered in the Survey ...................................... 64 Table 6.3.1: Aspects Related to Employment ................................................................... 66 Table 8.1.1: Recent Trends in Tariff Structure in Indian Auto Industry .......................... 84 Table 8.2.1: Effective Rates of Protection in percentage .................................................. 85
2
Table 9.1.1: Determinants of Technical Inefficiency in Indian Automobile Firms .......... 95 Table 9.1.2: Determinants of Technical Inefficiency in Indian Auto-component Firms .. 96 Table 9.2.1: Determinants of Cost Competitiveness of Automobile Firms ...................... 97 Table 9.2.2: Determinants of Cost Competitiveness of Auto-component Firms .............. 98 Table 9.3.1: Determinants of Market Shares of Automobile Firms ................................. 99 Table 9.3.2: Determinants of Market Shares of Auto-component Firms ....................... 100 Table 9.3.3: Other Determinants of Market Shares of Auto-component Firms ............. 101
List of Figures
Figure 2.1.1: Market Concentration (HHI) in Indian Auto Industry ................................ 15 Figure 2.1.2: Labour Intensity in Indian Auto Industry (number of employees per Rs.
crore of output at constant 1993-94 prices) ................................................... 16 Figure 2.1.3: Composition of Input Cost: Manufacture of ............................................... 17 Figure 2.1.4: Composition of Input Cost: Manufacture of ............................................... 17 Figure 2.1.5: Composition of Input Cost: Manufacture of Bodies, Parts & ..................... 18 Figure 2.1.6: Capacity Utilisation in Indian Automobile Industry ................................... 18 Figure 2.1.7: Role of Foreign Equity Participation in Indian Auto Industry (2000-01 to
2005-06) ......................................................................................................... 20 Figure 2.1.8: Export Intensity in Indian Auto Industry .................................................... 22 Figure 2.2.1: Comparison of Cost structure in Organised and Unorganised Auto Sectors
....................................................................................................................... 25 Figure 3.1.1: Domestic Sales of Automobiles (Number) ................................................. 28 Figure 3.1.2: Domestic Sales of Passenger Vehicles (Number) ....................................... 29 Figure 3.1.3: Domestic Sales of Commercial Vehicles (Number) ................................... 29 Figure 3.1.4: Domestic Sales of Two-Wheelers (Number) .............................................. 30 Figure 3.1.5: Sales of Scooters in terms of ....................................................................... 32 Figure 3.1.6: Sales of Motorcycles in terms of ................................................................. 32 Figure 3.1.7: Sales of Motorcycles in terms of ................................................................. 32 Figure 3.1.8: Sales of Motorcycles in terms of ................................................................. 33 Figure 3.1.9: Sales of Mopeds (Engine Capacity<75 cc) (Number) ................................. 33 Figure 3.1.10: Sales of Passenger Cars in terms of Sub-segments ................................... 34 Figure 3.1.11: Sales of Other Passenger Vehicles ............................................................ 34 Figure 3.2.1: Wholesale Price Indices of Automobiles & All .......................................... 35 Figure 3.2.2: Wholesale Price Indices of Different Segments in ...................................... 36 Figure 3.2.3: Growth Rates of Wholesale Price Indices of ............................................... 36 Figure 4.1.1: Exports of Indian Auto Industry .................................................................. 38 Figure 4.1.2: Composition of Indian Auto Exports .......................................................... 38 Figure 4.1.3: Region-wise Exports from Auto industry ................................................... 41 Figure 4.1.4: Region-wise Composition of Exports from Auto industry ......................... 41 Figure 4.2.1: Imports of Indian Auto Industry .................................................................. 44 Figure 4.2.2: Composition of Imports of Indian Auto Industry ........................................ 44 Figure 4.2.3: Region-wise Auto Imports .......................................................................... 47 Figure 4.2.4: Region-wise Shares of Auto Imports .......................................................... 47
3
Figure 5.2.1: Country Shares of Global Exports of Tractors ............................................ 55 Figure 5.2.2: Country Shares of Global Exports of Public Transport Vehicles ............... 55 Figure 5.2.3: Country Shares of Global Exports of Passenger Vehicles .......................... 55 Figure 5.2.4: Country Shares of Global Exports of Commercial Vehicles ...................... 55 Figure 5.2. 5: Country Shares of Global Exports of Chassis ............................................ 55 Figure 5.2. 6: Country Shares of Global Exports of Components of Automobiles (Except
Two-wheelers) ............................................................................................... 55 Figure 5.2. 7: Country Shares of Global Exports of Two-wheeler Components .............. 55 Figure 5.2. 8: Country Shares of Global Exports of Two-wheelers ................................. 55 Figure 5.4.1: Global Comparison of Real Lending Interest Rates .................................... 58 Figure 6.2.1: Cost Structure across Regions and Types in India ...................................... 63 Figure 8.1.1: Excise Duty Structure for Automobiles ...................................................... 82 Figure 8.1.2: Excise Duty Structure for Two-/Three-Wheelers (in %) ............................ 83 Figure 8.1.3: Customs Duties and their Impact on ........................................................... 83
i
Foreword
Though not to the same extent as the telecom sector, the automobile and auto-component industry has also emerged as one of the recent success stories. As in all other countries, the Indian automobile industry is one of the key drivers of industrial growth and employment which will further gain in importance in the coming years. Its recent record of rapid output growth, productivity improvements and expanding share in global markets has perhaps not been so well documented. This study fills that gap. The study will help us understand how the industry’s success is quite directly linked to the trade and industrial policy reforms initiated in the early 1990s. More importantly, the study will identify the critical constraints that prevent the industry from further expansion in the global share and emerge as one of the major production and export hubs in the coming years. This analysis is based on a comprehensive review of secondary literature and an extensive fieldwork which covered the major automobile assemblers and auto-component manufacturers across all the three tiers so as to cover the largest and the smallest component producers. This has allowed us to make some specific policy recommendations which have been discussed with the industry representatives more than once. Theses recommendations, if accepted and implemented, could contribute to India’s emergence as one of the major automobile producing economies in the world. Given our domestic demand and the entrepreneurial talent, this would be a natural outcome. The study has been supported by the National Manufacturing Competitiveness Council (NMCC) and the Automobile Component Manufacturers Association (ACMA). Their support was not limited only to the financial resources they provided. We were fortunate to interact with NMCC on a regular basis and get their inputs for required mid-course changes. ACMA was very forthcoming with all the secondary data and support for the fieldwork undertaken. Its elder sister association, the Society of Indian Automobile Manufacturers (SIAM) also helped with data, advice and spirited arguments which have helped to sharpen and correct the focus of some of our recommendations. I am indeed grateful to NMCC and ACMA for their generous support, involvement and for the inputs of their members in the study. Given the importance of the automobile industry for the progress of the manufacturing sector and indeed for the Indian economy, ICRIER will continue its work in this area. This study should, therefore, be seen also as a first phase of an ongoing enquiry. We are hopeful that the recommendations included here will merit the attention of both the government and the industry.
Rajiv Kumar Director & Chief Executive
January 18, 2008
ii
Executive Summary
1. This study analyses the determinants of competitiveness in the Indian auto industry. It is based on a field survey and a quantitative analysis of secondary data. The field survey covers 45 firms all over India, of which 31 are auto-component firms and 14 are Original Equipment Manufacturers (OEMs).
2. From 2001-02 to 2005-06, the Indian automobile sector has grown at an average annual rate of over 18 per cent in terms of value of output at constant 1993-94 prices and the auto-component sector has grown at about 26 per cent. During the same period, in terms of domestic sales in numbers, two-wheelers have grown at over 13 per cent per annum; three-wheelers at more than 15 per cent commercial vehicles at about 25 per cent per annum and the number of passenger vehicles by 17 per cent per annum.
3. Vehicle exports at constant 1993-94 prices have grown at an average annual rate of more than 55 per cent from 2001-02 to 2005-06, while auto-component exports have grown at 21 per cent. Two-wheeler exports have seen an annual average growth rate of 27 per cent; passenger car exports have grown at 80 per cent; and commercial vehicles at about 55 per cent.
4. The effective rate of protection on automobiles is much higher than on components. For example, during 2006-07, while nominal custom duties were 60 per cent for automobiles (other than commercial vehicles), 12.5 per cent for commercial vehicles and 12.5 per cent for auto-components, effective rates of protection were 183.5 per cent, 12.5 per cent and 10.1 per cent, respectively.
5. With the higher countervailing duty and other cesses/levies, the effective rate of protection for automobile sector would be even higher.
6. This differential rate of effective protection distorts resource allocation and investment pattern in the industry.
7. The auto-component sector has much higher employment-generation potential and export-intensity than the auto assembly segment of the sector. The component manufacturers are now globally competitive and are also maintaining reasonable profitability levels despite a tariff protection of only 7.5 per cent.
8. The import tariff for the assembled vehicles is 60 per cent. Given the low level of protection both for the auto components and CKD/SKD kits, this clearly reflects a policy bias in favour of auto assemblers.
9. The reduction in import duties on assembled units may be undertaken in a phased manner and after ensuring that Indian automobile companies get comparable access to ASEAN and Chinese markets.
10. The anti-dumping mechanism should be strengthened to prevent the dumping of vehicles in the Indian market.
iii
11. The government must also ensure that the large infrastructure deficit faced by this important sector is addressed urgently so that any adverse impact of macro-economic policies is avoided. These are important steps if import duty structure is to be rationalized.
12. Materials cost is the major component in production cost and its share is increasing. Policy measures to reduce domestic indirect taxes on all inputs for the auto industry would be a welcome step to enhance competitiveness. The Chinese auto industry faces a flat 17 per cent indirect tax incidence, so our aim should be to reach that level.
13. Significant scaling up is required at all levels in the Indian auto-component sector so that economies of scale are gained and cost of production reduced.
14. One of the major constraints for the smaller auto-component manufacturers in increasing their scales of production is lack of credit availability at interest rates comparable to other countries. This is also confirmed by our econometric analysis.
15. R&D expenditure as a share of turnover is low in the Indian auto-component sector ranging between 0 and 1.5 per cent while it is 0.5-3 per cent for the automobile sector. In fact, most of the smaller auto-component firms and a few of the bigger ones do not have an R&D facility. Policy intervention is urgently needed to improve the R&D activities in the Indian auto industry. Since fiscal incentives are not working, a scheme of special credit for R&D would be useful to induce the R&D activities.
16. India’s current levels of tariff on capital goods are higher than those in the ASEAN and China. Thus, these tariffs should be brought down further to enhance competitiveness.
17. The Indian auto industry does not possess good design facilities. The Government needs to significantly strengthen non-proprietary R&D and design capacity that has strong connections with research institutes like IITs. This could be used by all the players in the industry to develop new models, reduce material costs and become more competitive.
18. Skill shortages and skill mismatches have emerged as a major constraint. To address this critical concern, the proposed National Auto Institute1 should be quickly established with active participation of private industry players.
19. There is a significant and increasing use to contract workers in the industry. Labour
reforms, aimed at more flexibility, are widely considered among the industrialists as an essential step. This will encourage firms to employ and retain more permanent workers and improve learning and raise productivity levels.
1 National level Automotive Institute for training on automobile has been proposed in Automotive Mission
Plan. This should preferably be established in all major auto hubs in India. In addition to regular long-term courses such as diplomas and degrees, it should also provide short-term specialised training programmes for personnel already working in the auto industry.
iv
20. It is important to recognize that labour reforms are expected to increase overall employment in the auto sector and will also help firms in the organised sector to scale up.
21. The unorganised sector contributes 30 per cent to total employment, 15 per cent to fixed assets and only 1.5 per cent to output in auto industry in India. This sector has much lower capital and labour productivity than the organised sector. The share of power/fuel cost in total costs are much higher in the unorganised sector. Hence, policy measures are required to incentivise these smaller firms to use power and fuel more efficiently, by adopting better technologies and taking steps to minimise wastage.
22. In the econometric analysis, foreign equity participation is found to be correlated with technical efficiency. Therefore, both centre and state governments should create a conducive environment for attracting more FDI.
23. The trend of mid-sized vehicles capturing a large market share is expected to continue in the foreseeable future.
24. A detailed roadmap for strict implementation of emission standards that are harmonised across states should be drawn up. This could go a long way in ensuring that the entire automotive supply chain upgrades quality and technology.
25. While the implementation of VAT is a positive step, remaining differential in indirect taxes should be eliminated by moving to the GST. The currently prevalent region-specific fiscal concessions are creating the unsustainable locational distortions in the industry.
26. So far, India’s FTA with Thailand has resulted in a net trade gain for India. The government must, however, ensure comparable, if not preferential, market access to domestic firms in partner countries, especially in the Asia-Pacific region, while negotiating FTAs.
27. The principles pertaining to the rules of origin have to be strictly implemented. ______________________________________
JEL Classification: L62, F14, O25, D24 Key Words: Indian Auto Industry, Competitiveness, Efficiency and Indian Auto Policy.
Views expressed in this paper are those of the authors and may not necessarily reflect the views of the organization
1
1. Literature Review*
1.1 Introduction
The automobile sector is a key player in the global and Indian economy. The global motor vehicle industry (four-wheelers) contributes 5 per cent directly to the total manufacturing employment, 12.9 per cent to the total manufacturing production value and 8.3 per cent to the total industrial investment. It also contributes US$560 billion to the public revenue of different countries, in terms of taxes on fuel, circulation, sales and registration. The annual turnover of the global auto industry is around US$5.09 trillion, which is equivalent to the sixth largest economy in the world (Organisation Internationale des Constructeurs d'Automobiles, 2006). In addition, the auto industry is linked with several other sectors in the economy and hence its indirect contribution is much higher than this. All over the world it has been treated as a leading economic sector because of its extensive economic linkages. India’s manufacture of 7.9 million vehicles, including 1.3 million passenger cars, amounted to 2.4 per cent and 7 per cent, respectively, of global production in number. The auto-components manufacturing sector is another key player in the Indian automotive industry. Exports from India in this sector rose from US$1.0 billion in 2003-04 to US$1.8 billion in 2005-06, contributing 1 per cent to the world trade in auto-components in current USD. In India, the automobile industry provides direct employment to about 5 lakh persons. It contributes 4.7 per cent to India’s GDP and 19 per cent to India’s indirect tax revenue. Till early 1980s, there were very few players in the Indian auto sector, which was suffering from low volumes of production, obsolete and substandard technologies. With de-licensing in the 1980s and opening up of this sector to FDI in 1993, the sector has grown rapidly due to the entry of global players. A rapidly growing middle class, rising per capita incomes and relatively easier availability of finance have been driving the vehicle demand in India, which in turn, has prompted the government to invest at unprecedented levels in roads infrastructure, including projects such as Golden Quadrilateral and North-East-South-West Corridor with feeder roads.2 The Reserve Bank of India’s (RBI) Annual Policy Statement documents an annual growth of 37.9 per cent in credit flow to vehicles industry in 2006.3 Given that passenger car penetration rate is just about 8.5 vehicles per thousand, which is among the lowest in the world, there is a huge potential demand for automobiles in the country.
* We are grateful to Dr. Rajiv Kumar, Director & CE, ICRIER, Dr. Ramesh Chandra, Professor, ICRIER
and Ms. Nisha Taneja, Senior Fellow, ICRIER, for their valuable comments and suggestions. The usual disclaimer applies.
2 However, the road infrastructure still remains much below global standards. 3 Although credit availability may have boosted vehicle demand, the recent monetary tightening and hike
in interest rates may adversely affect vehicle demand.
2
There are two distinct sets of players in the Indian auto industry: Automobile component manufacturers and the vehicle manufacturers, which are also referred to as Original Equipment Manufacturers (OEMs). While the former set is engaged in manufacturing parts, components, bodies and chassis involved in automobile manufacturing, the latter is engaged in assembling of all these components into an automobile.4 The Indian automotive component manufacturing sector consists of 500 firms in the organised sector and around 31,000 enterprises in the unorganised sector. In the domestic market, the firms in this sector supply components to vehicle manufacturers, other component suppliers, state transport undertakings, defence establishments, railways and even replacement market. A variety of components are exported to OEMs abroad and after-markets worldwide. The automobile manufacturing sector, which involves assembling the automobile components, comprises two-wheelers, three-wheelers, four-wheelers, passenger cars, light commercial vehicles (LCVs), heavy trucks and buses/coaches. In India, mopeds, scooters and motorcycles constitute the two-wheeler industry, in the increasing order of market share. In 2005-06, the Indian auto sector had produced over 7.6 million two-wheelers and 1.3 million passenger cars and utility vehicles. India is a global major in the two-wheeler industry producing motorcycles, scooters and mopeds principally of engine capacities below 200 cc. It is the second largest producer of two-wheelers and 13th largest producer of passenger cars in the world. Tata figures among the ten largest global manufacturers of LCVs, heavy trucks, buses and coaches, while it is among the top 25 in passenger car manufacturing. The two-wheeler industry in India has grown at a compounded annual growth rate of more than 10 per cent (in number) during the last five years and has also witnessed a shift in the demand mix, with sales of motorcycles showing an increasing trend. Indian two-wheelers comply with some of the most stringent emission and fuel efficiency standards worldwide. The passenger car segment has been growing at a rapid pace -- from over 6,50,000 vehicles sold during 2001 to over a million vehicles sold during 2004-05, showing an annual growth rate of 17.36 per cent. With this general introduction, Section 1.2 presents a review of recent literature on the Indian auto industry and appraises it critically. Section 1.3 attempts to identify the gaps in the literature and highlights the contributions of this study. 1.2 Literature Review As noted by NMCC (2006), competitiveness of manufacturing sector is a very broad multi-dimensional concept that embraces numerous aspects such as price, quality, productivity, efficiency and macro-economic environment. The OECD definition of competitiveness, which is most widely quoted, also considers employment and
4 However, many OEMs also provide or upgrade technologies of auto-component manufacturers to build
up supply chain.
3
sustainability, while being exposed to international competition, as features pertaining to competitiveness. There are numerous studies on auto industry in India, published by industry associations, consultancy organisations, research bodies and peer-reviewed journals. In this section, various studies on the Indian auto industry are reviewed, under different heads pertaining to competitiveness, namely, global comparisons, policy environment and evolution of the Indian auto industry, productivity, aspects related to supply-chain and industrial structure and technology and other aspects. 1.2.1 Global Comparisons The Investment Information and Credit Rating Agency of India (ICRA, 2003) studies the competitiveness of the Indian auto industry, by global comparisons of macro-environment, policies and cost structure. This has a detailed account on the evolution of the global auto industry. The United States was the first major player from 1900 to 1960, after which Japan took its place as the cost-efficient leader. Cost efficiency being the only real means in as mature an industry as automobiles to retain or improve market share, global auto manufacturers have been sourcing from the developing countries. India and China have emerged as favourite destinations for the first-tier OEMs since late 1980s. There are only a few dominant Indian OEMs, while the number of OEMs is very large in China (122 car manufacturers and 120 motorcycle manufacturers). According to this study, the major advantage of the Indian economy is educated and skilled workforce with knowledge of English. Our disadvantages include poor infrastructure, complicated tax structure, inflexible labour laws, inter-state policy differences and inconsistencies. The drivers of Chinese economic growth are FDI, labour productivity growth, which was 1.5 times higher than that in India in the last decade, and domestic demand. Fiscal pressure is mounting on the Chinese government, while India is in a better state. Based on comparisons of cost composition to pinpoint the areas in which the Indian auto industry is at a disadvantage, this study recommends a VAT regime, speedy procedures, imports duty cuts on raw materials, common testing and design facility, labour reforms, upgradation of design and engineering capabilities and brand building. ICRA (2004a) analyses the implications of the India-ASEAN5 Free Trade Agreements for the Indian automotive industry. ASEAN economies are globally more integrated than India. The current size of Indian and ASEAN market for automobiles is more or less the same but the Indian market has a larger growth potential than the ASEAN market due to the low level of penetration. The labour cost is low in India but the stringent labour regulations erode this advantage. The level of infrastructure is better in India than Indonesia and the Philippines but worse than that in other ASEAN countries. The financial and banking sector is better in India than in the ASEAN countries. The study notes that there is a huge excess capacity in ASEAN countries, in comparison with that in India, which will help them to tackle the excess demand that may arise in future. The study finds a 20-30 per cent cost disadvantage for Indian companies on account of taxation and infrastructure and 5-20 per cent labour cost advantage over comparable 5 Association of South East Asian Nations.
4
ASEAN-member-based companies. Similar findings are noted in a study by the Automotive Component Manufacturers Association of India (ACMA, 2004), particularly in comparison with Thailand. ICRA (2004b) analyses the impact of Preferential Trade Agreement (PTA) with MERCOSUR6 on the automobile sector in India. This study finds a significant threat of imports in sub-compact and compact cars and certain auto-components. There is huge excess capacity and intense competition in MERCOSUR countries, propelling them to look for export opportunities. This is true especially of Brazil, which has a well-developed auto-component sector with huge economies of scale. Further, weak currency in all MERCOSUR countries provides a natural tariff barrier. In addition, MERCOSUR countries have an equitable arrangement within themselves to have a balanced trade, with fair level of exports and imports. The Indian auto industry could gain from this PTA with MERCOSUR only if it is assured of the balanced trade, as MERCOSUR countries practise among themselves. ICRA (2005) studies the possible impact of FTA with South Africa on the Indian automobile industry. The study finds that there are a few policies in South Africa that indirectly subsidise the auto industry, unlike India, in terms of financial grants. Hence it is suggested that India could minimise losses only if it goes for inclusion of certain auto-components, which involve huge logistic costs of imports, creating a natural protection (for example, stampings, glass, seats, plastics and tyres) and those in which India enjoys economies of scale and is cost-competitive (e.g. castings and forgings) in this FTA. If South Africa is ready to discontinue the schemes such as Motor Industry Development Programme (MIDP), India could include all automotive components in this FTA. There should be a minimum local content of 60 per cent and the agreement should not be trade-balancing as India will not gain much in that case. 1.2.2 Policy Environment and Evolution of Indian Auto Industry In this section, studies on the policy environment pertaining to the Indian auto industry and its evolution over the years have been reviewed. Pingle (2000) reviews the policy framework of India’s automobile industry and its impact on its growth. While the ties between bureaucrats and the managers of state-owned enterprises played a positive role especially since the late 1980s, ties between politicians and industrialists and between politicians and labour leaders have impeded the growth. The first phase of 1940s and 1950s was characterised by socialist ideology and vested interests, resulting in protection to the domestic auto industry and entry barriers for foreign firms. There was a good relationship between politicians and industrialists in this phase, but bureaucrats played little role. Development of ancillaries segment as recommended by the L.K. Jha Committee report in 1960 was a major event that took place towards the end of this phase. During the second phase of rules, regulations and politics, many political developments and economic problems affected the auto industry, especially passenger cars segment, in the 1960s and 1970s. Though politicians picked 6 Southern Common Market, which comprises Latin American countries.
5
winners and losers mainly by licensing production, this situation changed with oil crises and other related political and macro-economic constraints. The third phase starting in the early 1980s was characterised by delicensing, liberalisation and opening up of FDI in the auto sector. These policies resulted in the establishment of new LCV manufacturers (for example, Swaraj Mazda, DCM Toyota) and passenger car manufacturers.7 All these developments led to structural changes in the Indian auto industry. Pingle argues that state intervention and ownership need not imply poor results and performance, as demonstrated by Maruti Udyog Limited (MUL). Further, the non-contractual relations between bureaucrats and MUL dictated most of the policies in the 1980s, which were biased towards passenger cars and MUL in particular. However, D’Costa (2002) argues that MUL’s success is not particularly attributable to the support from bureaucrats. Rather, any firm that is as good as MUL in terms of scale economies, first-comer advantage, affordability, product novelty, consumer choice, financing schemes and extensive servicing networks would have performed as well, even in the absence of bureaucratic support. D’Costa has other criticisms about Pingle (2000). The major shortcoming of Pingle’s study is that it ignores the issues related to sector-specific technologies and regional differences across the country. Piplai (2001) examines the effects of liberalisation on the Indian vehicle industry, in terms of production, marketing, export, technology tie-up, product upgradation and profitability. Till the 1940s, the Indian auto industry was non-existent, since automobile were imported from General Motors and Ford. In early 1940s, Hindustan Motors and Premier Auto started, by importing know-how from General Motors and Fiat respectively. Since the 1950s, a few other companies entered the market for two-wheelers and commercial vehicles. However, most of them either imported or indigenously produced auto-components, till the mid-1950s, when India had launched import substitution programme, thereby resulting in a distinctly separate auto-component sector. Due to the high degree of regulation and protection in the 1970s and 1980s, the reforms in the early 1990s had led to a boom in the auto industry till 1996, but the response of the industry in terms of massive expansion of capacities and entry of multinationals led to an acute over-capacity. Intense competition had led to price wars and aggressive cost-cutting measures including layoffs and large-scale retrenchment. While Indian companies started focusing on the price-sensitive commercially used vehicles, foreign companies continued utilizing their expertise on technology-intensive vehicles for individual and corporate uses. Thus, Piplai concludes that vehicle industry has not gained much from the reforms, other than being thrusted upon a high degree of unsustainable competition. In August 2006, a Draft of Automotive Mission Plan Statement prepared in consultation with the industry was released by the Ministry of Heavy Industries and Public
7 Maruti Udyog Limited (MUL) was the only new entrant in passenger car segment from 1982 to 1993,
after which foreign firms such as Hyundai, Honda, Toyota, etc., started entering. This was despite the fact that many CV manufacturers had entered in early 1980s. Pingle takes this as an evidence for the fact that the relationship between bureaucrats and managers in MUL played a role in protecting MUL.
6
Enterprises. This was finally released as a report in December 2006. This document draws an action plan to take the turnover of the automotive industry in India to US$145 billion by 2016, accounting for more than 10 per cent of the GDP and providing additional employment to 25 million people, by 2016. A special emphasis is laid on small cars, MUVs, two-wheelers and auto-components. Measures suggested include setting up of a National Auto Institute, streamlining government/educational/research institutions to the needs of the auto industry, upgrading infrastructure, considering changes in duty structure and fiscal incentives for R&D. Similarly, NMCC (2006), which lays down a national strategy for manufacturing, recognises the importance of the Indian automobile and auto-component industry, particularly the latter, as a competitive knowledge-based industry with immense employment generation potential. McKinsey (2005) predicts the growth potential of India-based automotive component manufacturing at around 500 per cent, from 2005 to 2015. This report describes the initiatives required from industry players, the Government and the ACMA to capture this potential. This study was based on interviews and workshops with 20 suppliers and 7 OEMs and survey with ACMA members. Increase in cost pressures on OEMs in developed countries, coupled with the emergence of skilled, cost-competitive suppliers in Low Cost Countries (LCCs), is likely to facilitate further acceleration of sourcing of automotive components from LCCs. The analysis identifies strong engineering skills and an emerging culture of cost-competitiveness as the major strengths of the Indian auto-component sector, while its weaknesses include slow growth in domestic demand and structural disadvantages such as power tariffs and indirect taxes. The policy recommendations of this study include VAT implementation, lower indirect taxes, power reforms, tax benefits linked to export earnings, duty-cut for raw material imports, R&D incentives for a longer period, establishment of auto parks, benefits for export-seeking investments, human resources development and modernisation fund for new investments in auto clusters. Industry players have been advised to improve their operational performance, determine their strategic posture as one among those identified in the study, improve capabilities in line with their posture and invest very rapidly in a planned manner. ACMA needs to promote India as a brand, enable sourcing from India by global customers and promote the quality and productivity efforts of the auto-component firms in India. ACMA (2006) notes that India’s joining the WP (Working Party) 29: 1998 Agreement for global harmonisation of automotive standards, coupled with the funding of National Automotive Testing and Research Infrastructure Project (NATRIP) by the Government of India, has increased prospects of the Indian auto industry rising up to global standards in the near future, in all aspects. Narayanan (1998) analyses the effects of deregulation policy on technology acquisition and competitiveness in the Indian automobile industry during the 1980s and finds that competitiveness has depended on the ability to build technological advantages, even in an era of capacity-licensing. In a liberalised regime, this would depend on firms’ ability to bring about technological changes, as inferred from the behaviour of new firms in the
7
sample considered. Further, vertical integration could score over subcontracting in a liberal regime. This is probably because of the entry of new foreign firms that produce technologically superior and guaranteed quality vehicles and choose to produce most of the components in-house.8 Narayanan (2004) analyses the determinants of growth of Indian automobile firms during three different policy regimes, namely, licensing (1980-81 to 1984-85), deregulation (1985-86 to 1990-91) and liberalisation (1991-92 to 1995-96). Unlike the prediction by Narayanan (1998), this study finds that vertical integration is detrimental for growth in a liberalised regime as it potentially limits diversification. Narayanan (2006) also finds that vertical integration plays a positive role in a regulated regime, while it is not conducive for export competitiveness in a liberal regime. Kathuria (1995) notes that the time-bound indigenization programme for commercial vehicles in the 1980s facilitated the upgradation of vendor skills and modifying vehicles to suit local conditions, which demand functional efficiency, overloading capabilities, fuel economy, frequent changes in speed and easy repair and maintenance. Kathuria also mentions that the choice between vertical integration and subcontracting crucially depends on the policy regime: In a liberal regime, vertical integration may not work. 1.2.3 Productivity Sharma (2006) analyses the performance of the Indian auto industry with respect to the productivity growth. Partial and total factor productivity of the Indian automobile industry have been calculated for the period from 1990-91 to 2003-04, using the Divisia-Tornquist index for the estimation of the total factor productivity growth. The author finds that the domestic auto industry has registered a negative and insignificant productivity growth during the last one and a half decade. Among the partial factor productivity indices only labour productivity has seen a significant improvement, while the productivity of other three inputs (capital, energy and materials) haven’t shown any significant improvement. Labour productivity has increased mainly due to the increase in the capital intensity, which has grown at a rate of 0.14 per cent per annum from 1990-91 to 2003-04. 1.2.4 Aspects Related to Supply Chain and Industrial Structure In this section, the studies that examine the aspects pertaining to local and global auto supply chains as well as the structure of the Indian auto industry are reviewed. Humphrey (1999) compares the impact of globalisation on supply chain networks in the auto industry in Brazil and India. According to Humphrey, global auto industry hubs were situated in three regions, namely, North America, Western Europe and Japan. Brazil and India are examples of the countries which could develop the indigenous auto industry despite not being situated very close to any of these regions. Hence, Humphrey compares the auto industries in these two countries. This study considers auto industry as a
8 However, as Narayanan (2004) notes, vertical integration was gradually replaced by subcontracting,
because Indian auto-component sector could emerge as a competitive sector after the entry of foreign firms.
8
producer-driven commodity chain, wherein global auto assemblers control the entire supply chain from components to dealerships. While the global auto assembly majors used to produce 60-70 per cent of the value in-house till the 1980s, various phenomenal developments have started taking place since the 1980s, such as the emergence of independent dealers and rise of catalogue suppliers who supply their standard and indigenously designed components/modules to many assemblers. Brazil and India had liberalised auto investments and tariff structure since 1990. Prior to 1991, India had a much more protectionist regime than Brazil, in terms of licensing and quantitative restrictions on both imports and domestic production. Inflows of auto FDI occurred in both the countries since the mid-1990s. Further, Brazil and India have emerged as preferred suppliers for global auto assemblers. When the global auto assemblers entered India and Brazil, the phenomenon of ‘follow-source’9 was also happening. Now, there are parallel global networks of both assemblers and Tier-1 suppliers. Even Indian component suppliers have opportunities to enter the global auto supply chains, mainly in low technology products made to detailed drawings but the space for domestic industry is diminishing. With the global centralization of product engineering, skill requirements are likely to be immense in process engineering, particularly in assemblers and Tier-1 component manufacturers. Sutton (2000) compares the auto-component supply chains in India and China, based on field surveys. In both these countries, the supply chain has developed very rapidly at the level of car makers and Tier-1 suppliers, with quality levels close to world standards, largely driven by the entry of multinational car makers. But, the Tier-2 suppliers are still not up to the global standards. The domestic content requirements, based on the infant industry argument, have helped the international car makers in enhancing the production capabilities of the domestic players effectively, as shown by increases in auto-component exports from India and China. Of the top ten exporting firms in India and China, five and six are domestic ones, respectively. Enhanced supply-chain capabilities have benefited the domestic auto-makers as well, such as Mahindra and Mahindra in India, who have been able to capture a sizeable market share with their indigenously designed and assembled MUV. Some leading component producers in China and India strategically use highly capital-intensive techniques such as robotics, occasionally, despite the low wages, mainly on account of their concerns to achieve high levels of quality. This in combination with employing high-quality workforce even at shop floor is another strategic choice of a few leading firms in India, to promote exports. Many Tier-1 firms follow the standard Japanese work practices to improve quality and minimise costs. Interactions between car-makers and component suppliers have also helped the latter improve quality. Addressing a larger question of the impact of Foreign Direct Investment (FDI) on the domestic industry and economy, Tewari (2000) studies the automotive supply chain of
9 When global auto majors invest in India, their preferred suppliers elsewhere in the world are also
encouraged entering India as the wholly-owned subsidiaries of these suppliers. This phenomenon is called ‘follow-source’.
9
Tamil Nadu, based on field surveys. Studies such as Humphrey (1999) show that entry of global auto majors in India and Brazil have impeded domestic firms, because of ‘follow-source’, while this study shows evidence for the fact that medium-sized firms, which entered in the mid-1990s in Tamil Nadu have formed networks with smaller domestic suppliers and helped them upgrade their technologies. These medium-sized suppliers require more support from the government, since they play a crucial role in facilitating the development of the domestic auto industry. Joint ventures and technical tie-ups with overseas suppliers have been the strategies that were followed by well-performing auto-component manufacturers, long before the global auto majors entered India. These relationships and the entry of foreign OEMs not only promote employment and income, but also diffusion of technologies and knowledge to the entire supply chain, including smaller firms. Veloso and Kumar (2002) provide an overview of the major trends taking place in the global automotive industry, emphasising on the Asian market. Consumer preferences, government regulations and intense competition have been driving the firms towards new technologies, modernisation, research and changes in design and production. Market saturation in Triad regions (the United States, Western Europe and Japan) and rapid emergence of markets in Asia have led to increasing diversity in market needs. As a result, there are many models and segments coming up rapidly. Auto majors have started adopting a global perspective and reorganising their vehicle portfolio around product platforms, modules and systems. They are also minimising the number of suppliers, by opting for bigger ones, based on cost and quality competitiveness, R&D capacity and proximity to development centres. Mergers and acquisitions are taking place for consolidation. Suppliers have been taking new roles, as systems integrators, global standardiser-systems manufacturers, component specialists and raw material suppliers. These roles are based on their focus, market presence, critical capabilities and types of components and systems. The automobile industry in India had been facing the problem of overcapacity by 2000 and the auto-component sector was not so developed as to be able to deliver products of world-class quality. Chinese tariff and quota policies, coupled with local content regulations protect the auto industry in China immensely. However, the Chinese auto industry suffers from fragmentation, lower quality, lack of technological upgradation and managerial skills. Consolidation and liberalisation that are happening recently in China are expected to promote its auto industry. Auto industries in the ASEAN and Korea have recovered quickly from the Asian crisis of 1998. This report concludes with some aspects that any study on auto sector should focus on, such as evaluation of the capabilities of auto-component supply chain – both large and small suppliers, strategies of OEMs, cost, delivery, dependability, quality, product development, process development, flexibility, facilities/equipment, technology, process, workforce and organisation, logistics and supply chain, research and engineering and interfaces. ACMA (2006) presents the recent trends in the Indian auto industry as a whole and their implications for automotive supply chain in India. The market-oriented growth and
10
growing automobile industry in India have ensured bright prospects for the Indian auto-component sector, which is vibrant and competitive. Huge future growth potential of the automobile industry and increased access to consumer finance may lead India to a place among the top five automotive economies by 2025. Most of the ACMA members have at least one standards certification. They are embracing world-class modern shop-floor practices. The auto-component sector has been showing high rates of growth of production and exports, with a comprehensive production range, transforming as an attractive OEMs Tier-1 supplier. Many leading OEMs and Tier-1 companies have plans of sourcing from Indian auto-component manufacturers, who are scaling up, establishing partnerships in India and abroad, acquiring foreign companies and establishing greenfield investments overseas. Proficiency in understanding technical drawings, understanding of different global standards, appropriate automation, flexibility in small-batch production and use of Information Technology (IT) for design, development and simulation are some of the growing capabilities among Indian auto-component manufacturers. India is expected to emerge as the next big automotive R&D base, given its IT capabilities coupled with automotive domain knowledge and shifting of automotive design centres to India, by global MNCs, as it is a potentially excellent base for prototyping, testing, validating and producing auto-components. 1.2.5 Technology and Other Aspects Kathuria (1996) analyses the Commercial Vehicles (CV) industry in India in a detailed manner, dwelling on the concepts of vertical integration and subcontracting, production technology and technological change. After an overview of the global auto industry, Kathuria traces the developments in the Indian auto industry from the 1950s to 1991. To evaluate the competitiveness of Indian commercial vehicles manufacturers in the domestic market, growth trends, structural trends, market shares, profitability, productivity ratios, prices, quality, dealer network and performance are analysed. Macro and micro performance of India’s vehicle exports with major markets and Indian vehicle characteristics have been outlined, along with an analysis of global demand patterns. Domestic resource costs and global comparison of prices, credit and service are the other international trade-related aspects analysed in this study. On vertical integration, the analysis leads to the conclusion that the Indian CV industry needs to learn from the international experience to get into subcontracting and buying-in. Lack of scales and high inventories had impeded the competitiveness of Indian CV firms in the 1980s. R&D capabilities and new product ranges were the result of the challenges arising from time-bound indigenisation programme, but still Indian technology frontier remained far below global levels. Further, different firms have followed very different strategies and hence the impacts on their technological capabilities were also very different. However, success of Indian firms despite such a wide range of strategies is partly due to the protection available to them in the domestic market. Kathuria concludes that the Indian auto industry in general, and CV industry in particular, have a lot to learn from the global auto industry, in terms of best-practice technology and vertical integration and supplier
11
relationship. The study rightly predicted that the industry would see heightened activity and recommended that the government should ensure that the domestic firms do not lose out because of the unrestricted entry of highly competitive foreign firms. Narayanan (1998) finds that during the 1980s, technology acquisition through imports of technology and in-house R&D efforts explains much of differences in competitiveness, as measured by changes in market share, at the firm level, in the Indian automobile industry. Based on an econometric analysis, which considers technology acquisition, skill intensity, component imports, firm size, product differentiation, age and vertical integration as the determinants of competitiveness, Narayanan finds that competitiveness has depended on the ability to build technological advantages, even in an era of capacity licensing. This is facilitated by complementing imported technology with in-house R&D efforts. Narayanan (2004) uses two-way fixed effects estimation of the firm growth as a function of variables capturing technology, such as R&D expenditure as a proportion of sales, foreign equity participation and import of capital goods. Role of technology depends on the technological regime in which the firm operates. In a licensed regime, firms with foreign equity grow faster because of better access to resources and technology. In a deregulated regime, import of capital goods has been the technology-related variable that triggered growth. In a liberal regime, growth is positively influenced by the intra-firm technology transfer. Narayanan (2006) analyses the determinants of export intensity of Indian automobile firms using a Tobit model, taking the variables discussed in Narayanan (1998) and Narayanan (2004) as the determinants. This study is based on the premises that there is a systematic difference in the characteristics and performance between the firms that export and those which sell in the domestic market, mainly in terms of technology acquisition, which in turn depends on the policy regime. Technology acquisition, firm size, vertical integration, capital intensity, imports of components and policy regime are found to be the main determinants of export competitiveness, by this analysis. The studies reviewed so far were of a wide range in terms of objectives, methodologies used and conclusions arrived at. Some of them aim at studying very specific aspects of the Indian auto industry such as global comparisons to examine the implications of FTAs, productivity, technology and supply chain, while others dwell on more general aspects such as strategies, competitiveness, evolution of the industry, structure of the industry and policy aspects pertaining to the Indian auto industry. These studies are based on field surveys, interviews, secondary data sources, econometric analysis and descriptive analysis. Their conclusions vary widely on specifics, but there is almost a consensus that the Indian auto industry has a bright future due to various factors considered, except Piplai (2001), who argues that the competition in the auto industry in India is highly unsustainable. The studies by ICRA, ACMA and McKinsey, which focus on global comparisons and policy environment of the auto industry, are based on quite realistic and practical approach, but lack analytical and quantitative rigour. When looked from a neutral
12
perspective, it clearly emerges that most of the findings of these studies seek some degree of protection for the auto-component sector. They are justified in some ways because of the immense protection offered to the auto-component sectors in the competing countries. However, a more analytical and quantitative approach is required to arrive at concrete conclusions on protection, because tariff barriers will be removed at some point of time in future and the industry needs to gear up to face the free trade regime. Narayanan (1998, 2004 and 2006) studies the issues related to technology in the Indian automobile industry econometrically. These papers are based on sound econometric theories and the results have been critically analysed based on evolutionary theoretical framework. However, these studies suffer from a few common problems. First, the dataset used, which is CMIE Prowess database, does not cover all the major players in the automobile industry, including Toyota. Hence, this study could have been supplemented by an analysis on the major companies that have been left out, through field surveys, interviews or annual reports. Secondly, considering automobile industry in isolation is not sufficient, since the auto-component sector in India has been playing a key role in the automobile industry, throughout the period considered in these papers. Thirdly, vertical integration is proxied by the share of value-added in total sales, in these papers. This may not be sufficient because vertical integration and sub-contracting are too complex to be captured by a single variable based on value-added. Value-added could be high, as a share of output, despite the absence of vertical integration, because of the fact that several activities other than component-manufacturing such as painting, assembly and welding take place within the assemblers’ factories. Further, the conclusion by Narayanan (1998), that vertical integration is a preferred strategy in a liberal regime, based on the premises that foreign firms, which enter in this regime, produce technology-intensive and high-quality products, for which they need to produce components in-house, is likely to be misleading. This is because of the fact that these foreign firms have imported the components and have not produced them in-house for this purpose. Piplai (2001) studies the policy environment and its impact on the Indian automobile industry. While Piplai appears to be justified in saying that there has been excess capacity in the auto industry and the auto majors are facing difficulties in aggressively marketing their products, it is probably not correct to conclude, as he has done, that the current levels of competition resulting from liberalisation are unsustainable. As noted in the introduction, car penetration levels are very low in India and hence the future potential for demand is very high. This would ensure that competition is quite sustainable as there will be enough consumers, given the rapid economic growth that is taking place. The quantitative analysis of productivity indices is quite rigorous in Sharma (2006), but this study suffers from some major inadequacies that include absence of analysis of disaggregate data and lack of consistency with the reality. For example, the conclusion that there has been no significant improvement in productivity of materials and energy in recent years is incorrect, since the reality is that owing to cost pressures, firms have been increasing their productivity with respect to these inputs.
13
1.3 Contributions of the Study A few aspects have not been given sufficient attention in the literature. First, there has been almost no study that has covered a wide range of auto-component producers as well as vehicle manufacturers in its field survey, as most of them have focused on a few and very specific categories.10 Second, unorganised sector within the auto-component sector has been widely ignored in the literature. Third, no study has examined all possible determinants of competitiveness in an econometric framework. The econometric studies reviewed in this Chapter have rather focused on particular issues such as technology acquisition. Fourth, none of these studies have examined all the relevant aspects in supply and demand-side in an integrated framework, based on field surveys, quantitative and econometric analysis, to draw conclusions and policy measures on improving competitiveness of the Indian auto industry. Fifth, there has been no study that has analysed the Effective Rates of Protection in different segments of the auto industry - automobiles (excluding Commercial Vehicles) and auto-components over the years.11 Keeping these gaps in mind, the main objective of this study is to go into various aspects of competitiveness of the Indian auto industry and to suggest some policy measures to improve it and make India a major auto hub. The scheme of the study is as follows. In Chapter 2, various supply-side aspects related to organised and unorganised segments of the Indian auto industry are analysed. Chapter 3 examines the issues related to domestic demand. In Chapter 4, recent trends in international trade of auto products in India are explained. Some global comparisons are made, in terms of production shares, tariff structure, trade performance and macro-economic environment in Chapter 5. The next chapter summarises the objectives, methodology and results of the field survey conducted for the purpose of this study. Chapter 7 discusses recent policy developments. Chapter 8 deals with impact of taxes and tariff, especially effective rate of protection, on the Indian auto industry. Econometric analysis of various determinants of cost-competitiveness and market shares of the Indian auto industry is described in Chapter 9. This report concludes with a set of policy recommendations enumerated in Chapter 10.
10 We have covered 31 auto-component firms and 14 automobile assemblers, manufacturing a wide range
of products, in our field survey. 11 Das (2003), using input-output table, calculates ERP for some categories in the Indian manufacturing
sector at three-digit level of National Industrial Classification (NIC)-1998. Consequently, motor vehicles and parts are taken as a single category. In our study, we calculate ERP at a much more disaggregated level, using annual reports of the companies and the results of our field survey.
14
2. Supply Side Features of Indian Auto Sector
In this chapter, various supply-side features of the Indian auto industry are examined. The first part of this chapter deals with the organised auto sector, while its second part is about the unorganised sector. Industrial structure, production-related aspects, cost structure, role of foreign equity, import content and export intensity of the organised sector are covered. The chapter also examines the production-related aspects and cost structure in the unorganised sector and compares it with the organised. 2.1 Organised Auto Sector in India While the Original Equipment Manufacturers (OEMs) are at the top of the auto supply chain, it should be noted that there are a few OEMs in India which supply some components to other OEMs in India or abroad. Most of the Indian OEMs are members of the Society of Indian Automobile Manufacturers (SIAM), while most of the Tier-1 auto-component manufacturers are members of the Automobile Component Manufacturers’ Association (ACMA). All of them are in the organised sector and supply directly to the OEMs in India and abroad or to Tier-1 players abroad. Tier-2 and Tier-3 auto-component manufacturers are relatively smaller players. Though some of the Tier-2 players are in the organised sector, most of them are in the unorganised sector. Tier-3 manufacturers include all auto-component suppliers in the unorganised sector, including some Own Account Manufacturing Enterprises (OAMEs) that operate with one working owner and his family members, wherein manufacturing involves use of a single machine such as the lathe. Auto-component manufacturers cater not only to the OEMs, but also to the after-sales market. In the recent years, there has been a rapid transformation in the character of the automotive aftermarket, as a fast maturing organised, skill-intensive and knowledge-driven activity. Hence, the auto industry in India possesses a very diverse and complex structure, in terms of scale, nature of operation, market structure, etc. While output, emoluments and Gross Value-Added (GVA) have been growing in both the automobile and auto-component industries, employment is on the rise in the latter and it is declining in the former, as Table 2.1.1 shows. Fall in employment12 despite growth in total emoluments is a matter of concern in the automobile sector. This also indicates that the real labour costs are increasing.13 The growth rate in gross value-added has been quite impressive in both sub-sectors, more so in the automobile manufacturing sector. 14
12 This is because both automobiles and auto-components are becoming more mechanised to ensure
consistency and quality, especially for exports. This observation also explains why labour intensity is falling in both these sectors, as shown in Figure 2.1.2.
13 This is probably due to high costs of retaining people for whom opportunities are rapidly expanding in India. This is confirmed by the results of our field survey, which show that there is a lot of attrition in the Indian auto industry.
14 Details on data sources and definitions, along with some illustrations are given in Appendix 1.
15
Table 2.1.1: Recent Annual Average Growth Rates in Indian Auto Industry Particulars
Manufacture of Automobiles (except 2/3W)
Manufacture of Auto- Components
2001-02 to 2003-04
2003-04 to 2005-06
2001-02 to 2003-04
2003-04 to 2005-06
Gross Value of Output 19.31 17 25.86 26 Gross Value-Added 32.23 N.A. 22.14 N.A. Capital -11.39 17 28.38 14 Employment -2.79 -2.25 9.27 12.72 Total Emoluments 7.84 N.A. 11.84 N.A.
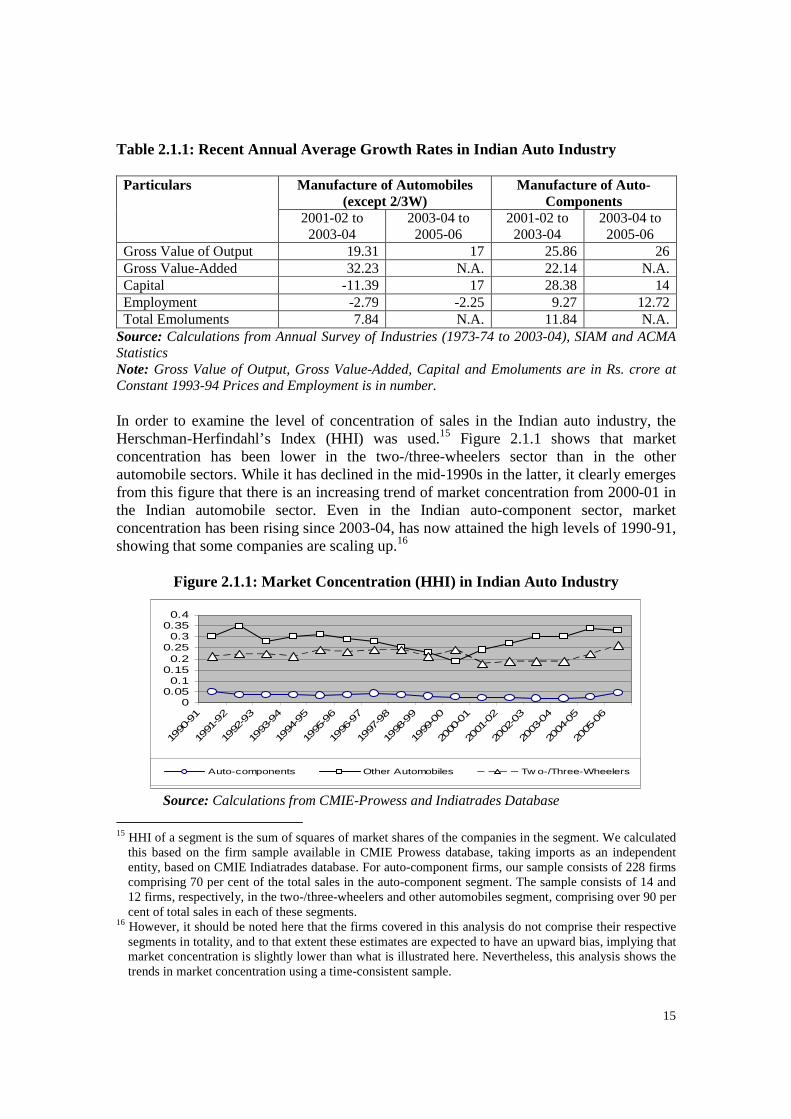
Source: Calculations from Annual Survey of Industries (1973-74 to 2003-04), SIAM and ACMA Statistics Note: Gross Value of Output, Gross Value-Added, Capital and Emoluments are in Rs. crore at Constant 1993-94 Prices and Employment is in number. In order to examine the level of concentration of sales in the Indian auto industry, the Herschman-Herfindahl’s Index (HHI) was used.15 Figure 2.1.1 shows that market concentration has been lower in the two-/three-wheelers sector than in the other automobile sectors. While it has declined in the mid-1990s in the latter, it clearly emerges from this figure that there is an increasing trend of market concentration from 2000-01 in the Indian automobile sector. Even in the Indian auto-component sector, market concentration has been rising since 2003-04, has now attained the high levels of 1990-91, showing that some companies are scaling up.16
Figure 2.1.1: Market Concentration (HHI) in Indian Auto Industry
00.050.1
0.150.2
0.250.3
0.350.4
1990
-91
1991
-92
1992
-93
1993
-94
1994
-95
1995
-96
1996
-97
1997
-98
1998
-99
1999
-00
2000
-01
2001
-02
2002
-03
2003
-04
2004
-05
2005
-06
Auto-components Other Automobiles Tw o-/Three-Wheelers
Source: Calculations from CMIE-Prowess and Indiatrades Database
15 HHI of a segment is the sum of squares of market shares of the companies in the segment. We calculated
this based on the firm sample available in CMIE Prowess database, taking imports as an independent entity, based on CMIE Indiatrades database. For auto-component firms, our sample consists of 228 firms comprising 70 per cent of the total sales in the auto-component segment. The sample consists of 14 and 12 firms, respectively, in the two-/three-wheelers and other automobiles segment, comprising over 90 per cent of total sales in each of these segments.
16 However, it should be noted here that the firms covered in this analysis do not comprise their respective segments in totality, and to that extent these estimates are expected to have an upward bias, implying that market concentration is slightly lower than what is illustrated here. Nevertheless, this analysis shows the trends in market concentration using a time-consistent sample.
16
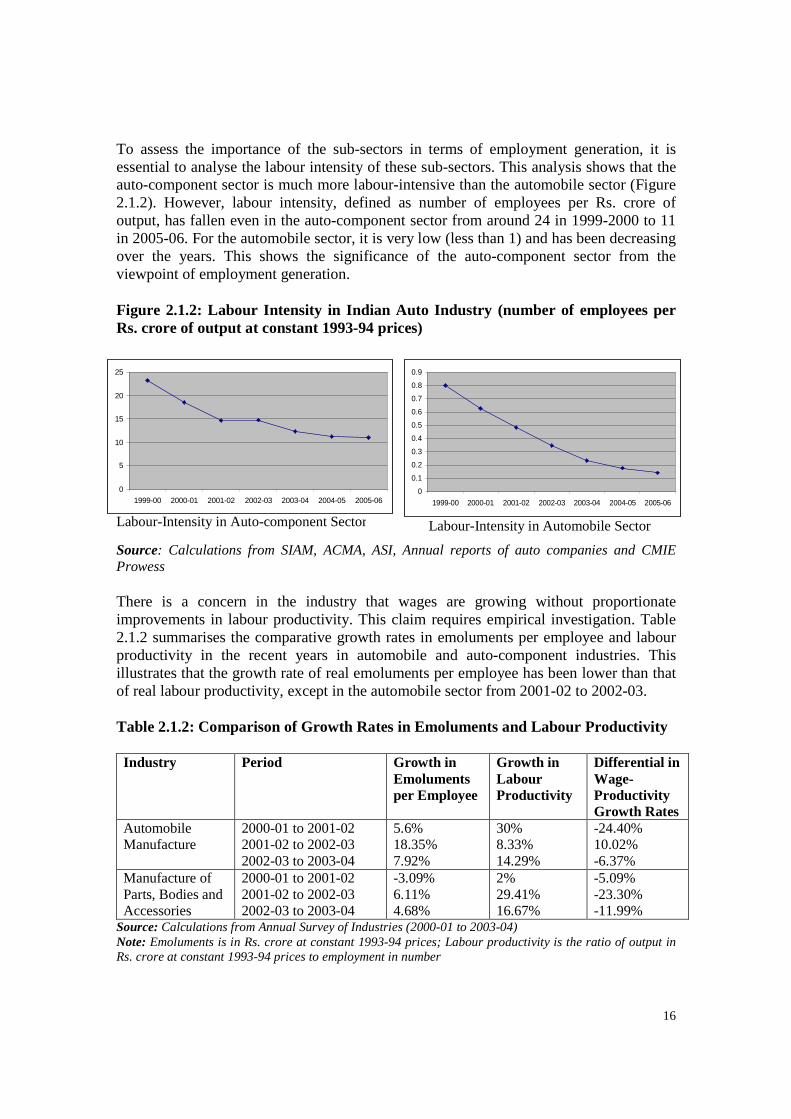
To assess the importance of the sub-sectors in terms of employment generation, it is essential to analyse the labour intensity of these sub-sectors. This analysis shows that the auto-component sector is much more labour-intensive than the automobile sector (Figure 2.1.2). However, labour intensity, defined as number of employees per Rs. crore of output, has fallen even in the auto-component sector from around 24 in 1999-2000 to 11 in 2005-06. For the automobile sector, it is very low (less than 1) and has been decreasing over the years. This shows the significance of the auto-component sector from the viewpoint of employment generation.
Figure 2.1.2: Labour Intensity in Indian Auto Industry (number of employees per Rs. crore of output at constant 1993-94 prices)
Source: Calculations from SIAM, ACMA, ASI, Annual reports of auto companies and CMIE Prowess There is a concern in the industry that wages are growing without proportionate improvements in labour productivity. This claim requires empirical investigation. Table 2.1.2 summarises the comparative growth rates in emoluments per employee and labour productivity in the recent years in automobile and auto-component industries. This illustrates that the growth rate of real emoluments per employee has been lower than that of real labour productivity, except in the automobile sector from 2001-02 to 2002-03. Table 2.1.2: Comparison of Growth Rates in Emoluments and Labour Productivity Industry Period Growth in
Emoluments per Employee
Growth in Labour Productivity
Differential in Wage-Productivity Growth Rates
Automobile Manufacture
2000-01 to 2001-02 2001-02 to 2002-03 2002-03 to 2003-04
5.6% 18.35% 7.92%
30% 8.33% 14.29%
-24.40% 10.02% -6.37%
Manufacture of Parts, Bodies and Accessories
2000-01 to 2001-02 2001-02 to 2002-03 2002-03 to 2003-04
-3.09% 6.11% 4.68%
2% 29.41% 16.67%
-5.09% -23.30% -11.99%
Source: Calculations from Annual Survey of Industries (2000-01 to 2003-04) Note: Emoluments is in Rs. crore at constant 1993-94 prices; Labour productivity is the ratio of output in Rs. crore at constant 1993-94 prices to employment in number
0
5
10
15
20
25
1999-00 2000-01 2001-02 2002-03 2003-04 2004-05 2005-060
0.1
0.2
0.3
0.4
0.5
0.6
0.7
0.8
0.9
1999-00 2000-01 2001-02 2002-03 2003-04 2004-05 2005-06
Labour-Intensity in Auto-component Sector Labour-Intensity in Automobile Sector
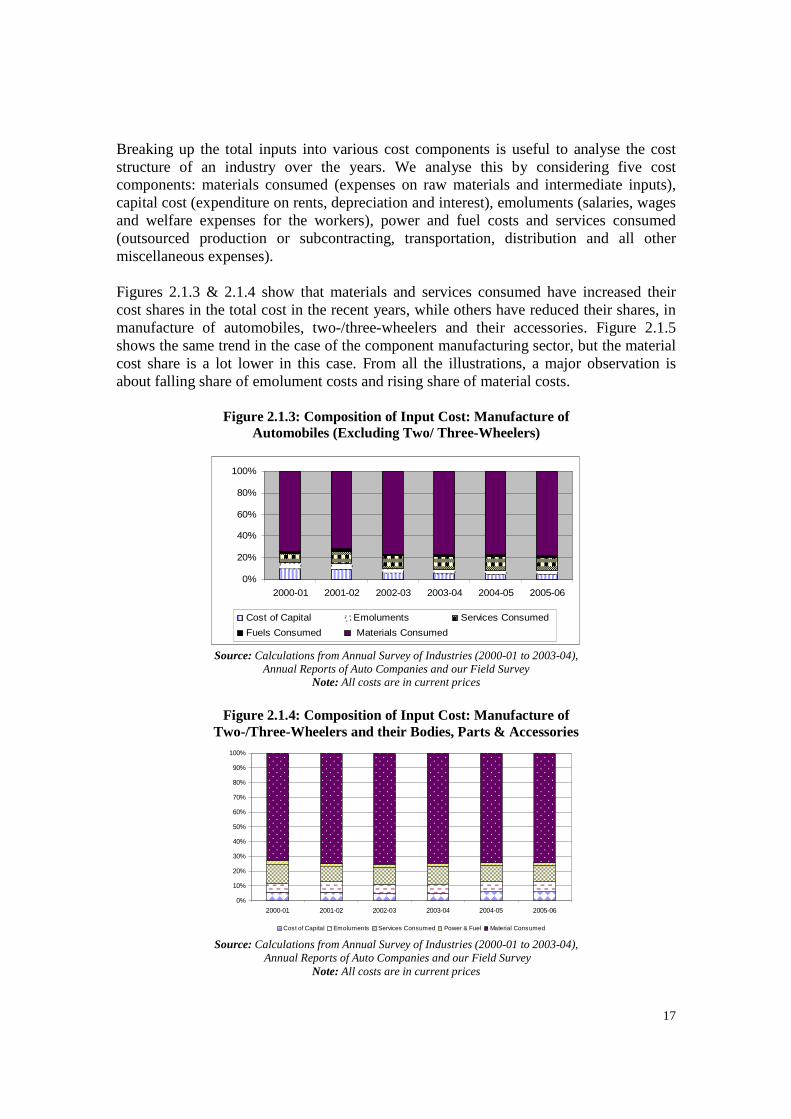
17
Breaking up the total inputs into various cost components is useful to analyse the cost structure of an industry over the years. We analyse this by considering five cost components: materials consumed (expenses on raw materials and intermediate inputs), capital cost (expenditure on rents, depreciation and interest), emoluments (salaries, wages and welfare expenses for the workers), power and fuel costs and services consumed (outsourced production or subcontracting, transportation, distribution and all other miscellaneous expenses). Figures 2.1.3 & 2.1.4 show that materials and services consumed have increased their cost shares in the total cost in the recent years, while others have reduced their shares, in manufacture of automobiles, two-/three-wheelers and their accessories. Figure 2.1.5 shows the same trend in the case of the component manufacturing sector, but the material cost share is a lot lower in this case. From all the illustrations, a major observation is about falling share of emolument costs and rising share of material costs.
Figure 2.1.3: Composition of Input Cost: Manufacture of
Automobiles (Excluding Two/ Three-Wheelers)
0%
20%
40%
60%
80%
100%
2000-01 2001-02 2002-03 2003-04 2004-05 2005-06
Cost of Capital Emoluments Services Consumed
Fuels Consumed Materials Consumed
Source: Calculations from Annual Survey of Industries (2000-01 to 2003-04), Annual Reports of Auto Companies and our Field Survey
Note: All costs are in current prices
Figure 2.1.4: Composition of Input Cost: Manufacture of
Two-/Three-Wheelers and their Bodies, Parts & Accessories
0%
10%
20%
30%
40%
50%
60%
70%
80%
90%
100%
2000-01 2001-02 2002-03 2003-04 2004-05 2005-06
Cost of Capital Emoluments Services Consumed Power & Fuel Material Consumed Source: Calculations from Annual Survey of Industries (2000-01 to 2003-04),
Annual Reports of Auto Companies and our Field Survey Note: All costs are in current prices
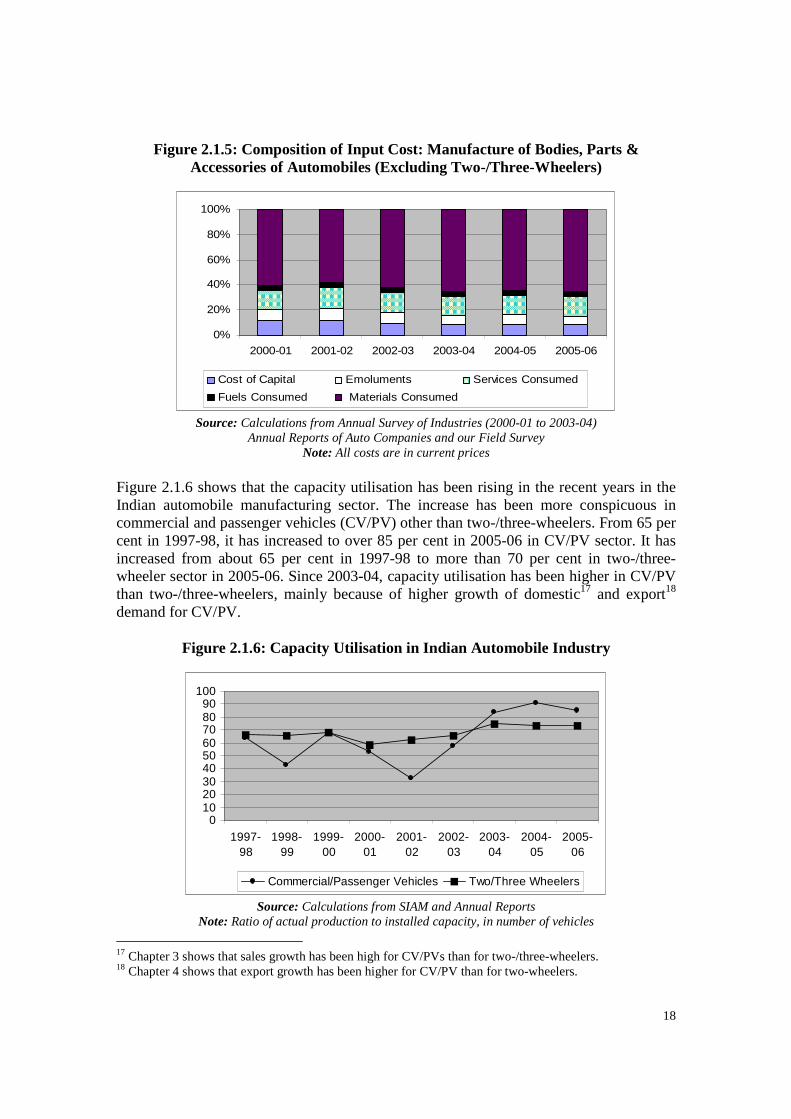
18
Figure 2.1.5: Composition of Input Cost: Manufacture of Bodies, Parts & Accessories of Automobiles (Excluding Two-/Three-Wheelers)
0%
20%
40%
60%
80%
100%
2000-01 2001-02 2002-03 2003-04 2004-05 2005-06
Cost of Capital Emoluments Services Consumed
Fuels Consumed Materials Consumed
Source: Calculations from Annual Survey of Industries (2000-01 to 2003-04) Annual Reports of Auto Companies and our Field Survey
Note: All costs are in current prices Figure 2.1.6 shows that the capacity utilisation has been rising in the recent years in the Indian automobile manufacturing sector. The increase has been more conspicuous in commercial and passenger vehicles (CV/PV) other than two-/three-wheelers. From 65 per cent in 1997-98, it has increased to over 85 per cent in 2005-06 in CV/PV sector. It has increased from about 65 per cent in 1997-98 to more than 70 per cent in two-/three-wheeler sector in 2005-06. Since 2003-04, capacity utilisation has been higher in CV/PV than two-/three-wheelers, mainly because of higher growth of domestic17 and export18 demand for CV/PV.
Figure 2.1.6: Capacity Utilisation in Indian Automobile Industry
0102030405060708090
100
1997-98
1998-99
1999-00
2000-01
2001-02
2002-03
2003-04
2004-05
2005-06
Commercial/Passenger Vehicles Two/Three Wheelers
Source: Calculations from SIAM and Annual Reports Note: Ratio of actual production to installed capacity, in number of vehicles
17 Chapter 3 shows that sales growth has been high for CV/PVs than for two-/three-wheelers. 18 Chapter 4 shows that export growth has been higher for CV/PV than for two-wheelers.
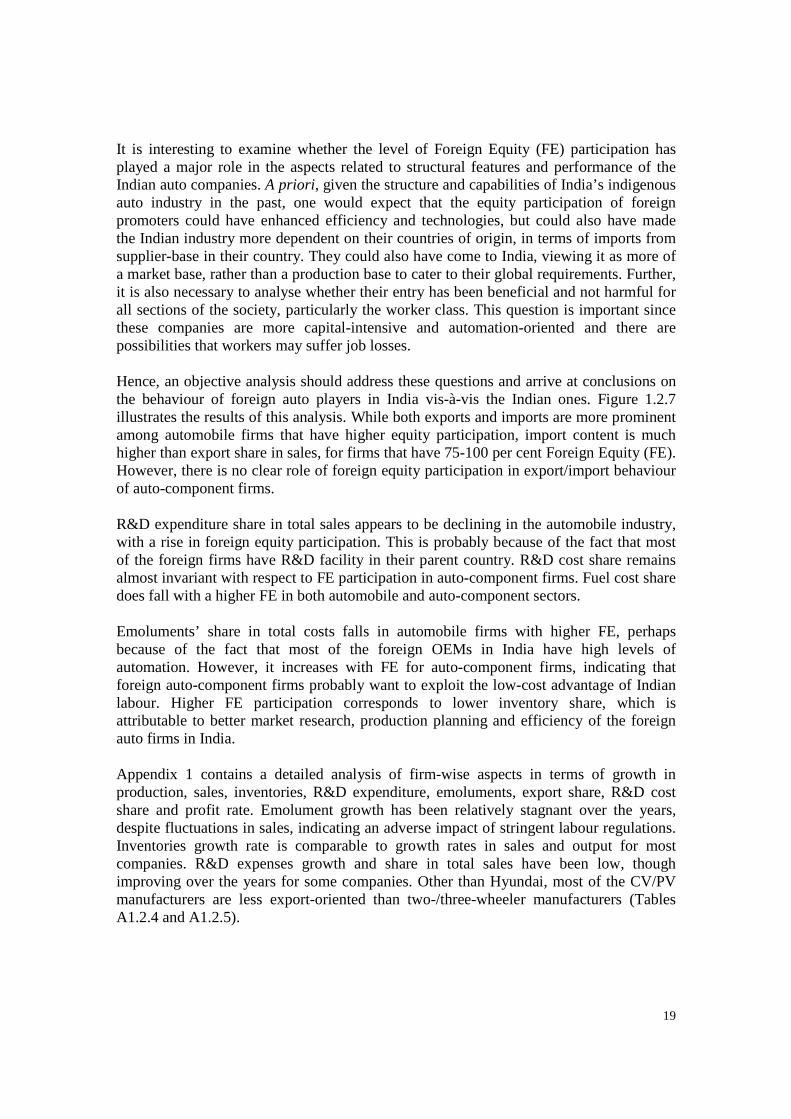
19
It is interesting to examine whether the level of Foreign Equity (FE) participation has played a major role in the aspects related to structural features and performance of the Indian auto companies. A priori, given the structure and capabilities of India’s indigenous auto industry in the past, one would expect that the equity participation of foreign promoters could have enhanced efficiency and technologies, but could also have made the Indian industry more dependent on their countries of origin, in terms of imports from supplier-base in their country. They could also have come to India, viewing it as more of a market base, rather than a production base to cater to their global requirements. Further, it is also necessary to analyse whether their entry has been beneficial and not harmful for all sections of the society, particularly the worker class. This question is important since these companies are more capital-intensive and automation-oriented and there are possibilities that workers may suffer job losses. Hence, an objective analysis should address these questions and arrive at conclusions on the behaviour of foreign auto players in India vis-à-vis the Indian ones. Figure 1.2.7 illustrates the results of this analysis. While both exports and imports are more prominent among automobile firms that have higher equity participation, import content is much higher than export share in sales, for firms that have 75-100 per cent Foreign Equity (FE). However, there is no clear role of foreign equity participation in export/import behaviour of auto-component firms. R&D expenditure share in total sales appears to be declining in the automobile industry, with a rise in foreign equity participation. This is probably because of the fact that most of the foreign firms have R&D facility in their parent country. R&D cost share remains almost invariant with respect to FE participation in auto-component firms. Fuel cost share does fall with a higher FE in both automobile and auto-component sectors. Emoluments’ share in total costs falls in automobile firms with higher FE, perhaps because of the fact that most of the foreign OEMs in India have high levels of automation. However, it increases with FE for auto-component firms, indicating that foreign auto-component firms probably want to exploit the low-cost advantage of Indian labour. Higher FE participation corresponds to lower inventory share, which is attributable to better market research, production planning and efficiency of the foreign auto firms in India. Appendix 1 contains a detailed analysis of firm-wise aspects in terms of growth in production, sales, inventories, R&D expenditure, emoluments, export share, R&D cost share and profit rate. Emolument growth has been relatively stagnant over the years, despite fluctuations in sales, indicating an adverse impact of stringent labour regulations. Inventories growth rate is comparable to growth rates in sales and output for most companies. R&D expenses growth and share in total sales have been low, though improving over the years for some companies. Other than Hyundai, most of the CV/PV manufacturers are less export-oriented than two-/three-wheeler manufacturers (Tables A1.2.4 and A1.2.5).
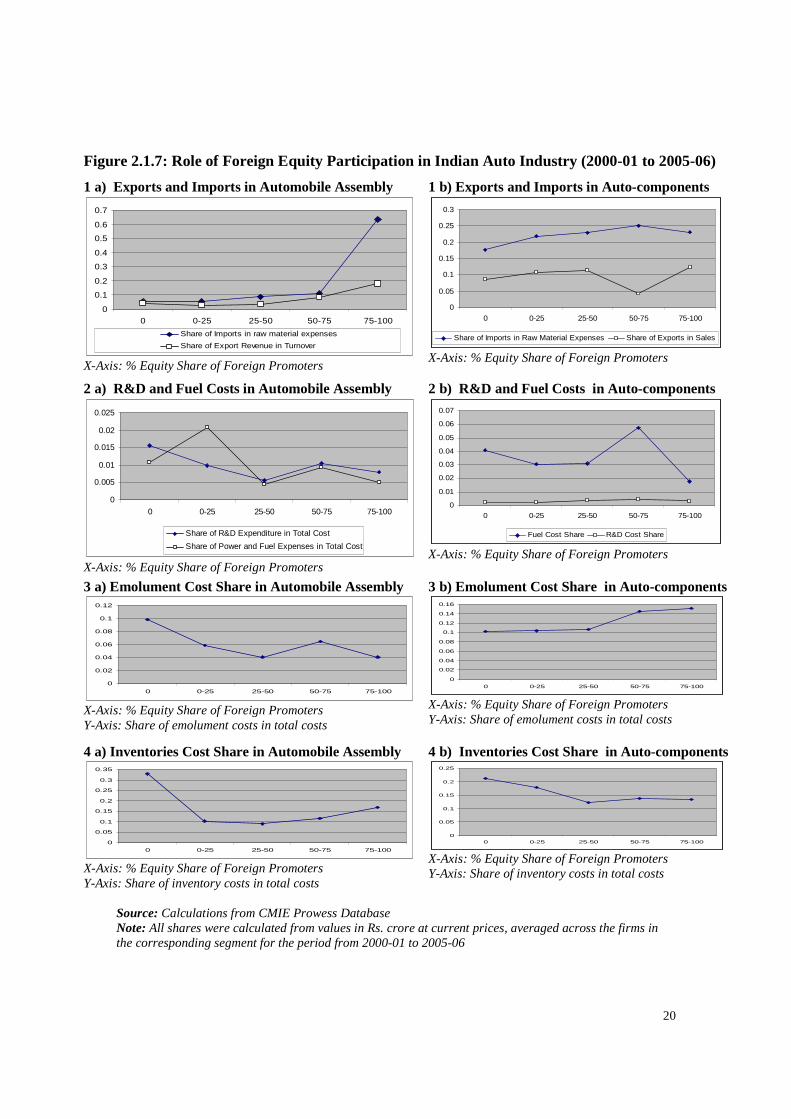
20
Source: Calculations from CMIE Prowess Database Note: All shares were calculated from values in Rs. crore at current prices, averaged across the firms in the corresponding segment for the period from 2000-01 to 2005-06
1 a) Exports and Imports in Automobile Assembly 1 b) Exports and Imports in Auto-components
0
0.1
0.2
0.3
0.4
0.5
0.6
0.7
0 0-25 25-50 50-75 75-100
Share of Imports in raw material expenses
Share of Export Revenue in Turnover
X-Axis: % Equity Share of Foreign Promoters
0
0.05
0.1
0.15
0.2
0.25
0.3
0 0-25 25-50 50-75 75-100
Share of Imports in Raw Material Expenses Share of Exports in Sales
X-Axis: % Equity Share of Foreign Promoters
2 a) R&D and Fuel Costs in Automobile Assembly 2 b) R&D and Fuel Costs in Auto-components
0
0.005
0.01
0.015
0.02
0.025
0 0-25 25-50 50-75 75-100
Share of R&D Expenditure in Total Cost
Share of Power and Fuel Expenses in Total Cost
X-Axis: % Equity Share of Foreign Promoters
0
0.01
0.02
0.03
0.04
0.05
0.06
0.07
0 0-25 25-50 50-75 75-100
Fuel Cost Share R&D Cost Share
X-Axis: % Equity Share of Foreign Promoters
3 a) Emolument Cost Share in Automobile Assembly 3 b) Emolument Cost Share in Auto-components
0
0.02
0.04
0.06
0.08
0.1
0.12
0 0-25 25-50 50-75 75-100
X-Axis: % Equity Share of Foreign Promoters Y-Axis: Share of emolument costs in total costs
0
0.02
0.04
0.06
0.08
0.1
0.12
0.14
0.16
0 0-25 25-50 50-75 75-100
X-Axis: % Equity Share of Foreign Promoters Y-Axis: Share of emolument costs in total costs
4 a) Inventories Cost Share in Automobile Assembly 4 b) Inventories Cost Share in Auto-components
0
0.05
0.1
0.15
0.2
0.25
0.3
0.35
0 0-25 25-50 50-75 75-100
X-Axis: % Equity Share of Foreign Promoters Y-Axis: Share of inventory costs in total costs
0
0.05
0.1
0.15
0.2
0.25
0 0-25 25-50 50-75 75-100 X-Axis: % Equity Share of Foreign Promoters Y-Axis: Share of inventory costs in total costs
Figure 2.1.7: Role of Foreign Equity Participation in Indian Auto Industry (2000-01 to 2005-06)
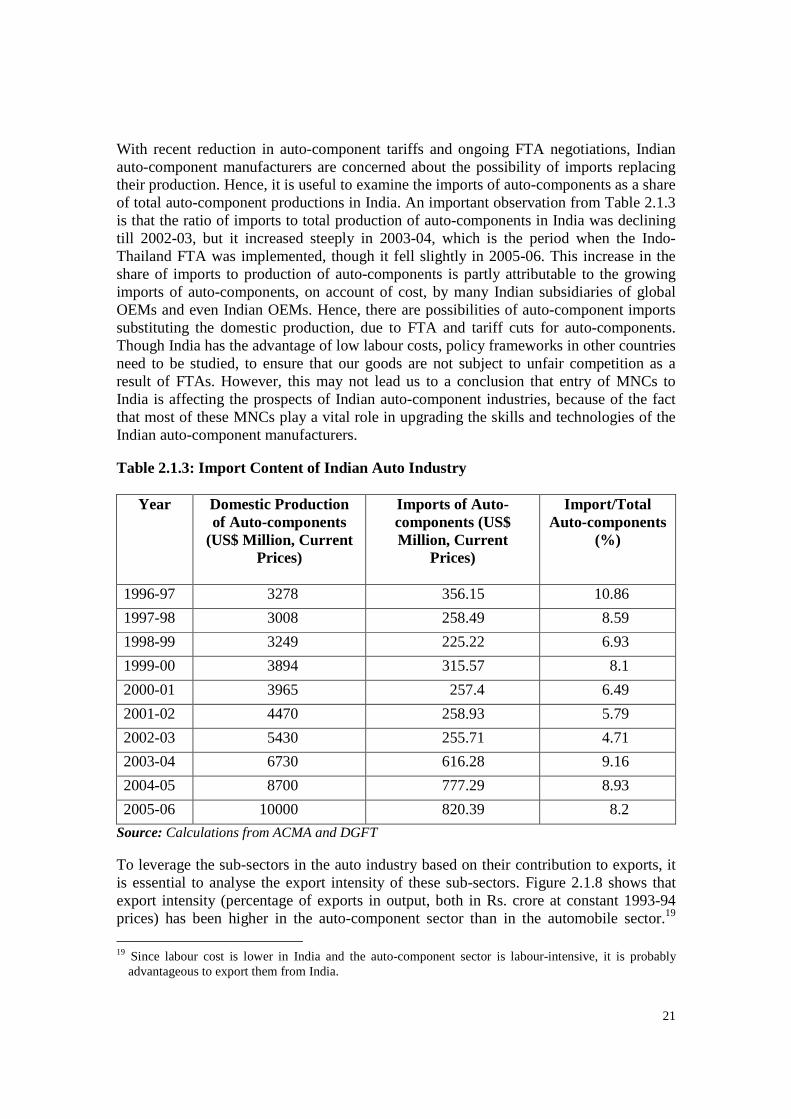
21
With recent reduction in auto-component tariffs and ongoing FTA negotiations, Indian auto-component manufacturers are concerned about the possibility of imports replacing their production. Hence, it is useful to examine the imports of auto-components as a share of total auto-component productions in India. An important observation from Table 2.1.3 is that the ratio of imports to total production of auto-components in India was declining till 2002-03, but it increased steeply in 2003-04, which is the period when the Indo-Thailand FTA was implemented, though it fell slightly in 2005-06. This increase in the share of imports to production of auto-components is partly attributable to the growing imports of auto-components, on account of cost, by many Indian subsidiaries of global OEMs and even Indian OEMs. Hence, there are possibilities of auto-component imports substituting the domestic production, due to FTA and tariff cuts for auto-components. Though India has the advantage of low labour costs, policy frameworks in other countries need to be studied, to ensure that our goods are not subject to unfair competition as a result of FTAs. However, this may not lead us to a conclusion that entry of MNCs to India is affecting the prospects of Indian auto-component industries, because of the fact that most of these MNCs play a vital role in upgrading the skills and technologies of the Indian auto-component manufacturers. Table 2.1.3: Import Content of Indian Auto Industry
Year Domestic Production of Auto-components
(US$ Million, Current Prices)
Imports of Auto- components (US$ Million, Current
Prices)
Import/Total Auto-components
(%)
1996-97 3278 356.15 10.86
1997-98 3008 258.49 8.59
1998-99 3249 225.22 6.93
1999-00 3894 315.57 8.1
2000-01 3965 257.4 6.49
2001-02 4470 258.93 5.79
2002-03 5430 255.71 4.71
2003-04 6730 616.28 9.16
2004-05 8700 777.29 8.93
2005-06 10000 820.39 8.2
Source: Calculations from ACMA and DGFT To leverage the sub-sectors in the auto industry based on their contribution to exports, it is essential to analyse the export intensity of these sub-sectors. Figure 2.1.8 shows that export intensity (percentage of exports in output, both in Rs. crore at constant 1993-94 prices) has been higher in the auto-component sector than in the automobile sector.19
19 Since labour cost is lower in India and the auto-component sector is labour-intensive, it is probably
advantageous to export them from India.
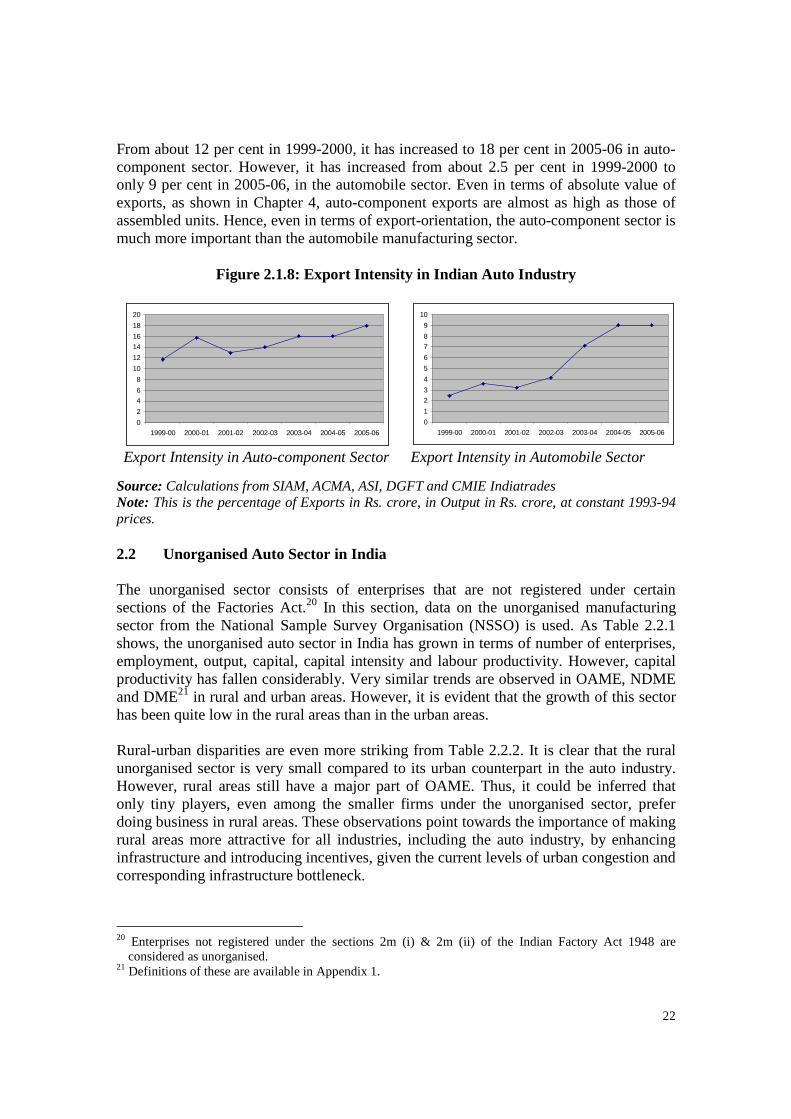
22
From about 12 per cent in 1999-2000, it has increased to 18 per cent in 2005-06 in auto-component sector. However, it has increased from about 2.5 per cent in 1999-2000 to only 9 per cent in 2005-06, in the automobile sector. Even in terms of absolute value of exports, as shown in Chapter 4, auto-component exports are almost as high as those of assembled units. Hence, even in terms of export-orientation, the auto-component sector is much more important than the automobile manufacturing sector.
Figure 2.1.8: Export Intensity in Indian Auto Industry
0
2
4
6
8
10
12
14
16
18
20
1999-00 2000-01 2001-02 2002-03 2003-04 2004-05 2005-06
0
1
2
3
4
5
6
7
8
9
10
1999-00 2000-01 2001-02 2002-03 2003-04 2004-05 2005-06
Export Intensity in Auto-component Sector Export Intensity in Automobile Sector
Source: Calculations from SIAM, ACMA, ASI, DGFT and CMIE Indiatrades Note: This is the percentage of Exports in Rs. crore, in Output in Rs. crore, at constant 1993-94 prices. 2.2 Unorganised Auto Sector in India The unorganised sector consists of enterprises that are not registered under certain sections of the Factories Act.20 In this section, data on the unorganised manufacturing sector from the National Sample Survey Organisation (NSSO) is used. As Table 2.2.1 shows, the unorganised auto sector in India has grown in terms of number of enterprises, employment, output, capital, capital intensity and labour productivity. However, capital productivity has fallen considerably. Very similar trends are observed in OAME, NDME and DME21 in rural and urban areas. However, it is evident that the growth of this sector has been quite low in the rural areas than in the urban areas. Rural-urban disparities are even more striking from Table 2.2.2. It is clear that the rural unorganised sector is very small compared to its urban counterpart in the auto industry. However, rural areas still have a major part of OAME. Thus, it could be inferred that only tiny players, even among the smaller firms under the unorganised sector, prefer doing business in rural areas. These observations point towards the importance of making rural areas more attractive for all industries, including the auto industry, by enhancing infrastructure and introducing incentives, given the current levels of urban congestion and corresponding infrastructure bottleneck.
20 Enterprises not registered under the sections 2m (i) & 2m (ii) of the Indian Factory Act 1948 are
considered as unorganised. 21 Definitions of these are available in Appendix 1.
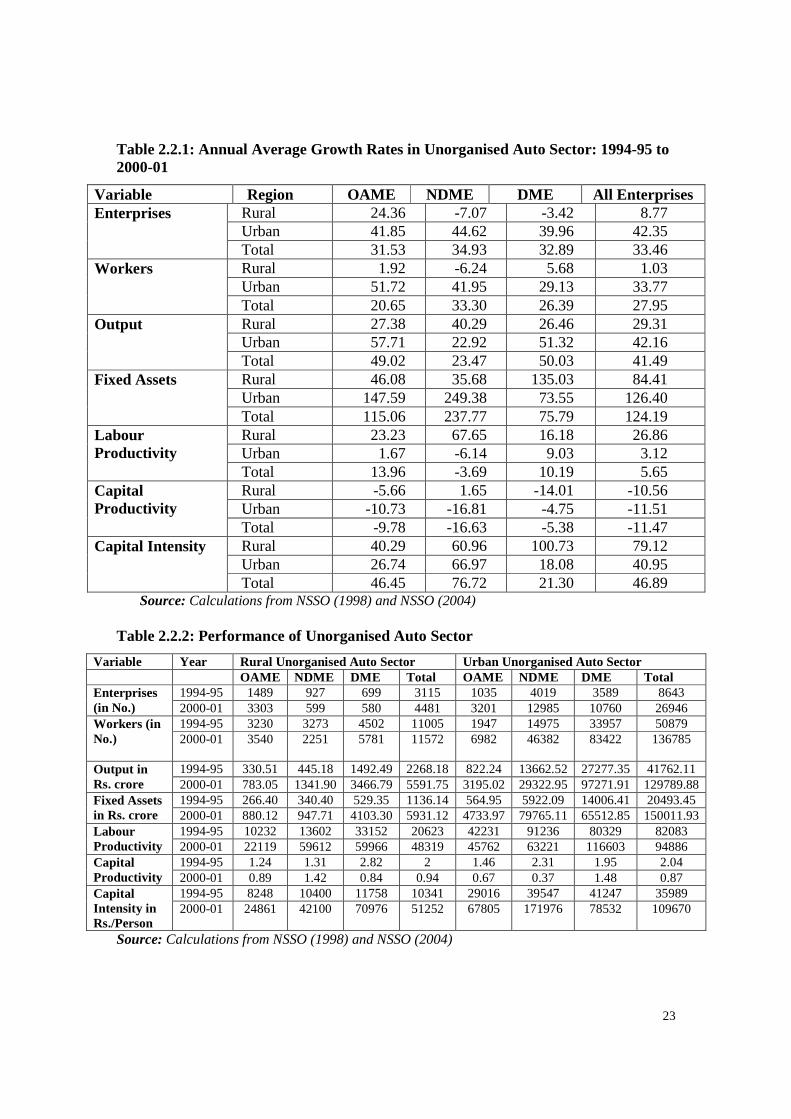
23
Table 2.2.1: Annual Average Growth Rates in Unorganised Auto Sector: 1994-95 to 2000-01
Variable Region OAME NDME DME All Enterprises Enterprises Rural 24.36 -7.07 -3.42 8.77
Urban 41.85 44.62 39.96 42.35 Total 31.53 34.93 32.89 33.46
Workers Rural 1.92 -6.24 5.68 1.03 Urban 51.72 41.95 29.13 33.77 Total 20.65 33.30 26.39 27.95
Output Rural 27.38 40.29 26.46 29.31 Urban 57.71 22.92 51.32 42.16 Total 49.02 23.47 50.03 41.49
Fixed Assets Rural 46.08 35.68 135.03 84.41 Urban 147.59 249.38 73.55 126.40 Total 115.06 237.77 75.79 124.19
Labour Productivity
Rural 23.23 67.65 16.18 26.86 Urban 1.67 -6.14 9.03 3.12 Total 13.96 -3.69 10.19 5.65
Capital Productivity
Rural -5.66 1.65 -14.01 -10.56 Urban -10.73 -16.81 -4.75 -11.51 Total -9.78 -16.63 -5.38 -11.47
Capital Intensity Rural 40.29 60.96 100.73 79.12 Urban 26.74 66.97 18.08 40.95 Total 46.45 76.72 21.30 46.89
Source: Calculations from NSSO (1998) and NSSO (2004) Table 2.2.2: Performance of Unorganised Auto Sector
Variable Year Rural Unorganised Auto Sector Urban Unorganised Auto Sector OAME NDME DME Total OAME NDME DME Total Enterprises (in No.)
1994-95 1489 927 699 3115 1035 4019 3589 8643 2000-01 3303 599 580 4481 3201 12985 10760 26946
Workers (in No.)
1994-95 3230 3273 4502 11005 1947 14975 33957 50879 2000-01 3540 2251 5781 11572 6982 46382 83422 136785
Output in Rs. crore
1994-95 330.51 445.18 1492.49 2268.18 822.24 13662.52 27277.35 41762.11 2000-01 783.05 1341.90 3466.79 5591.75 3195.02 29322.95 97271.91 129789.88
Fixed Assets in Rs. crore
1994-95 266.40 340.40 529.35 1136.14 564.95 5922.09 14006.41 20493.45 2000-01 880.12 947.71 4103.30 5931.12 4733.97 79765.11 65512.85 150011.93
Labour Productivity
1994-95 10232 13602 33152 20623 42231 91236 80329 82083 2000-01 22119 59612 59966 48319 45762 63221 116603 94886
Capital Productivity
1994-95 1.24 1.31 2.82 2 1.46 2.31 1.95 2.04 2000-01 0.89 1.42 0.84 0.94 0.67 0.37 1.48 0.87
Capital Intensity in Rs./Person
1994-95 8248 10400 11758 10341 29016 39547 41247 35989 2000-01 24861 42100 70976 51252 67805 171976 78532 109670
Source: Calculations from NSSO (1998) and NSSO (2004)
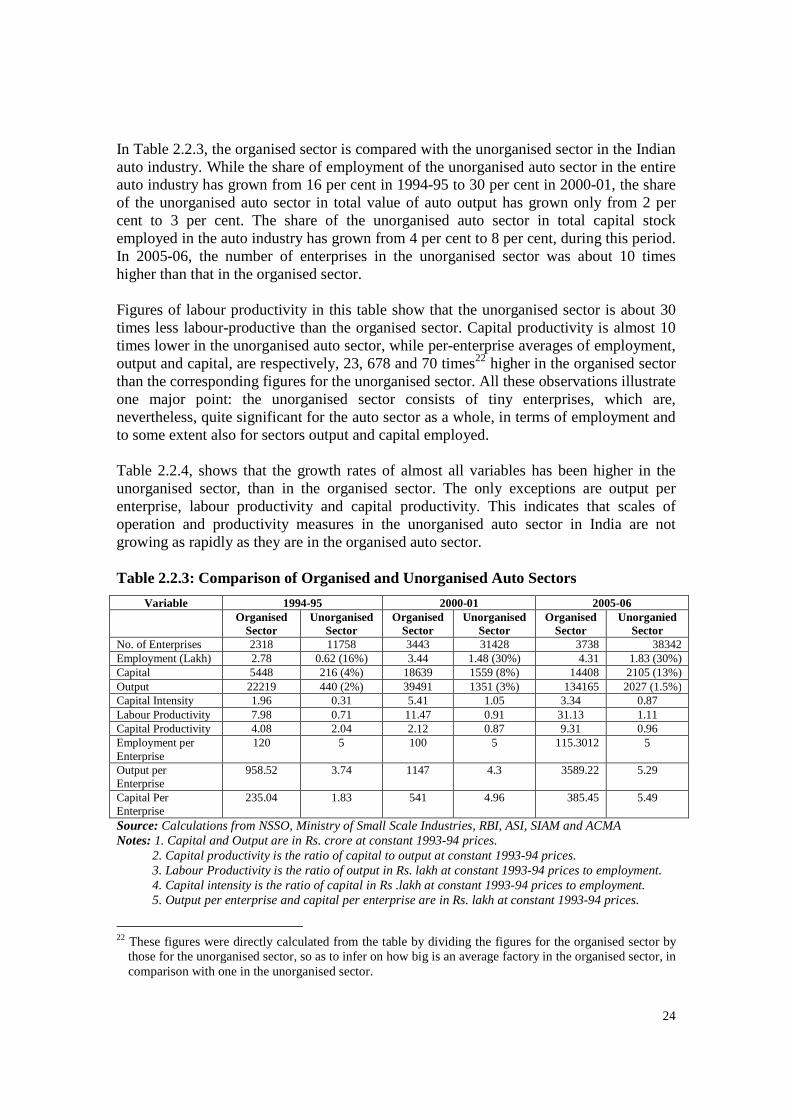
24
In Table 2.2.3, the organised sector is compared with the unorganised sector in the Indian auto industry. While the share of employment of the unorganised auto sector in the entire auto industry has grown from 16 per cent in 1994-95 to 30 per cent in 2000-01, the share of the unorganised auto sector in total value of auto output has grown only from 2 per cent to 3 per cent. The share of the unorganised auto sector in total capital stock employed in the auto industry has grown from 4 per cent to 8 per cent, during this period. In 2005-06, the number of enterprises in the unorganised sector was about 10 times higher than that in the organised sector. Figures of labour productivity in this table show that the unorganised sector is about 30 times less labour-productive than the organised sector. Capital productivity is almost 10 times lower in the unorganised auto sector, while per-enterprise averages of employment, output and capital, are respectively, 23, 678 and 70 times22 higher in the organised sector than the corresponding figures for the unorganised sector. All these observations illustrate one major point: the unorganised sector consists of tiny enterprises, which are, nevertheless, quite significant for the auto sector as a whole, in terms of employment and to some extent also for sectors output and capital employed. Table 2.2.4, shows that the growth rates of almost all variables has been higher in the unorganised sector, than in the organised sector. The only exceptions are output per enterprise, labour productivity and capital productivity. This indicates that scales of operation and productivity measures in the unorganised auto sector in India are not growing as rapidly as they are in the organised auto sector.
Table 2.2.3: Comparison of Organised and Unorganised Auto Sectors
Variable 1994-95 2000-01 2005-06 Organised
Sector Unorganised
Sector Organised
Sector Unorganised
Sector Organised
Sector Unorganied
Sector No. of Enterprises 2318 11758 3443 31428 3738 38342 Employment (Lakh) 2.78 0.62 (16%) 3.44 1.48 (30%) 4.31 1.83 (30%) Capital 5448 216 (4%) 18639 1559 (8%) 14408 2105 (13%) Output 22219 440 (2%) 39491 1351 (3%) 134165 2027 (1.5%) Capital Intensity 1.96 0.31 5.41 1.05 3.34 0.87 Labour Productivity 7.98 0.71 11.47 0.91 31.13 1.11 Capital Productivity 4.08 2.04 2.12 0.87 9.31 0.96 Employment per Enterprise
120 5 100 5 115.3012 5
Output per Enterprise
958.52 3.74 1147 4.3 3589.22 5.29
Capital Per Enterprise
235.04 1.83 541 4.96 385.45 5.49
Source: Calculations from NSSO, Ministry of Small Scale Industries, RBI, ASI, SIAM and ACMA Notes: 1. Capital and Output are in Rs. crore at constant 1993-94 prices. 2. Capital productivity is the ratio of capital to output at constant 1993-94 prices. 3. Labour Productivity is the ratio of output in Rs. lakh at constant 1993-94 prices to employment. 4. Capital intensity is the ratio of capital in Rs .lakh at constant 1993-94 prices to employment. 5. Output per enterprise and capital per enterprise are in Rs. lakh at constant 1993-94 prices.
22 These figures were directly calculated from the table by dividing the figures for the organised sector by
those for the unorganised sector, so as to infer on how big is an average factory in the organised sector, in comparison with one in the unorganised sector.
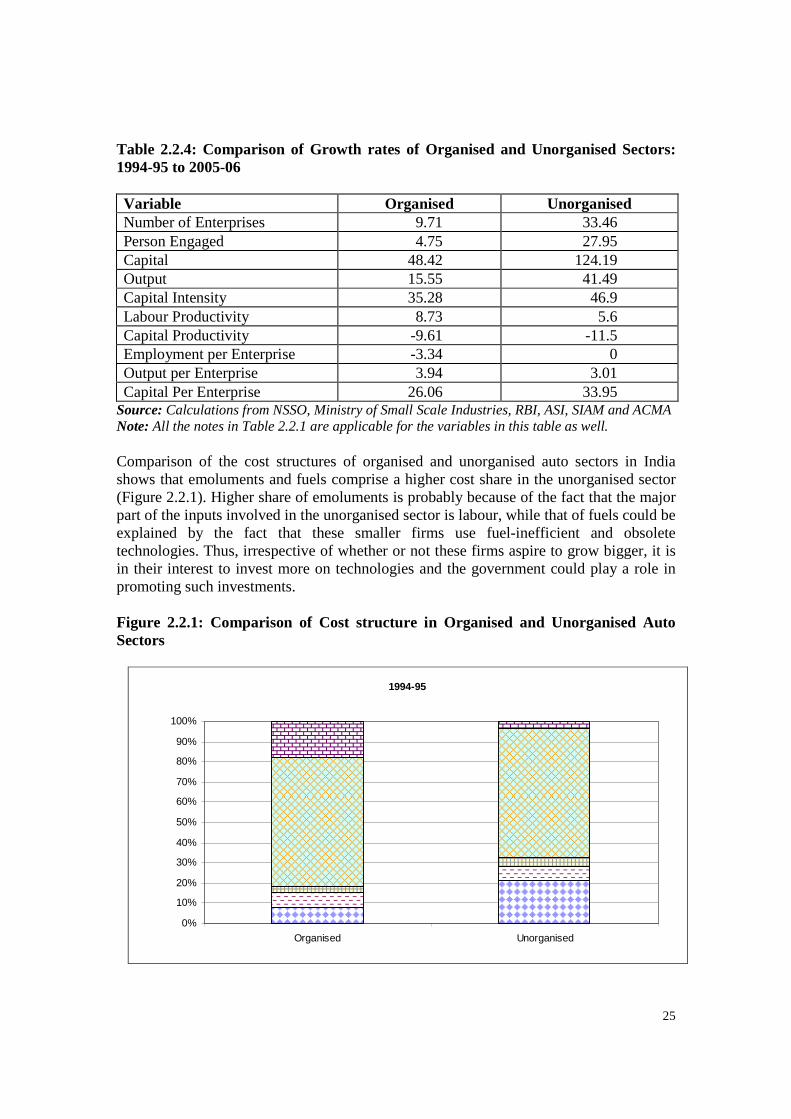
25
Table 2.2.4: Comparison of Growth rates of Organised and Unorganised Sectors: 1994-95 to 2005-06 Variable Organised Unorganised Number of Enterprises 9.71 33.46 Person Engaged 4.75 27.95 Capital 48.42 124.19 Output 15.55 41.49 Capital Intensity 35.28 46.9 Labour Productivity 8.73 5.6 Capital Productivity -9.61 -11.5 Employment per Enterprise -3.34 0 Output per Enterprise 3.94 3.01 Capital Per Enterprise 26.06 33.95
Source: Calculations from NSSO, Ministry of Small Scale Industries, RBI, ASI, SIAM and ACMA Note: All the notes in Table 2.2.1 are applicable for the variables in this table as well. Comparison of the cost structures of organised and unorganised auto sectors in India shows that emoluments and fuels comprise a higher cost share in the unorganised sector (Figure 2.2.1). Higher share of emoluments is probably because of the fact that the major part of the inputs involved in the unorganised sector is labour, while that of fuels could be explained by the fact that these smaller firms use fuel-inefficient and obsolete technologies. Thus, irrespective of whether or not these firms aspire to grow bigger, it is in their interest to invest more on technologies and the government could play a role in promoting such investments.
Figure 2.2.1: Comparison of Cost structure in Organised and Unorganised Auto Sectors
1994-95
0%
10%
20%
30%
40%
50%
60%
70%
80%
90%
100%
Organised Unorganised
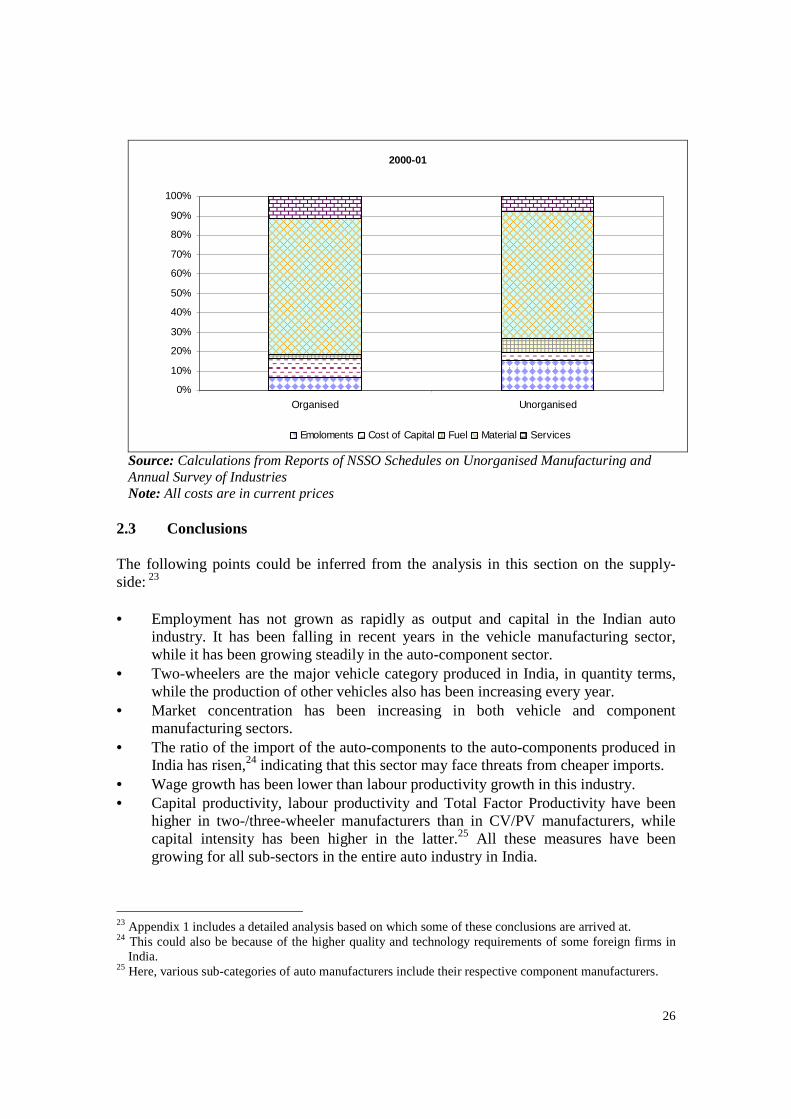
26
2000-01
0%
10%
20%
30%
40%
50%
60%
70%
80%
90%
100%
Organised Unorganised
Emoloments Cost of Capital Fuel Material Services
Source: Calculations from Reports of NSSO Schedules on Unorganised Manufacturing and Annual Survey of Industries Note: All costs are in current prices
2.3 Conclusions The following points could be inferred from the analysis in this section on the supply-side: 23 • Employment has not grown as rapidly as output and capital in the Indian auto
industry. It has been falling in recent years in the vehicle manufacturing sector, while it has been growing steadily in the auto-component sector.
• Two-wheelers are the major vehicle category produced in India, in quantity terms, while the production of other vehicles also has been increasing every year.
• Market concentration has been increasing in both vehicle and component manufacturing sectors.
• The ratio of the import of the auto-components to the auto-components produced in India has risen,24 indicating that this sector may face threats from cheaper imports.
• Wage growth has been lower than labour productivity growth in this industry. • Capital productivity, labour productivity and Total Factor Productivity have been
higher in two-/three-wheeler manufacturers than in CV/PV manufacturers, while capital intensity has been higher in the latter.25 All these measures have been growing for all sub-sectors in the entire auto industry in India.
23 Appendix 1 includes a detailed analysis based on which some of these conclusions are arrived at. 24 This could also be because of the higher quality and technology requirements of some foreign firms in
India. 25 Here, various sub-categories of auto manufacturers include their respective component manufacturers.
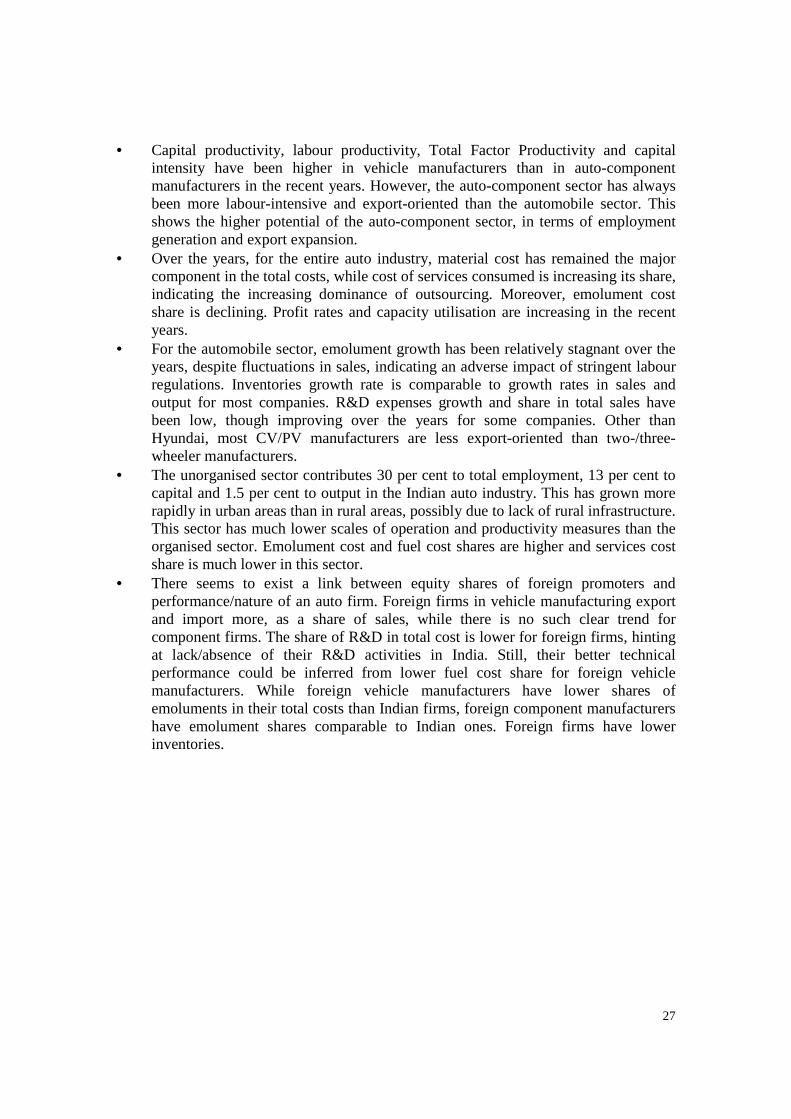
27
• Capital productivity, labour productivity, Total Factor Productivity and capital intensity have been higher in vehicle manufacturers than in auto-component manufacturers in the recent years. However, the auto-component sector has always been more labour-intensive and export-oriented than the automobile sector. This shows the higher potential of the auto-component sector, in terms of employment generation and export expansion.
• Over the years, for the entire auto industry, material cost has remained the major component in the total costs, while cost of services consumed is increasing its share, indicating the increasing dominance of outsourcing. Moreover, emolument cost share is declining. Profit rates and capacity utilisation are increasing in the recent years.
• For the automobile sector, emolument growth has been relatively stagnant over the years, despite fluctuations in sales, indicating an adverse impact of stringent labour regulations. Inventories growth rate is comparable to growth rates in sales and output for most companies. R&D expenses growth and share in total sales have been low, though improving over the years for some companies. Other than Hyundai, most CV/PV manufacturers are less export-oriented than two-/three-wheeler manufacturers.
• The unorganised sector contributes 30 per cent to total employment, 13 per cent to capital and 1.5 per cent to output in the Indian auto industry. This has grown more rapidly in urban areas than in rural areas, possibly due to lack of rural infrastructure. This sector has much lower scales of operation and productivity measures than the organised sector. Emolument cost and fuel cost shares are higher and services cost share is much lower in this sector.
• There seems to exist a link between equity shares of foreign promoters and performance/nature of an auto firm. Foreign firms in vehicle manufacturing export and import more, as a share of sales, while there is no such clear trend for component firms. The share of R&D in total cost is lower for foreign firms, hinting at lack/absence of their R&D activities in India. Still, their better technical performance could be inferred from lower fuel cost share for foreign vehicle manufacturers. While foreign vehicle manufacturers have lower shares of emoluments in their total costs than Indian firms, foreign component manufacturers have emolument shares comparable to Indian ones. Foreign firms have lower inventories.
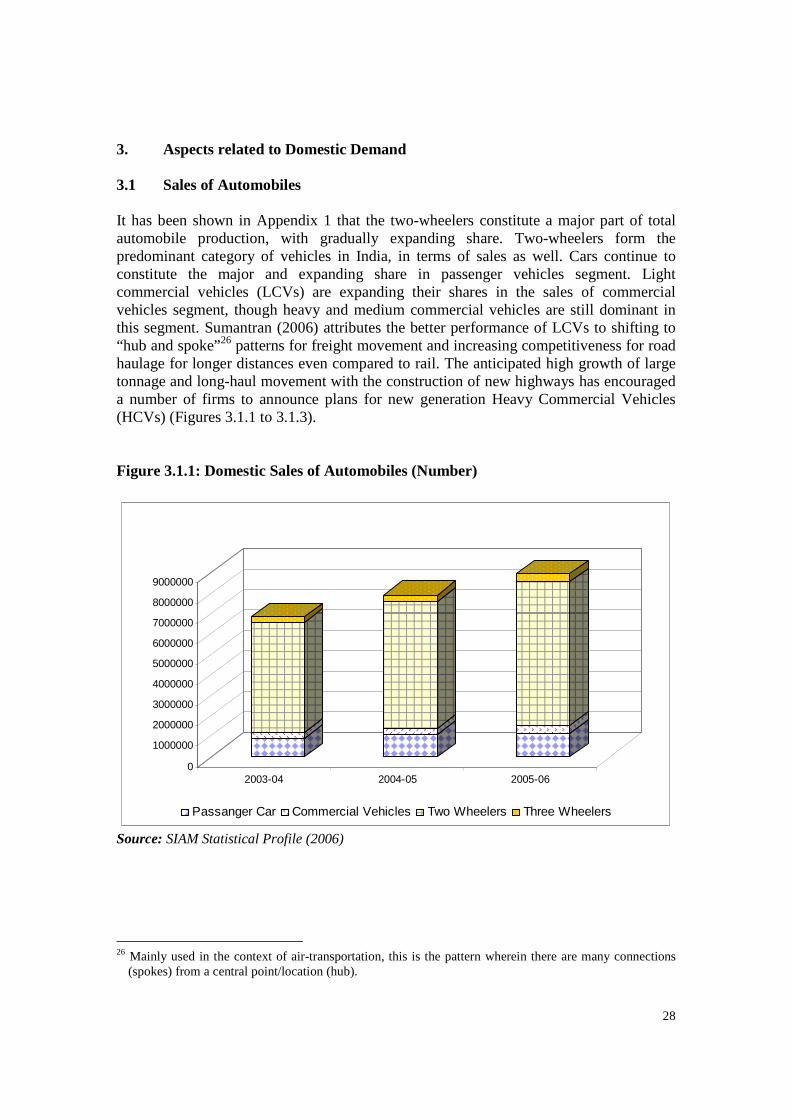
28
3. Aspects related to Domestic Demand 3.1 Sales of Automobiles It has been shown in Appendix 1 that the two-wheelers constitute a major part of total automobile production, with gradually expanding share. Two-wheelers form the predominant category of vehicles in India, in terms of sales as well. Cars continue to constitute the major and expanding share in passenger vehicles segment. Light commercial vehicles (LCVs) are expanding their shares in the sales of commercial vehicles segment, though heavy and medium commercial vehicles are still dominant in this segment. Sumantran (2006) attributes the better performance of LCVs to shifting to “hub and spoke”26 patterns for freight movement and increasing competitiveness for road haulage for longer distances even compared to rail. The anticipated high growth of large tonnage and long-haul movement with the construction of new highways has encouraged a number of firms to announce plans for new generation Heavy Commercial Vehicles (HCVs) (Figures 3.1.1 to 3.1.3). Figure 3.1.1: Domestic Sales of Automobiles (Number)
0
1000000
2000000
3000000
4000000
5000000
6000000
7000000
8000000
9000000
2003-04 2004-05 2005-06
Passanger Car Commercial Vehicles Two Wheelers Three Wheelers
Source: SIAM Statistical Profile (2006)
26 Mainly used in the context of air-transportation, this is the pattern wherein there are many connections
(spokes) from a central point/location (hub).
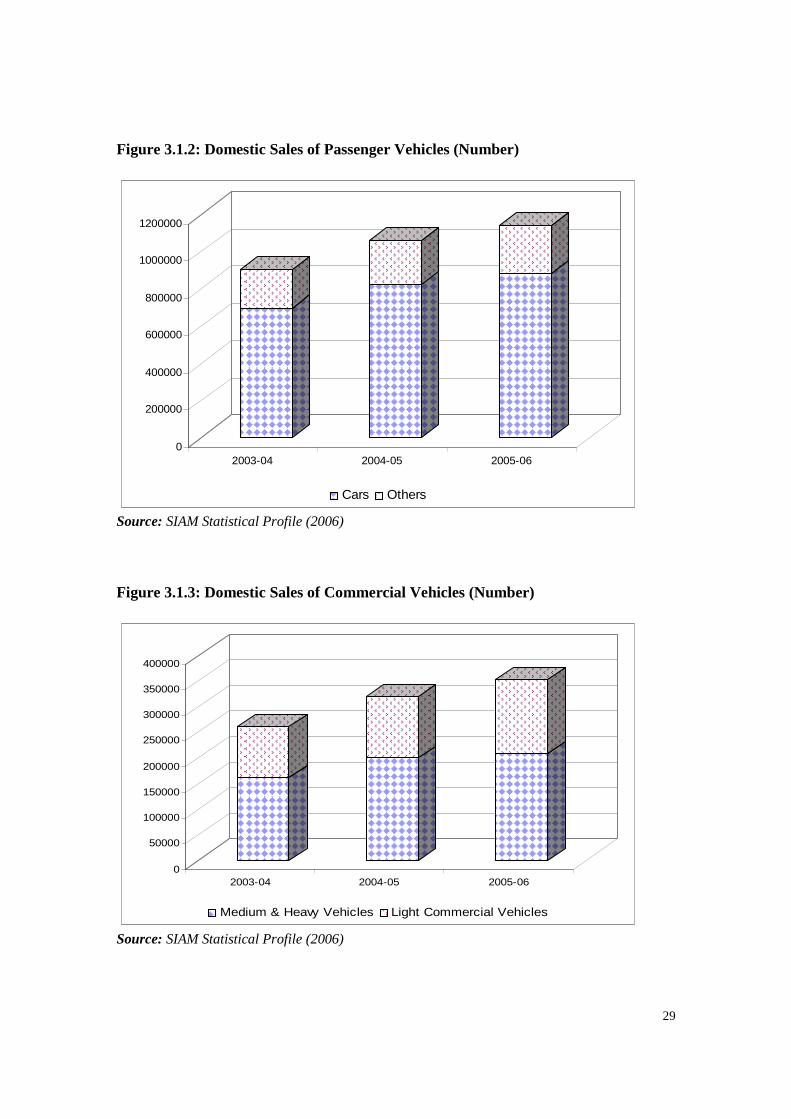
29
Figure 3.1.2: Domestic Sales of Passenger Vehicles (Number)
0
200000
400000
600000
800000
1000000
1200000
2003-04 2004-05 2005-06
Cars Others
Source: SIAM Statistical Profile (2006)
Figure 3.1.3: Domestic Sales of Commercial Vehicles (Number)
0
50000
100000
150000
200000
250000
300000
350000
400000
2003-04 2004-05 2005-06
Medium & Heavy Vehicles Light Commercial Vehicles
Source: SIAM Statistical Profile (2006)
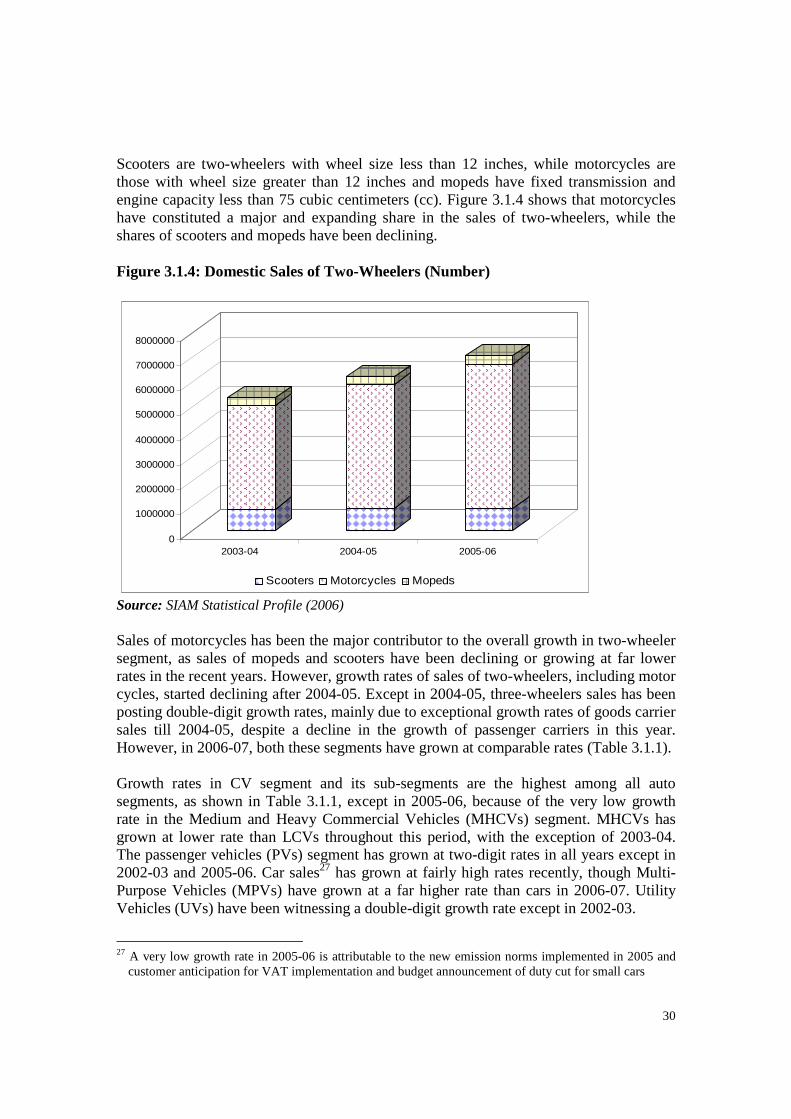
30
Scooters are two-wheelers with wheel size less than 12 inches, while motorcycles are those with wheel size greater than 12 inches and mopeds have fixed transmission and engine capacity less than 75 cubic centimeters (cc). Figure 3.1.4 shows that motorcycles have constituted a major and expanding share in the sales of two-wheelers, while the shares of scooters and mopeds have been declining. Figure 3.1.4: Domestic Sales of Two-Wheelers (Number)
0
1000000
2000000
3000000
4000000
5000000
6000000
7000000
8000000
2003-04 2004-05 2005-06
Scooters Motorcycles Mopeds
Source: SIAM Statistical Profile (2006) Sales of motorcycles has been the major contributor to the overall growth in two-wheeler segment, as sales of mopeds and scooters have been declining or growing at far lower rates in the recent years. However, growth rates of sales of two-wheelers, including motor cycles, started declining after 2004-05. Except in 2004-05, three-wheelers sales has been posting double-digit growth rates, mainly due to exceptional growth rates of goods carrier sales till 2004-05, despite a decline in the growth of passenger carriers in this year. However, in 2006-07, both these segments have grown at comparable rates (Table 3.1.1). Growth rates in CV segment and its sub-segments are the highest among all auto segments, as shown in Table 3.1.1, except in 2005-06, because of the very low growth rate in the Medium and Heavy Commercial Vehicles (MHCVs) segment. MHCVs has grown at lower rate than LCVs throughout this period, with the exception of 2003-04. The passenger vehicles (PVs) segment has grown at two-digit rates in all years except in 2002-03 and 2005-06. Car sales27 has grown at fairly high rates recently, though Multi-Purpose Vehicles (MPVs) have grown at a far higher rate than cars in 2006-07. Utility Vehicles (UVs) have been witnessing a double-digit growth rate except in 2002-03.
27 A very low growth rate in 2005-06 is attributable to the new emission norms implemented in 2005 and
customer anticipation for VAT implementation and budget announcement of duty cut for small cars
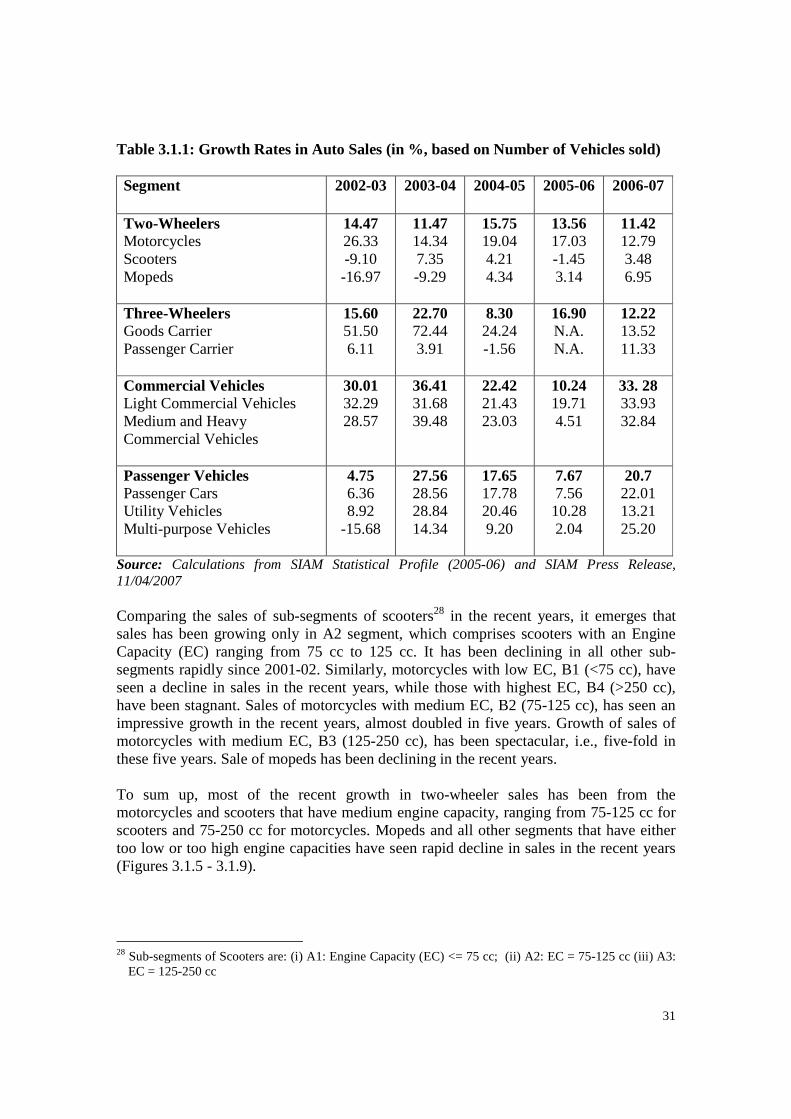
31
Table 3.1.1: Growth Rates in Auto Sales (in %, based on Number of Vehicles sold) Segment 2002-03 2003-04 2004-05 2005-06 2006-07
Two-Wheelers Motorcycles Scooters Mopeds
14.47 26.33 -9.10 -16.97
11.47 14.34 7.35 -9.29
15.75 19.04 4.21 4.34
13.56 17.03 -1.45 3.14
11.42 12.79 3.48 6.95
Three-Wheelers Goods Carrier Passenger Carrier
15.60 51.50 6.11
22.70 72.44 3.91
8.30 24.24 -1.56
16.90 N.A. N.A.
12.22 13.52 11.33
Commercial Vehicles Light Commercial Vehicles Medium and Heavy Commercial Vehicles
30.01 32.29 28.57
36.41 31.68 39.48
22.42 21.43 23.03
10.24 19.71 4.51
33. 28 33.93 32.84
Passenger Vehicles Passenger Cars Utility Vehicles Multi-purpose Vehicles
4.75 6.36 8.92
-15.68
27.56 28.56 28.84 14.34
17.65 17.78 20.46 9.20
7.67 7.56 10.28 2.04
20.7 22.01 13.21 25.20
Source: Calculations from SIAM Statistical Profile (2005-06) and SIAM Press Release, 11/04/2007 Comparing the sales of sub-segments of scooters28 in the recent years, it emerges that sales has been growing only in A2 segment, which comprises scooters with an Engine Capacity (EC) ranging from 75 cc to 125 cc. It has been declining in all other sub-segments rapidly since 2001-02. Similarly, motorcycles with low EC, B1 (<75 cc), have seen a decline in sales in the recent years, while those with highest EC, B4 (>250 cc), have been stagnant. Sales of motorcycles with medium EC, B2 (75-125 cc), has seen an impressive growth in the recent years, almost doubled in five years. Growth of sales of motorcycles with medium EC, B3 (125-250 cc), has been spectacular, i.e., five-fold in these five years. Sale of mopeds has been declining in the recent years. To sum up, most of the recent growth in two-wheeler sales has been from the motorcycles and scooters that have medium engine capacity, ranging from 75-125 cc for scooters and 75-250 cc for motorcycles. Mopeds and all other segments that have either too low or too high engine capacities have seen rapid decline in sales in the recent years (Figures 3.1.5 - 3.1.9).
28 Sub-segments of Scooters are: (i) A1: Engine Capacity (EC) <= 75 cc; (ii) A2: EC = 75-125 cc (iii) A3:
EC = 125-250 cc
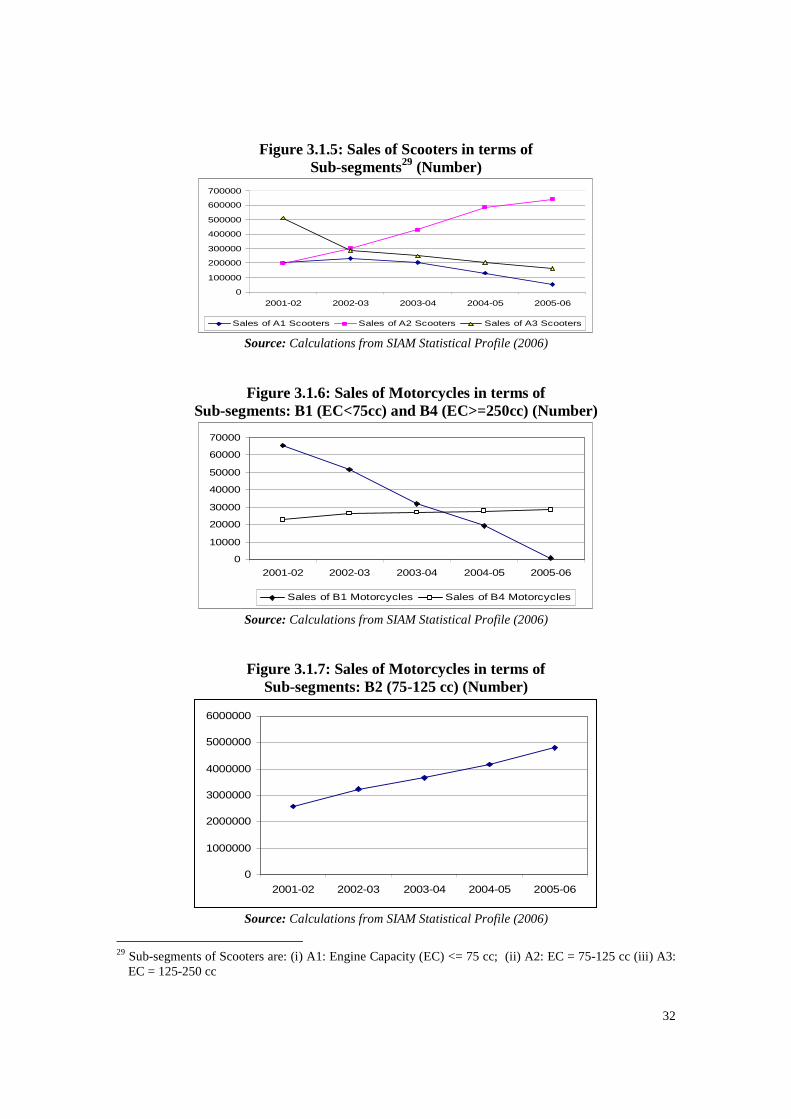
32
Figure 3.1.5: Sales of Scooters in terms of Sub-segments29 (Number)
0
100000
200000
300000
400000
500000
600000
700000
2001-02 2002-03 2003-04 2004-05 2005-06
Sales of A1 Scooters Sales of A2 Scooters Sales of A3 Scooters
Source: Calculations from SIAM Statistical Profile (2006)
Figure 3.1.6: Sales of Motorcycles in terms of Sub-segments: B1 (EC<75cc) and B4 (EC>=250cc) (Number)
0
10000
20000
30000
40000
50000
60000
70000
2001-02 2002-03 2003-04 2004-05 2005-06
Sales of B1 Motorcycles Sales of B4 Motorcycles
Source: Calculations from SIAM Statistical Profile (2006)
Figure 3.1.7: Sales of Motorcycles in terms of
Sub-segments: B2 (75-125 cc) (Number)
0
1000000
2000000
3000000
4000000
5000000
6000000
2001-02 2002-03 2003-04 2004-05 2005-06
Source: Calculations from SIAM Statistical Profile (2006)
29 Sub-segments of Scooters are: (i) A1: Engine Capacity (EC) <= 75 cc; (ii) A2: EC = 75-125 cc (iii) A3:
EC = 125-250 cc
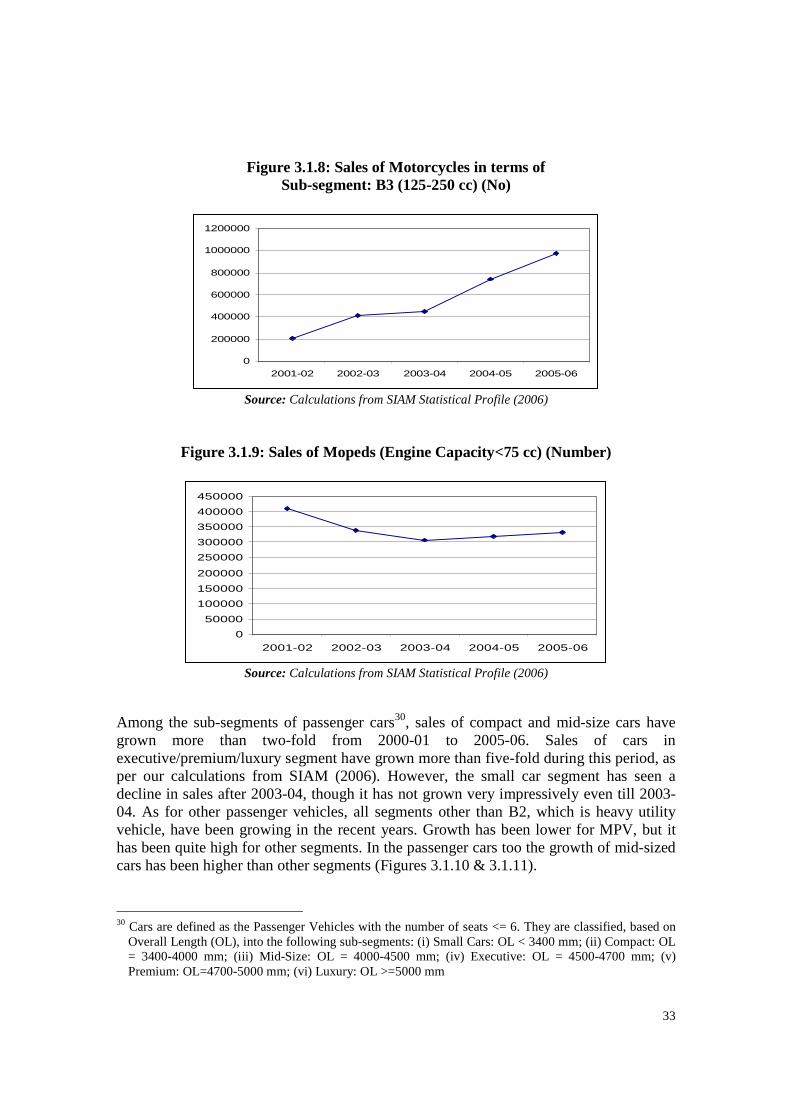
33
Figure 3.1.8: Sales of Motorcycles in terms of
Sub-segment: B3 (125-250 cc) (No)
0
200000
400000
600000
800000
1000000
1200000
2001-02 2002-03 2003-04 2004-05 2005-06
Source: Calculations from SIAM Statistical Profile (2006)
Figure 3.1.9: Sales of Mopeds (Engine Capacity<75 cc) (Number)
0
50000
100000
150000
200000
250000
300000
350000
400000
450000
2001-02 2002-03 2003-04 2004-05 2005-06
Source: Calculations from SIAM Statistical Profile (2006)
Among the sub-segments of passenger cars30, sales of compact and mid-size cars have grown more than two-fold from 2000-01 to 2005-06. Sales of cars in executive/premium/luxury segment have grown more than five-fold during this period, as per our calculations from SIAM (2006). However, the small car segment has seen a decline in sales after 2003-04, though it has not grown very impressively even till 2003-04. As for other passenger vehicles, all segments other than B2, which is heavy utility vehicle, have been growing in the recent years. Growth has been lower for MPV, but it has been quite high for other segments. In the passenger cars too the growth of mid-sized cars has been higher than other segments (Figures 3.1.10 & 3.1.11).
30 Cars are defined as the Passenger Vehicles with the number of seats <= 6. They are classified, based on
Overall Length (OL), into the following sub-segments: (i) Small Cars: OL < 3400 mm; (ii) Compact: OL = 3400-4000 mm; (iii) Mid-Size: OL = 4000-4500 mm; (iv) Executive: OL = 4500-4700 mm; (v) Premium: OL=4700-5000 mm; (vi) Luxury: OL >=5000 mm
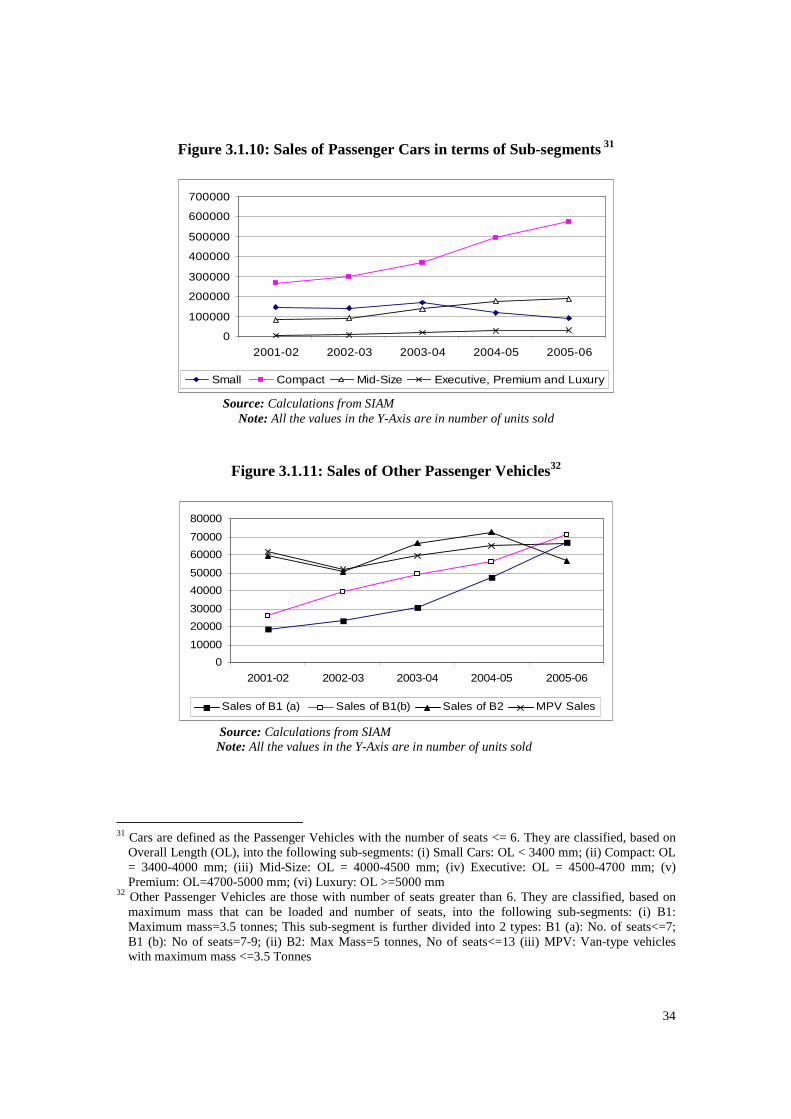
34
Figure 3.1.10: Sales of Passenger Cars in terms of Sub-segments 31
0
100000
200000
300000
400000
500000
600000
700000
2001-02 2002-03 2003-04 2004-05 2005-06
Small Compact Mid-Size Executive, Premium and Luxury
Source: Calculations from SIAM Note: All the values in the Y-Axis are in number of units sold
Figure 3.1.11: Sales of Other Passenger Vehicles32
0
10000
20000
30000
40000
50000
60000
70000
80000
2001-02 2002-03 2003-04 2004-05 2005-06
Sales of B1 (a) Sales of B1(b) Sales of B2 MPV Sales
Source: Calculations from SIAM Note: All the values in the Y-Axis are in number of units sold
31 Cars are defined as the Passenger Vehicles with the number of seats <= 6. They are classified, based on
Overall Length (OL), into the following sub-segments: (i) Small Cars: OL < 3400 mm; (ii) Compact: OL = 3400-4000 mm; (iii) Mid-Size: OL = 4000-4500 mm; (iv) Executive: OL = 4500-4700 mm; (v) Premium: OL=4700-5000 mm; (vi) Luxury: OL >=5000 mm
32 Other Passenger Vehicles are those with number of seats greater than 6. They are classified, based on maximum mass that can be loaded and number of seats, into the following sub-segments: (i) B1: Maximum mass=3.5 tonnes; This sub-segment is further divided into 2 types: B1 (a): No. of seats<=7; B1 (b): No of seats=7-9; (ii) B2: Max Mass=5 tonnes, No of seats<=13 (iii) MPV: Van-type vehicles with maximum mass <=3.5 Tonnes
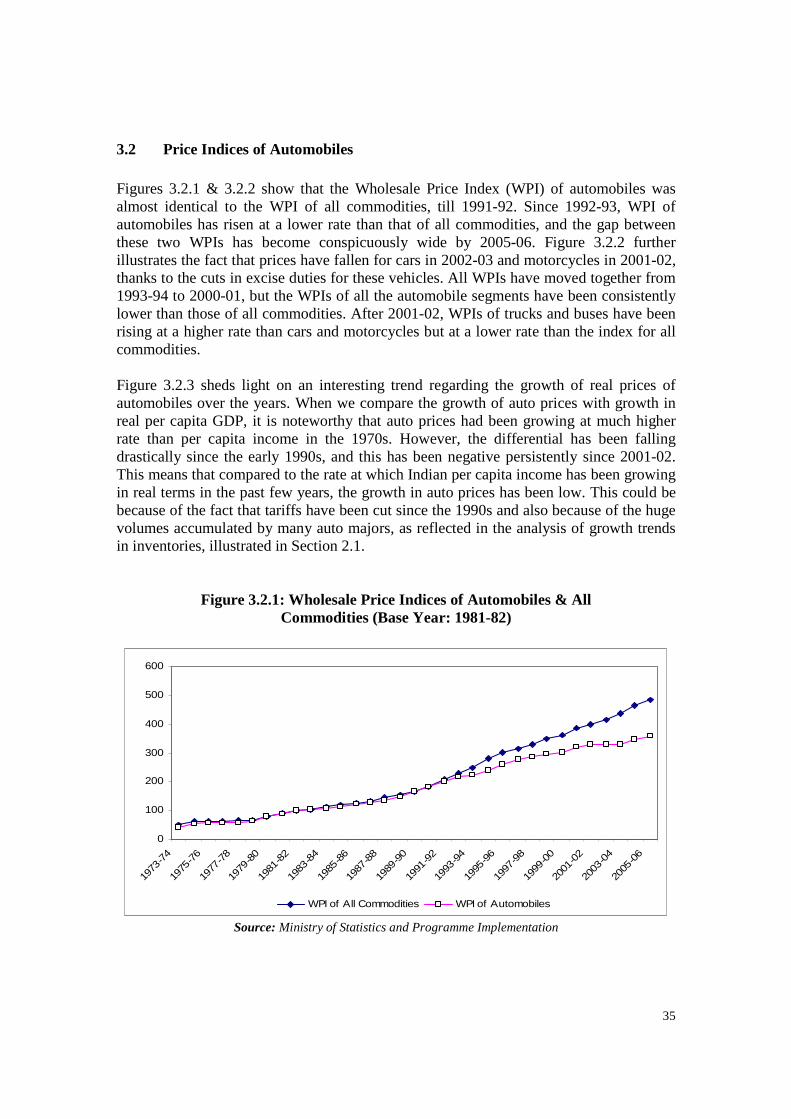
35
3.2 Price Indices of Automobiles Figures 3.2.1 & 3.2.2 show that the Wholesale Price Index (WPI) of automobiles was almost identical to the WPI of all commodities, till 1991-92. Since 1992-93, WPI of automobiles has risen at a lower rate than that of all commodities, and the gap between these two WPIs has become conspicuously wide by 2005-06. Figure 3.2.2 further illustrates the fact that prices have fallen for cars in 2002-03 and motorcycles in 2001-02, thanks to the cuts in excise duties for these vehicles. All WPIs have moved together from 1993-94 to 2000-01, but the WPIs of all the automobile segments have been consistently lower than those of all commodities. After 2001-02, WPIs of trucks and buses have been rising at a higher rate than cars and motorcycles but at a lower rate than the index for all commodities. Figure 3.2.3 sheds light on an interesting trend regarding the growth of real prices of automobiles over the years. When we compare the growth of auto prices with growth in real per capita GDP, it is noteworthy that auto prices had been growing at much higher rate than per capita income in the 1970s. However, the differential has been falling drastically since the early 1990s, and this has been negative persistently since 2001-02. This means that compared to the rate at which Indian per capita income has been growing in real terms in the past few years, the growth in auto prices has been low. This could be because of the fact that tariffs have been cut since the 1990s and also because of the huge volumes accumulated by many auto majors, as reflected in the analysis of growth trends in inventories, illustrated in Section 2.1.
Figure 3.2.1: Wholesale Price Indices of Automobiles & All
Commodities (Base Year: 1981-82)
0
100
200
300
400
500
600
1973
-74
1975
-76
1977
-78
1979
-80
1981
-82
1983
-84
1985
-86
1987
-88
1989
-90
1991
-92
1993
-94
1995
-96
1997
-98
1999
-00
2001
-02
2003
-04
2005
-06
WPI of All Commodities WPI of Automobiles
Source: Ministry of Statistics and Programme Implementation
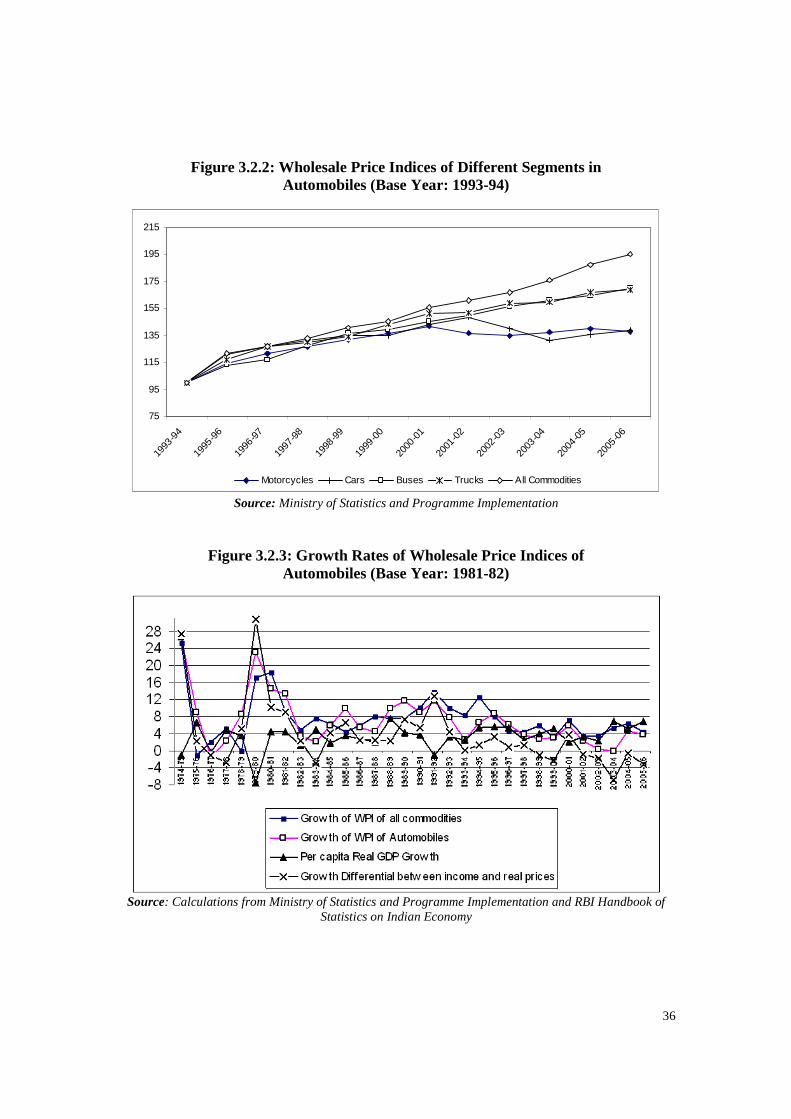
36
Figure 3.2.2: Wholesale Price Indices of Different Segments in
Automobiles (Base Year: 1993-94)
75
95
115
135
155
175
195
215
1993
-94
1995
-96
1996
-97
1997
-98
1998
-99
1999
-00
2000
-01
2001
-02
2002
-03
2003
-04
2004
-05
2005
-06
Motorcycles Cars Buses Trucks All Commodities
Source: Ministry of Statistics and Programme Implementation
Figure 3.2.3: Growth Rates of Wholesale Price Indices of Automobiles (Base Year: 1981-82)
Source: Calculations from Ministry of Statistics and Programme Implementation and RBI Handbook of
Statistics on Indian Economy
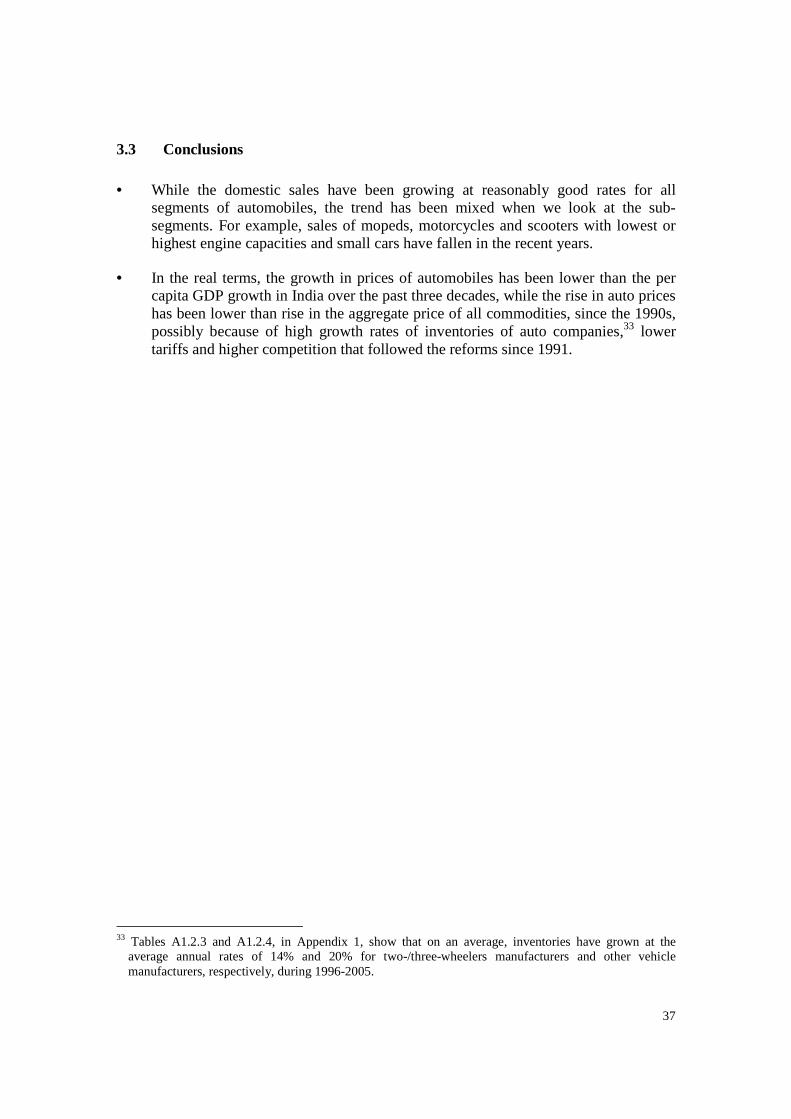
37
3.3 Conclusions • While the domestic sales have been growing at reasonably good rates for all
segments of automobiles, the trend has been mixed when we look at the sub-segments. For example, sales of mopeds, motorcycles and scooters with lowest or highest engine capacities and small cars have fallen in the recent years.
• In the real terms, the growth in prices of automobiles has been lower than the per capita GDP growth in India over the past three decades, while the rise in auto prices has been lower than rise in the aggregate price of all commodities, since the 1990s, possibly because of high growth rates of inventories of auto companies,33 lower tariffs and higher competition that followed the reforms since 1991.
33 Tables A1.2.3 and A1.2.4, in Appendix 1, show that on an average, inventories have grown at the
average annual rates of 14% and 20% for two-/three-wheelers manufacturers and other vehicle manufacturers, respectively, during 1996-2005.
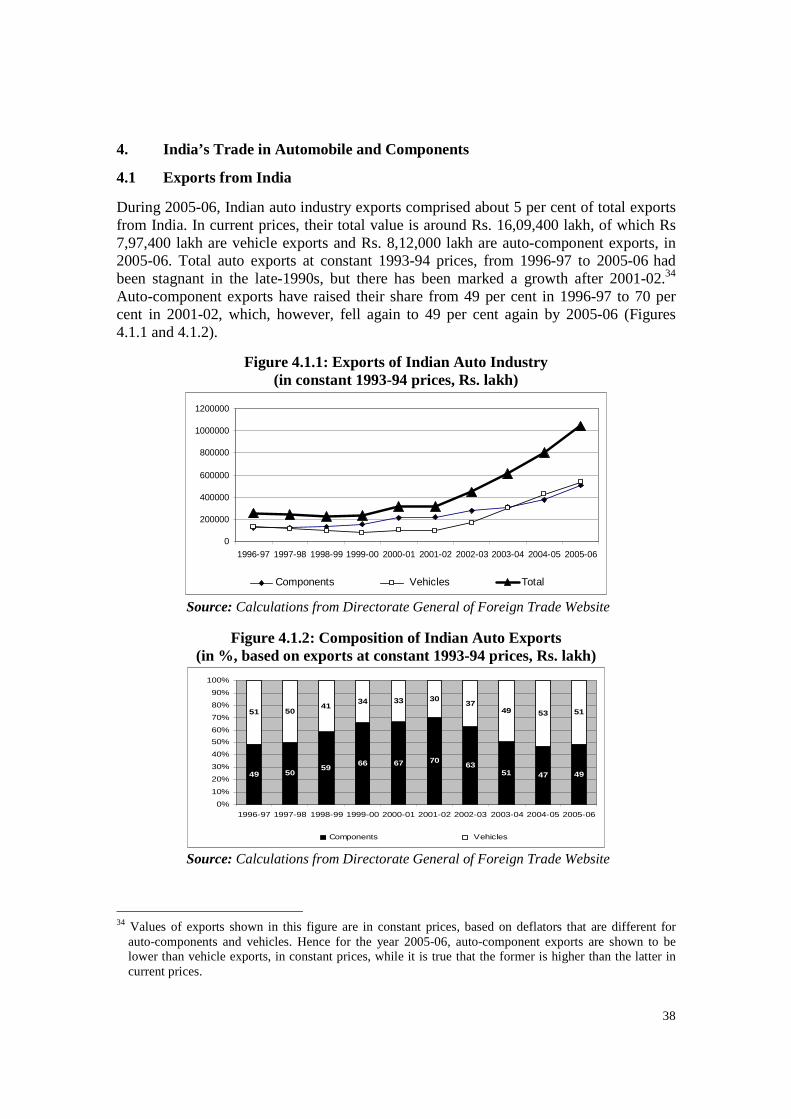
38
4. India’s Trade in Automobile and Components
4.1 Exports from India
During 2005-06, Indian auto industry exports comprised about 5 per cent of total exports from India. In current prices, their total value is around Rs. 16,09,400 lakh, of which Rs 7,97,400 lakh are vehicle exports and Rs. 8,12,000 lakh are auto-component exports, in 2005-06. Total auto exports at constant 1993-94 prices, from 1996-97 to 2005-06 had been stagnant in the late-1990s, but there has been marked a growth after 2001-02.34 Auto-component exports have raised their share from 49 per cent in 1996-97 to 70 per cent in 2001-02, which, however, fell again to 49 per cent again by 2005-06 (Figures 4.1.1 and 4.1.2).
Figure 4.1.1: Exports of Indian Auto Industry (in constant 1993-94 prices, Rs. lakh)
0
200000
400000
600000
800000
1000000
1200000
1996-97 1997-98 1998-99 1999-00 2000-01 2001-02 2002-03 2003-04 2004-05 2005-06
Components Vehicles Total
Source: Calculations from Directorate General of Foreign Trade Website
Figure 4.1.2: Composition of Indian Auto Exports (in %, based on exports at constant 1993-94 prices, Rs. lakh)
49 5059
66 67 7063
51 47 49
51 5041
34 33 3037
49 53 51
0%
10%
20%
30%
40%
50%
60%
70%
80%
90%
100%
1996-97 1997-98 1998-99 1999-00 2000-01 2001-02 2002-03 2003-04 2004-05 2005-06
Components Vehicles
Source: Calculations from Directorate General of Foreign Trade Website
34 Values of exports shown in this figure are in constant prices, based on deflators that are different for
auto-components and vehicles. Hence for the year 2005-06, auto-component exports are shown to be lower than vehicle exports, in constant prices, while it is true that the former is higher than the latter in current prices.
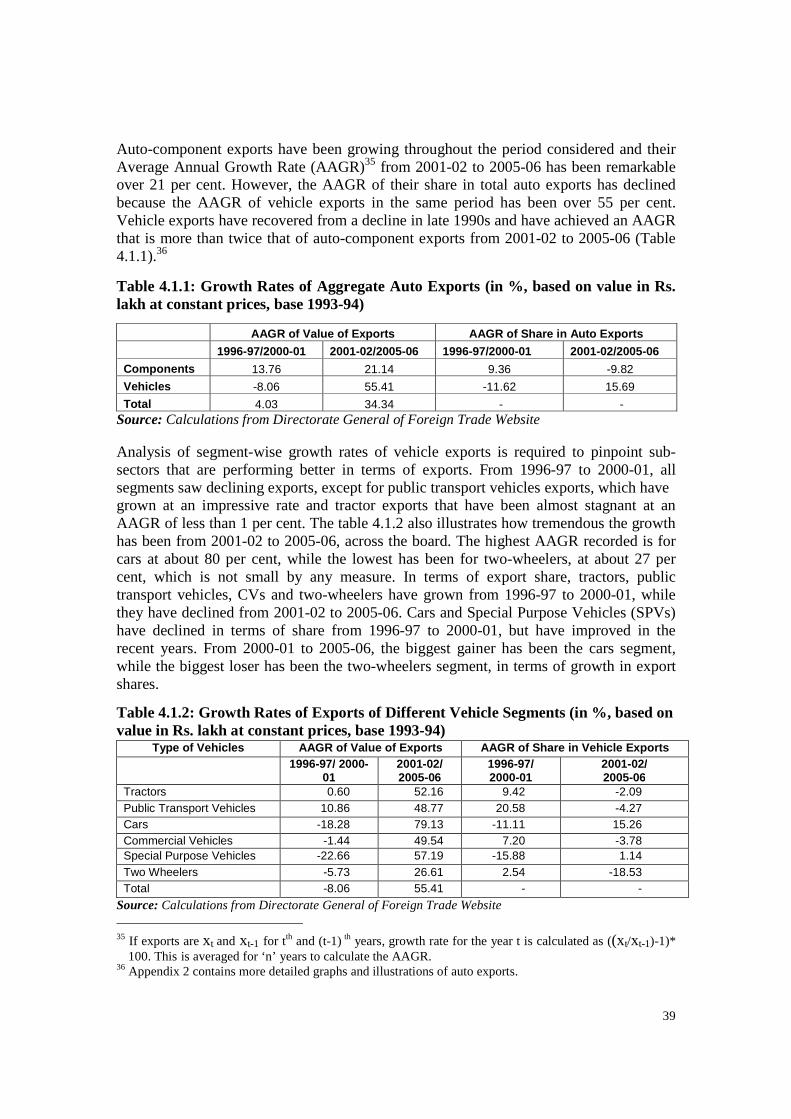
39
Auto-component exports have been growing throughout the period considered and their Average Annual Growth Rate (AAGR)35 from 2001-02 to 2005-06 has been remarkable over 21 per cent. However, the AAGR of their share in total auto exports has declined because the AAGR of vehicle exports in the same period has been over 55 per cent. Vehicle exports have recovered from a decline in late 1990s and have achieved an AAGR that is more than twice that of auto-component exports from 2001-02 to 2005-06 (Table 4.1.1).36
Table 4.1.1: Growth Rates of Aggregate Auto Exports (in %, based on value in Rs. lakh at constant prices, base 1993-94)
AAGR of Value of Exports AAGR of Share in Auto Exports
1996-97/2000-01 2001-02/2005-06 1996-97/2000-01 2001-02/2005-06
Components 13.76 21.14 9.36 -9.82
Vehicles -8.06 55.41 -11.62 15.69
Total 4.03 34.34 - - Source: Calculations from Directorate General of Foreign Trade Website Analysis of segment-wise growth rates of vehicle exports is required to pinpoint sub-sectors that are performing better in terms of exports. From 1996-97 to 2000-01, all segments saw declining exports, except for public transport vehicles exports, which have grown at an impressive rate and tractor exports that have been almost stagnant at an AAGR of less than 1 per cent. The table 4.1.2 also illustrates how tremendous the growth has been from 2001-02 to 2005-06, across the board. The highest AAGR recorded is for cars at about 80 per cent, while the lowest has been for two-wheelers, at about 27 per cent, which is not small by any measure. In terms of export share, tractors, public transport vehicles, CVs and two-wheelers have grown from 1996-97 to 2000-01, while they have declined from 2001-02 to 2005-06. Cars and Special Purpose Vehicles (SPVs) have declined in terms of share from 1996-97 to 2000-01, but have improved in the recent years. From 2000-01 to 2005-06, the biggest gainer has been the cars segment, while the biggest loser has been the two-wheelers segment, in terms of growth in export shares.
Table 4.1.2: Growth Rates of Exports of Different Vehicle Segments (in %, based on value in Rs. lakh at constant prices, base 1993-94)
Type of Vehicles AAGR of Value of Exports AAGR of Share in Vehicle Exports 1996-97/ 2000-
01 2001-02/ 2005-06
1996-97/ 2000-01
2001-02/ 2005-06
Tractors 0.60 52.16 9.42 -2.09 Public Transport Vehicles 10.86 48.77 20.58 -4.27 Cars -18.28 79.13 -11.11 15.26 Commercial Vehicles -1.44 49.54 7.20 -3.78 Special Purpose Vehicles -22.66 57.19 -15.88 1.14 Two Wheelers -5.73 26.61 2.54 -18.53 Total -8.06 55.41 - -
Source: Calculations from Directorate General of Foreign Trade Website
35 If exports are xt and xt-1 for tth and (t-1) th years, growth rate for the year t is calculated as ((xt/xt-1)-1)*
100. This is averaged for ‘n’ years to calculate the AAGR. 36 Appendix 2 contains more detailed graphs and illustrations of auto exports.
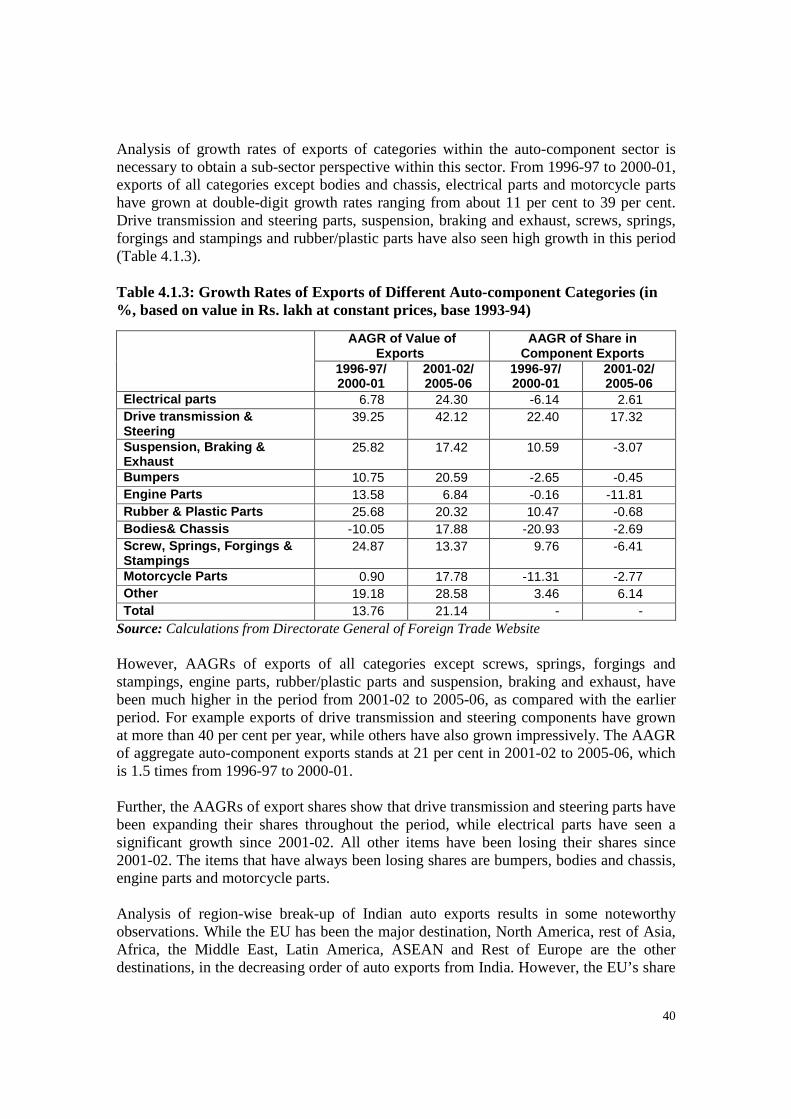
40
Analysis of growth rates of exports of categories within the auto-component sector is necessary to obtain a sub-sector perspective within this sector. From 1996-97 to 2000-01, exports of all categories except bodies and chassis, electrical parts and motorcycle parts have grown at double-digit growth rates ranging from about 11 per cent to 39 per cent. Drive transmission and steering parts, suspension, braking and exhaust, screws, springs, forgings and stampings and rubber/plastic parts have also seen high growth in this period (Table 4.1.3). Table 4.1.3: Growth Rates of Exports of Different Auto-component Categories (in %, based on value in Rs. lakh at constant prices, base 1993-94)
AAGR of Value of Exports
AAGR of Share in Component Exports
1996-97/ 2000-01
2001-02/ 2005-06
1996-97/ 2000-01
2001-02/ 2005-06
Electrical parts 6.78 24.30 -6.14 2.61 Drive transmission & Steering
39.25 42.12 22.40 17.32
Suspension, Braking & Exhaust
25.82 17.42 10.59 -3.07
Bumpers 10.75 20.59 -2.65 -0.45 Engine Parts 13.58 6.84 -0.16 -11.81 Rubber & Plastic Parts 25.68 20.32 10.47 -0.68 Bodies& Chassis -10.05 17.88 -20.93 -2.69 Screw, Springs, Forgings & Stampings
24.87 13.37 9.76 -6.41
Motorcycle Parts 0.90 17.78 -11.31 -2.77 Other 19.18 28.58 3.46 6.14 Total 13.76 21.14 - -
Source: Calculations from Directorate General of Foreign Trade Website However, AAGRs of exports of all categories except screws, springs, forgings and stampings, engine parts, rubber/plastic parts and suspension, braking and exhaust, have been much higher in the period from 2001-02 to 2005-06, as compared with the earlier period. For example exports of drive transmission and steering components have grown at more than 40 per cent per year, while others have also grown impressively. The AAGR of aggregate auto-component exports stands at 21 per cent in 2001-02 to 2005-06, which is 1.5 times from 1996-97 to 2000-01. Further, the AAGRs of export shares show that drive transmission and steering parts have been expanding their shares throughout the period, while electrical parts have seen a significant growth since 2001-02. All other items have been losing their shares since 2001-02. The items that have always been losing shares are bumpers, bodies and chassis, engine parts and motorcycle parts. Analysis of region-wise break-up of Indian auto exports results in some noteworthy observations. While the EU has been the major destination, North America, rest of Asia, Africa, the Middle East, Latin America, ASEAN and Rest of Europe are the other destinations, in the decreasing order of auto exports from India. However, the EU’s share
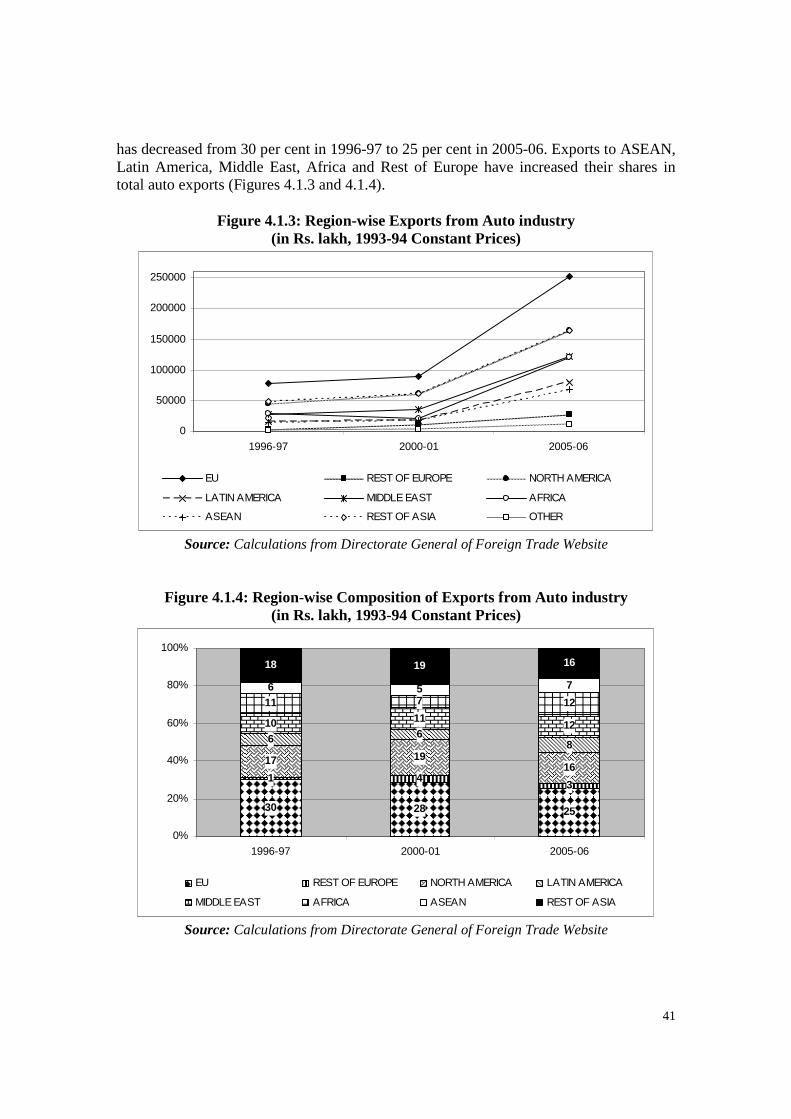
41
has decreased from 30 per cent in 1996-97 to 25 per cent in 2005-06. Exports to ASEAN, Latin America, Middle East, Africa and Rest of Europe have increased their shares in total auto exports (Figures 4.1.3 and 4.1.4).
Figure 4.1.3: Region-wise Exports from Auto industry
(in Rs. lakh, 1993-94 Constant Prices)
0
50000
100000
150000
200000
250000
1996-97 2000-01 2005-06
EU REST OF EUROPE NORTH AMERICA
LATIN AMERICA MIDDLE EAST AFRICA
ASEAN REST OF ASIA OTHER
Source: Calculations from Directorate General of Foreign Trade Website
Figure 4.1.4: Region-wise Composition of Exports from Auto industry (in Rs. lakh, 1993-94 Constant Prices)
30 28 25
1 43
17 1916
6 68
10 1112
11 7 126 5 7
18 19 16
0%
20%
40%
60%
80%
100%
1996-97 2000-01 2005-06
EU REST OF EUROPE NORTH AMERICA LATIN AMERICA
MIDDLE EAST AFRICA ASEAN REST OF ASIA
Source: Calculations from Directorate General of Foreign Trade Website
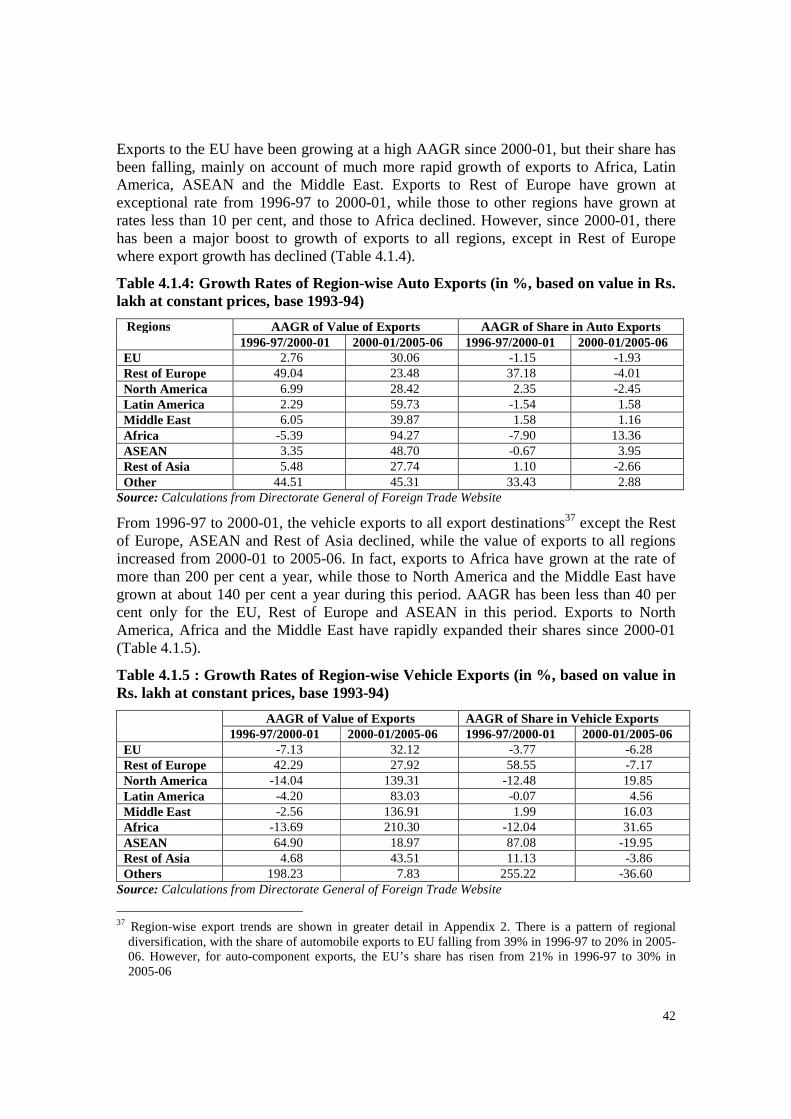
42
Exports to the EU have been growing at a high AAGR since 2000-01, but their share has been falling, mainly on account of much more rapid growth of exports to Africa, Latin America, ASEAN and the Middle East. Exports to Rest of Europe have grown at exceptional rate from 1996-97 to 2000-01, while those to other regions have grown at rates less than 10 per cent, and those to Africa declined. However, since 2000-01, there has been a major boost to growth of exports to all regions, except in Rest of Europe where export growth has declined (Table 4.1.4).
Table 4.1.4: Growth Rates of Region-wise Auto Exports (in %, based on value in Rs. lakh at constant prices, base 1993-94)
Regions AAGR of Value of Exports AAGR of Share in Auto Exports 1996-97/2000-01 2000-01/2005-06 1996-97/2000-01 2000-01/2005-06
EU 2.76 30.06 -1.15 -1.93 Rest of Europe 49.04 23.48 37.18 -4.01 North America 6.99 28.42 2.35 -2.45 Latin America 2.29 59.73 -1.54 1.58 Middle East 6.05 39.87 1.58 1.16 Africa -5.39 94.27 -7.90 13.36 ASEAN 3.35 48.70 -0.67 3.95 Rest of Asia 5.48 27.74 1.10 -2.66 Other 44.51 45.31 33.43 2.88
Source: Calculations from Directorate General of Foreign Trade Website
From 1996-97 to 2000-01, the vehicle exports to all export destinations37 except the Rest of Europe, ASEAN and Rest of Asia declined, while the value of exports to all regions increased from 2000-01 to 2005-06. In fact, exports to Africa have grown at the rate of more than 200 per cent a year, while those to North America and the Middle East have grown at about 140 per cent a year during this period. AAGR has been less than 40 per cent only for the EU, Rest of Europe and ASEAN in this period. Exports to North America, Africa and the Middle East have rapidly expanded their shares since 2000-01 (Table 4.1.5).
Table 4.1.5 : Growth Rates of Region-wise Vehicle Exports (in %, based on value in Rs. lakh at constant prices, base 1993-94)
AAGR of Value of Exports AAGR of Share in Vehicle Exports 1996-97/2000-01 2000-01/2005-06 1996-97/2000-01 2000-01/2005-06
EU -7.13 32.12 -3.77 -6.28 Rest of Europe 42.29 27.92 58.55 -7.17 North America -14.04 139.31 -12.48 19.85 Latin America -4.20 83.03 -0.07 4.56 Middle East -2.56 136.91 1.99 16.03 Africa -13.69 210.30 -12.04 31.65 ASEAN 64.90 18.97 87.08 -19.95 Rest of Asia 4.68 43.51 11.13 -3.86 Others 198.23 7.83 255.22 -36.60
Source: Calculations from Directorate General of Foreign Trade Website
37 Region-wise export trends are shown in greater detail in Appendix 2. There is a pattern of regional
diversification, with the share of automobile exports to EU falling from 39% in 1996-97 to 20% in 2005-06. However, for auto-component exports, the EU’s share has risen from 21% in 1996-97 to 30% in 2005-06
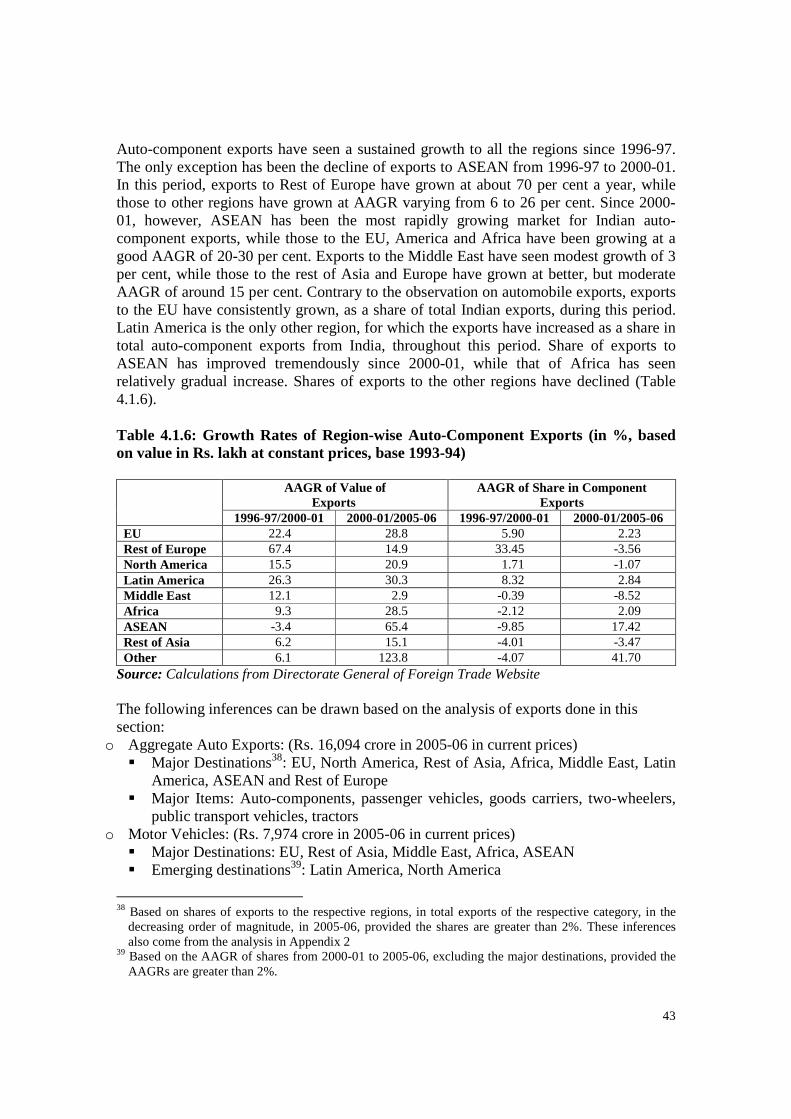
43
Auto-component exports have seen a sustained growth to all the regions since 1996-97. The only exception has been the decline of exports to ASEAN from 1996-97 to 2000-01. In this period, exports to Rest of Europe have grown at about 70 per cent a year, while those to other regions have grown at AAGR varying from 6 to 26 per cent. Since 2000-01, however, ASEAN has been the most rapidly growing market for Indian auto-component exports, while those to the EU, America and Africa have been growing at a good AAGR of 20-30 per cent. Exports to the Middle East have seen modest growth of 3 per cent, while those to the rest of Asia and Europe have grown at better, but moderate AAGR of around 15 per cent. Contrary to the observation on automobile exports, exports to the EU have consistently grown, as a share of total Indian exports, during this period. Latin America is the only other region, for which the exports have increased as a share in total auto-component exports from India, throughout this period. Share of exports to ASEAN has improved tremendously since 2000-01, while that of Africa has seen relatively gradual increase. Shares of exports to the other regions have declined (Table 4.1.6).
Table 4.1.6: Growth Rates of Region-wise Auto-Component Exports (in %, based on value in Rs. lakh at constant prices, base 1993-94)
AAGR of Value of Exports
AAGR of Share in Component Exports
1996-97/2000-01 2000-01/2005-06 1996-97/2000-01 2000-01/2005-06 EU 22.4 28.8 5.90 2.23 Rest of Europe 67.4 14.9 33.45 -3.56 North America 15.5 20.9 1.71 -1.07 Latin America 26.3 30.3 8.32 2.84 Middle East 12.1 2.9 -0.39 -8.52 Africa 9.3 28.5 -2.12 2.09 ASEAN -3.4 65.4 -9.85 17.42 Rest of Asia 6.2 15.1 -4.01 -3.47 Other 6.1 123.8 -4.07 41.70
Source: Calculations from Directorate General of Foreign Trade Website The following inferences can be drawn based on the analysis of exports done in this section:
o Aggregate Auto Exports: (Rs. 16,094 crore in 2005-06 in current prices) � Major Destinations38: EU, North America, Rest of Asia, Africa, Middle East, Latin
America, ASEAN and Rest of Europe � Major Items: Auto-components, passenger vehicles, goods carriers, two-wheelers,
public transport vehicles, tractors o Motor Vehicles: (Rs. 7,974 crore in 2005-06 in current prices)
� Major Destinations: EU, Rest of Asia, Middle East, Africa, ASEAN � Emerging destinations39: Latin America, North America
38 Based on shares of exports to the respective regions, in total exports of the respective category, in the
decreasing order of magnitude, in 2005-06, provided the shares are greater than 2%. These inferences also come from the analysis in Appendix 2
39 Based on the AAGR of shares from 2000-01 to 2005-06, excluding the major destinations, provided the AAGRs are greater than 2%.
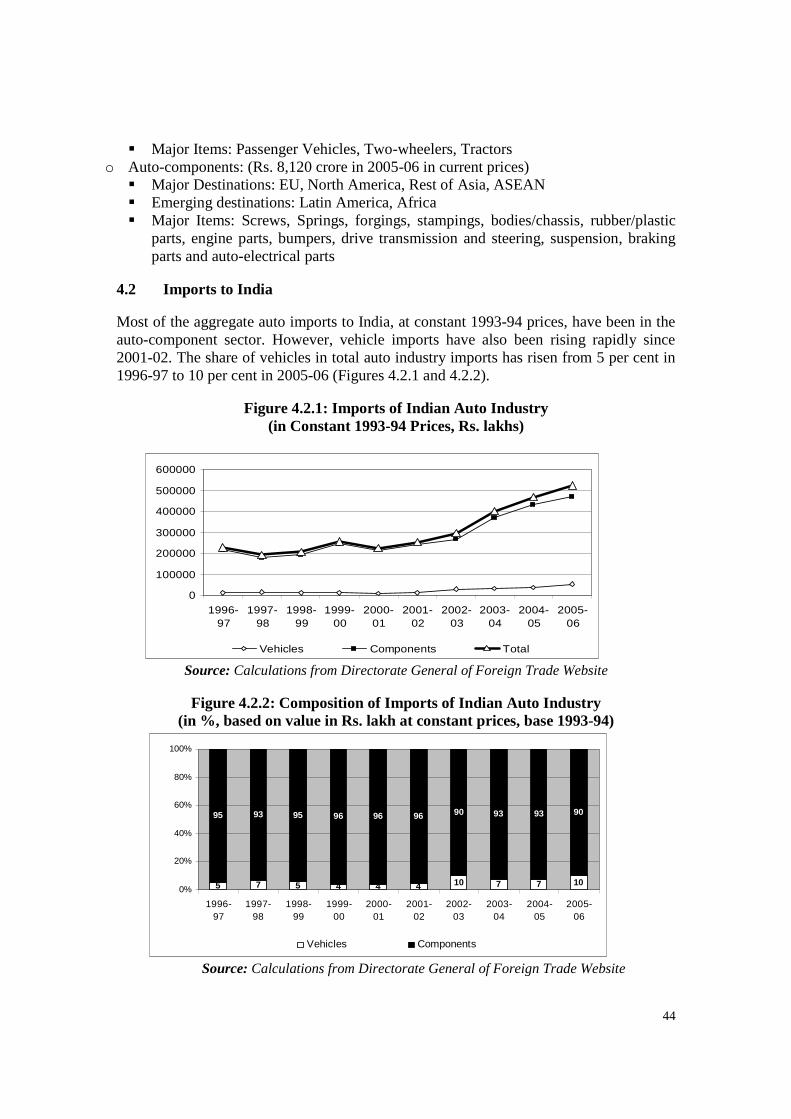
44
� Major Items: Passenger Vehicles, Two-wheelers, Tractors o Auto-components: (Rs. 8,120 crore in 2005-06 in current prices)
� Major Destinations: EU, North America, Rest of Asia, ASEAN � Emerging destinations: Latin America, Africa � Major Items: Screws, Springs, forgings, stampings, bodies/chassis, rubber/plastic
parts, engine parts, bumpers, drive transmission and steering, suspension, braking parts and auto-electrical parts
4.2 Imports to India Most of the aggregate auto imports to India, at constant 1993-94 prices, have been in the auto-component sector. However, vehicle imports have also been rising rapidly since 2001-02. The share of vehicles in total auto industry imports has risen from 5 per cent in 1996-97 to 10 per cent in 2005-06 (Figures 4.2.1 and 4.2.2).
Figure 4.2.1: Imports of Indian Auto Industry
(in Constant 1993-94 Prices, Rs. lakhs)
0
100000
200000
300000
400000
500000
600000
1996-97
1997-98
1998-99
1999-00
2000-01
2001-02
2002-03
2003-04
2004-05
2005-06
Vehicles Components Total
Source: Calculations from Directorate General of Foreign Trade Website
Figure 4.2.2: Composition of Imports of Indian Auto Industry (in %, based on value in Rs. lakh at constant prices, base 1993-94)
5 7 5 4 4 4 10 7 7 10
95 93 95 96 96 96 90 93 93 90
0%
20%
40%
60%
80%
100%
1996-97
1997-98
1998-99
1999-00
2000-01
2001-02
2002-03
2003-04
2004-05
2005-06
Vehicles Components
Source: Calculations from Directorate General of Foreign Trade Website
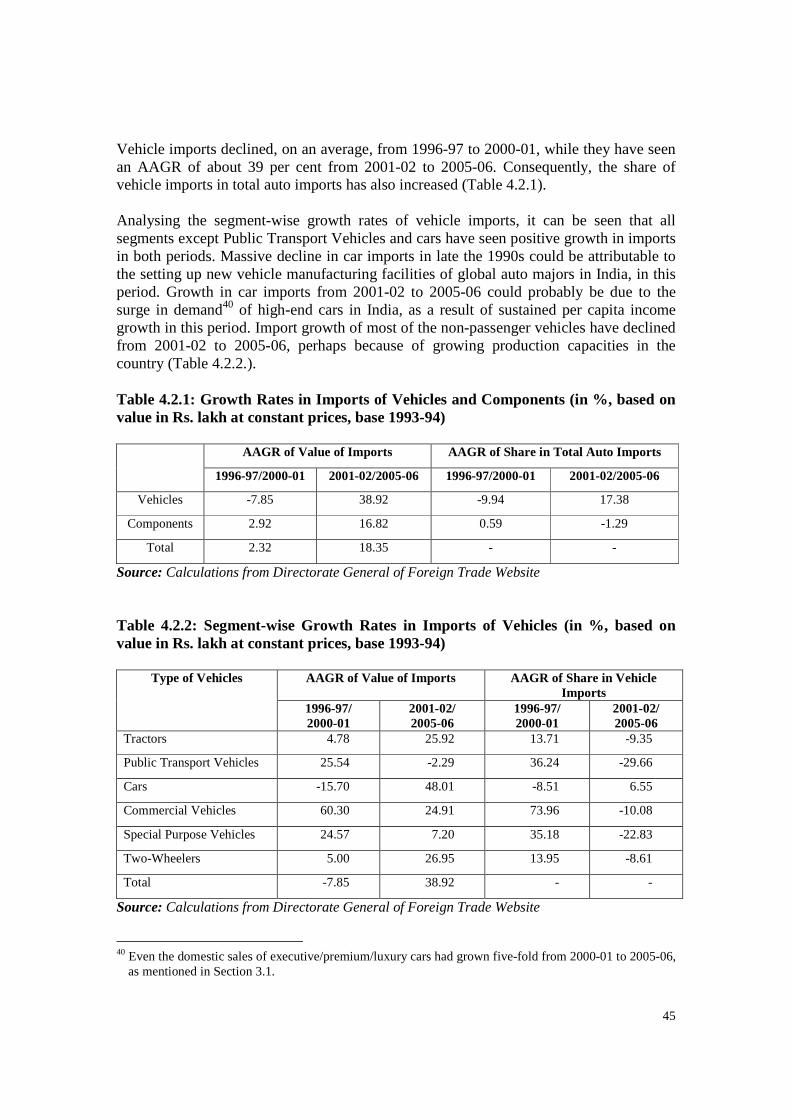
45
Vehicle imports declined, on an average, from 1996-97 to 2000-01, while they have seen an AAGR of about 39 per cent from 2001-02 to 2005-06. Consequently, the share of vehicle imports in total auto imports has also increased (Table 4.2.1). Analysing the segment-wise growth rates of vehicle imports, it can be seen that all segments except Public Transport Vehicles and cars have seen positive growth in imports in both periods. Massive decline in car imports in late the 1990s could be attributable to the setting up new vehicle manufacturing facilities of global auto majors in India, in this period. Growth in car imports from 2001-02 to 2005-06 could probably be due to the surge in demand40 of high-end cars in India, as a result of sustained per capita income growth in this period. Import growth of most of the non-passenger vehicles have declined from 2001-02 to 2005-06, perhaps because of growing production capacities in the country (Table 4.2.2.).
Table 4.2.1: Growth Rates in Imports of Vehicles and Components (in %, based on value in Rs. lakh at constant prices, base 1993-94)
AAGR of Value of Imports AAGR of Share in Total Auto Imports
1996-97/2000-01 2001-02/2005-06 1996-97/2000-01 2001-02/2005-06
Vehicles -7.85 38.92 -9.94 17.38
Components 2.92 16.82 0.59 -1.29
Total 2.32 18.35 - -
Source: Calculations from Directorate General of Foreign Trade Website Table 4.2.2: Segment-wise Growth Rates in Imports of Vehicles (in %, based on value in Rs. lakh at constant prices, base 1993-94)
Type of Vehicles AAGR of Value of Imports AAGR of Share in Vehicle Imports
1996-97/ 2000-01
2001-02/ 2005-06
1996-97/ 2000-01
2001-02/ 2005-06
Tractors 4.78 25.92 13.71 -9.35
Public Transport Vehicles 25.54 -2.29 36.24 -29.66
Cars -15.70 48.01 -8.51 6.55
Commercial Vehicles 60.30 24.91 73.96 -10.08
Special Purpose Vehicles 24.57 7.20 35.18 -22.83
Two-Wheelers 5.00 26.95 13.95 -8.61
Total -7.85 38.92 - -
Source: Calculations from Directorate General of Foreign Trade Website
40 Even the domestic sales of executive/premium/luxury cars had grown five-fold from 2000-01 to 2005-06,
as mentioned in Section 3.1.
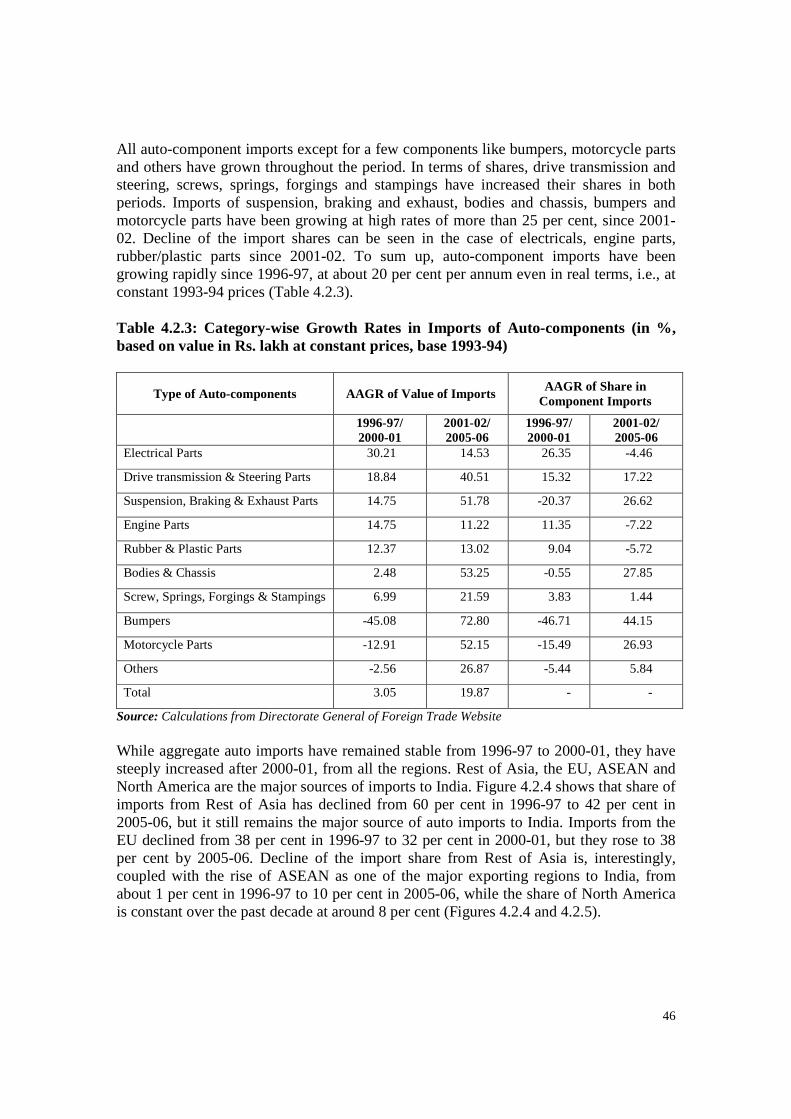
46
All auto-component imports except for a few components like bumpers, motorcycle parts and others have grown throughout the period. In terms of shares, drive transmission and steering, screws, springs, forgings and stampings have increased their shares in both periods. Imports of suspension, braking and exhaust, bodies and chassis, bumpers and motorcycle parts have been growing at high rates of more than 25 per cent, since 2001-02. Decline of the import shares can be seen in the case of electricals, engine parts, rubber/plastic parts since 2001-02. To sum up, auto-component imports have been growing rapidly since 1996-97, at about 20 per cent per annum even in real terms, i.e., at constant 1993-94 prices (Table 4.2.3). Table 4.2.3: Category-wise Growth Rates in Imports of Auto-components (in %, based on value in Rs. lakh at constant prices, base 1993-94)
Type of Auto-components AAGR of Value of Imports
AAGR of Share in Component Imports
1996-97/ 2000-01
2001-02/ 2005-06
1996-97/ 2000-01
2001-02/ 2005-06
Electrical Parts 30.21 14.53 26.35 -4.46
Drive transmission & Steering Parts 18.84 40.51 15.32 17.22
Suspension, Braking & Exhaust Parts 14.75 51.78 -20.37 26.62
Engine Parts 14.75 11.22 11.35 -7.22
Rubber & Plastic Parts 12.37 13.02 9.04 -5.72
Bodies & Chassis 2.48 53.25 -0.55 27.85
Screw, Springs, Forgings & Stampings 6.99 21.59 3.83 1.44
Bumpers -45.08 72.80 -46.71 44.15
Motorcycle Parts -12.91 52.15 -15.49 26.93
Others -2.56 26.87 -5.44 5.84
Total 3.05 19.87 - -
Source: Calculations from Directorate General of Foreign Trade Website While aggregate auto imports have remained stable from 1996-97 to 2000-01, they have steeply increased after 2000-01, from all the regions. Rest of Asia, the EU, ASEAN and North America are the major sources of imports to India. Figure 4.2.4 shows that share of imports from Rest of Asia has declined from 60 per cent in 1996-97 to 42 per cent in 2005-06, but it still remains the major source of auto imports to India. Imports from the EU declined from 38 per cent in 1996-97 to 32 per cent in 2000-01, but they rose to 38 per cent by 2005-06. Decline of the import share from Rest of Asia is, interestingly, coupled with the rise of ASEAN as one of the major exporting regions to India, from about 1 per cent in 1996-97 to 10 per cent in 2005-06, while the share of North America is constant over the past decade at around 8 per cent (Figures 4.2.4 and 4.2.5).
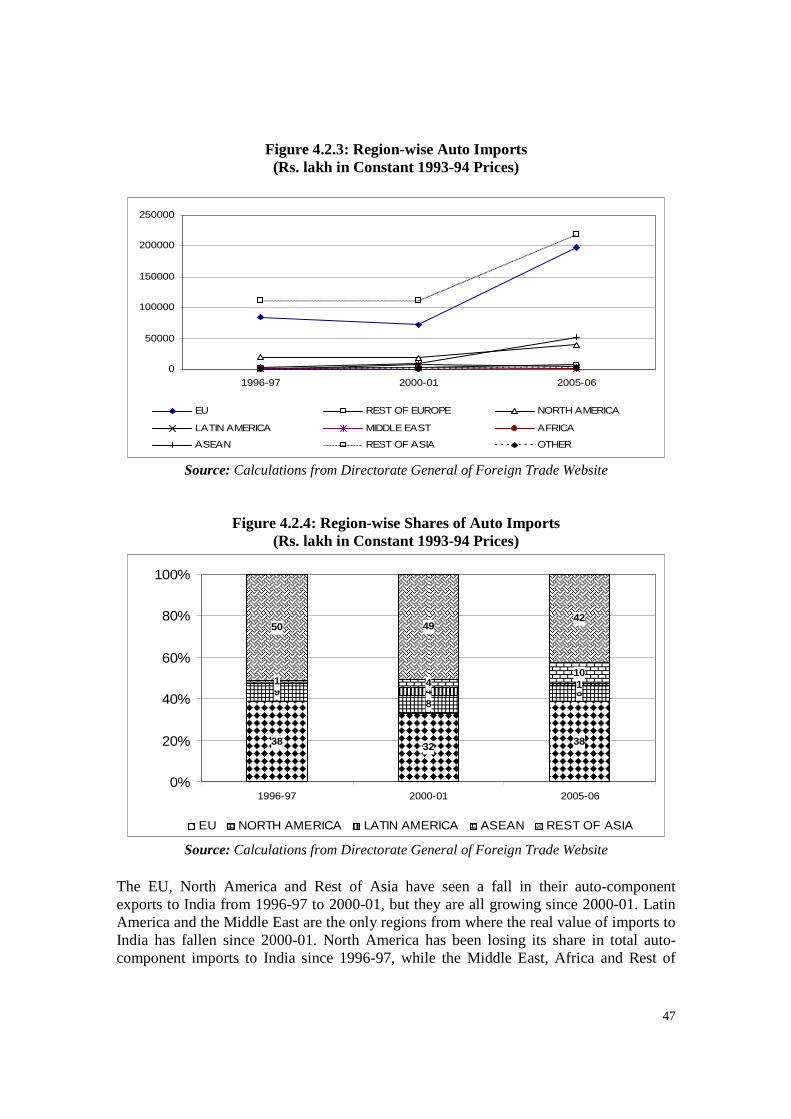
47
Figure 4.2.3: Region-wise Auto Imports (Rs. lakh in Constant 1993-94 Prices)
0
50000
100000
150000
200000
250000
1996-97 2000-01 2005-06
EU REST OF EUROPE NORTH AMERICA
LATIN AMERICA MIDDLE EAST AFRICA
ASEAN REST OF ASIA OTHER
Source: Calculations from Directorate General of Foreign Trade Website
Figure 4.2.4: Region-wise Shares of Auto Imports (Rs. lakh in Constant 1993-94 Prices)
38 32 38
98
80
411 410
50 4942
0%
20%
40%
60%
80%
100%
1996-97 2000-01 2005-06
EU NORTH AMERICA LATIN AMERICA ASEAN REST OF ASIA
Source: Calculations from Directorate General of Foreign Trade Website
The EU, North America and Rest of Asia have seen a fall in their auto-component exports to India from 1996-97 to 2000-01, but they are all growing since 2000-01. Latin America and the Middle East are the only regions from where the real value of imports to India has fallen since 2000-01. North America has been losing its share in total auto-component imports to India since 1996-97, while the Middle East, Africa and Rest of
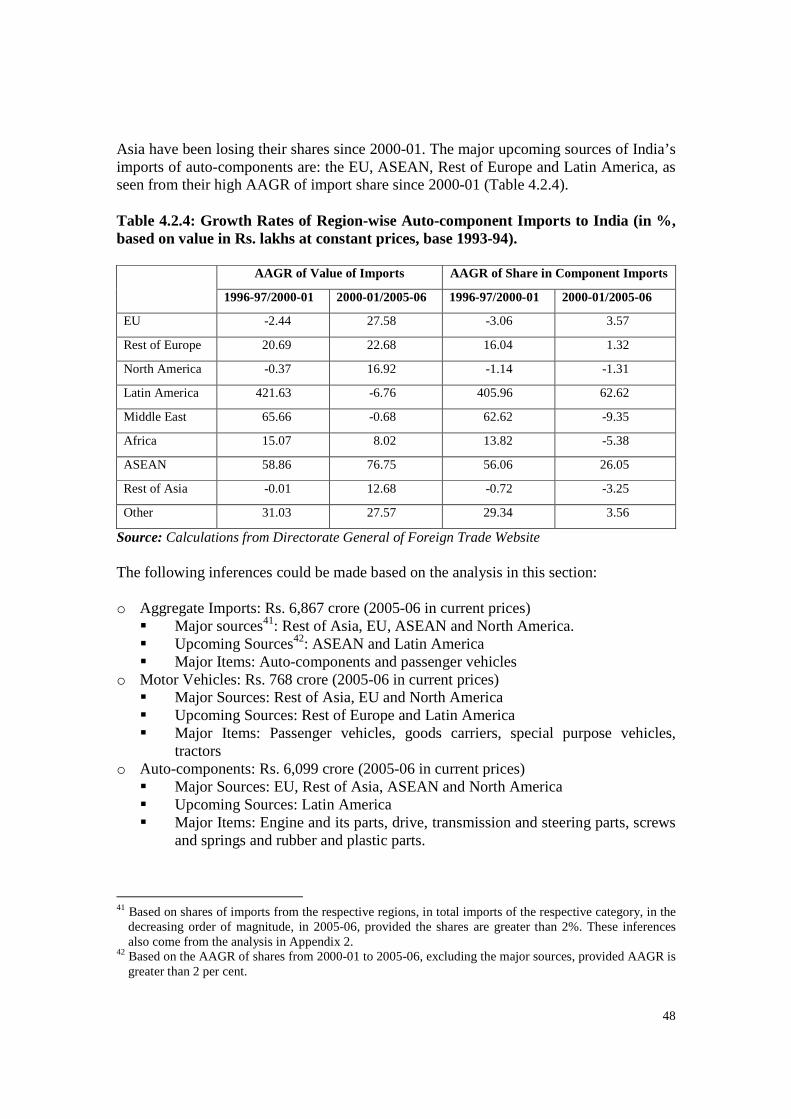
48
Asia have been losing their shares since 2000-01. The major upcoming sources of India’s imports of auto-components are: the EU, ASEAN, Rest of Europe and Latin America, as seen from their high AAGR of import share since 2000-01 (Table 4.2.4).
Table 4.2.4: Growth Rates of Region-wise Auto-component Imports to India (in %, based on value in Rs. lakhs at constant prices, base 1993-94).
AAGR of Value of Imports AAGR of Share in Component Imports
1996-97/2000-01 2000-01/2005-06 1996-97/2000-01 2000-01/2005-06
EU -2.44 27.58 -3.06 3.57
Rest of Europe 20.69 22.68 16.04 1.32
North America -0.37 16.92 -1.14 -1.31
Latin America 421.63 -6.76 405.96 62.62
Middle East 65.66 -0.68 62.62 -9.35
Africa 15.07 8.02 13.82 -5.38
ASEAN 58.86 76.75 56.06 26.05
Rest of Asia -0.01 12.68 -0.72 -3.25
Other 31.03 27.57 29.34 3.56
Source: Calculations from Directorate General of Foreign Trade Website The following inferences could be made based on the analysis in this section: o Aggregate Imports: Rs. 6,867 crore (2005-06 in current prices)
� Major sources41: Rest of Asia, EU, ASEAN and North America. � Upcoming Sources42: ASEAN and Latin America � Major Items: Auto-components and passenger vehicles
o Motor Vehicles: Rs. 768 crore (2005-06 in current prices) � Major Sources: Rest of Asia, EU and North America � Upcoming Sources: Rest of Europe and Latin America � Major Items: Passenger vehicles, goods carriers, special purpose vehicles,
tractors o Auto-components: Rs. 6,099 crore (2005-06 in current prices)
� Major Sources: EU, Rest of Asia, ASEAN and North America � Upcoming Sources: Latin America � Major Items: Engine and its parts, drive, transmission and steering parts, screws
and springs and rubber and plastic parts.
41 Based on shares of imports from the respective regions, in total imports of the respective category, in the
decreasing order of magnitude, in 2005-06, provided the shares are greater than 2%. These inferences also come from the analysis in Appendix 2.
42 Based on the AAGR of shares from 2000-01 to 2005-06, excluding the major sources, provided AAGR is greater than 2 per cent.
49
4.3 Conclusions
• India is a net exporter43 of automobiles and auto-components, the value of net exports in 2005-06 being Rs. 7,206 crore and Rs. 2,021 crore respectively in current prices. This shows that the automobile sector in India has become reasonably competitive. To increase its competitiveness further, tariff protection for automobiles should be brought down to the level prevailing for components. This will also reduce the attractiveness of home market in comparison with international market and therefore may further encourage vehicles exports, which are the high value-added category.
• Since 2000-01, both exports and imports of automobiles and auto-components
have been growing at high AAGRs. This indicates that the Indian auto industry is getting increasingly integrated with the global industry in the recent years. This is a good trend as it will allow Indian firms to take advantage of intra-industry trade that is bound to expand. This trend should, therefore, be further encouraged through appropriate policy measures.
43 Net exports in a segment is the difference between exports and imports in that segment.
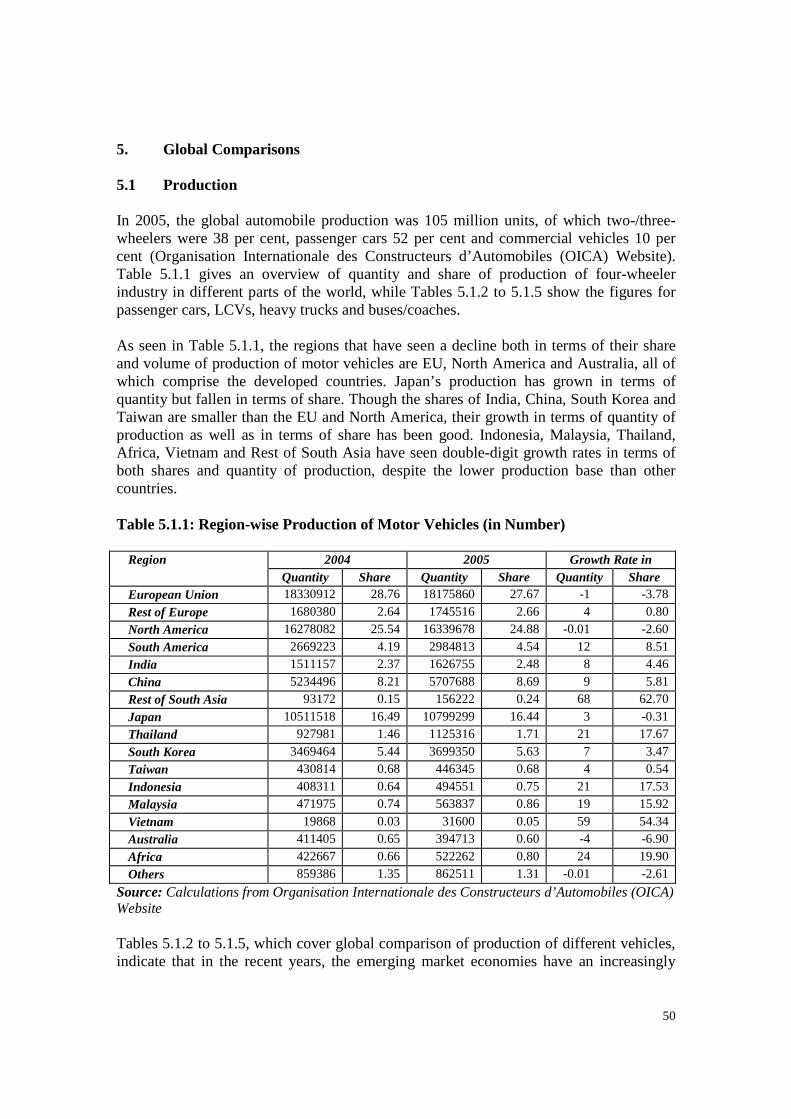
50
5. Global Comparisons 5.1 Production In 2005, the global automobile production was 105 million units, of which two-/three- wheelers were 38 per cent, passenger cars 52 per cent and commercial vehicles 10 per cent (Organisation Internationale des Constructeurs d’Automobiles (OICA) Website). Table 5.1.1 gives an overview of quantity and share of production of four-wheeler industry in different parts of the world, while Tables 5.1.2 to 5.1.5 show the figures for passenger cars, LCVs, heavy trucks and buses/coaches.
As seen in Table 5.1.1, the regions that have seen a decline both in terms of their share and volume of production of motor vehicles are EU, North America and Australia, all of which comprise the developed countries. Japan’s production has grown in terms of quantity but fallen in terms of share. Though the shares of India, China, South Korea and Taiwan are smaller than the EU and North America, their growth in terms of quantity of production as well as in terms of share has been good. Indonesia, Malaysia, Thailand, Africa, Vietnam and Rest of South Asia have seen double-digit growth rates in terms of both shares and quantity of production, despite the lower production base than other countries.
Table 5.1.1: Region-wise Production of Motor Vehicles (in Number)
Region 2004 2005 Growth Rate in Quantity Share Quantity Share Quantity Share
European Union 18330912 28.76 18175860 27.67 -1 -3.78
Rest of Europe 1680380 2.64 1745516 2.66 4 0.80
North America 16278082 25.54 16339678 24.88 -0.01 -2.60
South America 2669223 4.19 2984813 4.54 12 8.51
India 1511157 2.37 1626755 2.48 8 4.46
China 5234496 8.21 5707688 8.69 9 5.81
Rest of South Asia 93172 0.15 156222 0.24 68 62.70
Japan 10511518 16.49 10799299 16.44 3 -0.31
Thailand 927981 1.46 1125316 1.71 21 17.67
South Korea 3469464 5.44 3699350 5.63 7 3.47
Taiwan 430814 0.68 446345 0.68 4 0.54
Indonesia 408311 0.64 494551 0.75 21 17.53
Malaysia 471975 0.74 563837 0.86 19 15.92
Vietnam 19868 0.03 31600 0.05 59 54.34
Australia 411405 0.65 394713 0.60 -4 -6.90
Africa 422667 0.66 522262 0.80 24 19.90
Others 859386 1.35 862511 1.31 -0.01 -2.61
Source: Calculations from Organisation Internationale des Constructeurs d’Automobiles (OICA) Website
Tables 5.1.2 to 5.1.5, which cover global comparison of production of different vehicles, indicate that in the recent years, the emerging market economies have an increasingly
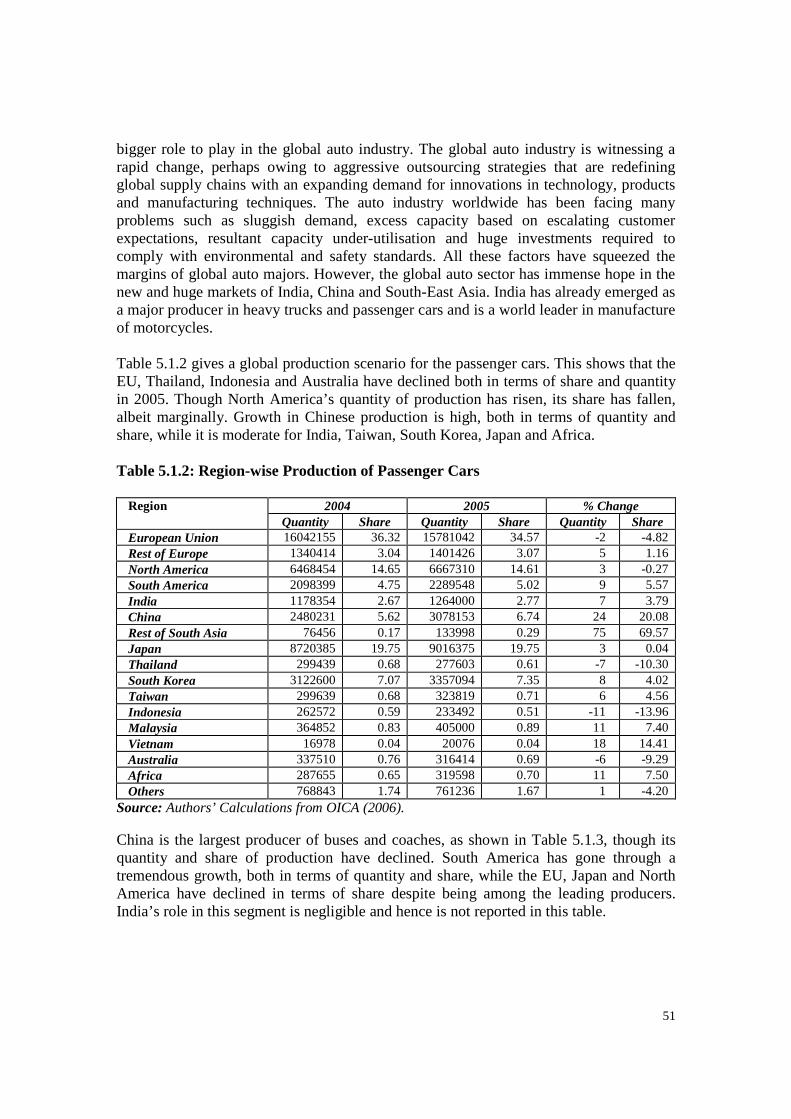
51
bigger role to play in the global auto industry. The global auto industry is witnessing a rapid change, perhaps owing to aggressive outsourcing strategies that are redefining global supply chains with an expanding demand for innovations in technology, products and manufacturing techniques. The auto industry worldwide has been facing many problems such as sluggish demand, excess capacity based on escalating customer expectations, resultant capacity under-utilisation and huge investments required to comply with environmental and safety standards. All these factors have squeezed the margins of global auto majors. However, the global auto sector has immense hope in the new and huge markets of India, China and South-East Asia. India has already emerged as a major producer in heavy trucks and passenger cars and is a world leader in manufacture of motorcycles. Table 5.1.2 gives a global production scenario for the passenger cars. This shows that the EU, Thailand, Indonesia and Australia have declined both in terms of share and quantity in 2005. Though North America’s quantity of production has risen, its share has fallen, albeit marginally. Growth in Chinese production is high, both in terms of quantity and share, while it is moderate for India, Taiwan, South Korea, Japan and Africa. Table 5.1.2: Region-wise Production of Passenger Cars
Region 2004 2005 % Change Quantity Share Quantity Share Quantity Share
European Union 16042155 36.32 15781042 34.57 -2 -4.82 Rest of Europe 1340414 3.04 1401426 3.07 5 1.16 North America 6468454 14.65 6667310 14.61 3 -0.27 South America 2098399 4.75 2289548 5.02 9 5.57 India 1178354 2.67 1264000 2.77 7 3.79 China 2480231 5.62 3078153 6.74 24 20.08 Rest of South Asia 76456 0.17 133998 0.29 75 69.57 Japan 8720385 19.75 9016375 19.75 3 0.04 Thailand 299439 0.68 277603 0.61 -7 -10.30 South Korea 3122600 7.07 3357094 7.35 8 4.02 Taiwan 299639 0.68 323819 0.71 6 4.56 Indonesia 262572 0.59 233492 0.51 -11 -13.96 Malaysia 364852 0.83 405000 0.89 11 7.40 Vietnam 16978 0.04 20076 0.04 18 14.41 Australia 337510 0.76 316414 0.69 -6 -9.29 Africa 287655 0.65 319598 0.70 11 7.50 Others 768843 1.74 761236 1.67 1 -4.20
Source: Authors’ Calculations from OICA (2006). China is the largest producer of buses and coaches, as shown in Table 5.1.3, though its quantity and share of production have declined. South America has gone through a tremendous growth, both in terms of quantity and share, while the EU, Japan and North America have declined in terms of share despite being among the leading producers. India’s role in this segment is negligible and hence is not reported in this table.
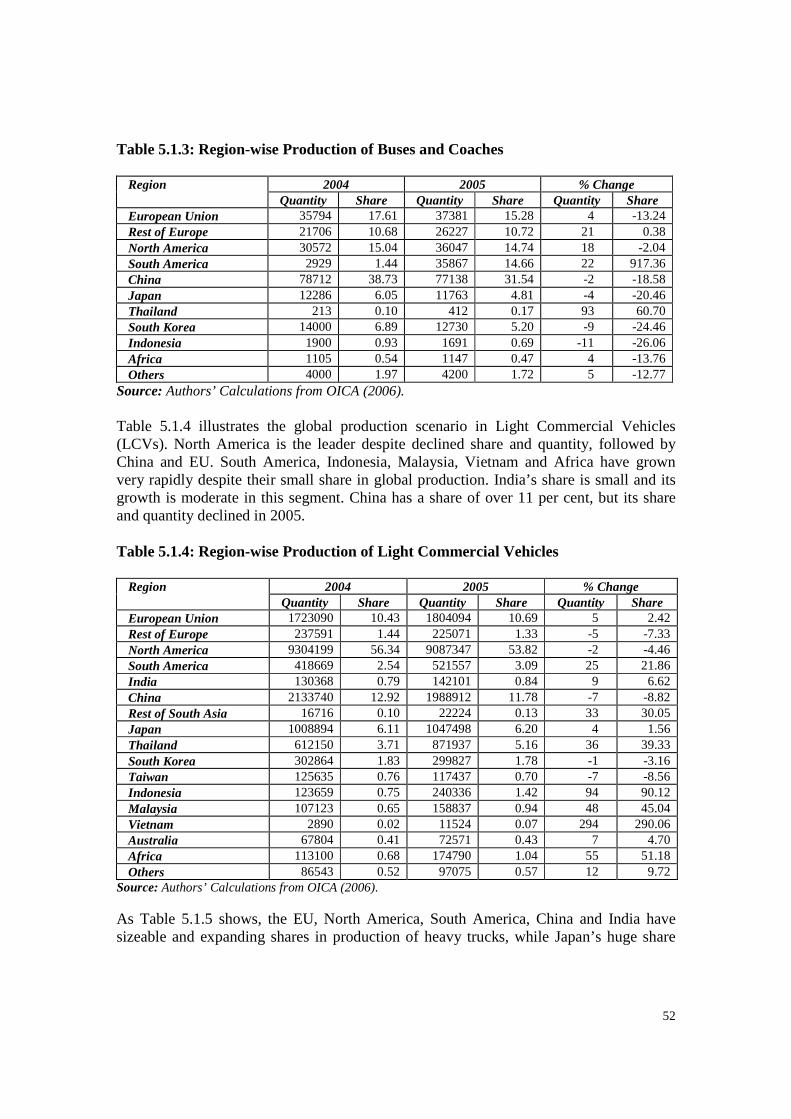
52
Table 5.1.3: Region-wise Production of Buses and Coaches
Region 2004 2005 % Change Quantity Share Quantity Share Quantity Share
European Union 35794 17.61 37381 15.28 4 -13.24 Rest of Europe 21706 10.68 26227 10.72 21 0.38 North America 30572 15.04 36047 14.74 18 -2.04 South America 2929 1.44 35867 14.66 22 917.36 China 78712 38.73 77138 31.54 -2 -18.58 Japan 12286 6.05 11763 4.81 -4 -20.46 Thailand 213 0.10 412 0.17 93 60.70 South Korea 14000 6.89 12730 5.20 -9 -24.46 Indonesia 1900 0.93 1691 0.69 -11 -26.06 Africa 1105 0.54 1147 0.47 4 -13.76 Others 4000 1.97 4200 1.72 5 -12.77
Source: Authors’ Calculations from OICA (2006). Table 5.1.4 illustrates the global production scenario in Light Commercial Vehicles (LCVs). North America is the leader despite declined share and quantity, followed by China and EU. South America, Indonesia, Malaysia, Vietnam and Africa have grown very rapidly despite their small share in global production. India’s share is small and its growth is moderate in this segment. China has a share of over 11 per cent, but its share and quantity declined in 2005. Table 5.1.4: Region-wise Production of Light Commercial Vehicles
Region 2004 2005 % Change Quantity Share Quantity Share Quantity Share
European Union 1723090 10.43 1804094 10.69 5 2.42 Rest of Europe 237591 1.44 225071 1.33 -5 -7.33 North America 9304199 56.34 9087347 53.82 -2 -4.46 South America 418669 2.54 521557 3.09 25 21.86 India 130368 0.79 142101 0.84 9 6.62 China 2133740 12.92 1988912 11.78 -7 -8.82 Rest of South Asia 16716 0.10 22224 0.13 33 30.05 Japan 1008894 6.11 1047498 6.20 4 1.56 Thailand 612150 3.71 871937 5.16 36 39.33 South Korea 302864 1.83 299827 1.78 -1 -3.16 Taiwan 125635 0.76 117437 0.70 -7 -8.56 Indonesia 123659 0.75 240336 1.42 94 90.12 Malaysia 107123 0.65 158837 0.94 48 45.04 Vietnam 2890 0.02 11524 0.07 294 290.06 Australia 67804 0.41 72571 0.43 7 4.70 Africa 113100 0.68 174790 1.04 55 51.18 Others 86543 0.52 97075 0.57 12 9.72
Source: Authors’ Calculations from OICA (2006). As Table 5.1.5 shows, the EU, North America, South America, China and India have sizeable and expanding shares in production of heavy trucks, while Japan’s huge share
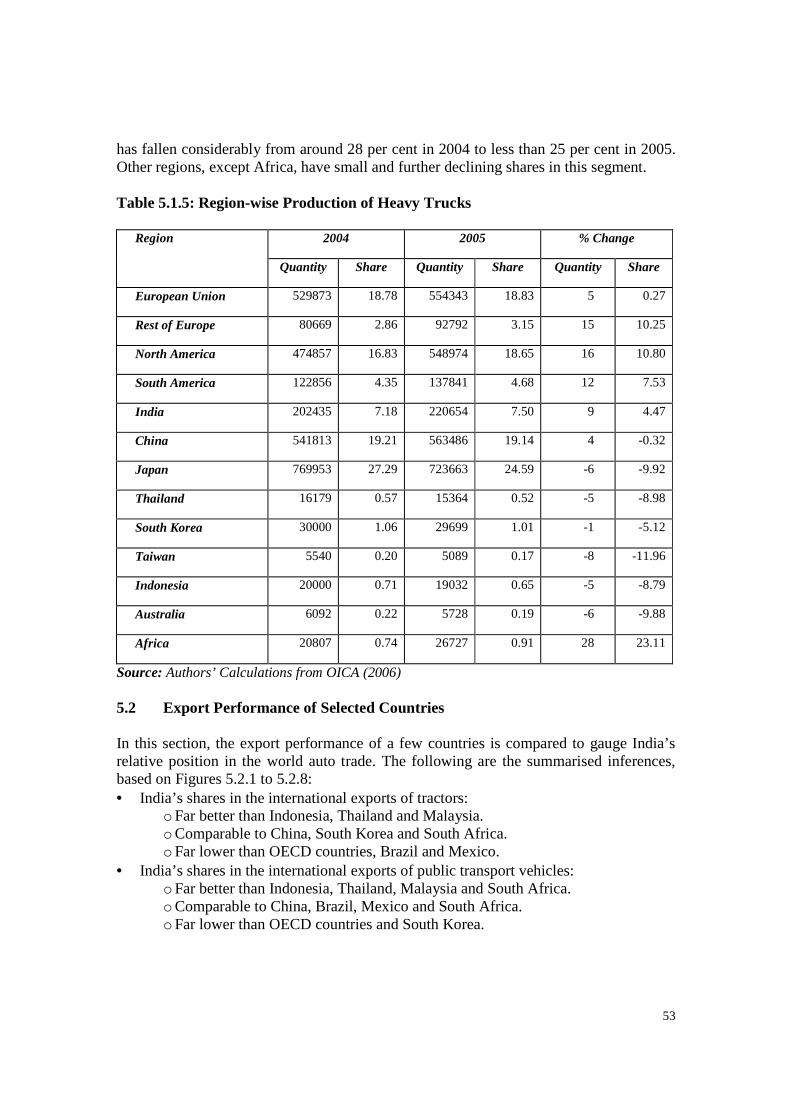
53
has fallen considerably from around 28 per cent in 2004 to less than 25 per cent in 2005. Other regions, except Africa, have small and further declining shares in this segment. Table 5.1.5: Region-wise Production of Heavy Trucks
Region 2004 2005 % Change
Quantity Share Quantity Share Quantity Share
European Union 529873 18.78 554343 18.83 5 0.27
Rest of Europe 80669 2.86 92792 3.15 15 10.25
North America 474857 16.83 548974 18.65 16 10.80
South America 122856 4.35 137841 4.68 12 7.53
India 202435 7.18 220654 7.50 9 4.47
China 541813 19.21 563486 19.14 4 -0.32
Japan 769953 27.29 723663 24.59 -6 -9.92
Thailand 16179 0.57 15364 0.52 -5 -8.98
South Korea 30000 1.06 29699 1.01 -1 -5.12
Taiwan 5540 0.20 5089 0.17 -8 -11.96
Indonesia 20000 0.71 19032 0.65 -5 -8.79
Australia 6092 0.22 5728 0.19 -6 -9.88
Africa 20807 0.74 26727 0.91 28 23.11
Source: Authors’ Calculations from OICA (2006) 5.2 Export Performance of Selected Countries In this section, the export performance of a few countries is compared to gauge India’s relative position in the world auto trade. The following are the summarised inferences, based on Figures 5.2.1 to 5.2.8: • India’s shares in the international exports of tractors:
o Far better than Indonesia, Thailand and Malaysia. o Comparable to China, South Korea and South Africa. o Far lower than OECD countries, Brazil and Mexico.
• India’s shares in the international exports of public transport vehicles: o Far better than Indonesia, Thailand, Malaysia and South Africa. o Comparable to China, Brazil, Mexico and South Africa. o Far lower than OECD countries and South Korea.
54
• India’s share in the international exports of chassis is better than China, South Korea, Indonesia, Thailand, Malaysia and South Africa, but is far lower than those of OECD countries and Brazil.
• India’s shares in the international exports of passenger vehicles, commercial vehicles and Special Purpose Vehicles are lower than all major countries, including China, Indonesia, Thailand, South Korea, Taiwan and Malaysia.
• India’s shares in the international exports of auto-components are comparable to Indonesia, Malaysia and Thailand, but lower than most of the other major players. However, in terms of exports of components of two-wheelers, India’s shares are lower than even that of Indonesia and Thailand.
• India’s share in the international exports of motorcycles has been its highest among all product categories, at around 2 per cent, which is:
o Higher than Indonesia, South Africa and Malaysia. o Comparable to Thailand. o Far lower than OECD countries, South Korea, Brazil, China, Taiwan and
Mexico.
Thus, India is not yet very competitive in the international arena or its firms are not export-oriented as the domestic market offers sufficient scope for expansion and provides reasonable rate of return. Though India’s production shares in the global total are reasonably good, this inference shows that some structural changes in technologies employed and quality are required to bring the Indian automobile industry up to world standards.
For example, when we compare a typical Indian company with its counterpart in a developed region such as Europe, it could be inferred that despite huge cost pressures due to labour costs and low profit margins, R&D expenditure is never compromised in such countries. Based on the annual reports of a few Europe-based companies,44 the following could be inferred: • Labour cost shares are higher in Europe (15-30%) than in India (7-10%). • Profit rates are lower in Europe (< 1.5%) than in India (2-10%). • Tax cost shares are lower in Europe (<1%) than in India (10-15%). • R&D cost shares are higher in Europe (2-4%) than in India (<2%) • Technologies are much more advanced in Europe than in India,45
It directly follows from the above that R&D efforts in developed regions such as Europe are much higher despite the fact that they have labour cost pressures, low profit margins and already fairly advanced technologies. On the other hand, Indian companies are reluctant to increase R&D efforts, even though profit margins are higher. Hence concerted efforts are required from both industry and the government in India, for spending more on R&D.
44 Antonov PLC, Caffyns PLC, Avon Rubber PLC and PSA Peugot S.A. are the companies considered.
This is just an indicative analysis and cannot be considered as a comprehensive comparative analysis. 45 This and other inferences on cost shares are as inferred from our field survey.
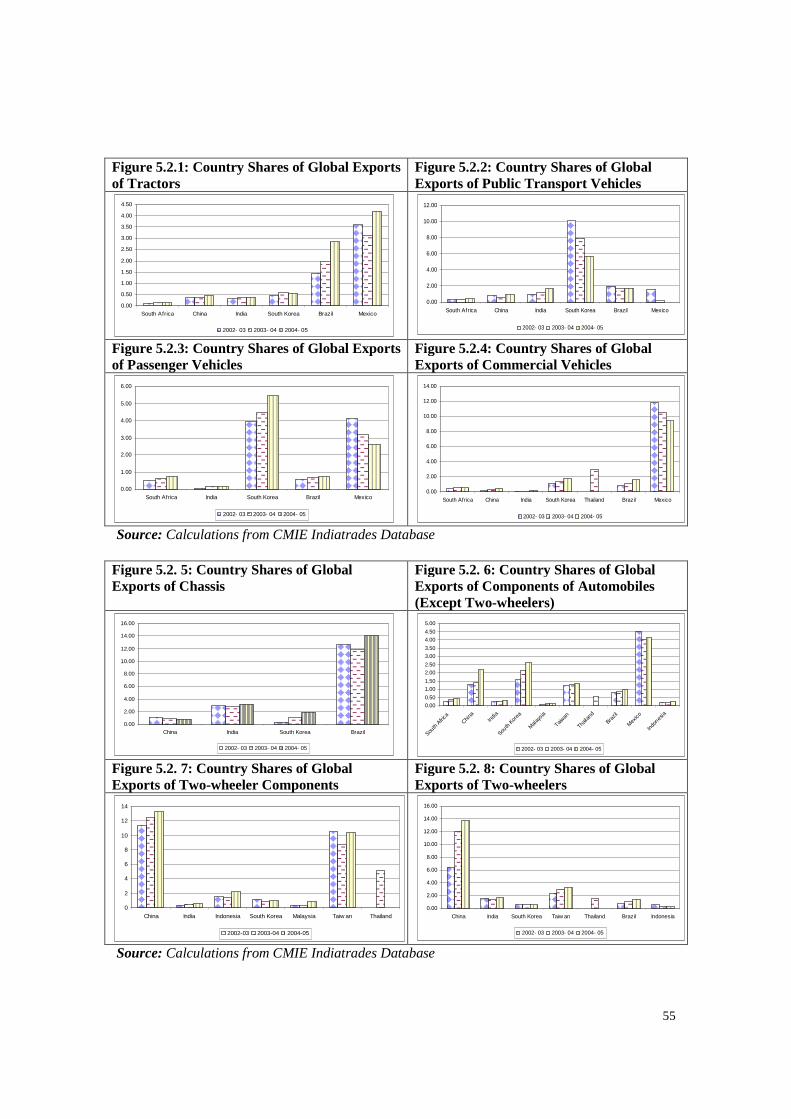
55
Figure 5.2.1: Country Shares of Global Exports of Tractors
Figure 5.2.2: Country Shares of Global Exports of Public Transport Vehicles
0.00
0.50
1.00
1.50
2.00
2.50
3.00
3.50
4.00
4.50
South Africa China India South Korea Brazil Mexico
2002- 03 2003- 04 2004- 05
0.00
2.00
4.00
6.00
8.00
10.00
12.00
South Africa China India South Korea Brazil Mexico
2002- 03 2003- 04 2004- 05
Figure 5.2.3: Country Shares of Global Exports of Passenger Vehicles
Figure 5.2.4: Country Shares of Global Exports of Commercial Vehicles
0.00
1.00
2.00
3.00
4.00
5.00
6.00
South Africa India South Korea Brazil Mexico
2002- 03 2003- 04 2004- 05
0.00
2.00
4.00
6.00
8.00
10.00
12.00
14.00
South Africa China India South Korea Thailand Brazil Mexico
2002- 03 2003- 04 2004- 05
Source: Calculations from CMIE Indiatrades Database
Figure 5.2. 5: Country Shares of Global Exports of Chassis
Figure 5.2. 6: Country Shares of Global Exports of Components of Automobiles (Except Two-wheelers)
0.00
2.00
4.00
6.00
8.00
10.00
12.00
14.00
16.00
China India South Korea Brazil
2002- 03 2003- 04 2004- 05
0.00
0.50
1.00
1.50
2.00
2.50
3.00
3.50
4.00
4.50
5.00
South
Afric
aChi
naIn
dia
South
Korea
Mal
aysia
Taiwan
Thaila
nd
Brazil
Mex
ico
Indo
nesia
2002- 03 2003- 04 2004- 05
Figure 5.2. 7: Country Shares of Global Exports of Two-wheeler Components
Figure 5.2. 8: Country Shares of Global Exports of Two-wheelers
0
2
4
6
8
10
12
14
China India Indonesia South Korea Malaysia Taiw an Thailand
2002-03 2003-04 2004-05
0.00
2.00
4.00
6.00
8.00
10.00
12.00
14.00
16.00
China India South Korea Taiw an Thailand Brazil Indonesia
2002- 03 2003- 04 2004- 05
Source: Calculations from CMIE Indiatrades Database
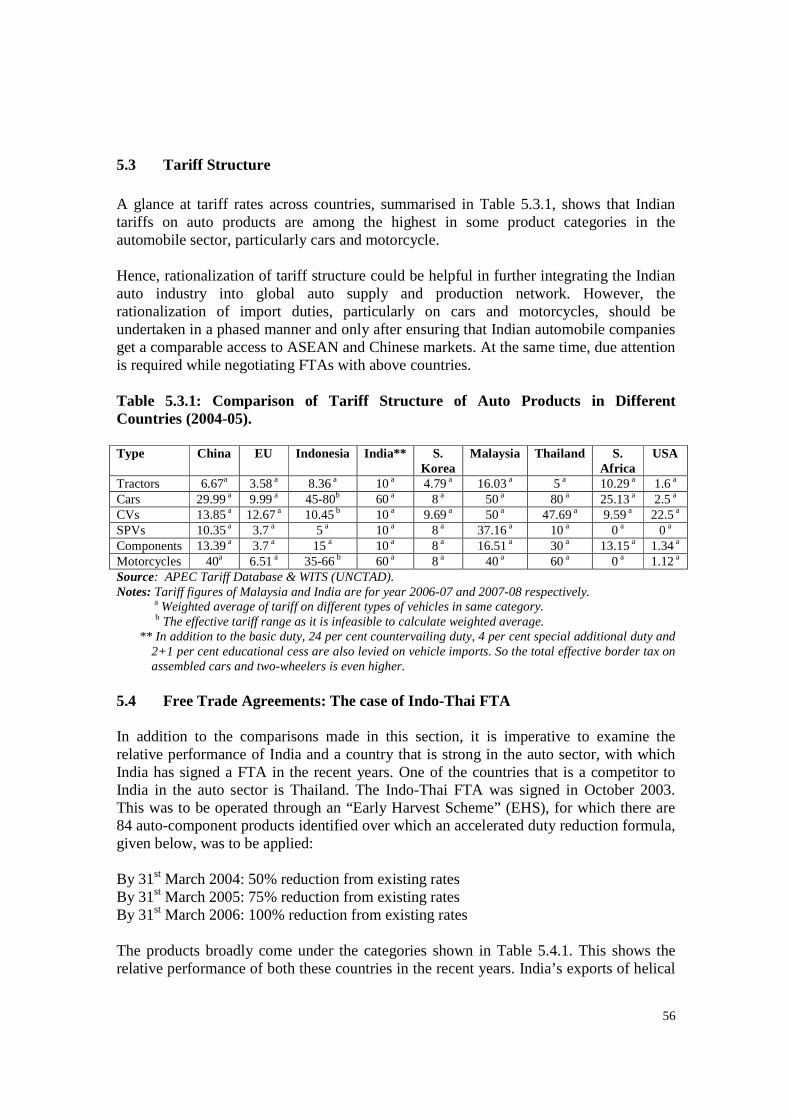
56
5.3 Tariff Structure A glance at tariff rates across countries, summarised in Table 5.3.1, shows that Indian tariffs on auto products are among the highest in some product categories in the automobile sector, particularly cars and motorcycle. Hence, rationalization of tariff structure could be helpful in further integrating the Indian auto industry into global auto supply and production network. However, the rationalization of import duties, particularly on cars and motorcycles, should be undertaken in a phased manner and only after ensuring that Indian automobile companies get a comparable access to ASEAN and Chinese markets. At the same time, due attention is required while negotiating FTAs with above countries. Table 5.3.1: Comparison of Tariff Structure of Auto Products in Different Countries (2004-05). Type China EU Indonesia India** S.
Korea Malaysia Thailand S.
Africa USA
Tractors 6.67a 3.58 a 8.36 a 10 a 4.79 a 16.03 a 5 a 10.29 a 1.6 a Cars 29.99 a 9.99 a 45-80b 60 a 8 a 50 a 80 a 25.13 a 2.5 a CVs 13.85 a 12.67 a 10.45 b 10 a 9.69 a 50 a 47.69 a 9.59 a 22.5 a SPVs 10.35 a 3.7 a 5 a 10 a 8 a 37.16 a 10 a 0 a 0 a Components 13.39 a 3.7 a 15 a 10 a 8 a 16.51 a 30 a 13.15 a 1.34 a Motorcycles 40a 6.51 a 35-66 b 60 a 8 a 40 a 60 a 0 a 1.12 a Source: APEC Tariff Database & WITS (UNCTAD). Notes: Tariff figures of Malaysia and India are for year 2006-07 and 2007-08 respectively. a Weighted average of tariff on different types of vehicles in same category. b The effective tariff range as it is infeasible to calculate weighted average. ** In addition to the basic duty, 24 per cent countervailing duty, 4 per cent special additional duty and
2+1 per cent educational cess are also levied on vehicle imports. So the total effective border tax on assembled cars and two-wheelers is even higher.
5.4 Free Trade Agreements: The case of Indo-Thai FTA In addition to the comparisons made in this section, it is imperative to examine the relative performance of India and a country that is strong in the auto sector, with which India has signed a FTA in the recent years. One of the countries that is a competitor to India in the auto sector is Thailand. The Indo-Thai FTA was signed in October 2003. This was to be operated through an “Early Harvest Scheme” (EHS), for which there are 84 auto-component products identified over which an accelerated duty reduction formula, given below, was to be applied: By 31st March 2004: 50% reduction from existing rates By 31st March 2005: 75% reduction from existing rates By 31st March 2006: 100% reduction from existing rates The products broadly come under the categories shown in Table 5.4.1. This shows the relative performance of both these countries in the recent years. India’s exports of helical
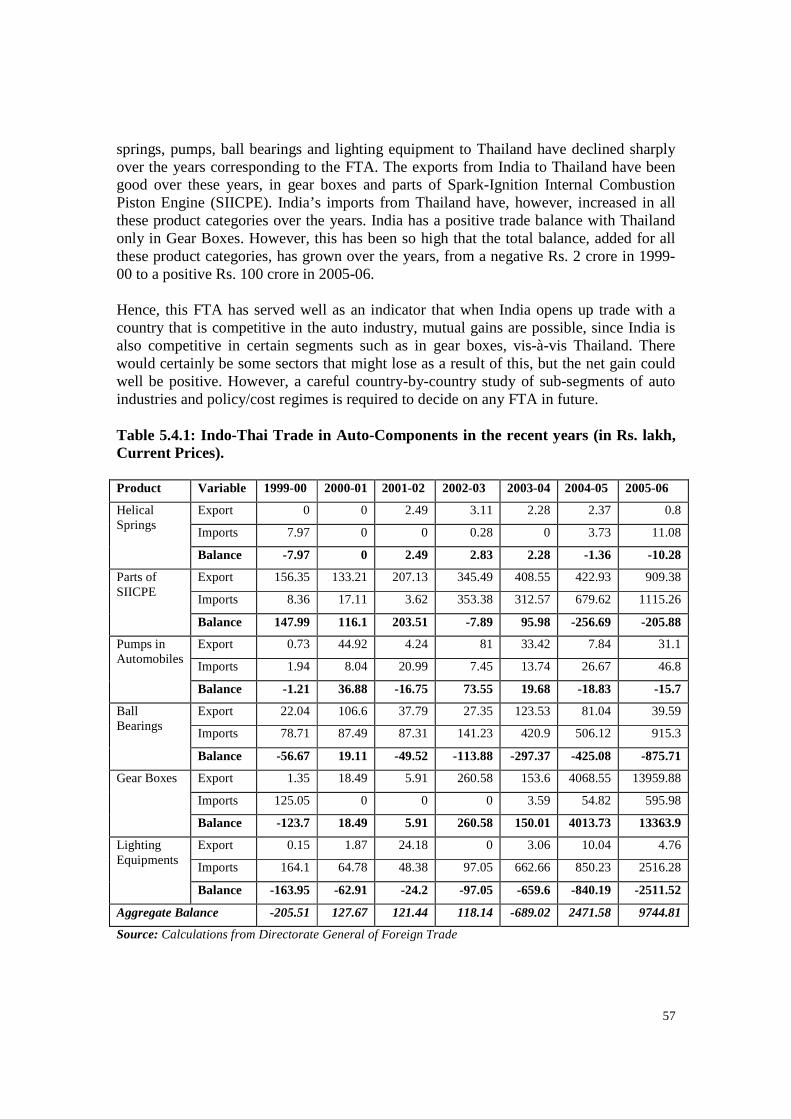
57
springs, pumps, ball bearings and lighting equipment to Thailand have declined sharply over the years corresponding to the FTA. The exports from India to Thailand have been good over these years, in gear boxes and parts of Spark-Ignition Internal Combustion Piston Engine (SIICPE). India’s imports from Thailand have, however, increased in all these product categories over the years. India has a positive trade balance with Thailand only in Gear Boxes. However, this has been so high that the total balance, added for all these product categories, has grown over the years, from a negative Rs. 2 crore in 1999-00 to a positive Rs. 100 crore in 2005-06. Hence, this FTA has served well as an indicator that when India opens up trade with a country that is competitive in the auto industry, mutual gains are possible, since India is also competitive in certain segments such as in gear boxes, vis-à-vis Thailand. There would certainly be some sectors that might lose as a result of this, but the net gain could well be positive. However, a careful country-by-country study of sub-segments of auto industries and policy/cost regimes is required to decide on any FTA in future. Table 5.4.1: Indo-Thai Trade in Auto-Components in the recent years (in Rs. lakh, Current Prices). Product Variable 1999-00 2000-01 2001-02 2002-03 2003-04 2004-05 2005-06
Helical Springs
Export 0 0 2.49 3.11 2.28 2.37 0.8
Imports 7.97 0 0 0.28 0 3.73 11.08
Balance -7.97 0 2.49 2.83 2.28 -1.36 -10.28
Parts of SIICPE
Export 156.35 133.21 207.13 345.49 408.55 422.93 909.38
Imports 8.36 17.11 3.62 353.38 312.57 679.62 1115.26
Balance 147.99 116.1 203.51 -7.89 95.98 -256.69 -205.88
Pumps in Automobiles
Export 0.73 44.92 4.24 81 33.42 7.84 31.1
Imports 1.94 8.04 20.99 7.45 13.74 26.67 46.8
Balance -1.21 36.88 -16.75 73.55 19.68 -18.83 -15.7
Ball Bearings
Export 22.04 106.6 37.79 27.35 123.53 81.04 39.59
Imports 78.71 87.49 87.31 141.23 420.9 506.12 915.3
Balance -56.67 19.11 -49.52 -113.88 -297.37 -425.08 -875.71
Gear Boxes Export 1.35 18.49 5.91 260.58 153.6 4068.55 13959.88
Imports 125.05 0 0 0 3.59 54.82 595.98
Balance -123.7 18.49 5.91 260.58 150.01 4013.73 13363.9
Lighting Equipments
Export 0.15 1.87 24.18 0 3.06 10.04 4.76
Imports 164.1 64.78 48.38 97.05 662.66 850.23 2516.28
Balance -163.95 -62.91 -24.2 -97.05 -659.6 -840.19 -2511.52
Aggregate Balance -205.51 127.67 121.44 118.14 -689.02 2471.58 9744.81
Source: Calculations from Directorate General of Foreign Trade
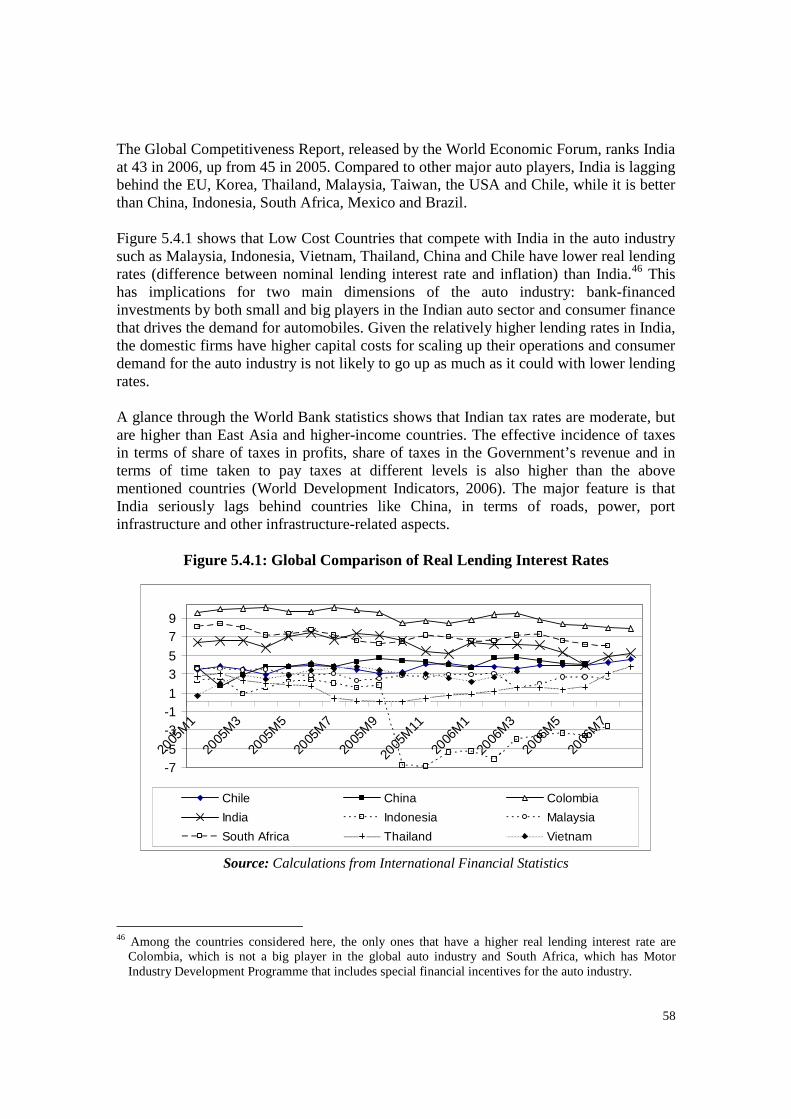
58
The Global Competitiveness Report, released by the World Economic Forum, ranks India at 43 in 2006, up from 45 in 2005. Compared to other major auto players, India is lagging behind the EU, Korea, Thailand, Malaysia, Taiwan, the USA and Chile, while it is better than China, Indonesia, South Africa, Mexico and Brazil. Figure 5.4.1 shows that Low Cost Countries that compete with India in the auto industry such as Malaysia, Indonesia, Vietnam, Thailand, China and Chile have lower real lending rates (difference between nominal lending interest rate and inflation) than India.46 This has implications for two main dimensions of the auto industry: bank-financed investments by both small and big players in the Indian auto sector and consumer finance that drives the demand for automobiles. Given the relatively higher lending rates in India, the domestic firms have higher capital costs for scaling up their operations and consumer demand for the auto industry is not likely to go up as much as it could with lower lending rates. A glance through the World Bank statistics shows that Indian tax rates are moderate, but are higher than East Asia and higher-income countries. The effective incidence of taxes in terms of share of taxes in profits, share of taxes in the Government’s revenue and in terms of time taken to pay taxes at different levels is also higher than the above mentioned countries (World Development Indicators, 2006). The major feature is that India seriously lags behind countries like China, in terms of roads, power, port infrastructure and other infrastructure-related aspects.
Figure 5.4.1: Global Comparison of Real Lending Interest Rates
-7-5
-3-11
35
79
2005
M1
2005
M3
2005
M5
2005
M7
2005
M9
2005
M11
2006
M1
2006
M3
2006
M5
2006
M7
Chile China Colombia
India Indonesia Malaysia
South Africa Thailand Vietnam
Source: Calculations from International Financial Statistics
46 Among the countries considered here, the only ones that have a higher real lending interest rate are
Colombia, which is not a big player in the global auto industry and South Africa, which has Motor Industry Development Programme that includes special financial incentives for the auto industry.
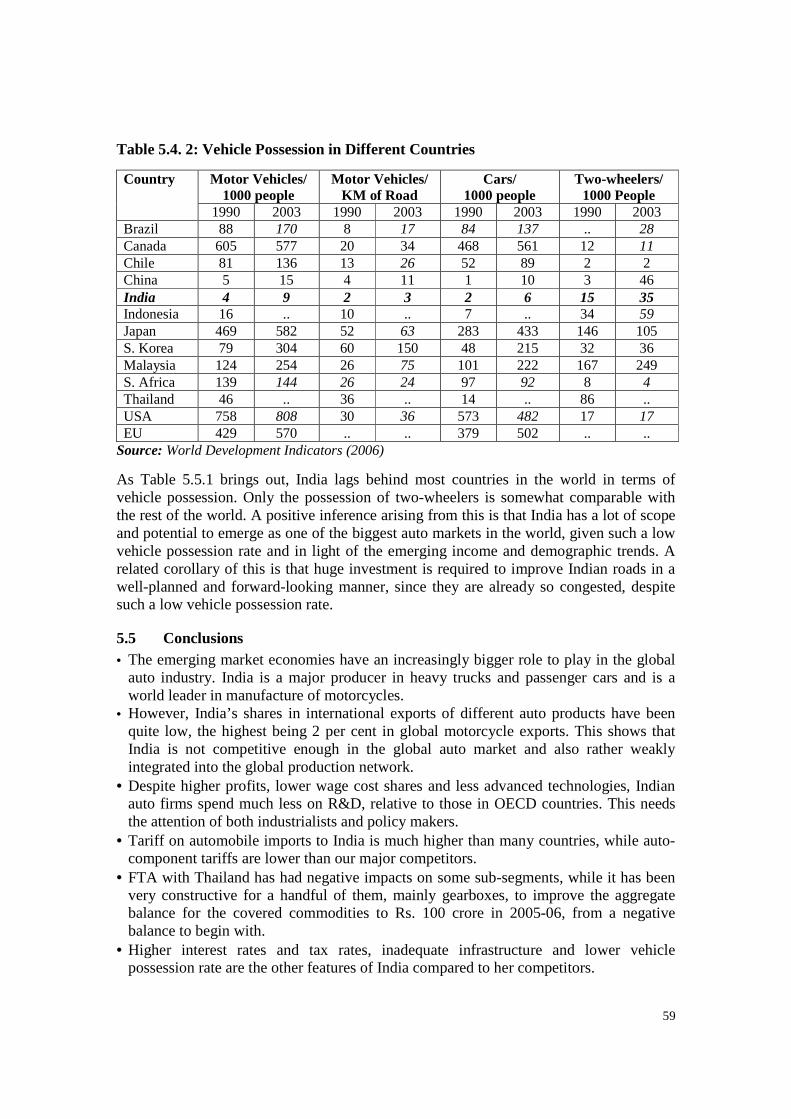
59
Table 5.4. 2: Vehicle Possession in Different Countries
Country Motor Vehicles/ 1000 people
Motor Vehicles/ KM of Road
Cars/ 1000 people
Two-wheelers/ 1000 People
1990 2003 1990 2003 1990 2003 1990 2003 Brazil 88 170 8 17 84 137 .. 28 Canada 605 577 20 34 468 561 12 11 Chile 81 136 13 26 52 89 2 2 China 5 15 4 11 1 10 3 46 India 4 9 2 3 2 6 15 35 Indonesia 16 .. 10 .. 7 .. 34 59 Japan 469 582 52 63 283 433 146 105 S. Korea 79 304 60 150 48 215 32 36 Malaysia 124 254 26 75 101 222 167 249 S. Africa 139 144 26 24 97 92 8 4 Thailand 46 .. 36 .. 14 .. 86 .. USA 758 808 30 36 573 482 17 17 EU 429 570 .. .. 379 502 .. ..
Source: World Development Indicators (2006)
As Table 5.5.1 brings out, India lags behind most countries in the world in terms of vehicle possession. Only the possession of two-wheelers is somewhat comparable with the rest of the world. A positive inference arising from this is that India has a lot of scope and potential to emerge as one of the biggest auto markets in the world, given such a low vehicle possession rate and in light of the emerging income and demographic trends. A related corollary of this is that huge investment is required to improve Indian roads in a well-planned and forward-looking manner, since they are already so congested, despite such a low vehicle possession rate.
5.5 Conclusions • The emerging market economies have an increasingly bigger role to play in the global
auto industry. India is a major producer in heavy trucks and passenger cars and is a world leader in manufacture of motorcycles.
• However, India’s shares in international exports of different auto products have been quite low, the highest being 2 per cent in global motorcycle exports. This shows that India is not competitive enough in the global auto market and also rather weakly integrated into the global production network.
• Despite higher profits, lower wage cost shares and less advanced technologies, Indian auto firms spend much less on R&D, relative to those in OECD countries. This needs the attention of both industrialists and policy makers.
• Tariff on automobile imports to India is much higher than many countries, while auto-component tariffs are lower than our major competitors.
• FTA with Thailand has had negative impacts on some sub-segments, while it has been very constructive for a handful of them, mainly gearboxes, to improve the aggregate balance for the covered commodities to Rs. 100 crore in 2005-06, from a negative balance to begin with.
• Higher interest rates and tax rates, inadequate infrastructure and lower vehicle possession rate are the other features of India compared to her competitors.
60
6. Field Survey 6.1 Objectives A firm-level survey was undertaken to analyse the aspects of competitiveness of the Indian auto industry. A sample of 45 firms (31 auto-component firms and 14 automobile assembly firms) was selected from four major clusters of the auto industry, namely, North India (Delhi, Uttar Pradesh, Punjab, Haryana, Madhya Pradesh), West India (Maharashtra and Gujarat), Tamil Nadu and Karnataka. Two questionnaires, one each for Original Equipment Manufacturers and Automotive- Component Manufacturers, were designed (Appendix 4). Our sample covers about 70 per cent of the automobile sector and about 25 per cent of the auto-component sector, in terms of sales turnover. Appendix 4 describes the sample covered in detail. The survey results were used to draw inferences on market structure and competitiveness, employment-related aspects, capacity utilisation, aspects related to supply chain, production-related constraints, policy measures and firm strategies to enhance competitiveness. 6.2 Market Structure and Competitiveness 6.2.1 Market Structure The survey examined the market structure of firms, in terms of the orientation of firms towards domestic and export markets. Most of the OEMs included in our study are domestic-oriented, though they do export a small proportion of their production. The share of export in total production for the OEMs that do export ranges between less than 1 and 10 per cent, with one exception, which is a car major based in Chennai, exporting more than 50 per cent of its production. Most of them have a better future outlook for domestic market than the international one, mainly because of the huge demand potential in India. Among the 31 auto-component manufacturers, there are two firms that export more than 60 per cent of production, while there are 8 firms that do not export at all. The firms that are more export-oriented in our sample prefer exports to domestic market because of the learning and technological upgradation facilitated by exporting to markets that impose sophisticated standards, speedy delivery47 schedules by importers abroad and the possibility of market risk diversification by exporting. Other firms focus more on domestic market because they perceive that there is a relatively lower degree of demand uncertainty involved in domestic market than in export markets. The major export markets for various auto products are: the EU, the United States, South Africa, Middle East and Latin America.
47 This is also because of the quick payment made by importers abroad.
61
6.2.2 Aspects of Competitiveness The survey examined various aspects pertaining to competitiveness, namely, price and quality, technology, quality and standards, cost composition and contracts. Price and Quality Almost all our respondents are not able to produce quality that is at par with South Korea, the EU and the USA, though a majority of them consider the quality of their products to be superior to those produced by their competitors in China, Thailand, Malaysia, Taiwan and Indonesia. A few component producers perceive that Taiwan, South Korea and the EU are better competitors in specific components, in terms of both price and quality, but they are not major threats as a whole. All respondents report that they receive good feedback from the customers on the quality of their products. However, their products are not cost-competitive in comparison with China and Thailand in most of the products. Quite interestingly, a leading US-based engine manufacturer covered in this study reported that their plant in India is more cost-competitive than its counterpart in China. This is a remarkable observation since this amounts to saying that for identical48 products and technologies, at least in engine manufacturing, India is more cost-competitive than China. Competitiveness of auto firms varies across different regions in India. While the firms in Mumbai, Pune, Chennai and Bangalore regions perceive those in the National Capital Region of Delhi to be their major competitors, the nature of threat, as felt by the respondents, was more of price than of quality in this region. Some firms perceive that though price and quality are the key aspects of competitiveness in the market, long-term sustainability matters much more than mere comparative advantage in terms of price and quality. Affordable quality on a long-term sustainable basis is the right strategy to be competitive in the long-run. Auto-component manufacturers in India, who cater to the needs of automobile industries with integral structure that requires customised products,49 face less threat from China, compared to those that manufacture modular (standardised) components. Even if the foreign OEMs entering India prefer their supply chain in their parent country to be re-established in India, it may not cause a major threat to Indian players, because those companies cannot sell at a price lower than they sell in their parent country. Technology, Quality and Standards Almost all respondents perceived that the technologies, quality of products and compliance with standards in their firm is at par, if not better, than other firms in India. When it comes to international comparison, the general impression of almost all firms is that they are better than China, Malaysia, South Africa, Taiwan and Indonesia, while they 48 The word ‘Identical’ is important here, because cost-comparison would be perfect only when costs of
production of items that are exactly identical are compared. This is exactly the case here, because the company is the same, with high global standards, and its products are identical the world over.
49 This is based on our discussion with Dr. Surinder Kapur, CEO, Sona Group of companies. There are two types of vehicle structures: Modular and integral. Modular structure involves many standardised parts, such as for tractors and commercial vehicles, while integral structure requires customised products that are integrated, such as passenger vehicles and two-wheelers.
62
are as good or slightly worse than Thailand and considerably worse than the EU, the USA and South Korea. While most of them did not feel any need of our government to facilitate betterment of the Indian auto firms in these aspects, two OEMs felt the need of extending the period for which R&D subsidies could be availed and introduction of capital subsidies to invest in better technologies. Amongst the smaller auto-component firms, rejection rate as measured by the PPM (Parts Per Million)50 range is much higher than the norm, indicating lower quality. For Tier-2 producers in our sample, it is 10,000-20,000 and around 500-1,000 PPM in Tier-1 suppliers, which is much higher than what is expected by the OEMs, which is 0-100 PPM. Most of the firms blame their suppliers for high rejection rates, while they also admit that better process planning could partly reduce these defects. One interesting strategy is blacklisting of ‘n’ number of worst quality suppliers (in terms of PPM) and removal of the suppliers from the list if they persist in the black list for more than ‘x’ number of times. All firms in our survey have been awarded with at least one of the certifications such as ISO 9000, 14000, etc. Almost all firms are open for technological collaborations with Indian or foreign companies for upgrading their technologies. R&D outlay was used to draw inferences on the firm’s desire for technological advancement. All the OEMs in our sample have R&D division either in-house or abroad in the case of foreign-origin companies. The R&D expenditure is 1-2 per cent of total cost and all these OEMs are ready to increase this up to 3-5 per cent in the next 3-4 years. Twenty -five of the 31 auto-component firms do have R&D facility, the expenditure on which constitutes less than 1 per cent of the total cost in most cases. All of them are interested in increasing this expenditure, while the firms that do not have any R&D facility are not interested in establishing one in the near future. However, in most cases, we came to know that R&D division is involved in process and product adaptation, and in a stricter sense, this may not be called ‘R&D’, as acknowledged by an OEM and auto-component manufacturer covered. The survey also examined the perceptions of firms about National Automotive Testing and Research Infrastructure Project (NATRIP) facilities, which was set up by the government to enhance research and testing facilities. We found that only 28 of the 31 auto-component manufacturing firms were aware of this development and 10 of them felt that this would not have any major impact on their technological capabilities, quality and competitiveness. Smaller firms feel that the testing charges in both the Automotive Research Association of India (ARAI) and potentially in the NATRIP are too high to be borne by SMEs. Big firms do not find this to be a major problem. All OEMs are quite positive about NATRIP and all other developments proposed in the Automotive Mission Plan. In fact, one of the biggest Indian auto-component manufacturers based in Gurgaon perceives that the NATRIP is likely to boost R&D in the Indian auto industry, which is at its infant stage now. All component manufacturers are satisfied with the OEMs as facilitators for their performance and growth, in terms of technology, quality assurance and standards. This is 50 This is the number of parts that are defective among one million parts supplied.
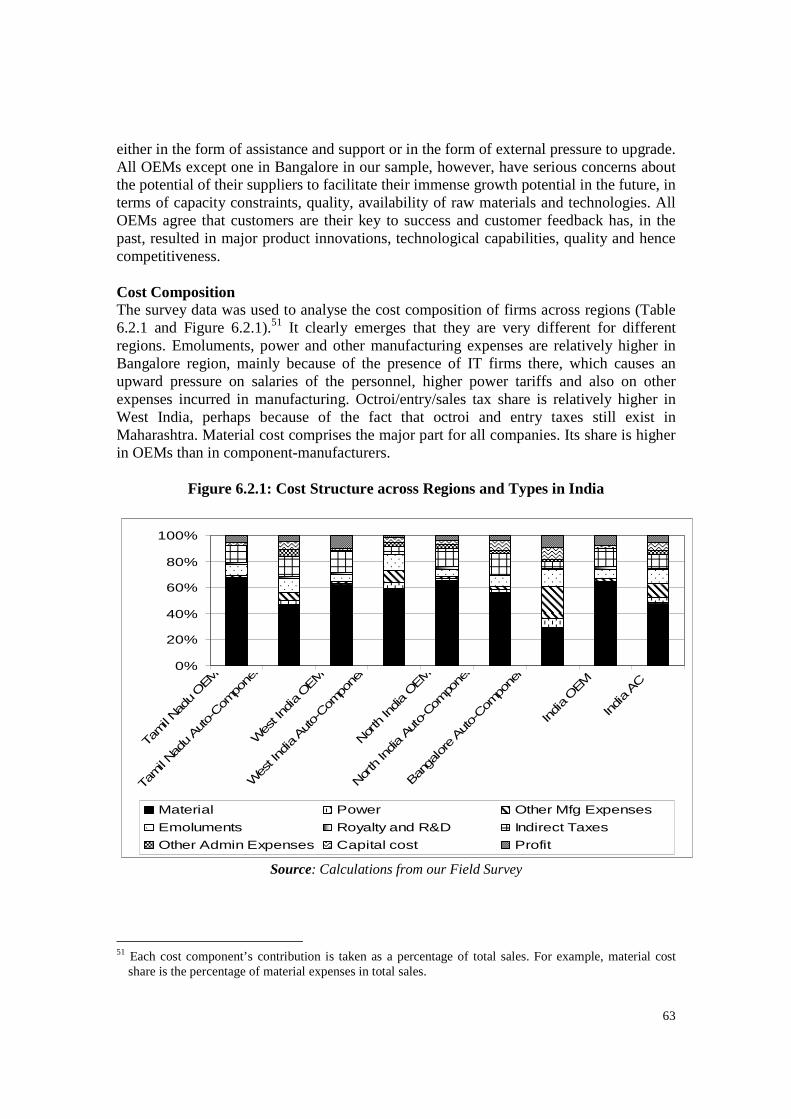
63
either in the form of assistance and support or in the form of external pressure to upgrade. All OEMs except one in Bangalore in our sample, however, have serious concerns about the potential of their suppliers to facilitate their immense growth potential in the future, in terms of capacity constraints, quality, availability of raw materials and technologies. All OEMs agree that customers are their key to success and customer feedback has, in the past, resulted in major product innovations, technological capabilities, quality and hence competitiveness. Cost Composition The survey data was used to analyse the cost composition of firms across regions (Table 6.2.1 and Figure 6.2.1).51 It clearly emerges that they are very different for different regions. Emoluments, power and other manufacturing expenses are relatively higher in Bangalore region, mainly because of the presence of IT firms there, which causes an upward pressure on salaries of the personnel, higher power tariffs and also on other expenses incurred in manufacturing. Octroi/entry/sales tax share is relatively higher in West India, perhaps because of the fact that octroi and entry taxes still exist in Maharashtra. Material cost comprises the major part for all companies. Its share is higher in OEMs than in component-manufacturers.
Figure 6.2.1: Cost Structure across Regions and Types in India
0%
20%
40%
60%
80%
100%
Tamil Nad
u OEM
Tamil Na
du A
uto-Com
pone
nt
Wes
t Ind
ia O
EM
Wes
t Ind
ia A
uto-Com
pone
nt
North In
dia OEM
North In
dia Au
to-C
ompo
nent
Banga
lore A
uto-Com
pone
nt
India OEM
India AC
Material Power Other Mfg Expenses
Emoluments Royalty and R&D Indirect Taxes
Other Admin Expenses Capital cost Profit
Source: Calculations from our Field Survey
51 Each cost component’s contribution is taken as a percentage of total sales. For example, material cost
share is the percentage of material expenses in total sales.
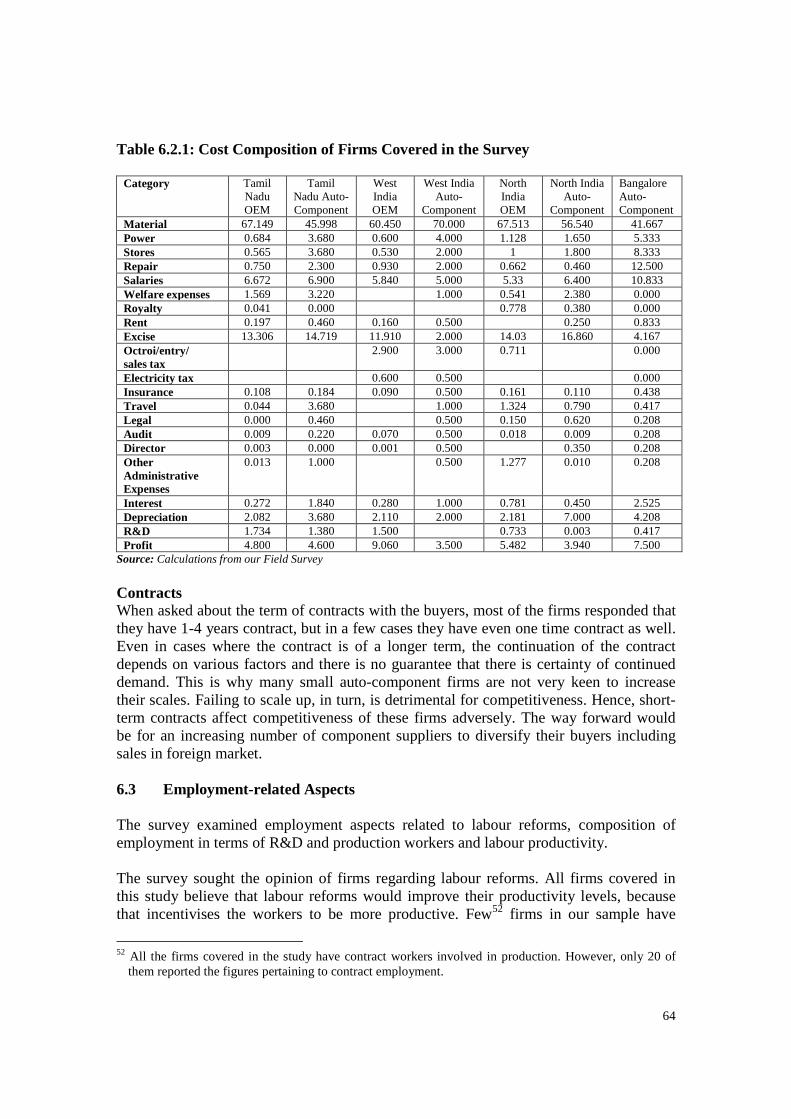
64
Table 6.2.1: Cost Composition of Firms Covered in the Survey
Category Tamil Nadu OEM
Tamil Nadu Auto-Component
West India OEM
West India Auto-
Component
North India OEM
North India Auto-
Component
Bangalore Auto-Component
Material 67.149 45.998 60.450 70.000 67.513 56.540 41.667 Power 0.684 3.680 0.600 4.000 1.128 1.650 5.333 Stores 0.565 3.680 0.530 2.000 1 1.800 8.333 Repair 0.750 2.300 0.930 2.000 0.662 0.460 12.500 Salaries 6.672 6.900 5.840 5.000 5.33 6.400 10.833 Welfare expenses 1.569 3.220 1.000 0.541 2.380 0.000 Royalty 0.041 0.000 0.778 0.380 0.000 Rent 0.197 0.460 0.160 0.500 0.250 0.833 Excise 13.306 14.719 11.910 2.000 14.03 16.860 4.167 Octroi/entry/ sales tax
2.900 3.000 0.711 0.000
Electricity tax 0.600 0.500 0.000 Insurance 0.108 0.184 0.090 0.500 0.161 0.110 0.438 Travel 0.044 3.680 1.000 1.324 0.790 0.417 Legal 0.000 0.460 0.500 0.150 0.620 0.208 Audit 0.009 0.220 0.070 0.500 0.018 0.009 0.208 Director 0.003 0.000 0.001 0.500 0.350 0.208 Other Administrative Expenses
0.013 1.000 0.500 1.277 0.010 0.208
Interest 0.272 1.840 0.280 1.000 0.781 0.450 2.525 Depreciation 2.082 3.680 2.110 2.000 2.181 7.000 4.208 R&D 1.734 1.380 1.500 0.733 0.003 0.417 Profit 4.800 4.600 9.060 3.500 5.482 3.940 7.500
Source: Calculations from our Field Survey
Contracts When asked about the term of contracts with the buyers, most of the firms responded that they have 1-4 years contract, but in a few cases they have even one time contract as well. Even in cases where the contract is of a longer term, the continuation of the contract depends on various factors and there is no guarantee that there is certainty of continued demand. This is why many small auto-component firms are not very keen to increase their scales. Failing to scale up, in turn, is detrimental for competitiveness. Hence, short-term contracts affect competitiveness of these firms adversely. The way forward would be for an increasing number of component suppliers to diversify their buyers including sales in foreign market. 6.3 Employment-related Aspects The survey examined employment aspects related to labour reforms, composition of employment in terms of R&D and production workers and labour productivity. The survey sought the opinion of firms regarding labour reforms. All firms covered in this study believe that labour reforms would improve their productivity levels, because that incentivises the workers to be more productive. Few52 firms in our sample have
52 All the firms covered in the study have contract workers involved in production. However, only 20 of
them reported the figures pertaining to contract employment.
65
reported that about 10-30 per cent of the total production workers are employed on contract basis. Further, wages paid to temporary workers, on an average, are one fourth to half of those paid to permanent workers. The firms also claim that temporary workers are far more efficient than permanent workers. However, since contract workers are temporary, it is difficult to train and retain them as skilled employees. Labour reforms, especially on flexibility in the regulations related to hire and fire policies, would in fact encourage recruitment of more permanent workers, which would have overall positive effect. Our analysis of ASI data in Chapter 2 showed that emoluments are falling as a share of total cost and that emolument growth is lower than labour productivity growth in recent years. This may be because the firms perceive that current labour productivity levels are far lower than global standards. If that is the case, they can, instead, opt for performance-linked incentives for the labour force. For example, a Japanese OEM in Bangalore, which did not have good industrial relations in past, has adopted a system which rewards the performance and innovation of workers. Each worker is free to adopt a work-method that minimises waste of time and resources on the shop floor and is rewarded accordingly. Some labour reforms suggested by the industry are: (i) raising the cap on the number of contract workers; (ii) allowing higher number of working hours per week; (iii) reduction of limits on overtime and magnitude of extra-compensation. Firms argue that firing a well-performing employee is not even in the firm’s interest, because skill availability is another major bottleneck in India. Many firms feel that their per-unit cost could be brought down by a significant proportion, mainly through higher labour productivity, if suggested labour reforms are implemented. Another interesting observation from the survey is that there is a positive correlation53 between labour productivity and turnover, calculated from our sample to be 0.465, which is significant at 5 per cent level. Further, OEMs, which are generally bigger than auto-component manufacturers in terms of turnover, have a higher labour productivity than auto-component manufacturers, both at the all-India level and in each region. Another observation is that the German, Korean and Japanese OEMs covered in our sample in India have high labour productivity, ranging from Rs.1.5 to 2.6 crore per person, as compared to Rs. 0.49 to 1.8 crore per person for Indian OEMs, because of the fact that automation levels are higher in the former. The survey results were also used to examine the relationship between turnover and number of production workers and R&D employees (Table 6.3.1). In our sample of both OEMs and auto-component firms, there is a negative correlation of 0.04 between the fraction of production workers in the total number of workers and turnover. Positive correlation of 0.11 is found between the fraction of R&D employees and turnover. As a supporting factor to this observation, OEMs in our sample invariably employ less production employees and more R&D employees as a fraction of total number of
53 This is based on the correlation coefficient of two variables under consideration, defined as the ratio of
sum of product of deviations from mean of these two variables to the square-root of products the sum of squares of deviations from mean of these two variables.
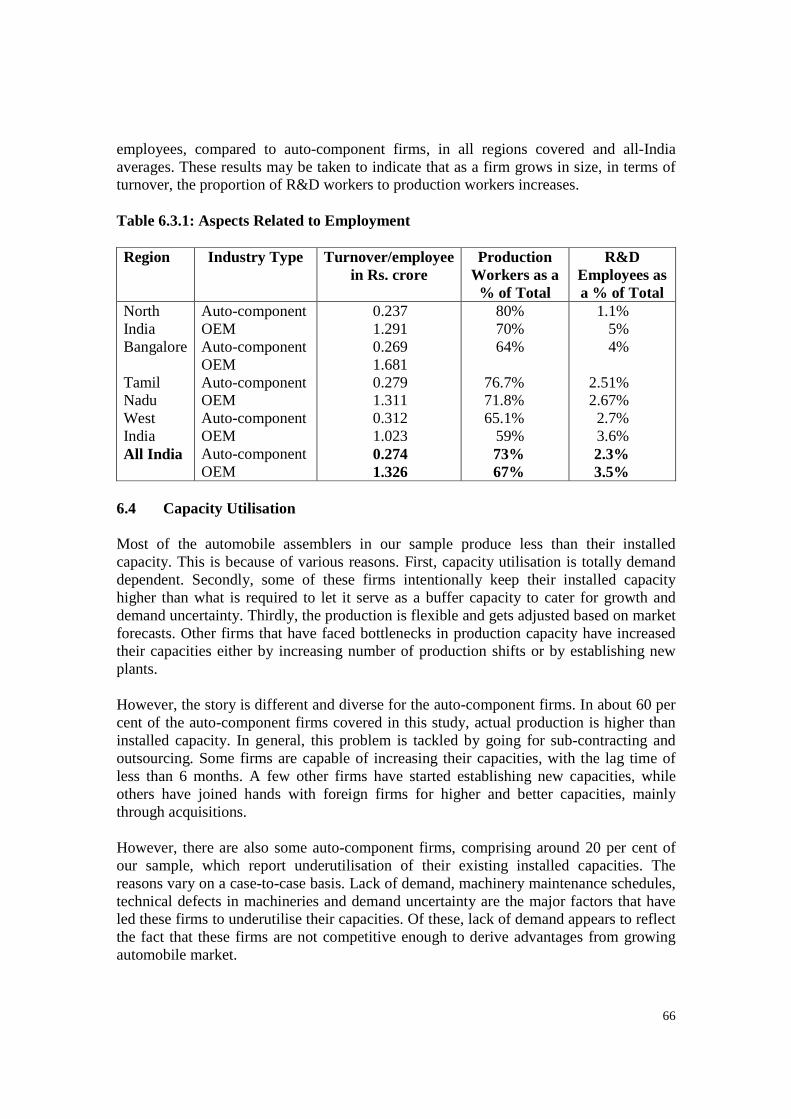
66
employees, compared to auto-component firms, in all regions covered and all-India averages. These results may be taken to indicate that as a firm grows in size, in terms of turnover, the proportion of R&D workers to production workers increases. Table 6.3.1: Aspects Related to Employment Region Industry Type Turnover/employee
in Rs. crore Production
Workers as a % of Total
R&D Employees as a % of Total
North India Bangalore Tamil Nadu West India All India
Auto-component OEM Auto-component OEM Auto-component OEM Auto-component OEM Auto-component OEM
0.237 1.291 0.269 1.681 0.279 1.311 0.312 1.023 0.274 1.326
80% 70% 64%
76.7% 71.8% 65.1%
59% 73% 67%
1.1% 5% 4%
2.51% 2.67% 2.7% 3.6% 2.3% 3.5%
6.4 Capacity Utilisation Most of the automobile assemblers in our sample produce less than their installed capacity. This is because of various reasons. First, capacity utilisation is totally demand dependent. Secondly, some of these firms intentionally keep their installed capacity higher than what is required to let it serve as a buffer capacity to cater for growth and demand uncertainty. Thirdly, the production is flexible and gets adjusted based on market forecasts. Other firms that have faced bottlenecks in production capacity have increased their capacities either by increasing number of production shifts or by establishing new plants. However, the story is different and diverse for the auto-component firms. In about 60 per cent of the auto-component firms covered in this study, actual production is higher than installed capacity. In general, this problem is tackled by going for sub-contracting and outsourcing. Some firms are capable of increasing their capacities, with the lag time of less than 6 months. A few other firms have started establishing new capacities, while others have joined hands with foreign firms for higher and better capacities, mainly through acquisitions. However, there are also some auto-component firms, comprising around 20 per cent of our sample, which report underutilisation of their existing installed capacities. The reasons vary on a case-to-case basis. Lack of demand, machinery maintenance schedules, technical defects in machineries and demand uncertainty are the major factors that have led these firms to underutilise their capacities. Of these, lack of demand appears to reflect the fact that these firms are not competitive enough to derive advantages from growing automobile market.
67
About 20 per cent of the auto-component firms, covered in our field survey, operate at full or close to full capacities owing to continuous planning. A leading Chennai-based steering manufacturer reported that they cannot afford to scale up because they follow TPM (Total Productive Maintenance) and lean manufacturing. Their margins are squeezed, which is why they cannot go for excess capacity; they have the highest fixed asset productivity among all their competitors. Some of the smaller Tier-1 firms do not plan to expand in the near future mainly on account of the feeling that they are not assured of volumes in the future,54 while others face constraints in credit availability and cost. Much smaller Tier-2 and Tier-3 firms prefer to remain small either to retain their advantage of being flexible in production, or because of constraints in credit availability. Another barrier for scaling up, for almost all firms, is the lack of manpower availability at all levels, mainly at managerial level. Hence a major thrust should be given to improving management skills and training. In fact, one of the biggest auto-component firms in India, which is based in Gurgaon, engaged in forgings and castings, reports that they face some competition and threat from the smaller auto-component players. The major reason is that the smaller firms have flexible production capacities and also can customise the products depending on the buyer’s requirements, at a higher pace than what the bigger firms can afford to. Despite this threat, the top executive of this firm believes in massive expansion on a continual basis, in order to eliminate problems due to logistics by being closer to the customer. In addition to setting up new plants and acquiring Indian plants, some bigger firms have also gone on to acquire sick foreign firms, mainly in the developed countries such as the United Kingdom. The reasons for doing this are one or more of the following: Access to new markets; access to advanced technologies; opportunity to blend the world-class technology with low-cost advantage enjoyed by their Indian plants. 6.5 Aspects Related to Supply Chain The survey also focused on aspects of supply chain, especially on the relationship between component suppliers and vehicle manufacturers. Tier-1 component manufacturers supply auto-components to the automobile assemblers, while Tier-2 manufacturers supply to the Tier-1 players. Tier-3 players are usually the small manufactures who supply to Tier-2 manufacturers. Our survey examined the role of foreign OEMs in Indian auto supply chain. Some Indian auto-component manufacturers feel threatened by foreign OEMs who bring with them part of the supplier network. They also feel threatened by the foreign OEMs that import cheaper components from elsewhere in the world. We found mixed evidence in this regard in our study. All leading foreign OEMs covered in our study do contribute to the enhancement of operations, quality and productivity of their suppliers in India. This is
54 This observation also indicates the weak management in some auto-component firms, because at such a
high and sustained GDP growth rate and investments pouring in the automobile segment, one would not fear much about demand uncertainty. Further, when we enquired about the contracts that ensure certainty in demand for few years, we were informed by many firms that these contracts are not strictly enforceable and hence demand uncertainty exists despite them.
68
done through various supplier training programmes and continuous monitoring of suppliers by these OEMs. It is true that they do source a part of their requirements of components from their parent country or elsewhere in the world, but this is driven either by exceptional quality/technology requirements that are not possible to be achieved in India or by low cost of products in other countries. Two of the foreign car majors and one Indo-Japanese joint venture covered in this study imported 10-100 per cent55 of their requirements for manufacturing different models of cars and MUVs, while Indian OEMs import less than 2 per cent of their requirements. Attempting for joint ventures with the suppliers of OEMs in their parent countries is also a good strategy for the auto-component firms to tap these markets, as one of our respondents has done. The survey indicates that the number of suppliers for OEMs is much higher than those for auto-component manufacturers. The number of suppliers to different OEMs ranges from 70 to 300, while for different Tier-1 component manufacturers it ranges from 15 to 100. Sub-contracting of products is also done in many auto-component manufacturers, depending on the demand and their supply capacities. Foreign firms procure a major proportion of their components required locally, but they import a part of their requirement mainly on account of the lack of scales of operation among domestic suppliers. This is because of the fact that supplier size in Thailand is, on an average, 5-6 times bigger than in India. About 60 per cent of the auto manufacturers had major scale constraint on the part of Tier-1 suppliers. Even though component suppliers have low capacity, their quality levels have improved through the OEMs. For instance, an Indian OEM has enabled their suppliers to reduce their defect rate from 1,000-2,000 PPM to 100 PPM. This extent of supplier relationship is, however, more prominent in foreign OEMs than in Indian ones. Few firms get a major part of their sourcing done through some supply-chain logistics companies, which are specialised in specific auto-components. The supply chain has also been affected by regulatory norms related to emissions. There have been frequent changes in regulations pertaining to emission norms in India (also Section 7.2). For instance, in the North-Eastern states, BS-II norms were scheduled to be implemented in 2005. However, the government changed its decision and reverted to BS-I due to lack of fuel availability. In addition, the emission norms are different in different states. For instance, 11 states have adopted BS-III, some of them still follow BS-II and the North-Eastern states are still following BS-I. Because of contradictions and inconsistencies in the standards, some suppliers had to dispose off their production facilities.56 Thus, harmonisation of emission norms and drawing a detailed roadmap would help entire auto supply chain in India to adopt the relevant technologies in advance.
55 Import content varies for each model in each company. 56 This event is based on our discussion with a MUVs major, based in Mumbai and is described in Chapter
7, in a section that explains emission norms in India.
69
BS-III has been implemented in most parts of the country. However, there are just 2 FIP (Fuel Injection Pumps) manufacturers in India, although this is necessary for BS-III. Thus, there is a capacity constraint to achieve higher emission standards. Some leading auto-component manufacturers report that scale is an issue with their suppliers. For example, a Chennai-based firm needs to go to 10-15 suppliers for each product, since their scale of operation is about 5 times lower than that in Korea. The number of suppliers for different auto-component firms in our sample varies between 10 and 100. In many cases, the problems arise due to sudden demand surges, which are also solved by sub-contracting. Tier-2 and Tier-3 suppliers suffer from problems such as inefficiency, lack of quality and credit constraint. However, two of our respondents, who are among the biggest auto-component producers in India, have mentioned that SMEs have their own strengths and great future ahead, because of their ability to produce very customised products for their buyers. However, there is a consensus among our respondents that they need to improve their quality so that the entire auto supply chain can enhance the quality of auto products. Some foreign OEMs have targets to procure auto-components from India for their global requirements. Generally, they are not able to achieve their targets. We discussed with auto-component manufacturers about the reasons for this mismatch between supply and demand in the auto supply chain. First, most of the Indian auto-component manufacturers do not have a scale of operation that can cater to huge requirements. Secondly, even the biggest companies that we had covered in this study perceive that it is too risky to cater to huge demand for a single buyer. Thirdly, the requirement of the global auto majors for huge inventories for long period is difficult to meet for the Indian auto-component manufacturers, since this is very expensive for them. 6.6 Production-related Constraints Most regions covered in our study report numerous bottlenecks in terms of roads, railway connectivity, port congestion, power quality and availability, input costs, supplier base, lack of skills, attrition, etc. But some of these constraints are found to be quite region-specific, in terms of the nature and extent of bottlenecks faced by auto firms. 6.6.1 Transport Infrastructure The dominant problems specific to Bangalore and Hosur are poor and insufficient roads, poor connectivity to railway station and distance from ports. While some of the auto-component manufacturers are closer to their customers in Bangalore-Hosur region and Chennai hub, most of them are far away from their customers and that seems to cause a major price threat from their competitors located near their customers. Hence, some of them have plans to relocate their plants or open new facilities in north India. In Mumbai and Chennai regions, ports are closer, but there is immense port congestion. Further, during rains, the road infrastructure gets affected. Non-availability of deep sea
70
vessels in Chennai leads to a lead time of 3-4 days in excess, which is very costly for the firms. Variance for outside freights is high and hence Chennai requires a deep sea port. Another suggestion by one of our respondents is that infrastructure in rural areas could be improved, so as to facilitate establishment of new industries in a much better infrastructural environment than at present. 6.6.2 Power High costs and low quality of power is an issue highlighted by our Bangalore-based respondents. Despite their advantages in terms of better roads and better supplier base, Mumbai-based firms face problems in power quality, because of fluctuations. In this area, some firms are prepared to pay higher prices for power, but they demand a very good and consistent quality of power. It is not just the delays resulting from power quality/availability, but also the quality factor, since this could seriously damage the quality of products during production. 6.6.3 Labour High cost of labour, at all levels, is a serious region-specific problem in Bangalore, owing to the fact that this is an IT hub, characteristised by high wages. High level of attrition is another particular concern in this region, though it is common to all regions. Unprofessional labour attitude and lack of skilled manpower are the major problems in north India. 6.6.4 Materials Another major issue faced by most of the firms covered in the study is one of materials. Some firms perceive that steel of very high quality is difficult to procure in India. While the auto industry grows at 15-30 per cent per annum, the steel availability grows only at 5 per cent. Prices also fluctuate though reasonably good quality steel is available with major Indian players. Future outlook in terms of steel availability and prices is almost always unclear. Similar problems are associated with high-quality plastic materials, rubber tyres, etc. A major rubber component producer in Mumbai reported that delivery of imported raw material, EPDM (Ethylene Propylene Diene Monomer) rubber is invariably delayed because of the customs clearance that takes 7-10 days. Further, there is an acute shortage of this material in India. 6.6.5 Taxation and Incentives Octroi taxation was the major region-specific issue raised by most firms in Maharashtra. Many Chennai players have established or are planning to establish plants in the Uttarakhand and Uttar Pradesh, because of huge tax incentives. However, they do acknowledge the severe disadvantage of this state, in comparison with Tamil Nadu, in terms of human capital and infrastructure. Thus, these region-specific tax incentives could result in distorted investment decisions that may result in long-term losses for these firms.
71
6.6.6 Environment Some firms in south India face environment-related problems. First, they report unwarranted interference in their operations, by some officials in the State Pollution Control Boards, despite the fact that they comply with all environmental regulations. Secondly, the sludge that emerges out of waste treatment is not disposable readily. In a few firms, this leads to heaping up of huge masses of sludge (non-disposable waste), reducing the space availability and causing health hazards and even soil degradation in the long run. In states like Maharashtra, the local governing body takes the responsibility of treating the sludge at a common place. 6.6.7 Other Constraints In the National Capital Region of Delhi, other major concerns of our respondents are unavailability of land, not so good law and order situation and competition from foreign auto-component firms due to duty reduction. Auto-component exporters have to offer around 2-5 per cent price reduction to their buyers every year. Though this price reduction is determined by a formula, which takes into account the rise in the price of raw material and currency inflation (in the case of foreign OEMs), this does not include the other costs involved in the production and delivery, mainly, power, fuel and transportation costs. Given the rise in all prices, efficiency improvement is the only way to cut costs, but it is difficult mainly because of low labour efficiency. Hence, they are forced to squeeze their margins. 6.7 Strategies of Different Firms The survey examined the strategies followed by the auto firms for different goals. These strategies will be discussed separately for OEMs and auto-component firms: 6.7.1 Strategies of OEMs
Strategies to face labour-related problems • Human Resource Development (HRD), mainly in terms of training of the existing
and new personnel at all levels, is a worthwhile strategy practised by many OEMs in India.
• Some OEMs offer performance-linked incentives to workers. Such firms have been able to improve labour productivity of their workers.
Strategies to face competition • Stiff competition amongst auto manufacturers has forced them to look for niche
markets. A Pune-based car manufacturer, who has been a major player since the 1940s, suffered major losses since the 1990s and has lost his entire market to new entrants in car manufacturing. This company has currently decided to follow a new strategy: focus on niche segments within LCVs, such as a high-power low-weight vehicle.
72
• Some firms have taken the initiative to offer value-added services to enable them to face competition in a market where vehicles within same segment are broadly similar in terms of looks and functional characteristics. For example, value-added services such as good dealer network (3S, i.e., Stores, Spares and Service, in many cases) play a vital role in market expansion. Some OEMs are also insistent on exclusive dealerships so as to protect their markets from their competitors.
• Low-cost manufacturing and targeting developing countries for exports are the other strategies followed mainly by Indian OEMs.
Strategies to improve technology and quality • Capacity-building of auto-component manufacturers is done by most OEMs. • Foreign OEMs have a focus on better technologies (both process and product) and
they are way ahead of Indian ones, for example, Emission Norms, Alternative Fuels and Automation
• Technical collaborations with international technology leaders is increasingly happening with Indian OEMs.
• Some OEMs are also functioning as Tier-1 suppliers to supplement revenues and go for partial vertical integration. One of the foreign-origin OEMs is also involved in sourcing components for the parent company abroad.
Strategies to serve expanding demand • OEMs are also going for huge investment plans in low-tax zones and other Low-
Cost Countries • Massive consolidation of plants and scaling up is taking place.
6.7.2 Strategies of Auto-component Firms
Strategies to face competition • Focus on niche segments and niche export markets is an innovative marketing
strategy followed by some component firms. For example, Manual Rack and Pinion (R&P) Steering Gears is in high demand in the Middle East and Africa, while they are not preferred in most other parts of the world. Hence, a Chennai-based steering manufacturer, whose core strength lies in manual R&P steering gears, has decided to focus on this niche export market.
• Low-cost manufacturing and targeting developed countries for exports are the strategies of most Indian auto-component manufacturers.
• Some auto-component manufacturers (e.g. Chains, Gears) would like to supply their products to non-auto industries such as industrial machinery manufacturers, so as to ensure that their market risk is minimised.
Strategies to improve technology and quality • Capacity-building of Tier-2 suppliers is done by bigger Tier-1 suppliers. • Acquisition of leading foreign brands and plants (e.g. three manufacturers of
rubber components, forges and clutches, covered in our study) is believed to be a strategy that gives access to new markets and technologies. When this value-addition is blended with existing cost advantage in Indian plants, overall
73
competitive advantage is enhanced. Further, this also serves as a brand-promotion strategy.
• Technical collaborations with international technology leaders help the Indian auto-component manufacturers to rise up to global standards.
• Black-listing of suppliers with consistently bad quality is a strategy that ensures good quality and capacity-building of suppliers in the long run.
6.8 Policy Measures Following are some of the policy measures suggested by our field survey respondents:
• Infrastructure improvement is required in the following areas: o Better quality of roads all over India. o Long-term road-planning. o Focus on rural areas to avoid further urban congestion. o Railway corridors for better connectivity to railway stations. o Deep Sea Vessel handling capacity in major ports and other measures to
minimise port congestion. o Better power quality and availability.
•••• Credit availability should be ensured, at reasonable interest rates, mainly for the smaller firms.
•••• The incentives and benefits that are meant for the R&D expenditure in the auto industry should be extended for a longer period.
•••• Vehicle design capacities within the country need to be improved. • All policy measures mentioned in the Automotive Mission Plan should be
implemented, such as the establishment of National Auto Institute with active participation of private industry players.
• Excise duties on auto products should be cut across the board, not only for certain segments. Custom duties for raw materials should be reduced. Further, customs clearance and other formalities in the government should be faster to ensure quicker delivery of exported goods.
• FTAs could be negotiated, with assured level-playing field for the Indian auto-component sector. For example, incentives/lower excise rates for OEMs for localisation of components could replace existing system of imposing lower rates for small cars alone.
• Inter-state differences in fiscal levies and taxes should be minimal. A move towards a common regime of Value-Added Taxes (VAT) across states and Goods and Service Taxes (GST) at the Centre is strongly recommended. Inter-state differences in taxes and incentives should be minimal.
• Reducing the testing charges in the Automotive Research Association of India (ARAI) and the National Automotive Testing and Research Infrastructure Project (NATRIP) will benefit smaller players.
• Encouragement of FDI in the auto sector and also promotion of activities by Indian industry to collaborate and interact with global players are required to help Indian industry gear up to global standards.
74
• Improving Market Development Assistance is required, mainly for the export-oriented Small and Medium Enterprises (SMEs).
• Instead of focusing on specific areas as export zones, all exporting firms should be treated alike and the incentives should be similar across the board.
• Introduction of labour reforms, mainly as regards contract labour act and hiring and firing regulations, is an essential step to improve cost-competitiveness.
• Environment: o Assistance in sludge disposal is required for the plants that treat their
effluents and environmental clearance procedures need to be faster. o Harmonisation57 of emission norms across states is required and a
roadmap for implementing this needs to be put in place.
6.9 Conclusions
• Despite higher productivity, contract workers cannot contribute much to long-term performance because of their temporary nature. Hence, policies that encourage recruitment of permanent workers are required. For example, if labour policies are made more flexible, firms would have the incentive to recruit more permanent workers. Firms should also be allowed to link emoluments with the productivity of workers to enhance efficiency.
• Ratio of turnover to employment is higher for bigger companies, including OEMs and for foreign firms in particular. Thus, auto-component players can generate more employment than OEMs, while Indian OEMs can generate more employment than foreign OEMs.
• Bigger auto firms (with exception of foreign firms), in terms of turnover, and OEMs, in general, employ relatively more R&D workers as a proportion of total number of workers.
• Most of the OEMs and a few auto-component manufacturers have excess capacity, while some smaller auto-component manufacturers have capacity constraint. Some of them are expanding rapidly and even acquiring foreign plants. Others are unable to scale up because of demand uncertainty, credit constraint and lack of skilled manpower.
• Both foreign and Indian OEMs assist in technology upgradation and quality improvement of their suppliers. Joint ventures with foreign suppliers could help to tap the markets of foreign OEMs as import content in them is high. Most of the OEMs are concerned about capacity constraint of their suppliers and lack of quality of their smaller suppliers.
• Most of the problems faced by the auto industry have to do with infrastructure, increasing material costs, skill shortage and tariff structure. In addition to these, falling prices is a major challenge faced by auto-components.
• Auto-component firms are more export-oriented than OEMs. Though most of the foreign OEMs target domestic markets, the biggest car exporter is a foreign OEM.
• Globally, Indian firms are as good as, or better than, other developing countries in technology and quality, but are not as good as those in OECD countries. But, they
57 This issue is discussed in Chapter 7, in a section on Emission Norms.
75
are not as cost-competitive as China, except in engines. R&D efforts are lower in auto-component firms, but NATRIP is expected to promote them in future.
• Bangalore region has the highest cost share for emoluments, while octroi/entry/sales tax share is relatively higher in west India. Material cost comprises the major part for all companies, while its share is higher in OEMs than in component-manufacturers.
76
7. Policy Framework Surrounding the Indian Auto Sector
This chapter explains the evolution of policy framework that surrounds the Indian auto sector, over the years. Emission norms and standards and inter-state differences in policies are also discussed under different sections in this chapter. 7.1 Evolution of the Policy Framework The Indian auto policy has generally been in line with the prevailing industrial policy framework. During the British regime, India had no auto industry to begin with and all the automobiles were imported from the global auto manufacturers such as General Motors and Ford Motors. In the 1940s, Hindustan Motors and Premier Motors were established by Indian entrepreneurs, by importing know-how from General Motors and Fiat respectively. In the 1950s, a few other companies such as Mahindra and Mahindra, Ashok Motors (with Technical Collaboration with Leyland Motors) and Bajaj Auto entered the market for commercial vehicles and two-wheelers. Most of them either imported auto-components or produced them in-house, till mid-1950s, when India launched import substitution programme. This development, followed by the L.K. Jha Committee’s recommendations in 1960 to develop an indigenous ancillaries sector, resulted in the evolution of a separate auto-component sector. From being a highly protected segment pre-1980s, the auto-component industry in India has emerged into a global player, supplying not only to domestic firms but also to numerous foreign Original Equipment Manufacturers (OEMs). Till 1991, the Phased Manufacturing Programme (PMP), under which domestic OEMs had to increase the proportion of domestic inputs over a specific time period, had laid foundation for the Indian auto-component sector. However, assured demand for their products had rendered many players in this sector inefficient. This led to abolition of this programme under the New Industrial Policy of 1991. Passenger car segment was restricted to licensed production. Commercial vehicles and two-wheelers were also restricted by licences, but the extent of restrictions was less and hence there were quite a few new entrants in these segments in the 1980s, especially in the CV segment. The reforms of 1991, followed by the entry of global OEMs and Tier-1 suppliers in India, paved the way for expansion of range, technologies and number of auto-component manufacturers. This led to a major transition in the Indian auto industry, wherein the vehicle manufacturers started outsourcing most of their components from the auto-component manufacturers. Ever since the delicensing of passenger car segment in 1993, the Indian auto industry has grown bigger, with new international players entering the market. Since 2000, there have been many significant policy developments such as removal of Quantitative Restrictions (QRs) on auto imports and permission for 100 per cent FDI. Financial liberalisation in the early 1990s enhanced credit availability to consumers and this, in turn, led to a boost of auto loans in India, which was a key driver of demand for automobiles. This facilitated the transition of passenger cars from being regarded as luxury goods, accessible only for the elites, to necessary goods, accessible to a wider section of the society.
77
Since 2000, India has been observing a Safety Decade. Efforts have been made for aligning Indian safety standards with global ones. Roadmap has been prepared till 2007 for safety standards, while an outline has been drawn till 2010. The National Road Safety Board is under active consideration by the government, which will be responsible for road-related measures, vehicle-related measures and research on road safety. One of the major measures, which is likely to be implemented in the near future, is the measurement of road-worthiness of vehicles, based on which a regulatory body under the government may be engaged in certifying, whether a motor vehicle is road-worthy or not, in terms of emissions and safety. Auto policy, 2002, stresses on the need to provide direction to the growth and development of the auto industry in India. This policy document resulted in reduction of duties in the auto-component sector to a large extent and the automobile sector to some extent and extension of R&D incentives to the auto sector. R&D thrust by the government can be inferred from the recent measures such as 150 per cent weighted deduction on R&D expenditure and increased R&D budget allocation for this sector. In 2005-06, a few major policy developments relevant for the auto sector took place in India. Implementation of VAT has taken place in a few states. Euro III emission norms have been introduced in 11 metro cities and at the same time, the Euro II norms have been implementation in rest of the cities. These norms have been delayed for the diesel vehicles due to the unavailability of fuel. Therefore, the government has decided to implement these norms58 in phased manners in selected northern states. Finance Bill 2006 reduced excise duty of motor vehicles to 12.5 per cent against 15 per cent before and import duty of raw materials to 5-7.5 per cent against 10 per cent before and has given a thrust to the development of infrastructure, which is the key factor influencing auto industry, both as a driver of demand59 and as a facilitator of enhancing competitiveness60 in manufacturing of auto products. The introduction of above mentioned norms, in addition to safety and noise norms have led to the increase in the workload on the Automotive Research Association of India (ARAI) testing facilities. Keeping this in mind, the Government of India has made various efforts to improve the testing facilities. These include the approval of two proposed additional testing facilities, upgradation of the ARAI & Vehicles Research and Development Establishment (VRDE), establishment of a world class test track and building of a few additional centres under the NATRIP in and around the major auto hubs in India. This is an industry-government joint initiative, involving an investment of Rs. 1,718 crore. The additional centres would be set up in Manesar, Pune, Ahmednagar, Chennai and Indore.
58 More on emission norms is covered in Section 7.2. 59 For example, when there is a better road network, it is more likely that demand for automobiles increases
among the people. 60 With better roads and power availability and quality, for example, the firms will be able to reduce their
costs of transportation and production, as well as improve their product quality.
78
Efforts have also been made to promote alternative fuels. For this, the following three initiatives have been launched: 1. Agreement with the sugar industry on the off-take of ethanol has been made. 2. An action plan has been prepared to grow and procure bio-diesel at fixed price. 3. Hydrogen energy roadmap has been prepared by Ratan Tata. According to this roadmap, 10 lakh hydrogen-fuelled vehicles will be produced by 2010. The accession to the UNWP (United Nations Working Party) 29 -1998 is another important decision taken by the Indian Government in 2005-06. This agreement will prove a significant step towards the global integration of the Indian auto industry. A great deal of progress has been made on bilateral and regional trade agreements. The bilateral agreement with Chile and Singapore and regional agreements with SAFTA (South Asian Free Trade Agreement) and MERCOSUR (Southern Common Market) have been concluded, while the bilateral discussion with Thailand61 and regional discussions with ASEAN and BIMSTEC62 (Bay of Bengal Initiative for Multi-Sectoral Technical and Economic Cooperation) have reached the final stage. In August 2006, a Draft of Automotive Mission Plan Statement was released by the Ministry of Heavy Industries, in consultation with industry. This was released as a report in December 2006. This document draws an action plan to take the turnover of the automotive industry in India to US$145 billion by 2016 with special emphasis on small cars, MUVs, two-wheelers and auto-components. Measures suggested include setting up of a National Auto Institute, upgrading infrastructure, cutting the duties of raw materials and fiscal incentives for R&D. In August 2006, the Working Group on Automotive Industry in the Ministry of Heavy Industries has brought out a report for the Eleventh Five Year Plan. This document stresses on the need of speeding up the move towards VAT in the states and GST at the Centre. Labour regulations, paperwork involved in government-related transactions, internal trade barriers,63 infrastructure bottlenecks, raw materials, human capital, increasing interest rates and threats due to FTAs are, as mentioned in this document, barriers to competitiveness. This report notes that the effective levy is lower for a Counter-Vailing Duty (CVD) than excise duties locally, because of the fact that excise is made after including the post-manufacturing expenses64 in the price, while imported Completely Built Units (CBUs) have the advantage of being levied the CVD before post-manufacturing expenses. In addition, the document recommends various other measures such as upgrading human resources, mandatory inspection and control and retirement of vehicles based on road-worthiness.
61 In 2004, Early Harvesting Scheme for Indo-Thailand FTA was launched for 84 auto-component
products, as mentioned in Chapter 5. 62 The countries included in this group are Bangladesh, India, Myanmar Sri Lanka and Thailand. 63 These are the barriers to inter-state movements, mainly because of inconsistencies and differences in the
fiscal and other policies of Indian states. 64 This includes selling and distribution costs (advertising, personnel, incentives, warranty, branding and
transportation) and margins. This ‘CVD anomaly’ is explained in the Report of Working Group on Automotive Industry, Ministry of Heavy Industries and Public Enterprises (2006), pp. 16-17.
79
Financial Bill for 2007-08 has very few measures that affect the auto sector. Cut in import tariffs of commercial vehicles to 10 per cent is expected to induce further competition in the Indian commercial vehicles sector. Since CVs are required in the development of infrastructure, duty reduction on CVs may give a boost to infrastructure. Increase in total tax burden is certain to occur now, because of the increase in education cess from 2 per cent to 3 per cent of total taxes. Extension of R&D incentives for five more years, reduction of Central Sales Taxes (CST) and increased infrastructural expenditure are positive features of the budget, for auto sector.
7.2 Emission and Safety Standards
In India, safety standards were introduced in the 1960s in auto-components, while the Central Motor Vehicles Rules came into existence in 1989. In 1991, the first state emission norms came into force for petrol vehicles and in 1992 for diesel vehicles. From April 1995, fitting of catalytic converters in new petrol-driven passenger cars was mandated in the four metros and unleaded petrol was also introduced. From April 2000, unleaded petrol is available in the entire country. As for road safety, numerous awareness programmes are arranged all over the country, since 2000-10 is a safety decade.
In developed countries, lead was phased out from petrol over a period of more than 10 years, while in India this was achieved in just six years. The time gap between the introduction of norms in Europe and India is narrowing down gradually. Euro I was introduced in the EU in 1983, while the same was introduced to India in 1996. Euro II was introduced in the EU in 1996-97. Bharat Stage-II norms, which are the Indian counterparts of Euro II, have been introduced for smaller passenger vehicles (Gross Vehicle Weight < 3.5 tonnes) in 2000, and for heavier vehicles (Gross Vehicle Weight > 3.5 tonnes) from 2001 in National Capital Region of Delhi. For Mumbai, Chennai and Kolkata, these standards were extended to different months in 2001. Later, these norms were extended to the rest of the country in phases by 2005. However, for some categories of vehicles such as two-wheelers and three-wheelers, new generation norms are yet to be announced. Bharat Stage-III norms have been implemented in many Indian states in phases. There are numerous other policy initiatives from the government and industry to encourage adoption of environment-friendly technologies, such as hydrogen energy initiative by Tata and a few other government policies enumerated in the previous sub-section.
However, there were some contradictions and policy changes in North-Eastern states, in terms of implementation of emission norms. The component-suppliers of an MUV major based in Mumbai, covered in our field survey, had adapted their technologies to suit Bharat-I norms, which were introduced in North-Eastern states in 1997. With the implementation of Bharat-II norms in this region in 2005, they had adapted their technologies accordingly. However, it was later found that fuel that is consistent with Bharath-II norms was not available in sufficient quantity and hence Bharat-I was implemented again, instead of Bharath-II. Consequently, some of the suppliers had to close down their operations partly or fully.65 Hence the emission norms-related policies should be designed in such a way that the manufacturers get sufficient time to adapt their
65 This observation is based on our discussion with industry people, during field survey.
80
processes and technologies. At the same time, both domestic and foreign firms at all levels should be prepared for the latest international norms.
7.3 Inter-State Differences in Policies
A major weakness in Indian policy framework is inter-state differences in policies, as our field survey respondents reported. This section summarises the major industrial policy initiatives in the leading auto-producing states. In addition to these policy differences, there are individual memoranda of understanding between the companies and state governments, resulting in further specialised incentives for the companies.
7.3.1 Tax Policies • Maharashtra is the only state that levies octroi taxes, among the major auto-
producing states in India. Thus, firms in this state find it expensive to procure components from other states. However, in an attempt to develop its backward districts, the Maharashtra Government is providing few incentives to the industrial units that are set up in these districts. These incentives include the exemption from the electricity duty for 10 years, stamp duty and registration fees for 5 years. There is octroi refund to the industries in these places.
• The Haryana Government provides exemption from sales tax and Local Area Development Tax (LADT) for certain time period for the industries that are newly set up.
• Tamil Nadu offers exemption from the electricity tax for three years to all the new projects with investment between Rs. 50 crore and Rs. 100 crore.
• Uttarakhand provides many tax incentives, such as the following: o Exemption from central excise is given for 10 years of establishment. o 100 per cent income tax exemption is given for the first five years of
establishment, followed by 30 per cent for the next five years. o Exemption from entry tax on plant and machinery is granted.
7.3.2 Subsidies • The Maharashtra Government provides capital subsidy to the SSIs. • The Haryana Government gives financial assistance to the SMEs for patent
registration. It also provides capital subsidy to the export oriented firms and interest-free loan to the Small Scale Industries (SSIs).
• The Tamil Nadu Government provides the following subsidies: o Capital subsidy of Rs. 25 lakh to all the new projects with investment
between Rs. 50 crore and Rs. 100 crore. The amount of subsidy increases with the volume of investment.
o Reimbursement of patent registration fee up to 50 per cent of expenses or Rs. 1 lakh, whichever is lower, is done.
o Subsidy of 25 per cent or Rs. 25 lakh, whichever is lower, is given for the setting up of Effluent Treatment Plants (ETPs).
• The Uttarakhand government provides the following subsidies: o Capital subsidy of 15 per cent with a maximum of Rs. 30 lakh is provided. o 3 per cent interest incentives with a maximum of Rs. 2 lakh are given for
the SSIs.
81
o Financial assistance is provided for the installation of pollution control equipment up to 50 per cent of total cost with a maximum of Rs. 1 lakh.
o Financial assistance is also granted for marketing the products.
7.3.3 Other Provisions • Maharashtra has the following industry-friendly provisions and proposals:
o The Maharashtra Government has proposed the amendments in existing labour laws such as the Industrial Disputes Act, Contract Labour Regulation and Minimum Wages Act.
o Rationalisation of inspection process and other paper work has been initiated.
o Captive power generation has been allowed and encouraged, in order to tackle the bottlenecks in power supply and quality.
• Haryana has the following industry-friendly provisions and proposals: o Schemes have been announced for modernisation, technological
improvement and quality upgradation. o Marketing under a common brand is being promoted in many sectors. o Special emphasis is laid on infrastructural development, in terms of
aspects such as building of express highways and power plants. o Priority is given to establishing Special Economic Zones in the state. o Self-certification scheme has been introduced with respect to labour laws
to curtail the unnecessary visits of inspectors. • Tamil Nadu has a provision for single window approval. Industrial parks are
being developed proactively and emphasis is being laid on infrastructural development.
• In Uttarakhand, single-window clearance mechanism is being enforced. Infrastructural development is given thrust, through improving the private participation. There are plans to simplify the labour laws.
7.4 Conclusions
• Since the late1980s, the auto industry has seen various measures such as delicensing, tariff reduction and encouragement of FDI. In the recent years, there have been major efforts by the Government of India, such as establishment of NATRIP facilities, implementation of emission norms and release of the Automotive Mission Plan. Implementation of the recommendations of this policy document could transform India into a global auto hub.
• There are many inter-state differences in terms of tax policies, incentives and emission norms. These could be minimised in order to smoothen the inter-state movements of goods and relocation of industries. Since the Indian auto industry is geographically widespread, this would strengthen the supply chain and its competitiveness.
• Firms make their decision to invest in certain states because of the incentives and subsidies offered. However, investment decisions should be based on real factors such as infrastructure and human resources that would ensure their sustainability in the long run.
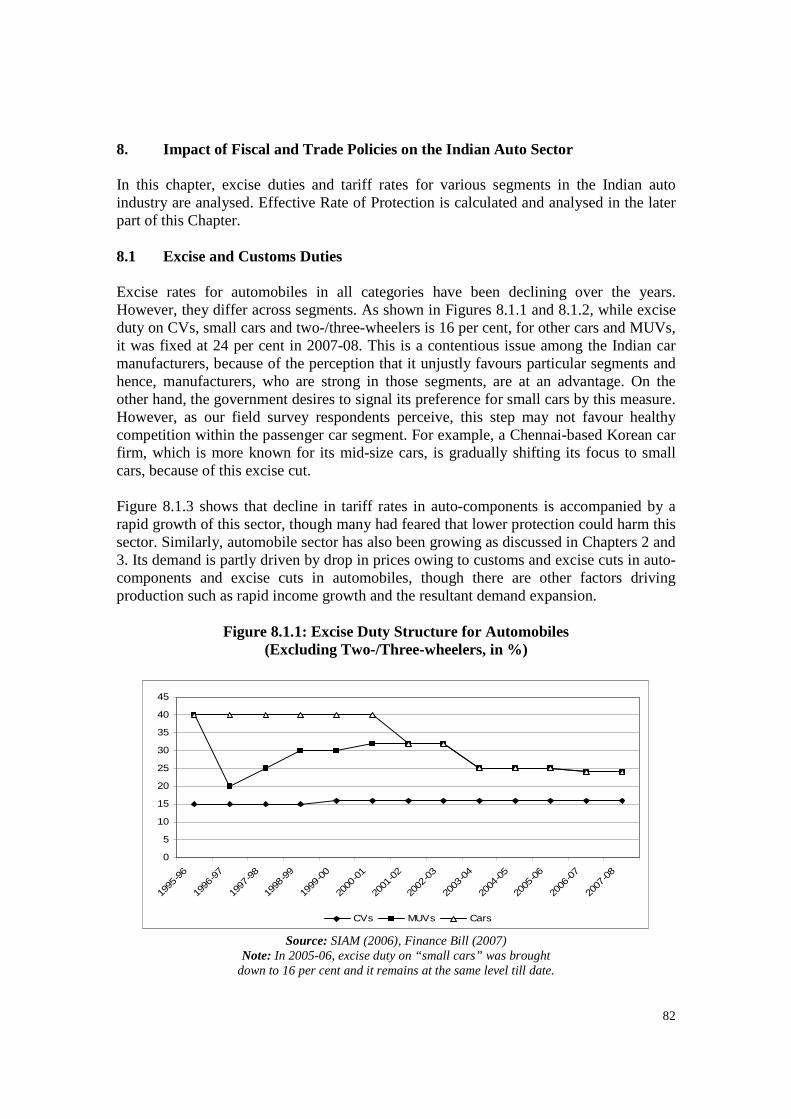
82
8. Impact of Fiscal and Trade Policies on the Indian Auto Sector In this chapter, excise duties and tariff rates for various segments in the Indian auto industry are analysed. Effective Rate of Protection is calculated and analysed in the later part of this Chapter. 8.1 Excise and Customs Duties Excise rates for automobiles in all categories have been declining over the years. However, they differ across segments. As shown in Figures 8.1.1 and 8.1.2, while excise duty on CVs, small cars and two-/three-wheelers is 16 per cent, for other cars and MUVs, it was fixed at 24 per cent in 2007-08. This is a contentious issue among the Indian car manufacturers, because of the perception that it unjustly favours particular segments and hence, manufacturers, who are strong in those segments, are at an advantage. On the other hand, the government desires to signal its preference for small cars by this measure. However, as our field survey respondents perceive, this step may not favour healthy competition within the passenger car segment. For example, a Chennai-based Korean car firm, which is more known for its mid-size cars, is gradually shifting its focus to small cars, because of this excise cut. Figure 8.1.3 shows that decline in tariff rates in auto-components is accompanied by a rapid growth of this sector, though many had feared that lower protection could harm this sector. Similarly, automobile sector has also been growing as discussed in Chapters 2 and 3. Its demand is partly driven by drop in prices owing to customs and excise cuts in auto-components and excise cuts in automobiles, though there are other factors driving production such as rapid income growth and the resultant demand expansion.
Figure 8.1.1: Excise Duty Structure for Automobiles (Excluding Two-/Three-wheelers, in %)
0
5
10
15
20
25
30
35
40
45
1995
-96
1996
-97
1997
-98
1998
-99
1999
-00
2000
-01
2001
-02
2002
-03
2003
-04
2004
-05
2005
-06
2006
-07
2007
-08
CVs MUVs Cars
Source: SIAM (2006), Finance Bill (2007) Note: In 2005-06, excise duty on “small cars” was brought
down to 16 per cent and it remains at the same level till date.
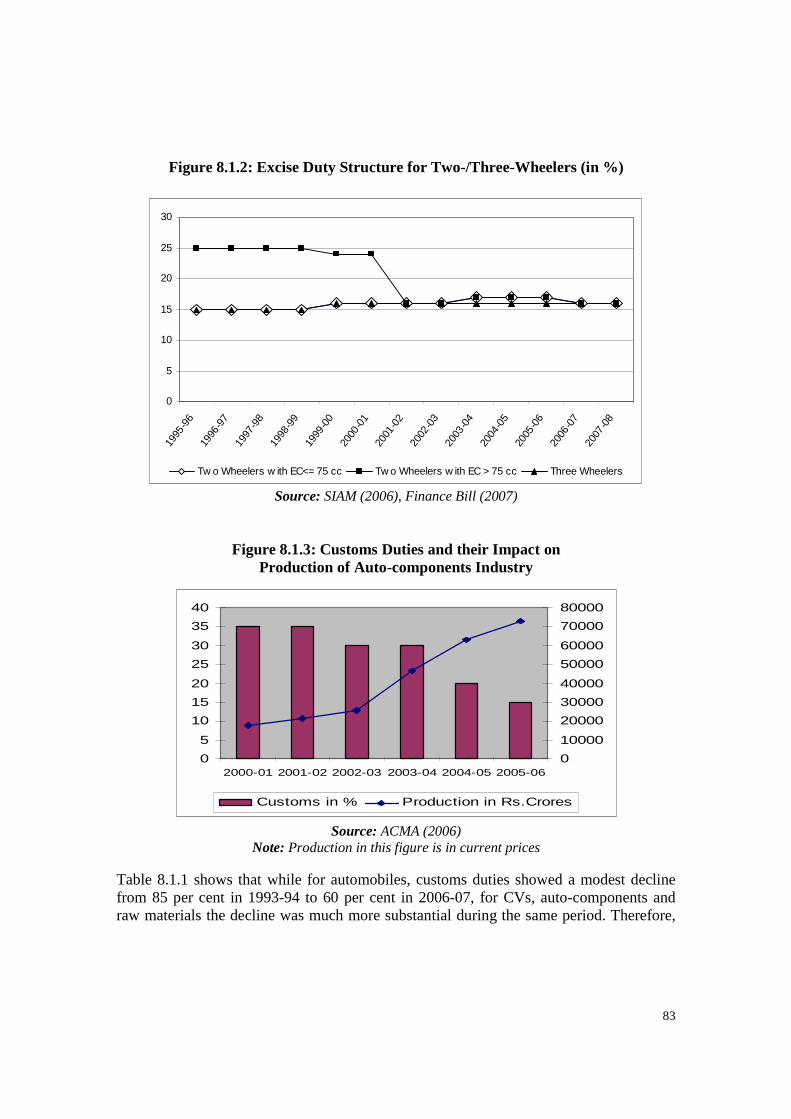
83
Figure 8.1.2: Excise Duty Structure for Two-/Three-Wheelers (in %)
0
5
10
15
20
25
30
1995
-96
1996
-97
1997
-98
1998
-99
1999
-00
2000
-01
2001
-02
2002
-03
2003
-04
2004
-05
2005
-06
2006
-07
2007
-08
Tw o Wheelers w ith EC<= 75 cc Tw o Wheelers w ith EC > 75 cc Three Wheelers
Source: SIAM (2006), Finance Bill (2007)
Figure 8.1.3: Customs Duties and their Impact on
Production of Auto-components Industry
Source: ACMA (2006) Note: Production in this figure is in current prices
Table 8.1.1 shows that while for automobiles, customs duties showed a modest decline from 85 per cent in 1993-94 to 60 per cent in 2006-07, for CVs, auto-components and raw materials the decline was much more substantial during the same period. Therefore,
0
5
10
15
20
25
30
35
40
2000-01 2001-02 2002-03 2003-04 2004-05 2005-060
10000
20000
30000
40000
50000
60000
70000
80000
Customs in % Production in Rs.Crores
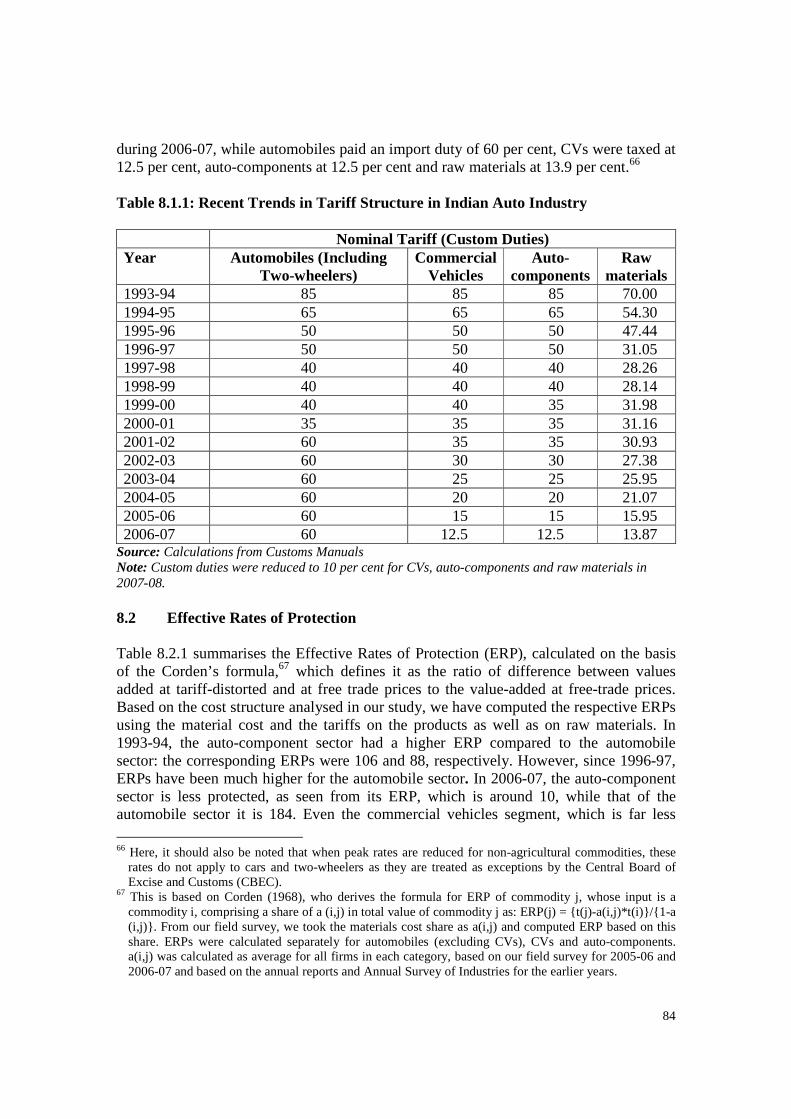
84
during 2006-07, while automobiles paid an import duty of 60 per cent, CVs were taxed at 12.5 per cent, auto-components at 12.5 per cent and raw materials at 13.9 per cent.66 Table 8.1.1: Recent Trends in Tariff Structure in Indian Auto Industry Nominal Tariff (Custom Duties) Year Automobiles (Including
Two-wheelers) Commercial
Vehicles Auto-
components Raw
materials 1993-94 85 85 85 70.00 1994-95 65 65 65 54.30 1995-96 50 50 50 47.44 1996-97 50 50 50 31.05 1997-98 40 40 40 28.26 1998-99 40 40 40 28.14 1999-00 40 40 35 31.98 2000-01 35 35 35 31.16 2001-02 60 35 35 30.93 2002-03 60 30 30 27.38 2003-04 60 25 25 25.95 2004-05 60 20 20 21.07 2005-06 60 15 15 15.95 2006-07 60 12.5 12.5 13.87
Source: Calculations from Customs Manuals Note: Custom duties were reduced to 10 per cent for CVs, auto-components and raw materials in 2007-08. 8.2 Effective Rates of Protection Table 8.2.1 summarises the Effective Rates of Protection (ERP), calculated on the basis of the Corden’s formula,67 which defines it as the ratio of difference between values added at tariff-distorted and at free trade prices to the value-added at free-trade prices. Based on the cost structure analysed in our study, we have computed the respective ERPs using the material cost and the tariffs on the products as well as on raw materials. In 1993-94, the auto-component sector had a higher ERP compared to the automobile sector: the corresponding ERPs were 106 and 88, respectively. However, since 1996-97, ERPs have been much higher for the automobile sector. In 2006-07, the auto-component sector is less protected, as seen from its ERP, which is around 10, while that of the automobile sector it is 184. Even the commercial vehicles segment, which is far less
66 Here, it should also be noted that when peak rates are reduced for non-agricultural commodities, these
rates do not apply to cars and two-wheelers as they are treated as exceptions by the Central Board of Excise and Customs (CBEC).
67 This is based on Corden (1968), who derives the formula for ERP of commodity j, whose input is a commodity i, comprising a share of a (i,j) in total value of commodity j as: ERP(j) = {t(j)-a(i,j)*t(i)}/{1-a (i,j)}. From our field survey, we took the materials cost share as a(i,j) and computed ERP based on this share. ERPs were calculated separately for automobiles (excluding CVs), CVs and auto-components. a(i,j) was calculated as average for all firms in each category, based on our field survey for 2005-06 and 2006-07 and based on the annual reports and Annual Survey of Industries for the earlier years.
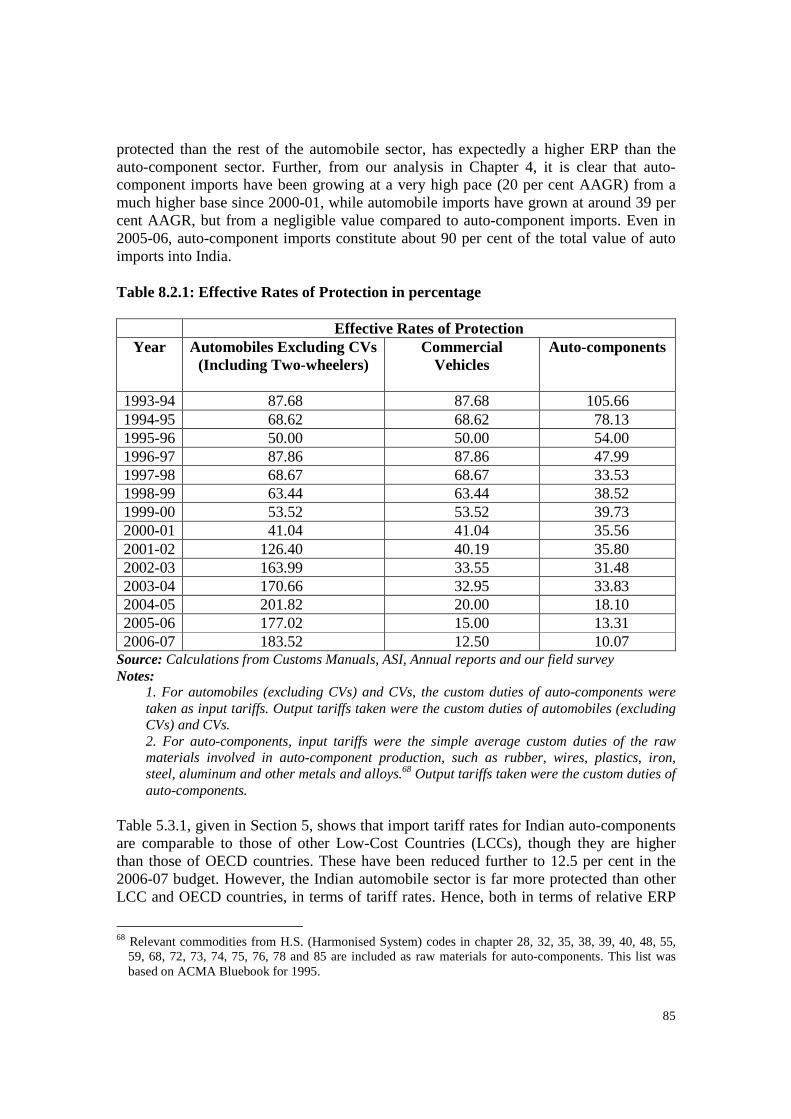
85
protected than the rest of the automobile sector, has expectedly a higher ERP than the auto-component sector. Further, from our analysis in Chapter 4, it is clear that auto-component imports have been growing at a very high pace (20 per cent AAGR) from a much higher base since 2000-01, while automobile imports have grown at around 39 per cent AAGR, but from a negligible value compared to auto-component imports. Even in 2005-06, auto-component imports constitute about 90 per cent of the total value of auto imports into India.
Table 8.2.1: Effective Rates of Protection in percentage
Effective Rates of Protection
Year Automobiles Excluding CVs (Including Two-wheelers)
Commercial Vehicles
Auto-components
1993-94 87.68 87.68 105.66 1994-95 68.62 68.62 78.13 1995-96 50.00 50.00 54.00 1996-97 87.86 87.86 47.99 1997-98 68.67 68.67 33.53 1998-99 63.44 63.44 38.52 1999-00 53.52 53.52 39.73 2000-01 41.04 41.04 35.56 2001-02 126.40 40.19 35.80 2002-03 163.99 33.55 31.48 2003-04 170.66 32.95 33.83 2004-05 201.82 20.00 18.10 2005-06 177.02 15.00 13.31 2006-07 183.52 12.50 10.07
Source: Calculations from Customs Manuals, ASI, Annual reports and our field survey Notes:
1. For automobiles (excluding CVs) and CVs, the custom duties of auto-components were taken as input tariffs. Output tariffs taken were the custom duties of automobiles (excluding CVs) and CVs. 2. For auto-components, input tariffs were the simple average custom duties of the raw materials involved in auto-component production, such as rubber, wires, plastics, iron, steel, aluminum and other metals and alloys.68 Output tariffs taken were the custom duties of auto-components.
Table 5.3.1, given in Section 5, shows that import tariff rates for Indian auto-components are comparable to those of other Low-Cost Countries (LCCs), though they are higher than those of OECD countries. These have been reduced further to 12.5 per cent in the 2006-07 budget. However, the Indian automobile sector is far more protected than other LCC and OECD countries, in terms of tariff rates. Hence, both in terms of relative ERP
68 Relevant commodities from H.S. (Harmonised System) codes in chapter 28, 32, 35, 38, 39, 40, 48, 55,
59, 68, 72, 73, 74, 75, 76, 78 and 85 are included as raw materials for auto-components. This list was based on ACMA Bluebook for 1995.
86
in the domestic economy and in comparison with other economies, the automobile assembly industry can be seen as enjoying high levels of protection when the value- addition in this segment of the automobile production chain is perhaps the lowest when compared to any other stage in the production chain. 8.3 Conclusions • Effective rate of protection of the automobile sector is much higher than that of the
auto-component sector. Net automobile exports are much higher than net auto-component exports, showing that the automobile sector been relatively more competitive over the years. Further, the auto-component sector has higher employment-generation potential and export intensity than the automobile sector. Hence, to remove the policy bias resulting from this situation, the tariff on automobiles could be brought down to levels comparable to that of auto-components.
• Partial excise cut for small cars, which was done in 2006-07, is expected to have adverse effects on other car segments and hence tax incentives based on the degree of localisation should replace the current system of differential treatment of automobile segments.
87
9. Econometric Analysis: Policies and Strategies In this Chapter, some econometric techniques have been employed to analyse the determinants of technical efficiency, cost-competitiveness and market share of auto firms. The objectives of this exercise are to formulate policy proposals for the government and strategies for the industry to improve the competitiveness of the Indian auto industry. The methodology used and data sources are elucidated in Appendix 4. A separate section on conclusions is included at the end of this chapter, in order to summarise the major findings of this exercise that are relevant for policy formulations.
9.1 Technical Efficiency and its Determinants: Stochastic Frontier Analysis Though the methodology is explained at length in Appendix 4, it is worthwhile to briefly explain some technical points here. In simple terms, technical efficiency, as measured by a method called stochastic frontier analysis, refers to the extent to which a firm is able to make the best use of its inputs that include materials, fuel, capital and labour. This is measured in relation with a best-performing firm in each year. The best-performing firm is said to operate on the ‘production frontier’, which is stochastic in the sense that it can be measured only with some error. When we measure technical efficiency, we can factor in its possible determinants and their impacts on it. For this exercise, we have included all possible determinants of technical efficiency, including those mentioned in the literature reviewed in Chapter 1. Table 9.1.1 shows the results of this estimation for automobile firms, using CMIE Prowess data from 1988-89 to 2005-06.69 Following are the inferences from this exercise, for automobile firms: • Market share, as defined by the ratio of sales turnover to the total sales turnover of the
segment, has a significant efficiency-enhancing effect, showing the positive relationship between scale and efficiency. So, any attempt to scale up, through mergers, acquisitions or consolidation of plants will prove useful in enhancing efficiency.
• Share of emoluments in total costs also has a significant positive effect on technical efficiency. This could be an indication of the fact that firms are able to go for a higher wage structure, by enhancing the overall operational efficiency of the workers. It is also possible that wages are increased to raise the efficiency levels of workers, thereby contributing to overall technical efficiency.
• Share of taxes in total costs, however, is significantly harmful for efficiency. Thus tax reforms that are expected to be implemented in India in the near future could go a long way in enhancing efficiency if they reduce overall tax burden.
• Capacity utilisation70 has a significant positive effect on technical efficiency. Hence, firms could enhance their efficiency by fully utilising their capacities.
69 For the analysis explained in 9.1 and 9.2, the kind of data used is panel data, which includes variables for
cross-section of firms over some years. 70 In this analysis, we measured capacity utilisation of a firm for a given year, as a ratio of the capital
productivity of that firm for that year, to its maximum capital productivity in the entire time period considered.
88
• Repair costs as a share of total costs are efficiency-retarding. Hence, careful operations that minimise the need for repairs could enhance efficiency.71
• Fuel and power expenses as a fraction of total costs have a significant negative effect on technical efficiency. This calls for efficient technologies that use less fuel and consume less power.
• Share of borrowings in total investment has a significant and negative effect on technical efficiency. One way of interpreting this result could be that the inefficiencies in credit market, if any, could get transferred to the firms if they depend more on credit for investments. This could be in terms of high interest rates and delay in credit disbursement.
• Inventory cost share has a significant negative impact on technical efficiency. Thus, the concepts of lean manufacturing and total productive manufacturing are efficiency-enhancing, as long as they minimise inventory stocks.
• Equity share of foreign promoters has a significant positive effect on technical efficiency. In other words, MNCs’ subsidiaries/collaborations in India are more technically efficient than Indian firms. Thus, more FDI could be encouraged by the government, while industry could look for more foreign collaborations.
• The share of R&D expenses in total costs72 is efficiency-enhancing, while that of R&D capital expenses in total investment,73 in interaction with share of imported stores and spares, is much more efficiency-enhancing, as inferred from the respective coefficients. This is perhaps because of the fact that some high-technology machineries and parts that are required for R&D are not available in India and need to be imported whenever R&D facilities are expanded. At the same time, share of R&D capital expenses in total investment, in isolation, is not conducive for enhancing efficiency. Hence, R&D capital expenditure is useful only when it is supported by required imports of stores and spares, while R&D expenditure can always enhance efficiency.
• As shown by the significant time coefficient, technical efficiency has been increasing over time, on an average, in this sector.
Table 9.1.2 shows the results of Stochastic Frontier Analysis using CMIE Prowess data for 22674 auto-component firms from 1988-89 to 2005-06. Some of the results are similar to those seen for automobile firms: positive effect of capacity utilisation, negative effect
71 If machinery and equipment is not repaired in time, it could diminish efficiency. Hence, this inference
cannot be taken to conclude that repair cost should be merely minimised, but damages that result in repair could be reduced, by careful operations.
72 R&D expenses in total costs or R&D expenses on current account are the regular expenses incurred on R&D such as maintenance of R&D equipments, training of R&D employees, purchase of research reports, journals and books, etc.
73 R&D capital expenses in total investment, or R&D expenses on capital account, are the periodic expenses incurred on R&D, which are a part of capital expenditure of the firm, such as purchase of testing equipments for R&D division.
74 About 60 per cent of these are Tier-1 firms, while 25 per cent are Tier-2 firms. The remaining 15 per cent act both as Tier-1 and Tier-2 firms for different customers. For example, a firm that supplies to OEM (Tier-1) may also supply to another Tier-1 firm in India or abroad (Tier-2). So, a firm can be Tier-1 and Tier-2 at the same time.
89
of fuel cost share and positive effect of equity share of foreign promoters. The other results, which are different from those mentioned for automobile firms, are as follows: • Emolument cost share has a negative effect on technical efficiency. This indicates
that, in the auto-component sector, wage cost pressure is a concern for technical efficiency. Currently, they may be competitive because of lower wages, but further wage growth may lead to increase in emolument share in total costs and hence affect technical efficiency.
• Unlike the automobile sector, tax cost share has a positive effect on efficiency in the auto-component sector. Probably, with higher tax pressure, auto-component firms become more efficient, so that they are able to cut other costs. This finding is also consistent with our discussion with a leading component producer and exporter based in Gurgaon, who mentioned that price cuts are enforced for auto-component firms every year by their buyers without factoring in the changes in tax structure, forcing them to minimise the costs by increasing the efficiency even if tax rates rise.
• Profit’s share in sales is significantly efficiency-enhancing. Hence, profitability goes hand in hand with efficiency in the auto-component sector.
• Another striking difference to be noted herein is that technical efficiency has declined over the years in the auto-component sector, as indicated by the positive sign on the coefficient of ‘time’. This observation is further confirmed by Figure A5.3, which shows that there has been almost persistent fall in technical efficiency till the late 1990s, after which it has improved, but has again declined in 2005-06. Thus, the auto-component firms need to frame their strategies in such a way as to enhance efficiency.
9.2 Determinants of Cost Competitiveness: Panel Data Analysis In order to examine the cost competitiveness of Indian auto firms, the ratio of total cost75 to total sales is taken as the dependent variable, expressed as a linear function of various possible determinants. Cost: sales ratio gives a fair idea of cost-competitiveness, because if a firm A has a higher ratio than another firm B, the former spends more for selling the same level of output as the latter, and hence is less cost-competitive than the latter. For this analysis, the panel data used in Section 9.1 was employed again. The methodology was Feasible Generalised Least Squares (FGLS) for panel data, with heteroskedastic panels.76 Table 9.2.1 shows the results of this analysis, for automobile firms. The following are the main inferences from this analysis: • Shares of emoluments and taxes (on materials and components used by OEMs) in
total costs have significant positive effects on cost-sales ratio, indicating that both of these play a significant role in building cost pressures.
• Capacity utilisation and better maintenance, as represented by maintenance cost share, have significant cost-reducing effects.
75 This is a sum of cost of production, selling cost, cost of sales, administrative and other costs. 76 This was chosen because of the possible existence of heterogeneity of the data points in the analysis
owing to diversity across both time and firms. Standard econometric textbooks such as Baltagi (1995) explain about panel data techniques, such as these, in detail.
90
• Inventory cost share has a positive effect on cost. Hence, excessive production is expensive and erodes cost-competitiveness.
• Both borrowings-investments ratio and interest payments’ share in total costs have significant cost-hiking effects, which reaffirms our earlier finding that cost of credit is an important constraint for the industry.
• Though most of the R&D-related variables are insignificant, share of imported know-how expenses has a cost-reducing effect.
• Two-/three-wheeler manufacturers, on an average, have a cost: sales ratio that is significantly higher than others, as inferred from the significant positive coefficient of the dummy variable that takes a value of 1 if the firm is a two-/three-wheeler manufacturer.
Table 9.2.2 reveals that the determinants of cost: sales ratio are different for auto-component manufacturers in India. Capacity utilisation, maintenance cost share, interest cost share and inventory cost share are the only determinants that have similar effects on cost-sales ratio in auto-component firms, as they have for OEMs. The following are the brief inferences from this table: • Share of taxes (on materials used by component manufacturers) in total costs has a
significant negative effect on cost-sales ratio, perhaps because of the pressure to cut costs across the board when tax rises, for auto-component industry. This is possible because the price cuts expected by OEMs, from auto-component manufacturers, are generally adjusted only for rises in raw material and exchange rates77 and hence with tax hikes, the firm has to undergo aggressive cost reduction. Similar argument could hold true for the significant cost-reducing effect of power cost share.
• The ratios of exports to total value of output has a significant negative effect on cost-sales ratio, which means that firms probably learn to reduce costs by exporting more, since the international markets are more competitive and survival requires immensely cost-efficient production. This could be taken to suggest that firms could become more export-oriented to cut their costs.
• The observation that borrowings as a fraction of capital, has a significant negative effect on cost: sales ratio, could be taken to suggest that better credit availability could go a long way in reducing costs as the firms could invest more on low-cost-enabling technologies. This result is different from that of OEMs, where more borrowings enhance cost: sales ratio due to high cost of credit.
• Advertising cost share has a negative effect on cost-sales ratio. This is perhaps due to the possibility that better advertising and brand image creation could go a long way to increase sales, in relation to costs, thereby reducing cost-sales ratio.
• The combination of R&D cost share and equity share of foreign promoters has a significant positive effect on cost-sales ratio. This could be more attributable to the fact that MNC firms with higher R&D share are more likely to focus on high-technology and/or luxury segments, which are more expensive to produce than the normal ones and have lower demand, and hence, lower sales.
• A significant positive coefficient on time is interesting, because it means that cost-sales ratio has increased over the years. This could mean that costs increase when
77 This observation is based on our Field Survey Analysis.
91
new value-added products, in terms of technology and quality, are launched over time.
9.3 Determinants of Market Shares In order to examine the competitiveness of Indian auto firms, the ratio of sales turnover of the company in its segment to total sales in that segment is taken as the dependent variable, expressed as a linear function of various possible determinants. For this, the panel data used in Section 9.1 was employed again. The methodology was FGLS for Panel Data, with heteroskedastic panels. Table 9.3.1 shows the results of this analysis, for automobile firms. Following are the main inferences from this analysis: • Costs: sales ratio has a significant positive impact on market share. This could be
attributable to the fact that firms that manufacture high-value items are likely to have a higher market share, since their sales, in value terms, could be higher than others.
• Emolument share has a negative effect on market share, showing that labour cost constraints can distort a firm’s competitiveness.
• Export: sales ratio has a significant positive effect on market share, implying that export-oriented firms are more competitive, perhaps because of their versatility and other merits that are required for catering to international markets.
• Power/fuel cost share has a significant negative effect on market share, implying that efficient technologies may go a long way in improving the firm’s competitiveness.
• Imported material expense’s share in total material expenses has a negative significant impact on market share, indicating that import of auto-components from abroad does not guarantee competitiveness of the firms, unless it is an item that is unavailable in Indian industry.78
• Borrowings’ share in total investments and interest’s share in total costs have negative significant effect on market-share, which means that too much dependence on credit may adversely affect a firm’s competitiveness. This also calls for improvements in credit system and its cost in India.
• Inventory cost share significantly distorts competitiveness, and hence, firms following lean manufacturing are more likely to be competitive than others.
• Share of imported know-how expenses in overall is competitiveness-enhancing, and hence, firms could aggressively go for importing know-how that is required for various aspects of production, so as to be more competitive.
• Advertising costs as a share of total costs, has a significant negative effect on market-share, implying that unless the structural factors such as price and quality are good, mere propaganda by advertising may in fact turn harmful for market share.79
• While royalty cost share and interaction between R&D Capital Expenditure Share and Imported Capital Goods Share have significant negative impacts on market share, the
78 For example, if many parts of a car are imported, the after-sales service will be affected because those
parts may not be easily available in India. Thus, too much of dependence on imports erodes a firm’s competitiveness.
79 A similar observation, on harmful propaganda, was made by a leading car manufacturer covered in our field survey.
92
interaction term between R&D Capital Expenditure Share and Imported Know-how Share has a significant positive effect on market share. This reiterates the earlier observation that imported know-how expenses can enhance competitiveness. This also indicates that capital expenditure on R&D could be effective in enhancing market-share, only if some relevant know-how is imported. R&D expenses on current account as a share of total costs has a positive and significant effect on market-share, showing that in-house R&D also plays a vital role in determining the firm’s competitiveness.
• Negative significant coefficient on ‘time’ shows that over the years market shares have significantly fallen, on an average, perhaps due to fall in market concentration, discussed in an earlier section.
Table 9.3.2 shows the results for an identical analysis done for auto-component firms. The determinants that have same effects as those for automobile firms are: emolument cost share, power/fuel cost share, imported material share, borrowings and interest shares, advertising cost share, royalty cost share and time. Other inferences are outlined below: • Tax cost share has a significant positive effect on market-share. This could be due to
the fact that bigger players are taxed more heavily than smaller ones. • Capacity utilisation and maintenance cost share have significant positive effects on
market share. • Export share has a significant negative effect on market-share. This could be taken to
indicate that exporting firms are relatively smaller, perhaps due to the versatility and flexibility that they possess.
• Share of investments abroad in total investments has a significant positive effect on market share, implying that the auto-component firms that invest abroad aggressively are more competitive.
• Subsidies share has a significant positive effect on market-share, indicating that incentives from the government enhance the competitiveness of the auto-component firms.
• Equity share of foreign promoters has a positive significant effect on market-share, indicating that foreign-promoted firms are more competitive in auto-component sector.
• Share of imported capital-goods has a positive significant effect on market-share and this probably indicates the fact that imported machinery are superior to domestic ones, in terms of efficiency and hence, the firms that use more of them are more competitive.
• Share of R&D expenses (on current account) in total costs is significantly competitiveness-enhancing only in interaction with equity share of foreign promoters and imported material share. This means that R&D efforts should be supplemented with foreign collaboration and import of relevant raw materials of superior quality, in order to improve firm competitiveness.
Table 9.3.3 examines other determinants of market shares of auto-component firms, using ACMA Buyers’ Guide and ACMA-SMERA80 auto-component SMEs database. This
80 SMERA is the abbreviation of Small and Medium Enterprises Rating Agency.
93
sample consists of 520 firms, covering over 95 per cent of the entire auto-component sector, for the year 2005-06. Hence, this data represents more fully the Indian auto-component sector. The following are the broad inferences of this analysis: • Firms that produce more than one product81 have significantly higher market share
than those that produce just one product. Hence, product diversification enhances competitiveness.
• Higher export turnover is associated with significantly higher market-share. Thus, export-orientation positively influences competitiveness.
• Number of accredits such as ISO 9000 has a significant positive effect on market share. This shows that quality and standards are essential for competitiveness.
• Number of plants has a positive significant effect on market share. This establishes the fact that spatial diversification promotes competitiveness.
• Though foreign equity participation is insignificant in influencing competitiveness, foreign collaboration has a significantly positive effect on market share at all levels. Hence, foreign collaboration enhances competitiveness.
9.4 Implications for Policies and Strategies The following policy implications and strategies those are common to OEMs and auto-component firms emerge from the econometric analysis: • R&D efforts, supported by import of high-technology goods from abroad, are helpful
in enhancing the competitiveness and reducing costs of OEMs and auto-component firms. The import of technologies is already encouraged by the government through lower tariffs. In 2007-08, custom duty on all capital goods, including the machines that are required for the manufacture of automobiles and auto-components has been brought down to 10 per cent in India. In 2003-04, it was 15 per cent in India, while it was mostly in the range of 0-10 per cent in other major auto-producing countries/regions such as the EU (0-3 per cent), the USA (0-4.4 per cent), China (0-10 per cent), Thailand (1-5 per cent) and Indonesia (0-5 per cent). Hence, India’s current levels of tariff on capital goods are markedly higher than in competing countries. These tariffs should be brought down further to enhance competitiveness. In addition, more incentives are required for the firms to increase their R&D efforts. Most of the OEMs and auto-component firms covered in our field survey recognise the importance of R&D in enhancing competitiveness.
• Since exports: sales ratio has a significant positive impact on competitiveness, it is imperative for the government to encourage exports by means of higher Market Development Assistance (MDA) grants82 and by further strengthening the provisions under different promotional schemes83. The most important measure that the government could take is to ensure that the rupee does not appreciate unduly vis-à-vis other currencies. Other tax incentives such as those on octroi, entry taxes, sales tax,
81 This was defined in two ways: different products/product ranges or same products for different
industries, in addition to auto industry. 82 Currently, these are for participation in international fairs and exhibitions, with grants from Rs. 80,000 to
Rs. 1.8 lakh 83The EPCG scheme, run by Export Credit Guarantee Corporation of India (ECGC), guarantees credit to
purchase capital goods with subsidies and insurance, based on export performance of the firm.
94
etc., vary over states and regions. This has to be rectified. In addition, Special Economic Zones (SEZs) can avail other exclusive incentives such as exemptions in almost all taxes and duties, tax holidays for 15 years and world-class infrastructure. The incentives could be given to all those export oriented firms who continuously export more than 50 per cent of their output, irrespective of their location.
• Equity participation by foreign promoters has a positive effect on efficiency. Hence, FDI in auto sector should be encouraged by the government, by creating conducive environment for FDI, mainly in terms of better infrastructure and higher quality of human resources. The protection offered by high custom duties is an inefficient way for attracting FDI as it also results in guaranteed rents for all the players in the particular product segment. Indian firms covered in our field survey recognise the benefits that they are able to derive from foreign firms entering India, in terms of technology and quality.
Following are the policy implications and strategies pertaining to OEMs: • Higher taxes on inputs, especially on capital goods, reduce efficiency and
competitiveness of OEMs. Hence, the government should minimise the tax burden, by reducing imports duties further and by implementing VAT across all states. These measures were also suggested by our field survey respondents.
• OEMs need to improve their capacity utilisation and minimise their inventories, by better market research and a greater focus on exports, since that would provide additional market to absorb inventories and maximise capacity utilisation. Our field survey shows that almost all OEMs operate below their capacities, probably because they generally focus on domestic markets and occasionally over-estimate the demand for their products. This problem could probably be eliminated by undertaking a comprehensive global market research and then focusing on exports.
Following are the policy implications pertaining to auto-component firms: • Share of emolument in total cost has a negative impact on efficiency. Hence, labour
reforms that reduce the labour costs may go a long way in improving efficiency of auto-component firms. This measure is widely supported by our field survey respondents.
• For auto-components, borrowings enhance competitiveness and hence improving credit availability is critically important for auto-components. Smaller auto-component firms covered in our field survey reported that the major constraint for them in scaling up is lack of credit availability.
• Quality and standards have positive significant impacts on competitiveness. Hence, the government should encourage and facilitate the auto-component firms in improving their quality and standards, by means of training programmes. All firms covered in our field survey recognise the importance of quality and standards in being competitive.
• As indicated by both this econometric exercise and our field survey, auto-component firms need to be more proactive, by engaging themselves in foreign collaborations and investments abroad. They could even go for acquisitions abroad, as some firms, which are covered in our field survey, had done successfully to enhance their brand image, technologies and market access.
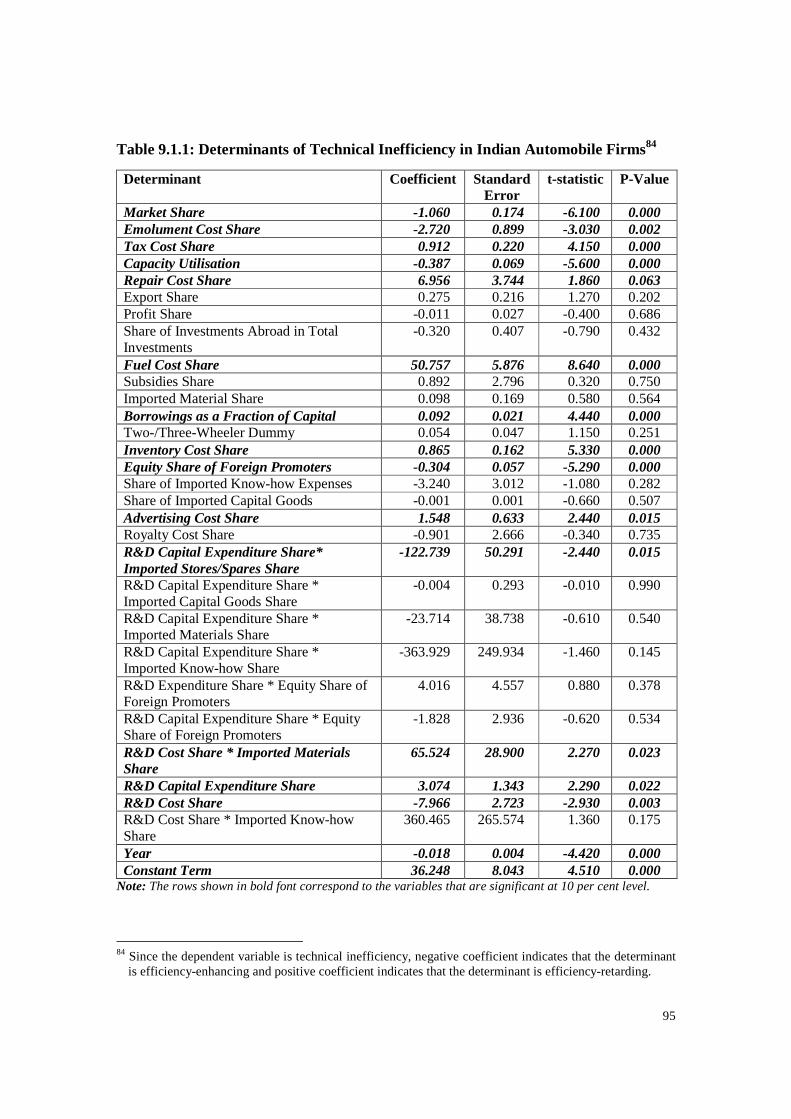
95
Table 9.1.1: Determinants of Technical Inefficiency in Indian Automobile Firms 84
Determinant Coefficient Standard Error
t-statistic P-Value
Market Share -1.060 0.174 -6.100 0.000 Emolument Cost Share -2.720 0.899 -3.030 0.002 Tax Cost Share 0.912 0.220 4.150 0.000 Capacity Utilisation -0.387 0.069 -5.600 0.000 Repair Cost Share 6.956 3.744 1.860 0.063 Export Share 0.275 0.216 1.270 0.202 Profit Share -0.011 0.027 -0.400 0.686 Share of Investments Abroad in Total Investments
-0.320 0.407 -0.790 0.432
Fuel Cost Share 50.757 5.876 8.640 0.000 Subsidies Share 0.892 2.796 0.320 0.750 Imported Material Share 0.098 0.169 0.580 0.564 Borrowings as a Fraction of Capital 0.092 0.021 4.440 0.000 Two-/Three-Wheeler Dummy 0.054 0.047 1.150 0.251 Inventory Cost Share 0.865 0.162 5.330 0.000 Equity Share of Foreign Promoters -0.304 0.057 -5.290 0.000 Share of Imported Know-how Expenses -3.240 3.012 -1.080 0.282 Share of Imported Capital Goods -0.001 0.001 -0.660 0.507 Advertising Cost Share 1.548 0.633 2.440 0.015 Royalty Cost Share -0.901 2.666 -0.340 0.735 R&D Capital Expenditure Share* Imported Stores/Spares Share
-122.739 50.291 -2.440 0.015
R&D Capital Expenditure Share * Imported Capital Goods Share
-0.004 0.293 -0.010 0.990
R&D Capital Expenditure Share * Imported Materials Share
-23.714 38.738 -0.610 0.540
R&D Capital Expenditure Share * Imported Know-how Share
-363.929 249.934 -1.460 0.145
R&D Expenditure Share * Equity Share of Foreign Promoters
4.016 4.557 0.880 0.378
R&D Capital Expenditure Share * Equity Share of Foreign Promoters
-1.828 2.936 -0.620 0.534
R&D Cost Share * Imported Materials Share
65.524 28.900 2.270 0.023
R&D Capital Expenditure Share 3.074 1.343 2.290 0.022 R&D Cost Share -7.966 2.723 -2.930 0.003 R&D Cost Share * Imported Know-how Share
360.465 265.574 1.360 0.175
Year -0.018 0.004 -4.420 0.000 Constant Term 36.248 8.043 4.510 0.000
Note: The rows shown in bold font correspond to the variables that are significant at 10 per cent level. 84 Since the dependent variable is technical inefficiency, negative coefficient indicates that the determinant
is efficiency-enhancing and positive coefficient indicates that the determinant is efficiency-retarding.
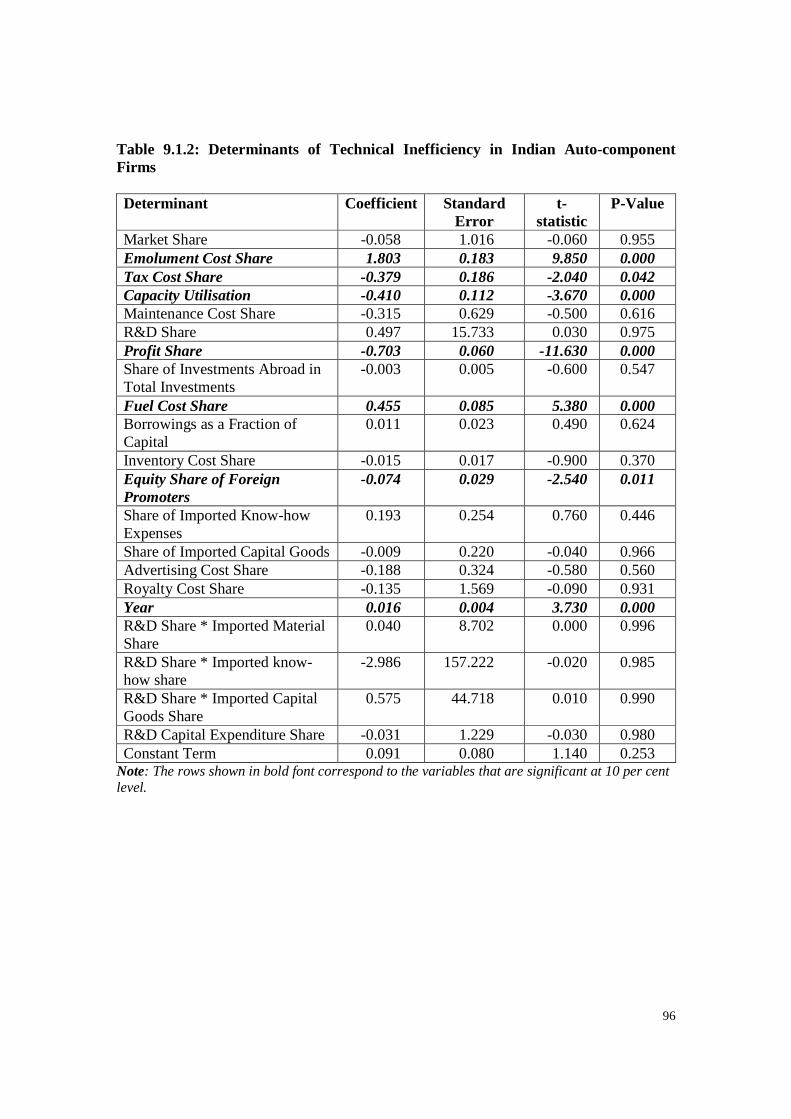
96
Table 9.1.2: Determinants of Technical Inefficiency in Indian Auto-component Firms Determinant Coefficient Standard
Error t-
statistic P-Value
Market Share -0.058 1.016 -0.060 0.955 Emolument Cost Share 1.803 0.183 9.850 0.000 Tax Cost Share -0.379 0.186 -2.040 0.042 Capacity Utilisation -0.410 0.112 -3.670 0.000 Maintenance Cost Share -0.315 0.629 -0.500 0.616 R&D Share 0.497 15.733 0.030 0.975 Profit Share -0.703 0.060 -11.630 0.000 Share of Investments Abroad in Total Investments
-0.003 0.005 -0.600 0.547
Fuel Cost Share 0.455 0.085 5.380 0.000 Borrowings as a Fraction of Capital
0.011 0.023 0.490 0.624
Inventory Cost Share -0.015 0.017 -0.900 0.370 Equity Share of Foreign Promoters
-0.074 0.029 -2.540 0.011
Share of Imported Know-how Expenses
0.193 0.254 0.760 0.446
Share of Imported Capital Goods -0.009 0.220 -0.040 0.966 Advertising Cost Share -0.188 0.324 -0.580 0.560 Royalty Cost Share -0.135 1.569 -0.090 0.931 Year 0.016 0.004 3.730 0.000 R&D Share * Imported Material Share
0.040 8.702 0.000 0.996
R&D Share * Imported know-how share
-2.986 157.222 -0.020 0.985
R&D Share * Imported Capital Goods Share
0.575 44.718 0.010 0.990
R&D Capital Expenditure Share -0.031 1.229 -0.030 0.980 Constant Term 0.091 0.080 1.140 0.253
Note: The rows shown in bold font correspond to the variables that are significant at 10 per cent level.
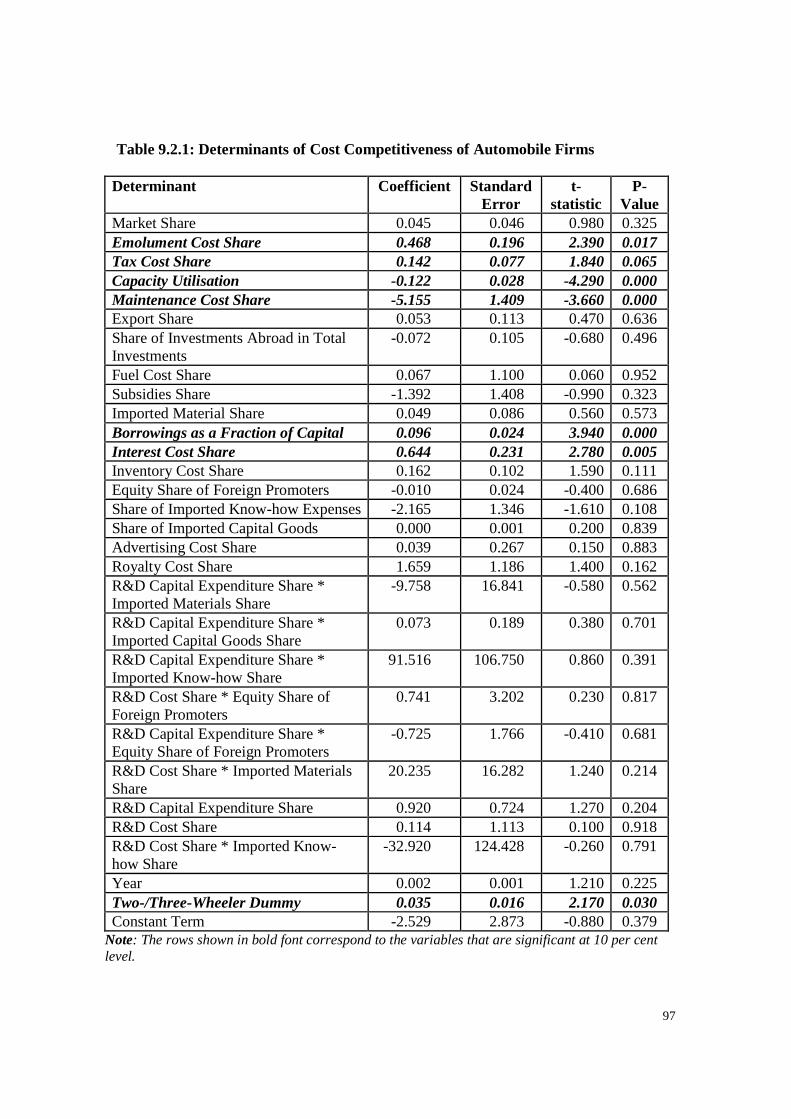
97
Table 9.2.1: Determinants of Cost Competitiveness of Automobile Firms
Determinant Coefficient Standard Error
t-statistic
P-Value
Market Share 0.045 0.046 0.980 0.325 Emolument Cost Share 0.468 0.196 2.390 0.017 Tax Cost Share 0.142 0.077 1.840 0.065 Capacity Utilisation -0.122 0.028 -4.290 0.000 Maintenance Cost Share -5.155 1.409 -3.660 0.000 Export Share 0.053 0.113 0.470 0.636 Share of Investments Abroad in Total Investments
-0.072 0.105 -0.680 0.496
Fuel Cost Share 0.067 1.100 0.060 0.952 Subsidies Share -1.392 1.408 -0.990 0.323 Imported Material Share 0.049 0.086 0.560 0.573 Borrowings as a Fraction of Capital 0.096 0.024 3.940 0.000 Interest Cost Share 0.644 0.231 2.780 0.005 Inventory Cost Share 0.162 0.102 1.590 0.111 Equity Share of Foreign Promoters -0.010 0.024 -0.400 0.686 Share of Imported Know-how Expenses -2.165 1.346 -1.610 0.108 Share of Imported Capital Goods 0.000 0.001 0.200 0.839 Advertising Cost Share 0.039 0.267 0.150 0.883 Royalty Cost Share 1.659 1.186 1.400 0.162 R&D Capital Expenditure Share * Imported Materials Share
-9.758 16.841 -0.580 0.562
R&D Capital Expenditure Share * Imported Capital Goods Share
0.073 0.189 0.380 0.701
R&D Capital Expenditure Share * Imported Know-how Share
91.516 106.750 0.860 0.391
R&D Cost Share * Equity Share of Foreign Promoters
0.741 3.202 0.230 0.817
R&D Capital Expenditure Share * Equity Share of Foreign Promoters
-0.725 1.766 -0.410 0.681
R&D Cost Share * Imported Materials Share
20.235 16.282 1.240 0.214
R&D Capital Expenditure Share 0.920 0.724 1.270 0.204 R&D Cost Share 0.114 1.113 0.100 0.918 R&D Cost Share * Imported Know-how Share
-32.920 124.428 -0.260 0.791
Year 0.002 0.001 1.210 0.225 Two-/Three-Wheeler Dummy 0.035 0.016 2.170 0.030 Constant Term -2.529 2.873 -0.880 0.379
Note: The rows shown in bold font correspond to the variables that are significant at 10 per cent level.
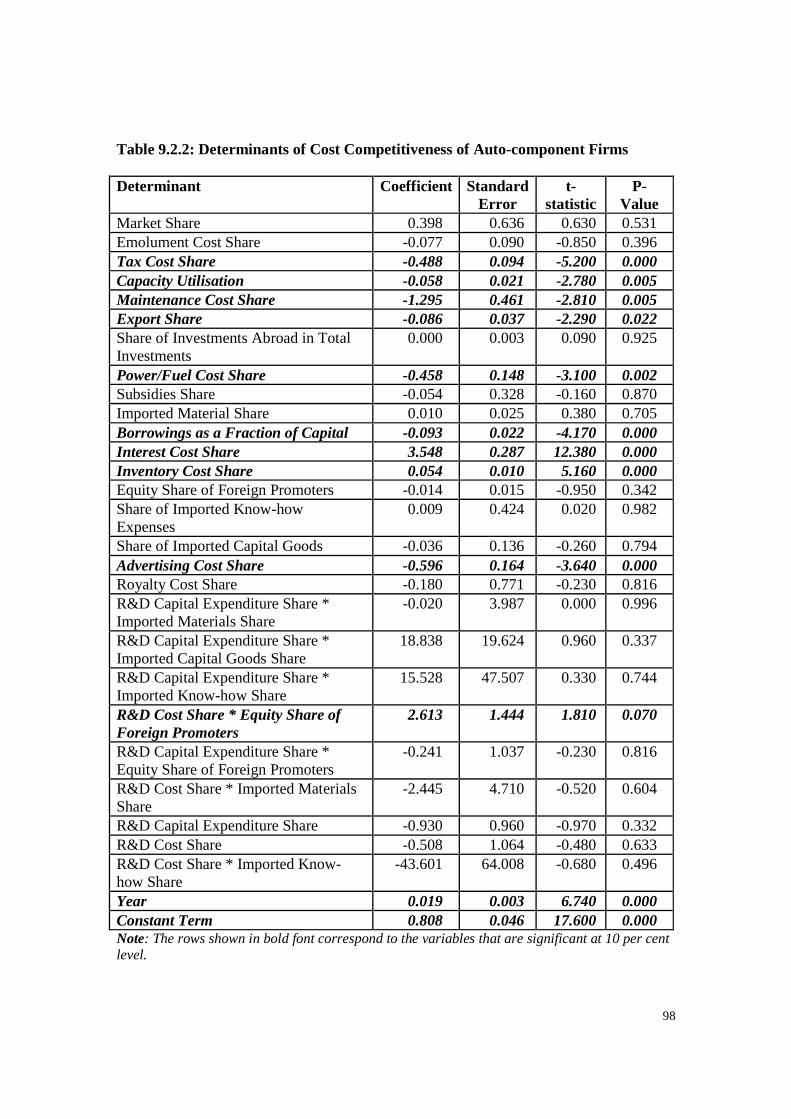
98
Table 9.2.2: Determinants of Cost Competitiveness of Auto-component Firms Determinant Coefficient Standard
Error t-
statistic P-
Value Market Share 0.398 0.636 0.630 0.531 Emolument Cost Share -0.077 0.090 -0.850 0.396 Tax Cost Share -0.488 0.094 -5.200 0.000 Capacity Utilisation -0.058 0.021 -2.780 0.005 Maintenance Cost Share -1.295 0.461 -2.810 0.005 Export Share -0.086 0.037 -2.290 0.022 Share of Investments Abroad in Total Investments
0.000 0.003 0.090 0.925
Power/Fuel Cost Share -0.458 0.148 -3.100 0.002 Subsidies Share -0.054 0.328 -0.160 0.870 Imported Material Share 0.010 0.025 0.380 0.705 Borrowings as a Fraction of Capital -0.093 0.022 -4.170 0.000 Interest Cost Share 3.548 0.287 12.380 0.000 Inventory Cost Share 0.054 0.010 5.160 0.000 Equity Share of Foreign Promoters -0.014 0.015 -0.950 0.342 Share of Imported Know-how Expenses
0.009 0.424 0.020 0.982
Share of Imported Capital Goods -0.036 0.136 -0.260 0.794 Advertising Cost Share -0.596 0.164 -3.640 0.000 Royalty Cost Share -0.180 0.771 -0.230 0.816 R&D Capital Expenditure Share * Imported Materials Share
-0.020 3.987 0.000 0.996
R&D Capital Expenditure Share * Imported Capital Goods Share
18.838 19.624 0.960 0.337
R&D Capital Expenditure Share * Imported Know-how Share
15.528 47.507 0.330 0.744
R&D Cost Share * Equity Share of Foreign Promoters
2.613 1.444 1.810 0.070
R&D Capital Expenditure Share * Equity Share of Foreign Promoters
-0.241 1.037 -0.230 0.816
R&D Cost Share * Imported Materials Share
-2.445 4.710 -0.520 0.604
R&D Capital Expenditure Share -0.930 0.960 -0.970 0.332 R&D Cost Share -0.508 1.064 -0.480 0.633 R&D Cost Share * Imported Know-how Share
-43.601 64.008 -0.680 0.496
Year 0.019 0.003 6.740 0.000 Constant Term 0.808 0.046 17.600 0.000 Note: The rows shown in bold font correspond to the variables that are significant at 10 per cent level.
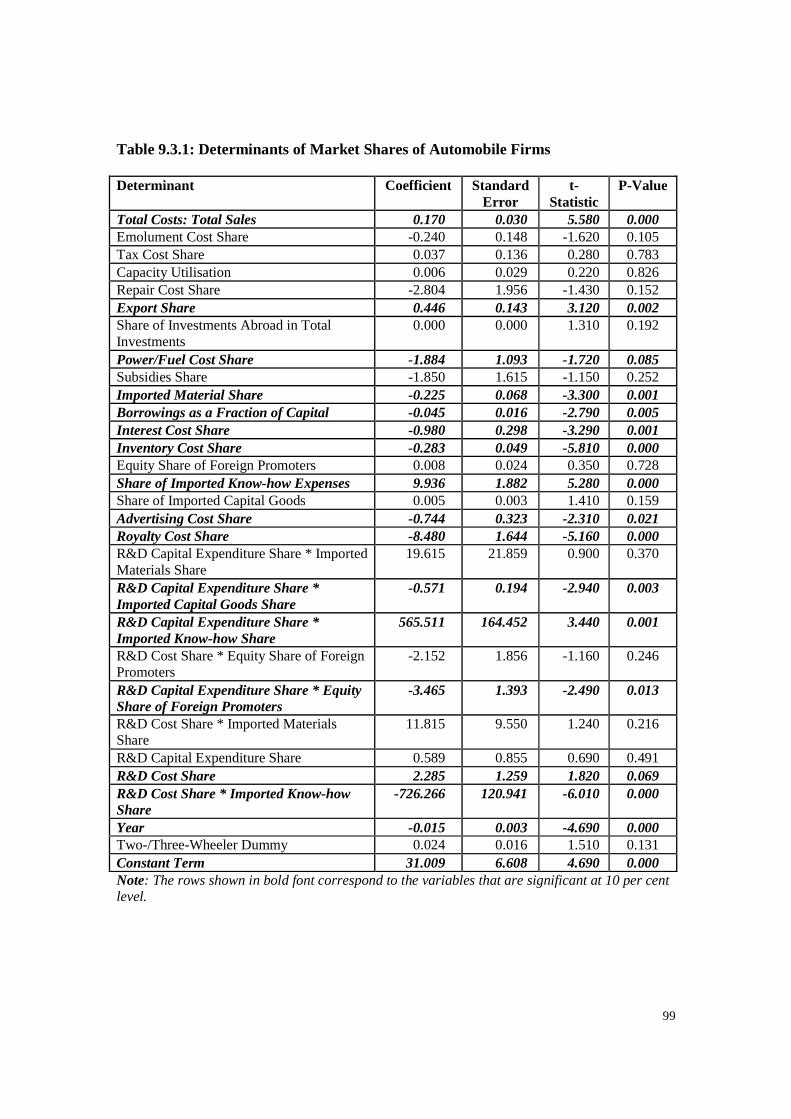
99
Table 9.3.1: Determinants of Market Shares of Automobile Firms Determinant Coefficient Standard
Error t-
Statistic P-Value
Total Costs: Total Sales 0.170 0.030 5.580 0.000 Emolument Cost Share -0.240 0.148 -1.620 0.105 Tax Cost Share 0.037 0.136 0.280 0.783 Capacity Utilisation 0.006 0.029 0.220 0.826 Repair Cost Share -2.804 1.956 -1.430 0.152 Export Share 0.446 0.143 3.120 0.002 Share of Investments Abroad in Total Investments
0.000 0.000 1.310 0.192
Power/Fuel Cost Share -1.884 1.093 -1.720 0.085 Subsidies Share -1.850 1.615 -1.150 0.252 Imported Material Share -0.225 0.068 -3.300 0.001 Borrowings as a Fraction of Capital -0.045 0.016 -2.790 0.005 Interest Cost Share -0.980 0.298 -3.290 0.001 Inventory Cost Share -0.283 0.049 -5.810 0.000 Equity Share of Foreign Promoters 0.008 0.024 0.350 0.728 Share of Imported Know-how Expenses 9.936 1.882 5.280 0.000 Share of Imported Capital Goods 0.005 0.003 1.410 0.159 Advertising Cost Share -0.744 0.323 -2.310 0.021 Royalty Cost Share -8.480 1.644 -5.160 0.000 R&D Capital Expenditure Share * Imported Materials Share
19.615 21.859 0.900 0.370
R&D Capital Expenditure Share * Imported Capital Goods Share
-0.571 0.194 -2.940 0.003
R&D Capital Expenditure Share * Imported Know-how Share
565.511 164.452 3.440 0.001
R&D Cost Share * Equity Share of Foreign Promoters
-2.152 1.856 -1.160 0.246
R&D Capital Expenditure Share * Equity Share of Foreign Promoters
-3.465 1.393 -2.490 0.013
R&D Cost Share * Imported Materials Share
11.815 9.550 1.240 0.216
R&D Capital Expenditure Share 0.589 0.855 0.690 0.491 R&D Cost Share 2.285 1.259 1.820 0.069 R&D Cost Share * Imported Know-how Share
-726.266 120.941 -6.010 0.000
Year -0.015 0.003 -4.690 0.000 Two-/Three-Wheeler Dummy 0.024 0.016 1.510 0.131 Constant Term 31.009 6.608 4.690 0.000 Note: The rows shown in bold font correspond to the variables that are significant at 10 per cent level.
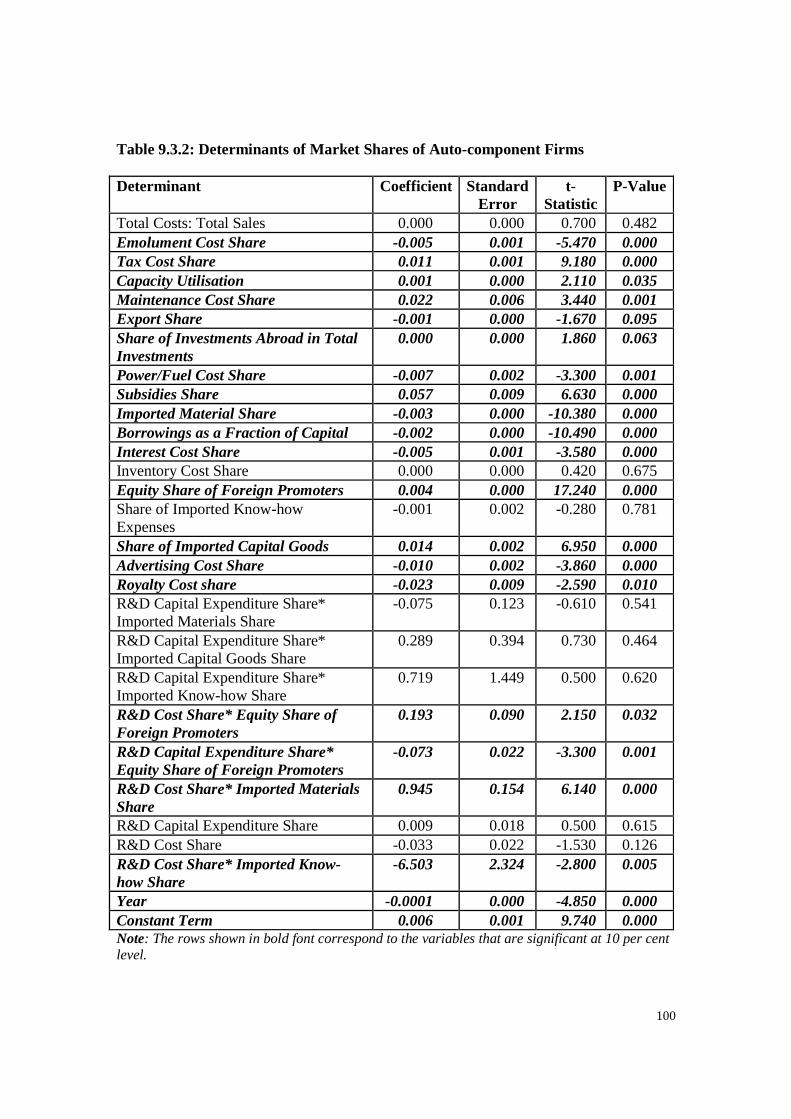
100
Table 9.3.2: Determinants of Market Shares of Auto-component Firms Determinant Coefficient Standard
Error t-
Statistic P-Value
Total Costs: Total Sales 0.000 0.000 0.700 0.482 Emolument Cost Share -0.005 0.001 -5.470 0.000 Tax Cost Share 0.011 0.001 9.180 0.000 Capacity Utilisation 0.001 0.000 2.110 0.035 Maintenance Cost Share 0.022 0.006 3.440 0.001 Export Share -0.001 0.000 -1.670 0.095 Share of Investments Abroad in Total Investments
0.000 0.000 1.860 0.063
Power/Fuel Cost Share -0.007 0.002 -3.300 0.001 Subsidies Share 0.057 0.009 6.630 0.000 Imported Material Share -0.003 0.000 -10.380 0.000 Borrowings as a Fraction of Capital -0.002 0.000 -10.490 0.000 Interest Cost Share -0.005 0.001 -3.580 0.000 Inventory Cost Share 0.000 0.000 0.420 0.675 Equity Share of Foreign Promoters 0.004 0.000 17.240 0.000 Share of Imported Know-how Expenses
-0.001 0.002 -0.280 0.781
Share of Imported Capital Goods 0.014 0.002 6.950 0.000 Advertising Cost Share -0.010 0.002 -3.860 0.000 Royalty Cost share -0.023 0.009 -2.590 0.010 R&D Capital Expenditure Share* Imported Materials Share
-0.075 0.123 -0.610 0.541
R&D Capital Expenditure Share* Imported Capital Goods Share
0.289 0.394 0.730 0.464
R&D Capital Expenditure Share* Imported Know-how Share
0.719 1.449 0.500 0.620
R&D Cost Share* Equity Share of Foreign Promoters
0.193 0.090 2.150 0.032
R&D Capital Expenditure Share* Equity Share of Foreign Promoters
-0.073 0.022 -3.300 0.001
R&D Cost Share* Imported Materials Share
0.945 0.154 6.140 0.000
R&D Capital Expenditure Share 0.009 0.018 0.500 0.615 R&D Cost Share -0.033 0.022 -1.530 0.126 R&D Cost Share* Imported Know-how Share
-6.503 2.324 -2.800 0.005
Year -0.0001 0.000 -4.850 0.000 Constant Term 0.006 0.001 9.740 0.000 Note: The rows shown in bold font correspond to the variables that are significant at 10 per cent level.
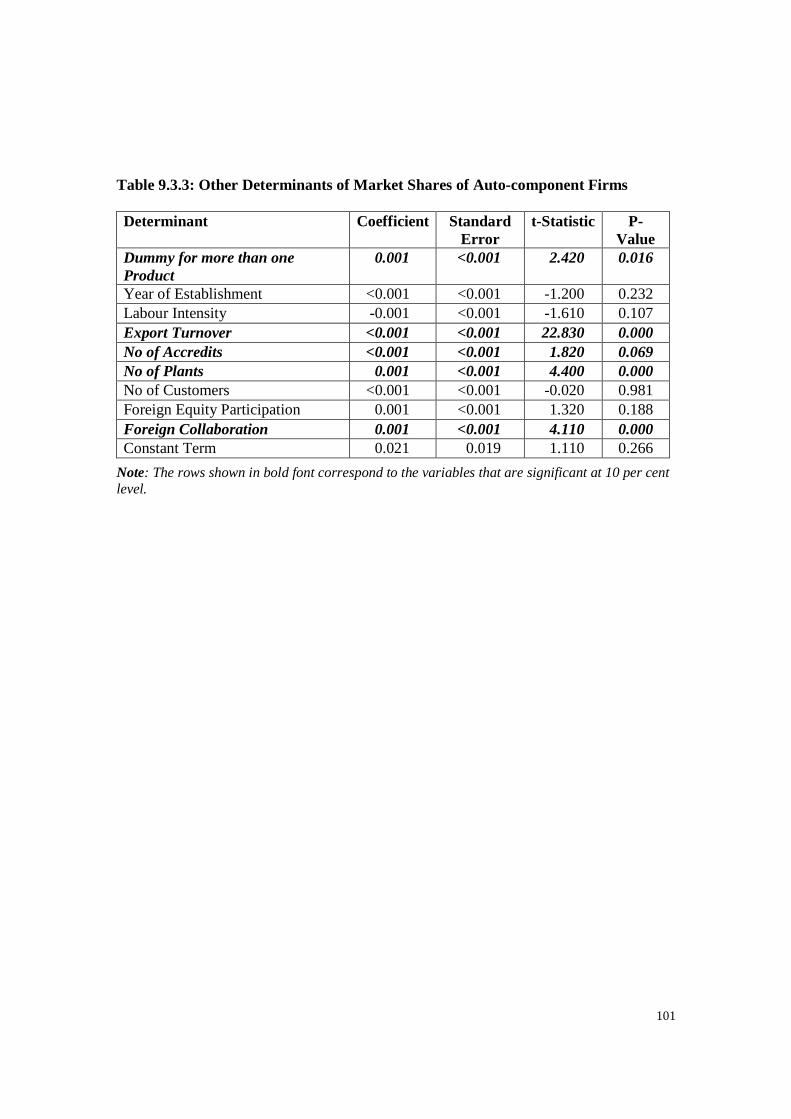
101
Table 9.3.3: Other Determinants of Market Shares of Auto-component Firms Determinant Coefficient Standard
Error t-Statistic P-
Value Dummy for more than one Product
0.001 <0.001 2.420 0.016
Year of Establishment <0.001 <0.001 -1.200 0.232 Labour Intensity -0.001 <0.001 -1.610 0.107 Export Turnover <0.001 <0.001 22.830 0.000 No of Accredits <0.001 <0.001 1.820 0.069 No of Plants 0.001 <0.001 4.400 0.000 No of Customers <0.001 <0.001 -0.020 0.981 Foreign Equity Participation 0.001 <0.001 1.320 0.188 Foreign Collaboration 0.001 <0.001 4.110 0.000 Constant Term 0.021 0.019 1.110 0.266
Note: The rows shown in bold font correspond to the variables that are significant at 10 per cent level.
102
10. Policy Recommendations The following are some policy recommendations that emerge from this study:
•••• The auto-component sector has much higher employment-generation potential and export-intensity, but it is still far less protected than the automobile sector. Effective rate of protection on automobiles is much higher than on components. During 2006-07, while nominal custom duties were 60 per cent for automobiles (other than commercial vehicles), 12.5 per cent for commercial vehicles and 12.5 per cent for auto-components, effective rates were 183.5 per cent, 12.5 per cent and 10.1 per cent, respectively. This implies that effective rate of protection to automobiles is much higher than that indicated by nominal rates. Therefore, to remove the policy bias inherent in such a situation, import tariffs for the automobile segment should be gradually brought.
•••• There are three preconditions for lowering the import tariffs for passenger cars
and two-wheelers. First, our macro-economic policy should be managed in such a way that the domestic currency does not appreciate against our major competing countries. Second, the infrastructure deficit, which has emerged as one of the most critical constraints for capacity expansion, should be addressed as quickly as possible. Third, further liberalisation should be done on the understanding that firms from non-market economy countries or those using non-transparent pricing mechanism will not dump their exports in the Indian market. It will also be advisable to ensure reciprocal market access in ASEAN and Chinese markets for our products when our import tariffs are being reduced.
•••• Since material cost is the major component of production cost and its share has
been increasing in recent years, policy measures to reduce the indirect taxes on all inputs to the auto industry could be a welcome step to enhance competitiveness.
•••• The firm-level survey indicates that significant scaling up is required at all levels
in the Indian auto-component sector. Our econometric analysis also indicates that scaling up is desirable for firms since scale has a positive effect on the performance of the firm, in terms of efficiency and cost reduction. While, most of the bigger Tier-1 players continue to expand, one of the major constraints for the smaller auto-component manufacturers in increasing their scales of production is lack of credit availability at interest rates comparable to other countries. Hence, measures are required to improve credit access to auto-component manufacturers, especially the smaller ones, at rates comparable to those in other competing low cost countries in the auto industry. Another constraint that impedes scaling up is lack of human resources, which needs to be solved by better training facilities all over India.
•••• R&D expenditure as a share of turnover is low in the Indian auto-component
sector ranging between 0 and 1.5 per cent, while it is 0.5-3 per cent in the automobile sector. In fact, most of the smaller auto-component firms and a few of the bigger ones do not have an R&D facility, nor do they plan to spend on R&D
103
in future. In the age of rapidly emerging and changing technologies, R&D is the key for successful business, and trends in the Indian auto sector in this regard do not appear to be encouraging. Policy intervention is urgently needed to improve the R&D activities in the auto industry. Since fiscal incentives are not working, a scheme of special credit for R&D would be useful to incentivise the R&D activities.
•••• Our main competitors in the auto industry have lower tariffs on capital goods,
with Indian import duties being higher than those in ASEAN and China in 2003-04. Thus, these tariffs should be brought down further to 0-5 per cent to enhance competitiveness.
•••• Despite lower real (productivity adjusted) wages received by contract workers,
they cannot contribute much to the industry’s long-term performance. Hence, labour reforms, aimed at more flexibility are widely considered among the industrialists as an essential step. This will encourage firms to employ and retain more permanent workers. This is also expected to increase overall employment in the auto sector through higher labour intensity.
•••• The unorganised sector contributes 30 per cent to total employment, 15 per cent to
capital and 1.5 per cent to output in the domestic auto industry. This sector has much lower capital and labour productivity than the organised sector. Share of power/fuel cost in total costs are much higher in the unorganised sector. Hence, policy measures are required to incentivise these smaller firms to use power and fuel more efficiently, by adopting better technologies and taking steps to minimise wastage of power/fuel.
•••• Indian auto industry does not possess good design facilities. The government
needs to significantly strengthen non-proprietary R&D and design capacity that can be undertaken with research institutes like the IITs. This could be used by all the players in the industry to develop new models, reduce material costs and become more competitive.
•••• To solve the emerging problem of skill shortages and skill mismatches, training
capacities and vocational skill development capacities need to be developed urgently. The proposed National Automotive Institute85 should be quickly established with active participation of private industry players. Industry also lacks skilled and efficient management professionals, which is one of the constraints for many firms to scale up their operations. This problem also needs to be addressed, by both industry and the government, by organising world-class management training programmes.
85 National level Automotive Institute for training on automobile has been proposed in Automotive Mission
Plan This should preferably be established in all major auto hubs in India. In addition to regular long-term courses such as diploma and degree, it should also provide short-term specialised training programmes for the personnel already working in the auto industry.
104
• Foreign firms have better technical performance (even though their share of R&D expenses in total costs is low); higher share of emoluments in total costs,86 higher exports as a share of sales; and lower inventory expenses in total costs. Hence, they should be encouraged by the government. Role of the government should be in terms of infrastructure development and human resources development, which create a conducive environment for FDI and not in terms of tax differentials across states.87 This would not only result in healthy competition in the Indian industry, but would also help in lifting it up to the global standards. At the same time, tendency of these firms to import from their supplier base abroad could be reduced if Indian auto-component firms increase their scale of production and strike joint ventures with foreign firms.
• Inventory growth has been high for most of the Indian auto companies over the
years, which is probably a reason for the fall of real income-adjusted prices of automobiles in India.88 Industry needs to focus on segments with increasing demand, such as motorcycles with medium engine capacity and compact cars, by engaging in intensive market research. The government could be helpful to the industry in general and the auto-component sector in particular, by conducting regular dialogue with the industry about policies and FTAs, so that they are apprised of the latest developments, which are to be keyed in their production strategies.
• Emission norms need to be harmonised across states. In addition, a detailed
roadmap needs to be drawn and strictly implemented. This would help the entire automotive supply chain to get adjusted in order to comply with the forthcoming standards well in advance.
• Inter-state differences in taxes and incentives should be minimised. While the
implementation of VAT is a positive step, remaining differential in indirect taxes should be eliminated by moving to GST. It could reduce and harmonize the tax burden and ensure that industries face little difficulty in inter-state transportation of goods and relocation of industries. This would also encourage firms to focus on factors that are necessary for their long-run sustainability, such as infrastructure and human resources, rather than on region specific-incentives and subsidies offered by certain states.
86 This is true only for the foreign auto-component firms, where wages and salaries are higher, but
emoluments as a share of total costs are lower. For automobile firms, the share of emoluments does not seem to have any relationship with foreign equity share.
87 If the states follow different taxes, the objective of harmonising taxes across states so as to have an integrated country-wide market would be defeated.
88 This point combines two inferences: one from Chapter 2 (Section 2.1) that showed that inventory growth is high in Indian companies and another from Chapter 3 (Section 3.2) that prices of automobiles are not rising as fast as those of all commodities in India. Price growth in automobiles is lower than the real income growth in India and hence the prices, after adjusting from growth in real income, have in fact fallen.
105
• So far, the FTA with Thailand has resulted in a net gain for India, in terms of the aggregate trade balance of auto-components covered in this agreement. However, this has been only because of huge gains due to India’s exports of gear boxes to Thailand. In future, FTA negotiations should be based on detailed country-by-country studies of disaggregate sub-sectors of the auto industry. For example, countries such as South Africa have many incentives for some sub-segments in the auto industry, which are absent in India and so free trade between South Africa and India in those product categories may harm the Indian industry in an unfair way. For the automobile sector, which in all economies is treated as a lead sector because of its extensive linkages, it is important to ensure a level-playing with our competitors.
106
References ACMA (2004). A Report on ACMA CEO’s Mission to Thailand, Automotive Component
Manufacturers Association of India. ACMA (2006). Indian Automotive Component Industry: Engine of Growth Driving the
Indian Manufacturing Sector, Available at http://acmainfo.com/docmgr/Status_of _ Auto _ Industry/Status_Indian_Auto_Industry.pdf.
Baltagi, B.H. (1995). Econometric Analysis of Panel Data, John Wiley and Sons, New
York. Coelli, T., D.S.P. Rao and G. Battese (1998). An Introduction to Efficiency and
Productivity Analysis, Kluwer Academic Publishers, London. Corden, W.M. (1966). The Structure of a Tariff System and Effective Protective Rate,
The Journal of Political Economy, 74(3), pp. 221-237. Das, D.K. (2003). Quantifying Trade Barriers: Has Protection Declined Substantially in
Indian Manufacturing, ICRIER Working Paper No: 105, Indian Council for Research on International Economic Relations, New Delhi.
D'Costa, A.P. (2002). A Book Review on Rethinking the Developmental State: India's
Industry in Comparative Perspective by Vibha Pingle, The Journal of Asian Studies, 61(4), pp. 1422-1424.
Humphrey, J. (1999). Globalisation and Supply Chain Networks: the Auto Industry in
Brazil and India, in G. Gereffi, F. Palpacuer and A. Parisotto (eds), Global Production and Local Jobs, Geneva, International Institute for Labour Studies.
ICRA (2003). Report on the Competitiveness of Indian Auto Industry, Society of Indian
Automobile Manufacturers, Automotive Component Manufacturers Association of India and Investment Information and Credit Rating Agency of India.
ICRA (2004a). The Thailand & ASEAN India Free Trade Agreement: Implications for
the Indian Auto Industry, Automotive Component Manufacturers Association of India and Investment Information and Credit Rating Agency of India.
ICRA (2004b). The MERCOSUR-India Preferential Trade Agreements -- Implications
for the Indian Automotive Industry, Automotive Component Manufacturers Association of India and Investment Information and Credit Rating Agency of India.
107
ICRA (2005). Implications of an FTA with South Africa for the Indian Auto Industry, Automotive Component Manufacturers Association of India and Investment Information and Credit Rating Agency of India.
Kathuria, S. (1996). Competing through Technology and Manufacturing: A Study of the
Indian Commercial Vehicles Industry, Oxford University Press, Delhi. Ministry of Heavy Industries and Public Enterprises (2006a). Automotive Mission Plan
2006-2016: A Mission for Development of Indian Automotive Industry, New Delhi.
Ministry of Heavy Industries and Public Enterprises (2006b). Report of Working Group
on Automotive Industry for the Eleventh Five-Year Plan, New Delhi. McKinsey (2005). Vision 2015 for the Indian Automotive Components Industry,
Automotive Component Manufacturers Association of India and McKinsey and Company.
Narayanan, K. (1998). Technology Acquisition, De-regulation and Competitiveness: a
Study of Indian Automobile Industry, Research Policy, 27(2), pp. 215-228. Narayanan, K. (2004). Technology Acquisition and Growth of Firms: Indian Automobile
Sector under Changing Policy Regimes, Economic and Political Weekly, 39(6), pp. 461-470.
Narayanan, K. (2006). Technology Acquisition and Export Competitiveness: Evidence
from Indian Automobile Industry, in S.D. Tendulkar, A. Mitra, K. Narayanan and D.K. Das (eds), India: Industrialisation in a Reforming Economy, Academic Foundation, New Delhi, pp. 439-470.
NMCC (2006). The National Strategy for Manufacturing, National Manufacturing
Competitiveness Council, Government of India, New Delhi. Organisation Internationale des Constructeurs d'Automobiles (2006). World’s Automotive
Industry: Some Key Figures, Available at http://www.oica.net/htdocs/ Main.htm Pingle, V. (2000). Rethinking the Developmental State: India’s Industry in Comparative
Perspective, Oxford University Press, Delhi, pp. 85-121. Piplai, T. (2001). Automobile Industry: Shifting Strategic Focus, Economic and Political
Weekly, 36(30), pp. 2892-2897. Sharma, S. (2006). A Study on Productivity Performance of Indian Automobile Industry:
Growth Accounting Analysis, Available at http://www.uq.edu.au/economics/ appc2004/ Papers/cs6C4.pdf.
108
SIAM (2006). The Indian Automobile Industry: Statistical Profile 2005-06. Society of Indian Automobile Manufacturers, New Delhi.
Sumantran, V. (2006). The Indian Auto Industry and the Role of Dealers, A Presentation
at Federation of Indian Automobile Dealers. Sutton, J. (2000). The Globalization Process: Auto-Component Supply Chains in China
and India, World Bank Report. Available at http://personal.lse.ac.uk/sutton/auto_ component_printroom_version3.pdf
Tewari, M. (2000). Engaging the new global interlocutors: Foreign direct investment and
the re-shaping of local productive capabilities in Tamil Nadu’s automotive supply sector, September 21, Available at http://www.ids.ac.uk/ids/global/pdfs/ tewari.pdf.
Veloso, F. and R. Kumar. (2002). The Automotive Supply Chain: Global Trends and
Asian Perspectives, Economics and Research Department Working Paper Series No: 3, Asian Development Bank.
109
Appendix 1: Supply Side Features This appendix is meant for explaining data sources and methodologies involved in the analysis of supply side of the auto sector in Chapter 2. In addition, there are few figures and explanations included herein, to supplement the analysis done in the report. A1.1 Data Sources and Methodology Analysis done in Chapter 2 of this report is based on the Annual Survey of Industries corresponding to the years from 1973-74 to 2003-04 and data released by the Society of Indian Automobile Manufacturers and Automobile Component Manufacturers, for 2004-05 and 2005-06. All the values involved in this analysis are computed at 1993-94 constant prices. The sub-sectors included in this analysis are the following:
• Automobiles, parts and accessories: Passenger cars, Multi-Utility Vehicles, Commercial Vehicles, Buses, Coaches and Tractors; parts, components and accessories thereof of all these automobile products (NIC-1987 Codes: 373 and 374; NIC-1998 Codes: 341,342 and 343)
• Two-wheeled and three-wheeled vehicles: Motorcycles, scooters, mopeds, auto-rickshaws; parts, components and accessories thereof of all these automobile products (NIC-1987 Codes: 375; NIC-1998 Code: 3591)
However, since this analysis would not reflect enough about the auto-component and automobile sectors in isolation, an analysis of data from 2001-02 to 2005-06 has been done for the following sectors:
• Automobile manufacturing (NIC-1998 Code: 341): Passenger cars, Multi-Utility Vehicles, Commercial Vehicles, Buses, Coaches and Tractors.
• Automobile Component Manufacturing (NIC-1998 Codes: 342 and 343): Components, bodies, and accessories of the automobile products covered in 341 above.
In addition, we also use data from CMIE Prowess, which is based on annual reports of companies. This dataset consists of 14 firms in two-/three-wheelers segment, 12 companies in CVs/PVs segment and 228 firms in auto-component segment, comprising about 90 per cent, 90 per cent and 70 per cent, respectively, of sales in these segments. This dataset is from 1988-89 to 2005-06. The unorganised manufacturing sector is defined as the collection of those manufacturing units whose activity does not come under any statutory Act or legal provision and/or which do not maintain any regular accounts or which are not registered under Sections 2m(i)89 and 2m(ii)90 of the Factories Act, 1948 and which are registered under Section 8591 of Factories Act, 1948. This sector contributes 28 per cent of the gross value-added
89 Factories using power and employing 10 or more workers on any working day 90 Factories not using power and employing 20 or more workers on any working day 91 Factories, which have less than 10/20 workers with or without power, specially notified by State
Government
110
and 73 per cent of employment to the total manufacturing, thus playing a vital role in the Indian economy. National Sample Survey Reports of 51st (1994-95) and 56th (2000-01) on Unorganised Manufacturing Enterprises in India have been used and the industry codes 373, 374 and 375 of NIC-87 and 341, 342, 343 and 35992 of NIC-1998 are used for this purpose, after aggregation. Unorganised sector is divided into three types:
• Own Account Manufacturing Enterprises (OAME): It consists of no hired employee other than working owner and his family members.
• Non-Directory Manufacturing Enterprises (NDME): It consists of less than 6 employees other than working owner
• Directory Manufacturing Enterprises (DME): It employs more than 6 employees. A1.2 Features of Organised Auto Sector Analysis Based on ASI Data As seen from Figure A1.2.1, the number of factories that are engaged in producing automobiles, two-wheelers and three-wheelers has been steadily increasing from 1973-74 till 2005-06. This increase has been much more conspicuous and sharper in mid-1990s. Since 2000, however, it can be noticed that there is a decline in the number of enterprises in both these sectors. There could be different plausible explanations for this, such as consolidation of the smaller enterprises in the industry, closing down of sick factories and potential relocation plans. Figure A1.2.2 shows that the net fixed capital93 in the factories manufacturing automobiles, parts and accessories has been steadily increasing since the mid-1980s. This increase continued till 1999-2000, after which this has fallen till 2003-04, but it has been on the rise thereafter. However, net fixed capital has been increasing among the factories manufacturing two-wheelers, three-wheelers and their components since the early-1980s, but for a fall in 1998-99. The gross value of output has been steadily growing since the mid-1980s, with an accelerated growth since the mid-1990s, as shown in Figure A1.2.3. This holds well for both automobiles and parts manufacturing as well as two-/three-wheelers and parts manufacturing. The combined inferences of all the figures analysed so far is that per-enterprise output and capital productivity have been increasing rapidly in the recent years. This hypothesis is examined explicitly in Chapter 2 of the report.
92 Since this includes product categories like bicycles and bullock carts, we calculate the values for auto
industries in this by imposing the share of values in 375 in 37 in the 51st round on the combination of 34 and 35.
93 This is calculated by Perpetual Inventories Method, as explained in Goldar (2004), taking 1973-74 as the base year.
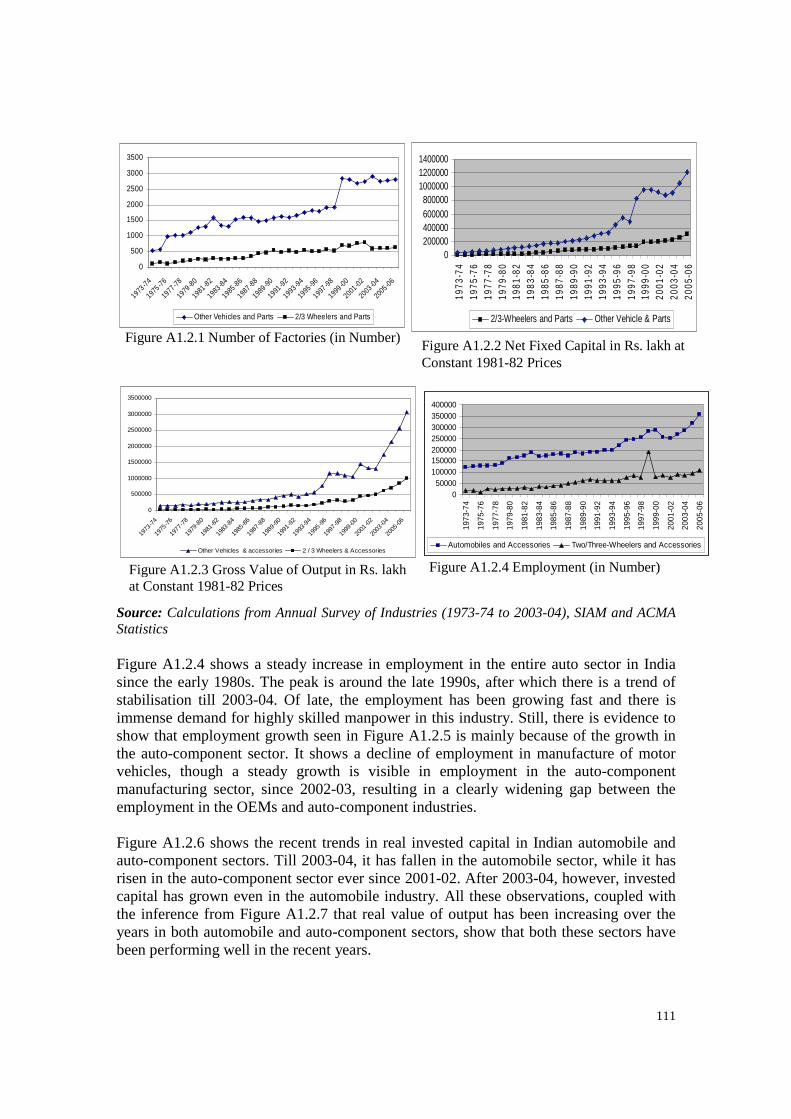
111
050000
100000150000200000250000300000350000400000
1973
-74
1975
-76
1977
-78
1979
-80
1981
-82
1983
-84
1985
-86
1987
-88
1989
-90
1991
-92
1993
-94
1995
-96
1997
-98
1999
-00
2001
-02
2003
-04
2005
-06
Automobiles and Accessories Two/Three-Wheelers and Accessories
Figure A1.2.4 Employment (in Number)
Source: Calculations from Annual Survey of Industries (1973-74 to 2003-04), SIAM and ACMA Statistics Figure A1.2.4 shows a steady increase in employment in the entire auto sector in India since the early 1980s. The peak is around the late 1990s, after which there is a trend of stabilisation till 2003-04. Of late, the employment has been growing fast and there is immense demand for highly skilled manpower in this industry. Still, there is evidence to show that employment growth seen in Figure A1.2.5 is mainly because of the growth in the auto-component sector. It shows a decline of employment in manufacture of motor vehicles, though a steady growth is visible in employment in the auto-component manufacturing sector, since 2002-03, resulting in a clearly widening gap between the employment in the OEMs and auto-component industries.
Figure A1.2.6 shows the recent trends in real invested capital in Indian automobile and auto-component sectors. Till 2003-04, it has fallen in the automobile sector, while it has risen in the auto-component sector ever since 2001-02. After 2003-04, however, invested capital has grown even in the automobile industry. All these observations, coupled with the inference from Figure A1.2.7 that real value of output has been increasing over the years in both automobile and auto-component sectors, show that both these sectors have been performing well in the recent years.
0
500
1000
1500
2000
2500
3000
3500
1973-74
1975 -76
1977-78
1979-80
1981-82
1983-84
1985-86
1987 -88
1989-90
1991-92
1993-94
1995-96
1997-98
1999 -00
2001-02
2003-04
2005-06
Other Vehicles and Parts 2/3 Wheelers and Parts
Figure A1.2.1 Number of Factories (in Number)
0200000400000600000800000
100000012000001400000
1973
-74
1975
-76
1977
-78
1979
-80
1981
-82
1983
-84
1985
-86
1987
-88
1989
-90
1991
-92
1993
-94
1995
-96
1997
-98
1999
-00
2001
-02
2003
-04
2005
-06
2/3-Wheelers and Parts Other Vehicle & Parts
Figure A1.2.2 Net Fixed Capital in Rs. lakh at Constant 1981-82 Prices
0
500000
1000000
1500000
2000000
2500000
3000000
3500000
1973
-74
1975
-76
1977
-78
1979
-80
1981
-82
1983
-84
1985
-86
1987
-88
1989
-90
1991
-92
1993
-94
1995
-96
1997
-98
1999
-00
2001
-02
2003
-04
2005
-06
Other Vehicles & accessories 2 / 3 Wheelers & Accessories
Figure A1.2.3 Gross Value of Output in Rs. lakh at Constant 1981-82 Prices
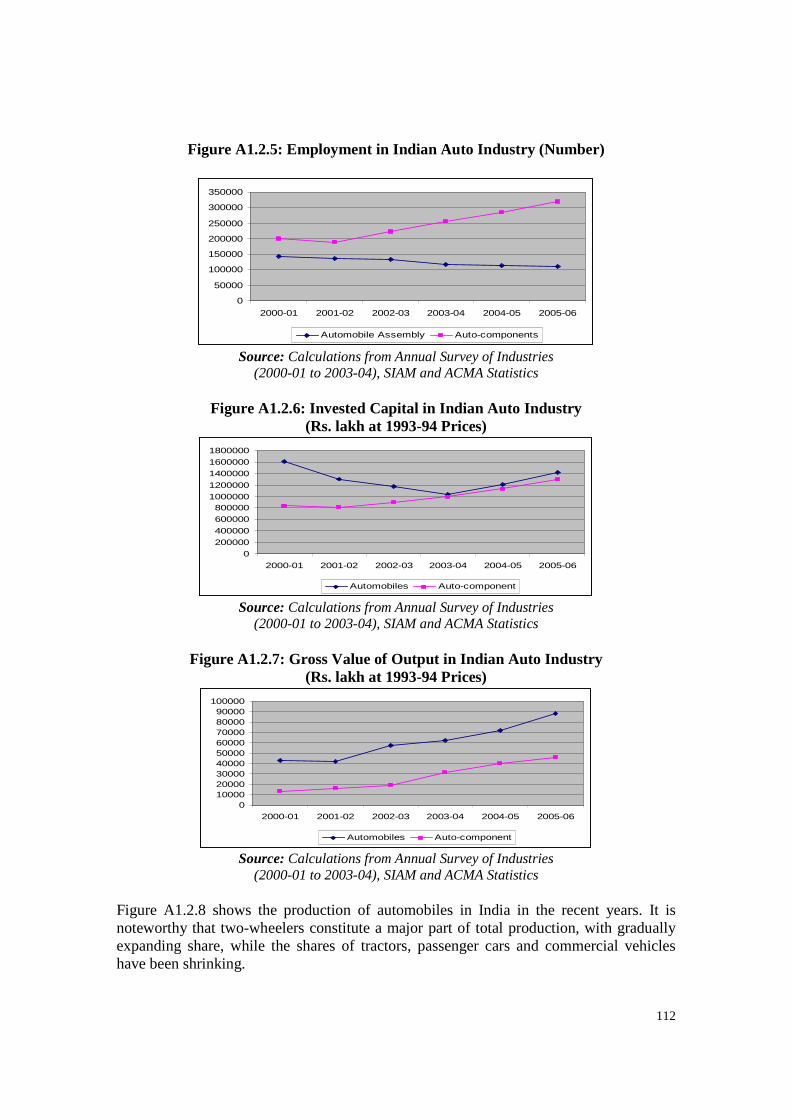
112
Figure A1.2.5: Employment in Indian Auto Industry (Number)
0
50000
100000
150000
200000
250000
300000
350000
2000-01 2001-02 2002-03 2003-04 2004-05 2005-06
Automobile Assembly Auto-components
Source: Calculations from Annual Survey of Industries (2000-01 to 2003-04), SIAM and ACMA Statistics
Figure A1.2.6: Invested Capital in Indian Auto Industry
(Rs. lakh at 1993-94 Prices)
0
200000
400000
600000
8000001000000
1200000
1400000
1600000
1800000
2000-01 2001-02 2002-03 2003-04 2004-05 2005-06
Automobiles Auto-component
Source: Calculations from Annual Survey of Industries (2000-01 to 2003-04), SIAM and ACMA Statistics
Figure A1.2.7: Gross Value of Output in Indian Auto Industry
(Rs. lakh at 1993-94 Prices)
0100002000030000400005000060000700008000090000
100000
2000-01 2001-02 2002-03 2003-04 2004-05 2005-06
Automobiles Auto-component
Source: Calculations from Annual Survey of Industries (2000-01 to 2003-04), SIAM and ACMA Statistics
Figure A1.2.8 shows the production of automobiles in India in the recent years. It is noteworthy that two-wheelers constitute a major part of total production, with gradually expanding share, while the shares of tractors, passenger cars and commercial vehicles have been shrinking.
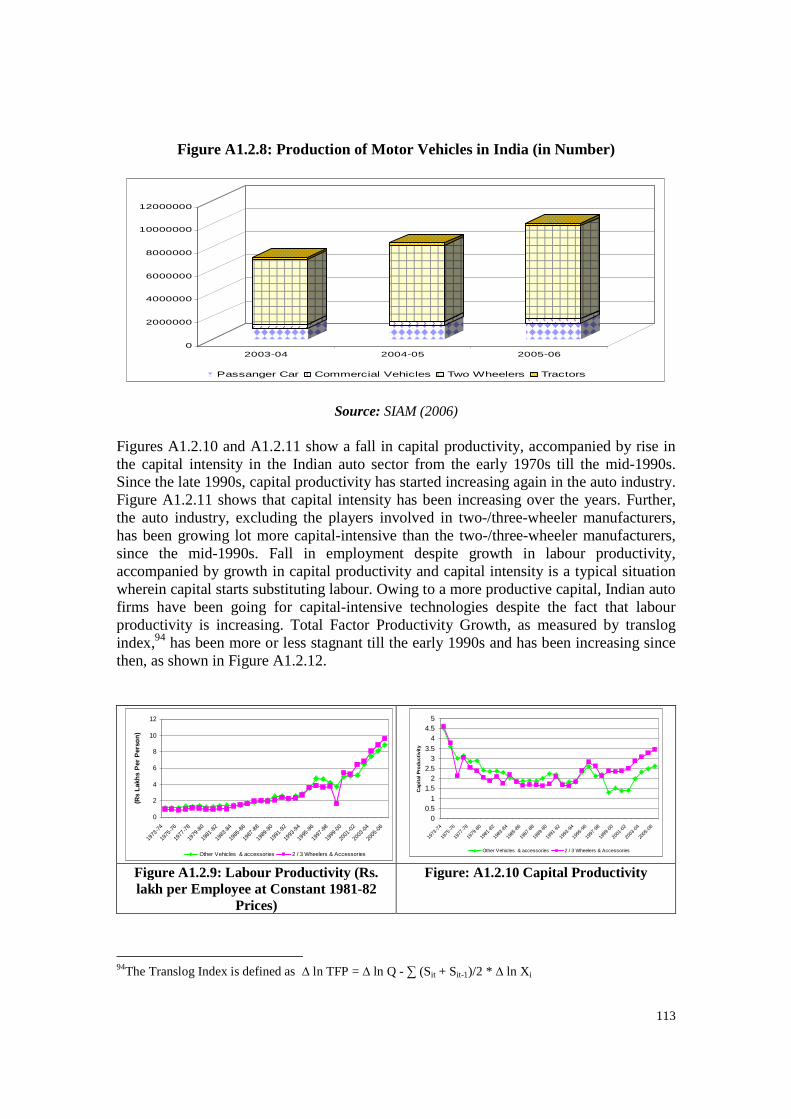
113
Figure A1.2.8: Production of Motor Vehicles in India (in Number)
0
2000000
4000000
6000000
8000000
10000000
12000000
2003-04 2004-05 2005-06
Passanger Car Commercial Vehicles Two Wheelers Tractors
Source: SIAM (2006) Figures A1.2.10 and A1.2.11 show a fall in capital productivity, accompanied by rise in the capital intensity in the Indian auto sector from the early 1970s till the mid-1990s. Since the late 1990s, capital productivity has started increasing again in the auto industry. Figure A1.2.11 shows that capital intensity has been increasing over the years. Further, the auto industry, excluding the players involved in two-/three-wheeler manufacturers, has been growing lot more capital-intensive than the two-/three-wheeler manufacturers, since the mid-1990s. Fall in employment despite growth in labour productivity, accompanied by growth in capital productivity and capital intensity is a typical situation wherein capital starts substituting labour. Owing to a more productive capital, Indian auto firms have been going for capital-intensive technologies despite the fact that labour productivity is increasing. Total Factor Productivity Growth, as measured by translog index,94 has been more or less stagnant till the early 1990s and has been increasing since then, as shown in Figure A1.2.12.
0
2
4
6
8
10
12
1973
-74
1975
-76
1977
-78
1979
-80
1981
-82
1983
-84
1985
-86
1987
-88
1989
-90
1991
-92
1993
-94
1995
-96
1997
-98
1999
-00
2001
-02
2003
-04
2005
-06
(Rs
Lak
hs
Per
Per
son
)
Other Vehicles & accessories 2 / 3 Wheelers & Accessories
00.5
11.5
22.5
33.5
44.5
5
1973
-74
1975
-76
1977
-78
1979
-80
1981
-82
1983
-84
1985
-86
1987
-88
1989
-90
1991
-92
1993
-94
1995
-96
1997
-98
1999
-00
2001
-02
2003
-04
2005
-06
Cap
ital
Pro
du
ctiv
ity
Other Vehicles & accessories 2 / 3 Wheelers & Accessories Figure A1.2.9: Labour Productivity (Rs. lakh per Employee at Constant 1981-82
Prices)
Figure: A1.2.10 Capital Productivity
94The Translog Index is defined as ∆ ln TFP = ∆ ln Q - ∑ (Sit + Sit-1)/2 * ∆ ln Xi
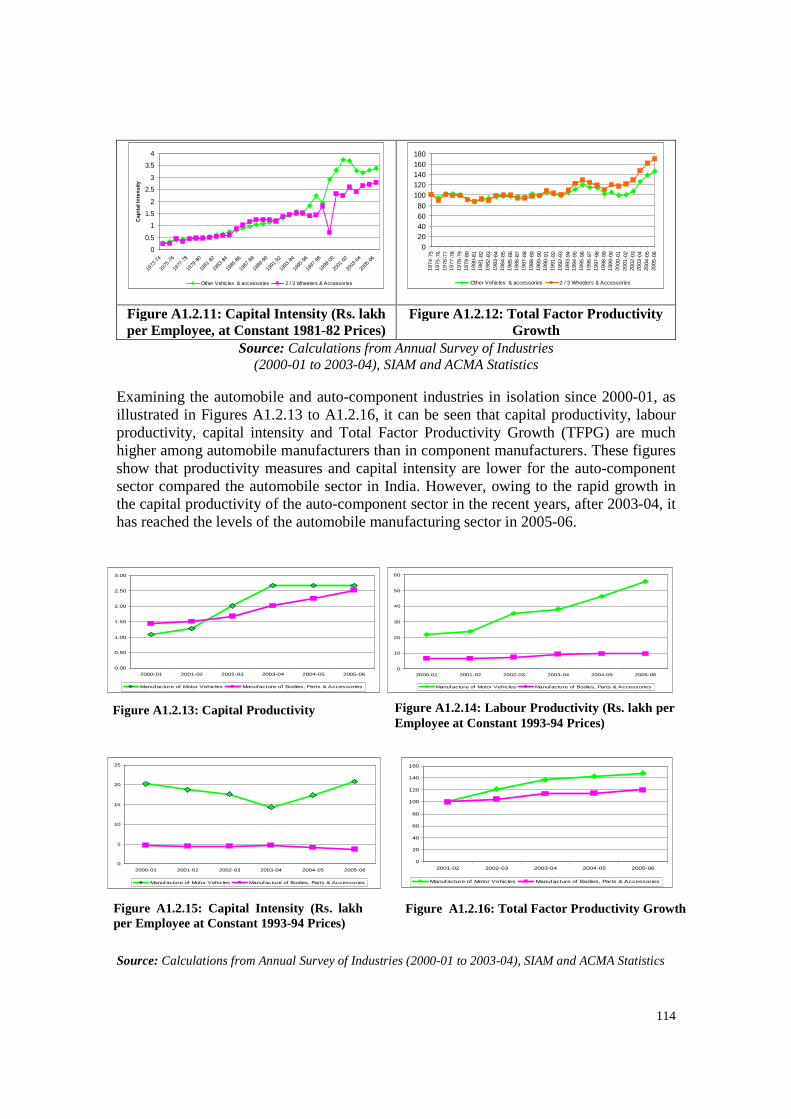
114
0
0.5
1
1.5
2
2.5
3
3.5
4
1973
-74
1975
-76
1977
-78
1979
-80
1981
-82
1983
-84
1985
-86
1987
-88
1989
-90
1991
-92
1993
-94
1995
-96
1997
-98
1999
-00
2001
-02
2003
-04
2005
-06
Cap
ital
Inte
nsi
ty
Other Vehicles & accessories 2 / 3 Wheelers & Accessories
020406080
100120140160180
1974
- 75
1975
- 76
1976
- 77
1977
-78
1978
-79
1979
-80
1980
-81
1981
- 82
1982
- 83
1983
- 84
1984
-85
1985
-86
1986
-87
1987
-88
1988
- 89
1989
- 90
1990
- 91
1991
-92
1992
-93
1993
-94
1994
-95
1995
- 96
1996
- 97
1997
- 98
1998
-99
1999
-00
2000
-01
2001
-02
2002
- 03
2003
- 04
2004
- 05
2005
-06
Other Vehicles & accessories 2 / 3 Wheelers & Accessories
Figure A1.2.11: Capital Intensity (Rs. lakh per Employee, at Constant 1981-82 Prices)
Figure A1.2.12: Total Factor Productivity Growth
Source: Calculations from Annual Survey of Industries (2000-01 to 2003-04), SIAM and ACMA Statistics
Examining the automobile and auto-component industries in isolation since 2000-01, as illustrated in Figures A1.2.13 to A1.2.16, it can be seen that capital productivity, labour productivity, capital intensity and Total Factor Productivity Growth (TFPG) are much higher among automobile manufacturers than in component manufacturers. These figures show that productivity measures and capital intensity are lower for the auto-component sector compared the automobile sector in India. However, owing to the rapid growth in the capital productivity of the auto-component sector in the recent years, after 2003-04, it has reached the levels of the automobile manufacturing sector in 2005-06. Source: Calculations from Annual Survey of Industries (2000-01 to 2003-04), SIAM and ACMA Statistics
0.00
0.50
1.00
1.50
2.00
2.50
3.00
2000-01 2001-02 2002-03 2003-04 2004-05 2005-06
Manufacture of Motor Vehicles Manufacture of Bodies, Parts & Accessories
Figure A1.2.13: Capital Productivity
0
10
20
30
40
50
60
2000-01 2001-02 2002-03 2003-04 2004-05 2005-06
Manufacture of Motor Vehicles Manufacture of Bodies, Parts & Accessories
Figure A1.2.14: Labour Productivity (Rs. lakh per Employee at Constant 1993-94 Prices)
Figure A1.2.15: Capital Intensity (Rs. lakh per Employee at Constant 1993-94 Prices)
0
5
10
15
20
25
2000-01 2001-02 2002-03 2003-04 2004-05 2005-06
Manufacture of Motor Vehicles Manufacture of Bodies, Parts & Accessories
0
20
40
60
80
100
120
140
160
2001-02 2002-03 2003-04 2004-05 2005-06
Manufacture of Motor Vehicles Manufacture of Bodies, Parts & Accessories
Figure A1.2.16: Total Factor Productivity Growth
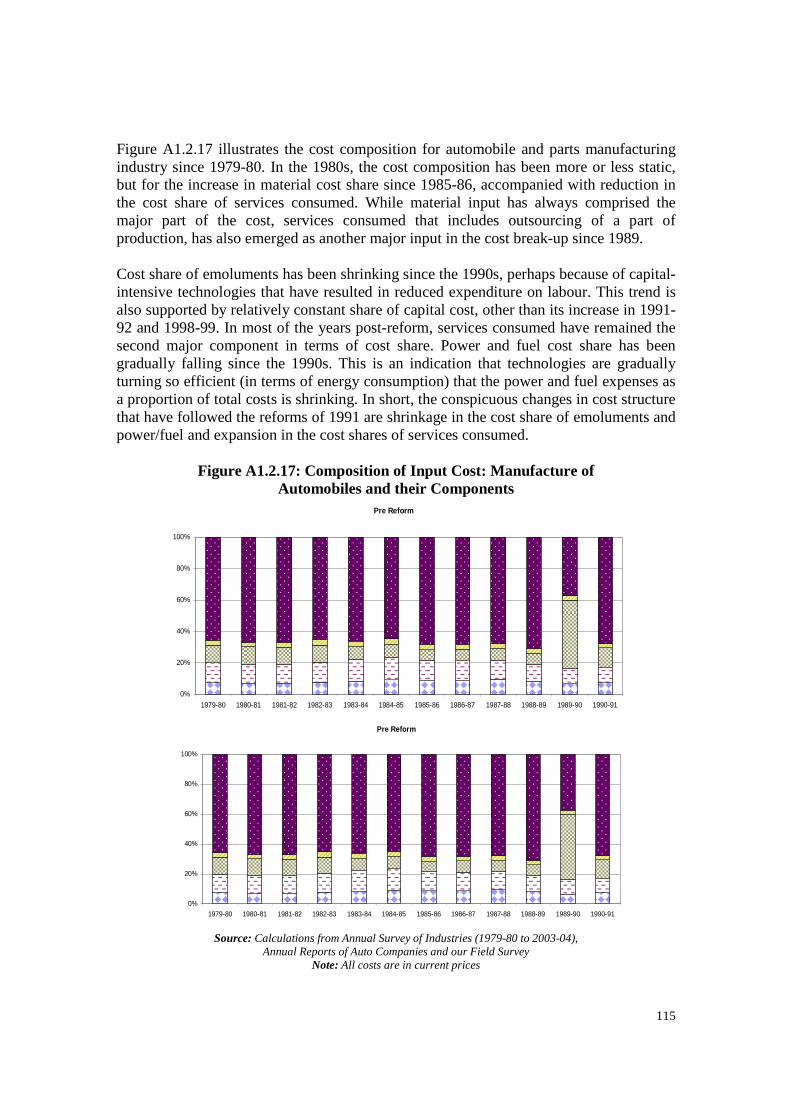
115
Pre Reform
0%
20%
40%
60%
80%
100%
1979-80 1980-81 1981-82 1982-83 1983-84 1984-85 1985-86 1986-87 1987-88 1988-89 1989-90 1990-91
Pre Reform
0%
20%
40%
60%
80%
100%
1979-80 1980-81 1981-82 1982-83 1983-84 1984-85 1985-86 1986-87 1987-88 1988-89 1989-90 1990-91
Figure A1.2.17 illustrates the cost composition for automobile and parts manufacturing industry since 1979-80. In the 1980s, the cost composition has been more or less static, but for the increase in material cost share since 1985-86, accompanied with reduction in the cost share of services consumed. While material input has always comprised the major part of the cost, services consumed that includes outsourcing of a part of production, has also emerged as another major input in the cost break-up since 1989. Cost share of emoluments has been shrinking since the 1990s, perhaps because of capital-intensive technologies that have resulted in reduced expenditure on labour. This trend is also supported by relatively constant share of capital cost, other than its increase in 1991-92 and 1998-99. In most of the years post-reform, services consumed have remained the second major component in terms of cost share. Power and fuel cost share has been gradually falling since the 1990s. This is an indication that technologies are gradually turning so efficient (in terms of energy consumption) that the power and fuel expenses as a proportion of total costs is shrinking. In short, the conspicuous changes in cost structure that have followed the reforms of 1991 are shrinkage in the cost share of emoluments and power/fuel and expansion in the cost shares of services consumed.
Figure A1.2.17: Composition of Input Cost: Manufacture of
Automobiles and their Components
Source: Calculations from Annual Survey of Industries (1979-80 to 2003-04), Annual Reports of Auto Companies and our Field Survey
Note: All costs are in current prices
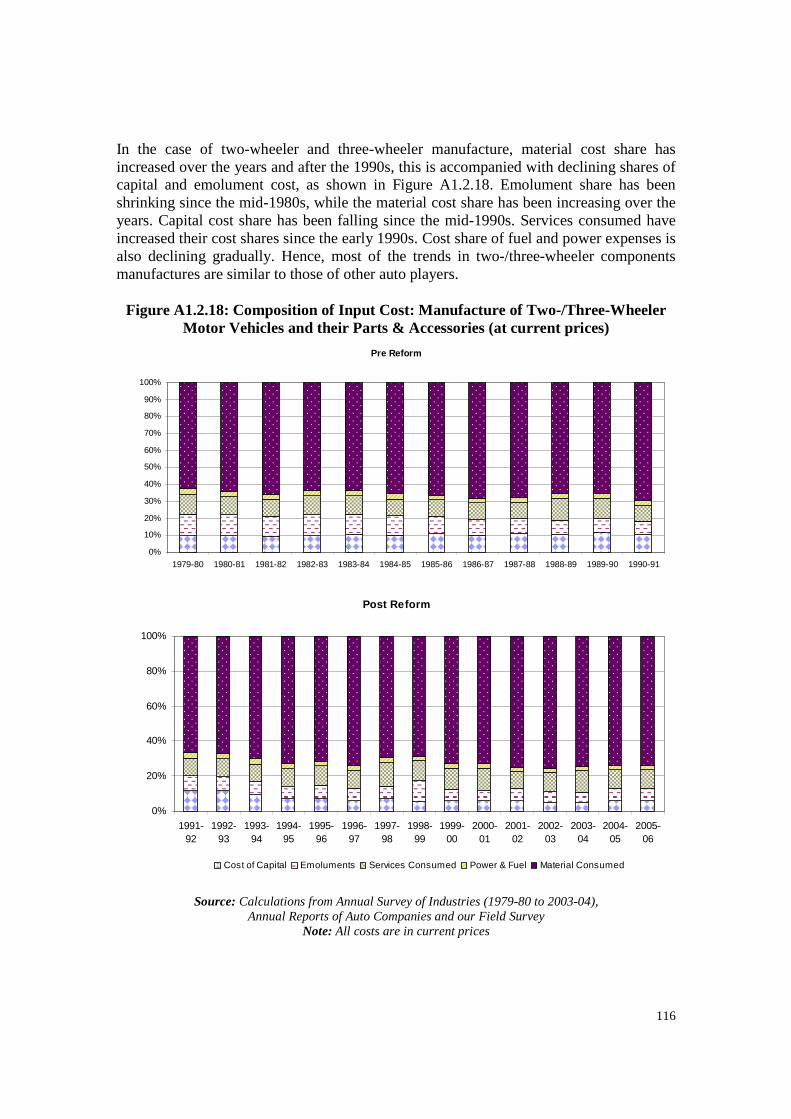
116
In the case of two-wheeler and three-wheeler manufacture, material cost share has increased over the years and after the 1990s, this is accompanied with declining shares of capital and emolument cost, as shown in Figure A1.2.18. Emolument share has been shrinking since the mid-1980s, while the material cost share has been increasing over the years. Capital cost share has been falling since the mid-1990s. Services consumed have increased their cost shares since the early 1990s. Cost share of fuel and power expenses is also declining gradually. Hence, most of the trends in two-/three-wheeler components manufactures are similar to those of other auto players.
Figure A1.2.18: Composition of Input Cost: Manufacture of Two-/Three-Wheeler
Motor Vehicles and their Parts & Accessories (at current prices)
Pre Reform
0%
10%
20%
30%
40%
50%
60%
70%
80%
90%
100%
1979-80 1980-81 1981-82 1982-83 1983-84 1984-85 1985-86 1986-87 1987-88 1988-89 1989-90 1990-91
Post Reform
0%
20%
40%
60%
80%
100%
1991-92
1992-93
1993-94
1994-95
1995-96
1996-97
1997-98
1998-99
1999-00
2000-01
2001-02
2002-03
2003-04
2004-05
2005-06
Cost of Capital Emoluments Services Consumed Power & Fuel Material Consumed
Source: Calculations from Annual Survey of Industries (1979-80 to 2003-04),
Annual Reports of Auto Companies and our Field Survey Note: All costs are in current prices
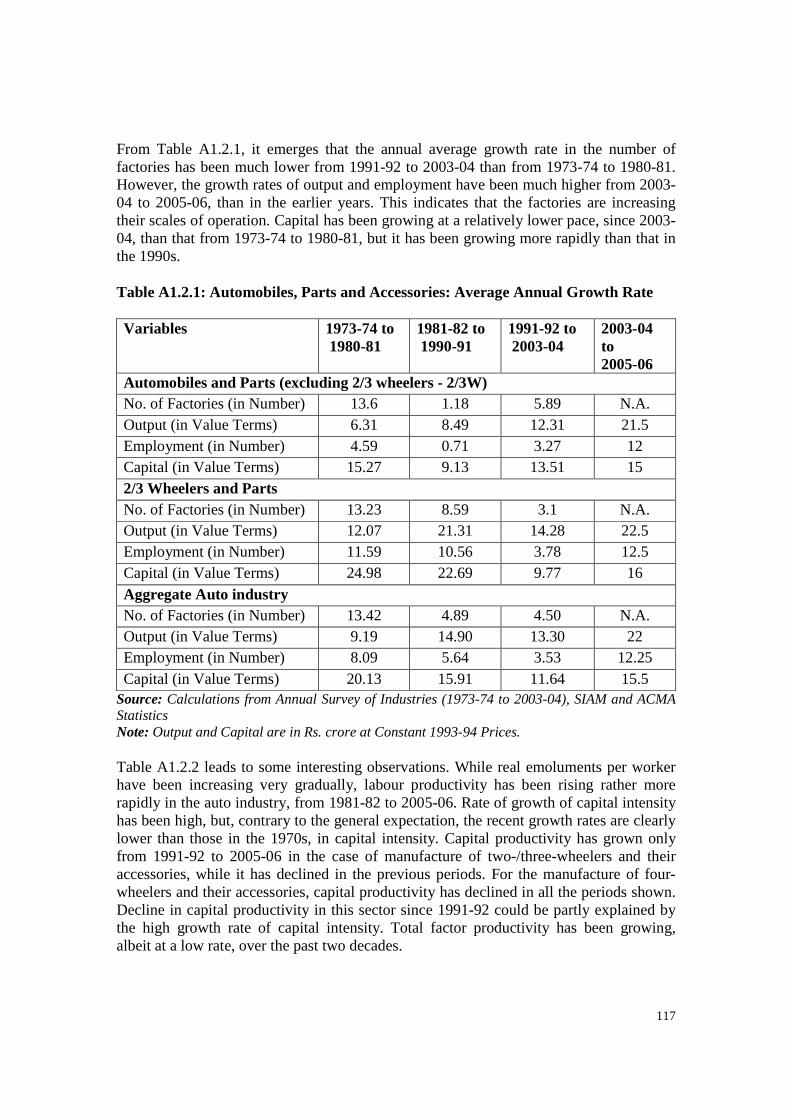
117
From Table A1.2.1, it emerges that the annual average growth rate in the number of factories has been much lower from 1991-92 to 2003-04 than from 1973-74 to 1980-81. However, the growth rates of output and employment have been much higher from 2003-04 to 2005-06, than in the earlier years. This indicates that the factories are increasing their scales of operation. Capital has been growing at a relatively lower pace, since 2003-04, than that from 1973-74 to 1980-81, but it has been growing more rapidly than that in the 1990s. Table A1.2.1: Automobiles, Parts and Accessories: Average Annual Growth Rate
Variables 1973-74 to
1980-81 1981-82 to 1990-91
1991-92 to 2003-04
2003-04 to 2005-06
Automobiles and Parts (excluding 2/3 wheelers - 2/3W) No. of Factories (in Number) 13.6 1.18 5.89 N.A. Output (in Value Terms) 6.31 8.49 12.31 21.5 Employment (in Number) 4.59 0.71 3.27 12 Capital (in Value Terms) 15.27 9.13 13.51 15 2/3 Wheelers and Parts No. of Factories (in Number) 13.23 8.59 3.1 N.A. Output (in Value Terms) 12.07 21.31 14.28 22.5 Employment (in Number) 11.59 10.56 3.78 12.5 Capital (in Value Terms) 24.98 22.69 9.77 16 Aggregate Auto industry No. of Factories (in Number) 13.42 4.89 4.50 N.A. Output (in Value Terms) 9.19 14.90 13.30 22 Employment (in Number) 8.09 5.64 3.53 12.25 Capital (in Value Terms) 20.13 15.91 11.64 15.5
Source: Calculations from Annual Survey of Industries (1973-74 to 2003-04), SIAM and ACMA Statistics Note: Output and Capital are in Rs. crore at Constant 1993-94 Prices. Table A1.2.2 leads to some interesting observations. While real emoluments per worker have been increasing very gradually, labour productivity has been rising rather more rapidly in the auto industry, from 1981-82 to 2005-06. Rate of growth of capital intensity has been high, but, contrary to the general expectation, the recent growth rates are clearly lower than those in the 1970s, in capital intensity. Capital productivity has grown only from 1991-92 to 2005-06 in the case of manufacture of two-/three-wheelers and their accessories, while it has declined in the previous periods. For the manufacture of four-wheelers and their accessories, capital productivity has declined in all the periods shown. Decline in capital productivity in this sector since 1991-92 could be partly explained by the high growth rate of capital intensity. Total factor productivity has been growing, albeit at a low rate, over the past two decades.
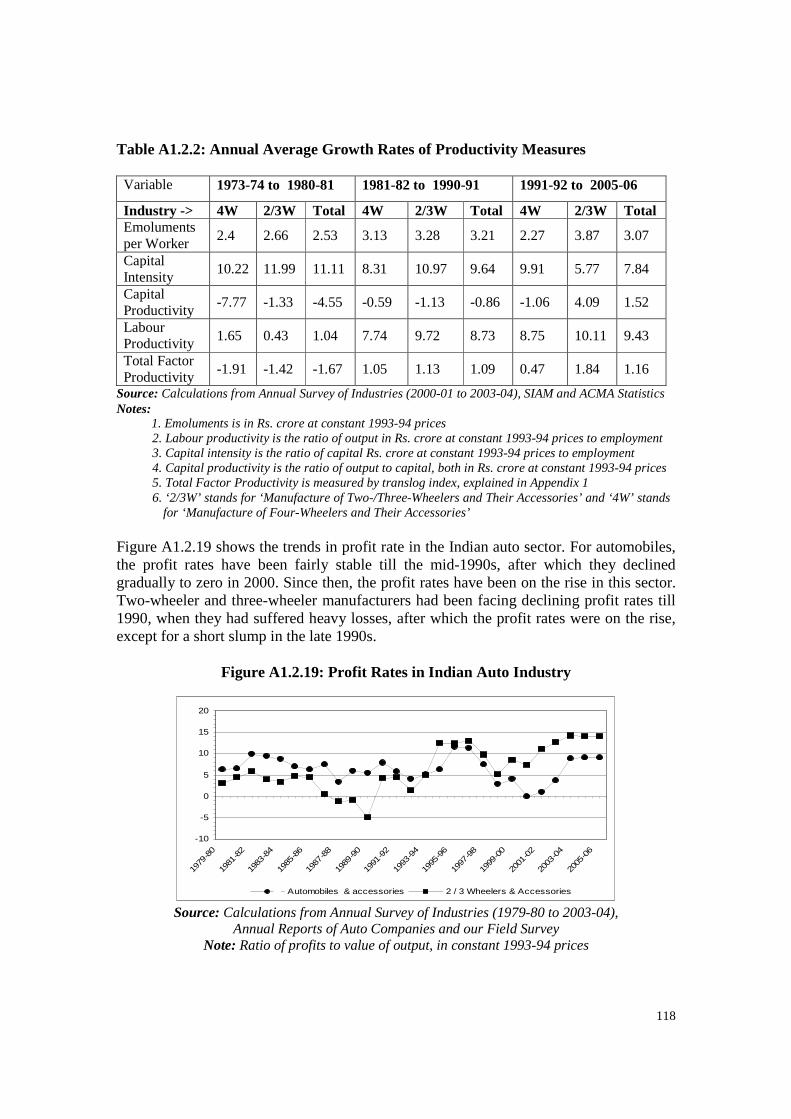
118
Table A1.2.2: Annual Average Growth Rates of Productivity Measures Variable 1973-74 to 1980-81 1981-82 to 1990-91
1991-92 to 2005-06
Industry -> 4W 2/3W Total 4W 2/3W Total 4W 2/3W Total Emoluments per Worker
2.4 2.66 2.53 3.13 3.28 3.21 2.27 3.87 3.07
Capital Intensity
10.22 11.99 11.11 8.31 10.97 9.64 9.91 5.77 7.84
Capital Productivity
-7.77 -1.33 -4.55 -0.59 -1.13 -0.86 -1.06 4.09 1.52
Labour Productivity
1.65 0.43 1.04 7.74 9.72 8.73 8.75 10.11 9.43
Total Factor Productivity
-1.91 -1.42 -1.67 1.05 1.13 1.09 0.47 1.84 1.16
Source: Calculations from Annual Survey of Industries (2000-01 to 2003-04), SIAM and ACMA Statistics Notes:
1. Emoluments is in Rs. crore at constant 1993-94 prices 2. Labour productivity is the ratio of output in Rs. crore at constant 1993-94 prices to employment 3. Capital intensity is the ratio of capital Rs. crore at constant 1993-94 prices to employment 4. Capital productivity is the ratio of output to capital, both in Rs. crore at constant 1993-94 prices 5. Total Factor Productivity is measured by translog index, explained in Appendix 1 6. ‘2/3W’ stands for ‘Manufacture of Two-/Three-Wheelers and Their Accessories’ and ‘4W’ stands
for ‘Manufacture of Four-Wheelers and Their Accessories’ Figure A1.2.19 shows the trends in profit rate in the Indian auto sector. For automobiles, the profit rates have been fairly stable till the mid-1990s, after which they declined gradually to zero in 2000. Since then, the profit rates have been on the rise in this sector. Two-wheeler and three-wheeler manufacturers had been facing declining profit rates till 1990, when they had suffered heavy losses, after which the profit rates were on the rise, except for a short slump in the late 1990s.
Figure A1.2.19: Profit Rates in Indian Auto Industry
-10
-5
0
5
10
15
20
1979
-80
1981
-82
1983
-84
1985
-86
1987
-88
1989
-90
1991
-92
1993
-94
1995
-96
1997
-98
1999
-00
2001
-02
2003
-04
2005
-06
Automobiles & accessories 2 / 3 Wheelers & Accessories
Source: Calculations from Annual Survey of Industries (1979-80 to 2003-04), Annual Reports of Auto Companies and our Field Survey
Note: Ratio of profits to value of output, in constant 1993-94 prices
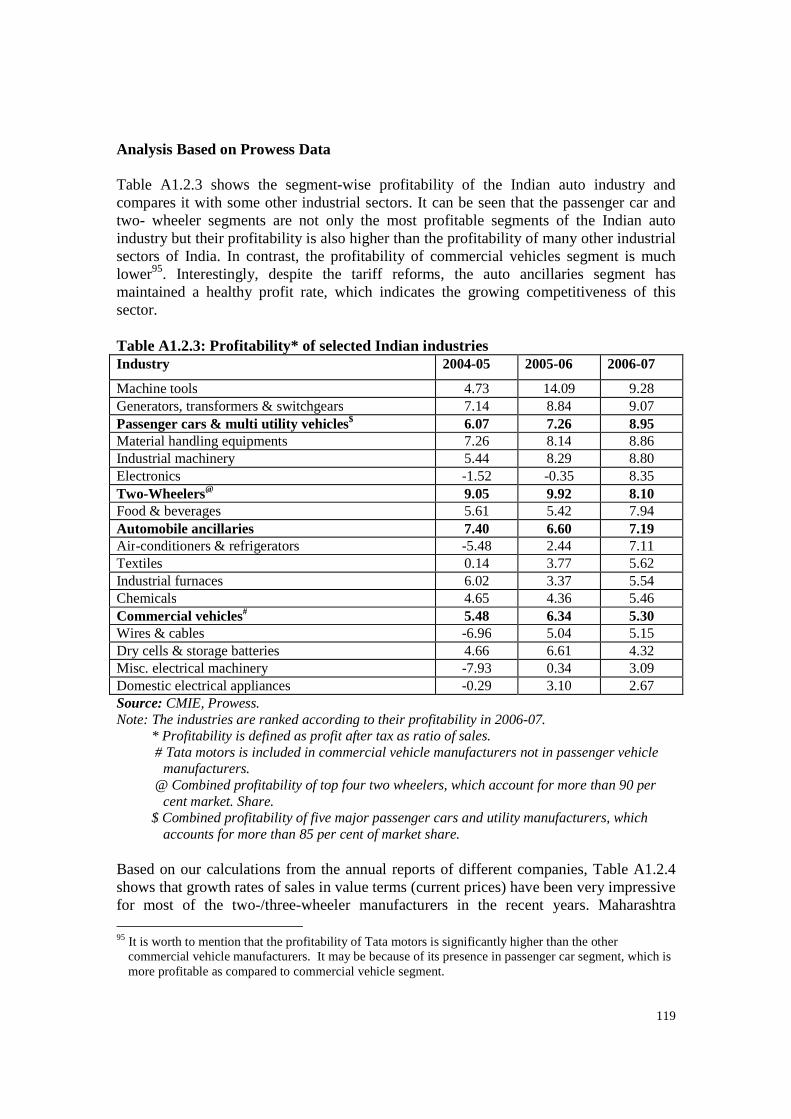
119
Analysis Based on Prowess Data Table A1.2.3 shows the segment-wise profitability of the Indian auto industry and compares it with some other industrial sectors. It can be seen that the passenger car and two- wheeler segments are not only the most profitable segments of the Indian auto industry but their profitability is also higher than the profitability of many other industrial sectors of India. In contrast, the profitability of commercial vehicles segment is much lower95. Interestingly, despite the tariff reforms, the auto ancillaries segment has maintained a healthy profit rate, which indicates the growing competitiveness of this sector. Table A1.2.3: Profitability* of selected Indian industries Industry 2004-05 2005-06 2006-07
Machine tools 4.73 14.09 9.28 Generators, transformers & switchgears 7.14 8.84 9.07 Passenger cars & multi utility vehicles$ 6.07 7.26 8.95 Material handling equipments 7.26 8.14 8.86 Industrial machinery 5.44 8.29 8.80 Electronics -1.52 -0.35 8.35 Two-Wheelers@ 9.05 9.92 8.10 Food & beverages 5.61 5.42 7.94 Automobile ancillaries 7.40 6.60 7.19 Air -conditioners & refrigerators -5.48 2.44 7.11 Textiles 0.14 3.77 5.62 Industrial furnaces 6.02 3.37 5.54 Chemicals 4.65 4.36 5.46 Commercial vehicles# 5.48 6.34 5.30 Wires & cables -6.96 5.04 5.15 Dry cells & storage batteries 4.66 6.61 4.32 Misc. electrical machinery -7.93 0.34 3.09 Domestic electrical appliances -0.29 3.10 2.67 Source: CMIE, Prowess. Note: The industries are ranked according to their profitability in 2006-07.
* Profitability is defined as profit after tax as ratio of sales. # Tata motors is included in commercial vehicle manufacturers not in passenger vehicle
manufacturers. @ Combined profitability of top four two wheelers, which account for more than 90 per
cent market. Share. $ Combined profitability of five major passenger cars and utility manufacturers, which
accounts for more than 85 per cent of market share. Based on our calculations from the annual reports of different companies, Table A1.2.4 shows that growth rates of sales in value terms (current prices) have been very impressive for most of the two-/three-wheeler manufacturers in the recent years. Maharashtra 95 It is worth to mention that the profitability of Tata motors is significantly higher than the other
commercial vehicle manufacturers. It may be because of its presence in passenger car segment, which is more profitable as compared to commercial vehicle segment.
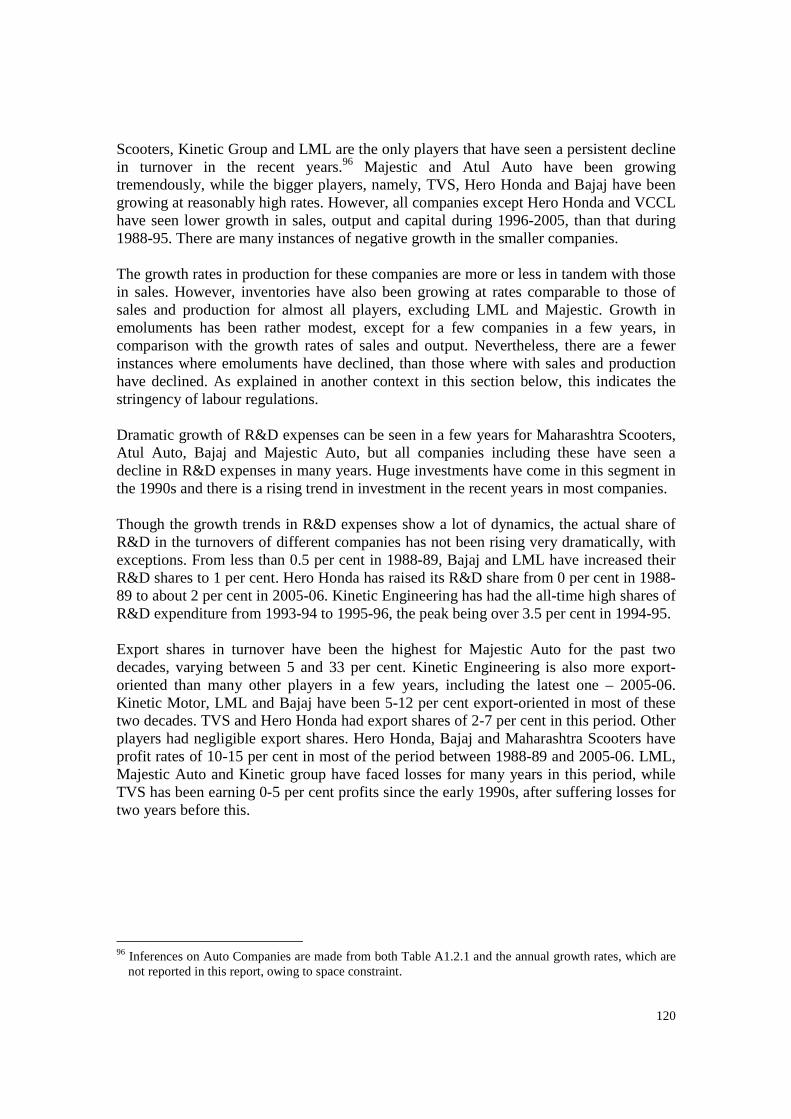
120
Scooters, Kinetic Group and LML are the only players that have seen a persistent decline in turnover in the recent years.96 Majestic and Atul Auto have been growing tremendously, while the bigger players, namely, TVS, Hero Honda and Bajaj have been growing at reasonably high rates. However, all companies except Hero Honda and VCCL have seen lower growth in sales, output and capital during 1996-2005, than that during 1988-95. There are many instances of negative growth in the smaller companies. The growth rates in production for these companies are more or less in tandem with those in sales. However, inventories have also been growing at rates comparable to those of sales and production for almost all players, excluding LML and Majestic. Growth in emoluments has been rather modest, except for a few companies in a few years, in comparison with the growth rates of sales and output. Nevertheless, there are a fewer instances where emoluments have declined, than those where with sales and production have declined. As explained in another context in this section below, this indicates the stringency of labour regulations. Dramatic growth of R&D expenses can be seen in a few years for Maharashtra Scooters, Atul Auto, Bajaj and Majestic Auto, but all companies including these have seen a decline in R&D expenses in many years. Huge investments have come in this segment in the 1990s and there is a rising trend in investment in the recent years in most companies. Though the growth trends in R&D expenses show a lot of dynamics, the actual share of R&D in the turnovers of different companies has not been rising very dramatically, with exceptions. From less than 0.5 per cent in 1988-89, Bajaj and LML have increased their R&D shares to 1 per cent. Hero Honda has raised its R&D share from 0 per cent in 1988-89 to about 2 per cent in 2005-06. Kinetic Engineering has had the all-time high shares of R&D expenditure from 1993-94 to 1995-96, the peak being over 3.5 per cent in 1994-95. Export shares in turnover have been the highest for Majestic Auto for the past two decades, varying between 5 and 33 per cent. Kinetic Engineering is also more export-oriented than many other players in a few years, including the latest one – 2005-06. Kinetic Motor, LML and Bajaj have been 5-12 per cent export-oriented in most of these two decades. TVS and Hero Honda had export shares of 2-7 per cent in this period. Other players had negligible export shares. Hero Honda, Bajaj and Maharashtra Scooters have profit rates of 10-15 per cent in most of the period between 1988-89 and 2005-06. LML, Majestic Auto and Kinetic group have faced losses for many years in this period, while TVS has been earning 0-5 per cent profits since the early 1990s, after suffering losses for two years before this.
96 Inferences on Auto Companies are made from both Table A1.2.1 and the annual growth rates, which are
not reported in this report, owing to space constraint.
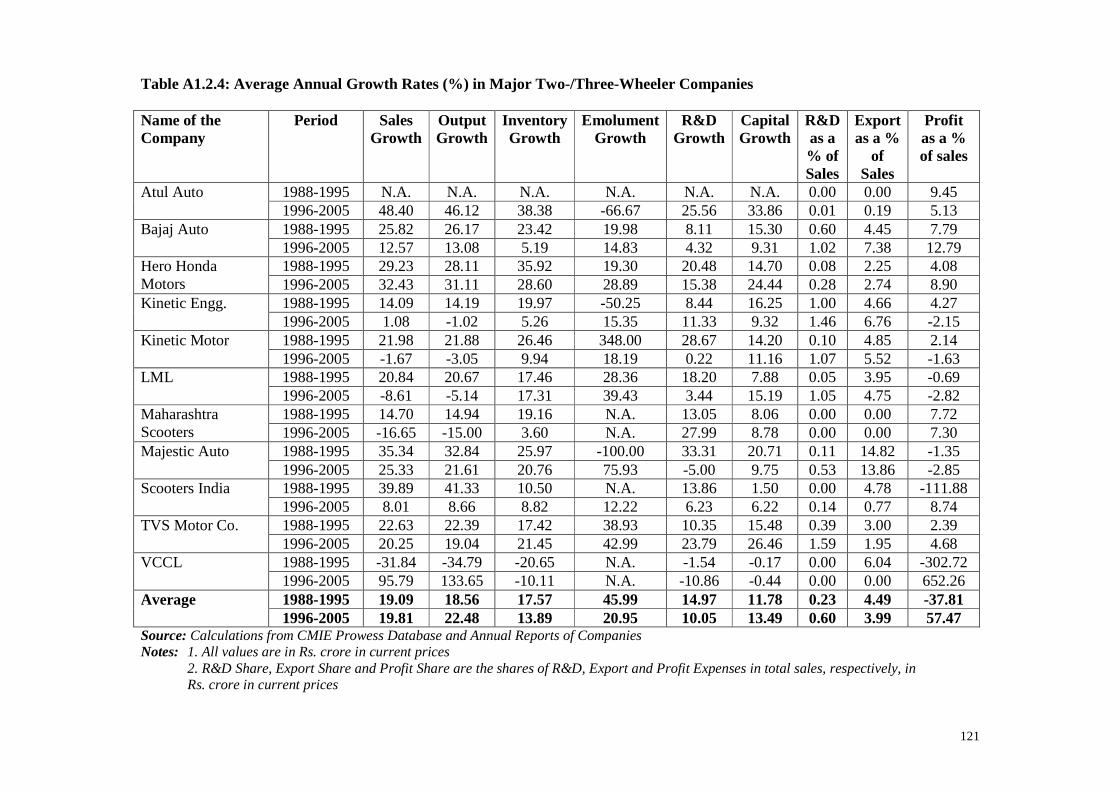
121
Table A1.2.4: Average Annual Growth Rates (%) in Major Two-/Three-Wheeler Companies
Name of the Company
Period Sales Growth
Output Growth
Inventory Growth
Emolument Growth
R&D Growth
Capital Growth
R&D as a % of Sales
Export as a %
of Sales
Profit as a % of sales
Atul Auto 1988-1995 N.A. N.A. N.A. N.A. N.A. N.A. 0.00 0.00 9.45 1996-2005 48.40 46.12 38.38 -66.67 25.56 33.86 0.01 0.19 5.13
Bajaj Auto 1988-1995 25.82 26.17 23.42 19.98 8.11 15.30 0.60 4.45 7.79 1996-2005 12.57 13.08 5.19 14.83 4.32 9.31 1.02 7.38 12.79
Hero Honda Motors
1988-1995 29.23 28.11 35.92 19.30 20.48 14.70 0.08 2.25 4.08 1996-2005 32.43 31.11 28.60 28.89 15.38 24.44 0.28 2.74 8.90
Kinetic Engg. 1988-1995 14.09 14.19 19.97 -50.25 8.44 16.25 1.00 4.66 4.27 1996-2005 1.08 -1.02 5.26 15.35 11.33 9.32 1.46 6.76 -2.15
Kinetic Motor 1988-1995 21.98 21.88 26.46 348.00 28.67 14.20 0.10 4.85 2.14 1996-2005 -1.67 -3.05 9.94 18.19 0.22 11.16 1.07 5.52 -1.63
LML 1988-1995 20.84 20.67 17.46 28.36 18.20 7.88 0.05 3.95 -0.69 1996-2005 -8.61 -5.14 17.31 39.43 3.44 15.19 1.05 4.75 -2.82
Maharashtra Scooters
1988-1995 14.70 14.94 19.16 N.A. 13.05 8.06 0.00 0.00 7.72 1996-2005 -16.65 -15.00 3.60 N.A. 27.99 8.78 0.00 0.00 7.30
Majestic Auto 1988-1995 35.34 32.84 25.97 -100.00 33.31 20.71 0.11 14.82 -1.35 1996-2005 25.33 21.61 20.76 75.93 -5.00 9.75 0.53 13.86 -2.85
Scooters India 1988-1995 39.89 41.33 10.50 N.A. 13.86 1.50 0.00 4.78 -111.88 1996-2005 8.01 8.66 8.82 12.22 6.23 6.22 0.14 0.77 8.74
TVS Motor Co. 1988-1995 22.63 22.39 17.42 38.93 10.35 15.48 0.39 3.00 2.39 1996-2005 20.25 19.04 21.45 42.99 23.79 26.46 1.59 1.95 4.68
VCCL 1988-1995 -31.84 -34.79 -20.65 N.A. -1.54 -0.17 0.00 6.04 -302.72 1996-2005 95.79 133.65 -10.11 N.A. -10.86 -0.44 0.00 0.00 652.26
Average 1988-1995 19.09 18.56 17.57 45.99 14.97 11.78 0.23 4.49 -37.81 1996-2005 19.81 22.48 13.89 20.95 10.05 13.49 0.60 3.99 57.47
Source: Calculations from CMIE Prowess Database and Annual Reports of Companies Notes: 1. All values are in Rs. crore in current prices 2. R&D Share, Export Share and Profit Share are the shares of R&D, Export and Profit Expenses in total sales, respectively, in Rs. crore in current prices
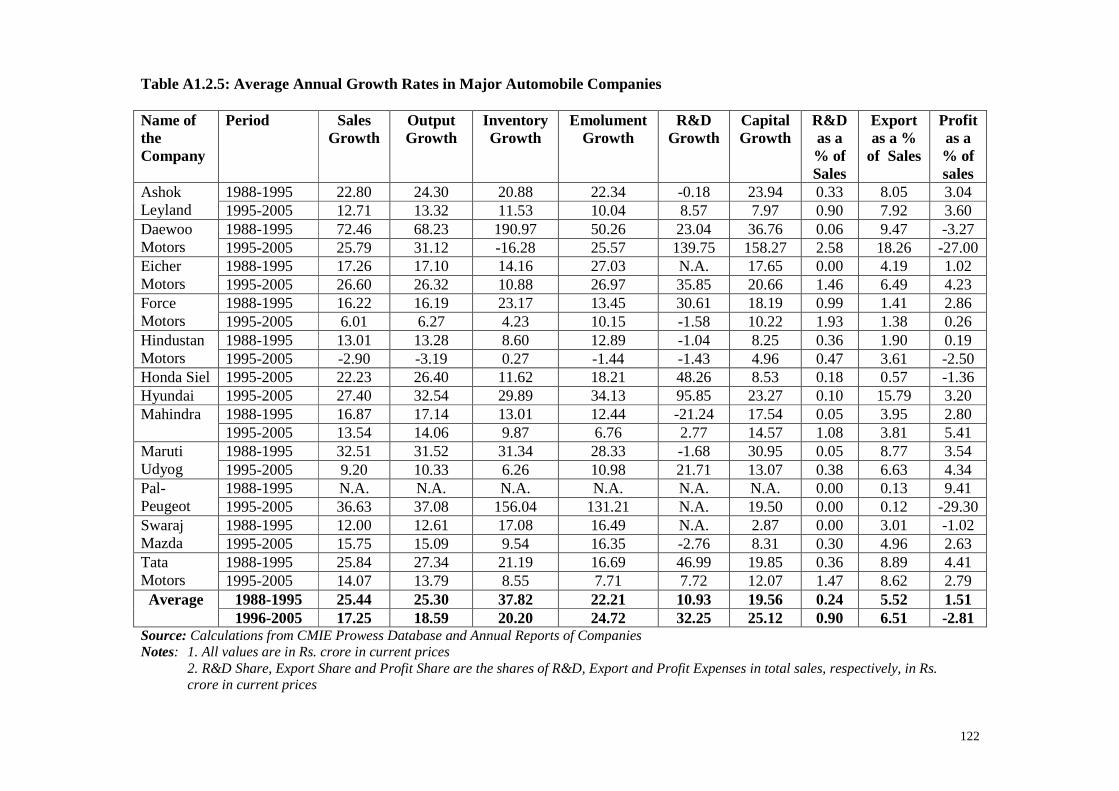
122
Table A1.2.5: Average Annual Growth Rates in Major Automobile Companies
Name of the Company
Period Sales Growth
Output Growth
Inventory Growth
Emolument Growth
R&D Growth
Capital Growth
R&D as a % of Sales
Export as a %
of Sales
Profit as a % of sales
Ashok Leyland
1988-1995 22.80 24.30 20.88 22.34 -0.18 23.94 0.33 8.05 3.04 1995-2005 12.71 13.32 11.53 10.04 8.57 7.97 0.90 7.92 3.60
Daewoo Motors
1988-1995 72.46 68.23 190.97 50.26 23.04 36.76 0.06 9.47 -3.27 1995-2005 25.79 31.12 -16.28 25.57 139.75 158.27 2.58 18.26 -27.00
Eicher Motors
1988-1995 17.26 17.10 14.16 27.03 N.A. 17.65 0.00 4.19 1.02 1995-2005 26.60 26.32 10.88 26.97 35.85 20.66 1.46 6.49 4.23
Force Motors
1988-1995 16.22 16.19 23.17 13.45 30.61 18.19 0.99 1.41 2.86 1995-2005 6.01 6.27 4.23 10.15 -1.58 10.22 1.93 1.38 0.26
Hindustan Motors
1988-1995 13.01 13.28 8.60 12.89 -1.04 8.25 0.36 1.90 0.19 1995-2005 -2.90 -3.19 0.27 -1.44 -1.43 4.96 0.47 3.61 -2.50
Honda Siel 1995-2005 22.23 26.40 11.62 18.21 48.26 8.53 0.18 0.57 -1.36 Hyundai 1995-2005 27.40 32.54 29.89 34.13 95.85 23.27 0.10 15.79 3.20 Mahindra 1988-1995 16.87 17.14 13.01 12.44 -21.24 17.54 0.05 3.95 2.80
1995-2005 13.54 14.06 9.87 6.76 2.77 14.57 1.08 3.81 5.41 Maruti Udyog
1988-1995 32.51 31.52 31.34 28.33 -1.68 30.95 0.05 8.77 3.54 1995-2005 9.20 10.33 6.26 10.98 21.71 13.07 0.38 6.63 4.34
Pal-Peugeot
1988-1995 N.A. N.A. N.A. N.A. N.A. N.A. 0.00 0.13 9.41 1995-2005 36.63 37.08 156.04 131.21 N.A. 19.50 0.00 0.12 -29.30
Swaraj Mazda
1988-1995 12.00 12.61 17.08 16.49 N.A. 2.87 0.00 3.01 -1.02 1995-2005 15.75 15.09 9.54 16.35 -2.76 8.31 0.30 4.96 2.63
Tata Motors
1988-1995 25.84 27.34 21.19 16.69 46.99 19.85 0.36 8.89 4.41 1995-2005 14.07 13.79 8.55 7.71 7.72 12.07 1.47 8.62 2.79
Average 1988-1995 25.44 25.30 37.82 22.21 10.93 19.56 0.24 5.52 1.51 1996-2005 17.25 18.59 20.20 24.72 32.25 25.12 0.90 6.51 -2.81
Source: Calculations from CMIE Prowess Database and Annual Reports of Companies Notes: 1. All values are in Rs. crore in current prices
2. R&D Share, Export Share and Profit Share are the shares of R&D, Export and Profit Expenses in total sales, respectively, in Rs. crore in current prices
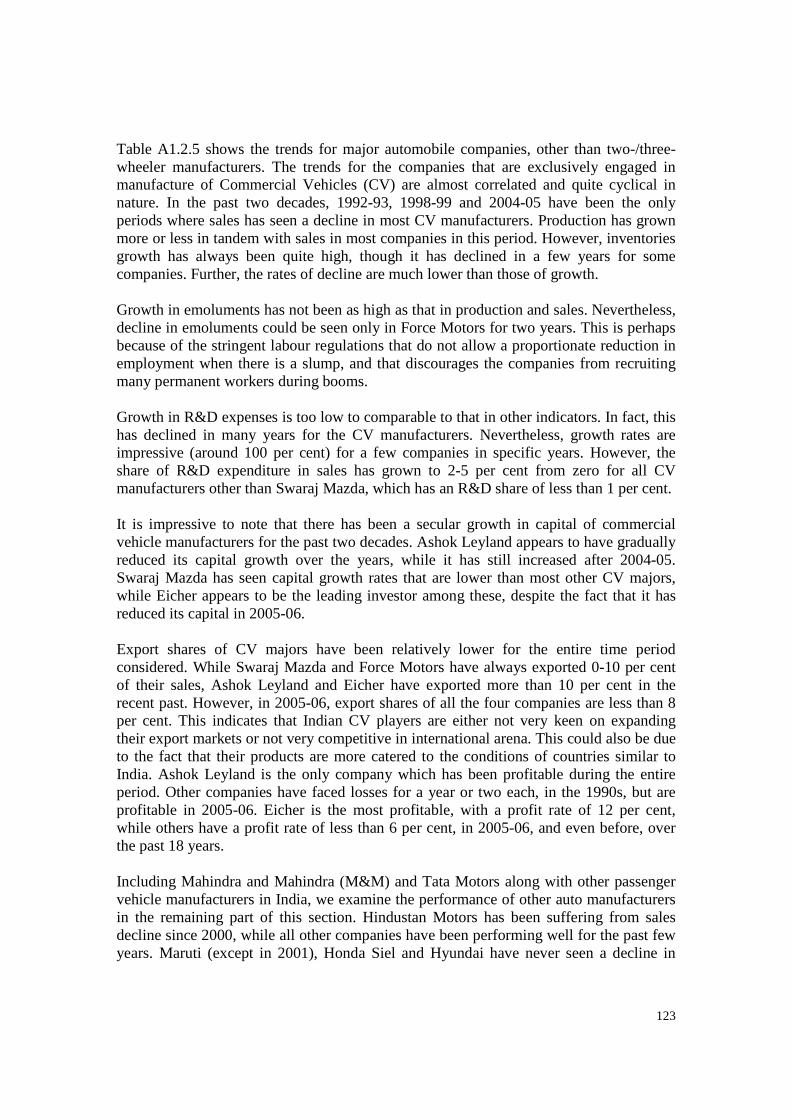
123
Table A1.2.5 shows the trends for major automobile companies, other than two-/three-wheeler manufacturers. The trends for the companies that are exclusively engaged in manufacture of Commercial Vehicles (CV) are almost correlated and quite cyclical in nature. In the past two decades, 1992-93, 1998-99 and 2004-05 have been the only periods where sales has seen a decline in most CV manufacturers. Production has grown more or less in tandem with sales in most companies in this period. However, inventories growth has always been quite high, though it has declined in a few years for some companies. Further, the rates of decline are much lower than those of growth. Growth in emoluments has not been as high as that in production and sales. Nevertheless, decline in emoluments could be seen only in Force Motors for two years. This is perhaps because of the stringent labour regulations that do not allow a proportionate reduction in employment when there is a slump, and that discourages the companies from recruiting many permanent workers during booms. Growth in R&D expenses is too low to comparable to that in other indicators. In fact, this has declined in many years for the CV manufacturers. Nevertheless, growth rates are impressive (around 100 per cent) for a few companies in specific years. However, the share of R&D expenditure in sales has grown to 2-5 per cent from zero for all CV manufacturers other than Swaraj Mazda, which has an R&D share of less than 1 per cent. It is impressive to note that there has been a secular growth in capital of commercial vehicle manufacturers for the past two decades. Ashok Leyland appears to have gradually reduced its capital growth over the years, while it has still increased after 2004-05. Swaraj Mazda has seen capital growth rates that are lower than most other CV majors, while Eicher appears to be the leading investor among these, despite the fact that it has reduced its capital in 2005-06. Export shares of CV majors have been relatively lower for the entire time period considered. While Swaraj Mazda and Force Motors have always exported 0-10 per cent of their sales, Ashok Leyland and Eicher have exported more than 10 per cent in the recent past. However, in 2005-06, export shares of all the four companies are less than 8 per cent. This indicates that Indian CV players are either not very keen on expanding their export markets or not very competitive in international arena. This could also be due to the fact that their products are more catered to the conditions of countries similar to India. Ashok Leyland is the only company which has been profitable during the entire period. Other companies have faced losses for a year or two each, in the 1990s, but are profitable in 2005-06. Eicher is the most profitable, with a profit rate of 12 per cent, while others have a profit rate of less than 6 per cent, in 2005-06, and even before, over the past 18 years. Including Mahindra and Mahindra (M&M) and Tata Motors along with other passenger vehicle manufacturers in India, we examine the performance of other auto manufacturers in the remaining part of this section. Hindustan Motors has been suffering from sales decline since 2000, while all other companies have been performing well for the past few years. Maruti (except in 2001), Honda Siel and Hyundai have never seen a decline in
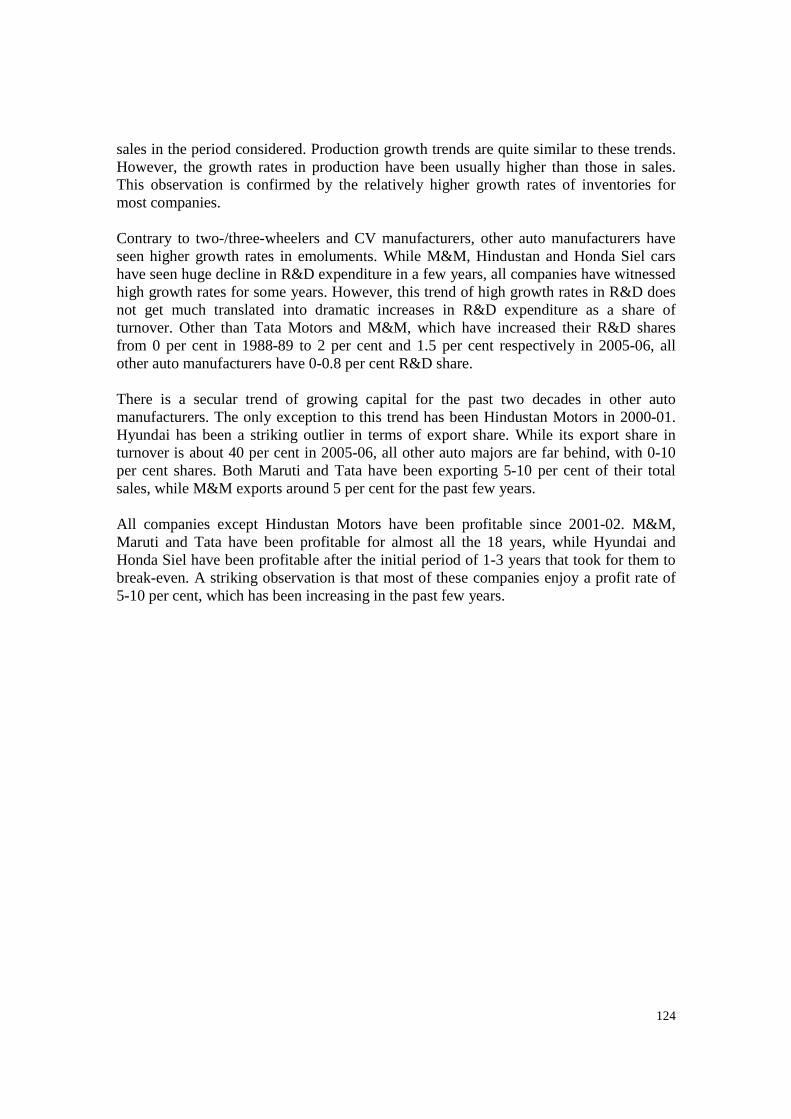
124
sales in the period considered. Production growth trends are quite similar to these trends. However, the growth rates in production have been usually higher than those in sales. This observation is confirmed by the relatively higher growth rates of inventories for most companies. Contrary to two-/three-wheelers and CV manufacturers, other auto manufacturers have seen higher growth rates in emoluments. While M&M, Hindustan and Honda Siel cars have seen huge decline in R&D expenditure in a few years, all companies have witnessed high growth rates for some years. However, this trend of high growth rates in R&D does not get much translated into dramatic increases in R&D expenditure as a share of turnover. Other than Tata Motors and M&M, which have increased their R&D shares from 0 per cent in 1988-89 to 2 per cent and 1.5 per cent respectively in 2005-06, all other auto manufacturers have 0-0.8 per cent R&D share. There is a secular trend of growing capital for the past two decades in other auto manufacturers. The only exception to this trend has been Hindustan Motors in 2000-01. Hyundai has been a striking outlier in terms of export share. While its export share in turnover is about 40 per cent in 2005-06, all other auto majors are far behind, with 0-10 per cent shares. Both Maruti and Tata have been exporting 5-10 per cent of their total sales, while M&M exports around 5 per cent for the past few years. All companies except Hindustan Motors have been profitable since 2001-02. M&M, Maruti and Tata have been profitable for almost all the 18 years, while Hyundai and Honda Siel have been profitable after the initial period of 1-3 years that took for them to break-even. A striking observation is that most of these companies enjoy a profit rate of 5-10 per cent, which has been increasing in the past few years.
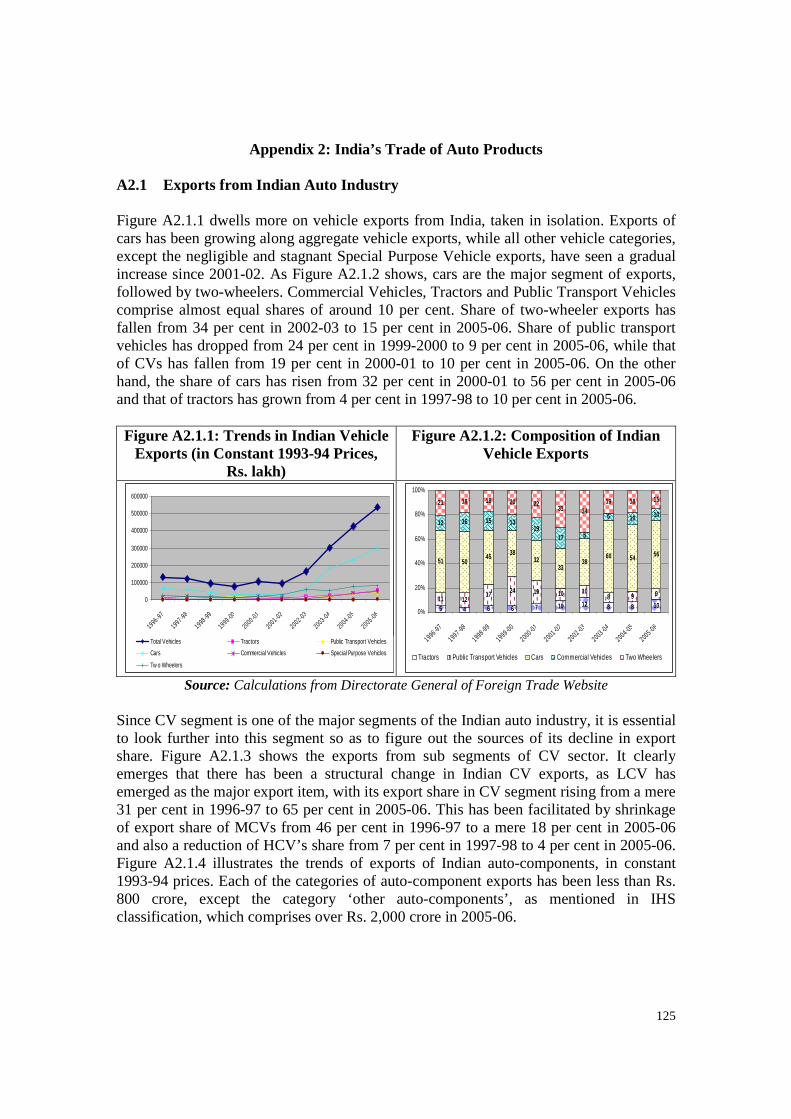
125
Appendix 2: India’s Trade of Auto Products A2.1 Exports from Indian Auto Industry Figure A2.1.1 dwells more on vehicle exports from India, taken in isolation. Exports of cars has been growing along aggregate vehicle exports, while all other vehicle categories, except the negligible and stagnant Special Purpose Vehicle exports, have seen a gradual increase since 2001-02. As Figure A2.1.2 shows, cars are the major segment of exports, followed by two-wheelers. Commercial Vehicles, Tractors and Public Transport Vehicles comprise almost equal shares of around 10 per cent. Share of two-wheeler exports has fallen from 34 per cent in 2002-03 to 15 per cent in 2005-06. Share of public transport vehicles has dropped from 24 per cent in 1999-2000 to 9 per cent in 2005-06, while that of CVs has fallen from 19 per cent in 2000-01 to 10 per cent in 2005-06. On the other hand, the share of cars has risen from 32 per cent in 2000-01 to 56 per cent in 2005-06 and that of tractors has grown from 4 per cent in 1997-98 to 10 per cent in 2005-06. Figure A2.1.1: Trends in Indian Vehicle
Exports (in Constant 1993-94 Prices, Rs. lakh)
Figure A2.1.2: Composition of Indian Vehicle Exports
0
100000
200000
300000
400000
500000
600000
1996-97
1997 -98
1998-99
1999-00
2000 -01
2001 -02
2002 -03
2003 -04
2004 -05
2005 -06
Total Vehicles Tractors Public Transport Vehicles
Cars Commercial Vehicles Special Purpose Vehicles
Tw o Wheelers
5 4 6 6 7 10 12 8 8 1011 12
17 24 19 10 108 9 9
51 5045 38
3233
3860 54 56
12 16 15 1319
17 5
6 10 10
21 18 18 20 2231 34
19 18 15
0%
20%
40%
60%
80%
100%
1996 -97
1997 -98
1998 -99
1999 -00
2000 -01
2001 -02
2002 -03
2003 -04
2004 -05
2005 -06
Tractors Public Transport Vehicles Cars Commercial Vehicles Two Wheelers
Source: Calculations from Directorate General of Foreign Trade Website Since CV segment is one of the major segments of the Indian auto industry, it is essential to look further into this segment so as to figure out the sources of its decline in export share. Figure A2.1.3 shows the exports from sub segments of CV sector. It clearly emerges that there has been a structural change in Indian CV exports, as LCV has emerged as the major export item, with its export share in CV segment rising from a mere 31 per cent in 1996-97 to 65 per cent in 2005-06. This has been facilitated by shrinkage of export share of MCVs from 46 per cent in 1996-97 to a mere 18 per cent in 2005-06 and also a reduction of HCV’s share from 7 per cent in 1997-98 to 4 per cent in 2005-06. Figure A2.1.4 illustrates the trends of exports of Indian auto-components, in constant 1993-94 prices. Each of the categories of auto-component exports has been less than Rs. 800 crore, except the category ‘other auto-components’, as mentioned in IHS classification, which comprises over Rs. 2,000 crore in 2005-06.
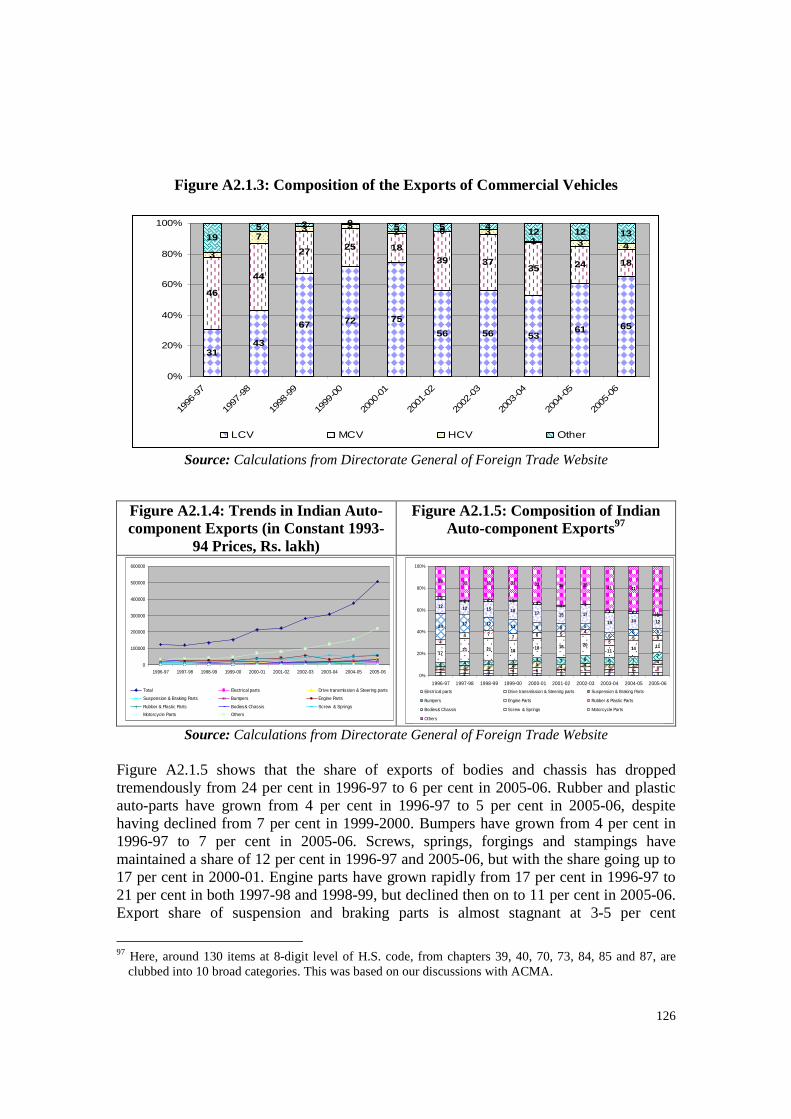
126
Figure A2.1.3: Composition of the Exports of Commercial Vehicles
3143
67 72 75
56 56 5361 65
46
44
27 25 1839 37
35 24 183
73 3
2 0 31 3 4
195 2 0 5 5 4
12 12 13
0%
20%
40%
60%
80%
100%
1996
-97
1997
-98
1998
-99
1999
-00
2000
-01
2001
-02
2002
-03
2003
-04
2004
-05
2005
-06
LCV MCV HCV Other
Source: Calculations from Directorate General of Foreign Trade Website
Figure A2.1.4: Trends in Indian Auto-component Exports (in Constant 1993-
94 Prices, Rs. lakh)
Figure A2.1.5: Composition of Indian Auto-component Exports97
0
100000
200000
300000
400000
500000
600000
1996-97 1997-98 1998-99 1999-00 2000-01 2001-02 2002-03 2003-04 2004-05 2005-06
Total Electrical parts Drive transmission & Steering parts
Suspension & Braking Parts Bumpers Engine Parts
Rubber & Plastic Parts Bodies& Chassis Screw & Springs
Motorcycle Parts Others
3 2 2 2 2 2 3 2 33 3 3 4 6 3 5 4 5 83 4 5 4 5 4 4 4 344 4 4 3 4 7 6 6 77
1721 21 18 18 18 20
11 14 114
4 7 7 6 5 4
55 5
24 17 12 13 9 8 5
66 6
12 12 15 16 17 15 17
19 14 12
22 2 1 1 1 1
2 2 1
28 31 31 31 33 3541 41 44
3
36
0%
20%
40%
60%
80%
100%
1996-97 1997-98 1998-99 1999-00 2000-01 2001-02 2002-03 2003-04 2004-05 2005-06
Electrical parts Drive transmission & Steering parts Suspension & Braking Parts
Bumpers Engine Parts Rubber & Plastic Parts
Bodies& Chassis Screw & Springs Motorcycle Parts
Others
Source: Calculations from Directorate General of Foreign Trade Website Figure A2.1.5 shows that the share of exports of bodies and chassis has dropped tremendously from 24 per cent in 1996-97 to 6 per cent in 2005-06. Rubber and plastic auto-parts have grown from 4 per cent in 1996-97 to 5 per cent in 2005-06, despite having declined from 7 per cent in 1999-2000. Bumpers have grown from 4 per cent in 1996-97 to 7 per cent in 2005-06. Screws, springs, forgings and stampings have maintained a share of 12 per cent in 1996-97 and 2005-06, but with the share going up to 17 per cent in 2000-01. Engine parts have grown rapidly from 17 per cent in 1996-97 to 21 per cent in both 1997-98 and 1998-99, but declined then on to 11 per cent in 2005-06. Export share of suspension and braking parts is almost stagnant at 3-5 per cent
97 Here, around 130 items at 8-digit level of H.S. code, from chapters 39, 40, 70, 73, 84, 85 and 87, are
clubbed into 10 broad categories. This was based on our discussions with ACMA.
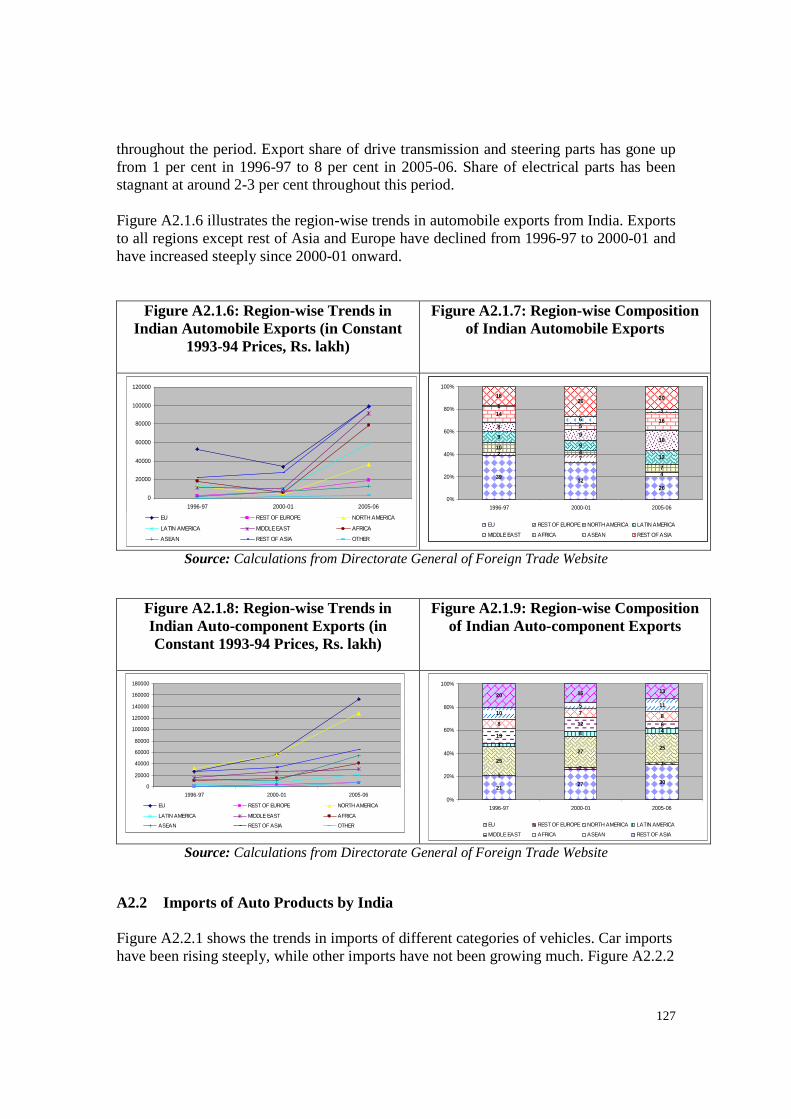
127
throughout the period. Export share of drive transmission and steering parts has gone up from 1 per cent in 1996-97 to 8 per cent in 2005-06. Share of electrical parts has been stagnant at around 2-3 per cent throughout this period. Figure A2.1.6 illustrates the region-wise trends in automobile exports from India. Exports to all regions except rest of Asia and Europe have declined from 1996-97 to 2000-01 and have increased steeply since 2000-01 onward.
Figure A2.1.6: Region-wise Trends in Indian Automobile Exports (in Constant
1993-94 Prices, Rs. lakh)
Figure A2.1.7: Region-wise Composition of Indian Automobile Exports
0
20000
40000
60000
80000
100000
120000
1996-97 2000-01 2005-06
EU REST OF EUROPE NORTH AMERICA
LATIN AMERICA MIDDLE EAST AFRICA
ASEAN REST OF ASIA OTHER
3932
20
27
4
104
7
99
12
89
18
14
516
1
63
1626 20
0%
20%
40%
60%
80%
100%
1996-97 2000-01 2005-06
EU REST OF EUROPE NORTH AMERICA LATIN AMERICA
MIDDLE EAST AFRICA ASEAN REST OF ASIA
Source: Calculations from Directorate General of Foreign Trade Website
Figure A2.1.8: Region-wise Trends in Indian Auto-component Exports (in Constant 1993-94 Prices, Rs. lakh)
Figure A2.1.9: Region-wise Composition of Indian Auto-component Exports
0
20000
40000
60000
80000
100000
120000
140000
160000
180000
1996-97 2000-01 2005-06
EU REST OF EUROPE NORTH AMERICA
LATIN AMERICA MIDDLE EAST AFRICA
ASEAN REST OF ASIA OTHER
2127 30
12
125
27253
4 413
12 68
7 8105 11
20 16 13
0%
20%
40%
60%
80%
100%
1996-97 2000-01 2005-06
EU REST OF EUROPE NORTH AMERICA LATIN AMERICA
MIDDLE EAST AFRICA ASEAN REST OF ASIA Source: Calculations from Directorate General of Foreign Trade Website
A2.2 Imports of Auto Products by India Figure A2.2.1 shows the trends in imports of different categories of vehicles. Car imports have been rising steeply, while other imports have not been growing much. Figure A2.2.2
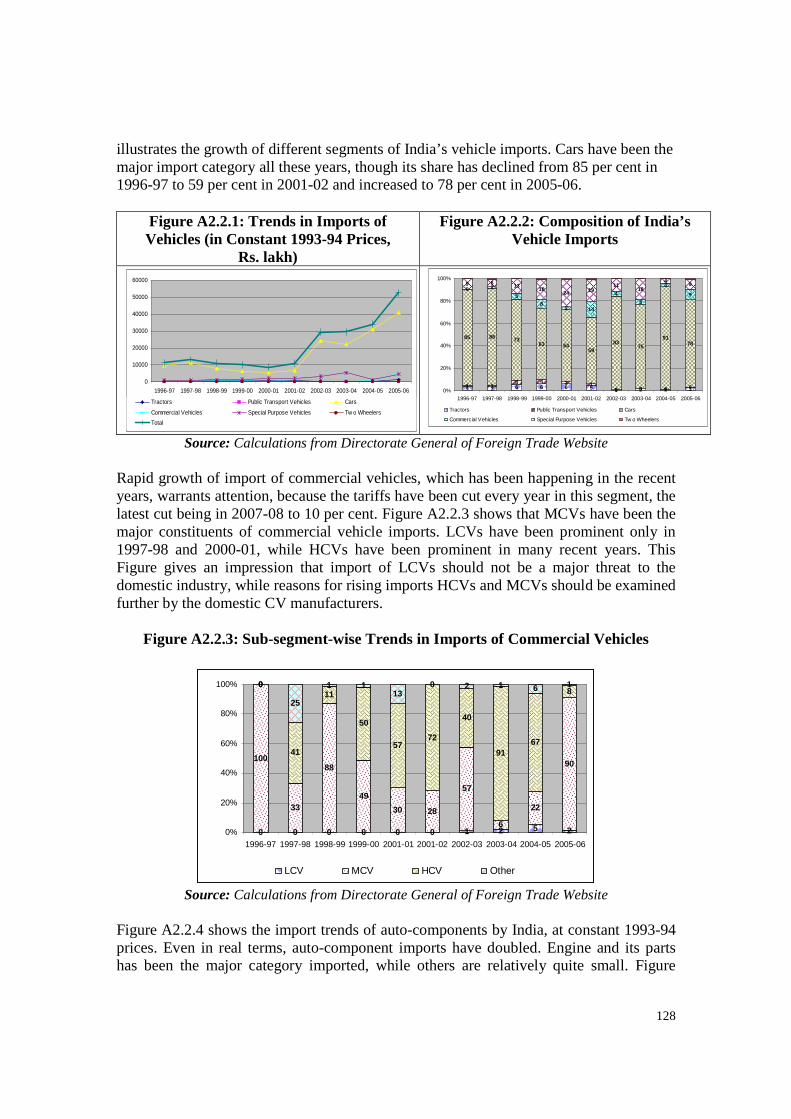
128
illustrates the growth of different segments of India’s vehicle imports. Cars have been the major import category all these years, though its share has declined from 85 per cent in 1996-97 to 59 per cent in 2001-02 and increased to 78 per cent in 2005-06.
Figure A2.2.1: Trends in Imports of Vehicles (in Constant 1993-94 Prices,
Rs. lakh)
Figure A2.2.2: Composition of India’s Vehicle Imports
0
10000
20000
30000
40000
50000
60000
1996-97 1997-98 1998-99 1999-00 2000-01 2001-02 2002-03 2003-04 2004-05 2005-06
Tractors Public Transport Vehicles Cars
Commercial Vehicles Special Purpose Vehicles Tw o Wheelers
Total
4 3 6 6 6 5 1 2 1 31 1
3 4 2 10 0 0 0
85 86 7363 64
5983
75
9178
0 2
58
3 14
4
5
3
9
9 6 1318
24 1911
18
49
0%
20%
40%
60%
80%
100%
1996-97 1997-98 1998-99 1999-00 2000-01 2001-02 2002-03 2003-04 2004-05 2005-06
Tractors Public Transport Vehicles Cars
Commercial Vehicles Special Purpose Vehicles Tw o Wheelers Source: Calculations from Directorate General of Foreign Trade Website
Rapid growth of import of commercial vehicles, which has been happening in the recent years, warrants attention, because the tariffs have been cut every year in this segment, the latest cut being in 2007-08 to 10 per cent. Figure A2.2.3 shows that MCVs have been the major constituents of commercial vehicle imports. LCVs have been prominent only in 1997-98 and 2000-01, while HCVs have been prominent in many recent years. This Figure gives an impression that import of LCVs should not be a major threat to the domestic industry, while reasons for rising imports HCVs and MCVs should be examined further by the domestic CV manufacturers.
Figure A2.2.3: Sub-segment-wise Trends in Imports of Commercial Vehicles
0 0 0 0 0 0 1 2 5 2
100
33
88
49
30 28
57
6
22
90
0
41
11
50
5772
40
9167
80
25
1 113
0 2 1 6 1
0%
20%
40%
60%
80%
100%
1996-97 1997-98 1998-99 1999-00 2001-01 2001-02 2002-03 2003-04 2004-05 2005-06
LCV MCV HCV Other
Source: Calculations from Directorate General of Foreign Trade Website Figure A2.2.4 shows the import trends of auto-components by India, at constant 1993-94 prices. Even in real terms, auto-component imports have doubled. Engine and its parts has been the major category imported, while others are relatively quite small. Figure
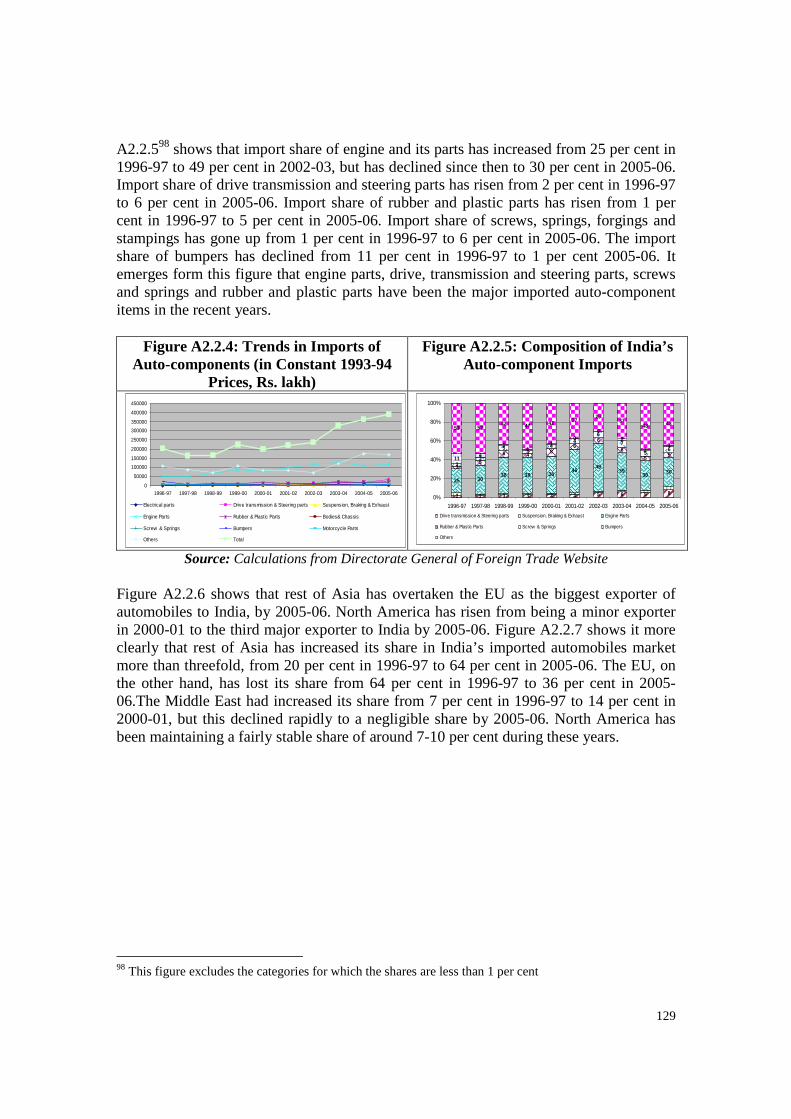
129
A2.2.598 shows that import share of engine and its parts has increased from 25 per cent in 1996-97 to 49 per cent in 2002-03, but has declined since then to 30 per cent in 2005-06. Import share of drive transmission and steering parts has risen from 2 per cent in 1996-97 to 6 per cent in 2005-06. Import share of rubber and plastic parts has risen from 1 per cent in 1996-97 to 5 per cent in 2005-06. Import share of screws, springs, forgings and stampings has gone up from 1 per cent in 1996-97 to 6 per cent in 2005-06. The import share of bumpers has declined from 11 per cent in 1996-97 to 1 per cent 2005-06. It emerges form this figure that engine parts, drive, transmission and steering parts, screws and springs and rubber and plastic parts have been the major imported auto-component items in the recent years.
Figure A2.2.4: Trends in Imports of Auto-components (in Constant 1993-94
Prices, Rs. lakh)
Figure A2.2.5: Composition of India’s Auto-component Imports
0
50000
100000
150000
200000
250000
300000
350000
400000
450000
1996-97 1997-98 1998-99 1999-00 2000-01 2001-02 2002-03 2003-04 2004-05 2005-06
Electrical parts Drive transmission & Steering parts Suspension, Braking & Exhaust
Engine Parts Rubber & Plastic Parts Bodies& Chassis
Screw & Springs Bumpers Motorcycle Parts
Others Total
2 2 3 3 3 3 5 6 5 8
25 3038 38 38
4649
3930 30
35
6 48
66
6
5 5
33
53
44
6
7
56
114
11
10
0
2
21
53 5242 47 42 37
2937
48 43
0%
20%
40%
60%
80%
100%
1996-97 1997-98 1998-99 1999-00 2000-01 2001-02 2002-03 2003-04 2004-05 2005-06
Drive transmission & Steering parts Suspension, Braking & Exhaust Engine Parts
Rubber & Plastic Parts Screw & Springs Bumpers
Others Source: Calculations from Directorate General of Foreign Trade Website
Figure A2.2.6 shows that rest of Asia has overtaken the EU as the biggest exporter of automobiles to India, by 2005-06. North America has risen from being a minor exporter in 2000-01 to the third major exporter to India by 2005-06. Figure A2.2.7 shows it more clearly that rest of Asia has increased its share in India’s imported automobiles market more than threefold, from 20 per cent in 1996-97 to 64 per cent in 2005-06. The EU, on the other hand, has lost its share from 64 per cent in 1996-97 to 36 per cent in 2005-06.The Middle East had increased its share from 7 per cent in 1996-97 to 14 per cent in 2000-01, but this declined rapidly to a negligible share by 2005-06. North America has been maintaining a fairly stable share of around 7-10 per cent during these years.
98 This figure excludes the categories for which the shares are less than 1 per cent
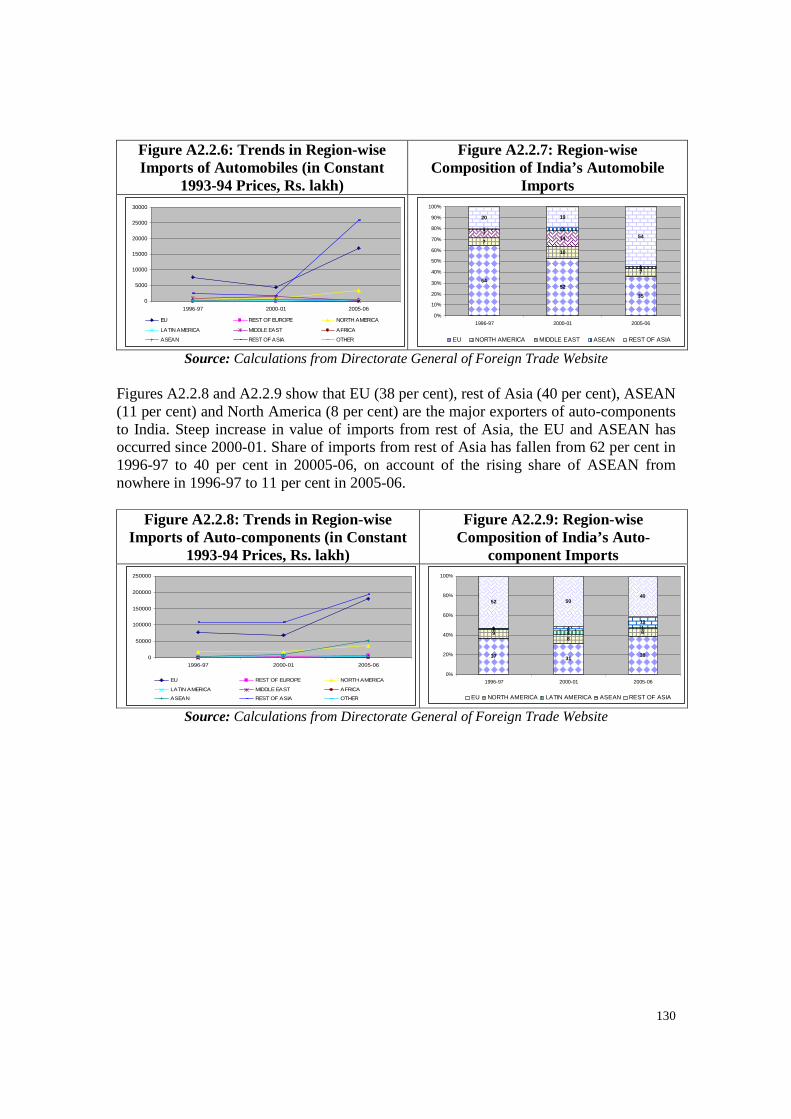
130
Figure A2.2.6: Trends in Region-wise Imports of Automobiles (in Constant
1993-94 Prices, Rs. lakh)
Figure A2.2.7: Region-wise Composition of India’s Automobile
Imports
0
5000
10000
15000
20000
25000
30000
1996-97 2000-01 2005-06
EU REST OF EUROPE NORTH AMERICA
LATIN AMERICA MIDDLE EAST AFRICA
ASEAN REST OF ASIA OTHER
6452
35
7
10
7
714
0
1 3
1
20 19
54
0%
10%
20%
30%
40%
50%
60%
70%
80%
90%
100%
1996-97 2000-01 2005-06
EU NORTH AMERICA MIDDLE EAST ASEAN REST OF ASIA
Source: Calculations from Directorate General of Foreign Trade Website Figures A2.2.8 and A2.2.9 show that EU (38 per cent), rest of Asia (40 per cent), ASEAN (11 per cent) and North America (8 per cent) are the major exporters of auto-components to India. Steep increase in value of imports from rest of Asia, the EU and ASEAN has occurred since 2000-01. Share of imports from rest of Asia has fallen from 62 per cent in 1996-97 to 40 per cent in 20005-06, on account of the rising share of ASEAN from nowhere in 1996-97 to 11 per cent in 2005-06.
Figure A2.2.8: Trends in Region-wise Imports of Auto-components (in Constant
1993-94 Prices, Rs. lakh)
Figure A2.2.9: Region-wise Composition of India’s Auto-
component Imports
0
50000
100000
150000
200000
250000
1996-97 2000-01 2005-06
EU REST OF EUROPE NORTH AMERICA
LATIN AMERICA MIDDLE EAST AFRICA
ASEAN REST OF ASIA OTHER
37 3138
98
80
411 411
52 5040
0%
20%
40%
60%
80%
100%
1996-97 2000-01 2005-06
EU NORTH AMERICA LATIN AMERICA ASEAN REST OF ASIA
Source: Calculations from Directorate General of Foreign Trade Website
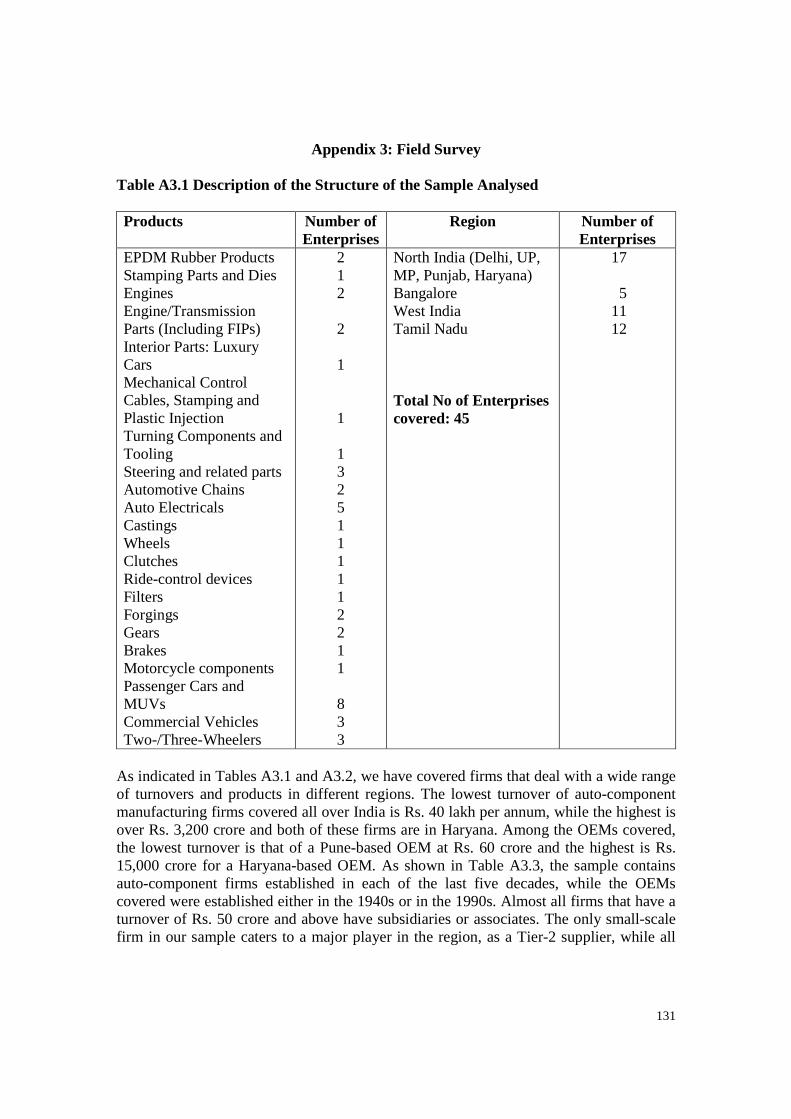
131
Appendix 3: Field Survey
Table A3.1 Description of the Structure of the Sample Analysed
Products Number of Enterprises
Region Number of Enterprises
EPDM Rubber Products Stamping Parts and Dies Engines Engine/Transmission Parts (Including FIPs) Interior Parts: Luxury Cars Mechanical Control Cables, Stamping and Plastic Injection Turning Components and Tooling Steering and related parts Automotive Chains Auto Electricals Castings Wheels Clutches Ride-control devices Filters Forgings Gears Brakes Motorcycle components Passenger Cars and MUVs Commercial Vehicles Two-/Three-Wheelers
2 1 2 2 1 1 1 3 2 5 1 1 1 1 1 2 2 1 1 8 3 3
North India (Delhi, UP, MP, Punjab, Haryana) Bangalore West India Tamil Nadu Total No of Enterprises covered: 45
17
5 11 12
As indicated in Tables A3.1 and A3.2, we have covered firms that deal with a wide range of turnovers and products in different regions. The lowest turnover of auto-component manufacturing firms covered all over India is Rs. 40 lakh per annum, while the highest is over Rs. 3,200 crore and both of these firms are in Haryana. Among the OEMs covered, the lowest turnover is that of a Pune-based OEM at Rs. 60 crore and the highest is Rs. 15,000 crore for a Haryana-based OEM. As shown in Table A3.3, the sample contains auto-component firms established in each of the last five decades, while the OEMs covered were established either in the 1940s or in the 1990s. Almost all firms that have a turnover of Rs. 50 crore and above have subsidiaries or associates. The only small-scale firm in our sample caters to a major player in the region, as a Tier-2 supplier, while all
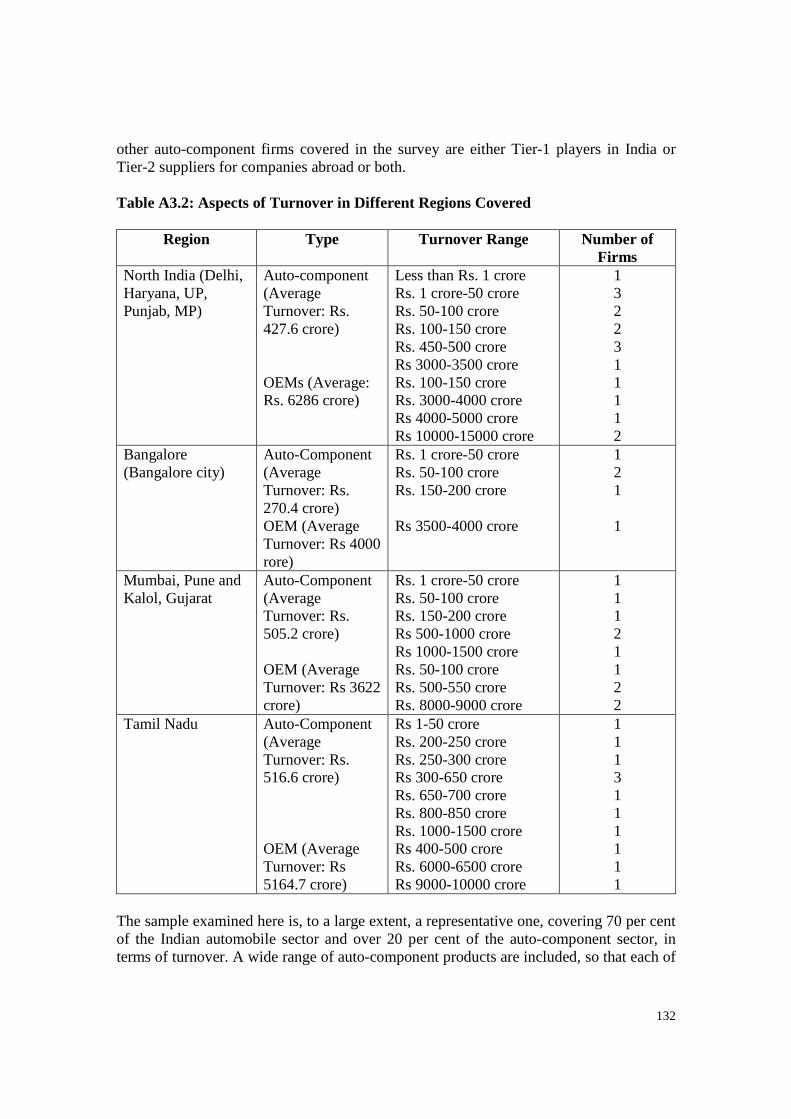
132
other auto-component firms covered in the survey are either Tier-1 players in India or Tier-2 suppliers for companies abroad or both. Table A3.2: Aspects of Turnover in Different Regions Covered
Region Type Turnover Range Number of Firms
North India (Delhi, Haryana, UP, Punjab, MP)
Auto-component (Average Turnover: Rs. 427.6 crore) OEMs (Average: Rs. 6286 crore)
Less than Rs. 1 crore Rs. 1 crore-50 crore Rs. 50-100 crore Rs. 100-150 crore Rs. 450-500 crore Rs 3000-3500 crore Rs. 100-150 crore Rs. 3000-4000 crore Rs 4000-5000 crore Rs 10000-15000 crore
1 3 2 2 3 1 1 1 1 2
Bangalore (Bangalore city)
Auto-Component (Average Turnover: Rs. 270.4 crore) OEM (Average Turnover: Rs 4000 rore)
Rs. 1 crore-50 crore Rs. 50-100 crore Rs. 150-200 crore Rs 3500-4000 crore
1 2 1 1
Mumbai, Pune and Kalol, Gujarat
Auto-Component (Average Turnover: Rs. 505.2 crore) OEM (Average Turnover: Rs 3622 crore)
Rs. 1 crore-50 crore Rs. 50-100 crore Rs. 150-200 crore Rs 500-1000 crore Rs 1000-1500 crore Rs. 50-100 crore Rs. 500-550 crore Rs. 8000-9000 crore
1 1 1 2 1 1 2 2
Tamil Nadu Auto-Component (Average Turnover: Rs. 516.6 crore) OEM (Average Turnover: Rs 5164.7 crore)
Rs 1-50 crore Rs. 200-250 crore Rs. 250-300 crore Rs 300-650 crore Rs. 650-700 crore Rs. 800-850 crore Rs. 1000-1500 crore Rs 400-500 crore Rs. 6000-6500 crore Rs 9000-10000 crore
1 1 1 3 1 1 1 1 1 1
The sample examined here is, to a large extent, a representative one, covering 70 per cent of the Indian automobile sector and over 20 per cent of the auto-component sector, in terms of turnover. A wide range of auto-component products are included, so that each of
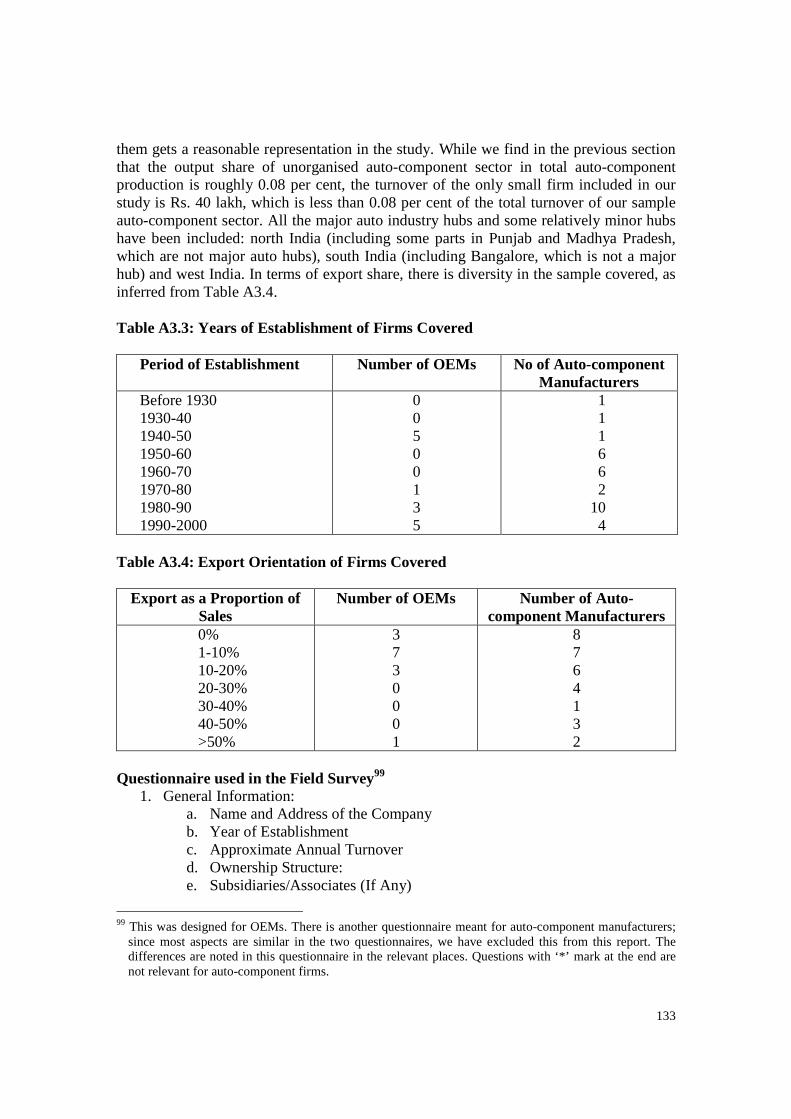
133
them gets a reasonable representation in the study. While we find in the previous section that the output share of unorganised auto-component sector in total auto-component production is roughly 0.08 per cent, the turnover of the only small firm included in our study is Rs. 40 lakh, which is less than 0.08 per cent of the total turnover of our sample auto-component sector. All the major auto industry hubs and some relatively minor hubs have been included: north India (including some parts in Punjab and Madhya Pradesh, which are not major auto hubs), south India (including Bangalore, which is not a major hub) and west India. In terms of export share, there is diversity in the sample covered, as inferred from Table A3.4. Table A3.3: Years of Establishment of Firms Covered
Period of Establishment Number of OEMs No of Auto-component Manufacturers
Before 1930 1930-40 1940-50 1950-60 1960-70 1970-80 1980-90 1990-2000
0 0 5 0 0 1 3 5
1 1 1 6 6 2
10 4
Table A3.4: Export Orientation of Firms Covered
Export as a Proportion of Sales
Number of OEMs Number of Auto-component Manufacturers
0% 1-10% 10-20% 20-30% 30-40% 40-50% >50%
3 7 3 0 0 0 1
8 7 6 4 1 3 2
Questionnaire used in the Field Survey99
1. General Information: a. Name and Address of the Company b. Year of Establishment c. Approximate Annual Turnover d. Ownership Structure: e. Subsidiaries/Associates (If Any)
99 This was designed for OEMs. There is another questionnaire meant for auto-component manufacturers;
since most aspects are similar in the two questionnaires, we have excluded this from this report. The differences are noted in this questionnaire in the relevant places. Questions with ‘*’ mark at the end are not relevant for auto-component firms.
134
2. Production Structure: a. Products: b. Total Manufacturing Area (Square Feet) c. Personnel Details:
i. Number of Production Employees ii. Number of Supervisory Staff iii. Number of Administrative Staff iv. Number of R&D Employees v. Number of Management Executives
d. Installed Capacity and Actual Production of Each Product: e. If Installed capacity is more than Actual Production, what are the reasons
for producing less than the potential? f. Has the scale of production been perceived a serious problem (as being too
excessive or too limited) in the recent past? i. If yes, what was the context and how was it proposed to be solved?
g. Is there any recent addition to the product range and/or individual products? Yes, this year/ Yes, in the past 2 years / Yes, in the past 5 years/ No
h. Supplier Details (If Any): i. Products ii. Number of Suppliers for Each Finished/Intermediate Product iii. Expenditure and Output Shares of Suppliers iv. Role of Suppliers in Timely Delivery of Products to Customers
Excellent/Good/Satisfactory/Poor v. Do you think Indian component-manufacturers are competitive in
all your component supply requirements?* 1. What are their strengths relative to other countries? 2. What are their drawbacks and weaknesses compared to
other countries, from where you import? i. Has Infrastructure bottleneck been a major problem influencing the overall
production performance? Yes / No
1. If yes, what are the specific problems? 2. If no, which specific infrastructural aspects (relevant
directly/indirectly to production) are reasonably good in your region?
j. Other Risks and Concerns Involved in Production k. How are the industrial relations (employer-employee relations in
particular) in the organisation and their impact on performance and competitiveness?
l. Do you operate optimal labour or do you have to carry labour surplus? If you have labour surplus, what are the reasons and in which departments? What is the approximate additional cost burden (in value or % terms)?
m. What are the recent policy decisions of the central and state governments that are likely to have a direct impact on your production, performance and competitiveness?
135
n. Do you think the investment climate and other policy aspects are better in your state, with relevance to your industry?
o. Has location played a crucial role in your production performance? i. If yes, was your choice of location deliberate, foreseeing this
possibility? ii. If no, what else was/were the reasons behind your choice of
location? p. Are there any incentives for your organisation from the central/state
government? q. Foreign OEMs: Do you plan to develop your facilities in India as a
production base to cater your global requirements or merely to serve the Indian market?*
3. Market Structure:
a. Who are your clients/customers?: Domestic Retail/Foreign Retail/ Others (Specify)
b. Approximate Share of Exports in Total Sales: c. Has there been a rapid expansion of domestic/export markets in recent
past for your company? Which of these is expanding more rapidly? Domestic Markets: Export Markets:
d. Competitors and their location: i. List of Domestic Competitors and their location:
1. Which among these pose a major threat and what is the nature of threat (quality/price/both/other)?
ii. List of Foreign Competitors and their location: 1. Which among these pose a major threat and what is the
nature of threat (quality/price/both/other)? e. Do you have your dealership network in place or do you look for new ones
every year?* 100 i. Number of Regular Dealers: ii. Number of Service Stations: iii. Any Other Company Infrastructure to reach customers: iv. In the case of regular dealers, is there any possibility that your
competitors might grab your share in future? If yes, what are the strategies you follow to retain and expand your share in the market?
v. In the case of new dealers, what are the strategies followed to explore new markets? Are you successful to enter the markets that are served by other competitors? If yes, how was it possible?
f. What is the general feedback from the market, on your products? g. Are there any synergies with other similar producers/suppliers? If yes,
what are they?
100 This question is not relevant for auto-component manufacturers. Instead, we have a question on their
buyers and their strategies to retain them and look for new ones. We also asked them about the role of OEMs in their capacity-building.
136
h. Is there any positive feedback from the market for your technology, operation, mode of production, etc.? If yes, specify in detail.
4. Financial and Cost Structure (in terms of Value and/or % Share)
a. Sales, Turnover and Production: b. Material Costs (includes raw material costs of things like steel, copper,
aluminum, plastics): c. Power & Fuel Costs:
i. Electricity Charges ii. Fuel Expenses: iii. Electricity Taxes/Duties:
d. Other Manufacturing Expenses: i. Conversion expenses ii. Stores consumed iii. Technical fee paid iv. Repair & maintenance v. Miscellaneous manufacturing expenses
e. Salary & Wages: i. Salaries to Managerial employees: ii. Salaries to Supervisory employees: iii. Salaries to Production Workers: iv. Total Welfare Expenses to Employees:
f. Royalty Expenses g. General and Administrative Expenses:
i. Rent Paid and Received: ii. Taxes
1. Excise 2. Customs 3. Sales tax 4. Octroi tax 5. Entry tax 6. Surcharges 7. Stamp duty 8. Water tax 9. Electricity tax
iii. Insurance iv. Communication expenses v. Travel/Transportation expenses
1. General Travel Expenses: 2. Port charges for the raw materials and finished products
vi. Printing & stationery expenses vii. Legal expenses viii. Audit expenses ix. Director’s remuneration x. Rejection/Quality Defect Costs xi. Other administrative expenses.
137
h. Interest i. Paid: ii. Received:
i. Depreciation: j. Research and Development Expenditure: k. Capital Investment and Cost of Capital
i. Invested Capital: ii. Working Capital:
l. Profits (Before and After Tax) m. Earnings/Share n. Return on Capital o. Dividend p. Growth of
i. Sales ii. Output/Production iii. Capital iv. Profits
q. How cost-competitive do you think your organisation is, in comparison with your domestic and foreign competitors, especially those in the following countries?
i. China ii. Thailand iii. Malaysia iv. South Korea v. South Africa vi. Taiwan vii. Indonesia viii. EU ix. USA
r. What are the major impediments in becoming more cost-competitive?
5. Technology, Quality and Standards: a. How competitive do you think your organisation is, in comparison with
your domestic competitors, in the following terms: i. Technology ii. Quality of products iii. Compliance with national/global standards?
b. Compare yourselves with typical firms in the following countries in the above terms:
i. China: ii. Thailand iii. Malaysia iv. South Korea v. South Africa vi. Taiwan vii. Indonesia viii. EU
138
ix. USA c. Are you Planning for New Technology or Technology Upgradation
i. Yes ii. No:
1. Reason for not being prepared for new technologies: 2. Plans for survival/expansion in future without technology
upgradation: d. Role of Government in Technology Upgradation, Standards and Quality:
i. Do Governments in Countries like China, Thailand, Malaysia, Indonesia, etc., mentioned above, extend any support to their respective firms in this area in acquiring new technologies, setting and compliance to global standards and quality upgradation?
ii. To what extent does our government play an important role in this
area, in comparison with these countries?
iii. What are the areas in which more governmental support is required?
e. Details of awards, recognitions, quality systems and standards (such as ISO 9000 and 14000):
f. Do you have any sort of collaboration with Indian/foreign companies for technological upgradation and import of technologies?
g. Do you have any R&D infrastructure or facility? i. If yes, what is the proportion of R&D investment in total? ii. If no, do you have plans for investing in R&D in near future, or do
you have collaborations with other Indian/foreign firms in this connection?
h. How far do you think NATRIP facilities would enhance your production technology and competitiveness?
i. Have your interactions with your Indian/foreign suppliers and/or Indian/foreign buyers enhanced your technological capabilities, quality and competitiveness in any way?
j. How do you compare the technologies that you employ with the best in India and best in the world?
k. What are your strengths and weaknesses compared to similar companies in China and Thailand?
l. Are there any rejections from the customer, because of lack of quality? i. If yes, what is the approximate proportion of this in the total
production and its approximate cost share? ii. Do you see any inherent disadvantage/weakness of your
organisation that results in rejection, or is it something that is merely incidental or is it something that can be eliminated by proper process planning?
m. Are the quality parameters of raw materials used satisfactory? i. If no, have you discussed this with the raw material suppliers, and
what are the reasons for this?
139
n. What are the strengths and weaknesses of component suppliers operating in India?
o. How can Indian component industry increase their cost competitiveness vis-à-vis the other countries mentioned above?
6. Plans for the Future:
a. Do you think increasing the product range, i.e., diversification, is a good strategy for future?
b. How important do you think is to establish Made-in-India brand abroad?
c. Which are the markets where Indian industry should focus on to increase exports?
d. What is the role of the government in overseas market development in the countries mentioned above? Do you think government can play a similar role in overseas market development?
e. Do you feel a need to build brand image for your own organization? f. What are the future strategies on technology front to enhance global
competitiveness? g. Do you think mergers or acquisitions, to enhance scales of production, are
useful in future? h. Which strategy, do you think, is more beneficial in the future: Focus on
export markets or domestic markets? i. Do you anticipate any shortfall in terms of raw materials in future? j. Are you open for any technological/business collaboration with other
domestic or foreign firms? k. Are there indications and expectations that your organisation will become
globally competitive in the next few years, given current set of policies of the state and central government? If no, can you elaborate on the required policy changes?
l. Are there any inherent disadvantages/weaknesses in terms of technology, raw materials or management in your organisation, which hinder it from being globally competitive? If yes, how do you plan to eliminate them in future?
140
Appendix 4: Econometric Analysis
The data sources used herein are CMIE Prowess (1988-89 to 2005-06), annual reports of some auto companies and ACMA Buyer’s Guide. The entire analysis is based on firm-level data. Though the sample of firms covered by CMIE Prowess database does not cover the entire population, it does comprise over 70 per cent of the population, and hence the results arrived at herewith are quite reliably applicable for the entire auto industry in India. In addition, the analysis of determinants of market share done in Section 8.3, using ACMA Buyer’s Guide, is more reliable because of the fact that this comprises more than 90 per cent of the entire auto-component industry.
Stochastic frontier analysis is a popular parametric method used to estimate technical efficiency and its determinants and is extensively used in the literature (See, Coelli et. al., 1998, for a detailed explanation of the relevant theories and methodologies). It requires specification of a production function, which carries the information on the inputs involved in production and the interactions between them, relevant for production. In our analysis, we assume transcendental logarithmic production function, which has four inputs, namely, capital, labour, energy and materials. This is the most general and flexible form, without imposing any theoretical restriction.
There are two equations that estimated simultaneously in this regression. First one is the production function that contains logarithm of output as the dependent variable and the logarithms of the inputs, their cross-products and quadratic terms. The error term in this equation has two components: one is stochastic error term, while the other is the inefficiency component, which is measured as the deviation from the stochastic production frontier that represents the firm in the sample that is able to make maximum output from a given basket of inputs.
The second equation is the one that represents the inefficiency term as a variable that follows a distribution, say, truncated normal distribution, with a mean that is a linear function of various determinants of inefficiency, along with a stochastic error term in it. This estimation is done using Joint Maximum Likelihood, wherein both equations are estimated simultaneously by some iteration.
Once the equations are estimated, technical efficiency scores could be calculated, using a formula that expresses the score as an exponentially decreasing function of inefficiency predicted from the second equation estimated as mentioned above. In this subsection, we illustrate and explain the results of stochastic frontier analysis performed for a reasonably huge unbalanced panel of firms from 1988-89 to 2005-06. This was done separately for automobile (26 firms) and auto-component industries (228 firms). As Figure A4.1 shows, technical efficiency of two-/three-wheelers has been increasing gradually on an average. It has grown very rapidly since mid-1990s for Hero Honda, TVS, Bajaj and Kinetic Motor, while it has fallen for Maharashtra Scooters, LML and Majestic. Figure A4.2 shows that the upswing of technical efficiency has occurred in the other automobiles segment only after 1999-2000, on an average. Maruti has always been the most technically efficient, while Hyundai has started bettering it in 2004-05.
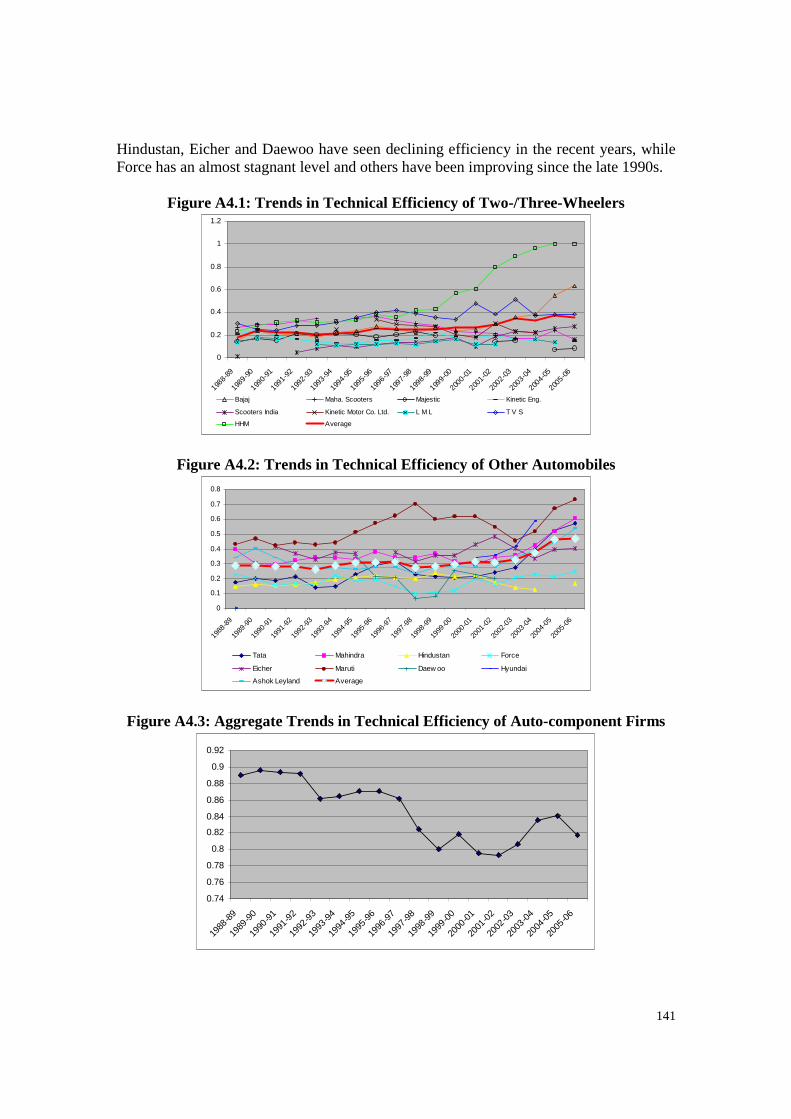
141
Hindustan, Eicher and Daewoo have seen declining efficiency in the recent years, while Force has an almost stagnant level and others have been improving since the late 1990s.
Figure A4.1: Trends in Technical Efficiency of Two-/Three-Wheelers
0
0.2
0.4
0.6
0.8
1
1.2
1988-
89
1989
-90
1990-
91
1991
-92
1992
-93
1993-
94
1994
-95
1995-
96
1996
-97
1997-
98
1998
-99
1999-
00
2000
-01
2001-
02
2002
-03
2003
-04
2004-
05
2005
-06
Bajaj Maha. Scooters Majestic Kinetic Eng.
Scooters India Kinetic Motor Co. Ltd. L M L T V S
HHM Average
Figure A4.2: Trends in Technical Efficiency of Other Automobiles
0
0.1
0.2
0.3
0.4
0.5
0.6
0.7
0.8
1988
-89
1989
-90
1990
-91
1991
-92
1992
-93
1993
-94
1994
-95
1995
-96
1996
-97
1997
-98
1998
-99
1999
-00
2000
-01
2001
-02
2002
-03
2003
-04
2004
-05
2005
-06
Tata Mahindra Hindustan Force
Eicher Maruti Daew oo Hyundai
Ashok Leyland Average
Figure A4.3: Aggregate Trends in Technical Efficiency of Auto-component Firms
0.74
0.76
0.78
0.8
0.82
0.84
0.86
0.88
0.9
0.92
1988
-89
1989
-90
1990
-91
1991
-92
1992
-93
1993
-94
1994
-95
1995
-96
1996
-97
1997
-98
1998
-99
1999
-00
2000
-01
2001
-02
2002
-03
2003
-04
2004
-05
2005
-06
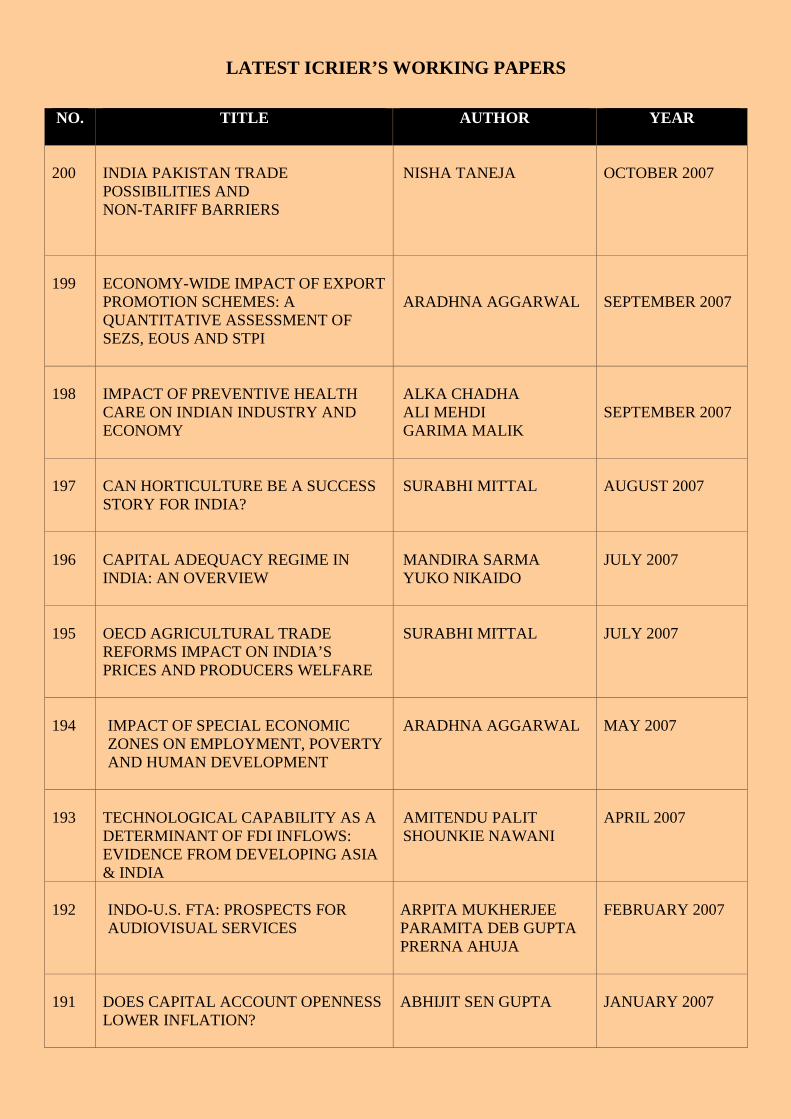
142
LATEST ICRIER’S WORKING PAPERS
NO. TITLE
AUTHOR YEAR
200
INDIA PAKISTAN TRADE POSSIBILITIES AND NON-TARIFF BARRIERS
NISHA TANEJA
OCTOBER 2007
199
ECONOMY-WIDE IMPACT OF EXPORT PROMOTION SCHEMES: A QUANTITATIVE ASSESSMENT OF SEZS, EOUS AND STPI
ARADHNA AGGARWAL
SEPTEMBER 2007
198
IMPACT OF PREVENTIVE HEALTH CARE ON INDIAN INDUSTRY AND ECONOMY
ALKA CHADHA ALI MEHDI GARIMA MALIK
SEPTEMBER 2007
197
CAN HORTICULTURE BE A SUCCESS STORY FOR INDIA?
SURABHI MITTAL
AUGUST 2007
196
CAPITAL ADEQUACY REGIME IN INDIA: AN OVERVIEW
MANDIRA SARMA YUKO NIKAIDO
JULY 2007
195
OECD AGRICULTURAL TRADE REFORMS IMPACT ON INDIA’S PRICES AND PRODUCERS WELFARE
SURABHI MITTAL
JULY 2007
194
IMPACT OF SPECIAL ECONOMIC ZONES ON EMPLOYMENT, POVERTY AND HUMAN DEVELOPMENT
ARADHNA AGGARWAL
MAY 2007
193
TECHNOLOGICAL CAPABILITY AS A DETERMINANT OF FDI INFLOWS: EVIDENCE FROM DEVELOPING ASIA & INDIA
AMITENDU PALIT SHOUNKIE NAWANI
APRIL 2007
192
INDO-U.S. FTA: PROSPECTS FOR AUDIOVISUAL SERVICES
ARPITA MUKHERJEE PARAMITA DEB GUPTA PRERNA AHUJA
FEBRUARY 2007
191
DOES CAPITAL ACCOUNT OPENNESS LOWER INFLATION?
ABHIJIT SEN GUPTA
JANUARY 2007
143
About ICRIER
ICRIER, established in August 1981, has successfully completed its 25 years as an
autonomous, policy-oriented, not-for-profit research institute. We have nurtured our
cherished autonomy by establishing an endowment fund, income from which meets all our
administration expenses. ICRIER’s offices are located in the prime institutional complex of
India Habitat Centre, New Delhi. The prime focus of all our work is to support India’s
interface with the global economy.
ICRIER’s founding Chairman was Dr. K.B. Lall who led the organization from its
inception from 1981 to 1992 when he handed over the Chairmanship to Mr. R.N. Malhotra
(1992-1996). He was followed by Dr. I.G. Patel who remained Chairman from 1997 to
2005 until his demise in July 2005. ICRIER’s current Chairperson is Dr. Isher Judge
Ahluwalia.
Amongst ICRIER’s founding member are: Dr. Manmohan Singh, Dr. C. Rangarjan,
Dr. M.S. Swaminathan, Dr. Jagdish Bhagwati, Mr. Montek Singh Ahluwalia and
Mr. Bharat Ram.
ICRIER conducts thematic research in the following six thrust areas:
• Trade, Openness, Restructuring and Competitiveness
• WTO Related Issues
• Regional and Bilateral Issues
• Financial Liberalization and Integration
• Macro-economic Management in an Open Economy
• Strategic Aspects of India’s External Relations
In addition, ICRIER holds public policy workshops to bring together policy makers,
academicians, Union Cabinet Ministers, senior industry representatives, Members of
Parliament and Media persons to try and forge a consensus on issues of major policy
interest. In the effort to better understand global developments and experiences of other
economies which have bearing on India’s policies and performance, ICRIER invites
distinguished scholars and policy makers from around the world to deliver public lectures
on economic themes of interest to contemporary India.
ICRIER’s highly qualified core team of researchers includes several PhD’s from reputed
Indian and foreign universities. At present the team has 18 economists. The team is led by
Dr. Rajiv Kumar, D.Phil in Economics from Oxford University.