determinants of coordination and … gedruckt mit genehmigung der agrar- und...
TRANSCRIPT

Eliud Abucheli Birachi
DETERMINANTS OF COORDINATION AND DETERMINANTS OF COORDINATION AND DETERMINANTS OF COORDINATION AND DETERMINANTS OF COORDINATION AND
SUPPLY CHAIN PERFORMANCESUPPLY CHAIN PERFORMANCESUPPLY CHAIN PERFORMANCESUPPLY CHAIN PERFORMANCE
The Case of Fresh Milk Supply Chains in The Case of Fresh Milk Supply Chains in The Case of Fresh Milk Supply Chains in The Case of Fresh Milk Supply Chains in
KenyaKenyaKenyaKenya
Department of Agricultural Economics
of the University of Kiel, Germany

ii
Gedruckt mit Genehmigung der
Agrar- und Ernaehrungswissenschaftlichen Fakultät der
Christian-Albrechts-Universität
Diese Arbeit kann als pdf-Dokument unter:
http://e-diss.uni-kiel.de/agrar-fak.html
aus dem Internet geladen werden
iii
Aus dem Institut für Agrarökonomie
der Christian-Albrechts-Universität zu Kiel
DETERMINANTS OF COORDINATION AND SUPPLY CHAIN
PERFORMANCE
The Case of Fresh Milk Supply Chains in Kenya
Dissertation
zur Erlangung des Doktorgrades
der Agrar- und Ernährungswissenschaftlichen Fakultät
der Christian-Albrechts-Universität zu Kiel
vorgelegt von
M.Sc. Eliud Abucheli Birachi
Aus Kenia
Kiel, im Mai 2006
Dekan: Prof. Dr. Joachim Krieter
Erster Berichterstatter: Prof. Dr. Awudu Abdulai
Zweiter Berichterstatter: Prof. Dr. R.A.E. Mueller
Tag der mündlichen Prüfung: Den 20. Juli, 2006

iv
Acknowledgement I have to resist the urge to individually thank all those who have contributed directly and
indirectly to this work but I take this chance to unreservedly thank all of them for their
support. In this limited space, I mention a few of them for the special role they played in this
work.
First and foremost, I wish to express my gratitude to my supervisor Professor Dr. Awudu
Abdulai, Chair of Food Economics and Policy at the Department of Food Economics and
Consumption Studies, Christian Albrecht’s University, Kiel, Germany, for the intellectual
advice, encouragement, and support he provided me with during the whole period that the
work was in development to the end. I reserve my deepest gratitude to him. My gratitude also
goes to (the late) Professor Dr. Claus-Hennig Hanf for introducing me to University of Kiel
and for his assistance in the initial stages of this work. I wish also wish to thank Professor Dr.
Rolf A.E Müller, Chair of Innovation and Information Studies at the Department of
Agricultural Economics, University of Kiel, for the second expert opinion on this work and,
for the ‘Gutachten’ that I required from time to time. Thanks also go to Professor Dr. Maike
Bruhn for her opinion too on the work.
I also wish to acknowledge the contribution of my colleagues at the Departments of
Agricultural Economics (Dr. Fels, Dr. Bruggerman, Dr. Dierks), and Food Economics and
Consumption Studies (Dr. Tietje and the rest), University of Kiel, for their professional
support, and the crucial friendly social support during my work.
I also acknowledge the useful comments from the members of the Department of Agricultural
Economics and Business Management, Egerton University, Kenya, in the initial stages of the
study, among them Dr Margaret Ngigi. I also wish to extent my gratitude to the Ministry of
Livestock Development officers in Bahati, Rongai, Molo, Nakuru district offices, and North
and South Kinagop in Nyandarua district in Kenya for their support during the data collection
phase of this work. Appreciations are also extended to the following research assistants:
Christine Oloo, Vivian Busienei, Steve Mwangi, Simon Ngotho, Joseph Machaka and Tom
Onsongo.
Financial support for this work was received from the German Academic Exchange Services,
DAAD (Deutscher Akademischer Austausch Dienst) throughout the study and research period
in Kenya and Germany without which this work would not have been possible. Thanks go to
the Dean, Faculty of Agriculture and Nutrition, CAU, Kiel and staff at the University’s

v
International Center for their support. I also thank the management of Egerton University for
granting me leave to pursue this research work.
Last but not least is to my family members, friends and colleagues in Kenya for their
encouragements. Most notably, I owe the greatest debt to my wife Grace, son Ron and
daughter Ronah for their strong emotional support and constant encouragements and, for their
long patience that helped me remain focused throughout the study period.

vi
Contents
ACKNOWLEDGEMENT ........................................................................................................................................ IV TABLES ............................................................................................................................................................ VIII FIGURES ............................................................................................................................................................. IX MAPS.................................................................................................................................................................. IX SUMMARY............................................................................................................................................................ X KURZFASSUNG.................................................................................................................................................. XII
CHAPTER 1 INTRODUCTION..................................................................................................................... 1
1.1 PROBLEM SETTING ................................................................................................................................... 1 1.2 OBJECTIVES ............................................................................................................................................. 3 1.3 HYPOTHESES............................................................................................................................................ 4 1.4 JUSTIFICATION ......................................................................................................................................... 4 1.5 SCOPE AND LIMITATIONS OF THE STUDY .................................................................................................. 5 1.6 DEFINITION OF TERMS.............................................................................................................................. 6 1.7 ORGANIZATION OF THE RESEARCH........................................................................................................... 8
CHAPTER 2 INSTITUTIONAL CHANGE AND LIBERALIZATION IN THE KENYAN
AGRICULTURE AND DAIRY INDUSTRY ..................................................................................................... 9
2.1 ROLE AND CONTRIBUTION OF AGRICULTURE TO THE KENYAN ECONOMY................................................ 9 2.2 AGRICULTURAL LIBERALIZATION IN KENYA.......................................................................................... 10 2.3 LIBERALIZATION AND INSTITUTIONAL CHANGE IN THE DAIRY INDUSTRY .............................................. 13
2.3.1 The livestock sub-sector ...................................................................................................................... 13 2.3.2 A historical perspective of the dairy industry: pre-liberalization period ........................................... 14 2.3.3 Post-liberalization scenario................................................................................................................. 17
2.4 THE KENYAN MILK SUPPLY CHAIN ......................................................................................................... 17 2.4.1 The chain configuration ..................................................................................................................... 17 2.4.2 Milk production system and consumption.......................................................................................... 19 2.4.3 Consumption patterns in the country ................................................................................................. 20 2.4.4 Informal milk supply chain................................................................................................................. 21 2.4.5 Milk collection, processing and marketing in the formal supply chain ............................................ 23
CHAPTER 3 TRANSACTION COST THEORY AND COORDINATION MECHANISMS................ 27
3.1 CLASSICAL AND NEOCLASSICAL ECONOMIC THEORIES........................................................................... 27 3.1.1 The classical economic theory ............................................................................................................ 27 3.1.2 Neoclassical (new classical) economics.............................................................................................. 28
3.2 BASIS AND FOUNDATIONS OF NEW INSTITUTIONAL ECONOMICS ........................................................... 31 3.3 TRANSACTION COST ECONOMICS: DEFINITION AND APPROACHES ......................................................... 34 3.4 INFORMATION ECONOMICS AND TRANSACTION COSTS ........................................................................... 37 3.5 BEHAVIORAL ASSUMPTIONS RESPONSIBLE FOR TRANSACTION COSTS .................................................... 40 3.6 DIMENSIONS OF TRANSACTION COSTS AND COORDINATION CONTINUUM............................................... 42 3.7 INSTITUTIONS, TRANSACTION COSTS AND COORDINATION PERFORMANCE IN DEVELOPING MARKETS.... 49
CHAPTER 4 EMPIRICAL STUDIES ON TRANSACTION COSTS, COORDINATION
MECHANISMS AND SUPPLY CHAIN PERFORMANCE .......................................................................... 61
CHAPTER 5 THEORETICAL AND EMPIRICAL MODEL ................................................................... 71
5.1 THEORETICAL FOUNDATIONS FOR SMALLHOLDER MARKET PARTICIPATION .......................................... 71 5.2 MARKET SITUATION FACING SMALLHOLDER MARKET PARTICIPANTS .................................................... 73
5.2.1 Market situation under assumption of no transaction costs .............................................................. 73 5.2.2 The market situation in the presence of transaction costs ................................................................. 76
5.3 A THEORETICAL MODEL FOR DETERMINANTS OF COORDINATION MECHANISMS..................................... 80 5.4 SPECIFICATION OF THE ECONOMETRIC MODEL ....................................................................................... 83
5.4.1 The multinomial logit model ............................................................................................................... 84 5.4.2 Model justification............................................................................................................................... 85
5.5 EMPIRICAL SPECIFICATION OF DETERMINANTS OF COORDINATION MECHANISMS .................................. 86 5.5.1 Household and individual characteristics .......................................................................................... 87 5.5.2 Firm specific characteristics ............................................................................................................... 88 5.5.3 Transaction cost specific characteristics ............................................................................................ 89

vii
5.6 DETERMINANTS OF SUPPLY CHAIN PERFORMANCE................................................................................. 94 5.6.1 Supply chain performance measurement ........................................................................................... 94 5.6.2 A theoretical model for determinants of supply chain performance ................................................. 97
CHAPTER 6 DATA DESCRIPTION......................................................................................................... 101
6.1 SURVEY STRATEGY .............................................................................................................................. 101 6.1.1 Characteristics of the study area....................................................................................................... 101 6.1.2 Sampling techniques ......................................................................................................................... 103 6.1.3 Data gathering methods .................................................................................................................... 103 6.1.4 Data and variable definitions ............................................................................................................ 104
6.2 SAMPLE CHARACTERISTICS AND DESCRIPTIVE ANALYSIS OF THE RESPONSES: DISTRIBUTION OF THE
TRANSACTIONS ................................................................................................................................................ 108 6.3 SAMPLE CHARACTERISTICS OF THE COORDINATION MECHANISMS ....................................................... 110 6.4 CHARACTERISTICS OF THE FACTORS INFLUENCING COORDINATION MECHANISMS BETWEEN MILK
PRODUCERS AND THEIR BUYERS....................................................................................................................... 111 6.5 CHARACTERISTICS OF RETAILER-SUPPLIER TRANSACTIONS ................................................................. 116 6.6 CHARACTERISTICS OF RETAILER-BUYER TRANSACTIONS ..................................................................... 120 6.7 CHARACTERISTICS OF THE DEPENDENT VARIABLE: SUPPLY CHAIN PERFORMANCE .............................. 123
CHAPTER 7 DETERMINANTS OF COORDINATION AND SUPPLY CHAIN PERFORMANCE 125
7.1 MODEL RESULTS AND DISCUSSIONS: DETERMINANTS OF COORDINATION MECHANISMS IN PRODUCER-BUYER TRANSACTIONS..................................................................................................................................... 125 7.2 DETERMINANTS OF COORDINATION IN RETAILER –SUPPLIER TRANSACTIONS....................................... 131 7.3 COORDINATION IN RETAILER-BUYER TRANSACTIONS .......................................................................... 136 7.4 DETERMINANTS OF SUPPLY CHAIN PERFORMANCE IN PRODUCER-BUYER MILK TRANSACTIONS ........... 139 7.5 PERFORMANCE IN RETAILER-SUPPLIER MILK TRANSACTIONS............................................................... 140 7.6 PERFORMANCE IN RETAILER-BUYER MILK TRANSACTIONS .................................................................. 143
CHAPTER 8 SUMMARY AND IMPLICATIONS FOR POLICY ......................................................... 145
8.1 SUMMARY............................................................................................................................................ 145 8.2 IMPLICATIONS OF THE STUDY FOR POLICY ........................................................................................... 149 8.3 DIRECTIONS FOR FURTHER RESEARCH.................................................................................................. 155
REFERENCES.................................................................................................................................................. 157
APPENDICES ................................................................................................................................................... 171
APPENDIX 1: QUESTIONNAIRES FOR MILK PRODUCERS............................................................................... 171 APPENDIX 2: QUESTIONNAIRE FOR MILK RETAIL OUTLETS ........................................................................... 182 CURRICULUM VITAE ........................................................................................................................................ 197

viii
Tables
Table 2.1 Key cattle performance indicators in Kenya ......................................................................................... 13 Table 2.2 Milk production (grazing) systems in Kenya ....................................................................................... 19 Table 2.3 Cost and price per liter of milk.............................................................................................................. 19 Table 2.4 Comparison of costs and revenues for three districts ............................................................................ 20 Table 2.5 Registered participants in the milk chain ............................................................................................. 23 Table 2.6 Concentration in the Kenyan dairy industry......................................................................................... 24 Table 2.7: Components of consumer price............................................................................................................ 26 Table 6.1: Summary of constructs for determinants of coordination mechanisms ............................................. 106 Table 6.2: Summary of constructs for determinants of supply chain performance ............................................. 107 Table 6.3: Sample distribution for milk producer transactions by district and division...................................... 108 Table 6.4: Producer-buyer chains in the milk industry ....................................................................................... 109 Table 6.5: Retailer-supplier milk supply chains.................................................................................................. 109 Table 6.6: Retailer-buyer milk supply chains ..................................................................................................... 110 Table 6.7: Coordination mechanisms and their distributions in producer transactions....................................... 110 Table 6.8: Distribution of coordination mechanisms .......................................................................................... 111 Table 6.9: Distribution of coordination mechanisms in retailer-buyer transactions............................................ 111 Table 6.10: Distribution of production units by district and gender ................................................................... 112 Table 6.11: Classification of respondents by educational class .......................................................................... 112 Table 6.12: Descriptive statistics for producer-buyer transactions ..................................................................... 113 Table 6.13: Importance of legal contracts in producer-buyer transactions ......................................................... 114 Table 6.14: Seriousness of problem of lack of buyers ........................................................................................ 114 Table 6.15: Extent of price knowledge in producer transactions ........................................................................ 115 Table 6.16: Length of credit period..................................................................................................................... 115 Table 6.17: Distribution of retailer-supplier transactions by gender ................................................................... 116 Table 6.18: Distribution of retailer-supplier transactions by type of retail outlet ............................................... 116 Table 6.19: Retailer-supplier transactions, summary descriptive statistics ......................................................... 117 Table 6.20: Extent of partner reliability .............................................................................................................. 118 Table 6.21: Extent of difficult of finding alternative milk suppliers................................................................... 118 Table 6.22: Usefulness of trader information sources to retailers ....................................................................... 118 Table 6.23: Usefulness of government market information to retailers .............................................................. 119 Table 6.24: Personal relations in retailer transactions......................................................................................... 119 Table 6.25: Length of credit period in retailer-supplier transactions .................................................................. 120 Table 6.26: Distribution of transactions by gender ............................................................................................. 120 Table 6.27: Distribution of retailer-buyer transactions by type of retail outlet ................................................... 121 Table 6.28: Summary descriptive statistics for retailer-buyer transactions......................................................... 122 Table 6.29: Distribution of retailer transactions by length of credit period ........................................................ 123 Table 6.30: Performance in producer-buyer transactions.................................................................................... 123 Table 6.31: Performance in retailer- supplier transactions.................................................................................. 124 Table 6.32: Performance in retailer- supplier transactions.................................................................................. 124 Table 7.1 Multinomial Logit Model estimates for determinants of producer-buyer coordination ...................... 126 Table 7.2 Marginal effects of explanatory variables on the probability of coordination choice ........................ 128 Table 7.3 Multinomial Logit Model estimates for determinants of retailer-supplier coordination .................... 132 Table 7.4 Marginal Effects of explanatory variables on the probability of coordination choice: retailer-supplier............................................................................................................................................................................ 134 Table 7.5 Multinomial Logit Model estimates for determinants of retailer-buyer coordination........................ 136 Table 7.6 Marginal effects of explanatory variables on the probability of coordination choice retailer-buyer coordination ........................................................................................................................................................ 137 Table 7.7: Ordered Probit parameter estimates for determinants of producer-buyer transaction performance... 140 Table 7.8 Ordered Probit parameter estimates for determinants of retailer-supplier transaction performance ... 142 Table 7.9: Probit parameter estimates for determinants of retailer-buyer transaction performance.................... 144 Table 8.1 Determinants of coordination mechanisms in the milk supply chains ................................................ 148

ix
Figures
Figure 2.1 Diagrammatic representation of the typical milk chains in Kenya ...................................................... 18 Figure 3.1 Transaction costs as a function of asset specificity.............................................................................. 43 Figure 3.2: Governance structure shift due to uncertainty .................................................................................... 45 Figure 3.3: The continuum of governance structures............................................................................................ 46 Figure 3.4: Simple contracting schema ................................................................................................................. 47 Figure 3.5: High and low level equilibriums with coordination and opportunism risk......................................... 53 Figure 3.6: Links between governance, institutional environment and the individual .......................................... 55 Figure 3.7: Dominance of hierarchical organization and adaptation during transition ......................................... 57 Figure 5.1: Relationship between transaction costs and household sales and purchases ...................................... 72 Figure 5.2: The conceptual model......................................................................................................................... 94 Maps
Map 1 Map of Kenya showing the research area ................................................................................................ 196
x
Summary
Typical problems impacting the Kenyan agricultural sector range from unfavorable weather
conditions, technical production skills, capital insufficiency, and inadequate markets and have
been well documented. Changes in the general macroeconomic environment such as opening
up of the markets (liberalization and privatization) have also brought about newer challenges
for the participants in the agricultural sector. The changes have impacted differently on the
prices and quantities of various products for both producers and consumers. Whereas many
production and or marketing based studies have been useful in identifying key solution areas,
institutional and management aspects in the agricultural sector have not been adequately
addressed.
Based on the New Institutional Economics framework (specifically Transaction Cost
Economics Theory) and Supply Chain Management frameworks, the study investigates two
main issues among the market participating agents in the Kenyan milk supply chain. Firstly, it
identifies and evaluates determinants of coordination mechanisms used in the Kenyan fresh
milk supply chain. Secondly, it identifies and evaluates determinants of supply chain
performance in the fresh milk supply chain. The two issues are investigated for transactions
between milk producers and their buyers, between milk retail outlets and their milk suppliers,
and between the retail outlets and their buyers. Coordination is defined by the kind of
contracts used in transactions between the sellers and the buyers of milk. On the other hand,
supply chain performance is defined by the extent to which the supply chain partners are
satisfied with key aspects of their transactions with partners and is measured on likert type
scales.
Primary data using personally administered questionnaires was collected on commercial dairy
activities from two districts in Kenya: Nakuru and Nyandarua districts, between May 2005
and September 2005. The data collected comprised of the agents’ socioeconomic
characteristics, farm/firm specific factors, transaction cost characteristics and performance
related aspects such as prices, milk quantities, milk quality, information flows and
communications, and transaction partner reputations and trustworthiness. Two econometric
models were applied to analyze the collected data. The first is a multinomial logit model that
was applied to analyze data on determinants of coordination mechanisms. The second model
is an ordered probit model that was applied to analyze data on determinants of supply chain
performance. Both models were run in LIMDEP™ econometric software.
The results of the study provide a framework for characterizing coordination mechanisms, and
factors influencing coordination modes or arrangements in the Kenyan fresh milk supply

xi
chains. Three main coordination mechanisms were identified in the milk supply chains: spot
market contracts, verbal contracts, and written contracts. The study demonstrates that the
different kinds of coordination mechanisms have several advantages and disadvantages. The
results also show that the coordination modes are used generally across milk transactions in
the country. Furthermore, it shows that each coordination mechanism is associated with
certain transaction costs, firm specific, as well as socioeconomic characteristics of the agents.
With regard to supply chain performance, the study shows that, socioeconomic, firm specific
and transaction cost factors as well as the type of coordination mechanisms used are important
determinants of performance in milk supply chains. Specifically, the study shows that milk
producers are constrained more by lack of information on markets and prices and inability to
effect any meaningful impact in the market for their milk. On the other hand, retail outlets are
shown to be constrained by high transaction costs arising out of having to deal with numerous
small sized milk producers in the upstream market and inability to influence prices in the
consumer market. Furthermore, milk prices, availability of buyers and market information
asymmetries are found to be important determinants of supply chain performance in the milk
transactions.
The study shows that certain state interventions may be necessary for the commercial
development of the dairy industry especially with regard to reduction of key transaction costs,
among them road transport infrastructure, farmer cooperative organizations, information and
market search and contractual support institutions. The study is an important contribution to
the operations of the dairy industry and in particular the fresh milk supply chain and provides
a detailed insight into the mechanisms of coordination and supply chain performance in the
dairy industry. It provides information on the institutional arrangements in the industry that is
necessary for the understanding and development of the dairy industry in the country by
private agents and policy makers. The information can assist in achieving better transaction
partner selection when designing their milk supply chains. Most significant is in pointing out
what kinds of transaction costs are important or likely to be faced by opting for certain
transactions, transaction partners, and coordination modes. In the overall, the determinants of
the contractual modes also show the sources of these transaction costs which can be addressed
by the chain partners (or policy makers) or if they prove insurmountable, they can be avoided
all together.
Key words: New Institutional Economics, Transaction Costs, Coordination Mechanisms,
Supply Chain Management, Supply Chain Performance, Milk Supply Chain, Household
Model, Multinomial Logistic Regression, Ordered Logistic Regression, Kenya.

xii
Kurzfassung
Die typischen Probleme, die den kenianischen Agrar-Sektor beeinflussen, reichen von
ungünstigen Wetterbedingungen, technischen Produktionsfähigkeiten, und
Kapitalunzulänglichkeit bis zu unzulänglichen Märkten, und sind gut dokumentiert worden.
Änderungen im allgemeinen makroökonomischen Klima wie Erschließung der Märkte
(Liberalisierung und Privatisierung) gehen mit neune Herausforderungen für die
Marktteilnehmer in verschiedenen Sektoren der Wirtschaft einher. Die Änderungen haben
sich auf Preise und Mengen der verschieden Produkte sowohl für Produzenten als auch
Verbraucher ausgewirkt. Während viele produktions- und oder marketingbezogene Studien
Lösungen für zentrale Probleme in diesen Bereichen bieten, sind Institutions- und
Managementaspekte im landwirtschaftlichen Sektor bisher nicht ausreichend untersucht
worden.
Basierend auf der neuen Institutionenökonomie (beziehungsweise Transaktionskosten
Theorie) und dem Konzept des Supply Chain Managements, untersucht die Studie zwei
Hauptthemen der Marktteilnehmer kenianischen Milchindustrie. Es werden zum einem
Determinanten der Koordinationsmechanismen, die in der kenianischen Milchlieferkette
angewandt werden, und zum anderen Determinanten der Leistungsfähigkeit der Lieferkette
bei Frischmilch identifiziert und analysiert. Beides wird für Verhandlungen zwischen
Milchproduzenten und ihren Kunden, zwischen Einzelhändler und Milchlieferanten, sowie
zwischen Einzelhändlern und ihren Kunden untersucht. Koordination wird durch die Art der
Verträge definiert, die in den Verhandlungen zwischen Anbietern und Nachfragern von Milch
zur Anwendung kommen. Demgegenüber wird die Leistungsfähigkeit der Lieferkette durch
den Umfang definiert, in dem die Partner dieser Kette mit Schlüsselaspekten ihrer
Transaktionen mit Vertragspartnern zufrieden sind, der auf Likertskalen gemessen wird.
Die Primärdaten, wurden im Milchsektor in zwei Bezirken Kenia, Nakuru und Nyandarua,
zwischen Mai und September 2005 mittels persönlicher Befragung erhoben. Diese Dateien
umfassen sozioökonomische Eigenschaften der Marktteilnehmer, betriebs- und
transaktionskostenbezogene Eigenschaften, sowie leistungsbezogene Aspekte der Lieferketten
wie Preise, Milchmenge, Milchqualität, Informationsflüsse und Kommunikation, sowie
Renommees und Vertrauenswürdigkeit der Verhandlungspartner. Zur Analyse der erhobenen
Daten werden zwei ökonometrische Modelle angewendet. Zunächst wird ein multinomiales
Logit Modell angewendet, um die Daten hinsichtlich der Bestimmungsfaktoren der
Koordinationsmechanismen zu analysieren. Zusätzlich werden die Bestimmungsfaktoren der

xiii
Leistungsfähigkeit der Milchlieferkette mit einem Ordered Probit Modell untersucht. Beide
Modelle werden mit der ökonometrischen Software LIMDEP ™ geschätzt.
Die Ergebnisse der Studie bieten eine Grundlage zur Charakterisierung der
Koordinationsmechanismen der kenianischen Frischmilchlieferkette und der Faktoren, die
diese Koordinationsmechanismen beeinflussen. Drei Hauptkoordinationsmechanismen
werden identifiziert: Spotmarktverträge, mündliche Verträge, und schriftliche Verträge. Die
Untersuchung zeigt, dass die verschiedenen Arten der Koordinationsmechanismen
verschiedene Vor- und Nachteile haben. Generell kommen unterschiedliche Arten der
Koordinationsmechanismen bei Milchtransaktionen zur Anwendung. Es wird weiterhin
gezeigt, dass jeder Koordinationsmechanismus mit bestimmten Verhandlungskosten und
unternehmensbezogenen sowie sozioökonomische Eigenschaften der Teilnehmer verbunden
ist. Im Hinblick auf die Leistungsfähigkeit der Lieferkette zeigt die Studie, dass
sozioökonomische, betriebsbezogene und Transaktionskostenbezogene Faktoren so wie die
Art des benutzten Koordinationsmechanismus wichtige Determinanten sind. Insbesondere
werden Milchproduzenten dieser Milch mehr durch Informationsmangel über Märkte und
Preise sowie mangelnde Einflussmöglichkeiten auf den Milchmarkt eingeschränkt. Anderseits
werden die Einzelhandelgeschäfte auch durch die hohen Transaktionskosten aufgrund der
Vielzahl kleinerer Produzenten mit denen sie im vorgelagerten Bereich in Beziehung stehen
sowie mangelnder Einflussmöglichkeiten auf die Preise im Absatzmarkt für Konsumgüter
belastet. Außerdem werden Milchpreise, Verfügbarkeit der Kunden und
Marktinformationsasymmetrien als Determinanten der Leistungsfähigkeit der Milchlieferkette
identifiziert.
Die Studie zeigt weiterhin, dass bestimmte staatliche Interventionen für die kommerzielle
Entwicklung der Milchindustrie besonders hinsichtlich der Reduzierung zentraler
Transaktionskosten, wie beispielsweise Verbesserung der Transportinfrastruktur, Gründung
landwirtschaftlicher Genossenschaften, Reduzierung von Informations- und Suchkosten sowie
institutionelle Unterstützung von Verträgen notwendig sind. Diese Studie ist ein wichtiger
Beitrag für die Betriebe der Milchindustrie und insbesondere der Frischmilchlieferkette und
bietet einen ausführlichen Einblick in die Mechanismen der Koordination und
Leistungsfähigkeit der Milchlieferketten. Sie stellt Informationen über institutionelle
Vereinbarungen zur Verfügung, die für das Verständnis und die Entwicklung der
Milchindustrie im Land durch private Teilnehmer und Politiker notwendig sind. Diese
Informationen können bei der besseren Auswahl von Verhandlungspartner beim Aufbau von
Milchlieferketten unterstützen. Als bedeutendster Aspekt wird dargestellt, welche Arten von
xiv
Verhandlungskosten wichtig oder wahrscheinlich sind, wenn eine Entscheidung für
bestimmte Verhandlungspartner und Koordinationsmechanismen getroffen. Insgesamt zeigen
die Determinanten der Vertragsarten auch die Quellen der Transaktionskosten an, welche von
den Partnern in der Lieferkette (oder von Politikern) beeinflusst werden können oder wenn sie
sich als unüberwindbar erweisen, vermieden werden können.
Schlüsselwörter: Neue Institutionenökonomie, Transaktionskosten,
Koordinationsmechanismen, Supply Chain Management, Milchlieferketten , Supply Chain
Performance, Haushaltsmodell, Multinomiale Logit Regression, Ordered Probit Regression,
Kenia.

xv
Abbreviations
CBS Central Bureau of Statistics
CME Coordinated market economies
COMESA Common Market for Eastern and Southern Africa
EAC East African Community
FAO Food and Agriculture Organization
GoK Government of Kenya
KCC The Kenya Cooperative Creameries
KDB The Kenya Dairy Board
Kshs Kenya Shillings
LME Liberal market economies
MNL Multinomial logit
NIE New Institutional Economics
OECD Organization for Economic Co-operation and Development
SCM Supply Chain Management
SCOR Supply Chain Operations Reference (Model)
TCE Transaction Cost Theory
UNSD United Nations Statistical Database
WTO World Trade Organization

CHAPTER 1INTRODUCTION
1
CHAPTER 1 INTRODUCTION
1.1 Problem setting
A supply chain is a set of three or more entities (organizations or individuals) directly
involved in the upstream and downstream flows of products, services, and/or information
from a source to a customer (Mentzer et al, 2001). The entities in the supply chain include
producers, intermediaries, processors, retailers and product users among others. Coordination
on the other hand is the extent to which the work activities of the parties are logically
consistent and coherent so they are directed toward a common objective in such a way that
they supplement and complement one another (Milgrom and Roberts, 1992). Coordination is
necessary to ensure smooth flow of resources from one technologicINTRODUCTIONal level to
another, such as from a producer to a processor or processor to retailer, that is, within a supply
chain. This is especially so when the technologies are owned or controlled by different
independent economic entities. Williamson (1985) has shown that there is a close relationship
between coordination modes and transaction costs, a point further developed by Hobbs (1996)
who develops an insightful framework for analyzing supply chain relations based on
transaction cost economics. This study investigates coordination and performance
relationships in the Kenyan fresh milk supply chain in the frameworks of supply chain
management and transaction cost economics.
The Kenyan milk industry has undergone major changes following market reforms in the last
two decades. The period can be characterized as a transition period from state controlled
agricultural sector to a market driven sector. Both the institutional environment (at the macro
level) and the institutional arrangements (at the micro level) have been undergoing changes,
which have had important implications for the management of the various agricultural supply
chains in the country. Specifically, the implications are couched in terms of coordination
modes and performance levels attained by agents in the supply chains. The thesis of this work
is that determinants of coordination and performance in the supply chains have changed
during the transition period and require an analysis to understand them and their implications
for the performance of the agricultural sector. With regard to the dairy industry, these changes
are illustrated in the following paragraphs.
Agricultural market reforms in Kenya began in 1987 and brought about many changes in all
major sub-sectors of agriculture. Most of the sectors were opened up to private participation
and or the state led organizations were required to operate on commercial basis alongside
private enterprises. In the dairy industry, the changes were characterized by an increase in the
CHAPTER 1INTRODUCTION
2
number of milk processing firms from a single firm supported by the government to more
than 40 firms within a span of five years. Before liberalization, the single processing firm was
supported by an extensive network of cooperatives responsible for collection, bulking and
onward distribution of the produce. Cooperatives therefore played a significant role in
coordinating the flows of materials, information and funds in the dairy industry. However,
after the market reforms, many primary cooperatives were adversely affected as they were
unprepared and consequently failed due in part to their reliance on the milk processing firm.
The failure of most cooperatives coupled with the withdrawal of state marketing bodies
presented new challenges for the small-scale producers as they heavily relied on them to
market their products. Producers were henceforth expected to coordinate both production and
market side activities by themselves. Furthermore, the failure of farmer cooperative
organizations and most of the milk processing factories meant that producers were no longer
guaranteed a market for their products, product prices became subject to supply and demand
forces and for the milk processors the problem of capacity utilization and cost control became
critical to their survival as they were no longer guaranteed milk supplies. The upshot is that
the nature of transaction costs faced in the milk supply chain has changed drastically and the
costs are reflected in the type of coordination mechanisms used and the performance levels
the supply chain participants are able to achieve in their transactions.
Additional challenges have been provided by an increase in the number and types of
intermediaries in the milk supply chain. New types of intermediaries in the milk supply chain
include itinerant milk traders, brokers and agents and retail outlets for milk (such as milk bars
and kiosks) in urban and rural areas. Thus the number and types of transactions in the supply
chain have also tremendously increased for all participants in the supply chain with varying
consequences on the transaction relations, transaction costs and performance levels in the
supply chains.
Furthermore, downstream in the supply chain, the consumer faces high prices for the
processed products. Unlike producer prices that often vary with supply conditions, consumer
prices for processed products are often either non-responsive or change only in one direction,
upwards. The consumer pays for the coordination problems in the supply chain and the
benefits of a liberalized business environment in the milk industry have been slow in reaching
the consumer especially for the processed milk products. The growing importance of
unprocessed milk transactions bought directly from producers or through intermediaries
attests to the magnitude of the pricing problem.

CHAPTER 1INTRODUCTION
3
The developments above have brought about new coordination problems in the Kenyan dairy
industry that call for a new look at the management of the milk supply chains so as to keep the
costs of transacting among the participants within manageable levels. The need to generate a
fair return on investments by the producers, processors and other chain participants requires
approaching the problems in the dairy industry from a holistic perspective. In an attempt to
mitigate some of these problems, it is necessary to come up with institutional arrangements
that can lower coordination costs for the benefit of all the participants.
Whereas government efforts target sector-wide improvements, participants in the milk supply
chain can shape the costs of transactions through choice of appropriate governance structures.
Coupled with the choice of coordination mechanisms is the question of the extent to which
coordination can be improved or optimized. It has been generally recognized that transaction
costs are important in determining the kind of coordination modes employed by agents. Other
factors besides transaction costs such as socioeconomic characteristics of the agents and
firm/farm specific factors may have some role to play. However, it is not clear which among
these characteristics and factors are major determinants for the type of coordination
mechanism used in the Kenyan milk supply chain given the diverse nature of transaction
costs, socioeconomic and firm specific factors. There is also recognition that the influence of
these factors is not homogenous across the various stages of the supply chain.
In addition to the above, it is understood that performance in the supply chains has to be
enhanced for the benefit and sustainability of the dairy operations. This calls for an
investigation into the main determinants of the level of supply chain performance attained by
the supply chain participants. Establishing the link between coordination mechanisms and
transaction costs, socioeconomic and firm specific factors and supply chain performance in
the milk supply chain is necessary to provide possible future directions for coordination and
performance improvement in the dairy industry. The study therefore addresses these issues.
1.2 Objectives
This study identifies and evaluates the determinants of coordination mechanisms and supply
chain performance in the Kenyan milk supply chain.
The specific objectives of the study are:
• To characterize the coordination mechanisms used in transactions at the producer and
trader stages of the fresh milk supply chain.

CHAPTER 1INTRODUCTION
4
• To identify and evaluate the determinants of coordination mechanisms in transactions
at the producer and trader stages of the fresh milk supply chain.
• To identify and evaluate the determinants of supply chain performance in transactions
at the producer and trader stages of the fresh milk supply chain.
1.3 Hypotheses
The following hypotheses are advanced and investigated in the study
• The predominance of the coordination mechanisms depends on the stage in the milk
supply chain. As such, spot market contracts dominate transactions with direct
consumers and verbal and written contracts dominate in transactions with other types
of transaction partners.
• Socioeconomic and firm related factors influence the type of coordination mechanisms
employed. The strength and nature of influence differs according to the coordination
mechanisms employed and also according to the stage in the supply chain.
• Market search cost, negotiation cost and monitoring cost components of transaction
costs influence the kind of coordination mechanisms employed. The strength of the
association between the transaction cost components also differs with the type of
coordination mechanism used and the stage in the supply chain.
• Socioeconomic characteristics, firm related factors and transaction cost characteristics
as well as the kind of coordination mechanism used influence the level of supply chain
performance attained in the milk transactions. The impact of the factors on supply
chain performance differs according to the stage in the supply chain.
A detailed discussion of the specific factors and their theoretical relationships is found in
sections 5.5 and 5.6.
1.4 Justification
The dairy industry contributes up to 3.5% of Kenya’s Gross National Product (GNP) and up
to 14% of the agricultural GDP. It is a source of livelihood for over 660,000 rural households,
365,000 direct farm wage jobs and 40,000 jobs in the processing activities. Most of the
producers and other participants are small scale in nature and face costly market transactions.
Coordination has consequences for the performance of the industry as it determines whether
value is added in the milk supply chains or not. With the adoption of the common markets
CHAPTER 1INTRODUCTION
5
such as East African Community (EAC), the Common Market for Eastern and Southern
Africa (COMESA), and the requirements of the World Trade Organization (WTO), the need
to achieve competitiveness and survival for the local milk supply chains is now more critical.
This study therefore targets parties involved in the production, processing and distribution
activities of the milk supply chain with the aim of contributing to their improvement and
enhancement of their value creation processes for the benefit of the consumer.
The study also aims at providing information and an understanding of the milk supply chain
operations so as to help in creating a conducive environment (institutional) for the growth of
the dairy industry, given the role the dairy industry plays in national development.
The current knowledge base on the management of supply chains in Kenya is thin. While
recognizing efforts in production activities, the probability of success is higher when a holistic
approach to the chain is undertaken. Both the downstream and upstream chain activities and
the management of the flows of information, materials, and funds are necessary for the
successful functioning of agricultural supply chains. This works makes a contribution in this
area of research.
Finally the study makes a valuable contribution to the on-going academic development and
research in the fields of New Institutional Economics (NIE) and chain management in
agriculture, as well as agro-industrial and agribusiness areas.
1.5 Scope and limitations of the study
The study focuses on the basic milk supply chain involving production and retailing chain
levels. The processing stage of the supply chain, input supplies and consumers are not
investigated. However, this does not mean that their role in the dairy industry is in any way
less significant. Resources available are limited and therefore milk producers and traders are
selected as starting points for chain wide investigations in the operations of the Kenyan milk
supply chain.
Two districts from two provinces in Kenya have been selected for inclusion in the study:
Nakuru district from Rift Valley province and Nyandarua District from Central province. The
study does not therefore necessarily cover the entire country but uses the two districts due to
the scope of dairy activities and the importance of the districts in the national dairy milk
production and marketing. The two districts offer a fair view of the nature of transaction costs,
coordination and supply chain performance of the other regions of the country, albeit with
minor adaptations.
CHAPTER 1INTRODUCTION
6
The emphasis of the study is on transaction costs, coordination and supply chain performance.
These are not the only determinants of the operations of the enterprises in the dairy industry
as there are other constraints such as production costs and other expenses to countenance
with. The issues addressed here should be looked at together with other costs and constraints
impinging on the operations of the agents in the milk supply chain.
Furthermore, market participating agents are not the only groups operating in the Kenyan
dairy industry. There are other dairy farmers or milk producers whose product does not reach
the market. Insights from this study can be looked at as a glimpse in to the constraints facing
non market participating agents as the constraints are the same but only worse in their case.
Attempts to address problems facing non market participating agents have been addressed in
studies elsewhere (for example Omamo, 1998; Key et al 2000; and Goetz, 1992 among
others).
1.6 Definition of terms
• A supply chain is a set of three or more entities (organizations or individuals)
directly involved in the upstream and downstream flows of products, services,
and/or information from a source to a customer (Mentzer et al, 2001; Daganzo,
2003).
• A basic supply chain: Consists of a firm, an immediate supplier and an immediate
customer directly linked by one or more of the upstream and downstream flows of
products, services, finances and information.
• An ultimate supply chain includes all firms involved in all the upstream and
downstream flows of products, services, finances and information.
• A supply chain orientation is the recognition by a firm of the systemic, strategic
implications of the activities, and processes involved in managing the various
flows in a supply chain.
• Supply chain management is the implementation of a supply chain orientation
across customers and suppliers. It is the systemic, strategic coordination of the
traditional business functions within a particular firm and across businesses within
the supply chain, for the purposes of improving the long-term performance of the
individual firms and the supply chain as a whole.

CHAPTER 1INTRODUCTION
7
• Supply chain performance: A consideration of the chain wide performance as
opposed to single firm performance measures.
• Governance structures/coordination mechanisms/modes/contracts: These are used
to capture the types of linkages used and the types of relations that subsist among
the transacting partners. These terms are used interchangeably in this study to
mean the same thing.
• Coordination: Coordination is the extent to which the work activities of the parties
are logically consistent and coherent, so that they are directed toward a common
objective in such a way that they supplement and complement one another.
• Spot market contract: A contract for the immediate exchange of goods or services
at current prices. The identity of the party is irrelevant.
• The relational bilateral governance (also implicit contract): A non-written (non-
legally enforceable) contract that specifies only the general terms and objectives
of the relationship. The governance introduces the idea of repeated relations with
the same agents and is equivalent to verbal contracts.
• The relational bilateral governance with ‘qualified partners’. This structure is
close to the previous one. However, agents are not free to choose their partners,
but have to select a ‘qualified’ transactor (accredited for instance by a collective
organization)
• The formal (written) bilateral contract: A legally enforceable set of promises that
defines all or part of each party’s obligations.
• Financial participation in the ownership of the partner(s): In this case, the buyer
(respectively seller) is a stockholder of the other but stays legally independent
from the seller (respectively buyer). Joint venture is a canonical example of this
type of governance structure.
• Vertical integration: Refers to bringing of two or more successive stages of the
supply chain under common ownership and management (Milgrom and Roberts,
1992).
• Transect sampling: A special random sampling technique used in ecological
survey where sampling frames are unavailable. Straight lines are mapped out and
objects randomly selected for inclusion in the study.

CHAPTER 1INTRODUCTION
8
1.7 Organization of the research
The study is organized as follows. Chapter two discusses institutional changes in the Kenyan
agricultural sector with special emphasis on liberalization and its effects on the Kenyan dairy
industry. Chapter three presents the theoretical underpinnings of the study, that is, the New
Institutional Economics and in particular Transaction Cost Economics theory with reference
to developing markets. Chapter four discusses empirical works on transaction costs,
coordination mechanisms and supply chain performance, with special reference to agricultural
and smallholder enterprises in developing countries. Chapter five discusses the economic
problem facing market participating agents, presents theoretical and empirical models for the
study and finally discusses the empirical specification of the relations under study. A
descriptive overview of the data and variables of interest are discussed in chapter six. Model
results and discussions on the determinants of coordination mechanisms and supply chain
performance are presented and discussed in chapter seven. Finally, chapter eight summarizes,
discusses policy implications and suggests further research directions in light of the findings
in this study.

INSTITUTIONAL CHANGE AND LIBERALIZATION IN THE KENYAN AGRICULTURE AND DAIRY INDUSTRY
9
CHAPTER 2
INSTITUTIONAL CHANGE AND LIBERALIZATION IN THE KENYAN
AGRICULTURE AND DAIRY INDUSTRY
The chapter reviews major institutional changes that have occurred in the Kenyan agricultural
sector and their impact on key agricultural commodity supply chains. It evaluates the effects
of liberalization policies with special emphasis on the dairy industry. The chapter is organized
as follows: Section 2.1 reviews the role of agriculture in both the national and individual
welfare of the Kenyan people. Section 2.2 reviews the main institutional changes using
examples from key agricultural sectors and industries in Kenya. Section 2.3 analyses the
institutional changes in the dairy industry following liberalization policies while section 2.4
provides a discussion of the current milk supply chain and possible coordination mechanisms
used. Two types of supply chains and three types of coordination mechanisms are discussed.
2.1 Role and contribution of agriculture to the Kenyan economy
Kenya has a total area of 582,646 square kilometers, of which 11,230 km2 is under water
(CBS 2006), and an estimated human population of 33.6 million as of the year 2005 (UNSD,
2006). An estimated 65-75% of the population lives in rural areas with the rest residing in
urban areas and towns. This means that agriculture will continue playing a significant role in
the livelihoods of the people. It further means that Kenya’s economy will continue relying on
agriculture to contribute significantly to the creation of the nation’s wealth or gross domestic
product (GDP). Currently, agriculture contributes up to 25% of the country’s GDP. The
multiplier effect of agriculture on the performance of the rest of the economy cannot be
gainsaid. Besides its general contribution to wealth creation, agriculture is vital for the
following reasons:
• It provides 70% of the raw materials required by all industries
• Over 80% of the country’s population relies on agriculture for employment and
general livelihood
• Agriculture is a major source of foreign exchange, major items being tea, coffee,
horticultural produce among others
• It is also a source of employment and incomes, as it contributes up to 19% of
waged employment in the country and employs over 59% of the country’s labor
force (Ngigi, 2005).
INSTITUTIONAL CHANGE AND LIBERALIZATION IN THE KENYAN AGRICULTURE AND DAIRY INDUSTRY
10
The challenge facing the country is harnessing the limited agricultural resources to achieve
the country’s needs in food security and incomes for the people. The constraints facing the
country stem from the increasing population leading to reductions in arable land areas. It is
imperative that agriculture produces not only enough to meet the food needs of those residing
in the rural areas but also adequate surpluses to feed the rest of the population. Agricultural
producers should be assisted to overcome their subsistence nature of production in order to
increase their participation in the market. Thus commercialization of agriculture through
strengthening of agricultural supply chains is necessary to help in achieving these objectives.
The next section reviews major institutional changes that have characterized key agricultural
sectors in Kenya in the last two decades.
2.2 Agricultural liberalization in Kenya
Before liberalization, Kenyan agricultural sector had been dominated by government
parastatals set up to assist producers in processing and marketing agricultural commodities.
The parastatals were set up for major commodities such as tea, coffee, sugar, rice, pyrethrum,
maize, milk and beef among others. Others were set up to assist in financing and insurance of
agricultural activities by guaranteeing minimum returns to farmers. For some time after
Kenya’s political independence, the institutions were being run well and the government
continued supporting them. The government also took over control of cooperatives through
which it used to channel credit and extension services to farmers.
Agricultural liberalization has been taking place in Kenya for the last two decades since mid
1980’s. It had become evident that the parastatals were not performing well anymore due to
poor management (Nyoro, 2002). The parastatals required government subsidies which was a
drain on the economy. The Sessional Paper on Growth and Economic Management of 1986
(Sessional Paper 1 of 1986) initiated the liberalization process in the agricultural sector. The
aim was to remove the monopolistic trends and allow the private sector to participate and take
up the functions of the parastatal bodies. A review of liberalization in the key crop and
livestock sectors show that it has been driven by forces consisting of the donor community
and institutions like the World Bank and the International Monetary Fund (IMF). The
concerns underlying the liberalization have been the need for efficiency and private
participation in the economy in sectors formally controlled by the government through
parastatals. The key agricultural areas that have been affected include coffee, tea, grains
(maize, wheat, and rice), sugar, and dairy industries.
The objectives of the reforms included the following:
INSTITUTIONAL CHANGE AND LIBERALIZATION IN THE KENYAN AGRICULTURE AND DAIRY INDUSTRY
11
• to enhance productivity
• to raise the level of production of basic food commodities to their potential
• to improve quality and standards of products and diversify exports and hence high
economic growth.
A common feature of the liberalization process has been the withdrawal of the then existing
institutions from the market and the coming up of new institutions to try and replace them.
The institutional vacuum following the liberalization policies has been difficult to fill in
certain industries. In certain cases, poor planning has been a major problem for less than
successful performance of the newly liberalized industries, other reasons being government
reversals or half hearted liberalization and lack of capacity to implement the reforms or lack
of supporting institutions to enforce the new trading arrangements. These have had negative
consequences for certain sectors while other sectors have successfully been liberalized.
Examples of sub-sectors and industries that are being liberalized are briefly discussed below.
Fertilizer
Fertilizer trade was liberalized in 1990 (Omamo and Mose, 1999). Before then, international
and domestic trade in fertilizer was being undertaken by the Kenya Grain Growers
Cooperative Union (KGGCU), a parastatal body that was responsible for handling input and
commodity trading in the country. However, due to inefficiencies in its operations, there was
a need to liberalize trade in fertilizer. In 1990, the government liberalized international and
domestic trade in fertilizer by abolishing quotas and licenses and decontrolling prices. As a
result, many private traders entered the business, especially in major urban areas and rural
trading centers. The results of the liberalization are so far mixed; in the high potential areas,
fertilizer availability has improved but in low potential areas, the benefits have been minimal.
The high competition in the trade means that revenues are depressed, yet economies of scale
in the fertilizer trade are important. The institutions in the fertilizer trade are still evolving.
Cereals
Maize market reforms began in 1987/88 with the Cereal Sector Reform Program as part of the
structural adjustment policies (Nyoro et al, 1999). The reform process intensified in the early
1990s under pressure from international lenders culminating in the full liberalization of the
maize industry in 1994. The government eliminated movement and price controls on maize
trading, deregulated maize and maize meal prices and eliminated direct subsidies on maize
INSTITUTIONAL CHANGE AND LIBERALIZATION IN THE KENYAN AGRICULTURE AND DAIRY INDUSTRY
12
sold to registered millers. Maize and maize meal prices were previously set at pan seasonal
and pan territorial levels. Private traders were allowed to transport maize across districts
without any hindrance. The government still participates in maize markets but on a limited
scale through the National Cereals and Produce Board (NCPB) which functions as a price
stabilization and strategic reserves agency. The expected result was to reduce maize
marketing costs by encouraging more market participation by private parties. However, the
objective has not been achieved as the policy environment has not been helpful, tariffs and
trade bans intended to protect consumers and producers are still exercised as the government
tries to ensure that consumers have access to food and that producers are not negatively
affected by predatory pricing practices of traders. A consequence of this is that more than 15
years later, the maize supply chain is still not yet fully functioning. Market failures still
persist, the private sector response has been low and is thought to be collusive and
exploitative. Furthermore, government interference still persists. The same scenario applies to
wheat marketing that was also liberalized in 1993.
Coffee and tea
The process of liberalization in the coffee sub-sector began in 1992 in line with the structural
adjustment policies at the time (Karanja and Nyoro, 2002). At this time, the Nairobi Coffee
Auction was required to conduct its trade in US dollars. Farmers were also allowed to be paid
in dollars, and to retain part of the dollars for their own use. For the farmers, direct payment
gradually replaced the pooling payment system. The pooling system is slow unlike the direct
payment system that is faster and payments are based on quality. However, smallholder
marketing that works through cooperatives continues to use the pooling system. In 1993, the
coffee milling monopoly of the Kenya Planters Cooperative Union (KPCU) ended and other
millers were allowed to enter into coffee milling, increasing the milling capacity from
140,000 to 230,000. The result is that there is overcapacity of about 60% in coffee milling.
Full liberalization of the coffee sector took place in April 2002. Before then, coffee marketing
was solely being undertaken by the Coffee Board of Kenya (CBK). Other agents have since
then been licensed while the CBK has been left to regulate the industry. The rest of the
structure (and participants) comprising of cooperative societies, milling factories and others
remained as before as they were already being privately handled. The gradual liberalization
process in the coffee (and in the tea) sectors were designed to avoid disruptions in coffee
production, processing and marketing. Broad consultations have always been carried out
unlike other sectors that were earlier liberalized. New institutional arrangements in the coffee
INSTITUTIONAL CHANGE AND LIBERALIZATION IN THE KENYAN AGRICULTURE AND DAIRY INDUSTRY
13
supply chain and their effects are still evolving. The need to protect the smallholder farmer
can also be discerned in the coffee liberalization process.
The tea industry was liberalized in the year 2000 and has been relatively successfully.
Liberalization in the sugar industry is still going with some sugar processing firms having
been partially liberalized while others are being prepared for liberalization. The pyrethrum
industry is yet to be opened up.
The next section discusses liberalization and institutional developments in the dairy industry.
2.3 Liberalization and institutional change in the dairy industry
2.3.1 The livestock sub-sector
Livestock contributes about 47% of the agricultural GDP and about 12% to the national GDP
(FAO, 2005). The varied climatic conditions in Kenya underlie the diverse livestock activities
being undertaken in the country. The livestock activities range from cattle, goat, sheep,
donkey, camel rearing and poultry keeping. In the semi arid areas are camels, donkeys and
goats, conditions in these regions being unsuitable for cattle rearing especially for the grade
and improved breeds. Among the livestock, cattle (beef and dairy) play the most significant
role in both national and individual economic welfare. They are kept on both large and small
scales for both commercial and subsistence purposes.
Table 2.1 below shows that the total number of cattle in Kenya is estimated to be 11.5 million
heads (FAO, 2005). A census has not been carried out for the last 40 years to ascertain the
correct number and distribution of the animals hence the figures are at best estimates.
However, the figures show that the number of cattle has been declining for the last decade.
The table also shows that the quantity of milk produced and consumed has remained stable
since the year 2000.
Table 2.1 Key cattle performance indicators in Kenya
Aspect of cattle Year Annual growth rate
1980 1990 2000 2002 1980-1990 1990-2000
Cattle ´000 10,000 13,793 11,706 11,500 3.3 -1.6
Milk production ´000 metric tons
1,033.8 2,480 2,884 2,841 9.2 1.4
Milk consumption ´000 tons 968.6 2,235 2,645 2,640 8.7 1.7
Source: FAO, 2005

INSTITUTIONAL CHANGE AND LIBERALIZATION IN THE KENYAN AGRICULTURE AND DAIRY INDUSTRY
14
Dairy is the second largest contributor to livestock GDP after beef. It provides income to
more than 660,000 rural households, most of who have per capita income of less than US$ 2
per day. The industry is characterized by smallholder producers, who produce over 70% of
the total milk marketed in the country (Staal 2004a).
There is an estimated 3.2 million dairy cattle in the country (Onyango et al, 2003). Cattle of
milk producing ability constitute grade and cross breeds. About 80% of the dairy cattle are
kept by the small scale farmers. Whereas dairy cattle contribute 60% of the total milk in the
country, indigenous animals contribute up to 40% of total national milk production. However,
most of the milk produced by indigenous cattle is not marketed as it is consumed by the
households. The main dairy breeds kept in Kenya are the Friesians, Ayshire, Guernsey,
Jerseys and the cross-breeds.
Most of the high milk producing areas are found in Central Province, Rift Valley and parts of
Eastern Province (slopes of mount Kenya). The two leading milk producing districts in the
country are Kericho (Rift Valley) and Nyandarua (Central). Other districts are Uasin Gishu,
Trans Nzoia, Nakuru in Rift Valley Province and Kiambu in Central province. The areas have
the necessary conditions (temperatures and rainfall) favorable for dairy production.
2.3.2 A historical perspective of the dairy industry: pre-liberalization period
The history of Kenya’s dairy industry is almost synonymous with the history of Kenya
Cooperative Creameries (KCC), a firm formed in 1931 following merging of three milk
cooperatives that were then operating in Naivasha, Nyahururu and Kipkelion areas (Lumbwa).
The need for the merging arose from fierce competition in a market characterized by thin
local markets among the three dairy cooperatives and also from the need to increase the
bargaining power of the farmers (Ngigi, 2005). KCC continued expanding its processing
capacity in the 1950s to cater for the colonial farmers’ interests in the pre-independence
period, to the exclusion of the indigenous people who were not allowed to produce and
deliver their milk to KCC. The firm entered into contracts with the farmers as a means of
reducing uncertainty in the utilization of its investment in processing capacities. Thus in this
period, the dairy industry was dominated by large scale milk producers with smallholder
producers playing a minimal or peripheral role.
KCC remained the sole milk processor and its influence in the industry increased in 1958 with
the formation of the regulatory arm of the government, the Kenya Dairy Board (KDB),
through the Dairy Industry Act Chapter 336 Laws of Kenya. KCC was given powers to act as

INSTITUTIONAL CHANGE AND LIBERALIZATION IN THE KENYAN AGRICULTURE AND DAIRY INDUSTRY
15
a government agent in the processing, packaging and selling of milk in urban areas. It was to
ensure that no raw milk is sold in the urban areas. However, raw milk could be sold in the
rural areas.
The role of the Kenya Dairy Board was generally to promote milk production and marketing.
Specifically, it was mandated to
• Organize, regulate and develop efficient production, marketing, distribution, and
supply of dairy produce required by different classes of consumers
• promote quality assurance to attain high quality products with emphasis on
hygiene of milk production
• encourage proper use of milk containers for transportation and storage facilities
for milk and milk products
• regulate the sales of raw milk and importation of dairy products
• promote consumption of quality milk and milk products
• develop, promote, and advise on proper packaging equipment and materials
• license milk producers and processors to permit the greatest possible degree of
private enterprise in production and processing of dairy products
• enforce the Dairy Industry Act through anti-hawking operations and prosecutions
• train farmers on clean milk production and modern techniques of animal
management through short courses and seminars.
However the Board was never fully empowered to regulate and oversee the development of
the dairy industry. Besides lacking in adequate financing, most of the important functions had
been transferred to KCC (nutrition function) and the Ministry of Agriculture (dairy
development). Thus KCC, which was essentially a private firm but with heavy government
influence and interventions, acquired regulatory powers. This situation continued even after
independence giving rise to the monopolistic status of KCC in the dairy industry.
In the last few years before and after independence, the share of the smallholder agriculture in
national production and marketed surplus increased tremendously. This was largely due to the
use of high yielding cattle breeds, supporting institutional and organizational frameworks for
milk marketing and improved services for tick control, disease control, extension and artificial
insemination services. It should be noted that the period before 1969 was characterized by
INSTITUTIONAL CHANGE AND LIBERALIZATION IN THE KENYAN AGRICULTURE AND DAIRY INDUSTRY
16
open markets with independent dairies processing their milk. However, after 1969, the
situation started changing, especially between 1969 and 1992. Rationalization of the dairy
industry by the government ultimately created a monopolistic market situation.
One of the major developments in the period before liberalization involved initiation of milk
price controls by the government in 1971 based on the uniform pricing system and abolishing
the quota system. The result was that KCC received virtual monopoly rights in the industry. It
was also required to buy all quality milk delivered at its gate without turning away the farmers
subject to minimum quality requirements. This meant KCC became a buyer of last resort for
the milk delivered by the farmers. It also acted as a strategic reserve provider of milk for the
government through powdered milk. This also meant that the firm could even out deficit
periods by reconstituting the powdered milk into liquid milk as need arose. It also acted as the
government’s agent in the school milk feeding program (Ngigi, 2005).
Consequently because of these expanded roles, KCC increased its capacity countrywide to
include 11 cooling plants and 11 processing plants spread over the country and processed a
variety of products. It provided a reliable outlet for all dairy farmers, which was favorable to
the smallholders. Other private firms were restricted to niche or specialty products like
cheese, yoghurt and ice cream.
Despite KCC’s monopoly, Ngigi (2005) observes that the firm was only able to utilize 77% of
its installed capacity that stood at 1.2 million liters per day as of 1991. This was due to the
seasonality of the milk production eventually leading to cost control problems. The firm had
also employed too much permanent labor and coupled with lower margins, heavy inventories,
high transportation costs and wastes in the rainy season, its performance and efficiency
declined. Delayed payments to farmers also set in leading to the insolvency of cooperatives
which were in charge of the collection and the transportation of milk to KCC and transmitting
payments to farmers. KCC was being served by about 700 cooperatives that were handling
80% of the milk being delivered to the firm. In the 1980s two small cooperatives were set up
on a pilot basis to process milk. These were Kitinda in Western Kenya and Meru Dairy in
Eastern province. However, the two firms controlled only 2% of all milk marketed through
the formal channel. Hence KCCs monopoly went on unchallenged.
In summary, the pre-liberalization period was characterized by increased participation of
smallholder producers due to reduced costs of marketing and improved services. It was also
characterized by heavy government controls and protectionism for the industry. A single
processor (KCC) was sanctioned by the government thereby becoming quasi parastatal, which
INSTITUTIONAL CHANGE AND LIBERALIZATION IN THE KENYAN AGRICULTURE AND DAIRY INDUSTRY
17
was however not able to efficiently utilize its capacity, control costs and effectively market its
products on behalf of farmers. Social functions were emphasized at the expense of
commercial or sound economic decisions. Furthermore the regulatory mechanism through the
Kenya Dairy Board (KDB) was found to be inadequate.
2.3.3 Post-liberalization scenario
Reforms in the dairy industry began in 1987 when the government began divesting away from
breeding services through cost recovery measures. The breeding service (Artificial
Insemination) costs had earlier in 1966 been lowered to make them affordable to farmers. In
1988, the government divested away from clinical services which were from then expected to
be undertaken by the private sector. In 1989, the manufacture and sale of feeds was
liberalized. In 1991, the process to transfer management of cattle dips to local communities
was started and completed in 1992. And in 1992, the marketing of milk was liberalized
following elimination of price controls.
One feature arising out of the liberalization of the industry is the increase in the number of
private firms and individuals operating in the industry besides KCC. The number of
processors shot to 42 in 1999 from three in 1991. In the pre-liberalization period, KCC’s peak
production per day was 0.97 million liters. Later in 2000, this daily intake reached a low of
about 20,000 liters per day. The decline in KCC’s intake has had serious implications for the
dairy industry. The next section analyses the milk supply chain in the post liberalization
period in Kenya.
2.4 The Kenyan milk supply chain
2.4.1 The chain configuration
The milk supply chain involves activities and processes from production, processing, trading
and consumption of milk. The Kenyan milk supply chain can be categorized into two: the
cold chain and the warm chain. Milk delivered to the main processing firms constitutes the
'cold chain' or the pasteurized milk system while milk sold and used in an unprocessed form
constitutes the 'warm chain'. Each of these chains has an important role to play. The supply
chains differ in terms of sizes, geographical distribution, degree of licensing, relative rewards,
quality perceptions and long term prospects for the development of the dairy industry. There
are continuing developments and tradeoffs in the industry meaning that the various

INSTITUTIONAL CHANGE AND LIBERALIZATION IN THE KENYAN AGRICULTURE AND DAIRY INDUSTRY
18
institutions and supply chains are still evolving. Figure 2.1 shows the typical milk supply
chains in Kenya.
Figure 2.1 Diagrammatic representation of the typical milk chains in Kenya
An alternative classification to cold and warm chains above is formal and informal milk
supply chains. Supply chains handling non processed milk products are categorized as
informal supply chains (Ngigi, 2005; Onyango et al, 2003). They include mobile (itinerant)
traders, milk bars and kiosks, brokers, and self help groups. The formal chain participants are
the milk processors, cooperatives, supermarkets and retail shops and kiosks, milk bars and
others that handle processed milk products.
An overview of the supply chains shows that 42% of the milk is often sold directly to
customers by the milk farmers. On the other hand 32% of the milk is sold to informal market
participants who also buy 6% from cooperatives to bring the total milk handled by them to
38%. About 24% of the milk is sold through cooperatives and of this amount, 12% is
delivered to processors and 6% sold directly to consumers. Only 14% of the farmers' milk is
handled by the processing firms (Staal 2004b). However, evidence also shows that some of
the informal participants deliver some of their milk to processing firms.
Milk producers
Wholesale/retail outlets
Consumers
Informal outlets (mobile traders, milk bars etc)
Milk processing firms
Cooperatives, other bulking producer organizations
Input suppliers (funds, materials, knowledge, information)

INSTITUTIONAL CHANGE AND LIBERALIZATION IN THE KENYAN AGRICULTURE AND DAIRY INDUSTRY
19
2.4.2 Milk production system and consumption
The type of milk production system depends on the technology used and the number of
animals kept. The production systems are classified as small, medium and large scale
productions according to the number of animals kept. The cost structures and margins
(including milk prices) vary according to the production systems as well as from region to
region (Ngigi, 2005; Staal, 2004a) (Table 2.2 below shows some of their characteristics).
Table 2.2 Milk production (grazing) systems in Kenya
Small-scale Zero Medium-scale open Large-scale open
Cows (average) 3 12 146
Milking cows 2 4 33
Acres 1 4 160
Marketed milk (liters) 2,014 3,180 73,700
Other: Home use calf feeding and unsold
1,210 4,339 29,377
Total (liters) 3,224 7,519 103,077
% marketed 62 42 72
Source: Adapted from Karanja (2003:8)
However, the classification of milk producers by number of cows kept or size of land may not
give a true picture of what is meant by smallholder producer. Other sources have classified
smallholders as productions less than five liters of milk per day. This captures intensive
producers who may have less than 3 cows and less than one acre of land but efficient enough
to produce more than 5 liters of milk per day. The quantity of milk produced and marketed is
a better criterion for classifying the milk producers. This study involves only small and
medium scale milk producers with daily milk productions less than 100 liters.
Table 2.3 Cost and price per liter of milk
Zero-grazing system small-scale open grazing large-scale open grazing
Variable costs 8.60 6.20 8.50
Labor costs 4.90 3.10 2.70
Fixed costs 1.45 1.20 1.30
Total costs 14.95 10.50 12.50
Producer price 15.00 12.00 14.00
Source: Adapted from Karanja (2003:11)

INSTITUTIONAL CHANGE AND LIBERALIZATION IN THE KENYAN AGRICULTURE AND DAIRY INDUSTRY
20
Figures available from Karanja (2003) indicate that zero grazing systems face higher milk
production costs compared to small scale open grazing or large scale open grazing systems.
However, the systems also face different prices depending on their locations, sales outlets and
buyer arrangements (table 2.3 above).
Table 2.3 above indicates that margins are narrower for zero grazing farmers. Their cost
structure is higher as they use relatively more purchased inputs (feed) and fixed assets
compared to other grazing systems. Per unit production costs also depend on the average
yields per cow which vary according to production systems and regions. For example, in a
study by Ngigi (2005), she finds that milk yields per cow were 2214.97 liters in Kiambu
under zero grazing system and 1633.46 liters per year in Nyandarua and Nakuru under open
grazing systems. Therefore the costs and production levels vary according to the production
system employed and location of the farming units. Table 2.4 below further illustrates these
observations.
Staal, (2004a) estimates the average costs and revenue for three districts of Kiambu, Nakuru
and Nyandarua and shows that milk producers are able to make some positive returns from
their enterprises. Kiambu has the highest cost structure but also fetches a higher price by
virtue of its proximity to the capital city, Nairobi. The other districts fetch lower prices but
also are also low cost producers. In an efficiently working market however, Kiambu
producers are likely to be disadvantaged.
Table 2.4 Comparison of costs and revenues for three districts
Kiambu (1998) Nakuru (2000) Nyandarua (2000)
Cost per liter (Kshs) 17.20 13.28 11.93
Price per liter (minimum)
17.63 15.19 14.30
Revenue per liter 21.29 16.88 16.68
Profit per liter 4.09 3.60 4.75
Source: Adapted from Staal (2004a:3)
2.4.3 Consumption patterns in the country
Of the total milk produced in the year 2000, 63% was marketed, about 30% was consumed at
home, and 7% fed to calves. The marketed milk is usually a surplus after home consumption
and feeding of calves have been taken care of.

INSTITUTIONAL CHANGE AND LIBERALIZATION IN THE KENYAN AGRICULTURE AND DAIRY INDUSTRY
21
Though national milk production is currently higher than demand, the increasing population
coupled with an improvement in the economic condition may put pressure on the milk
supplies in a few years’ time. The balance between demand and production will depend on the
state of the economy (Omore et al, 1999). In a depressed economy, the surplus situation in the
market may persist for some time.
About 80% of processed milk products are sold in Nairobi and Mombasa. Per capita
consumption is estimated at 82 liters on average, but this ranges from less than 64 liters in the
rural areas to 125 liters in the urban areas. Milk shows high income elasticity, which provides
potential for the growth of the industry especially when economic conditions and incomes
improve (Karanja, 2003; Onyango et al, 2003).
Most of the marketed milk, whether raw or processed, is consumed in the urban areas. The
informal milk outlets account for up to 80% of the outlets while formal or processed milk
account for the remaining portion in the urban areas. However, in Nairobi, most of the milk
consumed is processed milk (Staal, 20004b).
2.4.4 Informal milk supply chain
One feature characterizing the current milk supply chain is the emergence of informal milk
outlets in the country. Informal milk sales account for up to 80% of the milk supplied and
consumed in urban and peri-urban areas. Informal milk supply chains therefore cannot be
ignored anymore because of the role they currently play in the milk industry. Sale of
unprocessed milk in urban areas is illegal, however, it is legally allowed in the rural areas.
However, Ngigi (2005) notes that unprocessed milk has always been sold in urban areas even
before liberalization. This implies that it is the scale and openness of the operations that have
brought the illegality of the practice into the open. The regulations regarding informal milk
sales were not changed, therefore informal distribution of milk in urban areas remains an
illegal activity. However the sale of unprocessed milk in urban areas has continued to flourish
due to the lucrativeness of the market and inability of the Kenya Dairy Board to effectively
regulate and ensure compliance.
Informal milk distribution takes the form of direct sales to consumers by farmers, milk
vending (mobile or itinerant traders), operating milk bars and other retail outlets that generally
handle unprocessed milk. In urban areas, the diminishing purchasing power of consumers has
made informal milk distribution an attractive source of milk for the people compared to the
high prices offered for processed milk products. Consumer prices are sometimes up to 30-

INSTITUTIONAL CHANGE AND LIBERALIZATION IN THE KENYAN AGRICULTURE AND DAIRY INDUSTRY
22
50% cheaper for unprocessed milk compared to prices for processed milk products.
Consumers in the country also perceive whole milk as being superior (quality and taste) to
skimmed pasteurized milk, based on the butter fat content. Furthermore for producers, milk
prices have been found to be 10-20% higher than what processing firms pay the producers.
Payment for the milk is also timely, so the farmer does not have to wait for long periods
before receiving a payment.
However, informal milk distribution faces problems such as perceived unhygienic conditions
under which the informal milk dealers operate which are likely to pose health hazards to
users. Many of the operators have no training or facilities to handle milk safely and
hygienically. Some of the operators are not licensed to operate the milk outlets. Besides risks
in handling of milk, there have been fears that use of raw milk may bring about zoonotic
diseases (TB, Brucellosis, and Pneumonia) which can be transmitted to man. This is
particularly so if the milk is not properly boiled before use, however it is common for milk to
be boiled by households before use.
There have been reported cases of adulteration of milk through addition of water, or additives
and preservatives to enhance shelf life, which are harmful to consumers. This is a classic case
of moral hazard and hidden action. Sometimes milk coagulates while being moved over long
distances before they are sold. This causes losses to the vendor and or to the farmer.
With most milk being consumed in raw form, form and time utility, which are created through
processing, are lost. There are also possibilities of shortages (due to droughts) arising out of
lack of reserves or storable products to even out the cycles. This is likely to create price
instabilities in the market, which are not conducive for the development of the industry.
Shortages are often reported in the coastal areas by as much as 70% and by 30 to 40% in the
west of the country. However, most of the shortages are as a result of preference for raw milk
rather than availability of milk in general. It is also a result of the inability of consumers to
afford the high prices charged for processed milk.
Sometimes producers have not been paid for their milk by the vendors or the vendors have
disappeared with the proceeds from the milk. This means that whereas informal channels pay
on time and a higher price, they cannot guarantee farmers a reliable market for their milk. As
farmers increase their production levels, the informal distributors can absorb only limited
quantities. Farmers have to look elsewhere for a market beyond the informal buyers, that is, in
the formal market. Thus for the long term development of the dairy industry, the formal
market has an important role to play (Staal 2004b; Launonen et al, 1985).

INSTITUTIONAL CHANGE AND LIBERALIZATION IN THE KENYAN AGRICULTURE AND DAIRY INDUSTRY
23
2.4.5 Milk collection, processing and marketing in the formal supply chain
Collection of milk
When brokers are used to collect milk from farmers, they are paid a margin or per unit (liter)
commission. Brokers ensure that the milk collected from producers is of the right quality.
Brokers are informal agents. Cooperatives and self-help groups also play a vital role in the
bulking of milk for onward transmission to processing firms or direct resale to consumers and
other traders. Some 332 dairy cooperatives are registered in Kenya and handle up to 24% of
the total milk marketed by smallholder farmers (Staal 2004a). Most of them channel their
milk to processors. To transport the milk, most transporters charge producers an average of
Kshs 2 per liter of the collected milk (Karanja, 2003).
The types and numbers of licensed milk traders in Kenya as of 1999 are shown in table 2.5
below. Most producers and informal outlets are not registered hence are not reflected in the
table. This is in addition to the supermarkets and other general grocery shops, whose role in
marketing of processed milk is increasingly becoming significant.
Table 2.5 Registered participants in the milk chain
Producers Processors Milk bars Mini dairies Cottage Total
1043 42 393 23 51 1552
Source: Adapted from Karanja (2003:23).
Milk processing and the problem of prices and capacity utilization
Though the number of processors licensed stood at 45 in 1999, only 34 firms were operational
at the time. Of the 3 billion liters of milk produced in 1999, only 200 million liters of milk
were processed. The rest was used unprocessed, consumed at home or fed to calves or wasted.
By the end of 2001 only 22 processing firms were operational and by 2004, the number of the
firms is reported to have fallen to 17. There are realignments in the industry and efficient
processors are expected to survive. The large number of processing firms implies more
competition for the consumer’s attention. Ultimately the number of processors will decline
thus increasing concentration in the industry. The concentration levels in the industry are
shown in table 2.6 below.

INSTITUTIONAL CHANGE AND LIBERALIZATION IN THE KENYAN AGRICULTURE AND DAIRY INDUSTRY
24
Table 2.6 Concentration in the Kenyan dairy industry
Top 2 firms, % Top 4 firms, % Bottom 10 firms, %
1999 42 65.5 1.9
2001 64.5 79.5 2
Source: Karanja (2003:30)
In 1999, the top 4 firms were Brookside, Premiere, Spin Knit, and Meru Central. In 2001, the
firms remained the same but with Meru Central overtaking Premiere. The concentration ratio
is expected to be even higher in 2005 as the larger firms (including New KCC) improve their
milk intake and efficiency. Concentration levels affect economies of scale, transaction costs
and other economies and this should benefit consumers in terms of lower prices (Girgzdiene,
1999). Capacity utilization determines the firms’ ability to spread the costs of processing milk
through economies of scale. The rate of capacity utilization is expected to change from time
to time, especially with the on going realignments. Only 26% of installed processing capacity
in the industry was being used as of 1999. This idle capacity was contributed to a very large
extent by KCC. Of the total estimated 2 million liter processing capacity in the industry, KCC
has 1.2 million liters or 60%. As of 1999, KCC was using only 10% of its capacity. The rest
are shared by the other firms in varying capacities. However, the New KCC has currently
improved its milk intake to about 300,000 liters per day since being reorganized by the
government. Low utilizations of available capacity ultimately translate into high prices for
consumers and low prices for producers. The inability to utilize capacity is an indicator of
lack of sales growth, which indicates low performance.
Pricing structure, competitiveness and performance of processors
A feature closely linked to and impacting on the actual and potential performance of the milk
processing firms is price of processed milk. On freeing up the milk market, the expectations
were that competition would bring in favorable prices for both the producer and the consumer,
but this has not been realized. Producer prices have remained relatively low as a proportion of
consumer prices for the processed milk products. For example, the current prices paid by the
processors to the farmers have ranged between Kshs 13 to 19. During periods of gluts (long
rain season) the price paid to producers sometimes falls as low as Kshs 10.
On the other hand consumers pay a price ranging from Kshs 42 to 60 for a liter of fresh
pasteurized or whole milk. The gap between the consumer prices and the producer prices thus

INSTITUTIONAL CHANGE AND LIBERALIZATION IN THE KENYAN AGRICULTURE AND DAIRY INDUSTRY
25
comes to about three times the prices producers receive. With most people in Kenya living on
less than 2 dollars per day, processed milk gets out of reach for most of them. But milk is
essential for the health and nutrition of the people and since access to milk through the formal
outlets is beyond most of the people’s reach, informal milk supply chains naturally fill this
gap.
When the consumer price is used as a measure of performance, there seems to be high levels
of inefficiencies at the processing stage of the supply chain (Karanja, 2003). The trend in
prices shows that consumer prices have increased for the last 15 years. On the other hand,
producer prices decreased (in real terms) over the same period. This implies the welfare of
producers has decreased. The proportion of consumer price paid to producers has declined
from 60% between 1985-1990, to 28% in 2001. The processing stage is therefore a costly link
in the supply chain.
The fact that upcountry prices for processed milk are lower by as much as 20% than in major
cities can be attributed to the marketing strategy differentials of the milk processing firms
(Karanja 2003). Since the milk is supplied by the same processors, this cannot be attributed to
the production cost structure alone. It may be a price skimming strategy by processors in the
major urban areas. The margins on the milk in supermarkets are also thin. Karanja computes
the processing margin to be 57% of retail consumer price for one liter of milk. Thus most of
the margin between the producer and consumer prices can be attributed to the processing
stage of the chain.
The cost of packaging material constitutes the largest portion of the cost of milk, amounting
to 26% of the consumer price. Packaging is monopolized by one firm. Cheaper packaging
materials and technologies are necessary to reduce the costs of packaging and consequently,
the consumer prices (table 2.7 below). The total cost of pasteurizing, cooling and packaging
was estimated at 40% of the consumer price. The profit margin for the milk processing firms
of 16% of consumer price is also very high. Raw milk cost accounts for only 26% of the
consumer milk price. Transportation costs on the other hand have been found to be quite
minimal relative to the consumer prices. Both informal and formal milk supply chain charge
the same transport cost per liter. Therefore the contribution to these high consumer prices
cannot be directly linked to transportation costs. The scenario shows the magnitude of the
challenges facing the formal milk supply chain in the country.
INSTITUTIONAL CHANGE AND LIBERALIZATION IN THE KENYAN AGRICULTURE AND DAIRY INDUSTRY
26
Table 2.7: Components of consumer price
Cost component Contribution to consumer price (%)
Cost of raw milk 26
Transport costs 6
Processing 57
Retail margin 8
Distribution 3
Source: Adapted from Karanja, (2003:35)
Coordination in the milk industry
Three types of coordination mechanisms are commonly used in the milk transactions: Spot
market contracts, verbal contracts and, written contracts. Spot market contracts are
characterized by one off transactions between agents with no prior arrangements and no
guarantee for repeat transactions in future. The transactions usually take place at market
centers but buyers looking for milk can also search for sellers to buy the milk. Most of the
transactions involve spot cash payments and prices may be negotiated during the transaction.
Furthermore, sellers use spot market contracts mostly when they have surplus milk that has
not been committed for delivery to other buyers. On the hand, verbal contracts involve prior
agreements to supply milk at certain prices (mostly negotiated in advance) and involve repeat
transactions. The collection of milk is agreed upon in advance, which could be as follows:
buyer collects from seller, seller delivers to buyer or another location for delivery is agreed
upon in advance. Payments for the milk may be on the spot or deferred in case of credit
transactions. Reputations play an important role in ensuring that the parties meet their part of
the contracts. Finally, written contracts are very much similar to verbal contracts except that
they are formal agreements, being backed by law. Written contracts are signed by the parties
concerned for delivery of quality milk at specified prices and locations. Volumes may not
necessarily be specified in the contracts.
The chapter has reviewed the Kenyan milk supply chain in light of the institutional changes
that have been occurring in the industry in the last two decades. It has shown that the nature of
production and marketing activities leaves the milk supply chain prone to coordination
problems arising out of transaction costs and that there are disparities in the performance of
the milk supply chains. It has also reviewed the coordination modes in the milk supply chains.
The next chapter discusses the theoretical framework that can be used to analyze transaction
relations and performance of the fresh milk supply chains in the country.
TRANSACTION COST THEORY AND COORDINATION MECHANISMS
27
CHAPTER 3
TRANSACTION COST THEORY AND COORDINATION MECHANISMS
The chapter discusses the theories underlying institutional arrangements, that is, coordination
mechanisms, and performance in supply chains. It reviews the challenges facing product
supply chains in light of transaction costs they face. According to Hobbs (1996), the
appropriate framework for analyzing supply chain management relations is the Transaction
Cost Economics theory, which is a branch of the New Institutional Economics (NIE). In the
supply chains, transactions are determined not only by prices involved. The behavior of
transacting parties is critical in determining whether the transaction takes place or not.
Performance in supply chain depends on how chain relations are managed, that is, how agents
go about managing costs of their transactions.
The chapter begins by tracing developments in the economic theories underlying transactions
between agents, from the classical economic theory through neoclassical economic theories in
section 3.1. Section 3.2 introduces the New Institutional Economic Theory while section 3.3
introduces the Transaction Cost Theory and various definitions for transaction costs. Section
3.4 relates Information Economics to Transaction Cost Theory and section 3.5 relates
elements of Behavioral Economics to transaction costs and coordination mechanisms. Section
3.6 addresses the dimensions of transaction costs and their relationship to coordination
mechanisms. Finally, section 3.7 reviews the role of institutions, transaction costs and
coordination mechanisms in developing markets.
3.1 Classical and neoclassical economic theories
3.1.1 The classical economic theory
The Classical School of Economic Theory began with the publication in 1776 of Adam
Smith's monumental work, ‘The Wealth of Nations’. Adams Smith cited in Barney and
Hesterly (1996) was among the first people to explain the role of decentralized system of
prices as a coordination mechanism in the market through the operation of ‘the invisible hand’
in The Classical Theory of Economics. Much of this work was in developing theories about
the way markets and market economies work. The working of the ‘invisible hand’ was such
that it leads all individuals in the market, in pursuit of their own self-interests, to produce the
greatest benefit for the society as a whole. The approach known as a 'laissez-faire' approach
places total reliance on markets, and anything that prevents markets from clearing properly
should be done away with. The government was not supposed to intervene in markets but was

TRANSACTION COST THEORY AND COORDINATION MECHANISMS
28
to play its role by encouraging free trade and free markets. Any imperfections in the market
that prevented this process should be dealt with by the government to ensure that optimum
equilibriums in the economies or markets were attained. The government was supposed to
achieve optimum equilibrium through the use of 'supply-side policies' (to reduce market
imperfections) and to ensure a balanced budget based on three theories: free market theory,
Says law and quantity theory of money. Much of Adam Smith’s work laid the foundation of
modern economics. Much of this work has subsequently been updated by modern economists
who generally are referred to as Neo-Classical Economists, the word neo meaning ‘new’.
Among the opponents of classical economic theory were the Keynesian economists arising
from the works of John Maynard Keynes from the 1930s. Keynesians argued that markets
would not automatically lead to full-employment equilibrium, but in fact the economy could
settle in equilibrium at any level of unemployment. This meant that classical policies of non-
intervention would not work. The economy would need prodding if it was to head in the right
direction, and this meant active intervention by the government to manage the level of
demand, unlike classical theories that sought to have no government involvement in markets.
Another critic of the Classical theory was John Stuart Mill who differed with the earlier
classical economists on the inevitability of the distribution of income produced by the market
system. Mill pointed to a distinct difference between the market's two roles: allocation of
resources and distribution of income. The market might be efficient in allocating resources
but not in distributing income, he wrote, making it necessary for society to intervene. Thus the
issue of functioning and malfunctioning (failures) of markets had begun that necessitated a
review of the economic thinking underlying the working of the markets.
3.1.2 Neoclassical (new classical) economics
Under classical economics the value of a product was thought to depend on the costs involved
in producing that product. Goods were distributed in an economy, it was assumed, in the same
way that costs were distributed -- thus a landlord would receive more goods than a tenant
farmer because the landlord bore most of the cost. The problem with this approach was that
prices for a product did not always reflect the expected value as indicated by the costs of a
product. Clearly, something was wrong with the perspective that the cost of a product was
expressed in its price, a phenomenon that is explained by differences in "utility." Economists
began to explore the way that elements such as supply and demand effected price, and Neo-
Classical Economics gradually came into being.
TRANSACTION COST THEORY AND COORDINATION MECHANISMS
29
New Classical Economics (NCE) emerged as a school in macroeconomics during the 1970s
based on neoclassical economic framework. It emphasizes the importance of rigorous micro
foundations, in which the macroeconomic model is built up from the actions of individual
agents, whose behavior is modeled by microeconomics. Neoclassical economics refers to a
general approach to economics based on supply and demand which depends on individuals (or
any economic agent) operating rationally, each seeking to maximize their individual utility or
profit by making choices based on available information.
Neoclassical Economics is based on three main assumptions: rationality and self interest,
utility and profit maximization, and full and relevant information. The assumptions are briefly
discussed below.
Rationality and self interest
People have rational preferences among outcomes that can be identified and associated with a
value. All agents also possess rational expectations. Rationality implies that preferences are
rational if they are complete and transitive. That is, that the decision maker is able to compare
all of the alternatives, and that these comparisons are consistent. The decision makers then
choose or predict the best alternative. Rational expectations refer to the use of the available
information to make the best possible predictions about the future.
Neoclassical economists usually assume, in other words, that human beings make the choices
that give them the best possible advantage, given the circumstances they face. Circumstances
include the prices of resources, goods and services, limited income, limited technology for
transforming resources into goods and services, and taxes, regulations, and similar objective
limitations on the choices they may make.
Strictly speaking, neoclassical economics does not assume that real, concrete human beings
are rational and self-interested. Rather, most economists assume that economic systems work
as if they consisted of rational, self-interested persons. The rationality and self interest here
refers to the average person, where it is assumed that deviations from rational self-interest are
random and will cancel out and so the system will act as if everyone were rational and self-
interested. Accordingly, neoclassical economics studies an economic system consisting of
rational, self-interested persons.
There are two very different issues here. The first issue is that people are sometimes altruistic.
People often do act on non-self-interested values -- but when they do so they act on their own
values, not those of the government, some philosopher, or (most important) the observing

TRANSACTION COST THEORY AND COORDINATION MECHANISMS
30
economist. A broader neoclassical economics assumes that people choose in the way that best
advances their own values, altruistic or self-interested as those values may be.
Utility and profit maximization
Individuals maximize utility and firms maximize profits. Utility maximization implies that
rational economic agents make decisions that maximize their satisfaction in consumption.
Under profit maximization, the agents determine price and output levels that return the
highest profits possible.
Full and relevant information
The assumption implies that people act independently on the basis of full and relevant
information. Information relevant for decision making is available to decision makers who
make full use of it. There is perfect information such that no economic agent will be left
worse off or better off for lack of relevant information for decision making.
From the three assumptions above, neoclassical economists have built a structure to
understand the allocation of scarce resources among alternative ends. From the basic
assumptions of neoclassical economics comes a wide range of theories about various areas of
economic activity. For example, profit maximization lies behind the neoclassical theory of the
firm, while the derivation of demand curves leads to an understanding of consumer goods,
and the supply curve allows an analysis of the factors of production. Utility maximization is
the source for the neoclassical theory of consumption, the derivation of demand curves for
consumer goods, and the derivation of factor supply curves.
The role of demand and supply was emphasized by Marshal in his book (Principles of
Economics, 1890) where he explained that prices resulted from the intersection of demand
and supply curves and introduced the concept of market periods, from the very short run to
the long run.
Neoclassical economists believe that free markets usually bring about an efficient allocation
of resources. Consequently, efficient allocation is the important thing about free markets. In
those more or less rare cases when markets "fail" to bring about an efficient allocation of
resources, it is appropriate for the government to intervene to correct the situation, if it can.
The framework of neoclassical economics is summarized as follows. Buyers attempt to
maximize their gains from getting goods, and they do this by increasing their purchases of a
TRANSACTION COST THEORY AND COORDINATION MECHANISMS
31
good until what they gain from an extra unit is just balanced by what they have to give up to
obtain it. In this way they maximize "utility"—the satisfaction associated with the
consumption of goods and services. Likewise, individuals provide labor to firms that wish to
employ them by balancing the gains from offering the marginal unit of their services (the
wage they would receive) with the disutility of labor itself—the loss of leisure. Individuals
therefore make choices at the margin. This results in a theory of demand for goods, and
supply of productive factors (Wikipedia, 2006).
Similarly, producers attempt to produce units of a good so that the cost of producing the
incremental or marginal unit is just balanced by the revenue it generates. In this way they
maximize profits. Firms also hire employees up to the point that the cost of the additional hire
is just balanced by the value of output that the additional employee would produce.
The neoclassical vision thus involves economic "agents," be they households or firms,
optimizing (doing as well as they can), subject to all relevant constraints. Value is linked to
unlimited desires and wants colliding with constraints, or scarcity. The tensions, the decision
problems, are worked out in markets. Prices are the signals that tell households and firms
whether their conflicting desires can be reconciled.
Neoclassical economics conceptualized the agents, households and firms as rational actors.
Agents were modeled as optimizers who were led to "better" outcomes. The resulting
equilibrium was "best" in the sense that any other allocation of goods and services would
leave someone worse off. Thus, the social system in the neoclassical vision was free of
irresolvable conflict. The next section relaxes some of these assumptions.
3.2 Basis and foundations of New Institutional Economics
A realization that perfect market competition was not always appropriate led to other models
being introduced such as imperfect competition market model forms and industrial
organization.
Institutional economics regards individual economic behavior as part of a larger social pattern
influenced by current ways of living and modes of thought. It rejects the narrow classical
view that people are primarily motivated by economic self-interest. Opposing the laissez-faire
attitude towards government's role in the economy, the Institutionalists called for government
controls and social reform to bring about a more equal distribution of income. Institutional
economics therefore developed as an alternative to the neoclassical economic theory
TRANSACTION COST THEORY AND COORDINATION MECHANISMS
32
formulated by among others, Alfred Marshall in the 19th century. The most prominent of the
so-called old Institutionalists were Thorstein Veblen and John R. Commons.
Major contributions to New Institutional Economics, to which transaction cost economics
belong, have been made by Oliver Williamson, Douglas North among others over the last
three decades. Williamson used the term New Institutional Economics to distinguish it from
the ‘old institutional school’ pioneered by Commons and Veblen (Paarlberg, 1993).
According to the old institutional school, institutions were a key factor in explaining and
influencing economic behavior, but there was little analytical rigor and theory in this school
of thought. It operated outside the neoclassical economics, and there was no quantitative
theory from which reliable generalizations could be derived or from which sound policy
choices could be made. Neoclassical economics on the other hand ignored the role of
institutions and economic agents that were assumed to operate in almost a vacuum (Makhura,
2001).
According to the neoclassical theory, markets function according to the Walrasian model in
which homogenous products are traded, perfect information is guaranteed for both sellers and
buyers and friction in time or space does not occur (Kreps, 1994 in Boger, 2001a). However,
the frictionless trading and business environment have been shown to fall short of
characterizing the operation of market economies.
In his path breaking article, ‘The nature of the firm’, Coase (1937), showed that despite the
price system, firms continued to exist because sometimes the cost of transactions in the
market were higher than if transactions are internalized, that is, carried out wholly within the
organization. He stated that the cost of using the market involves the cost of establishing the
price, the cost of negotiations, the cost of specification of the contract and, the cost of
monitoring compliance. In the presence of high costs of using the market, firms provide an
alternative to the market system. Specifically the coordination alternative used depends on the
associated costs of transactions, that is, which coordination is more efficient (FitzRoy et al,
1998). Neoclassical economic assumptions of no transaction costs, perfect information and,
full rationality, are relaxed under New Institutional Economics, which helps cope with real
world economic problems (Boger, 2001a; North, 2005). But the assumption of self-seeking
individuals attempting to maximize their utility or profit subject to certain constraints still
holds. The NIE encompasses both paradigms and acknowledges the importance of institutions
within the framework of neoclassical economics.
TRANSACTION COST THEORY AND COORDINATION MECHANISMS
33
New institutional economics explains the operation and evolution of institutions over time and
evaluates their impact on economic performance, efficiency, and distribution (Boger, 2001a;
North, 2005). There is a sort of two way causality between institutions and economic growth.
On the one hand, institutions have a profound influence on economic growth, and on the other
hand, economic growth and development often result in a change in institutions. However, not
all institutional changes are beneficial. By influencing transaction costs and coordination
possibilities, institutions can either facilitate or retard economic growth. This may be
explained by the availability of different institutions in different countries and different
economic development paths.
The NIE represents an expanded economics that focuses on choices people make, while at the
same time it allows for factors such as pervasiveness of information, evolution and evolution
of norms, and willingness of people to form bonds of trust (Boger, 2001a; Clauge 1997;
Williamson, 2005). The goal of new institutional economics is therefore to explain what
institutions are, how they arise, what purpose they serve, how they change and how, if at all,
they should be reformed (Klein, 1999).
Institutions have been defined as rules of conduct (norms, traditions, value systems, religions,
sociological trends) that facilitate coordination or govern relationships between individuals or
groups. Institutions provide for more certainty in human interaction (North, 1990). Institutions
therefore have influence on behavior and therefore on outcomes such as economic
performance, efficiency, economic growth and development.
Approaches to New Institutional Economics (NIE)
NIE operates at two levels: macro and micro levels (Williamson, 2000). The macro level
deals with institutional environment or rules of the game, which affect the behavior and
performance of economic actors and in which organizational forms and transactions are
embedded. Williamson further describes it as the set of fundamental political, social, and
legal ground rules that establish the basis for production, exchange and distribution. The
other level is the micro level which is also referred to as institutional arrangements, and deals
with the institutions of governance. Institutions of governance refer to modes of managing
transactions and include market, quasi-market, and hierarchical modes of contracting. The
focus here is on the individual transaction and the question regarding organizational forms. It
is these institutional arrangements that govern the way in which its members cooperate and or
compete. Institutions in this case do not refer to organizations.

TRANSACTION COST THEORY AND COORDINATION MECHANISMS
34
Among the branches of the New Institutional Economics is New Economic History by North
among others, Public Choice and Political Economy by Buchanan and Tullock among others,
New Social Economics by Becker, Theory of Collective Action by Ostrom, Olson and
Hardin, Law Economics by Posner and Transaction Cost Economics by Coase, Williamson
and Furubotn. Transaction Cost Economics branch is also closely associated with social
capital by Putnan and Coleman, property rights literature by Alchain and Demsetz and
Economics of Information by Akerlof, Stigler and Stiglitz (Furubotn, 2005).
Among these branches of NIE, North’s New Economic History and Williamson’s Transaction
Cost Economics have received major prominence and the differences in the approaches of the
two are briefly discussed here briefly. North takes a macro level view of institutions and looks
at the role of institutional change in fostering overall economic growth and explaining the
divergence in the development of various countries, which tries to explain how economies
evolve over time. According to North, institutions that evolve to lower transaction costs are
the key to the performance of economies (North, 1990). He equates institutions in this case to
institutional environment, which Williamson distinguishes from Institutional arrangements.
North further posits that inefficient institutions can persist over time and this hinders
economic growth. The main catalysts for institutional change are changes in relative prices
caused by population changes and technological innovations. Both relative price changes and
technological changes will lead to changes in the rules of the game thereby introducing new
institutional arrangements in their transactions.
On the other hand, Williamson’s approach takes a different view of institutions and
transaction costs from a micro perspective. This study adopts Williamson’s definition and
approach to institutions and transaction costs by virtue of being micro rather than macro in
nature but operating within the institutional environment. However, the two approaches
(micro and macro approaches) to institutions are complementary.
3.3 Transaction Cost Economics: definition and approaches
Transaction cost economics is based on the hypothesis that institutions are transaction cost
minimizing arrangements, which may change and evolve with changes in the nature and
sources of transaction costs. Building on Coase (1937), Williamson (1975, 1985) uses the
Transaction Cost Economic Theory to explain the role of hierarchies as alternative
governance structures to the price system. He explains that while the market governance relies
on prices, competition and contracts to ensure that all parties to an exchange observe their
rights and responsibilities, hierarchical forms depend on a third party who may be called “the

TRANSACTION COST THEORY AND COORDINATION MECHANISMS
35
boss” to achieve the same intention. This approach is commonly referred to as Williamsonian
Transaction Cost Economics (TCE). The transaction is the unit of analysis. Transaction costs
cannot be directly measured but instead are estimated through proxies to bring out any
significant relationship between the proxy and the governance of interest. The prevalence of
coordination alternatives explain why firms exist in general and their behavior in the market
and the problems necessitating their use in transactions. Williamson (2005) further points out
that transaction cost economics is concerned with complex markets where there are small
numbers of parties on each side of the transaction, which goes beyond the simple market
exchanges. He refers to transaction cost economics as the science of contract and to
neoclassical economics as the science of choice.
Thus according to Williamson, a trade off exists between costs of coordination and
hierarchies within an organization and the costs of using contracts in the markets (Drugger,
1983; Makhura, 2001). This trade off depends on the magnitude of the transaction costs.
Transaction costs defined
Transaction costs are costs that arise when a good or service is transferred across a
technologically separable interface (Williamson, 1985). Transaction costs arise because of the
frictions involved in the exchange process. The exchange process involves transfer and
enforcement of property rights. Eggertson (1999) defines transaction costs as ‘the costs that
arise when individuals exchange ownership rights for economic assets and enforce their
exclusive rights’. Transaction cost theory identifies the causes of transaction costs as market
search and information costs, negotiating or bargaining costs (when prices are not
exogenously determined) and monitoring and enforcement costs (Coase, 1937; Williamson,
1975, 1981, 1985). Basically the costs arise because the parties must find each other,
communicate and exchange information, the goods and services must be described, inspected,
weighed and measured. Contracts must also be drawn up, title transferred and records kept.
These contracts may have to be enforced in cases of violation, which involve costs.
Information costs arise because the markets are not perfect as information is not freely
available. Information is costly as it requires time, efforts and money to acquire. Lack of
information increases search costs for the transacting partners (Williamson, 1975, 1989;
Hobbs, 1997; Douma and Schroeder, 1991). Resources are spent to acquire information on
potential contracting partners, the price and quality of the resources in which they have
property rights (Eggertson, 1999) which may be in terms of personal time, travel expenses
and communication costs.

TRANSACTION COST THEORY AND COORDINATION MECHANISMS
36
Monitoring of contractual partners is designed to make sure that they abide by the terms of the
contracts. Monitoring costs are related to the level of trust between the transacting partners.
Trust can be build over time or broken between transacting partners. When trust is adjudged
to be low, there will be a corresponding increase in monitoring costs. The higher the level of
monitoring required of partners, the higher the expected costs and consequently, the more
costly it is to transact among the partners (Barney and Hesterly, 1996).
Two further dimensions of transaction costs in the context of marketing agricultural produce
are presented by Jaffee and Morton (1995) in Makhura (2001):
• screening costs, which refer to the uncertainty about the reliability of potential
suppliers or buyers and the uncertainty about the actual quality of the goods
• transfer costs, which refer to the legal, extra legal or physical constraints on the
movement and transfer of goods. The dimension commonly includes handling
costs, storage costs, and transport costs among others.
Other approaches to defining transaction costs include Drabenstott (1995), who refer to
transaction costs as perceived risk, transportation, and administrative costs. Staal et al (1997),
and Delgado (1995) in Makhura (2001) classify transaction costs into observable and
unobservable or inhibitive transaction costs. The observable transaction costs include
marketing costs such as transport, handling, packaging, storage, spoilage among others and
are observable when a transaction takes place. Unobservable transaction costs include costs of
information search, bargaining, screening, monitoring, coordination, enforcement (Bardham,
1994 in Makhura, 2001), and product differentiation (Benham et al, 1998). Delgado (1997) in
Makura et al (2001) identifies these costs as costs of participating in the market process,
whether the market exists or not.
According to Hobbs (1997), transaction costs can be divided into information, negotiation
and monitoring costs. Information costs arise ex ante of an exchange and include the costs of
obtaining price and product information and the cost of identifying suitable transaction
partners. Negotiation costs are costs of physically carrying out the transaction. She presents
examples of negotiation costs to include costs such as are commission costs, costs of
physically negotiating the terms of exchange, and costs of drawing up formal contracts.
Monitoring or enforcement costs occur ex post of a transaction and are the costs of ensuring
that the terms of the transaction (quality standards and payment arrangements) are adhered to
by other transaction partners. Haddad and Zeller (1997) cited in Makhura (2001) equate
transaction costs with administrative costs of screening, delivery and monitoring of

TRANSACTION COST THEORY AND COORDINATION MECHANISMS
37
implementation of the program, which closely mirror Hobbs. Cuevas and Graham (1986) also
cited in Makhura (2001) classify them as explicit costs for the observable costs and implicit
costs for the unobservable costs.
Frank and Henderson (1992) identify transaction cost factors related to uncertainty, input
supplier concentration, asset specificity and internalization costs. For Zaibet and Dunn (1998),
transaction costs include high transport costs due to distances from market, poor or non
existent infrastructure, high marketing margins due to monopoly power and high costs of
searching for markets and monitoring contracts.
Other transaction costs in agricultural markets include bureaucratic costs and distortions in
managing, and coordinating integrated production, processing and marketing, the value of
time used to communicate with participating farms and to coordinate them, costs of incentives
employed to convince farmers to voluntarily participate in integrated production, costs
involved in establishing and monitoring long term contracts and the economies of scale
forgone when batch production replaces commodity production (Hayes et al in Makhura,
2001).
Information inefficiencies and institutional problems like absence of formal markets give rise
to transaction costs. The presence of transaction costs is often reflected by the difference, or
discrepancy, between perceived buying and selling prices (de Janvry et al, 1991). In such a
case, sellers experience low selling prices and will be discouraged to sell while buyers
experience high buying prices and will be discouraged from buying. This creates disutility in
the market and leads to market failures (Fafchamps and Minten, 2001).
A further delineation of transaction costs is by Key et al (2000) who distinguish transaction
costs into fixed and proportional transactional costs. Fixed transaction costs do not vary with
the amount of product sold but proportional transaction costs vary with quantity of product
bought or sold. In this study, transaction costs are defined and classified into three classes of
information and market search costs, monitoring, negotiation and, monitoring costs according
to Hobbs (1997) and North (1990).
3.4 Information economics and transaction costs
According to information economics, individuals act in an environment characterized with
incomplete information. Incomplete information can also arise because of the inability to
process all the information pertaining to a decision to be made due to bounded rationality.
Seminal works on information economics have found relevance in transaction cost

TRANSACTION COST THEORY AND COORDINATION MECHANISMS
38
economics. Stigler (1961) shows that searching for market information is not costless and that
may explain why there is sometimes divergence of prices between efficient markets and why
capital markets are imperfect. Arkelof’s (1970) work on the market for lemons explains how
quality guarantees, reputation, and trust are useful tools that ensure production of quality
goods and provision of information about the goods. Other important works have been
undertaken by Stiglitz (1998) on the role of imperfect information, adverse selection, and
moral hazard, on the performance of credit and labor markets, and the behavior of firms.
Information requirements determine the mix of coordination (between markets and
organizations) that can be used in transactions (Douma and Schreuder, 2002). Under perfect
competition, each individual is a price taker; they will have no influence individually on the
market price. The price conveys all the necessary information to market participants. The only
decisions that decision makers make is how much to sell given the prevailing prices. The
product is also assumed to be homogenous in nature. Thus in this case the price mechanism
will be adequate in coordinating the market.
When the price does not provide all the required information about a product (such as
quality), uncertainty sets in. In this situation, contingent contracts may be necessary to ensure
that the prices and quality of the products delivered are acceptable to both parties. However, it
would be impossible to cover all possible uncertainties occurring in future periods as there are
limits on how much the human mind is able to accommodate at any one time. It would also be
very expensive to arrive at such contracts as well as enforcing them. Alternative coordination
modes are therefore be necessary in such cases.
Information asymmetry
Symmetrical information occurs when the distribution of information across all agents before
a transaction takes place is the same. In such a case the information will have zero economic
value. Sometimes information may be available but is unevenly distributed. This results in
information asymmetry. The value of information can only be revealed to another party by
disclosing that information, while such disclosure destroys its value. This is the information
paradox (Douma and Schreuder, 2002). The paradox makes it difficult for those who have
information to make it available to others before getting something in return. Parties that need
the information are unwilling to pay for it before knowing the contents of what they are
buying. Information asymmetries may give rise to opportunistic behavior (strategic behavior).
All coordination modes require information, but the type of information requirements differ.

TRANSACTION COST THEORY AND COORDINATION MECHANISMS
39
Markets and prices are able to transmit certain types of information, but not all types of
information.
Hidden information
Hidden information (Douma and Schreuder, 1991, 2002; FitzRoy et al, 1998) leads to adverse
selection. In a transaction, one may end up with a set of business partners or clients in which
the high-risk part of the population is over-represented (lemons) (Akerlof, 1970). One partner
to a potential transaction is better informed about a relevant variable in the transaction, which
the other party does not have. The high risks have self-selected themselves in response to the
market offer. Ultimately, the costs of the offer will rise making it even more unattractive to
potential lower risk parties. Adverse selection is an ex ante information problem as the parties
concerned have no incentive to reveal this information truthfully as it will be harmful to them.
At certain levels of information asymmetry, no transaction may take place and this may lead
to complete market failures. The private information is unobservable to the other party to the
transaction and consequently introduces risk for the other party (Douma and Schreuder,
2002).
Hidden information can manifest itself in all coordination types. When private information is
present it can preclude transactions across markets as well as within organizations. Markets
and organizations offer different solutions to the information problem.
Hidden action
Moral hazard (or hidden action) is an information problem that can develop in both markets
and organizations (Douma and Schreuder, 1991; and FitzRoy et al, 1998). It refers to actions
(mostly, undesirable) which parties in a transaction take (or fail to take) after they have agreed
to execute the transaction (Spencer and Zeckhauser, 1971). Thus moral hazard is an ex post
phenomenon. One party to the transaction may have incentive to entertain actions that may be
harmful to the other party’s interest. Outputs or claims may be falsified, inputs and efforts
may also be misrepresented among other actions that may not easily be observed by the other
party to the transaction. The effect of hidden action is similar to private information above.
When potential transacting partners anticipate that hidden action is possible, the transaction
may not take place at all.
Information economics finds relevance in the agricultural field through the Imperfect Market
Theory. The theory explains the emergence of key agrarian institutions which are seen as
TRANSACTION COST THEORY AND COORDINATION MECHANISMS
40
substitutes for missing markets for credit or insurance in an environment of pervasive risk,
information asymmetry and high transaction costs. Such institutions play an important role in
the development of the agriculturally dependent economies. The kinds of governance
structures crafted to address information problems have an important role to play here.
3.5 Behavioral assumptions responsible for transaction costs
Two basic assumptions of bounded rationality and opportunism underlie the transaction cost
theory. The concepts of bounded rationality and opportunistic behavior are used by
Williamson to explain contractual choice and ownership structure of firms.
Bounded rationality
Bounded rationality means that those who engage in transactions are intently rational but
limited by their cognitive abilities. The inability to evaluate all the alternative courses of
action and to select the most optimal alternative as caused by bounded rationality means that
the participants cannot specify all the contingencies to their contracts. Bounded rationality
therefore refers to human behavior which is ‘intendedly rational but limitedly so’ (Simon,
1961 in Douma and Schreuder, 2002). The presence of complex and uncertain environments
make bounded rationality a problem in transactions. For complex transactions and in
uncertain environments, it becomes difficult or costly to write up a contract incorporating all
contingencies to the transactions. A contingent contract encompassing all possible future
scenarios would require enormous amounts of information that would be beyond an
individual’s processing ability. The result of incomplete contracts is uncertainty because the
economic players cannot foresee all the possible outcomes or formulate other responses to the
unforeseeable eventualities. Sufficient information reduces uncertainty (Williamson, 1975,
1981; Barney and Hesterly, 1996; Douma and Schreuder, 1991, 2002). These observations
have also been made by Zuurbier & Bremmers (1997) and additionally, for frequency by
Macbeth and Ferguson (1994), Douma and Schreuder (1991) and, Buvik and John (2000).
Williamson (2005) further avers that all complex contracts are unavoidably incomplete
because of bounded rationality.
Opportunism
Williamson observes that human beings are not only boundedly rational but they also display
opportunistic behavior. Opportunism means that economic players ‘display self-interest
seeking with guile’ and as making ‘self disbelieved statements’. Opportunism arises when

TRANSACTION COST THEORY AND COORDINATION MECHANISMS
41
there is incomplete or distorted disclosure of information, especially calculated to mislead,
distort, disguise, obfuscate or otherwise confuse partners in an exchange. Some actors
sometimes behave opportunistically and it is costly or impossible to distinguish between
genuine and those likely to behave opportunistically before the transaction takes place
(Douma and Schreuder, 2002). Williamson furthermore states that even those who behave
opportunistically need not do so all the time. Opportunistic behavior can occur ex ante or ex
post. Ex ante opportunistic behavior leads to adverse selection as in hidden action. Ex ante
opportunistic behavior can occur only when there is asymmetric information: the seller has
information that buyers do not have. Such opportunistic behavior may manifest itself as moral
hazard, cheating, shirking, and other forms of strategic behavior. Shirking takes place if
benefits exceed costs, that is, when the rewards or benefits are not perfectly correlated with
productive efforts such that the incentive to produce or to apply more effort is diminished
(Alchian and Demsetz, 1972). If shirking can be easily detected at zero costs, neither party to
the transaction would shirk, since the other party would renegotiate the contracts and pass
over the costs to the shirking party. However, if it is costly to monitor efforts of the
transacting partners, the shirking party may not bear the full cost of their shirking behavior. In
this case, the marginal cost of monitoring will be higher than the marginal gains from
detecting shirking. This means that when monitoring the behavior of transacting partners is
less than perfect, the incentives to shirk will remain. The costs of monitoring will increase
with increase in the number of violations of the contractual terms.
Opportunism becomes a problem when there is small numbers exchange situation, that is, a
situation where there is a small number of transaction partners. When there many sellers or
buyers, opportunism is reduced due to the importance of reputations among the sellers or
buyers. When there are very few sellers or buyers, the concern over reputations rises and this
is likely to raise costs of verifying the reputations before transacting.
Transacting parties use governance structures that take into consideration bounded rationality,
opportunism and costs involved in the exchange. The mode of governance of a transaction is
determined by minimization of the sum of transaction and production costs. Douma and
Schreuder (2002) in addition remark that the atmosphere of a transaction also determines the
governance mode of a transaction besides the transaction costs. The atmosphere in this case
refers to the value attached to one mode of coordination, which despite having higher
transaction costs may still be the preferred mode of governance. In this case, the benefits
derived from the particular governance mode translate into higher utility which goes beyond
TRANSACTION COST THEORY AND COORDINATION MECHANISMS
42
monetary returns or costs. The atmosphere also captures other influences on coordination
mechanisms besides transaction costs.
3.6 Dimensions of transaction costs and coordination continuum
Asset specificity, frequency of transactions and, uncertainty and complexity of transactions
have been hypothesized to influence the kind of governance structures adopted by transaction
partners (Williamson 1985; Joskow, 1985, 1987). The relative influence of these factors
differs according to the kinds and nature of products, sectors, or economies among others.
Asset specificity
Williamson (1985) defines asset specificity in relation to the ease with which it can be
redeployed to alternative use without sacrificing productive value. The level of transaction
specific investment determines the type of governance structure chosen. The investments may
range from modification of the physical technology, operating policies and procedures or
learning special language, styles and business practices of their partners to expedite the
transaction and also the location of the enterprises. Despite the fact that investing in
specialized production facilities has been known to increase productivity (Dyer, 1997; Douma
and Schreuder, 1991), the investments have value in so far as they are applicable to only one
partner or one transaction and not elsewhere. The bargaining positions of transacting partners,
ex ante and ex post will be determined by the idiosyncratic investments made or likely to be
made by each of them. The partner that has made specific investments in the transaction is
vulnerable to ex post contractual opportunistic behavior by the other party in attempting to
appropriate quasi rents of the specialized assets (Klein, Crawford and Alchian, 1978). This is
a typical ‘hold up’ problem (Williamson, 1991). Thus it is important to determine the
importance asset specificity has on the mode of governance that is employed by the
transacting partners.
One remedy to the hold up problem is vertical integration by one of the parties that is most
vulnerable. Other possible remedies include explicit agreements, or use of several governance
structures. Transaction cost economics holds that parties tend to choose the governance
structures that best control the underinvestment problem, given the particulars of the
relationship (Klein, 1999).
Figure 3.1 below shows the trade-offs between asset specificity, transaction costs and
coordination mechanisms. k1 and k2 are two levels of asset specific investments indicating
low and high levels of asset specificities respectively. Below k1 parties to transactions have

TRANSACTION COST THEORY AND COORDINATION MECHANISMS
43
invested lower amounts in transaction specific assets. The risk of their partners behaving
opportunistically or holding them hostage in the transactions is low, consequently the
perceived level of transaction costs faced by the parties are relatively low. Spot market (open
markets) contracts are therefore adequate in coordinating transactions between the parties as
the need to safeguard the assets is low. However, as the partners increase the amount of
investments necessary for their transactions from k1 to k2, the need to protect the investments
from being taken advantage of by the transaction partners rises. But since the level of asset
specificity is moderate, the levels of perceived transaction costs are also relatively moderate
and consequently simple contracts and informal agreements may be adequate to safeguard
their investments. The range of possible safeguards between k1 and k2 is large and these are
generally referred to as hybrid coordination modes and include verbal contracts, written
contracts, partnerships, share exchange, strategic alliances among others. Beyond k2 the level
of asset specificity rises tremendously and the perceived level of transaction costs escalate.
Hybrid based coordination mechanisms are not adequate to safeguard the investments from
opportunistic tendencies in the market. As a result, the parties concerned are likely to
withdraw from the market and bring the transactions in-house by carrying out self production,
acquiring the relevant partners or merging with them. This leads to formation of integrated, or
diversified or conglomerate firms referred to as hierarchies in order to minimize exposure to
high transaction costs in the market. In such cases, the costs of internal organization are
perceived to be lower than the costs of market organization.
Figure 3.1 Transaction costs as a function of asset specificity
Source: Williamson (2005:49)
Tra
nsaction c
osts
Asset specificity, k
Hierarchies Hybrids Markets
k1 k2

TRANSACTION COST THEORY AND COORDINATION MECHANISMS
44
Frequency and volume of transactions
Another factor determining whether exchange relationships are carried out in-house or in the
spot markets is the frequency with which transactions are carried out (Douma and Schreuder
1991; Macbeth and Ferguson, 1994). When the frequency of transactions is high it is expected
that transaction will be carried out within organizations rather than across markets. To set up
specialized governance structures involves certain fixed costs and the need for safeguards
against post contractual opportunistic behavior will be influenced by the frequency of the
transactions. Whether the volume of transactions conducted through such specialized
governance structure utilizes it to capacity is the remaining issue. A higher probability of
repeated exchanges lowers the expected transaction costs per unit of exchange (Dyer, 1997).
Without specific investments, spot market contracts will normally suffice, irrespective of
frequency of transactions. At the other end, highly specific investments will require the use of
hierarchies to govern the transactions, whether transactions are carried out frequently or not.
For moderate levels of investments, hybrid governance mechanisms may be adopted such as
contracting, whether formal or informal. Klein (1985) points to a self-enforcing contract
encompassing an implicit enforcement mechanism that prevents strategic hold-ups. When
transactions are carried out with a high frequency, contract performance can be implicitly
enforced if the transacting party facing termination expects to earn a future ‘quasi-rent stream’
which is greater than the immediate short-term gain from breaching the contract.
Uncertainty and complexity
Douma and Schreuder (1991, 2002) indicate that uncertainty when combined with complexity
of the transaction causes many exchange relationships to be brought in-house. For complex,
high technology exchanges there will be more uncertainty surrounding it compared to
uncertain but simple transactions.
Without uncertainty, transactions would be predictable and ex ante. Uncertainty comprises
unforeseen, exogenous disturbances as well as behavioral uncertainty. The former refers to
changing market conditions, while the latter arises either from lack of communication or from
strategic opportunistic behavior (Williamson, 1985). Increases in uncertainty makes it
impossible to write out full contingent contracts, therefore it is not possible to spell out the
full rights and obligations of the transacting parties (Joskow, 1985, 1987).
Together with asset specificity, behavioral uncertainties affect the efficiency of governance
structures. The most susceptible governance structures are the hybrid forms due to their
typical contractual relationships (Williamson, 1996). Hybrids are more susceptible to

TRANSACTION COST THEORY AND COORDINATION MECHANISMS
45
uncertainties because they do not normally contain adequate safeguards to withstand uncertain
changes in the transaction environment even with moderate levels of asset specificity. In
hybrids, the transacting parties remain independent and the cost of coordinating their activities
including information flows, monitoring opportunistic tendencies (rent seeking) coupled with
inability to enforce such contracts easily lead to a breakdown in the contractual arrangement.
This leads to a shift in the transaction function of the hybrid mode as shown in figure 3.2
below. It becomes difficult to build new contractual arrangements. A consequence of the shift
in transaction costs associated with the hybrid coordination modes is that more transactions
will move to the open markets and or to hierarchies leading to reduced efficiencies in the
market due to institutional breakdowns. Some transaction parties may not recover to
effectively participate in the market. The effects of uncertainty, frequency and asset
specificity on the coordination mechanisms have useful implications for the performance of
the transactions and the economies concerned.
Figure 3.2: Governance structure shift due to uncertainty
Source: Williamson (1991:140)
A continuum of coordination mechanisms
Inter-organizational coordination refers to how well the transacting members perform in
accordance with their roles in the system (Cheung, 1983 cited in Hernandez-Espallardo and
Arcas-Lario, 2003). It is the extent to which the work activities of the parties are logically
Tra
nsac
tion
cos
ts
K1 k2 Asset specificity k
Markets
Hybrids shift due to uncertainty
Hybrids Hierarchies
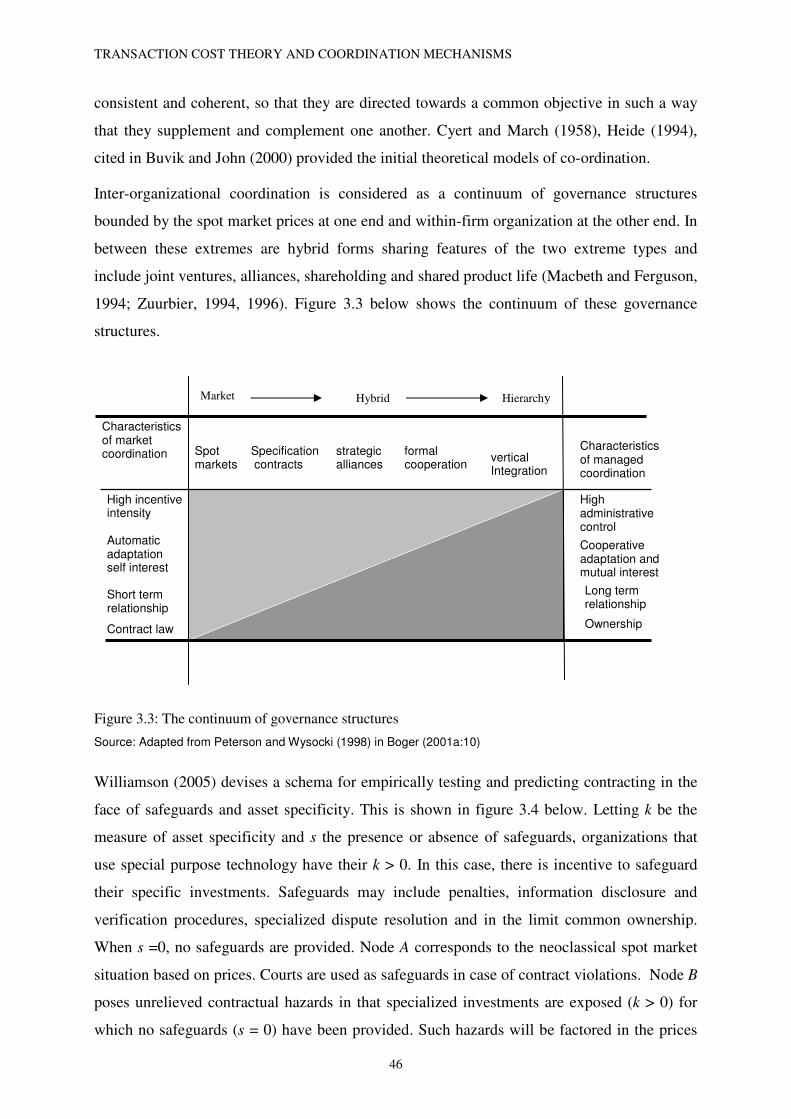
TRANSACTION COST THEORY AND COORDINATION MECHANISMS
46
consistent and coherent, so that they are directed towards a common objective in such a way
that they supplement and complement one another. Cyert and March (1958), Heide (1994),
cited in Buvik and John (2000) provided the initial theoretical models of co-ordination.
Inter-organizational coordination is considered as a continuum of governance structures
bounded by the spot market prices at one end and within-firm organization at the other end. In
between these extremes are hybrid forms sharing features of the two extreme types and
include joint ventures, alliances, shareholding and shared product life (Macbeth and Ferguson,
1994; Zuurbier, 1994, 1996). Figure 3.3 below shows the continuum of these governance
structures.
Figure 3.3: The continuum of governance structures
Source: Adapted from Peterson and Wysocki (1998) in Boger (2001a:10)
Williamson (2005) devises a schema for empirically testing and predicting contracting in the
face of safeguards and asset specificity. This is shown in figure 3.4 below. Letting k be the
measure of asset specificity and s the presence or absence of safeguards, organizations that
use special purpose technology have their k > 0. In this case, there is incentive to safeguard
their specific investments. Safeguards may include penalties, information disclosure and
verification procedures, specialized dispute resolution and in the limit common ownership.
When s =0, no safeguards are provided. Node A corresponds to the neoclassical spot market
situation based on prices. Courts are used as safeguards in case of contract violations. Node B
poses unrelieved contractual hazards in that specialized investments are exposed (k > 0) for
which no safeguards (s = 0) have been provided. Such hazards will be factored in the prices
Spot markets
Specification contracts
strategic alliances
formal cooperation
vertical Integration
Characteristics of managed coordination
High administrative control
Cooperative adaptation and mutual interest
Long term relationship
Ownership
Characteristics of market coordination
High incentive intensity
Automatic adaptation self interest
Short term relationship
Contract law
Market Hybrid Hierarchy

TRANSACTION COST THEORY AND COORDINATION MECHANISMS
47
offered to take care of the implied contractual breakdown. Nodes C and D have added
contractual safeguards. Transactions will be transferred from C to D if there are continued
contractual breakdowns. Prices bid at C are expected to be lower than at B, which includes the
contractual hazard premium. But transactions need not necessarily end at node D. Other cost
effective safeguards like reputation or credibility can be used to achieve the same end.
Macbeth and Ferguson (1994) have also related the coordination mechanisms to transaction
costs, indicating that transaction costs vary on the coordination continuum.
Figure 3.4: Simple contracting schema
Source: Williamson (2005:50)
Coordination has become critical because of the structural changes that emerge in the business
environment from time to time such as low or no market growth, greater and more
international competition, more choice and enhanced value, improved food safety and
legislation and consumer concerns about various environmental issues. Collaborating
(partnering) is a strategic option for achieving and meeting these requirements (Downy,
1996). Buvik and John (2000) note that greater vertical co-ordination of action between
buyers and sellers will create additional economic value through interaction that takes into
account the traditional partner’s requirements and circumstances. They also note that
complete contracts are increasingly difficult to write and that such contracts lock the parties in
positions that might otherwise be revised profitably. Incomplete contracts can only work
k=0
s=0
k>0
s>0
D (Hierarchy)
C (Credible contracting)
B (Unrelieved hazard)
A (Unassisted market)

TRANSACTION COST THEORY AND COORDINATION MECHANISMS
48
within supportive governance structures, such as vertical co-ordination, that have higher
chances of reducing ex-post transaction costs (Douma and Schreuder, 1991).
One way of cooperating is through collusion where the parties agree in some way to cooperate
in the market association as a group. The incentives to collude are mostly to gain economic
profits by restricting outputs or by raising prices or both. The incentives to cheat by each
member of the cartel are equally high. Bertrand (1833) and Cournot (1897) cited in Barney
and Hesterly (1996) have illustrated examples of this cheating and the inherent opportunistic
behavior. Given the strong incentive to cheat, effective collusion requires a very strong
monitoring system. Monitoring however is difficult granted the dispersion of the members-
the producers and customers (Stijnen et al, 1998).
However, cheating is not limited to cartels only. Explicit governance structures, which are
used to manage cheating problems, also face more or less the same problems. Besides the
explicit governance structures, trust between parties to a transaction can be used to manage
cheating. According to Downy and Cannon cited in Masuku and Kirsten (2004), trust exists if
one party believes the other party is honest or benevolent. Over time, the partners realize that
they can be trusted not to behave opportunistically. Thus trust can be used as a low cost
substitute for costly governance structures (Barney & Hesterly, 1996; Mentzer et al, 2001).
Beers et al (1996) recognize the importance of collaboration in agricultural product chains
with regard to quality, delivery time, assortment and product life cycle of products. They
further note that a basic aspect of collaboration between organizations is the exchange of
information associated with receiving, processing and delivery of materials and products.
Porter (1985) argues that the use of information technology may bestow competitive
advantage to those companies involved with regard to new forms of relationships with
customers, new product characteristics, quality and delivery time of the product and services.
Specifically information tries to bridge the uncertainties in goods flow and quality of products
in agriculture (Trienekens, 1993 cited in Beers et al 1996; Downy, 1996).
Frohlich and Westbrook (2001) in their study cited in de Treville and Hameri (2002)
demonstrated that higher supply chain performance resulted when a firm combined with both
an upstream and downstream partner, than either with an upstream or downstream partner.
But one-sided integration was found to be better than none at all. Higher levels of integration
brought about higher levels of performance (also observed by Gimenez and Ventura (2003).
The success of a supply chain management strategy is dependent on the relations among the
supply chain partners, which further depends on the costs involved, real or perceived. The

TRANSACTION COST THEORY AND COORDINATION MECHANISMS
49
relations between the supply chain partners are determined by the level of transaction costs
between them.
3.7 Institutions, transaction costs and coordination performance in
developing markets
Developing markets face many barriers in their attempts to commercialize their agricultural
activities. They face informational barriers and may not easily venture into distant markets for
fear of opportunistic tendencies from potential trading partners. Institutions that are supposed
to support the markets are poorly developed, missing or ineffective. Thus market
arrangements and market support institutions that are common in developed markets may not
be available. But limited transactions still take place under these conditions in these
economies.
Kydd and Doward (2003) show that disappointing performance of market liberalization
policies in promoting agricultural performance in sub-Saharan Africa result from weaknesses
in the neoclassical theory on which liberalization policies are based. After independence, most
countries in Africa used state intervention to support agriculture at the expense of the private
sector. State corporations were established to support the introduction and spread of more
intensive production methods for the smallholder farmers and to develop rural areas. State
intervention offered a means of providing a coordination mechanism across trading,
infrastructural, research and extension investments and activities through financing,
coordinating farmers, reducing systemic investment risks and investing in organizational and
human resource development necessary to develop working systems.
The state parastatals were not successful and as a result the 1980s saw pressure from donor
countries to reform them and involve the private sector in the economic system. The
parastatals were not profit driven, were prone to political interferences, and were a
discouragement to private participation in the economies. Thus liberalization efforts set in
based on the neoclassical theory of competitive markets. The urge to open up the markets was
given impetus by the World Bank and the International Monetary Fund (IMF) that based their
mission on neoclassical competitive market solutions to the markets.
Actions to promote more efficient and less distorted operation of agricultural markets, with
privatization of agricultural marketing organizations (de-linking credit, input and output
markets), deregulation of these markets and elimination of credit, input and output subsidies
TRANSACTION COST THEORY AND COORDINATION MECHANISMS
50
were undertaken. These changes are among what Williamson (1996) refers to as changes in
the institutional environment.
Using figures from the World Bank and FAO, Kydd and Doward (2003) show that there has
been low or negative per capita growth in agriculture in much of Sub Saharan Africa over the
last 30 years which manifests itself in high incidences of rural poverty compared to other
regions in the world. Arguments have been presented as to whether pre-liberalization situation
should have been sustained despite not having delivered substantial improvements in
agriculture as they were expected to, that is, to reduce rural poverty and increase food
security.
Various reasons have been presented for the lack of success in liberalization, ranging from
lack of sufficiently thorough liberalization (partial liberalization) to weak institutions –
cultural, political, and legal factors, which undermine clear property rights consequently the
investment incentives. A third explanation for liberalization’s lack of success is the lack of a
proper liberalization agenda. All these find relevance in developing agricultural markets in
Africa.
Major problems facing rural areas have been indicated as poor roads and communication, lack
of a well developed monetary system, business environment characterized by weak
information, difficult and weak contract enforcement mechanisms, high risks and high
transaction costs, which Kydd and Doward define as the costs of protecting oneself against
risks of transaction failure by searching for and screening potential contracting parties and
their goods and services, then negotiating and contracting with them, and monitoring their
adherence to the contract.
Among the major risks facing agriculture in the rural areas is the transaction risk, which can
be divided into two: coordination risks and risks of opportunism (Kydd and Doward, 2003).
They define coordination as efforts or measures designed to make players within a system act
in a common or complimentary way towards a common goal (Poultron, 2003 in Kydd and
Doward, 2003). Economic coordination failure can thus be defined from two different but
complementary perspectives: in terms of its direct effects on individual investors, it is the
failure to make investment due to possible absence of complementary investments by other
players at different stages in the supply chain. In terms of wider processes, and economic
impacts, economic coordination failure occurs ‘‘where individuals’ failure to coordinate
complementary changes in their actions leads to a state of affairs for everyone that is worse
than some alternative state of affairs that is also an equilibrium’’ (Hoff, 2000 in Kydd and

TRANSACTION COST THEORY AND COORDINATION MECHANISMS
51
Doward, 2003). Examples of failures to coordinate include having undue share of revenues in
the supply chain, or delivering sub-standard products. Examples of opportunism include loan
default by farmers, low product prices offered by traders at harvest time (when farmers are
desperate for cash), or in remote areas (where farmers have no other sales outlets), sale of
poor or adulterated products and, use of false weights. All these depress investments in the
economic activity.
Low level equilibriums result from low or depressed investments, thin markets, coordination
failure and weak institutions (for coordination and contract enforcement). This leads to low
equilibrium traps or vicious cycles. Three different approaches are used to explain the
problem of coordination failure or low equilibrium trap based on NIE.
According to North, institutional change is considered as an evolutionary process where
powerful groups respond to changes in relative prices, technologies and transaction costs by
modifying institutions in ways that they perceive to be in their interests. These changes may
stimulate very different types of institutional changes promoting, in broad terms, pro
development form (structuring transactions to create and promote trade and investments) or
an ‘anti-development’ form (structuring transactions to create rents and, in the process,
creating the possibility of a low level equilibrium trap). There is a strong dependence in these
processes as initial conditions play an important role in determining the relative perceptions
and power of different groups, and the institutional and technological options that they face.
Williamson on the other hand takes a micro-economic approach to analyze the way that
agents, in the context of their institutional environment, structure their institutional
arrangements, and this then influences the organization of the economy with regards to
choices to use firms, markets and relational contracts or hierarchical, market and hybrid
contractual forms for exchange and coordination. The key insights relevant here are the
influences on contractual form and transaction failure of asset specificity, risk exposure,
frequency of contracts, the nature of goods and services exchanged, the institutional
environment, and human propensity for opportunism. This can be applied to rural markets
following the realization that asset specificity is the result of thin markets in developing
economies. Complementary investments are difficult to make except perhaps when a
monopolist is involved such that the monopolist ends up capturing an unfair share of the
revenues. Williamson calls for non standard contractual forms in cases of high asset
specificity which is also applicable to developing poor rural markets such as share cropping,
interlocked markets and local monopolies. These may be the most efficient contractual forms

TRANSACTION COST THEORY AND COORDINATION MECHANISMS
52
given the circumstances prevailing at the time and can ensure that transaction costs and risks
are minimized and that the supply chain does not fail completely.
The other institutional economics approach is found in Hall and Soskice (2001) cited in Kydd
and Doward (2003) in their examination of ‘varieties of capitalism’ in Organization for
Economic Co-operation and Development (OECD) economies. They propose two types of
national economy, at poles of a spectrum. Liberal market economies or LMEs, where
activities are coordinated via intra-firm hierarchies, competitive market arrangements and
vertical hybrid arrangements between firms in a supply chain, and coordinated marketed
economies or CMEs, where there is more use of ‘non market relations to coordinate
endeavors and to construct core competencies’ with more extensive information within
networks. CMEs draw on a further set of organizations and institutions, supporting more
horizontal or networked strategic interaction, both across and within supply chains.
LMEs are associated with radical innovations while CMEs are linked to continuous technical
innovations. The role of the state is higher in CMEs as they take deliberative and coordination
processes that promote and enforce coordinated action and shared understandings of goals and
distributive outcomes of such action. The CME approach may be more appropriate for poor
countries facing serious weaknesses in the institutional environment that need continuous
technical innovation and have serious coordination failures.
Kydd and Doward propose a formal model of low equilibrium traps and coordination failure
that demonstrates a mechanism by which coordination failure may lead to under development
traps and also highlights key variables determining the movement of an economy to low or
high level equilibriums. This is shown in figure 3.5 below.
Figure 3.5 shows the relationship between the actors’ costs and returns and the volume of
investments in a supply chain. It is assumed that all actors face a two stage investment
problem, in which they must make stage 1 investments in assets specific to a particular
activity in the supply chain in order to reap net revenues in stage 2. Their revenues in stage 2
are however determined not only by the scale of their own stage 1 investments, but also by the
scale of others’ stage 1 investments. This relationship with others is thus a result of potential
coordination failure (limited stage 1 investment by others may mean that there is not
sufficient supply or demand of complementary products or services to support full utilization
of the capacity generated by the actors’ stage 1 investments) and of opportunism by other
agents who, in a thin market, may be able to capture undue share of the surplus generated in
the supply chain.

TRANSACTION COST THEORY AND COORDINATION MECHANISMS
53
Figure 3.5 also shows that increasing total supply chain investments lead to increasing and
then decreasing returns in net revenues assuming no loss of coordination failure or
opportunism. However, there is a threshold level of total supply chain investment (I*) below
which individual actors in that supply chain incur losses and above which they reap profits.
Below the threshold, no actor has incentive to invest leading to a low level equilibrium trap.
Above the threshold, we may expect the dynamics of competition and technical and
institutional innovations to further lower costs with time with continuing increases in
investment.
Figure 3.5: High and low level equilibriums with coordination and opportunism risk
Source. Kydd and Doward (2003:19)
Following the CME logic, coordination cannot be achieved by the market mechanism alone.
Non market mechanisms referred to by Kydd and Doward (2003) as local and extensive
coordinations are also necessary. Vertical integration (e.g. for large scale commercial farms)
and local relations linking various local agents interested in investing in different activities in
the supply chain through farmer groups or powerful traders can be employed. However, this
coordination needs support probably from the state to keep it on the growth path so that it
does not become too slow and fragile.
I*
Cost of transaction enforcement and opportunism risk
Coordination costs and risks
loss
Profit (loss)
Growth equilibrium
Total supply chain investments ($)
Costs & returns (in $ invested)
Low level equilibrium?
Enforcement & coordination failure
0
Expected revenue net of transformation costs and risks
Spillover effects
TRANSACTION COST THEORY AND COORDINATION MECHANISMS
54
An alternative to local endogenous coordination is externally assisted ‘soft’ coordination
processes (state or NGO assisted) or the more extensive ‘hard’ coordination where some
strong central coordinating body with a mandate from the state ensures investments across the
supply chain with highly credible coordinated commitments. However, the history of such
bodies (e.g. parastatals) does not make this option appealing.
Total supply chain investments threshold can be lowered to make it attractive to potential
participants by lowering coordination costs and risks, by lowering transaction enforcement
costs and opportunism risks, and by raising expected returns net of transformation costs and
risks. Most important is to lower stage 1 costs.
Williamson (1996) presents a framework for linking governance structures, individuals and
the institutional environment (figure 3.6 below). In it, he identifies the institutional
environment as the overreaching wider or general environment in which individuals and
governance structures interact. According to Menard (1995), the institutional environment
provides the rules of the game and includes contract laws, norms, customs and standards
which are capable of inducing a shift in the relative costs of transaction costs in different
governance structures, thereby leading to a change in the governance structures. The
institutional environment is visualized to operate at higher levels than governance structures,
for example at the national or macro level rather than at the enterprise or micro level.
Governance structures, though they may be changed by changes in the institutional
environment, have a life of their own (arrowed circle) and this is determined by transaction
costs (Williamson 1996; Boger, 2001a). The governance structures have a feedback to both
the individuals and the institutional environment. An example of a feedback is change of
contractual law in response to new product developments.
The individual in the diagram refers to the behavioral assumptions of bounded rationality and
opportunism. The attributes of individuals influence the costs of transactions and the relative
advantages of governance structures. Behavior is further influenced by the institutional
environment: the rules and norms developed, for instance, determine the level of trust in a
society (Boger, 2001a).
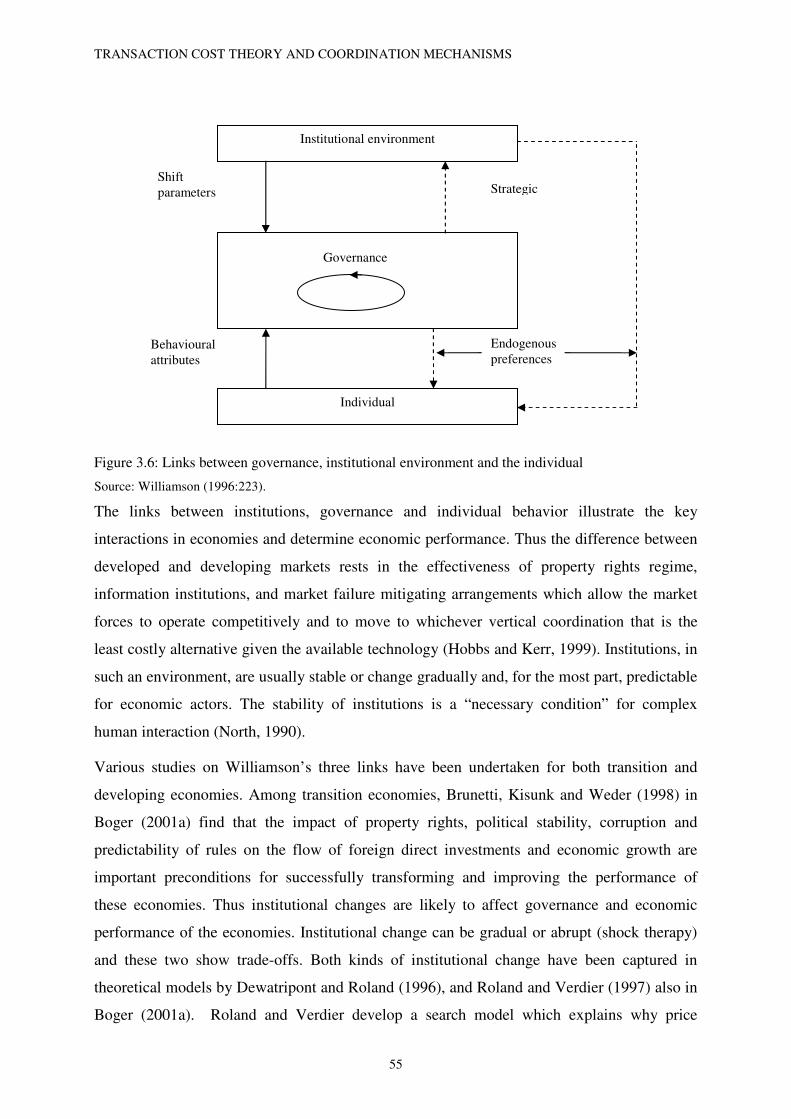
TRANSACTION COST THEORY AND COORDINATION MECHANISMS
55
Figure 3.6: Links between governance, institutional environment and the individual
Source: Williamson (1996:223).
The links between institutions, governance and individual behavior illustrate the key
interactions in economies and determine economic performance. Thus the difference between
developed and developing markets rests in the effectiveness of property rights regime,
information institutions, and market failure mitigating arrangements which allow the market
forces to operate competitively and to move to whichever vertical coordination that is the
least costly alternative given the available technology (Hobbs and Kerr, 1999). Institutions, in
such an environment, are usually stable or change gradually and, for the most part, predictable
for economic actors. The stability of institutions is a “necessary condition” for complex
human interaction (North, 1990).
Various studies on Williamson’s three links have been undertaken for both transition and
developing economies. Among transition economies, Brunetti, Kisunk and Weder (1998) in
Boger (2001a) find that the impact of property rights, political stability, corruption and
predictability of rules on the flow of foreign direct investments and economic growth are
important preconditions for successfully transforming and improving the performance of
these economies. Thus institutional changes are likely to affect governance and economic
performance of the economies. Institutional change can be gradual or abrupt (shock therapy)
and these two show trade-offs. Both kinds of institutional change have been captured in
theoretical models by Dewatripont and Roland (1996), and Roland and Verdier (1997) also in
Boger (2001a). Roland and Verdier develop a search model which explains why price
Institutional environment
Individual
Governance
Shift parameters Strategic
Behavioural attributes
Endogenous preferences

TRANSACTION COST THEORY AND COORDINATION MECHANISMS
56
liberalization has been associated with an output fall in transition economies. The key factors
leading to output decline in the model are search frictions in exchange and transaction specific
investments. Asset specificity gains a new dimension in transition: due to substantial
liberalization, disruption of previous production links and depreciation of the capital stock,
searching for new business partners is usually laborious. New investments are made only after
a new long term partner has been found.
The disorganization of production links after the breakdown of state managed institutions had
severe impacts on output decline in such countries. Before liberalization, the state institutions
provided instruments for avoiding adverse effects of specificity (hold ups). There arose a
vacuum of formal institutions such that the lowered specificity in firms’ relations opened
room for bargaining due to asymmetric information and incomplete contracts. The consequent
of the disorganization is that transaction costs increase as enterprises seek new customers and
suppliers. The combination of the freedom to contract with imperfect information causes a
breakdown of business relationships and a decline in production. Under such conditions, the
question arises of how firms should reorganize (Boger, 2001a).
A theoretical framework for reorganizing of firms in less developed and transition economies
has been provided by Beckmann (1999, 2000), cited in Boger (2001a). He uses the basic links
between asset specificity and governance structures in TCE to model a socialist style of
economy (figure 3.7 below). It is assumed that only hierarchical modes of organization exist
(fat line in the figure). Such organizations suffering from bureaucratic burden and high
transaction costs are economically justified only if asset specificity and or uncertainty are
substantial. The fundamental institutional changes in transition remove the constraint of
keeping transactions in hierarchical structures and bring the freedom to contract. With
privatization and restructuring of state owned firms, one would expect a change in governance
structure for transactions with a low and medium degree of asset specificity (vertical solid
arrows). However, the assumption that transition leaves asset specificity untouched may not
hold. Decapitalization or abrupt interruption in business links (Blanchard and Kremer 1997
cited in Boger, 2001a) can incur substantial sunk costs and reduce specificity (dejected arrow
lines). Furthermore, specific relations in vertical coordination between firms will decline if
liberalization leads to open markets and entry of new firms. Finally uncertainties due to major
institutional changes negatively affect transaction costs of susceptible hybrid modes. The
hybrid modes may either disappear or not evolve with the result that the spot market solution
may dominate in early transition.
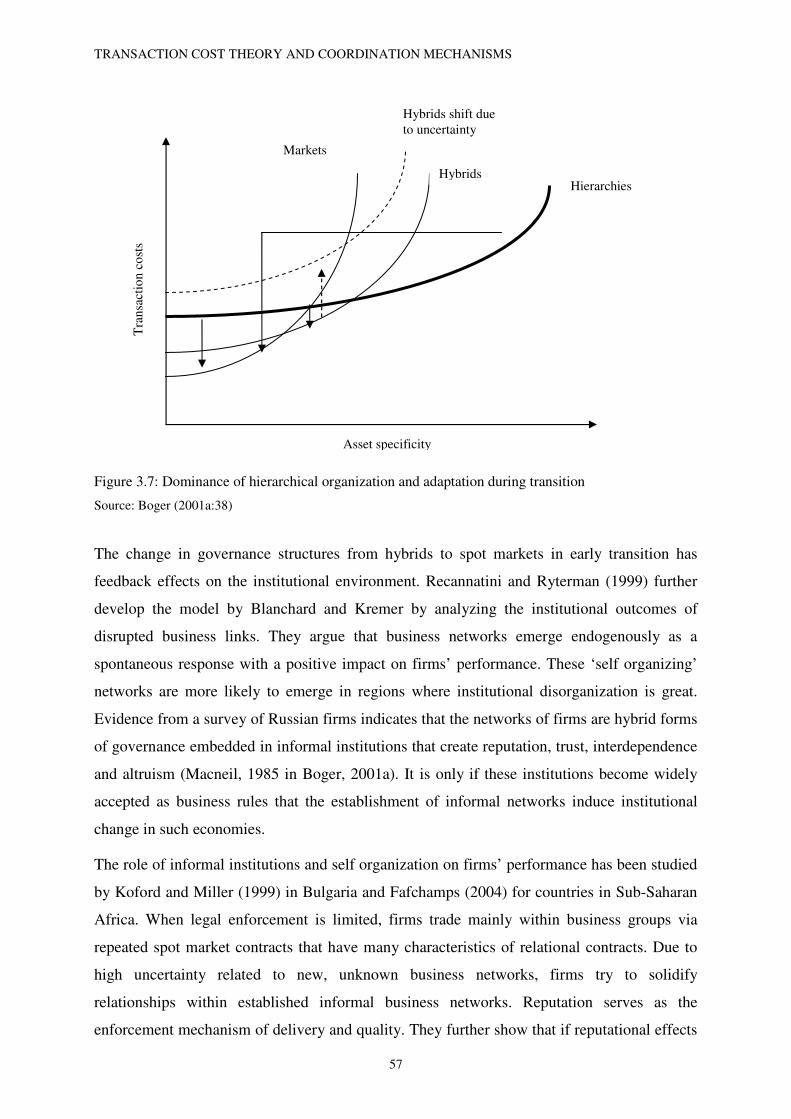
TRANSACTION COST THEORY AND COORDINATION MECHANISMS
57
Figure 3.7: Dominance of hierarchical organization and adaptation during transition
Source: Boger (2001a:38)
The change in governance structures from hybrids to spot markets in early transition has
feedback effects on the institutional environment. Recannatini and Ryterman (1999) further
develop the model by Blanchard and Kremer by analyzing the institutional outcomes of
disrupted business links. They argue that business networks emerge endogenously as a
spontaneous response with a positive impact on firms’ performance. These ‘self organizing’
networks are more likely to emerge in regions where institutional disorganization is great.
Evidence from a survey of Russian firms indicates that the networks of firms are hybrid forms
of governance embedded in informal institutions that create reputation, trust, interdependence
and altruism (Macneil, 1985 in Boger, 2001a). It is only if these institutions become widely
accepted as business rules that the establishment of informal networks induce institutional
change in such economies.
The role of informal institutions and self organization on firms’ performance has been studied
by Koford and Miller (1999) in Bulgaria and Fafchamps (2004) for countries in Sub-Saharan
Africa. When legal enforcement is limited, firms trade mainly within business groups via
repeated spot market contracts that have many characteristics of relational contracts. Due to
high uncertainty related to new, unknown business networks, firms try to solidify
relationships within established informal business networks. Reputation serves as the
enforcement mechanism of delivery and quality. They further show that if reputational effects
Tra
nsac
tion
cos
ts
Asset specificity
Markets
Hybrids shift due to uncertainty
Hybrids Hierarchies

TRANSACTION COST THEORY AND COORDINATION MECHANISMS
58
are limited to groups, it may have important implications on market entry and competition.
Private ordering via informal institutions might mitigate opportunistic behavior within the
business groups but it lowers competition and provides fertile ground for market power.
Furthermore, poorly developed formal market institutions such as contract laws and courts
force firms to engage in lengthy and costly trust building processes leading to high transaction
costs compared to a situation in which enforcement institutions function well (Hobbs and
Kerr, 1999).
Empirical evidence from private firms in Eastern Europe show that courts and relational
contracts within a network are substitutes for enforcing contractual obligations (Johnson et al,
1999). Thus the impact of institutional development is two fold: first the role of courts will
increase over time as legal systems become more workable and as decreasing costs of
searching for alternative partners deteriorate stability in networks. Second, an increasing
importance of courts will lead to improved efficiency since transaction costs can be lowered
and entry barriers from more efficient firms reduced.
Market frictions go beyond the problems of contract enforcement and informational barriers
associated with finding partners. Lack of quality and monitoring mechanisms create
challenges in organizing business as well. Quality related problems affect buyers who may
not be able to observe it before purchase.
In north’s view (North, 2005), institutions evolve to reduce transaction costs and these
institutions are important for the performance of economies. North sees the role of the
government as being crucial in specifying property rights and enforcing contracts both of
which promote specialization and reduce the costs of market exchange. The inability of
societies to develop effective, low cost enforcement of contracts is an important source of
stagnation and contemporary underdevelopment in developing countries (North, 2000, 2005).
There has been a recognition that transaction costs are relevant for agricultural market
analysis in developing countries because many of their institutions (formal rules of behavior)
that are taken for granted in developed countries which facilitate market exchange are absent
in these low income countries. The occurrence of market failures and incomplete markets has
been linked to higher transaction costs and to information asymmetries, which cannot be
explained by neoclassical economics (Makhura, 2001; North, 2005; Kydd and Doward, 2003).
Earlier approaches at the recognition of transaction costs in agricultural markets have been
explored by de Janvry et al (1991) for the case of missing markets in many African markets.
They use the household as the decision making unit and show that in the absence of food
TRANSACTION COST THEORY AND COORDINATION MECHANISMS
59
markets, households will normally strive to be self sufficient in their food requirements before
they allocate their resources to cash crops. Another observation in the market is that there are
wide variations between the selling prices (usually low) and the buying prices (usually high)
(Sadoulet and de Janvry, 1995). The reasons for the missing markets have been attributed to
transaction costs. Makhura (2001) provides examples of studies that indicate transaction costs
to be a major reason for the observed missing markets such as for credit, labor markets, land
markets as well as product markets. He further shows studies that indicate that these market
failures result in alternative institutional arrangements, such as share cropping, interlinking
and interlocking of markets among others.
Sadoulet and de Janvry (1995) study determinants of commercialization of small scale
farmers and find that distance from markets, poor infrastructure, high marketing margins,
imperfect information, supervision and incentive costs contribute a lot to whether a farming
household participates in the market or not. Thus before a farmer participates in the market,
he must overcome these transaction costs.
The importance of transaction costs have been identified by Coase (1937) and Hobbs (1997)
as costs of searching for potential transacting partners, negotiating with them and ensuring
that they meet their terms of transactions. Participation in the market will not be possible
when these costs are very high (Staal et al., 1997; Coase, 1937). Campell (1978) in Makhura
(2001) illustrate the problem of transaction costs by indicating that after one has decided on a
price, one needs to find a buyer. The longer one looks for ideal buyers, the higher the search
costs incurred. The transaction costs include advertising, telephone and transport costs, and
also the actual time spent. These extra costs of search and information may rise so high that
they exceed the gap between the price at which one would be willing to sell or buy and the
price asked or offered by the end user.
Very high transaction costs limit the number of participants in the market. Unfortunately, the
transaction costs associated with parties that are not able to participate in the market cannot be
estimated or measured. But it is known that the transaction costs that the non market
participants face may be too high to surmount in order to be able to participate in the market.
High or prohibitive transaction costs may arise from prohibitive investment requirements
(specifically asset specificity) (Frank and Henderson, 1992), too much uncertainty in
transactions (natural and human), and high frequency/volume of transactions. Institutional
arrangements are necessary to deal with problems such as hold up costs arising from
differential investments in the transactions.
TRANSACTION COST THEORY AND COORDINATION MECHANISMS
60
Staal et al (1997) shows that high transaction costs limit the amounts of products that can be
available for transactions in the market, or the use of inputs (Strasberg et al 1999). Zaibet and
Dunn (1998) show that household characteristics such as family size and dependency ratio
may also limit market participation. Capital is not individual specific; it is shared among the
family members (Goetz, 1992).
These few studies point to the significance of transaction costs and institutional arrangements
in affecting market relations of individuals and firms in developing markets. The next chapter
provides a detailed review of relevant works with regard to transaction costs and other
determinants of coordination mechanisms and supply chain performance with special
reference to agricultural markets in developing countries.

EMPIRICAL STUDIES ON TRANSACTION COSTS, COORDINATION MECHANISMS AND SUPPLY CHAIN PERFORMANCE
61
CHAPTER 4
EMPIRICAL STUDIES ON TRANSACTION COSTS, COORDINATION
MECHANISMS AND SUPPLY CHAIN PERFORMANCE
The difficult in the measurement and estimation of transaction costs empirically has been
recognized by many researchers and scholars (Allen, 1999; Wallis and North, 1986; Davis
1986). However there have been continuing efforts in this direction over time.
An assumption in empirically testing transaction costs follows directly from the Coase
theorem which states that under assumption of zero transaction costs, the type of
organizational arrangement does not matter. The merits of alternative arrangements can be
explained through a direct comparison of the costs of governing exchange under each
alternative (Masten, 1996). Coase’s argument is that:
G* = G1, if C1 > C2
= G2, if C1 ≥ C2 ……….……………………………………………………………1
where G1 and G2 represent alternative governance structures, G* is the chosen alternative and
C1 and C2 are the costs related to the transaction under the corresponding organizational
alternatives. Problems with transaction cost measurement usually hamper this form of
analysis. A major problem facing transaction cost analysis is availability of data. The data
required is usually not collected on regular basis, neither is it standardized nor publicly
available. This problem has been recognized by among others, Menard (2000); Masten
(1996); and Hobbs et al (1997). These limitations have however not stopped efforts in
empirically studying transaction costs. Using the Coase theorem and insights from
Williamson, Masten (1996) formalizes Coase’s argument as
2..........................................................................................................................111 eXC += β
3........................................................................................................................222 eXC += β
where X displays a vector of observable attributes of both the organizational form and the
transaction, β1 and β2 reflect parameter vectors, while e1 and e2 summarize unobserved
factors such as errors and misperceptions of transaction costs. How the types of transaction
costs affect the differential efficiency of organizational alternatives can thereby be analyzed,
even though transaction costs themselves cannot be measured. The probability of observing
the governance structure G1, therefore becomes
4..........................................................................).........)(Pr()Pr( 122121 XeeCC ββ −<−=<

EMPIRICAL STUDIES ON TRANSACTION COSTS, COORDINATION MECHANISMS AND SUPPLY CHAIN PERFORMANCE
62
The operationalization has been extensively used in recent empirical works.
Masten, Meehan and Synder (1991) provide a method of measuring the costs of organization,
which are used to represent transaction costs. They note that while the proxies capture the
hazards of the market, they ignore the internal costs of governance. Reduced form estimates
are unable to distinguish between internal and external transaction costs. They use switching
regression techniques and adopt censored regression models used in labor economics. Actual
dollar estimates of organization costs are obtained as well as estimates of the magnitude of
individual coefficients to capture their relative impact. They applied this methodology to
naval shipyards and found the overall organizational costs to be 14% of the total costs and
that with an incorrect contract agreement the costs would go up to 70%.
Other efforts at directly operationalizing transaction costs based on Masten’s (1996) structural
discrete alternatives have been undertaken by Fahlbeck (1996). Fahlbeck analyses the
influence of physical asset specificity, site specificity and human asset-specificity on the
choice of the marketing channel among Swedish farmers. The results indicated that farmers
with a higher degree of sunk costs, that is, greater asset specificity, favor trade with
cooperative societies. Sales to cooperatives incur lower transaction costs when asset
specificity is high compared to investor owned firms. Allen and Luech (1992) show that
measurement and enforcement costs dictate the choice between cash rent contracts and
cropshare contracts in land leasing while risk-sharing considerations derived from
neoclassical theory are irrelevant for contract choice. Cropshare contracts are directly linked
to low measurement costs of output and a high chance of soil exploitation.
Vakis et al (2003) measured transaction costs based on observed behavior in the market
among potato farmers in Peru. They estimated proportional and fixed transaction costs using
reduced form and semi structural conditional logit approach to market choice. A result of their
study was that the choice of a market is a function of effective farm level prices and of market
information that account for fixed transaction costs. Information that farmers receive reduces
fixed transaction costs by increasing the price received. They observed that the effect of
information availability was two times that of transport cost reduction. The study shows that
transaction costs are not synonymous with transport costs and that fixed transaction costs are
critical if the market is to properly function. In the same vein, Renkow et al (2004) present a
framework for quantifying fixed transaction costs facing semi-subsistence households in
Kenya. Log likelihood regression was used on the demand and supply side equations.

EMPIRICAL STUDIES ON TRANSACTION COSTS, COORDINATION MECHANISMS AND SUPPLY CHAIN PERFORMANCE
63
Frank and Henderson (1992) studied transaction costs as determinants of vertical coordination
in the US food industries. They measured vertical coordination by a vertical coordination
index derived from the industry’s upstream and downstream matrices of connections for a
product as dependent variables using ordinary least squares regression. Explanatory variables
used included farm output supply concentration, flow economies, capital intensity, demand
and input supply uncertainty and concentration, and idiosyncratic investments and scale
economies, all which were found to be significant. Non market exchanges were found to
reduce transactional inefficiencies.
On the other hand, Buvik and Andersen (2002) have studied the impact of vertical
coordination on ex post transaction costs comparing domestic and international buyer-seller
relationships. Using ex post transaction costs as the dependent variable and vertical
coordination and asset specificity as explanatory variables, they analyze relationships between
manufacturing firms in Norway using ordinary least squares regression. Governance
performance varied widely under international buyer-seller relationships compared with local
relationships due the higher costs of performance monitoring in the international business
relationships. The study involved unilateral rather than bilateral buyer seller relationships. In
Buvik and John (2000), relationship development effectively reduces the threat of
opportunism in long-term ties which in turn reduces ex post transaction costs. Thus
performance should be higher in long term ties due to in part, lower inventory costs.
Perishability and the bulky nature of milk combined with tropical climates and poor market
access means that milk lends itself to quality problems, and needs an appropriate location of
processing plants and specialized transportation arrangements. Though asset specificity is
observed, temporal specificity is the most relevant for milk as it determines the subsequent
investments and activities (Masten, 2000). The temporal nature of milk therefore requires
short and fast supply chains. Extensive negotiations in the market are not appropriate. Ngigi
(2002) and Staal et al (1997) also note that the lengthy period to maturities or gestations in
agriculture causes supply inflexibility in response to market changes in agriculture.
Agriculture is also prone to transaction, environmental and behavioral uncertainties. Seasonal
variability in output for non-storable commodities increases dependence on relational
contracts between suppliers of raw materials and processors. Ngigi further notes that the milk
industry is characterized by multiple sales outlets for the small-scale producers, sales on credit
where lump-some payments are expected at the end of an agreed period, as well as spot cash
sales due to different levels of transaction costs faced by the agents.

EMPIRICAL STUDIES ON TRANSACTION COSTS, COORDINATION MECHANISMS AND SUPPLY CHAIN PERFORMANCE
64
Aust (1997) examines vertical integration versus vertical coordination in the broiler industry
in the USA and finds that the driving force behind contracting in the industry is asset
specificity and uncertainty. She notes that vertical coordination is chosen over vertical
integration because of its flexibility, which allows firms to obtain inputs with specific
characteristics without getting into another business where large investments may be required.
She uses Schmid’s (1987) Situation-Structure and Performance framework to analyze the
industry and categorizes transaction costs into asset specificity and information costs. She also
notes that contracts do not eliminate risks fully as there are still risks of contract non renewal
and the risk of contractor not keeping chicks in housing on regular basis. She thus provides a
link between the transaction costs and their reduction through the coordination mechanisms.
Hobbs and Linda (1999) provide a theoretical framework for analyzing vertical linkages in
agrifood supply chains. Based on Transaction Cost Economics, they show that vertical
coordination is determined by transaction costs that arise from transaction characteristics, and
that these characteristics are a result of product characteristics, which are further influenced
by regulatory, technological and socio-economic factors. Using examples from the
agricultural sector they show that vertical relations are widespread and that trust and strategic
alliances play a vital role in the supply chains.
Von Bailey and Hunnicutt (2002) evaluate the role of transaction costs in market selection for
commercial feeder cattle in the Utah State. They find that transportation, shrinkage and
commissions alone are not enough to explain the selection of marketing alternatives (video,
internet, direct sales and the traditional auction). They provided a detailed analysis of the
components of transaction costs and their measures and the role trust plays in the reduction of
these costs. Other significant factors are size of operation, and experience. Respondents were
asked to indicate their perceptions of transaction costs under different pricing methods. The
proportion of cattle sold through each market type was then regressed against the transaction
cost factors using seemingly unrelated regression model. Transaction costs were found to be
significant and present in the industry.
Hobbs (1997) measures transaction costs in the choice between direct sales and auction sales
of cattle in the UK. The influence of transaction costs and farmer variables in the choice of
coordination mode were tested. The dependent variable was the proportion of cattle sold
through each coordination mode against the measures of information, negotiation and
monitoring costs. The study approached the measuring of transaction cost by looking at the
importance of individual transaction costs. A two limit maximum likelihood regression

EMPIRICAL STUDIES ON TRANSACTION COSTS, COORDINATION MECHANISMS AND SUPPLY CHAIN PERFORMANCE
65
estimation technique (Tobit) was used. Four types of transaction cost and three producer
characteristics were shown to be significant in the study.
Mathye et al (2000) in Makhura (2001) also study the choice of marketing channels for
smallholder banana and mango farmers in the Northern Province of South Africa. They find
that not all farmers sell their produce and that those who sell tend to use different channels
such as fresh produce market, ‘achaar’ (type of salad) market and direct sales to consumers.
Problems of transport, searching for markets and education were identified as the major
factors determining which channel was used by the farmers.
A study of the grain marketing in Ethiopia by Gabre-Madhini (2001) provides further insights
into the measurement of transaction costs in the agricultural sector. The study covered the
grain supply chain and detailed measures of transaction costs such as search time, search
labor, working capital and social capital. These were estimated using revenue functions
through instrumentations for each of the cost components. Two stage least-squares estimation
was then applied to the revenue functions. She concludes that transaction costs (social capital)
form a major component of the total costs in the Ethiopian grain transactions.
In a study by Fafchamps and Minten (2001), the role of social capital or networks in the
resolution of disputes among traders is studied. They measured social capital in terms of the
number of relatives in the trade, the number of traders known personally as well as the
number of clients known personally. They find that incidences of contract breach are low and
that traders preferred to depend on trust based relationships for contract enforcement rather
than formal legal institutions such as courts and the police. The study closely mirrors Gabre-
Madhini (2001) on the role of social capital in transactions.
The significance of trust among supply chain partners has been studied by among others
Whan et al (2004). Trust is highly associated with both side’s specific asset investments.
Constructs were used to identify and measure the variables for trust and asset specificity. An
ordinary regression analysis was then applied with trust as the dependent variable. The
biggest challenge to implementing supply management relations was traced to the ability to
cultivate trust among the partners. Trust takes a long time to build showing that it is dynamic
in nature. In the study, trust is considered as a consequence of asset specificity; however trust
could as well be an antecedent to asset specificity. This point is still unclear.
In studies on the predictions made by transaction cost theory regarding the relationship
between governance structures and the characteristics of transactions using ‘survivor
analysis’, Pint and Baldwin (1997) find that inefficient governance structures are weeded out

EMPIRICAL STUDIES ON TRANSACTION COSTS, COORDINATION MECHANISMS AND SUPPLY CHAIN PERFORMANCE
66
by competitive pressures. Also vertical integration will be more efficient when asset
specificity, uncertainty and thin markets are present. It is also possible to tailor contracts to fit
characteristics of transactions. They stress importance of reputation in reducing opportunism.
Key et al (2000) have used proportional and fixed transaction costs in Mexico to study why
some maize producers may have different relationships to the market. They use estimates of
supply elasticity and measures of the relative importance of factors that determine both
proportional and fixed transaction costs for households. The reduced form model of the
market participation equation and the supply functions under the log likelihood were then
applied to the data. Transportation and improvement of market institutions were found to be
critical in improving production and increasing market participation by the producers.
Improvement of market institutions is expected to reduce transaction costs. This was shown
by the result that selling to official sources tended to significantly increase the production and
selling threshold for the sellers. Ownership of assets (pick-up truck) also increased the
tendency to participate in the market.
In their study on alternative techniques for influencing market participation among peri-urban
milk producers in the Ethiopian highlands, Holloway et al (2000) find that institutional
innovations to promote entry into the market should be accompanied by a mix of other factors
such as infrastructure, knowledge, and asset accumulation in the household. The location of
the producer together with distance also influenced the level of participation in the market.
Furthermore, in Staal et al (1997), transaction costs are presented as the cause for lack of
participation in dairy markets in East Africa. In this case contracts and cooperatives are
essential in reducing transaction costs. Larger producers face less transaction costs than
smaller ones and this is reflected in the market outlets they choose, costs of inputs and the
prices they receive. Transaction costs are also likely to rise with distance from captive
markets. Long distances increase costs of information search, wastage and spoilage when the
roads are bad and the buyers are not found on time.
Staal et al (2000, 2002) further study the effect of location on the uptake of technologies by
smallholder dairy farmers in Kenya. They use elements of market access such as distance to
destination, quality of road, utility derived by the producer and transaction costs. Transaction
costs are captured by the individual capacity and resources of agents at the point of
observation. Transaction costs faced by the agents are found to be a function of their
individual characteristics and their ability to use market information and conduct exchanges.

EMPIRICAL STUDIES ON TRANSACTION COSTS, COORDINATION MECHANISMS AND SUPPLY CHAIN PERFORMANCE
67
The effect of transport costs on the household’s decision to devote resources to low yielding
crops rather than to cash crops has been studied by Omamo (1998) in Siaya district of Kenya.
The results indicate that transport costs were important in explaining the cropping decision of
the households. More resources and land are devoted to cash crops when the distances to
markets are shorter or when the households are located closer to roads. Similar results were
realized in Fafchamps (1992) study where the relationship between food price volatility and
market integration were investigated. He found that better roads and transportation tended to
equalize price movements across a larger or international market, but also that the food prices
were highly dissociated from local supply and demand conditions. Furthermore, Minot (1999)
also find that transaction costs (particularly transportation costs) do not only decrease market
surplus but that they can substantially reduce the elasticity of supply and demand.
De Janvry et al (1991) use household characteristics to measure unobservable transaction
costs. The rationale is that market failures are household specific. Grosh (1994) and Key et al
(2000) add that market failures are also commodity specific. However, there is possibility that
transaction costs are transaction specific as the same commodity being sold by the same buyer
using different coordination mechanisms may attract different levels of transaction costs.
Goetz (1992) studies the effect of transaction cost factors on market participation of coarse
grain farmers. He used proxy variables such as ownership of a cart for transportation of grain
to the market, physical distance to market and regional dummy for location of market. The
results indicate that there was a significant relationship between the grain price and the
probability of buying, and the quantities bought and sold. Other factors that influenced market
participation were better information and access to grain processing technology.
Strasberg et al (1999) and Zaibet and Dunn (1998) study the effect of land size, location,
number of plots and existence of annual crops (as proxies for transaction costs) on market
participation. They test the proposition that larger family ownership systems, as opposed to
restricted family ownership systems and farm size are sources of increased risk aversion and
transaction costs in market participation. They find that nuclear family ownership system had
a significant and positive correlation with fertilizer purchasing. In the case of mechanization
and labor hiring, the estimate was positive but not significantly different from zero for nuclear
family. For a large family, farm size was significant and positively correlated to
mechanization and labor use. Strasberg et al (1999) show that the use of fertilizer depended
mainly on the distance to a motorable road, assets such as the value of agricultural equipment
EMPIRICAL STUDIES ON TRANSACTION COSTS, COORDINATION MECHANISMS AND SUPPLY CHAIN PERFORMANCE
68
owned, value of the livestock owned, and human resource factors. This shows that transaction
costs are also available in the input markets just as in the output markets.
The cost of market information has also been recognized as a major component of transaction
costs. Market information costs are defined as the costs associated with lack of or access to
sources of information. Abdulai and Delgado (1999) find that the decline in the cost of
information and transport flows as a result of good infrastructure reduces transaction costs. In
Strasberg et al 1999, increased human capital has a significant positive effect on the effective
use of inputs since the chances are that better management skills, and thus a greater
propensity to seek information on operations of the market are available.
Makhura (1994) in Makhura (2001) defines access to information amongst others as having
the opportunity of listening to radio for agricultural communications. He finds that farmers
having access to the use of such information sold more agricultural produce while those
having no access sold less. He and Yang (1999) find that farmers in some regions of China
used neighbors, TV and newspapers or magazines and carried out investigations on markets to
access market information. Transaction costs were thus lowered in all the cases. High
transaction costs faced by the farmers really originated from small transaction scale, outdated
information and disorderly marketing system.
Randolph and Ndung’u (2000) measure the importance of attributes of different health
services for the decision of the smallholder dairy farmers in Kenya to choose an animal health
service using conjoint analysis. The results indicate that promptness and professionalism of
the service determine the farmer’s decisions whereas the price is the least important reason for
choosing a health service. Thus the risk of delays in the health services outweighs the price
considerations showing the significance of transaction costs.
Leathers and Kähkönen (1998) focus on market participation in post liberalization agricultural
markets in Tanzania and Zambia. They define transaction costs to include information,
negotiation, enforcement costs and transfer costs (costs of handling, transport, storage,
processing, wholesaling and retailing). They use a descriptive survey to show that transaction
costs for many farmers are too high for them to participate in the market despite a growing
private sector after liberalization and privatization. The results show that the high transaction
costs emanated from poor institutional environment and infrastructure.
Makhura (2001) studies the role of transaction costs on market participation of smallholder
commercial farmers in the Northern Province of South Africa using Heckman’s two stage
estimation approach. Transaction costs were divided into fixed and proportional transaction

EMPIRICAL STUDIES ON TRANSACTION COSTS, COORDINATION MECHANISMS AND SUPPLY CHAIN PERFORMANCE
69
costs. The results show that information, asset endowments and market access significantly
influence the decision to participate in the market by households.
Boger (2001a, 2001b) studies the effect of transaction costs on the governance structures in
the Polish Hog sector. Using multivariate and multinomial logit models and variables such as
asset specificity, quality systems, grading, bargaining power, market structure/site specificity
for market channels and contract types, she finds that farmers that did not invest significantly
traded on spot markets and received relatively low prices. Those who invested significantly
secured their investments through neoclassical or relational contracts and received higher
prices. However, there were some transactions that had high investments but were taking
place on the spot markets and thus lacked any safeguards for their investments.
Low economic performance stems from high incidence of cheating, whether real or perceived.
Potential customers can keep away from new products when they suspect there may be a
hidden flaw (Casson, 1991). Insisting on pre-payment of sales and post payment of purchases
eliminates all exposure to risk for some chain members. Transaction costs are expected to be
lower in smaller stable compact groups and information flows among them will be better.
Parties found cheating risk loosing reputation and are punished as it is easier to monitor the
activities of each other leading to better performance than large amorphous groups (Casson,
1991). Chains that have lower information costs are expected to perform better than those that
do not. Information costs can be captured by various kinds of uncertainty that impact on
performance through the chosen coordination mechanisms.
Supply chain performance measurement is difficult because it involves different groups or
firms. However, Beamon (1999) provides a framework for the selection of a performance
measurement system. The main measures for performance identified are resources, output and
flexibility. The measures contain quantitative and qualitative measures unlike simple
numerical measures that limit the scope of performance measurement. The measures are also
more complete, accurate and therefore more effective.
The importance of measuring the impact of supply chain performance is underlined by
Bolstorf (2003). Using the Supply Chain Council’s SCOR model (Supply Chain Operations
Reference-model), performance is evaluated through measures such as delivery performance
(time, order fulfillment, lead time and supply response time) and total supply chain
management cost (within firm) and also cash-to-cash cycle time. Most of the information that
is critical may be not be open to the public but may be confined within the firms.

EMPIRICAL STUDIES ON TRANSACTION COSTS, COORDINATION MECHANISMS AND SUPPLY CHAIN PERFORMANCE
70
Chen and Paulraj (2004) carry out an extensive survey of research done in the field of supply
chain management consisting of its critical elements, its performance measurement and the
theoretical framework. They assert that Supply chain performance should go beyond financial
performance and operational performance measures to include system wide measures such as
extent of mutual trust, changes in inventory held and turnover at the various stages of the
chain and adaptability of the supply chain as a whole to meet customer needs.
Performance in SCM has been measured by Kaplan and Norton (1996) and also emphasized
by Brewer and Speh (2000) using the Balanced scorecard approach. The scorecard provides a
multidimensional scorecard and balances financial and non financial measures. It measures
performance across four balanced perspectives of: financial perspective – return on
investment, economic value added; customer perspective – customer satisfaction, customer
retention, market share, customer acquisition; learning and growth perspective and –
employee satisfaction, information technology (IT) system availability and; internal business
processes – costs and quality, response time, new product introductions. Similar approaches
on supply chain performance have been used by Bullinger et al (2002) cited in Hieber (2002).
Performance has also been measured by the prices paid and or received by members of the
supply chain. Keidailene and Hockman (2002) in a study in Lithuania, measures performance
by the prices that cooperatives were paying relative to private firms. The prices were found to
be about 10% higher for raw milk delivered to cooperatives societies compared to deliveries
to dairy processing firms, implying that better performance for the producers concerned and
the entire chain was achieved by selling through cooperative societies.
Performance measures vary from absolute measures to relative measures, both of which are
relevant in the evaluation of performance in supply chains. Performance measures can also be
grouped as financial and non financial performance measures. Both types are also necessary
for a proper evaluation of the supply chain activities. However due to lack of standard
performance measures and especially at the chain level, multiple constructs consisting of
financial and non financial indicators can be used. Standardized measures of performance are
still evolving. However, subjective measures of performance have been widely used to
measure performance. A composite measure of performance incorporates the measures
subjectively derived from the respondents, as well as financial measures where available.
Likert-like scales are used for the subjective measures. Subjective measures have been used
widely by Venkatraman and Ramanujan (1987), among others. They find that subjective
measures give results similar to their quantitative counterparts.

THEORETICAL AND EMPIRICAL MODEL
71
CHAPTER 5
THEORETICAL AND EMPIRICAL MODEL
The chapter begins by introducing the theoretical foundations of smallholder market
participation in the face of transaction costs as a prelude to modeling determinants of
coordination mechanisms and supply chain performance in the Kenyan dairy industry in
sections 5.1 and 5.2. Section 5.1 introduces the economic problem facing smallholder market
participation in the presence of transaction costs. Section 5.2 builds on this framework to
compare farmers’ and traders’ decision making under two conditions: with and without
transaction costs. These foundations are necessary to understand the kind of challenges that
farm households and agricultural commodity traders face in their attempts to commercialize
their farming activities or to participate in product markets as sellers.
The economic model for the study is discussed in section 5.3 for market participating farmers
and traders. The model does not take into consideration non market participating agents but
the understanding is that the constraints facing agents participating in the market are worse for
those agents not able to participate causing them to be shut out of the market. In section 5.4
the econometric model for the determinants of coordination mechanisms in the supply chains
is discussed. Empirical specification of the determinants of coordination mechanisms are
discussed in section 5.5. Finally, section 5.6 discusses a theoretical and econometric model for
the determinants of supply chain performance in the Kenyan fresh milk supply chains.
5.1 Theoretical foundations for smallholder market participation
Most of the markets in developing countries are dominated by small scale operators, generally
referred to as smallholders. This is both at the production and marketing/trading levels of the
respective primary product supply chains. The number of producers is usually large. The
number of traders can also be large in number or dominated by few large buyers
(monopsonists) depending on the commodity and location of interest.
Based on the competitive market situation, smallholder market participation has been
modeled to account for the fact that production and marketing decisions of the decision
makers are usually not separable. The decisions are rather looked at as a continuum, on one
end is autarky (self production), both production and buying in the middle (net buyers), and at
the other end full market participation as net sellers (Key et al, 2000; Bellemare and Barrett,
2006). The location of the agents on the continuum is a function of transaction costs they face.
It therefore means that the amount of a product sold or the degree of participation in the

THEORETICAL AND EMPIRICAL MODEL
72
market is a function of the transaction costs so faced by the decision makers. A threshold must
be attained before the individuals decide to participate in the market whether as sellers or
traders. Figure 5.1 below illustrates these relationships.
Figure 5.1: Relationship between transaction costs and household sales and purchases
Source: Adapted from Makhura (2001:36).
HHTCS = sales by household facing high transaction costs
HLTCS = sales by household facing lower transaction costs
HHTCP= purchases by household facing high transaction costs
HLTCP= purchases by household facing lower transaction costs
Net selling individuals and household will receive an observed sales price of Pi-δ, where δ
represents the marketing costs. At this price, sales will be reflected by HLTCS, i.e sales of a
low transaction cost household. When the household faces more transaction costs, ξ, the
unobserved decision price is Pi-δ-ξ and will correspond to sales of HHTCS, i.e sales of a
household facing high transaction costs, which is less than sales of HLTCS. Thus at high
transaction costs, less quantities will be sold, implying that transaction costs are negatively
related to market participation (Makhura, 2001).
On the other hand, deficit households which purchase food will face the observed price of
Pi+δ where δ are the observable costs. At this price the household equilibrium conditions will
be at HLTCP, that is, purchases by households facing low transaction costs. But if the
Pi+δ+ξ
Pi+ δ
µi/ξ
Pi
Pi-δ
Pi-δ-ξ
P
Q
Individuals supply
Unobservable purchase price
Observable purchase price
Unobservable decision price
HHTCP
HLTCP
HLTCS
HHTCS
THEORETICAL AND EMPIRICAL MODEL
73
household faces unobservable transaction costs, ξ, the decision price will be Pi+δ+ξ, thus
purchasing at HHTCP or purchases of a household facing high transaction costs. The
household tends to purchase less when faced with high transaction costs as compared to when
it is facing low or no transaction costs (Makhura, 2001). Thus it can be similarly concluded
that market participation is negatively related to transaction costs.
It has been noted by Ejupu et al (1999) that non surplus producers may also participate in the
market as sellers. Makhura (2001) also shows that a production level is necessary but not
sufficient condition for commercialization or market participation. Other household related
characteristics also affect the decision to participate. He further indicates that a household
model rather than a competitive market framework would be required in this case.
Commercially participating households and individuals require the separatibility of
consumption and production/marketing decisions. The competitive market framework can be
used taking cognizance of the household decision making process in the presence of
transaction costs. The next section compares household and individual agent decisions in the
presence and absence of transaction costs by expanding on the exposition above.
5.2 Market situation facing smallholder market participants
In order to conceptualize the market situation facing commercial agricultural producers and
traders in agricultural supply chains, consider a household that produces an agricultural
product, in this case milk. The household’s decision can be divided mainly into production
and marketing decisions. Firstly, the household chooses the optimal allocation of resources to
determine the quantity to be produced. Following a typical household setting, this decision is
based on the utility that can be derived from the production activity, monetary or otherwise,
given the available resources such as labor, land, and other factors. Secondly, the household
then makes decisions regarding the market where the volumes of the product to sell or buy are
determined.
The exposition below draws from several sources including Key et al (2000), Vakis et al
(2002, 2003), and Makhura (2001) to illustrate the economic problem facing smallholder
farmers and traders participating in markets under two situations: when transaction costs are
assumed to be absent and when transaction costs are present.
5.2.1 Market situation under assumption of no transaction costs
Under the assumptions of no transaction costs, the household maximizes its utility (U) by
deciding on the consumption of k goods ( )( kc , production of k goods )( kq , and sales of k
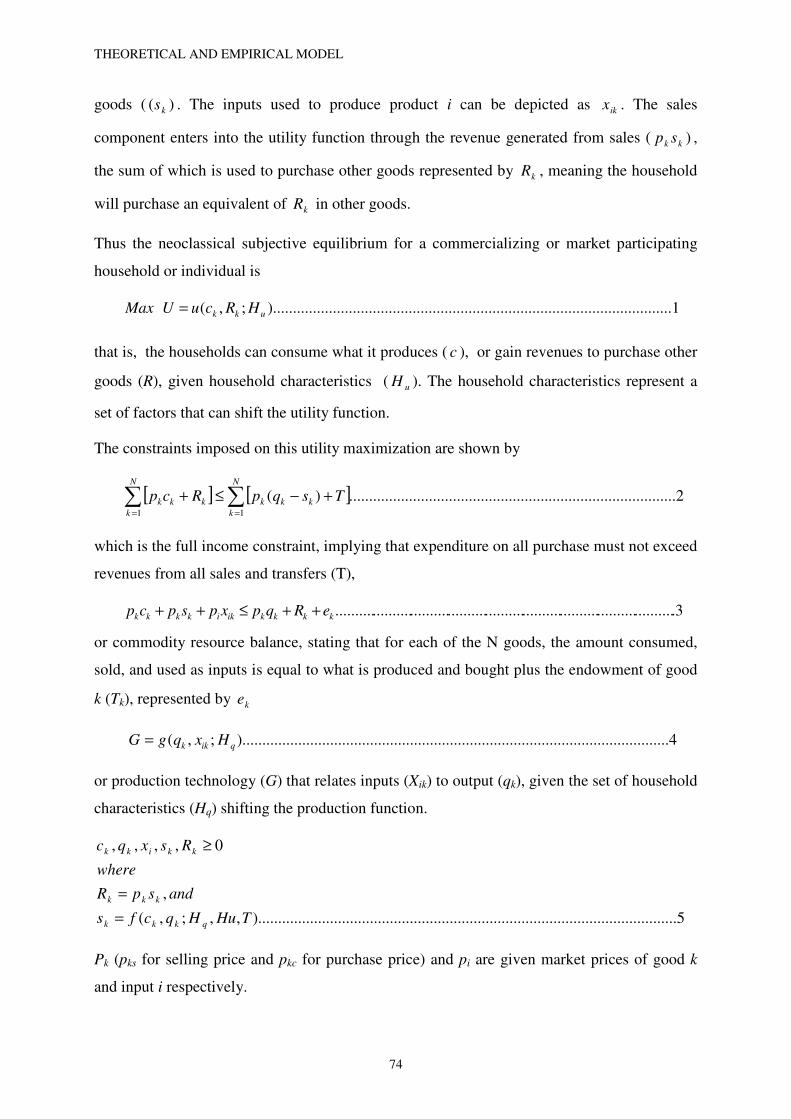
THEORETICAL AND EMPIRICAL MODEL
74
goods ( )( ks . The inputs used to produce product i can be depicted as ikx . The sales
component enters into the utility function through the revenue generated from sales ( )kk sp ,
the sum of which is used to purchase other goods represented by kR , meaning the household
will purchase an equivalent of kR in other goods.
Thus the neoclassical subjective equilibrium for a commercializing or market participating
household or individual is
1...........................................................................................).........;,( ukk HRcuUMax =
that is, the households can consume what it produces ( c ), or gain revenues to purchase other
goods (R), given household characteristics ( uH ). The household characteristics represent a
set of factors that can shift the utility function.
The constraints imposed on this utility maximization are shown by
[ ] [ ] 2..................................................................................)(11∑∑
==
+−≤+N
k
kkk
N
k
kkk TsqpRcp
which is the full income constraint, implying that expenditure on all purchase must not exceed
revenues from all sales and transfers (T),
3...........................................................................................kkkkikikkkk eRqpxpspcp ++≤++
or commodity resource balance, stating that for each of the N goods, the amount consumed,
sold, and used as inputs is equal to what is produced and bought plus the endowment of good
k (Tk), represented by ke
4..................................................................................................).........;,( qikk HxqgG =
or production technology (G) that relates inputs (Xik) to output (qk), given the set of household
characteristics (Hq) shifting the production function.
5................................................................................................).........,,;,(
,
0,,,,
THuHqcfs
andspR
where
Rsxqc
qkkk
kkk
kkikk
=
=
≥
Pk (pks for selling price and pkc for purchase price) and pi are given market prices of good k
and input i respectively.

THEORETICAL AND EMPIRICAL MODEL
75
Thus c, R, s and q are defined and decided over k goods, where the set k covers all goods
entering into production, consumption and the market or commercial activity.
The household jointly makes its production, consumption and market participation decision
subject to a number of constraints: the full income constraint (2), the resource equilibriums (3)
and the technology (4) to produce the output.
The market situation without transaction costs can thus be captured by the Lagrangian
demand and supply equations as below.
[ ] 6...........................................).........;,()(
)();(1
qikkkkikikkkkk
N
k
kkkkkkkukk
HxqGTRxpcpsqp
TcpRsqpHRcLMax
Φ+++−−−+
+−−−+= ∑
=
λ
µµ
where µ, Ф, and λ are Lagrange multipliers associated with the full-income constraint,
resource balance equilibriums, and technology constraint, respectively.
The optimal consumption, input use and market participation must, respectively, satisfy the
following first order conditions, upon solving which the optimal supply and demand can be
determined. These represent the shadow prices of the constraint resource.
For consumption the partial derivative of u (or L) with respect to ck is:
7...............................................................................................................kk
k
ppc
uλµ +=
∂
∂
For other purchased goods, the partial derivative with respect to Rk is
8...................................................................................................................λµ −=∂
∂
kR
u
For output, the partial derivative of G with respect to qk is:
9.......................................................................................................kk
k
ppq
Gλµ −−=
∂
∂Φ
For inputs, the partial derivative with respect to xik is
10..................................................................................................................i
ik
px
Gλ−=
∂
∂Φ
For marketed goods, the partial derivative of G with respect to sk is:
11.......................................................................................................kk
k
pps
Gλµ −−=
∂
∂Φ
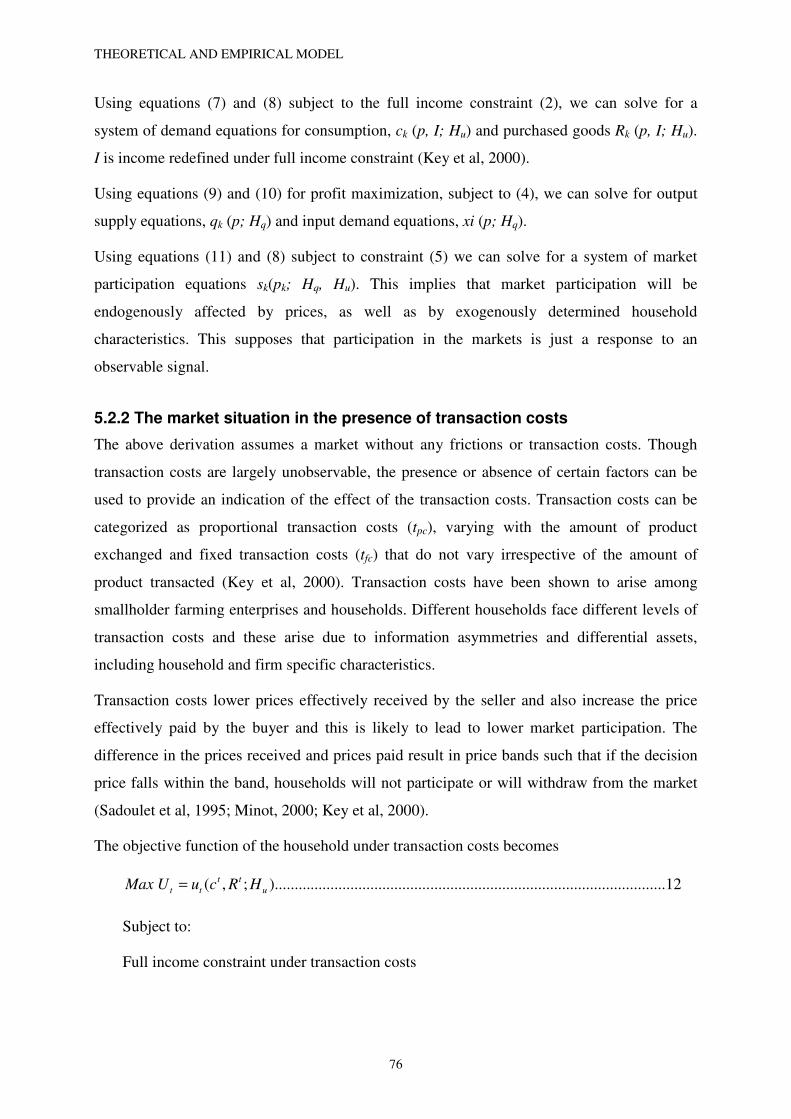
THEORETICAL AND EMPIRICAL MODEL
76
Using equations (7) and (8) subject to the full income constraint (2), we can solve for a
system of demand equations for consumption, ck (p, I; Hu) and purchased goods Rk (p, I; Hu).
I is income redefined under full income constraint (Key et al, 2000).
Using equations (9) and (10) for profit maximization, subject to (4), we can solve for output
supply equations, qk (p; Hq) and input demand equations, xi (p; Hq).
Using equations (11) and (8) subject to constraint (5) we can solve for a system of market
participation equations sk(pk; Hq, Hu). This implies that market participation will be
endogenously affected by prices, as well as by exogenously determined household
characteristics. This supposes that participation in the markets is just a response to an
observable signal.
5.2.2 The market situation in the presence of transaction costs
The above derivation assumes a market without any frictions or transaction costs. Though
transaction costs are largely unobservable, the presence or absence of certain factors can be
used to provide an indication of the effect of the transaction costs. Transaction costs can be
categorized as proportional transaction costs (tpc), varying with the amount of product
exchanged and fixed transaction costs (tfc) that do not vary irrespective of the amount of
product transacted (Key et al, 2000). Transaction costs have been shown to arise among
smallholder farming enterprises and households. Different households face different levels of
transaction costs and these arise due to information asymmetries and differential assets,
including household and firm specific characteristics.
Transaction costs lower prices effectively received by the seller and also increase the price
effectively paid by the buyer and this is likely to lead to lower market participation. The
difference in the prices received and prices paid result in price bands such that if the decision
price falls within the band, households will not participate or will withdraw from the market
(Sadoulet et al, 1995; Minot, 2000; Key et al, 2000).
The objective function of the household under transaction costs becomes
12.........................................................................................).........;,( u
tt
tt HRcuUMax =
Subject to:
Full income constraint under transaction costs
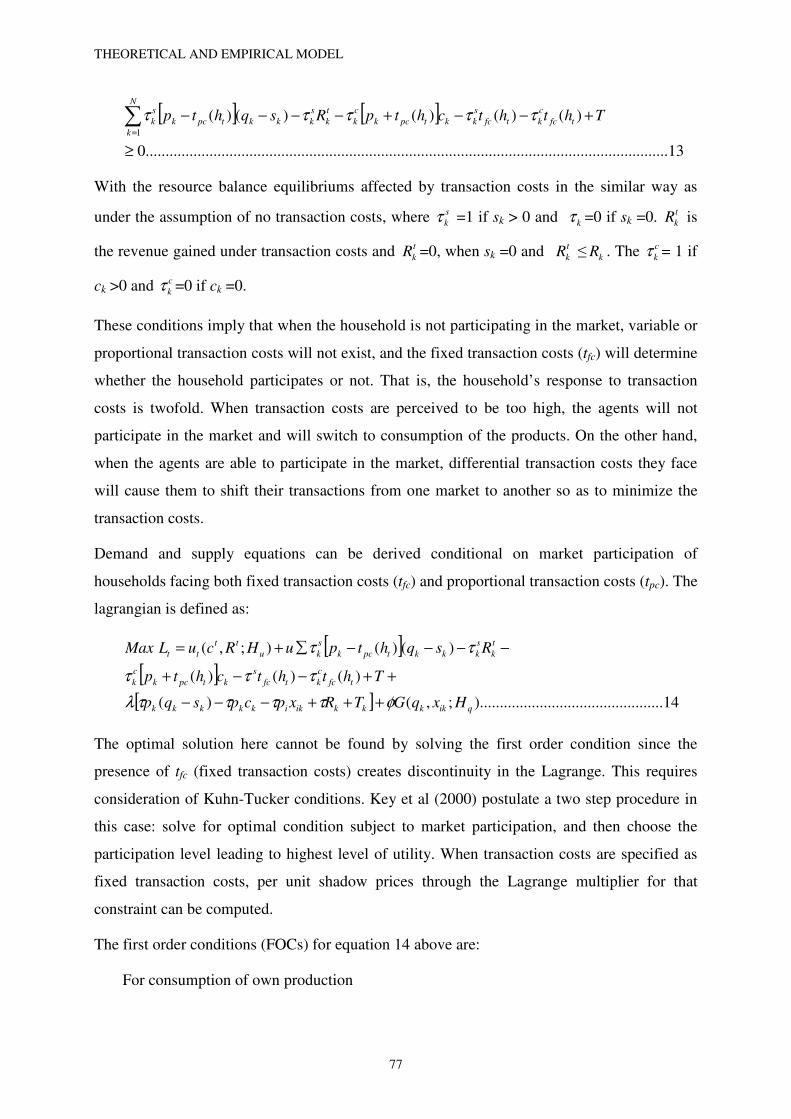
THEORETICAL AND EMPIRICAL MODEL
77
[ ] [ ]
13...................................................................................................................................0
)()()()()(1
≥
+−−+−−−−∑=
ThthtchtpRsqhtp tfc
c
ktfc
s
kktpck
c
k
t
k
s
kkk
N
k
tpck
s
k τττττ
With the resource balance equilibriums affected by transaction costs in the similar way as
under the assumption of no transaction costs, where s
kτ =1 if sk > 0 and kτ =0 if sk =0. t
kR is
the revenue gained under transaction costs and t
kR =0, when sk =0 and t
kR ≤ kR . The c
kτ = 1 if
ck >0 and c
kτ =0 if ck =0.
These conditions imply that when the household is not participating in the market, variable or
proportional transaction costs will not exist, and the fixed transaction costs (tfc) will determine
whether the household participates or not. That is, the household’s response to transaction
costs is twofold. When transaction costs are perceived to be too high, the agents will not
participate in the market and will switch to consumption of the products. On the other hand,
when the agents are able to participate in the market, differential transaction costs they face
will cause them to shift their transactions from one market to another so as to minimize the
transaction costs.
Demand and supply equations can be derived conditional on market participation of
households facing both fixed transaction costs (tfc) and proportional transaction costs (tpc). The
lagrangian is defined as:
[ ][ ]
[ ] 14.....................................).........;,()(
)()()(
)()();,(
qikkkkikikkkkk
tfc
c
ktfc
s
ktpck
c
k
t
k
s
kkktpck
s
ku
tt
tt
HxqGTRxpcpsqp
Ththtchtp
RsqhtpuHRcuLMax
φττττλ
τττ
ττ
+++−−−
++−−+
−−−−∑+=
The optimal solution here cannot be found by solving the first order condition since the
presence of tfc (fixed transaction costs) creates discontinuity in the Lagrange. This requires
consideration of Kuhn-Tucker conditions. Key et al (2000) postulate a two step procedure in
this case: solve for optimal condition subject to market participation, and then choose the
participation level leading to highest level of utility. When transaction costs are specified as
fixed transaction costs, per unit shadow prices through the Lagrange multiplier for that
constraint can be computed.
The first order conditions (FOCs) for equation 14 above are:
For consumption of own production

THEORETICAL AND EMPIRICAL MODEL
78
15............................................................)),.......(())(( tpck
c
tpck
c
t
t
htphtpc
u+++=
∂
∂λτµτ
For consumption of purchased goods,
16.............................................................)),.......(())(( tpck
c
ktpck
c
k
k
htphtpR
u+−+=
∂
∂λτµτ
For output
17........................................................)),.......(())(( tpck
s
ktpck
s
k
c
htphtpuq
G−−−−=
∂
∂λττφ
For inputs used in production
18.....................................................................................).........(( tpcck
s
k
ix
htpx
G−−=
∂
∂λτφ
For marketed goods
19........................................................)),.......(())(( tpck
s
ktpck
s
k
k
htphtps
G−−−−=
∂
∂λτµτφ
The income constraint takes two forms: When the household participates in the market, the
change in utility as a result of unit change in µ will be equivalent to income constraint in (13)
which has both fixed and proportional transaction costs. However, when the household is not
yet participating
20...............................................................................0))()( =+−−=∂
∂Ththt
u
Ltfc
c
ktfc
s
kt ττ
We can solve for systems of demand equations under transaction costs
1.21...............................................................................).........,;( upct
t
k
t
k hItpcc +=
2.21..........................................................................................).........,;( upct
t
k
t
k hItpRR −=
The systems of output supply equations under transaction costs
3.21...............................................................................................).........;( qpct
tt
k htpqq −=
Input equations
4.21..........................................................................................................).........,( qi hpxx =
and the system of market participation equations is given by

THEORETICAL AND EMPIRICAL MODEL
79
),;( uqfc
tt
k hhtpss −=
depending on whether =s
kτ 0 or 1,
and
),;( uqfc
tt
k hhtpss −=
when
5.21.............................................................................................................................1=s
kτ
From the foregoing, and according to Makhura (2001) and Key et al (2000), transaction costs
affect all systems of equations. Utility maximization under transaction costs is different from
one when transaction costs are assumed not to exist. Under transaction costs, more of the
production will be consumed since producers will be valuing output consumed at
kpck ptp ≥+ , and they will be saving on a higher purchase price.
On the other hand, less of other goods Rk will be consumed since there is a low propensity to
participate in the market. A twist in the indifference curve and an inward shift of the full
income constraint will be observed.
The household’s market supply without transaction costs is a function of prices and household
characteristics, that is
),,( quk hhpss =
Equation (21.5) thus shows that households participating in the market face both fixed and
proportional transaction costs. Fixed transaction costs will shift the supply curve with respect
to both revenue (R) and price, thus increasing the threshold at which market participation can
take place, that is, when production under transaction costs (particularly fixed transaction
costs) will lower the decision price considerably so much so that it might not be worthwhile to
participate in the market. Furthermore, consumption is a residual of production and market
participation;
),(),,(),( upcqupc
t
kqpc htpchhtpshtpq +=−−−
This shows that market participation and consumption are inversely related. With this
observation in mind, the equations can be modified to apply to traders participating in the
market. In this case consumption is either zero or negligible and a solution for profit
maximization can be carried out in the same way.
THEORETICAL AND EMPIRICAL MODEL
80
Equation 21.5 also indicates that when no sales take place, we can get the decision price, d
kP ,
for selling by setting the amount sold to zero (s= 0) and solve for d
kk PP = . The equation for
shadow decision price will be given by
22..........................................................................................).........,,,( uqkfc
d
k
d
k hhptPP =
Equation (21.5) shows that the decision to take part in the market depends only on fixed
transaction costs, while the market supply (conditional on participation) will depend on both
fixed and proportional transaction costs. When a certain threshold of fixed transaction costs
has been attained positive values of supply (sales or market participation) will be observed for
the commodity (Makhura, 2001a).
The rest of the exposition below focuses on agents (households and traders) that are net sellers
(that is, s>o) to model determinants of coordination mechanisms used in their transactions in
the market. Section 5.3 to 5.5 model determinants of coordination mechanisms in the milk
supply chain transactions while section 5.6 models determinants of supply chain performance
in the transactions.
5.3 A theoretical model for determinants of coordination mechanisms
To model determinants of coordination mechanisms used by market participating agents
(farmers and traders) in the Kenyan fresh milk supply chains, we assume that the agents make
two types of decisions: production decisions and marketing decisions. The decisions are also
assumed to be made in the presence of transaction costs. For the farmers, production decisions
involve allocating resources to the various portfolios of crop and livestock activities, while
marketing activities include finding markets and entering into transactions to sell their
products under various coordination mechanisms in various supply chains. Both decisions are
interrelated and should be simultaneously determined. However, this study models farmer
marketing decisions assuming their production decisions are predetermined. The question of
whether or not to participate in the market is therefore not addressed as all the agents are
assumed to be already participating in the market, albeit at different levels. Milk retail
operators also make marketing decisions by buying the farmers’ milk and selling it to
consumers and or other buyers. The study concentrates on market participating agents, at both
producer and trader stages of the milk supply chain.
We assume that milk producers and traders wish to maximize some utility function of net
revenue over time and in so doing choose not only the profit maximizing production methods

THEORETICAL AND EMPIRICAL MODEL
81
but also appropriate contractual forms for the various transactions they engage in. We take
note that to realize the net benefits, several costs will necessarily be incurred by the agents for
each transaction. The costs are assumed to be specific to each coordination mechanism used.
The relative benefits of alternative coordination mechanisms to use in transactions with other
parties have to be addressed by the market participant. The benefits or losses derived under
each coordination mechanism are determined by quasi rents available in their transaction
relationships. The transacting parties will continuously be evaluating the opportunity costs of
their transaction arrangements. The quasi rents are a function of transaction costs (Klein,
Crawford and Alchian, 1978). The problem of hold up is likely to arise in this case as the
parties compare their switching costs from one transaction arrangement to another. Ultimately
for each transaction, the chosen coordination mechanisms are expected to be the net revenue
maximizing coordination arrangements.
The modeling draws from several sources including Doward (1999, 2001), Vakis (2003), and
Hobbs (1997). Doward categorizes costs faced by agents into two groups. The first category is
production or transformation costs necessary to physically produce the products in readiness
for the market. These costs are likely to vary due to efficiencies and scale economies of each
farm or firm. The other category of costs is referred to as transaction costs. These costs
consist of pure transaction costs (information and search costs, negotiation costs and
monitoring and enforcement costs) as well as the associated risk costs arising from the
transactions. Vakis et al (2003) distinguish transaction costs as fixed transaction costs and
variable or proportional transaction costs. Hobbs (1997) does not distinguish between fixed
and proportional transaction costs but classifies the fixed and proportional transaction costs
into three classes: market search and information costs, negotiation costs, and monitoring and
enforcement costs. In this study, risk costs are not handled separately as these arise out of
opportunistic tendencies among transacting partners because of information asymmetry
problems and asset specificity. Risk costs are therefore assumed to be part of the pure
transaction costs. The study therefore uses Doward’s framework but defines transaction costs
according to Hobbs and Vakis et al.
To generate revenues, a firm will need to select quantities of milk to sell under each of the
coordination mechanisms. Let the total amount of milk sold be Q, such that the firm is able to
select or allocate various quantities or volumes of milk to sell under each of the coordination
mechanisms. A firm may sell all its milk under spot market contracts, under verbal contracts
or under written agreements or allocate partial volumes under each of the coordination

THEORETICAL AND EMPIRICAL MODEL
82
arrangements. Let the volume of milk handled or sold under each of the coordination
mechanism be Qj. Furthermore, let the transformation costs be represented by C, proportional
transaction costs by Pj, fixed transaction costs by Fj and finally TR as the total revenues
received by the agent or firm. Assuming that all agents are rational, net revenue maximization
(П) can be found by choosing the volume (Qj ) to be obtained under each contractual form j to
maximize
23........................................................................................).........;,,,,( jjjj zPFQCTRf=Π
such that
QQj
j =∑
and
0≥jQ
where TR are the gross revenues derived under each coordination mechanism, C are the
transformation costs, Qj is the quantity sold under coordination j, Fj are the fixed transaction
costs under coordination j, Pj are the proportional transaction costs under coordination j and zj
are the relevant individual socioeconomic and firm specific characteristics that also affect the
net revenues derived under each coordination mechanism.
Fixed transaction costs relate to searching for the best market and buyer or obtaining
information about prices. In addition, they are invariant to the specific quantity sold and may
also be market or transaction specific. For example, knowledge of market specific attributes
such as prices and relevant infrastructure (that could potentially affect the probability of
finding a buyer) can influence the decision of a farm enterprise or trader as to where to sell
and how to sell it. On the other hand, proportional transaction costs vary with the number or
value of transactions undertaken. Such transaction costs include transport costs and time taken
to reach markets or buyers.
Socioeconomic characteristics such as experience, education, gender and age could also
enhance the ability to collect and analyze relevant information and thus can affect choice of
coordination mechanisms. The type of supply chain partner (and their relations) and the
location or region where the sellers and buyers are located may also affect what kinds of
coordination mechanisms may be used in the transactions. The benefits derived from a
particular coordination mechanism also depend on the quantity sold (qj) in addition to the
above factors since the scale of operation influences bargaining related attributes.

THEORETICAL AND EMPIRICAL MODEL
83
Assuming that farmers and milk traders are risk neutral, they will undertake their market
transactions under coordination mechanisms that yield the highest net revenues ( jΠ ), subject
to transaction costs they face, their socioeconomic characteristics and their firm specific
characteristics. Thus the net revenues represent revenues net of fixed transaction costs which
may not be quantifiable. Specifically a transaction will be carried out by farmers and traders
using a coordination mechanism j which maximizes the following net revenue function:
{ } 24...............................................................................)(max jjjjjj zFPCTR −−−=∏
represented in proportional transaction costs are distance and time costs assumed vary with
quantities bought or sold while fixed transaction costs include information and search cost
components, negotiation cost components and, monitoring and enforcement cost components.
The coordination mechanisms used vary from j to k. The components entering the model are
allowed to vary for each transaction relation between the producers and buyers, traders and
suppliers and traders and buyers, that is, for each stage of the supply chain. The type and
number of coordination mechanisms are also allowed to vary under each of the three stages in
the supply chain. Since farmers and milk traders are assumed to be risk neutral and as such
strive to maximize their net revenues subject to transaction costs and other resource
constraints, observing transaction i under coordination mechanism j implies:
25............................................................................................................., kjikij ≠∀Π>Π
That is, coordination mechanism j is observed if and only if j∏ > k∏ . However, the net
revenues associated with each coordination mechanism may not be directly observable but
can be represented by their latent profits, *ij∏ , such that the chosen coordination mechanism
represent the maximum possible latent net revenues available to the transacting partners.
5.4 Specification of the econometric model
The econometric specification follows a multinomial logistic regression given the nature of
the issues under consideration. The use of a particular coordination mechanism is choice
based, in that agents can opt to use one coordination mechanism based on the perceived
benefits that can be derived from using it. The values of interest are discrete in nature. Three
coordination mechanisms are possible in the milk supply chain: spot market contracts, verbal
contracts and written contracts. However, when only two choices are available, the
multinomial logit model collapses to a binomial logit model.
THEORETICAL AND EMPIRICAL MODEL
84
5.4.1 The multinomial logit model
Essentially the multinomial logit model (MNL) only deals with individual specific data,
which means that the values of the independent variables are assumed to be constant among
all alternatives in the choice set (Maddala 1983, Wooldridge, 2002). A general formalization
of the MNL according to Schmidt and Strauss (1975) is:
26...................................................................................,....,2,1,1
)Pr( '
'
Jjee
ejY
ik
ij
w
w
=+
==∑ β
β
27........................................................................................................1
1)0Pr( '
∑+==
ik wee
Yβ
The estimated equations lead to a set of probabilities for J+1 choices for a decision maker
with the vector wi describing each individual transaction characteristics and the vector of
coefficients ßj associated with the jth coordination category. Normalization is achieved by
setting ß0 = 0. We thus obtain a vector ßj for each probability except for the first which is the
normalized alternative. The estimated coefficients of the model can therefore be interpreted as
the effect of the characteristics wi on the probability of an alternative j relative to the chosen
option (John and Weitz, 1988 in Boger, 2001a).
Thus the probability of choosing alternative j, if one were to define it, would either be one or
zero depending on the relative profitability of alternative j (Train, 1993) subject to perceived
opportunistic behavior of transacting partners captured in transaction cost related factors, firm
specific factors and socioeconomic characteristics. Since the possible coordination
mechanisms are more than two, the model can be estimated using multinomial logistic
regression. The model parameters are estimated by the maximum likelihood estimation. The
dependent variable need not be normally distributed under the maximum likelihood
estimation since the estimates remain consistent.
The empirical model for the study can thus be summarized as follows.
28................................................................................................*ikkikiik WX εφβ ++=∏
where *ik∏ are the latent net revenues from transaction i under each coordination mechanism j,
iX is a vector of transaction cost characteristics, iW are socioeconomic and firm related
attributes of the operators, βk and kφ are parameters to be estimated, and εik are iid. error
terms.

THEORETICAL AND EMPIRICAL MODEL
85
The estimated coefficients give the role of transaction costs, farmer and trader socioeconomic
characteristics and firm specific factors in selecting the coordination mechanism to guide
transactions among buyers and sellers of milk.
For a better interpretation of the outcomes, marginal effects are computed by differentiating
the coefficients at their mean. The marginal effects of the attributes on the probability of
observing the coordination mechanisms are therefore represented as:
[ ] [ ] 29.................................................................................................ββββδ −=−= ∑ jjlljjj
PPP
5.4.2 Model justification
The model adopted for analyzing coordination mechanisms in the fresh milk supply chains is
determined by theoretical and practical data constraints. The determinants of coordination
mechanisms employed are largely individual specific, individual here referring to the unit of
analysis, the transaction, based on transaction cost economics and supply chain management
frameworks. The alternatives may also not be fully independent of each other under the
independent of irrelevant alternatives (IIA) assumptions. This implies that there is a
possibility of employing more than one coordination mechanism by the decision makers at the
same time, however, this should present no problem as each transaction is analyzed
independently. The focus is not the individual decision maker rather the transactions that the
individual undertakes. It is possible that some choice specific attributes also influence the type
of coordination mechanism employed, implying that a nested logit model would be more
appropriate. In carrying out the transactions, three types of coordination mechanisms are
possible, spot market contracts, verbal contracts and written contracts. However, a fourth
mechanism comprising of hybrids between any two of the coordination mechanisms is
possible in the transactions. But for the purpose of analysis, whenever more than two
coordination mechanisms are observed, the transaction is classified according to which
coordination had the larger amount of milk transacted under it. Sampling results showed that
less than 1% of the transactions consisted of hybrid coordination mechanism, a negligible
number of transactions. The inability to get information on the coordination mechanisms not
observed or not employed rules out the use of nested logit models or conditional logit models.
Such information on unobserved alternatives is normally difficult to get from the decision
makers (Boger, 2001a; Benham and Benham, 2000). The nested model does not also allow for
varying of individual choice sets as it assumes the dependence of alternatives. For these
reasons, nested and conditional logit model are not employed in this study.

THEORETICAL AND EMPIRICAL MODEL
86
A natural alternative to the nested logit model is the multivariate probit model (Greene, 2003;
McFadden, 1984). However, this model would require two simultaneous equations of
binomial choices. Such a model can be achieved by a multinomial logit model. The
multinomial logit model measures the probability with which the individual will choose one
of the three coordination alternatives for a particular transaction given a set of socioeconomic,
firm specific factors and transaction cost characteristics. The multinomial logit model
provides estimated coefficients of the variables of each alternative so that distinctive criteria
typifying the alternatives can be obtained for each contractual form. The large number of
coefficients associated with the number of choices is a desirable advantage due to detailed
information on the single alternatives (Boger, 2001a).
Since the MNL model assumes individual characteristics as independent variables and not
choice specific attributes, this model specification is only feasible from the perspective of the
transaction, not of the individual who carries out the transaction. In essence the interpretation
of the results is not about the probability of an individual using a certain coordination
mechanism, rather the probability of a transaction being carried out with one of the
coordination mechanisms (Boger, 2001a). Three models are estimated for transactions
between milk producers and their buyers, retail outlets and their milk suppliers and retail
outlets and their milk buyers.
5.5 Empirical specification of determinants of coordination mechanisms
Three coordination types are identified, spot market contracts, verbal contracts and written
contracts. The three coordination modes constitute a part of Milgrom and Roberts’ (1992) six
part coordination continuum. Milgrom and Roberts define spot market contracts as a contract
for exchange of goods and services at current prices without bothering with the identity of the
parties. Verbal contracts are termed as relational bilateral contracts or implicit contracts and
are basically non written and legally non enforceable. They are characterized by repeated
transactions with the same agents. Formal or written contracts on the other hand are
enforceable by law being sets of promises that define each party’s obligations. These three
have been identified to be extensively used in milk supply chains in Kenya. It is hypothesized
that the kind of coordination mechanism employed is determined by certain socioeconomic
characteristics, certain firm or enterprise specific characteristics and various transaction cost
components. Each mode of coordination is identified by the proportion of milk sold through
it.

THEORETICAL AND EMPIRICAL MODEL
87
5.5.1 Household and individual characteristics
According to Zaibet and Dunn (1998), certain household characteristics impinge on
transaction costs. Zaibet and Dunn consider these household characteristics as endogenous or
internal transaction costs. They indirectly impact on the level of transaction costs that a
household faces. Family size is shown to have influence on the level of transaction costs,
such that larger or extended families are likely to be associated with higher transaction costs.
However, other household related factors independent of family size play an important role in
moderating or influencing the transaction costs. Such characteristics may include education
level of farm/firm operators, their experience and gender.
The gender of the operator affects the level of transaction costs. Females have been found to
face more transaction costs compared to male operators or male headed households (Makhura
et al, 2001; Udry, 1996; and Pingali et al, 2005). If we let the coordination mechanisms to
vary on a continuum from less coordination (that is spot market contracts) on one end and
more coordination (written contracts) on the other end with verbal contracts falling in
between, it is hypothesized that female headed operations will employ more coordinated
transactions compared to their male operated counterparts. Female operators are more likely
to perceive higher transaction costs than male operators. Conversely, it is hypothesized that
male headed operations are more likely to use spot market contracts than their female
counterparts.
Age of the operators also influence the level of transaction costs. Age has been used as a
measure of experience especially for operations that have been continuing over time. Higher
experience makes certain information and search costs easier or cheaper (Pingali et al, 2005).
This implies that older farm or enterprise operators face lower transaction costs than younger
operators. Over time, operators set up business relations based on trust and or reputation
which becomes a valuable asset (social capital) in their activities. Older operators are
therefore likely to be more involved in relational based transactions than spot market
contracts. Conversely it is hypothesized that younger operators will employ more spot market
contracts due to their low relational asset specificities or social capital. Lack of stable
transacting partners implies that younger operators face more transaction costs in the market
and this will be associated with the use of spot market contracts.
There are, however, exceptions to using age as a measure of experience. A case in point is
liberalization efforts in many developing countries in the last two decades that led to a
breakdown of existing relations and institutions and setting up of new institutions and new
agents entering the industry. In this case the link between age and experience may not be

THEORETICAL AND EMPIRICAL MODEL
88
obvious. For example at the retail and processing levels of the Kenyan milk supply chain,
many traders and processing firms have come up after liberalization meaning that most of the
participants are new in their enterprises. In this case experience measured by the number of
years since the enterprise begun would be more appropriate to use. At the production level,
the changes were not very drastic in terms of new entrants, except in the number and types of
milk buyers. In general however, the higher the experience of the operator, the more likely it
is that the operator will use relational based contracts rather than spot market contracts. Lower
enterprise experience is likely to be associated with spot market contracts and to some extent
written contracts.
Another socioeconomic characteristic is the educational level of the operator (Boger, 2001a).
Education increases the efficiency of searching for and processing information. Thus
information costs are likely to be lower for more educated operators (Pingali, 2005; Makhura
et al, 2001). The ability to evaluate more information about a transaction means that the
problem of bounded rationality is lower for more educated operators. More educated
operators are likely to be less averse to explicit contracts such as written contracts due to
higher information access in the market. It is therefore hypothesized that higher education
levels increase the likelihood that the transaction will carried out using written contracts.
Higher education level is also likely to lead to more usage of spot market contracts due to
better information search, and processing ability and, communication. Educational level and
experience are inversely related in that more educated operators are likely to have operated
their enterprises for shorter periods than less educated operators of the same age.
5.5.2 Firm specific characteristics
Besides socioeconomic characteristics, other important variables likely to be associated with
the governance structures are firm specific factors. Such characteristics include firm sizes in
terms of level of quantity of product handled or produced, type of enterprise, stage in the
supply chain and location of enterprise. The quantity of milk handled by a firm can be used as
an indicator of its size. Firm size has been measured in terms of land size for arable crops
(Makhura et al, 2001; Boger, 2001a). Larger firms are expected to employ more relational
coordination mechanisms rather than spot market contracts. The reason could be the larger
quantity of product handled requires more certainty in the market. Fresh milk shows high
temporal asset specificity and transaction costs can easily rise when the operator is exposed to
the spot markets. To avoid possible losses, operators opt for coordination mechanisms that
ensure that their milk is sold as fast as possible. The likelihood of the price being bargained

THEORETICAL AND EMPIRICAL MODEL
89
down or the failure to secure a market for the milk rises when the quantity available for sell is
large. Larger milk producers and traders are easily left exposed to opportunistic tendencies
from other traders or buyers, especially from partners that have not made complementary
investments. Large firms are as a consequence likely to adopt either written contracts to
safeguard their investments or use spot market contracts to ensure fast sales in the absence of
safeguards.
Pingali et al (2005) point out that location specific factors are also associated with differential
transaction costs. This means that firms located in one region are likely face higher or lower
transaction costs than other firms located in a different region. The reason for this may be
infrastructural or simply historical in nature. In this study, two regions were investigated:
Nakuru district and Nyandarua districts. Nyandarua district suffers from poor road and
communication infrastructure relative to Nakuru district despite being a high potential district.
Historically, Nyandarua was formerly served by a good network of cooperatives and good
processing facilities from the only milk processing firm in the country at the time (Kenya
Cooperative Creameries) before liberalization of the industry most of which later collapsed
and left the dairy industry disorganized as a consequent of liberalization. In this transition
period, households and individuals in Nyandarua district face more transaction costs as they
try to realign their transactions and institutions. Lack of suitable institutions in Nyandarua
implies that spot market contracts are likely to persist relative to Nakuru district.
The length of the supply chain can be captured by the number of distinct stages the milk goes
through before it finally reaches the consumer. Farmers can sell milk directly to consumers, to
traders, to farmer cooperative organizations or directly to the processing firms. Direct sales to
consumers constitute short supply chains (part of the warm chain) while sales to processing
firms constitute long supply chains (cold chain). Iyengar (2005) finds that the length of the
supply chain is inversely related to the level of transaction costs faced. Thus short supply
chains are a reflection of the prevalence of high levels of transaction costs and the converse is
true for long supply chains. Short supply chains are expected to use spot market contracts and
verbal contracts, while long supply chains are expected to use both spot market contracts and
written contracts. However, exceptions are likely to arise in the presence of social capital
among the transacting partners.
5.5.3 Transaction cost specific characteristics
Besides the above socioeconomic and firm specific factors, transaction cost characteristics are
also hypothesized to affect the type of coordination mechanisms employed by agents in the
THEORETICAL AND EMPIRICAL MODEL
90
milk supply chains. Based on Hobbs’ (1997) classification of transaction costs into
information and search costs, negotiation and monitoring costs, the hypothesized relationships
are discussed below. The classification can also be seen in the light of ex-ante and ex-post
transaction costs. Ex- ante transaction costs are those that are observed or determined before a
transaction takes place and are generally represented by information and market search costs.
On the other hand, ex post transaction costs are those that are observed after a particular
transaction has been carried out and are represented by monitoring costs. Negotiation costs
occur when the transaction is actually being carried out. Transaction cost characteristics
constitute one category of the independent variables in the study. The three components of
transaction costs are further discussed below.
Information and market search costs
One of the factors influencing transaction costs is uncertainty in the markets. High levels of
uncertainties are likely to lead to high transaction costs. Uncertainties arise from imperfect
market information on prices of outputs and inputs. Information costs include the time spent
discovering information on price, potential partners and the resources used to acquire this
information (Coase, 1937: Williamson, 1985; Gabre-madhini, 2001). Being located in remote
areas or far away from markets will require more efforts at discovering market prices and
customers. More resources in terms of money and time are required to search for such
information and markets in distant markets compared to nearby markets. Transaction costs are
therefore likely to increase with the remoteness of an operator from markets. It may also be
difficult to establish closer relations among the transacting parties due to low knowledge
about potential transacting partners. Consequently it is hypothesized that explicit contracts
will prevail with longer distances between the sellers and the buyers. It is also hypothesized
that the transactions are also likely to remain at arms length (spot market contracts) for those
not able to initiate explicit contracts.
Related to distance, is the average time required to travel between the seller and the buyer
(Vakis et al, 2003; Winter-Nelson and Temu, 2005). Travel time is determined by the
condition (quality) of the available road infrastructure besides plain distances between sellers
and buyers. It also depends on the means of transport used for traveling and transporting the
milk products, which is a function of the parties’ asset endowments and scale of operation.
When the road infrastructure is good for all transacting parties, the effect of distance is likely
to be minimal. On the other hand, shorter distances with poor road infrastructure may have
bigger influence on marketing decisions of the agents concerned. In such a case, the time

THEORETICAL AND EMPIRICAL MODEL
91
required to travel between the sellers and the buyers is a better measure of the difficult of
accessing the market compared to plain distance measures. It is therefore expected that the
time required to reach buyers or sellers will be directly associated with transaction costs.
Consequently spot market contracts and written contracts are likely to prevail with increases
in the time needed to reach the markets. Shorter travel times to market favor use of verbal
contracts.
In addition to the above items, transport costs (Hobbs 1997; Omamo, 1998) are used to
capture some of the bargaining costs in the market. Transport costs depend on the distance
and or the means of transport. The means of transport commonly used by the parties to
transport milk products are on foot, by animal drawn carts, by bicycle or motor vehicle. The
costs of transporting milk on foot, bicycle, or on carts are difficult to discern or quantify and
may not be proportional to distances between the sellers and buyers. Milk transactions are
also not wholly carried out at one market point or outlet. Estimates of transport costs to such
market points are likely to be very unreliable, especially when in combination with the diverse
means of transportation used. Difficulties in transportation are therefore better described by
distances between the partners and time taken to reach the partners.
Market search costs are also measured by the time taken to sell the milk products in
possession of the agents concerned. Vakis et al (2003) and Hobbs (1997) have used various
measures to capture the time required to sell agricultural products in the market. For the case
of milk, this refers to how long it takes the seller on average to sell the milk products before
they expire or get spoiled. In the presence of difficulties to sell the milk, sellers will spend
more effort, time and money searching for alternative buyers which increases transaction
costs. Relational coordination mechanisms are more likely to be used to reduce this problem.
Higher costs will be incurred when it takes longer to close the sales. Longer times to sell milk
will be associated with spot market contracts and to some extent written contracts. Low times
to sell the milk will be associated with verbal contracts. The type of coordination mechanism
used will be however moderated by the distances between the transacting agents and social
capital considerations.
The ease with which a buyer can be found and a price agreed on in advance has also been
used to estimate information and search costs in the market (Vakis et al, 2003; Hobbs, 1997).
Knowledge of prices in advance of a transaction reduces search costs. Uncertainties in prices
cause sellers and buyers to exert more efforts and time to get the price information. This may
discourage some parties from the market. Ability to determine price information in advance of

THEORETICAL AND EMPIRICAL MODEL
92
the transactions increases the likelihood of using verbal and written contracts in the
transactions. Inability to determine market prices in advance is likely to be associated with
usage of spot market contracts.
Related to information search is the importance of various sources of market information to
the transaction parties. The source of price information provides an indicator on the ease of
information flow and exchange between the transacting parties. Price information sources
could be public such as by state organs, mass media or private such as from other transacting
parties (traders or producers). Public information sources are likely to favor use of spot
market contracts. On the other hand private sources of price information are likely to favor
use of relational based coordination mechanisms. This is because public price information
improves the market for all participants and reduces opportunistic tendencies and the problem
of private information.
Measures of bargaining/negotiation costs
These are costs that arise while transactions are actually taking place. The costs depend on the
ease and time taken to reach an agreement between and among those engaged in the
negotiating activity. Boger (2001a) uses price to distinguish between contractual
arrangements. The average price received or paid is expected to be inversely proportional to
the transaction costs involved. For sellers, transaction costs will be reflected in lower prices
which they receive due to high transaction costs (Key et al, 2000). For buyers, it will be
reflected in the higher prices which they pay for the products. Thus the effect of transaction
costs is to squeeze margins for all transacting parties. Higher bargaining costs will lead to
lower prices received. For the sellers, high prices are likely to be associated with spot or
verbal contracts while lower prices are likely to be associated with written contracts reflecting
the presence or absence of transaction safeguards. For the buyers, high prices are associated
with verbal and written contracts and lower prices will be associated with spot market
contracts.
Related to prices received or paid is the coefficient of variation of prices (Vakis et al, 2003).
Price variation captures the difference between the highest and lowest prices for the product
over the latest year or the ending 12 month period. Higher variations in the prices are
therefore a reflection of the seasonal nature of production as well as transaction costs inherent
in the transactions. It is hypothesized that higher price variations are associated with the use
of spot market contracts. Low variations in milk prices on the other hand are be associated
with verbal and written contracts. However, this variable was not used in this study.

THEORETICAL AND EMPIRICAL MODEL
93
The number of buyers in the market provides an indication of market access and consequently
the ease of getting buyers for the milk products. The presence of a large number of buyers
reduces the costs of negotiating in the market. Producers are usually large in number while
buyers (not consumers) are usually fewer and larger. The probability of conducting
transactions using spot market contracts increases with increases in the number of buyers.
Higher buyer availability will therefore be associated with verbal and written contracts with
difficulties in finding buyers being associated with spot market contracts.
Monitoring and enforcement costs (ex post costs)
Monitoring may be necessary once the transaction or contract has been entered into to ensure
compliance by all or both parties to the transaction. Monitoring costs arise because of
problems of information asymmetry that result in moral hazards and opportunistic tendencies
among transacting parties. The efforts put in to ensure compliance with the terms of the
transaction depend on the perception of the likelihood of opportunistic tendencies. Various
measures have been used to represent monitoring costs. Hobbs (1997) uses quality uncertainty
and shrinkage losses to represent monitoring costs. Vakis et al (2003) use trust levels in the
buyers, time to get paid and extent of the importance of signed agreements among the
transacting parties.
The time taken to get paid is reflected in the credit transactions. For cash sales, monitoring
costs will be negligible. For credit sales however, associated default risks emerge leading to
monitoring efforts designed to check likely defaults in payments. The duration of credit
period can vary from zero (for spot cash payments) to over 30 days. It is thus hypothesized
that since longer credit periods require more monitoring to ensure compliance, relational
based coordination mechanisms are necessary to provide the required safeguards. These are
governance structures that are likely to minimize the possible monitoring costs that may arise
from the credit transactions.
The presence or absence of signed agreements (legal contracts) also indicates the extent to
which monitoring costs influence the transacting parties. Higher importance is likely to be
attached to signed agreements when transactions are carried out under relational based
coordination mechanism as opposed to spot market contracts. Furthermore, higher levels of
trust, reputation or reliability among transacting partners are likely to be associated with
relational based coordination mechanism rather than spot market contracts. The relations
above are summarized in the diagram 5.2 below.

THEORETICAL AND EMPIRICAL MODEL
94
Direction of causation
Figure 5.2: The conceptual model
Source: Own conceptualization, 2006
5.6 Determinants of supply chain performance
5.6.1 Supply chain performance measurement
The next issue the study addresses is the relationship between socioeconomic characteristics,
firm specific factors, transaction cost factors, coordination mechanisms, and performance in
the Kenyan fresh milk supply chains. Most studies on performance have focused on single
firms/households emphasizing internal efficiency over external effectiveness. There is a
Coordination mechanisms
- spot market contracts - verbal contracts - written contracts
Socioeconomic
characteristics
- gender - age - schooling
years - enteprise
Firm specifc factorrs - location of
enterprise - size of firm - type of firm - type of supply
chain (partner)
Transactiopn cost
characteristics
- market search costs
- negotiation costs
- monitoring costs
Supply chain performance
- satisfaction with quantities handled - satisfaction with buyer prices - satisfaction with information and communication - satisfaction with milk quality - satisfaction with buyer reputation - satisfaction with buyer trustworthiness

THEORETICAL AND EMPIRICAL MODEL
95
limited availability of multi firm performance measures and in addition performance has not
been linked directly to transaction costs in the studies undertaken. Industry structure has been
the main focus in performance related studies; however the changes that have been taking
place in the economies call for a review of the structural paradigm, especially in developing
countries. Competition is changing from single firm competition to chain competition. This
study therefore takes a holistic approach to the supply chain by investigating the determinants
of supply chain performance in Kenya.
Performance in agricultural markets has frequently been evaluated based on the industrial
organization model, the S-C-P model (Scherer, 1970; Shepherd, 1979; and Debrah and
Anteneh, 1991). The model examines the causal relationships between market structure,
conduct and performance, and is usually referred to as the S-C-P (structure, conduct,
performance) model. However, empirical applications of the model in the presence of
imperfect markets show some deficiencies, especially for developing markets whose markets
are far from imperfect or are missing. Kriesberg (1986) in Jabbar et al (1997) proposes a more
appropriate model for the less developed countries as an alternative to the S-C-P model.
Kriesberg’s model differentiates between marketing efficiency and marketing effectiveness as
performance measures. Marketing efficiency is related to the amount or cost of inputs
required to obtain a given level of output, and is measured by input to output or, cost to
benefit ratios. For instance, a change which reduces input costs without reducing consumer
services or satisfaction would be considered as raising efficiency. Marketing effectiveness is
viewed in terms of the objectives set for the marketing system (for example, higher net prices
to producers or movements of larger quantities of goods at reasonable cost to urban
producers). It is thus measured in terms of objectives and depends on comparisons between
alternative supply chains or channels, enterprises, or even countries with similar
developmental conditions. Marketing efficiency and effectiveness have essentially the same
meaning if the objectives sought are the same. Market performance is then evaluated by how
well the process of marketing is carried out and how successfully its aims are accomplished
(Jabbar et al, 1997).
Further attempts at evaluating performance while recognizing the importance of transaction
relationships (both vertical and horizontal market relations) among categories of firms within
the marketing system have been made by French (1977) cited in Jabbar et al, 1997) and,
Scarborough and Kydd, (1992). This extended approach is known as the 'food or commodity
system framework' (Schaffer, 1973 and 1980 in Jabbar et al, 1997) and is similar to French’s
concept of "filiére", which means a commodity production and marketing chain. Furthermore,

THEORETICAL AND EMPIRICAL MODEL
96
this approach recognizes the importance of joint products and services, and the existence of
marketing firms and channels that handle a number of commodities or services using the same
facilities.
An alternative theory to the above is based on market organization incorporating transaction
cost and information theories. In these theories, markets, firms, relational contracts, vertical
integration, groups and associations are regarded as different forms of organization ruling
transactions implying that market is just one form of organization in the process of
transaction. Non-price relationships in transactions are given particular importance in these
theories. There are few empirical applications of these theories in the less developed
countries, particularly in the area of food marketing. Moustier (1996) in Jabbar et al (1997)
gives a good review of the conceptual differences among the strands of organization theory,
and applies the theory to a study of vegetable market organization in Brazzaville.
Theoretical developments in transaction cost economics are based on the premise that many
factors that affect the operations of the agents in the market are hardly completely measurable
but are important enough to determine whether a transaction succeeds in the market or not in
the market. Therefore other criteria apart from quantitative measures have to be included in
the assessment of the performance of transactions in the market.
The primary interest in evaluating performance in agricultural markets is to assess the impacts
of marketing inefficiencies on consumer and producer prices, on levels of production and
consumption by all agents in the supply chain. Thus evaluating performance in supply chains
goes beyond the price effects to address the relationships among the transacting agents (Whan
and Suh, 2004; Mentzer et al, 2001; Hobbs, 1996). The concept of supply chain management
and the role of transaction costs in determining performance in the supply chains are yet to be
well addressed for developing markets. Furthermore an appreciation of the fact that
performance of individual agents is tied to the performance of the entire system of agents in
the supply chain has yet to be fully evaluated for agricultural supply chains in these countries.
Another challenge is provided by the available measures of performance which show that
there is a limited availability of multi firm performance measures and, in addition
performance has not been linked directly to transaction costs in many of the works. This study
attempts to fill this gap for developing markets.
The study adopts various measures of supply chain performance that have been used in
previous studies and computes a score on the measures to represent the level of performance
attained in the supply chain transactions. Venkatraman and Ramanujan (1987) make use of

THEORETICAL AND EMPIRICAL MODEL
97
subjective performance measures as proxies for measuring performance in supply chains and
notes that the subjective measures give results similar to their quantitative counterparts. Their
findings are particularly useful since standardized performance measures and especially at the
chain level are not yet available. In this case, composite measures of performance
incorporating measures subjectively derived from the respondents as well as financial
measures where available are used. Supply chain performance in this study was measured by
the extent to which the agents were satisfied with various aspects of their transactions with
their partners Performance was therefore represented by five key measures of performance
that included satisfaction with prices offered, quantities of milk handled, information and
communications, quality of milk, and the agents’ reputation and trustworthiness.
The study hypothesizes that performance in the supply chains is influenced by transaction cost
characteristics, coordination mechanisms, the socioeconomic characteristics and firm specific
factors. Thus in addition to the factors influencing coordination mechanisms discussed in
section 5.5 above, the level of performance attained in the supply chains is also influenced by
the type of coordination mechanisms employed. The type of coordination mechanisms used
provides an indicator of whether the relationship between the transacting parties is close or at
arms length. Verbal and to some extent written contracts represent closer transaction relations
than spot market contracts. Verbal and written contracts are therefore an attempt at
relationship building in the supply chains. Relationships in the supply chain are manifested
through long term ties and size and number of transacting partners. Low levels of transaction
costs are expected in relational based coordination mechanisms, which are consequently
expected to show higher performance levels compared to spot market contracts.
5.6.2 A theoretical model for determinants of supply chain performance
This section focuses on developing a theoretical model for the determinants of supply chain
performance in the fresh milk supply chains. Performance relations are investigated in
transactions between milk producers and their buyers and milk traders and their customers.
Trader transactions constitute upstream transaction activities with their milk suppliers and
downstream transactions with their milk buyers. The two types of upstream and downstream
trader transactions are analyzed separately.
In carrying out their transactions, market participating milk producers and traders make
decisions regarding who to sell their milk to and what volumes of milk to sell to them. The
decision regarding the transaction partners and quantities of milk to transact with them
depends on the satisfaction or performance they expect to derive from the transactions, which
THEORETICAL AND EMPIRICAL MODEL
98
is equivalent to maximization of their expected utility. The agents therefore strive to
maximize an objective function, in this case, maximization of expected utility. The agents are
assumed to be risk neutral and therefore prefer higher performance levels to lower
performance levels. The expected utility can be expressed in form of net revenues derived
from the transactions by allocating quantities of milk to the available transaction partners.
High satisfaction results when the objective function is realized or closely mirrors the actual
results. On the other hand, low satisfaction results when the objective function is not
achieved. The attainment of the objective function can be calibrated on a continuous scale that
captures the extent to which the agents have been able to achieve their objectives.
The net revenues attained by the agents is however constrained by various factors that
include socioeconomic characteristics, firm specific factors, transaction costs faced as well as
coordination mechanisms used. The agents also face certain production constraints in
transforming their products in readiness for the market, which can be represented by the
inputs they use for farmers and purchase of milk for resale in the case of traders. Assuming
the traders and milk producers are risk neutral and therefore maximize expected profits, the
objective function in light of the constraints can be expressed as:
30...........................................................................................].........'),([ CICZPQEMaxt −=
where E is the expectation operator given the constraints facing the milk producers and
traders in the market, P is the output price, Q is the output expected to be transacted in the
market, C is a column of vector production inputs, I is a column vector of input prices(cost of
purchased milk), and Z is a vector of the agents’ socioeconomic characteristics, location, firm
specific attributes, coordination mechanisms, and transaction cost characteristics. The net
revenues π attained by the agents can be expressed as a function of the constraints facing the
agents as follows:
31..............................................................................................................).........,,,( IZPππ =
implying that the net revenues attained are a function of the output and input prices as well as
socioeconomic characteristics, firm specific factors, transaction cost characteristics and
coordination mechanisms used. The relationship between the net returns and the constraining
factors can be expressed in stacked form as:
32........................................................................................................................,ey +Χ= β
with y representing the objective function (net revenue), X representing the constraining
THEORETICAL AND EMPIRICAL MODEL
99
factors, ß representing the coefficients for the determinants of performance and e expressing
the effect of unobservable factors.
However, since the net profits attained cannot be observed, they can be considered as a latent
function of the explanatory factors. What is observed is an ordinal measure of the level of
performance attained by the agents, which is assumed to be a continuous function of the
factors determining it. Let the observed performance level be represented by y*. y* is an
ordinal measure of the satisfaction level derived from the transaction. Let the y* indicate the
disposition to the state of affairs of the agent’s transaction with his partners such that the
higher the value of y*, the more favorably disposed the agent is to the transaction.
We assume that y* is fully known to the parties transacting themselves and independent
among the transactions entered into and that y* is a linear combination of the observed and
unobserved characteristics determining it, so that
33.......................................................................................................................,* ey +Χ= β
where y* is an ordinal measure depicting the level of performance in the transaction, X is the
vector of the observed factors influencing the level of performance (socioeconomic, firm
specific, transaction cost and coordination mechanism used), and e reflects the net influence
of unobserved factors on y*, and ß is the vector of the coefficients.
5.6.3 An Ordered Probit model for determinants of supply chain performance
Unlike coordination mechanisms that are considered to be discrete in nature, evaluating
performance involves ordered responses. The study seeks to evaluate the determinants of
supply chain performance and the extent to which these determinants impact of the
performance level achieved by the parties in the milk supply chain transactions. To capture
the ordinal nature of the responses, an ordered probit model is used to analyze the data for the
transactions between milk producers and their buyers, between traders and their suppliers and
between the traders and their downstream customers. Probit models use the inverse of the
standard normal cumulative distribution function and assume the categorical dependent
reflects an underlying quantitative variable. Unlike the multinomial logit models which ignore
ordering of the responses, ordered probit models make use of the extra information contained
in the ordering of the responses. The ordered probit model can be derived as follows:
Let y be the ordered response taking the values 0,1,2. The ordered probit is derived from a
latent variable, y*, such that

THEORETICAL AND EMPIRICAL MODEL
100
34.........................................................................................)1,0(~,* Normaleey Χ+Χ= β
Let α be the unknown cut off points such that 21 αα < , and define
35....................................................................................................
*2
*1
*0
2
21
1
>
≤<
≤
=
α
αα
α
yif
yif
yif
yT
The response variables vary as follows: 0 for low performance, 1 for moderate performance
and, to 2 for high performance. The error term is assumed to be normally distributed,
therefore the probability of observing a performance level for a transaction given X is
represented as follows:
36...................................................................).........(1)*(Pr()2Pr(
)()()*Pr()1Pr(
)()Pr()*Pr()0Pr(
22
122
111
βαα
βαβαα
βααβα
Χ−Φ−=Χ>=Χ=
Χ−Φ−Χ−Φ=Χ≤=Χ=
Χ−Φ=Χ≤+=Χ≤=Χ=
yy
yy
exyy
where Ф (.) is the cumulative standard normal distribution function and βΧ is the probit
score or index.
Thus the distribution gives the probability that in transaction n the performance or likelihood
of being satisfied with the transaction is high or low.
The model collapses to a binary probit model when J =1 such that
37..............................................)()(1)0Pr(1)1Pr( 11 αββα −ΧΦ=Χ−Φ−=Χ=−=Χ= yy
The parameters of the probit model can be estimated by the maximum likelihood methods.
The log likelihood function for the model becomes
[ ] [ ] [ ] [ ]
[ ] [ ] 38.................................................................)(1log21
)()(log11)(log01),(
2
121
βα
βαβαβαβα
tt
tttttt
y
yy
Χ−Φ−=
+Χ−Φ−Χ−Φ=+Χ−Φ==l
The probit model can thus be expressed in brief as
Pr(y=1|x) = Φ(xb)……………………………………………………………………….....39
The model is amenable to analysis with LIMDEP™ statistical software.

DATA DESCRIPTION
101
CHAPTER 6
DATA DESCRIPTION
The chapter discusses the operationalization of the determinants of coordination mechanisms
and supply chain performance in the fresh milk supply chains in Kenya and their sampling
results. The chapter draws on empirical studies on Transaction Cost Economics and Supply
Chain Management theories to operationalize the relationships among transaction costs,
operator socioeconomic characteristics, firm specific factors, and coordination mechanisms
and supply chain performance. The study focuses on the fresh milk supply chain transactions
in Kenya. The unit of analysis is the transaction between milk sellers and buyers. The supply
chain is analyzed at three levels: transactions between milk producers and their buyers,
transactions between milk retailers and their milk suppliers, and transactions between milk
retailers and their downstream customers. At the producer stage of the supply chain, milk
buyers include direct consumers, traders and processing firms. Sources of milk supplies for
the retail outlets include direct farm supplies and supplies from other milk traders. On the
other hand, customers of the retailers include direct consumers or users and milk processing
firms. In all these transactions, the modes of coordination were spot market contracts, verbal
contracts and written contracts.
The chapter is organized as follows. Section 6.1 presents the survey strategy that involves a
characterization of the survey area, sampling and data collection techniques and data
definitions. Section 6.2 presents a characterization of the types of transactions in the milk
supply chains. Section 6.3 presents a characterization of the coordination mechanisms used in
the milk transactions. Sections 6.4 to 6.6 presents a description of the factors influencing both
coordination mechanisms and performance in the milk supply chains. Finally section 6.7
presents sample results for the dependent variable in supply chain performance.
6.1 Survey strategy
6.1.1 Characteristics of the study area
The study covered Nyandarua and Nakuru districts of Kenya. Nyandarua district is in Central
Province while Nakuru district is in the Rift Valley Province but the two districts share
common borders with each other. There are differences in the two districts: Nakuru district
has population of about 1.5 million while Nyandarua district has about 0.5 million people.
Nakuru district has several urban areas and towns, which serve as captive markets for the milk
produced, but the biggest captive market is Nakuru town with about 300,000 people. Nakuru

DATA DESCRIPTION
102
town also receives milk from the northern parts of Nyandarua district. Nyandarua district is
mainly a rural district with very few urban areas and situated about 75 kilometers from
Nairobi city. Nairobi city with a population of about 3 million is a major market for the milk
produced in the two districts especially for processed milk.
Nyandarua is the leading milk producing district in the country, while Nakuru is considered
the third largest milk producer in the country. The two districts are characterized by some of
the highest concentration of dairying activities in the country ranging from production to
processing and to consumption. The dairying (feeding) system in Nakuru district is
characterized as semi intensive while that of Nyandarua district is characterized as extensive
system. The two districts thus constitute a fair representation of the dairy industry in the
country.
For sampling purposes, the districts were further divided according to administrative
divisions. Nakuru district has a total of 13 divisions while Nyandarua has six divisions. Four
divisions were selected from Nakuru district and two from Nyandarua district for inclusion in
the study. The divisions were selected based on their unique characteristics, which included
their geographical location, milk production levels and diversity of dairy activities. The
divisions selected were Nakuru Municipality, Bahati, Rongai and Molo divisions from
Nakuru district and North Kinangop and South Kinangop from Nyandarua district.
Nakuru Municipality was selected for its location that includes Nakuru town (population of
about 300,000 people) and has diverse dairying activities ranging from production, trading,
processing to consumption. Bahati division on the other hand is the leading milk producing
division in Nakuru district and has mostly small scale level milk enterprises and serves
Nakuru town and its environs. Rongai division is characterized by a mixture of large scale and
small scale milk production activities and also serves Nakuru town and a number of
processing firms elsewhere in the country. Molo division is situated farthest away from
Nakuru town and mostly comprises of Molo Township. Molo is generally a small scale
production area. It also receives milk from neighboring catchment divisions of Kamara,
Kuresoi and Elburgon.
Parts of Nyandarua district, especially the northern divisions have similar characteristics to
those of Bahati division of Nakuru district and were therefore not included in the study. South
Kinangop serves Nairobi city and other milk processors in the central Kenya region, and is
characterized by small scale milk production. North Kinangop on the other hand is situated
DATA DESCRIPTION
103
more than 100 km from Nairobi and is characterized as a large scale milk production area.
The two divisions are major producers of milk in Nyandarua district.
6.1.2 Sampling techniques
The population of interest constitutes commercial (market participating) dairy farmers and
intermediaries in the fresh milk supply chain in Nakuru district in Rift Valley Province and
Nyandarua district in Central Province of Kenya. The intermediaries include fresh milk retail
outlets (shops, milk bars, kiosks, mobile/itinerant traders, brokers and, mini dairies) and
farmer cooperative organizations (cooperative societies and farmer groups). Cross sectional
data was collected on the participants’ transactions at each of the supply chain levels
(production and retailing).
A listing of retail outlets was compiled from the local authority list of licensed retail outlets
and supplemented by on site visits at the market centers and along the major roads where they
were located. On site visits were necessary as some of the retail outlets were no longer in
operation. A listing of the dairy producers was not in existence therefore transects were
utilized to access and sample the milk producers.
After selecting the divisions of interest, smaller administrative units (sub-locations) were
randomly selected for inclusion in the study. At the producer level, a random sample of the
milk producers was achieved by means of transects sampling. Transects sampling was the
most optimal way of selecting milk producers as no sampling frame for milk producers was in
existence at the time of the study for both districts. The sampling was based on certain
landmarks or geographical features in the areas of interest. The starting point on the transect
line was randomly selected to reduce bias in sampling. All cooperative societies and farmer
groups were included in the study as their number was not large. However, stratified sampling
was used to select the traders for inclusion in the study. Traders and other intermediaries were
normally located in urban areas or market centers or at major road intersections. For the
mobile traders, simple random sampling was applied as the traders operated and traveled in
groups.
6.1.3 Data gathering methods
Data gathering was carried out by means of personally administered questionnaires. The
surveys were designed to collect data from the three different transaction types in the fresh
milk supply chain: transactions between milk producers and their buyers, transactions
DATA DESCRIPTION
104
between the milk traders and their suppliers, and transactions between the traders and their
buyers. The questionnaire was prepared using information derived from measurements
previously used by other researchers, the respondents’ recollection and their perceptions of
their transaction relationships. The main source of data was primary surveys where data was
collected on the coordination mechanisms employed, transaction costs characteristics,
socioeconomic characteristics of the operators and firm specific factors in the chains and,
extent of satisfaction with partner transactions. Constructs used to measure perceptions and
attitudes employed likert type scales. The surveys were supplemented by general background
information on the structure and operations of the dairy industry. The questions were adjusted
to reflect each stage of the supply chain. Before collecting data, a pre-test was carried out to
assess the appropriateness of the data collection instruments in order to increase the reliability
and validity of the instruments. A pilot study was further carried out using the refined
instruments on actual respondents leading to further refinement of the instrument and
constructs. Both pre test and pilot surveys were intended to pinpoint any feasibility problems
and, the suitability and relevancy of the instrument for the study’s objective. Necessary
adjustments were thereafter made on the instrument which was subsequently applied to the
commercial milk producers and milk traders.
6.1.4 Data and variable definitions
The definition of key variables is based on transaction cost economics predictions and supply
chain management theory. Use is made of proxy measures that represent the theoretical
measures. Several indicators of the theoretical measures have been used to capture the
different aspects of a theoretical measure. This is intended to minimize measurement errors.
The depended variables
The first dependent variable was coordination mechanisms used in the milk transactions. The
coordination mechanisms were measured by the proportion of milk transacted under each
coordination mode. Three coordination mechanisms were identified and included spot market
contracts, verbal contracts and the written contracts. The dependent variable for the second
model was supply chain performance and was measured by the extent to which the transaction
partners were satisfied with key aspects of their transactions. The key aspects included
satisfaction with quantities of milk handled, prices of milk, information flows and
communications, quality of milk, and reputation and trustworthiness of the partners. The
measures were represented by 3 point likert scales measuring the extent to which partners

DATA DESCRIPTION
105
were satisfied with each others’ transactions across key supply chain performance aspects. A
score was then computed to represent the overall performance levels in the transactions.
Explanatory variables
Explanatory variables consisted of information on the following aspects: data on
socioeconomic characteristics of the farm and retail outlet operators such as gender, education
level, experience and age of the operators. Data was also collected on enterprise specific
factors such as firm size (in terms of quantity of milk produced), type of customers, and
location of enterprise (in Nakuru or Nyandarua district including the divisions), type of retail
outlets, and type of grazing systems for the milk producers. A third aspect on which data was
collected was transaction cost characteristics, represented by information and market search
costs, negotiation costs, and monitoring and enforcement costs. Finally information was
collected on performance evaluations of the supply chain partners. The questionnaire was not
structured along these aspects of information but according to the natural flow and ease of
answering the questions by the respondents.
Table 6.1 below summarizes the constructs and their expected influences for determinants of
coordination mechanisms. A positive sign indicates a high probability for the particular
coordination mechanism when a high value of the independent variable is given. A negative
sign indicates a high probability for the use of the given alternative coordination mechanism
is expected for a low value of the independent variable. Question marks indicate weak or
unclear impacts of the independent variable on the possibility of the alternatives arising in the
two dependent variables. A multinomial logit model (MNL) was used to estimate the
parameters and their effects on coordination mechanism.
Table 6.2 below summarizes the constructs for the determinants of supply chain performance
for the Kenyan fresh milk supply chains. A positive sign indicates a high probability of higher
performance for a high value of the independent variable. An ordered probit model was
applied to analyze the supply chain performance relationships. Both models were amenable to
analysis by LIMDEP™ econometric software. However, descriptive analyses were carried out
in SPSS™ statistical software.

DATA DESCRIPTION
106
Table 6.1: Summary of constructs for determinants of coordination mechanisms
Construct Construct description *spot *verb *writ
1 Gender Sex of operator (1- male, 2-female) - + +
2 Education Number of schooling years + - +
3 Experience Enterprise experience in years - + +
Firm specific characteristics
4 Firm/farm size Size of operation in liters of milk handled per day + - +
5 Enterprise type Type of operation or form of business (traders) ? ? ?
6 Location Location of the enterprise (1- Nakuru district, 2- Nyandarua district)
+ - -
7 Chain Type/length of supply chain (direct or indirect 1/2) +- - +
Transaction cost characteristics
Measures of information and search costs
8 Distance Distance between milk seller and buyer or nearest outlet/collection points in km
+- - +
9 Time Time to travel between milk seller and buyer or nearest outlets/collection points in hours
+ - +
10 Sell time Average time required to sell the milk in hours - + +
11 Relations Importance of personal relations in transactions (1-3) - + +
12 Price knowledge Extent of knowledge of milk price in advance (1-3) - + +
13 Price information from traders
Importance of price information from partners (1-3) - + +
14 Price information from government
Importance of price information from government or state (1-3)
+ - -
Measures of negotiation costs
15 Current Prices Amount received or paid for a liter of milk in Kshs** -+ -+ -+
16 Lack of buyers Extent of problem of lack of buyers (1-3) - + +
Measures of monitoring costs
17 Credit time Length of credit period, in days - + +
18 Legal contracts Extent of importance of legal contracts in transactions ( 1-3)
- + +
The coordination mechanisms
*18 Coordination Type of coordination mechanism employed ( 0-Spot, 1-verbal and, 2- written)
**Kshs = Kenya shillings. 1 Kshs = 100 cents
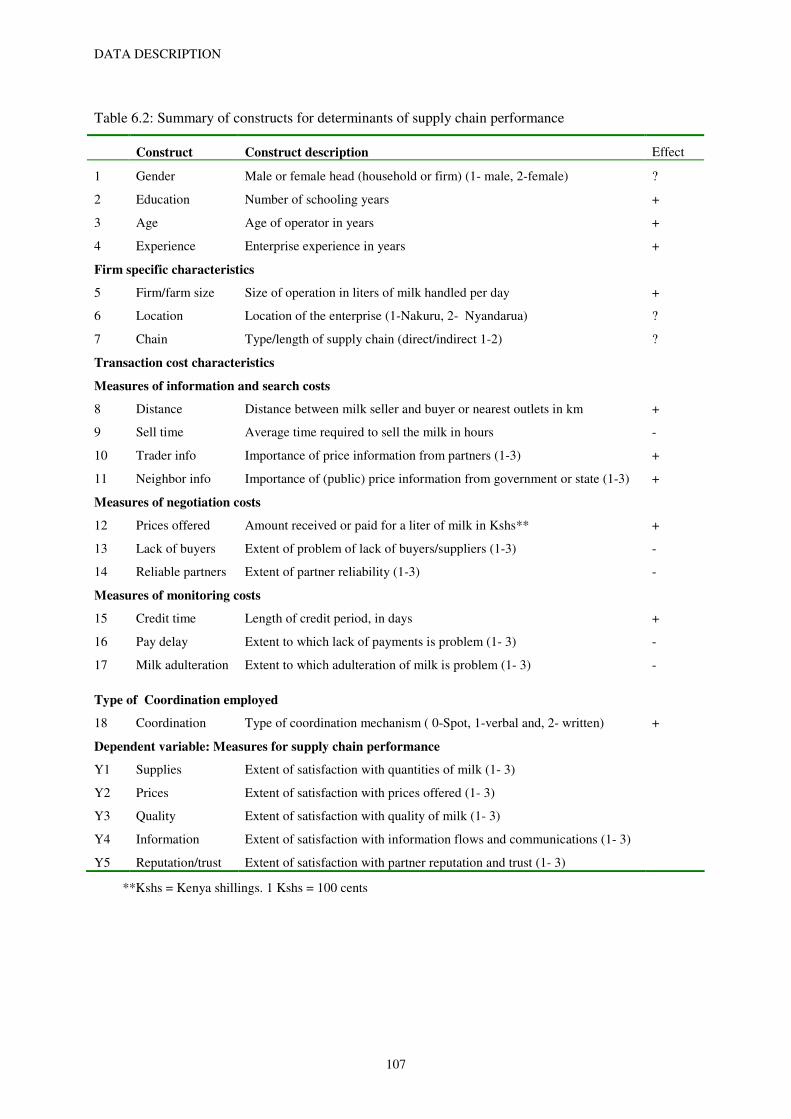
DATA DESCRIPTION
107
Table 6.2: Summary of constructs for determinants of supply chain performance
Construct Construct description Effect
1 Gender Male or female head (household or firm) (1- male, 2-female) ?
2 Education Number of schooling years +
3 Age Age of operator in years +
4 Experience Enterprise experience in years +
Firm specific characteristics
5 Firm/farm size Size of operation in liters of milk handled per day +
6 Location Location of the enterprise (1-Nakuru, 2- Nyandarua) ?
7 Chain Type/length of supply chain (direct/indirect 1-2) ?
Transaction cost characteristics
Measures of information and search costs
8 Distance Distance between milk seller and buyer or nearest outlets in km +
9 Sell time Average time required to sell the milk in hours -
10 Trader info Importance of price information from partners (1-3) +
11 Neighbor info Importance of (public) price information from government or state (1-3) +
Measures of negotiation costs
12 Prices offered Amount received or paid for a liter of milk in Kshs** +
13 Lack of buyers Extent of problem of lack of buyers/suppliers (1-3) -
14 Reliable partners Extent of partner reliability (1-3) -
Measures of monitoring costs
15 Credit time Length of credit period, in days +
16 Pay delay Extent to which lack of payments is problem (1- 3) -
17 Milk adulteration Extent to which adulteration of milk is problem (1- 3) -
Type of Coordination employed
18 Coordination Type of coordination mechanism ( 0-Spot, 1-verbal and, 2- written) +
Dependent variable: Measures for supply chain performance
Y1 Supplies Extent of satisfaction with quantities of milk (1- 3)
Y2 Prices Extent of satisfaction with prices offered (1- 3)
Y3 Quality Extent of satisfaction with quality of milk (1- 3)
Y4 Information Extent of satisfaction with information flows and communications (1- 3)
Y5 Reputation/trust Extent of satisfaction with partner reputation and trust (1- 3)
**Kshs = Kenya shillings. 1 Kshs = 100 cents

DATA DESCRIPTION
108
6.2 Sample characteristics and descriptive analysis of the responses:
distribution of the transactions
The unit of analysis in the study is the transaction. The transactions were between the milk
producers and their respective customers/buyers and between the milk retail outlets and their
respective milk suppliers and buyers.
Producer-buyer transactions
In total, 340 usable milk producer transactions were realized from the survey. About 70.59%
of the milk transactions were from Nakuru district while 29.41% were from Nyandarua
district. There were also 256 retailer-supplier transactions and 278 retailer-buyer transactions.
Table 6.3 below summarizes the distribution of the transactions by district and division.
Table 6.3: Sample distribution for milk producer transactions by district and division
Producers-Buyer*
transactions
Retailer-Supplier**
transactions
Retailer-Buyer***
transactions
Number of
Cases
Percent
(%)
Number of
cases
Percent
%
No of
cases
Percent
%
Nakuru
District
Nakuru Municipality
56 16.47 40 15.63 51 18.35
Bahati 73 21.47 66 25.78 61 21.94
Rongai 67 19.71 33 12.89 37 13.31
Molo 44 12.94 36 14.06 40 14.39
Sub-total 240 70.59 175 68.36 189 67.99
Nyandarua
District
South Kinangop
57 16.76 55 21.48 61 21.94
North Kinangop
43 12.65 26 10.16 28 10.07
Sub-total 100 29.41 81 31.64 89 32.01
Total 340 100 256 100 278 100
Source: Field Survey Data, 2006
*includes direct consumers, traders, farmer cooperative organizations and processing firms
** includes direct farm suppliers and milk supplies from other traders
*** includes direct consumers and sales to processing firms
Table 6.4 below shows that about 32% of the transactions were carried out with direct
consumers. Milk bars, hotels and restaurants constituted about 17.4% of producer
transactions. The next supply chain constituted sales of milk directly to milk processing firms,
or to cooperative organizations and brokers who further transferred the milk to processing
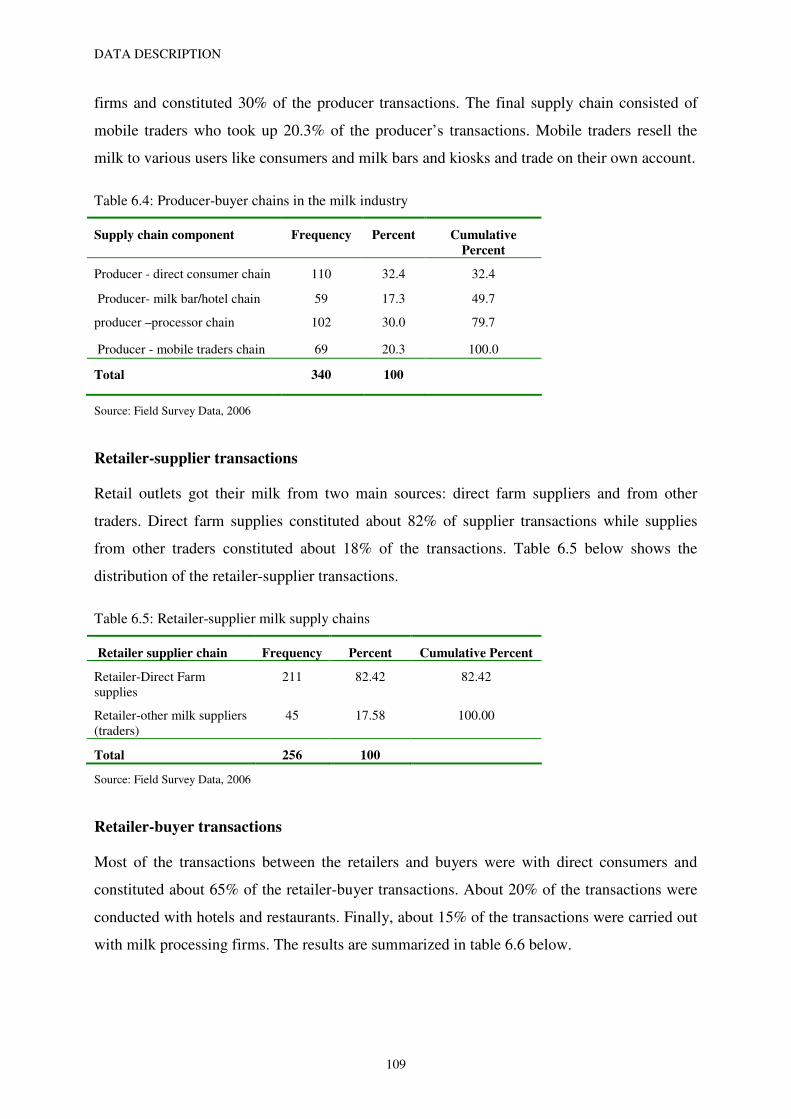
DATA DESCRIPTION
109
firms and constituted 30% of the producer transactions. The final supply chain consisted of
mobile traders who took up 20.3% of the producer’s transactions. Mobile traders resell the
milk to various users like consumers and milk bars and kiosks and trade on their own account.
Table 6.4: Producer-buyer chains in the milk industry
Supply chain component Frequency Percent Cumulative
Percent
Producer - direct consumer chain 110 32.4 32.4
Producer- milk bar/hotel chain 59 17.3 49.7
producer –processor chain 102 30.0 79.7
Producer - mobile traders chain 69 20.3 100.0
Total 340 100
Source: Field Survey Data, 2006
Retailer-supplier transactions
Retail outlets got their milk from two main sources: direct farm suppliers and from other
traders. Direct farm supplies constituted about 82% of supplier transactions while supplies
from other traders constituted about 18% of the transactions. Table 6.5 below shows the
distribution of the retailer-supplier transactions.
Table 6.5: Retailer-supplier milk supply chains
Retailer supplier chain Frequency Percent Cumulative Percent
Retailer-Direct Farm supplies
211 82.42 82.42
Retailer-other milk suppliers (traders)
45 17.58 100.00
Total 256 100
Source: Field Survey Data, 2006
Retailer-buyer transactions
Most of the transactions between the retailers and buyers were with direct consumers and
constituted about 65% of the retailer-buyer transactions. About 20% of the transactions were
conducted with hotels and restaurants. Finally, about 15% of the transactions were carried out
with milk processing firms. The results are summarized in table 6.6 below.

DATA DESCRIPTION
110
Table 6.6: Retailer-buyer milk supply chains
Retailer-buyer chain
Frequency Percent Cumulative Percent
Retailer-Consumer chain 180 64.75 64.75
Retailer-Hotels/Restaurants chain 56 20.14 84.89
Retailer-Processor chain 42 15.11 100.00
Total 278 100
Source: Field Survey Data, 2006
6.3 Sample characteristics of the coordination mechanisms
Producer-buyer coordination
The dependent variable was coordination mechanisms, defined by the kind of contractual
arrangement used in carrying out milk transactions with milk buyers. Three main coordination
mechanisms were identified as spot market contracts, verbal contracts and written contracts.
The distribution of the contractual arrangements for transactions between milk producers and
buyers is shown in table 6.7 below. The results show that spot market contracts constituted
44.12% of all transactions between the milk producers and their buyers while verbal
agreements took up 43.94% of the transactions. Written contracts comprised of 12.94% of the
producer transactions.
Table 6.7: Coordination mechanisms and their distributions in producer transactions
Nature of coordination Frequency Percent Cumulative
Percent
Spot market contracts 150 44.12 44.12
Verbal Agreements 146 43.94 88.06
Written agreements 44 12.94 100
Total 340 100
Source: Field Survey Data, 2006
Retailer-supplier coordination
The distribution of the coordination mechanisms in transactions between milk retailers and
their suppliers is shown in table 6.8 below. About 63% of the retailer supplier transactions
were based on spot market contracts while 32% of the transactions were based on verbal
contracts. Written contracts constituted about 5% of the retailer-supplier transactions.
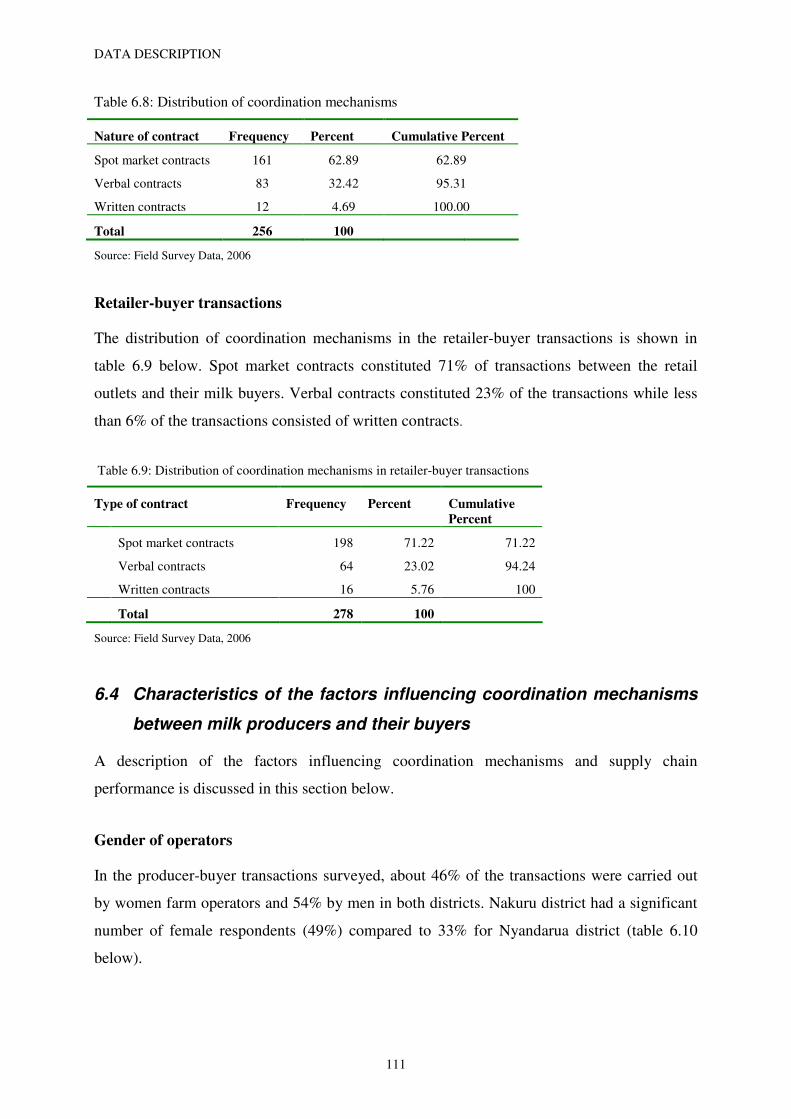
DATA DESCRIPTION
111
Table 6.8: Distribution of coordination mechanisms
Nature of contract Frequency Percent Cumulative Percent
Spot market contracts 161 62.89 62.89
Verbal contracts 83 32.42 95.31
Written contracts 12 4.69 100.00
Total 256 100
Source: Field Survey Data, 2006
Retailer-buyer transactions
The distribution of coordination mechanisms in the retailer-buyer transactions is shown in
table 6.9 below. Spot market contracts constituted 71% of transactions between the retail
outlets and their milk buyers. Verbal contracts constituted 23% of the transactions while less
than 6% of the transactions consisted of written contracts.
Table 6.9: Distribution of coordination mechanisms in retailer-buyer transactions
Type of contract Frequency Percent Cumulative
Percent
Spot market contracts 198 71.22 71.22
Verbal contracts 64 23.02 94.24
Written contracts 16 5.76 100
Total 278 100
Source: Field Survey Data, 2006
6.4 Characteristics of the factors influencing coordination mechanisms
between milk producers and their buyers
A description of the factors influencing coordination mechanisms and supply chain
performance is discussed in this section below.
Gender of operators
In the producer-buyer transactions surveyed, about 46% of the transactions were carried out
by women farm operators and 54% by men in both districts. Nakuru district had a significant
number of female respondents (49%) compared to 33% for Nyandarua district (table 6.10
below).

DATA DESCRIPTION
112
Table 6.10: Distribution of production units by district and gender
Gender District Total
Nakuru Nyandarua
Male 50.7% 67.0% 55.8%
Female 49.3% 33.0% 44.2%
Total% 100% 100% 100.0%
Source: Field Survey Data, 2006
Educational level of respondents
About 10% of the respondents reported having attended either adult education classes or no
education at all. About 9% had between one and four years of primary school education. A
further analysis showed that 28% of the respondents had between 5 and 8 years of primary
school (primary school graduates) but the majority of the respondents (about 33%) reported
having received between 10 and 12 years of education (at least secondary school education).
More than 13 years of schooling was reported in 20% of the farm operators which comprises
of advanced secondary school education, tertiary college training or university education
(table 6.11 below).
Table 6.11: Classification of respondents by educational class
Educational class Proportion of respondents
No formal education at all 10%
1 to 4 years of formal education 9%
5 to 8 years 28%
10 to 12 years 33%
13 to 16 years 20%
Source: Field Survey Data, 2006
The overall mean number of schooling years was about 9 years (table 6.12 below) while the
modal number of schooling years was about 12 years. The results show a relatively high level
of education indicating that most of the milk producers are relatively well informed about
their dairy activities. This also explains the commercial nature of the milk producers. Further
analyses showed that there were no significant differences in the mean education levels
among the milk producers.
Enterprise experience and age
Table 6.12 below also shows the distribution of enterprise experience and age of the milk
producers. Experience of the operator was measured by the number of years since the

DATA DESCRIPTION
113
enterprise began. The overall mean number of years since the enterprise began was about 15.6
years. However the largest proportion of producers had operated their farms for about 10
years with the longest time in operation being 50 years and the shortest time being less than
one year. The distribution of the producers based on experience was relatively well balanced
in the study regions and between the genders. The age of the dairy operators ranged from 18
years to 85 years. The overall mean age of the milk producers was about 45.744 years with
the modal age being about 35 years old. The sample results show that older dairy operators
were also the more experienced ones.
Table 6.12: Descriptive statistics for producer-buyer transactions
Minimum Maximum Mean
Average schooling years 0 16.000 9.076
Age of respondent in years 18 85.000 45.744
Experience of operator in years 0 50.000 15.438
Quantity bought by buyer in liters per day 1 70.000 9.694
Distance of buyer from seller to buyer in km 0 35.000 1.460
Time required to sell milk stocks in hours 0 17.000 5.676
Price per liter of fresh milk in Kshs* 11 30.000 17.099
N = 340
Source: Field Survey Results, 2005
* Kshs = Kenya shillings, one shilling = 100 cents.
Farm size, distances traveled, mean time to sell and milk selling prices
Table 6.12 above shows that the mean quantity of milk sold by the farmers was 9.694 liters
per transaction per day. But this quantity varied between 1 liter and 70 liters showing
skewness towards lower quantities. The mean distance required to travel between the milk
producers and the milk buyers was about 1.5 km. The distance however varied from 0 km to
35 kilometers, with a general skewness towards shorter distance between producers and
buyers. The overall mean duration taken by the farmers to sell the milk after milking was
5.676 hours with a range of 0 hours (immediate sales after milking) to 17 hours after milking.
Furthermore, the mean price of milk per liter was about 17 Kenya shillings (Kshs). The lowest
price fetched for the milk per liter was kshs 11 while the highest price fetched by the
producers was Kshs 30. The data show a wide variation in the milk selling prices among the
producers.

DATA DESCRIPTION
114
Importance of legal contracts in transactions
Frequency distributions for the importance of legal contracts shows that in most of the
transactions, legal contracts were not used or were not considered important to producers in
83.8% of the transactions with buyers. About 8% of transactions indicated that legal contracts
were a significant part of their transactions while another 8% indicated that legal contracts
contributed only partly to transactions with their buyers. The results therefore show that there
were very few written contracts in transactions between the producers and the buyers. This
result attests to the dominance of informal transaction relations between the producers and or
use of spot market contracts. A summary of the observations are presented in table 6.13
below.
Table 6.13: Importance of legal contracts in producer-buyer transactions
Presence of contract with
buyer
Frequency Percent Cumulative
Percent
not true 285 83.82 83.82
partly true 28 8.24 92.06
true 27 7.94 100.00
Total 340 100
Source: Field Survey Data, 2006
Extent of lack of buyers in producer transactions
Buyer availability was represented by the extent to which lack of buyers was perceived to be a
problem in producers’ transactions with their buyers. This is shown in table 6.14 below. Lack
of buyers was reported as a serious problem in about 12% of the producers’ transactions with
buyers, while in 24% of the transactions, lack of buyers was reported as being a small
problem. Lack of buyers was not a problem in about 64% of the transactions.
Table 6.14: Seriousness of problem of lack of buyers
Lack of buyers Frequency Percent Cumulative Percent
serious 41 12.06 12.06
a small problem 82 24.12 36.18
no problem 217 63.82 100.00
Total 340 100
Source: Field Survey Data, 2006

DATA DESCRIPTION
115
Advance milk price information in the supply chains
Milk producers were further asked to indicate the extent to which they were always able to
determine prices for their milk in advance of selling milk (table 6.15 below). In about 20.3%
of the transactions, it was very difficult for producers to know milk prices in advance of the
transactions. In 26.76% of the transactions, producers were sometimes able to know milk
prices before selling while in about 53%, the producers were always able to know the milk
prices before selling their milk.
Table 6.15: Extent of price knowledge in producer transactions
Knowledge about buyer price offers
Frequency Percent Cumulative Percent
very difficult to know their prices 69 20.30 20.29
sometimes able to know 91 26.76 47.06
full knowledge 180 52.94 100.00
Total 340 100
Source: Field Survey Data, 2006
Length of credit period in transactions
Milk could be sold for spot cash payments or on credit. Most of the milk transactions were
carried out on credit. Spot cash transactions constituted about 31% of all transactions. Among
the credit transactions, 25% consisted of credit periods of up to 2 weeks, and 43.5% consisted
of credit periods of at least one month. Thus in general there were more credit transactions
than spot cash payments in the producers’ transactions with buyers (table 6.16 below).
Table 6.16: Length of credit period
length of credit period
Frequency Percent Cumulative
Percent
Spot cash sales 106 31.18 31.18
1 to 2 weeks credit sales 86 25.29 56.47
One month or more credit sales
148 43.53 100.00
Total 340 100
Source: Field Survey Data, 2006

DATA DESCRIPTION
116
6.5 Characteristics of retailer-supplier transactions
Gender of retail operator
Female retail operators constituted about 43% of the retailer-supplier transactions and male
operators about 57% of the transactions (table 6.17 below). The distribution of retailer-
supplier transactions by gender was similar to producer-buyer transactions.
Table 6.17: Distribution of retailer-supplier transactions by gender
Gender
Frequency Percent Cumulative Percent
Male 145 56.64 56.64
Female 111 43.36 100.00
Total 256 100
Source: Field Survey Data, 2006
Type of retail operation
The transactions were also broken down according to the type of enterprise as shown in table
6.18 below. Grocery shops and kiosks constituted about 34% of the retailer-supplier
transactions. Milk bars accounted for about 39.5% of the transactions while mobile traders
and farmer cooperative societies accounted for about 20% and about 6% of the retailer-
supplier transactions respectively.
Table 6.18: Distribution of retailer-supplier transactions by type of retail outlet
Frequency Cumulative
Percent
Grocery/kiosk 87 33.98 33.98
Dairy/milk bar 101 39.45 73.44
Mobile traders 52 20.31 93.75
Cooperative societies
16 6.25 100.00
Total 256 100
Source: Field Survey Data, 2006
Age, experience and educational level
Table 6.19 below shows summary statistics for key socioeconomic, firm specific and
transaction cost variables in retailer-supplier transactions. The age of the retail operators
ranged between 15 and 70 years with a mean of about 33 years. It implies that most of the

DATA DESCRIPTION
117
retail operators were relatively young. Some of the retail outlets were hardly more than a year
in operation having been newly set up. However, some outlets, especially the cooperative
societies, had been in operation for longer periods. The mean enterprise experience indicates
that most of the retail operations were new having been set up within the last decade, which
coincides with when liberalization policies were initiated in the industry. Regarding the
educational levels of the retail operators, the mean number years of schooling was 10 years
with a range of zero to 16 years. Educational levels were higher in cooperative societies and
milk bar operators, which also operated at higher levels than other business types such as
kiosks or mobile traders.
Table 6.19: Retailer-supplier transactions, summary descriptive statistics
Minimum Maximum Mean
Respondent's Age in years 15.00 70.000 33.340
Enterprise experience in years 0.00 41.000 3.945
Educational level of respondent in years 0.00 16.000 10.387
Quantity of milk supplied by supplier in liters per day 1.00 17,000.000 298.980
Time to transport from supplier in hours 0.05 9.000 1.109
N = 256
Source: Field Survey Data, 2006
Travel times, prices and quantities of milk handled
Table 6.19 above also shows that the quantity of milk handled in the retailer-supplier
transactions varied from 1 liter to 17,000 liters with a mean quantity of about 300 liters per
transaction. Lower quantities of milk were handled by the smaller operators especially the
kiosks and the mobile traders while larger quantities were handled by the milk bars and
cooperative societies. To transport milk from the suppliers to the retail outlets required
between 0.05 hours to about 9 hours. However, the mean time required to transport the milk
was about 1.1 hours, indicating skewness towards shorter delivery times. Larger operators
tended to take longer procuring their milk supplies compared to smaller retail operators.
Supplier reliability
The reliability of the milk supplier was considered an important factor in about 80% of the
retailer-supplier transactions. In the remaining 20% of the transactions, reliability of the milk
supplier was not considered an important factor in the transactions. The results are
summarized in table 6.20 below.
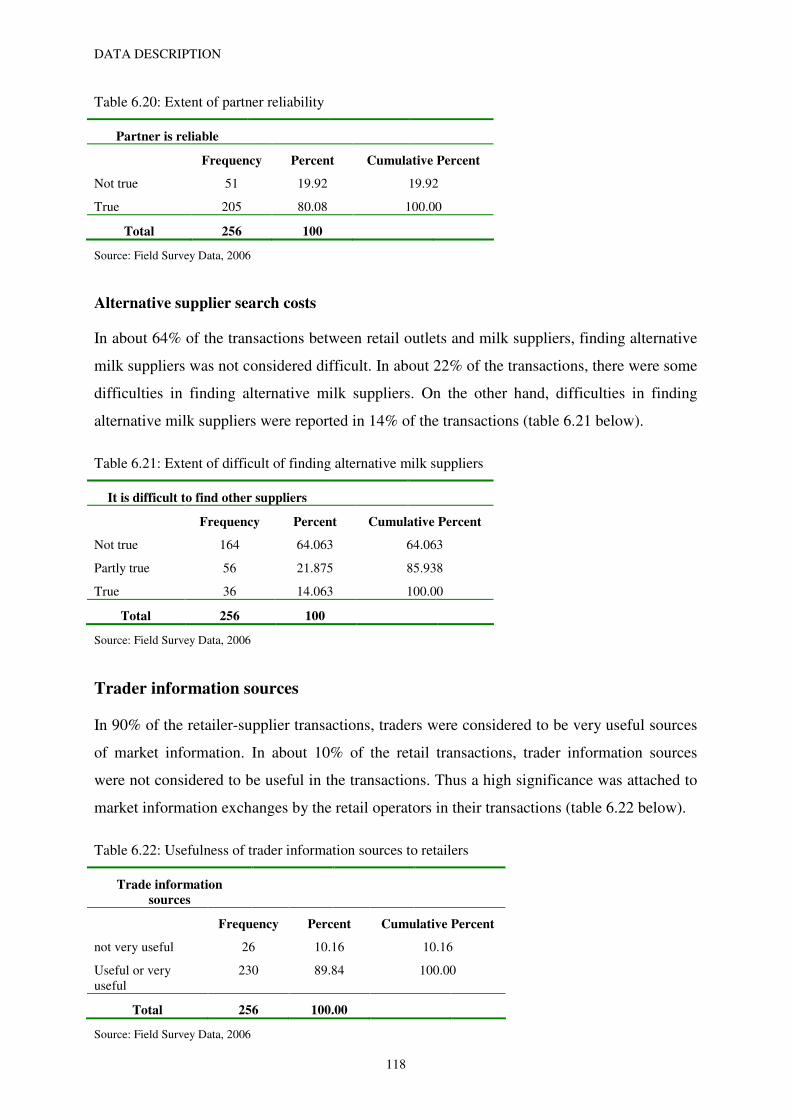
DATA DESCRIPTION
118
Table 6.20: Extent of partner reliability
Partner is reliable
Frequency Percent Cumulative Percent
Not true 51 19.92 19.92
True 205 80.08 100.00
Total 256 100
Source: Field Survey Data, 2006
Alternative supplier search costs
In about 64% of the transactions between retail outlets and milk suppliers, finding alternative
milk suppliers was not considered difficult. In about 22% of the transactions, there were some
difficulties in finding alternative milk suppliers. On the other hand, difficulties in finding
alternative milk suppliers were reported in 14% of the transactions (table 6.21 below).
Table 6.21: Extent of difficult of finding alternative milk suppliers
It is difficult to find other suppliers
Frequency Percent Cumulative Percent
Not true 164 64.063 64.063
Partly true 56 21.875 85.938
True 36 14.063 100.00
Total 256 100
Source: Field Survey Data, 2006
Trader information sources
In 90% of the retailer-supplier transactions, traders were considered to be very useful sources
of market information. In about 10% of the retail transactions, trader information sources
were not considered to be useful in the transactions. Thus a high significance was attached to
market information exchanges by the retail operators in their transactions (table 6.22 below).
Table 6.22: Usefulness of trader information sources to retailers
Trade information
sources
Frequency Percent Cumulative Percent
not very useful 26 10.16 10.16
Useful or very useful
230 89.84 100.00
Total 256 100.00
Source: Field Survey Data, 2006

DATA DESCRIPTION
119
Government market information sources
In about 89.5% of retailer-supplier transactions, government sources of market and price
information were not considered to be useful in the transactions (figure 6.23 below). In the
remaining 10.5% government information sources were indicted to be useful in retailer-
supplier transactions. The results of evaluation of government information sources by retailers
are likely to be a pointer to non availability rather than usefulness of the information. Market
information from the government is rarely available to many dairy operators on time when
they require it.
Table 6.23: Usefulness of government market information to retailers
Government information sources
Frequency Percent Cumulative Percent
not very useful 229 89.45 89.45
very useful 27 10.55 100.00
Total 256 100
Source: Field Survey Data, 2006
Personal relations in transactions
Personal relations between the retail outlets and milk suppliers were not considered important
in about 31% of the transactions. In 37.5% of the transactions, personal relations were
considered to be partially important in the transactions with milk suppliers. About 31.6% of
the retail-supplier transactions considered the presence of personal relations to be an
important factor in their transactions with milk suppliers. The results are summarized in table
6.24 below.
Table 6.24: Personal relations in retailer transactions
Have relations with supplier
Frequency Percent Cumulative Percent
not true 79 30.86 30.86
partly true 96 37.50 68.36
true 81 31.64 100.00
Total 256 100
Source: Field Survey Data, 2006

DATA DESCRIPTION
120
Length of credit period
Spot cash payments (no credit) accounted for about 57.4% of the transactions with milk
suppliers (table 6.25 below). Weekly credit periods accounted for 24.6% of the transactions
while monthly credit periods accounted for about 18% of the transactions with milk suppliers.
This is unlike milk producers most of whose transactions were mostly carried out on credit
basis.
Table 6.25: Length of credit period in retailer-supplier transactions
Length of credit period
Frequency Percent Cumulative percent
Spot cash payments 147 57.42 57.42
Weekly 63 24.61 82.03
Monthly 46 17.97 100.00
Total 256 100
Source: Field Survey Data, 2006
6.6 Characteristics of retailer-buyer transactions
Gender
About 57% of the transactions between retail operators and buyers were carried out by male
operators. Female retail operators were responsible for about 43% of the transactions. The
distribution of the retailer-buyer transactions by gender are shown in table 6.26 below.
Table 6.26: Distribution of transactions by gender
Gender Cumulative
Frequency Percent Percent
male 159 57.19 57.19
female 119 42.81 100
Total 278 100
Source: Field Survey Data, 2006
Type of retail outlet
An analysis of the retail transactions by type of retail outlet indicated that 32% of the milk
transactions were carried out by grocery shops. Milk bars handled 41.7% of the transactions
while mobile traders and cooperative societies handled 20.5% and 5.75% of the transactions
respectively. Unlike grocery shops, milk bars, mobile traders and cooperatives usually
exclusively handle milk and milk related products. The results are shown in table 6.27 below.

DATA DESCRIPTION
121
Table 6.27: Distribution of retailer-buyer transactions by type of retail outlet
Type of retail outlet Cumulative
Frequency Percent Percent
Grocery/kiosks 89 32.01 32.02
Dairy/milk bars 116 41.73 73.74
Mobile traders 57 20.50 94.24
Cooperative societies 16 5.76 100
Total 278 100
Source: Field Survey Data, 2006
Educational level, enterprise experience and age
The education level of the retail operators was captured by the number of years they attended
school. The overall mean number of schooling years was about 10.6 years (table 6.28 below)
and ranged from none at all to 16 years. The mean number of years of enterprise experience
was about 4 years. The mean age of the retail operators was about 33 years but ranged from a
minimum of 15 years and a maximum of 70 years. The mean quantity of milk sold by the
retailers per transaction was about 266 liters per day indicating that on average the retail
outlets were larger compared to the milk producers.
Distance, travel time, and milk prices
Table 6.28 below shows that the mean distance between the retail outlets and the buyers was
about 10 kilometers. The mean distance is highly influenced by buyers situated in distant
locations such as processing firms and buyers in major towns. For transactions between
retailers and direct consumers, distances were less than one kilometer.
The mean time required to travel between the milk buyers and the retail outlets was 0.80
hours (about 48 minutes) but varied between 0 and 7 hours. The variation in the times also
reflected the differences between sales to direct consumers and sales to processing firms. The
time required to reach the buyers is however affected by the means of transport used and the
condition of the road. The main means of transport used either to deliver or collect milk were
on foot, by bicycle or, by vehicle. Thus the time required to reach buyers may not necessarily
be an indicator of distance from buyers but a function of the difficulties faced in attempts to
reach the transacting parties.

DATA DESCRIPTION
122
Table 6.28: Summary descriptive statistics for retailer-buyer transactions
Minimum Maximum Mean
Educational level of retail operators in years
0
16.000
10.576
Enterprise experience in years 0 41.000 4.047
Age 15 70 33
Quantity bought by buyer in liters per day
2 17000.000 265.775
Distance to buyer in km 0 220.000 10.275
Time to get to buyer in hours 0,01 7.000 0.799
Current price for buyers per liter
14
30.000
21.367
Number of buyers 1 400 38
Time to clear fresh milk stocks in hours
0.40 48.000 12.404
N=278
Source: Field Survey Data, 2006
The mean selling price of milk was about Kshs 21.40 per liter. The selling price ranged
between Kshs 14.00 and Kshs 30.00, indicating wide variations in the prices received by
retailers in their transactions. And finally, the mean number of milk buyers was 38 buyers.
However, the number of buyers ranged from one to 400 buyers.
Furthermore, the time required to sell milk ranged from slightly under half an hour to about
48 hours. Operators with cooling facilities (milk bars and some cooperatives) could afford
longer stocking times than others (e.g. mobile traders).
Length of credit period
About 74% of the retailer-buyer transactions were based on spot cash payment basis without
any credit being offered to buyers. In about 7.6% of the transactions, a credit period of one
week was allowed by the retail outlet operators. Monthly credit periods constituted 18.7% of
the retail transactions (table 6.29 below).

DATA DESCRIPTION
123
Table 6.29: Distribution of retailer transactions by length of credit period
Length of credit period Cumulative
Frequency Percent Percent
Spot cash transactions 205 73.74 73.74
Weekly 21 7.55 81.29
Monthly 52 18.71 100
Total 278 100
Source: Field Survey Data, 2006
6.7 Characteristics of the dependent variable: supply chain performance
The distribution of the dependent variable in the transactions between the milk producers and
buyers is shown in table 6.30 below. In about 9% of the transactions, producers reported
being dissatisfied in their transactions with the buyers. In more than 51% of the transactions,
producers were neither satisfied nor dissatisfied in their transactions. On the other hand,
satisfaction was reported in 39% of the producer-buyer transactions. The figures show that the
performance of milk producers was quite modest as a majority of them indicated that they
were not satisfied in transactions with their partners (about 60%).
Table 6.30: Performance in producer-buyer transactions
Source: Field Survey Data, 2006
Table 6.31 below presents summary descriptive results for performance in retailer-supplier
transactions. Dissatisfaction was reported in about 10% of the transactions with milk
suppliers. In a further 54%, retailers indicated that they were neither satisfied nor dissatisfied
in their transactions with milk suppliers. Finally, retailers reported being satisfied in 36% of
the transactions with their partners.
Frequency Percent Cumulative percent
Dissatisfied 30 8.82 8.82
Neither satisfied nor dissatisfied
175 51.47 60.29
satisfied 135 39.71 100.00
Total 340 100.00
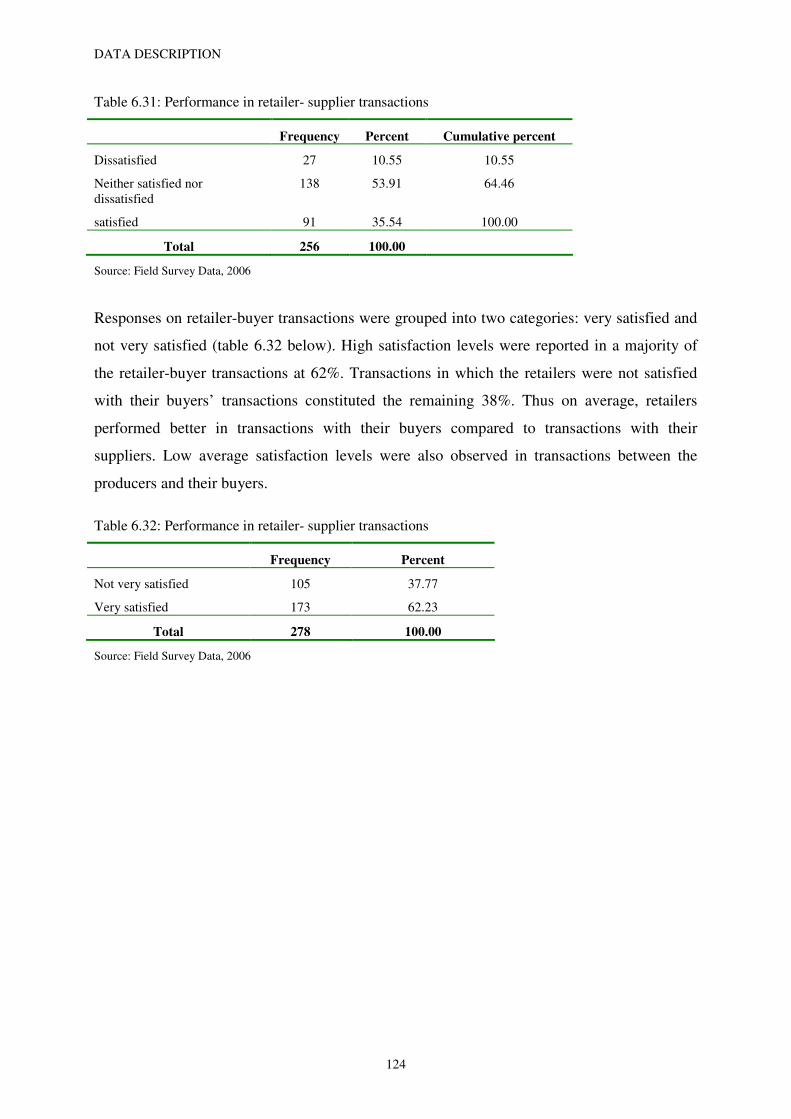
DATA DESCRIPTION
124
Table 6.31: Performance in retailer- supplier transactions
Frequency Percent Cumulative percent
Dissatisfied 27 10.55 10.55
Neither satisfied nor dissatisfied
138 53.91 64.46
satisfied 91 35.54 100.00
Total 256 100.00
Source: Field Survey Data, 2006
Responses on retailer-buyer transactions were grouped into two categories: very satisfied and
not very satisfied (table 6.32 below). High satisfaction levels were reported in a majority of
the retailer-buyer transactions at 62%. Transactions in which the retailers were not satisfied
with their buyers’ transactions constituted the remaining 38%. Thus on average, retailers
performed better in transactions with their buyers compared to transactions with their
suppliers. Low average satisfaction levels were also observed in transactions between the
producers and their buyers.
Table 6.32: Performance in retailer- supplier transactions
Frequency Percent
Not very satisfied 105 37.77
Very satisfied 173 62.23
Total 278 100.00
Source: Field Survey Data, 2006

DETERMINANTS OF COORDINATION AND SUPPLY CHAIN PERFORMANCE
125
CHAPTER 7
DETERMINANTS OF COORDINATION AND SUPPLY CHAIN
PERFORMANCE
The chapter is divided into two major parts. Part one consists of sections 7.1 through 7.3 and
discusses multinomial logit model results for the determinants of coordination mechanisms in
the fresh milk supply chains in Kenya. Section 7.1 discusses coordination in transactions
between milk producers and buyers. Section 7.2 discusses coordination in transactions
between retailers and milk suppliers while section 7.3 deals with coordination in transactions
between retailers and milk buyers.
Part two consists of sections 7.4 to 7.6 and discusses ordered probit results for the
determinants of supply chain performance in the fresh milk supply chain. Section 7.4
discusses determinants of supply chain performance in producer-buyer transactions. Section
7.5 discusses determinants of supply chain performance in retailer-supplier transactions while
section 7.6 deals with the determinants of supply chain performance in retailer-buyer
transactions.
7.1 Model results and discussions: determinants of coordination mechanisms
in producer-buyer transactions
Table 7.1 below shows the multinomial logit results for the relationship between coordination
mechanisms and the explanatory factors. Most of the explanatory factors were significant at
the 5% and 10% levels. In the producer-buyer transactions a number of variables were
significant in determining the kind of coordination mechanism used in the transactions. The
log likelihood chi-square value of 146.09 was significant at the 1% level (p-value = 0.00000).
The pseudo R square was 0.217 and a moderate prediction of 67.94% for the coordination
mechanisms was achieved. The parameter estimates for the producer-buyer transactions and
the corresponding t-values (in brackets) are shown in table 7.1 below. Further discussions of
the model results by means of marginal effects follow below.

DETERMINANTS OF COORDINATION AND SUPPLY CHAIN PERFORMANCE
126
Table 7.1 Multinomial Logit Model estimates for determinants of producer-buyer coordination
Variable description Prob(Y=1)
-
verbal
Prob[Y =
2]-written
Constant -2.824** -2.128 (-2.453) (-1.225) DISTRICT Location of farm (Nakuru/Nyandarua district) -1.220*** -1.540*** (-3.420) (-2.807) EXPERIENCE Experience of farm operator in years 0.018 -0.022 (1.380) (-1.020) QUANTITY Quantity of milk sold in liters per day -0.015 0.019 -(1.017) (0.995) SALETIME Average time required to sell milk in hours 0.148*** 0.084** (5.414) (2.106) DISTANCE Distance in kilometers between farm and buyers -0.049 0.113** (-0.730) (2.199) SELLPRICE Milk selling price per liter -0.054 -0.158** (-1.193) (-2.208) CREDIT Length of credit period (none, 2 weeks, monthly) 0.584*** 0.596*** (5.241) (3.569) PRICEKNOW Extent of price knowledge before milk sales (1-3) 0.512*** 0.471* (2.645) (1.630) NOBUYERS Extent of problem of buyer availability in (1-3) 0.391** 0.407 (2.261) (1.484) LEGALCON Importance attached to legal contracts in (1-3) 0.799*** 1.225*** (2.732) (3.735) N=340, Pseudo R-squared =0.217, percentage correctly predicted =67.94, chi-square = 146.089***; *** significant at 1%, ** 5% and *10%. t-values in brackets. Source: Survey Results, 2006.
Table 7.2 below presents the marginal effects for transactions between milk producers and
milk buyers for the three coordination mechanisms of spot market contracts, verbal contracts
and written contracts. The results for the transactions show that the location of the producer
was significant in distinguishing between the coordination mechanisms. Being located in
Nyandarua district increased the probability of using spot market contracts with a marginal
effect of 0.315. On the other hand, being located in Nakuru district increased the probability
of using verbal and written contracts. The marginal effects of location for verbal and written
contracts were -0.224 and -0.090 respectively indicating that being located in Nakuru district
significantly increased the probability of using verbal and written contracts respectively. The
results therefore imply that repeat transactions with partners were more likely to be
undertaken in Nakuru district than in Nyandarua district. Such repeat transactions are likely to
lead to lower information and market search costs. The use of the safeguards (relational
contracting) is likely to result in lower transaction costs in Nakuru district compared to
Nyandarua district.

DETERMINANTS OF COORDINATION AND SUPPLY CHAIN PERFORMANCE
127
The differences in the two districts can be accounted for by historical and geographical
considerations. Nyandarua district being a rural district implies that the market for milk may
not be readily available in producers’ neighborhoods. There are also very few major urban
areas that could act as captive markets for the milk produced in Nyandarua district compared
to Nakuru district. Therefore most of the milk producers in the district are likely to sell their
milk in distant markets and for this reason it becomes difficult to enter into relational based
transactions which normally require more information and knowledge about the buyers. The
cost of acquiring such information is likely to be very high and therefore spot market
contracts rather than relational based transactions (verbal and written contracts) are more than
likely to predominate. This observation is further strengthened by the influence of distance
between the milk sellers and the buyers on the coordination mechanisms used as discussed
below, where longer distances favor use of spot market contracts. A further explanation is
based on the institutional changes that appear to have affected Nyandarua district more
negatively than Nakuru district, restricting farmers in Nyandarua district to rely more on spot
market contracts.
Experience of the farm operators had a significant and positive marginal effect on the use of
verbal contracts. Longer experience in the dairy operations increased the probability of using
verbal contracts. The marginal effect of enterprise experience for verbal contracts was 0.006.
This implies that more experienced producers establish social networks (social capital) for
milk sales and the networks are likely to persist for long periods. The marginal effects for
both spot and written contracts were -0.003 indicating that having shorter enterprise
experience increased the likelihood of using both spot market contracts and written contracts
in transactions between milk producers and buyers but its effect was not statistically
signficant. However, experience did not have a significant influence on the use of spot market
contracts and written contracts.
The results also show that verbal contracts were associated with lower quantities of milk
handled (marginal effect of -0.005) but the effect was not significantly different from zero. On
the other hand, positive marginal effects for quantity of milk sold imply that higher quantities
of milk handled were positively associated with the use of spot market and written contracts
in the transactions. The positive marginal effects for milk quantity signify that with increasing
production levels, transactions are likely to be closed through spot market contracts and
written contracts. However, the overall effect of quantity of milk sold was not significant in
distinguishing between the coordination mechanisms.

DETERMINANTS OF COORDINATION AND SUPPLY CHAIN PERFORMANCE
128
Table 7.2 Marginal effects of explanatory variables on the probability of coordination choice
Variable Variable description Spot
market
Verbal
contracts
Written
contracts
Constant 0.660** -0.592** -0.067 (2.444) (-2.233) (-0.420) DISTRICT Location of farm (Nakuru/ Nyandarua
district 1-2) 0.315*** -0.224*** -0.090*
(3.774) (-2.735) (-1.854) EXPERIENCE Experience of farm operator in years -0.003 0.006* -0.003 (-0.812) (1.849) (-1.585) QUANTITY Quantity of milk sold in liters per day 0.002 -0.005 0.003 (0.611) (-1.381) (1.583) SALETIME Average time required to sell milk in
hours -0.033** 0.032*** 0.001
(-5.190) (5.278) (0.227) DISTANCE Distance in kilometers between farm
and buyers 0.004 -0.018 0.014***
(0.285) (-1.172) (2.847) SELLPRICE Milk selling price per liter 0.018* -0.005 -0.013** (1.706) (-0.520) (-2.037) CREDIT Length of credit period (none, 2 weeks,
monthly) -0.144*** 0.115*** 0.029**
(-5.543) (4.519) (1.971) PRICEKNOW Extent of price knowledge before milk
sales (1-3) -0.124*** 0.103** 0.021
(-2.744) (2.308) (0.774) NOBUYERS Extent of problem of buyer
availability in the transactions (1-3) -0.097** 0.076** 0.020
(-2.395) (1.889) (0.799) LEGALCON Importance attached to legal
contracts in the transactions (1-3) -0.217*** 0.136** 0.081***
(-3.153) (2.182) (3.094) *** Significant at 1%, ** 5% and *10% Source: Survey Results, 2006.
The time required to sell milk was highly significant for spot market contracts and verbal
contracts. Shorter times before selling milk significantly increased the likelihood of using spot
market contracts (marginal effect of -0.033). On the other hand, longer times before selling
milk increased the chances of using verbal contracts with a marginal effect of 0.032. Longer
hours before selling were also positively associated with written contracts but were not
statistically different from zero in their influence. Longer hours before selling milk are likely
to increase uncertainty in transactions especially when there are no safeguards. Since milk is a
highly perishable commodity, bargaining power will be low for milk producers especially
when exposed to open markets. Milk producers therefore strive to close their sales as fast as
possible using spot market contracts to reduce long exposures to uncertainties in the absence
of safeguards that are usually provided by relational based contracts.

DETERMINANTS OF COORDINATION AND SUPPLY CHAIN PERFORMANCE
129
Longer distances between milk producers and buyers had a significant positive influence on
the use of written contracts (marginal effect of 0.014). Milk producers selling to buyers
located farther away were more likely to use written contracts. Long distances also favored
the use of spot market contracts but the effect was not significant. Shorter distances increased
the likelihood of using verbal contracts but the effect was also not significant.
Higher milk selling prices increased the likelihood of using spot market contracts by
producers. The marginal effect of prices for spot market contracts was 0.018. Higher prices
associated with spot market contracts reflect the lack of safeguards against transaction failure
or opportunism. Lower milk selling prices were likely to favor the use of verbal contracts in
the producer-buyer transactions but the effect was not significant. However, milk selling
prices were significant in influencing the use of written contracts, albeit negatively. The
marginal effect of milk selling prices on written contracts was -0.013 indicating that lower
prices increased the probability that written contracts would be used in producer-buyer
transactions. This result is theoretically supported in Transaction Cost Economics theory,
where written contracts and other relational based contracts provide safeguards which can be
represented by the difference between the spot market prices and the prices received or paid
for under written contracts. The safeguards provide some insurance against market search
costs, and bargaining costs which ensure that there is always a market for the highly
perishable milk products, and in addition, contract enforcement is also made easier.
Safeguards are also necessary when larger quantities of milk are sold or handled.
The length of credit period was highly significant in influencing the coordination mechanisms
in various ways. Short credit periods (mostly 0 to 2 days) favored the use of spot market
contracts (marginal effect of -0.144). Longer credit periods on the other hand favored the use
of verbal and written contracts. For the verbal contracts, the effect of credit period was
significant with a marginal effect of 0.115 while for written contracts the marginal effect was
0.029. Thus the effect of credit period was stronger for verbal contracts compared to written
contracts. The length of credit period is often affected by the amount of trust subsisting
between the transacting partners. Earlier results on the effect of enterprise experience
indicated that more experienced operators tended to use verbal and written contracts, a result
that could be explained by the trust and reputation developed over time as part of their social
capital. Less experienced operators tended to use spot market contracts. Monitoring costs are
likely to rise whenever milk is sold on credit due to perceived opportunism from transaction
partners. Monitoring and enforcement costs can be reduced when there are effective legal
enforcement mechanisms in the event of default. Reputation of the transacting partner may

DETERMINANTS OF COORDINATION AND SUPPLY CHAIN PERFORMANCE
130
also determine whether transactions are to be carried out on credit or not. Credit is usually
extended to partners who are known to the sellers and or have good reputations (such as
neighbors) or where legal redress can be easily sought (such as processing firms).
Some producers were able to determine milk prices in advance before the transactions took
place. Others were not always able or were only able to determine the prices in advance. Low
levels of price knowledge significantly favored the use of spot market contracts. Therefore
difficulties in accessing price information by farmers increase the probability of using spot
market contracts. The marginal effect of price knowledge of –0.124 for spot market contracts
was significant at the 1% level. On the other hand, advance price knowledge before
transacting increased the likelihood that verbal contracts and written contracts would be used
in the transactions. However, the influence of price knowledge on written contracts was not
significant though it was positive. Information search costs are likely to be lower in the two
relational coordination mechanisms compared to spot market contracts. The results indicate
that adequate price knowledge is necessary for both verbal and written contracts.
Lack of price information leads producers to sell to buyers located near their farms to avoid
uncertainties associated with insufficient market information. It would be difficult to use
verbal contracts in such distant markets. The data also indicate that farmers using verbal
contracts were also fairly more experienced than farmers using spot market contracts and
written contracts, meaning that experienced farmers were more likely to have more price
information relative to less experienced farmers. From the results, the positive relationship
between high information availability and the relational contracts imply that the available
information was most likely to have been gained from private sources, such as other farmers
or milk buyers or traders. Farmers that did not have adequate information therefore opted to
use spot market contracts in their transactions.
Difficulties in getting adequate numbers of milk buyers significantly favored the use of spot
market contracts. On the other hand, high buyer availability significantly increased the
likelihood of using verbal contracts with a significant marginal effect of 0.076. Higher buyer
availability was also likely to increase the possibility of using written contracts but this was
not statistically significant at the 10% level. The number of buyers in the market determines
the relative bargaining powers and costs that farmers are likely to face in their transactions.
Fewer buyers make it difficult to effectively bargain leading to high negotiation costs.
The importance of perceived enforceability of contracts, whether explicit or implicit, also
influenced the type of coordination mechanisms used. Low importance attached to legal

DETERMINANTS OF COORDINATION AND SUPPLY CHAIN PERFORMANCE
131
contracts significantly increased the likelihood of using spot market contracts. The marginal
effect of importance of legal contracts for spot market coordination mechanism was -0.217.
But as the importance of contract enforcement increases, the probability of using the
relational coordination mechanisms also increases. The marginal effects of legal contracts for
verbal and written contracts were 0.136 and 0.081 respectively. Legal contracts are important
for contract enforcement purposes. Availability of contract enforcement mechanisms reduces
the costs of monitoring transaction partners. The presence or absence of contract support
institutions affects the amount and extent of monitoring costs required in transactions between
the producers and the buyers.
7.2 Determinants of coordination in retailer –supplier transactions
Regression results for determinants of coordination mechanisms in transactions between the
milk retail outlets and milk suppliers show that the type of coordination mechanism employed
was also influenced by socioeconomic factors, firm related factors and transaction costs
characteristics. The regression results are presented in table 7.3 below. The model log-
likelihood chi-square value was 126.877 with a p-value less than 0.00001. The pseudo R
squared value was 0.31 and the model was able to predict the probability of using the
coordination mechanisms up to 78% of the time. Further analyses and discussions of the
results using marginal effect follow from table 7.4 below.
The results in table 7.4 show that being located in Nyandarua district significantly increased
the probability of using spot market contracts with a marginal effect of 0.452. On the other
hand, being located in Nakuru district significantly increased the probability of using verbal
contracts (marginal effect of -0.410) in transactions between retailers and milk suppliers.
Being located in Nakuru district also increased the likelihood that written contracts would be
used in retailer-supplier transactions (marginal effect of 0.042). The results for the effect of
location in retailer-supplier transactions closely mirror results in producers-buyer transactions.
Being a male retail operator significantly increased the chance of using spot market contracts
with a marginal effect of -0.185. On the other hand, being a female retail operator
significantly increased the likelihood of using relational coordination mechanisms, that is,
both verbal and written contracts. The marginal effects were 0.176 and 0.009 for verbal and
written contracts respectively. Female operators are likely to perceive higher transaction costs
and are more likely to adopt safeguards in their transactions than their male counterparts.

DETERMINANTS OF COORDINATION AND SUPPLY CHAIN PERFORMANCE
132
Table 7.3 Multinomial Logit Model estimates for determinants of retailer-supplier coordination
Description of the variables Pr(Y=1) Pr(Y=2)
Constant -3.997** -8.182* (-2.129) (-1.711) DISTRICT Location of the retail outlets (Nakuru, Nyandarua 1-
2) -2.301*** -3.078***
(-4.427) (-2.895) RESPSEX Gender of operator (Male/female 1-2) 0.975*** 0.802 (2.691) (1.137) QUANTITY Quantity of milk sold in liters per day 0.000 0.000 (1.357) (1.075) TRADERIN Importance of trader price/market information
sources (1-3) 0.570** 1.543**
(2.435) (2.299) GOVTINFO Importance of government price/market information
sources (1-3) -1.257*** -0.712
(-3.338) (-1.275) TIME_1 Time required to travel between milk retail outlet and
milk supplier in hours -0.370** -1.077*
(-2.096) (-1.731) RELIABLE Importance of supplier reliability in transaction (1-3) 0.793* 1.447 (1.815) (1.278) RELATION Importance of personal relations in transactions (1-3) 1.035*** 0.582 (4.060) (1.183) COST_1 Ease of finding alternative milk suppliers (1-3) 0.290 -1.196* (1.184) (-1.689) SALETIME Average time required to sell milk in hours -0.056*** -0.010 (-2.747) (-0.282) CREDIT Length of credit period (none, up to 2 weeks,
monthly) 0.854*** 1.357***
(3.118) (2.718) N=256; Chi squared =126.877***; Pseudo R squared = 0.31; percentage correctly predicted = 78.13%. *** Significant at 1%, ** 5% and *10%
Source: Survey Results, 2006.
The size of the retail operation was measured in terms of the quantity of milk handled and did
not have a significant influence on the use of the coordination mechanisms. However, the
negative marginal effect of quantity of milk handled for spot market contracts indicates that
low quantities of milk purchased increased the likelihood that retailers would use spot market
contracts to purchase milk. On the other hand, positive marginal effects of quantity of milk for
verbal and written contracts imply that larger quantities of milk were likely to be transacted
using verbal and written contracts. Continuous supply is crucial for the retailers especially
those that handle large quantities of milk and therefore verbal and written contracts provide
the necessary safeguards against uncertainties in milk supplies.
Two sources of price information were evaluated for their significance in the retailer supplier
transactions: trader price information sources and government price information sources. Both

DETERMINANTS OF COORDINATION AND SUPPLY CHAIN PERFORMANCE
133
had significant influence on the kind of coordination mechanisms employed. Low trader
information availability increased the likelihood that spot market contracts would be used in
the transactions (marginal effect of -0.122) while high trader information availability
significantly increased the likelihood of using verbal contracts as well as written contracts
with marginal effects of 0.098 and 0.023, respectively.
On the other hand, high availability of price information from the government significantly
increased the likelihood of using spot market contracts (marginal effect of 0.235). Having low
levels of government price information increased the probability that verbal and written
contracts would be used in the transactions (with marginal effects of -0.228 and -0.007
respectively). Thus the influence of market information depends on the source of the
information. Trader and government information sources represent private and public
information sources respectively with different effects in the market. Private information is
not usually available to the public and benefits only those parties that have access to it. This is
a case of asymmetric information which is leveraged for private benefit or rent seeking. On
the other hand, government information is normally considered open to the public as it can be
available to all parties interested in using it. Such information sources are likely to reduce
information asymmetries in the market and improve the workings of the whole market.
Information and market search costs are likely to decline in the presence of more public
information. Public information sources do not proffer any special competitive or business
advantages to any particular individual or group but is likely to benefit all parties that have
access to it.
The time required to travel between the retail outlets and the milk suppliers also significantly
influenced the kind of coordination mechanisms used. Longer times required to reach milk
suppliers increased the likelihood of using spot market contracts (marginal effect of 0.080)
while shorter times to reach the milk suppliers increased the probability of using verbal and
written contracts with marginal effects of -0.064 and -0.016 respectively. The results show
that retail outlet operators that took shorter times to reach suppliers were likely to be those
using relational based contracting while retail outlets that took longer times to access their
milk sources were likely to be those using spot market contracts. Longer times to reach
partners are pointers to difficulties in the transactions.
The time required to reach the milk suppliers is a function of several factors: the distance
between the parties, the condition of the road and the means of transport used (asset
endowments); all of which are likely to increase or decrease the time required to travel

DETERMINANTS OF COORDINATION AND SUPPLY CHAIN PERFORMANCE
134
between the transacting parties. Longer distances on good roads and good asset endowments
(means of transport) reduce the times required to reach the transacting partners. On the other
hand, shorter distances in the presence of poor road conditions and or lack of good means of
transport will lead to longer times to reach the partners. In this regard, it is possible that
retailers who use spot market contracts face certain difficulties that may include poor roads,
poor means of transport or long distances traveled, and consequently face higher transaction
costs. The result could also be explained by the possibility that such retailers transport their
milk on foot due to smaller quantities involved.
Table 7.4 Marginal Effects of explanatory variables on the probability of coordination choice: retailer-supplier
Description of the variables Spot market
Verbal contracts
Written contracts
Constant 0.821** -0.701** -0.120 (2.316) (-2.048) (-1.292) DISTRICT Location of the retail outlets (Nakuru,
Nyandarua 1-2) 0.452*** -0.410*** -0.042*
(4.712) (-4.416) (-1.702) RESPSEX Gender of operator (Male/female 1-2) -0.185*** 0.176*** 0.009 (-2.697) (2.653) (0.765) QUANTITY Quantity of milk sold in liters per day 0.000 0.000 0.000 (-1.385) (1.351) (0.903) TRADERIN Importance of trader price/market information
sources (1-3) -0.122*** 0.098** 0.023*
(-2.713) (2.280) (1.650) GOVTINFO Importance of government price/market
information sources (1-3) 0.235*** -0.228*** -0.007
(3.613) (-3.535) (-0.693) TIME_1 Time required to travel between milk retailer
outlet and milk supplier in hours 0.080** -0.064** -0.016*
(2.444) (-2.021) (-1.658) RELIABLE Importance of supplier reliability in transaction
(1-3) -0.161** 0.140* 0.021
(-1.949) (1.762) (1.049) RELATION Importance of personal relations in transactions
(1-3) -0.193*** 0.188*** 0.005
(-4.119) (4.132) (0.660) COST_1 Ease of finding alternative milk suppliers (1-3) -0.037 0.058 -0.021 (-0797) (1.313) (-1.507) SALETIME Average time required to sell milk in hours 0.010*** -0.010*** 0.000 (2.703) (-2.814) (0.122) CREDIT Length of credit period (none, up to 2 weeks,
monthly) -0.171*** 0.151*** 0.019
(-3.263) (3.011) (1.553) *** Significant at 1%, ** 5% and *10% Source: Survey Results, 2006.
Reliability of milk suppliers was also significant in distinguishing between the coordination
mechanisms. Transacting with unreliable milk suppliers increased the likelihood of using spot

DETERMINANTS OF COORDINATION AND SUPPLY CHAIN PERFORMANCE
135
market contracts. The marginal effect of reliability on spot market contracts was -0.161. On
the other hand, high levels of supplier reliability increased the likelihood that verbal contracts
would be used in transactions with milk suppliers with a marginal effect of 0.140. High
supplier reliability was also likely to favor the use of written contracts but the influence was
not significant enough, its marginal effect was only 0.021. Supplier reliability reduces the
efforts required to search for milk suppliers each time a transaction takes place. Low
reliability increases the likelihood of using spot market contracts when complementary
investments in trust among trading partners is not possible.
The findings on the effect of partner reliability are similar to those on the effect of personal
relations in the transactions. Absence of personal relations in transactions between retailers
and milk suppliers increased the likelihood of using spot market contracts with a marginal
effect of -0.193. On the other hand, the presence of personal relations increased the likelihood
of using verbal and written contracts in the transactions. The marginal effect of personal
relations on verbal contracts was 0.188 and on written contracts, the marginal effect was
0.005. Personal relations are a specific asset (relational asset or social capital) and reduce
transaction costs in transactions.
Difficulties in finding alternative milk suppliers did not significantly influence the type of
coordination mechanism used. But the negative marginal effect indicated that difficulties in
searching and getting alternative milk suppliers were likely to increase the likelihood of using
spot market contracts and written contracts. Higher buyer availability on the other hand were
likely to increase the likelihood that verbal contracts would be used in the transactions.
The time required to sell milk had a significant influence on the probability of using spot
market contracts and verbal contracts but did not influence the use of written contracts.
Longer hours to sell milk increased the probability that the transaction would be carried out
using spot market contracts with a marginal effect of 0.10. On the other hand, shorter milk
sale times increased the likelihood that the transaction would be carried out using verbal
contracts. The marginal effect was -0.01. Longer milk sale times were also likely to increase
the probability of using written contracts but the effect was not significant.
Preference for shorter credit periods significantly increased the probability of using spot
market contracts with a marginal effect of -0.171. on the other hand, longer credit periods
increased the probability that verbal contracts and written contracts would be used with
marginal effects of 0.151 and 0.019, respectively. However, for written contracts, the effect

DETERMINANTS OF COORDINATION AND SUPPLY CHAIN PERFORMANCE
136
was not significant. Both verbal and written contracts provide some level of safeguards
against default on milk sold on credit.
7.3 Coordination in retailer-buyer transactions
The results in table 7.5 below show that various types of transaction cost and socioeconomic
characteristics were significant in influencing the type of coordination mechanisms used. The
chi-square value of 105.599 was significant indicating that the model was appropriate in
addressing the determinants of coordination mechanisms in retailer-buyer transactions. The
pseudo-R squared value of 0.254 shows a moderate fit but the prediction level was moderately
good at 76%. Despite the low pseudo R2, the high number of significant individual variables
eliminates possibility of multicollinearity being present in the explanatory variables.
Table 7.5 Multinomial Logit Model estimates for determinants of retailer-buyer coordination
Description of variable Pr(Y=1) Pr(Y=2) Constant -1.838 -
13.558*** (-1.132) (-3.129) DISTRICT Location of the retail outlets (1=Nakuru, 2= Nyandarua) -1.532*** -2.362** (-2.767) (-2.050) RESPSEX Gender of operator (Male/female) 0.624* 1.935** (1.858) (2.343) RESPAGE2 Age of operator in years -0.052*** 0.035 (-2.717) (1.108) QTYBOT_1 Quantity of milk sold in liters per day 0.000 0.001** (-0.713) (2.464) DISTANCE Distance between milk retail outlet and milk buyer 0.024*** 0.017 (2.841) (1.470) CPRICE_1 Price of milk per liter in Kenya shillings 0.106** 0.236** (2.100) (1.892) CREDITTI Length of credit period (none, up to 2 weeks, monthly) 1.152*** 2.246*** (4.289) (4.494) RETCHAIN Type/length of supply chain ( direct consumers, processors) 0.248 1.331* (0.770) (1.796)
N= 278; Chi-square = 105.599***; Pseudo R squared = 25.4%; percentage correctly predicted =76%. *** Significant at 1%, ** 5% and *10% Source: Survey Results, 2006.
Table 7.6 below presents the marginal effects of the determinants of coordination mechanisms
in retailer-buyer transactions that are used for the interpretation of the model results. In the
retailer-buyer transactions, the location of the retail outlet was significant in distinguishing
between the use of spot market contracts and verbal contracts. Being located in Nyandarua
district increased the likelihood of using spot market contracts. The marginal effect of
Nyandarua district for spot market contracts was 0.260. Being located in Nakuru district on
the other hand significantly increased the likelihood that verbal and written contracts would

DETERMINANTS OF COORDINATION AND SUPPLY CHAIN PERFORMANCE
137
be used in the retailers’ transactions with buyers, with a marginal effect of -0.238. The
marginal effect of Nakuru district for verbal contracts was significant with a marginal effect
of -0.238. However, location had no effect on the use of written contracts. Thus for all
transactions in the supply chain, operators in Nyandarua district were more likely to use spot
market contracts while operators in Nakuru district were more likely to use relational based
contracting.
Gender of the retail operator also had a significant influence on the kind of coordination
mechanisms used except for written contracts where its influence was not significant. Being a
male retail operator increased the probability that the transaction would be carried out under
spot market contracts (marginal effect of -0.114). Being a female retail operator on the other
hand increased the likelihood that the transactions would be carried out using verbal contracts
with a marginal effect of 0.095. The effect of gender on the type of coordination mechanism
used is similar previous findings in retailer-supplier transactions.
Table 7.6 Marginal effects of explanatory variables on the probability of coordination choice retailer-buyer coordination
Description of variable Spot
market
Verbal
contracts
Written
contracts
Constant 0.401 -0.264 -0.137* (1.499) (-1.019) (-1.760) DISTRICT Location of the retail outlets (1=Nakuru, 2=
Nyandarua) 0.260*** -0.238*** -0.021
(2.980) (-2.794) (-1.375) RESPSEX Gender of operator (Male/female) -0.114** 0.095* 0.019 -(2.074) (1.774) (1.556) RESPAGE2 Age of operator in years 0.008*** -0.008`*** 0.000 (2.673) (-2.885) (1.137) QTYBOT_1 Quantity of milk sold in liters 0.000 0.000 0.000 (0.663) (-0.752) (1.454) DISTANCE Distance between milk retail outlet and milk
buyer -0.004*** 0.004*** 0.000
(-2.927) (2.892) (0.930) CPRICE_1 Price of milk per liter in Kenya shillings -0.019** 0.016** 0.002 (-2.254) (2.033) (1.375) CREDITTI Length of credit period (none, up to 2 weeks,
monthly) -0,199*** 0.178*** 0.021*
(-4.460) (4.148) (1.755) RETCHAIN Type/length of supply chain ( direct
consumers, processors) -0.050 0.037 0.013
(-0.965) (0.726) (1.504) *** Significant at 1%, ** 5% and *10% Source: Survey Results, 2006.

DETERMINANTS OF COORDINATION AND SUPPLY CHAIN PERFORMANCE
138
The age of the retail operator also played a significant role in influencing the use of spot
market contracts as well as verbal contracts but not written contracts. Being a younger retail
operator increased the probability that the transaction would be carried out using verbal
contracts with a marginal effect of -0.008. The results also show that being an older retail
operator increased the likelihood that the transaction would be carried out under spot market
contracts with a marginal effect of 0.008. Age had no effect on the use of written contracts.
Shorter distances between retail operators and milk buyers significantly raised the probability
of using spot market contracts (marginal effect of -0.004). On the other hand, longer distances
significantly increased the probability of using verbal contracts in the transactions (marginal
effect of 0.004). Therefore it appears that retail outlets that are likely to use spot market
contracts are those that sell within their neighborhoods or vicinity. On the other hand, retail
operators selling in distant markets are those that were likely to use verbal contracts to
safeguard their business relations in the light of the distances involved.
Low milk prices increased the probability of using spot market contracts for the retail outlet
operators (marginal effect of -0.019). The perishability of milk does allow for extensive
negotiations to take place. This exerts pressure on prices received by the retail outlets. Higher
milk selling prices significantly increased the probability of using verbal contracts (marginal
effect of 0.016). In this case, buyers are willing to pay a higher price (over spot market prices)
to safeguard continuous milk supplies.
The length of credit period was also significant in explaining the probability of using the
coordination mechanisms. The marginal effect of the length of credit period for spot market
contracts was -0.199 indicating that shorter credit periods increased the probability that spot
market contracts would be used in the transactions. However, longer credit periods increased
the probability that verbal and written contracts would be used in the transactions with
marginal effects of 0.172 and 0.021, respectively. Similar results were observed for
transactions between the retail outlets and their suppliers.
The type of retail chain was not significant in influencing any particular coordination
mechanism. The coordination mechanisms were equally available to all retail supply chains
whether to direct consumers or processing firms.
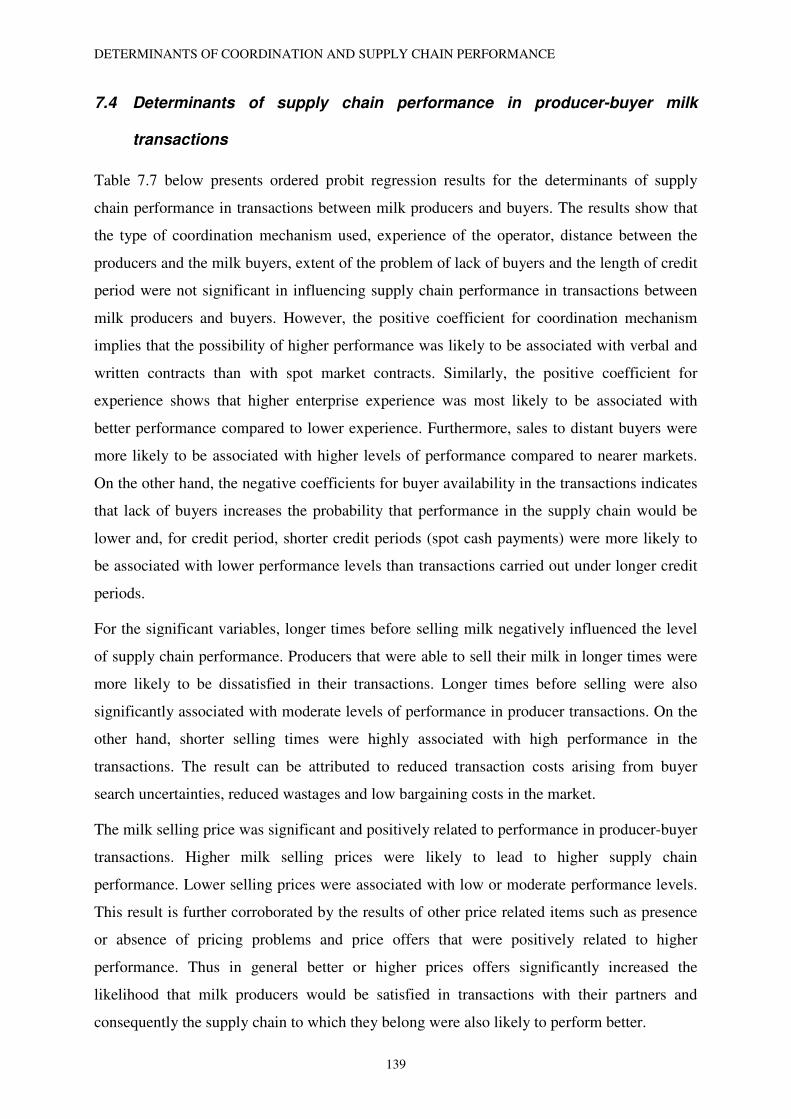
DETERMINANTS OF COORDINATION AND SUPPLY CHAIN PERFORMANCE
139
7.4 Determinants of supply chain performance in producer-buyer milk
transactions
Table 7.7 below presents ordered probit regression results for the determinants of supply
chain performance in transactions between milk producers and buyers. The results show that
the type of coordination mechanism used, experience of the operator, distance between the
producers and the milk buyers, extent of the problem of lack of buyers and the length of credit
period were not significant in influencing supply chain performance in transactions between
milk producers and buyers. However, the positive coefficient for coordination mechanism
implies that the possibility of higher performance was likely to be associated with verbal and
written contracts than with spot market contracts. Similarly, the positive coefficient for
experience shows that higher enterprise experience was most likely to be associated with
better performance compared to lower experience. Furthermore, sales to distant buyers were
more likely to be associated with higher levels of performance compared to nearer markets.
On the other hand, the negative coefficients for buyer availability in the transactions indicates
that lack of buyers increases the probability that performance in the supply chain would be
lower and, for credit period, shorter credit periods (spot cash payments) were more likely to
be associated with lower performance levels than transactions carried out under longer credit
periods.
For the significant variables, longer times before selling milk negatively influenced the level
of supply chain performance. Producers that were able to sell their milk in longer times were
more likely to be dissatisfied in their transactions. Longer times before selling were also
significantly associated with moderate levels of performance in producer transactions. On the
other hand, shorter selling times were highly associated with high performance in the
transactions. The result can be attributed to reduced transaction costs arising from buyer
search uncertainties, reduced wastages and low bargaining costs in the market.
The milk selling price was significant and positively related to performance in producer-buyer
transactions. Higher milk selling prices were likely to lead to higher supply chain
performance. Lower selling prices were associated with low or moderate performance levels.
This result is further corroborated by the results of other price related items such as presence
or absence of pricing problems and price offers that were positively related to higher
performance. Thus in general better or higher prices offers significantly increased the
likelihood that milk producers would be satisfied in transactions with their partners and
consequently the supply chain to which they belong were also likely to perform better.
DETERMINANTS OF COORDINATION AND SUPPLY CHAIN PERFORMANCE
140
Information flows and communications also played a vital role in influencing performance in
producer-buyer transactions. Higher exchange of price and market information between milk
producers and traders increased the likelihood that the milk producers would be satisfied in
their transactions. This lack of information from traders was likely to lead to low or moderate
performance compared to when adequate information is available. Information flows and
communication on prices serves to assure producers that their milk is being sold under
favorable terms. The result is also corroborated by the fact that higher information exchange
takes place when relational based contracts rather than spot market based contracts are used.
In summary, results on determinants of supply chain performance indicate that the main
factors contributing to higher performance in transactions between milk producers and buyers
are better milk price offers, shorter milk selling times and, better information and
communications with the buyers. Low values on these variables were likely to bring about
low or moderate performance among farmers. Such low supply chain performance may
consequently affect the entire supply chain to which the farmers belong.
Table 7.7: Ordered Probit parameter estimates for determinants of producer-buyer transaction performance
Variable Parameter estimate t-value
COORDINATION .1801203786E-01 .165
EXPERIENCE .7967351939E-02 1.211
MILK SALE TIME -.4340082716E-01 -3.267***
DISTANCE .4815763036E-02 .271
SELLING PRICE .6087252426E-01 2.803***
(LOW PRICE PROBLEM 1-3) .5858820749 7.481***
(BETTER PRICES OFFER 1-3) .3765882850 3.999***
LACK OF BUYERS -.4523021554E-01 -.725
CREDI PERIOD -.1063985158 -1.264
TRADER INFO .2473232485 3.623***
Threshold .14850694** 14.864***
N=340; χ2= 156.0962***; cell counts y0 =30, y1= 174, y2=135; *** 1%, ** 5%, * 10% Source: Survey Results, 2006.
7.5 Performance in retailer-supplier milk transactions
In transactions between milk retailers and their suppliers, the type of coordination mechanism
used was significant in determining the level of performance achieved in transactions between

DETERMINANTS OF COORDINATION AND SUPPLY CHAIN PERFORMANCE
141
retailers and milk suppliers. The use of written contracts increased the possibility of attaining
higher performance levels compared to the use of spot market contracts. Written contracts
ensure steady supplies of milk products and reduce the uncertainties of having to search for
suppliers each time they want to transact. Thus verbal and written contracts were positively
associated with high satisfaction in transactions between the retail outlets and the milk
suppliers. The results are presented in table 7.8 below.
The location of retail outlets also contributed to whether performance was likely to be high or
low. Being located in Nakuru district was associated with higher satisfaction in supplier
transactions compared to being located in Nyandarua district. Nakuru is associated with a
better infrastructure, larger urban population relative to Nyandarua district and this could be a
significant factor for the milk traders when sourcing for their milk. Relative to Nyandarua
district, Nakuru faces lower transaction costs which are reflected in the performance levels
attained by the agents.
Retailers that sourced their milk directly from other traders rather than directly from farmers
were less likely to be satisfied in their transactions. Sourcing milk from the farms is difficult
especially when producers are small in size and dispersed but is associated with lower farm
gate prices and milk quality can be monitored compared to the case when traders are used as
suppliers. However, direct milk supplies from farms is not able to guarantee high
performance, a result that can be attributed to high transaction costs of trading with small and
dispersed milk producers.
Results on the effect of milk purchase prices indicated that higher prices did not significantly
influence high performance. However, low prices were significantly associated with low
performance in transactions with milk suppliers. Since retailers thrive on margins between
purchase and sales prices, this result seems to go against expectations. However, when looked
at in conjunction with the previous result on sources of milk supplies, the result becomes
clear. Accessing the lower farm gate milk prices for most retailers is associated with higher
transaction costs as the traders would need to trade with a very large number of producers.
Traders are therefore likely to forego the lower farm gate prices in favor transacting with
other traders despite the higher milk purchase prices. It is also possible to establish long term
trading relations with the few transaction partners which saves on transaction costs. Thus
lower milk purchase prices do not necessarily lead to higher performance levels for the milk
retailers.

DETERMINANTS OF COORDINATION AND SUPPLY CHAIN PERFORMANCE
142
Results on the effect of the importance of price offers in the transactions indicate that good
milk price offers significantly increased the likelihood of the retailers being satisfied in their
transactions with milk suppliers. The results imply that prices arrived at are likely to have
been reached through negotiations with suppliers and thus are acceptable to them or in the
case of transactions with the producers, the retailers are able to extract a favorable price from
them due to their large sizes.
Table 7.8 Ordered Probit parameter estimates for determinants of retailer-supplier transaction performance
Variable Parameter estimate t-value
COORDINATION .3324759033 2.264**
DISTRICT -.5251692522 -2.691***
TYPE OF MILK SUPPLIER -.6314276746 -2.888***
MILK PRURCHASE PRICE .5105358203E-01 1.649*
TRADER INFO .2017831213 1.623*
NEIGHBORHOOD INFO .1580122432 1.396
RELIABLE .4642593592 2.279**
LATE PAYMENT
PROBLEMS
.9428563372E-01 .998
BETTER PRICE OFFERS .4597450687 3.546***
Threshold 1.935489705*** 13.801***
N=256, χ2= 74.70575***, cell counts: y0 =27, y1= 138, y2=91 *** 1%, ** 5%, * 10%
Source: Survey Results, 2006.
Information flows and communications were only marginally significant in influencing the
level of satisfaction with retailer-supplier transactions. Higher information exchanges had the
potential to lead to higher performance in transactions between the retailers and their milk
suppliers. However, the effect of information from both traders and the neighborhoods were
not statistically significant.
Supplier reliability also contributed to the observed level of performance in retailer-supplier
transactions. Higher levels of reliability among milk suppliers increased the likelihood that
performance would be higher. This result underscores the need to transact with a small set of
partners who can be monitored or vetted for reliability compared to a large number of
partners.

DETERMINANTS OF COORDINATION AND SUPPLY CHAIN PERFORMANCE
143
In summary the results show that the main factors that contribute to higher levels of
satisfaction in retailer-supplier transactions are use of relational based coordination
mechanisms (verbal to written contracts), better price offers, better market information flows
and communications, and high supplier reliability. On the other hand, retailers were not
satisfied with direct supplies of milk from the farms. Retailers in Nakuru were also not
satisfied in their transactions with milk suppliers.
7.6 Performance in retailer-buyer milk transactions
Table 7.9 below shows probit results for the determinants of performance in retailer-buyer
transactions. Performance was measured on two-point scale; low performance and high
performance, necessitating the use of a binary probit model according to whether the retailers
were satisfied or not in transactions with their partners.
Reliability of buyers was important in influencing the level of satisfaction of milk retailers in
their transactions with milk buyers. High buyer reliability therefore increased the possibility
of higher satisfaction in retailer-buyer transactions. Reliability coupled with better or higher
prices significantly increase the chances that the retailers would be satisfied in their
transactions with milk buyers. Better information flows and communications with buyers
were also positively associated with higher satisfaction in the retailer-buyer transactions. The
presence of adequate numbers of buyers in the market also increased the chances of higher
performance for the retailers.
The type of coordination mechanism did not significantly influence the level of performance
but the positive coefficient implies that written contracts and verbal contracts were likely to
be associated with high performance relative to spot market contracts. Similarly, absence of
quality problems in the milk transactions increased the possibility of attaining higher
performance levels in retailer-buyer transactions.
On the other hand, difficulties in finding alternative milk buyers were significantly associated
with lower satisfaction in retailer-buyer transactions. This is a reflection of thin markets and
high transaction costs that prevail in the market. Other factors that were not statistically
significant but which had a negative effect on performance were transport problems and low
educational levels, both of which were associated with low satisfaction levels in the retailer-
buyer transactions.
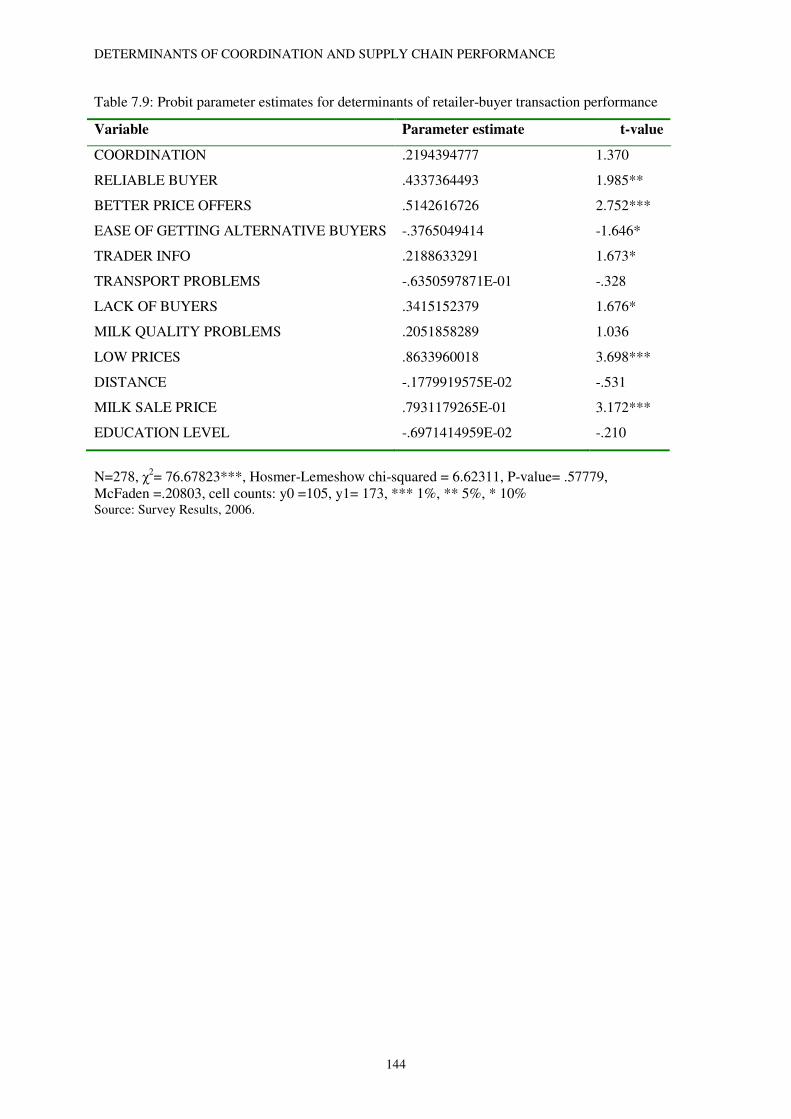
DETERMINANTS OF COORDINATION AND SUPPLY CHAIN PERFORMANCE
144
Table 7.9: Probit parameter estimates for determinants of retailer-buyer transaction performance
Variable Parameter estimate t-value
COORDINATION .2194394777 1.370
RELIABLE BUYER .4337364493 1.985**
BETTER PRICE OFFERS .5142616726 2.752***
EASE OF GETTING ALTERNATIVE BUYERS -.3765049414 -1.646*
TRADER INFO .2188633291 1.673*
TRANSPORT PROBLEMS -.6350597871E-01 -.328
LACK OF BUYERS .3415152379 1.676*
MILK QUALITY PROBLEMS .2051858289 1.036
LOW PRICES .8633960018 3.698***
DISTANCE -.1779919575E-02 -.531
MILK SALE PRICE .7931179265E-01 3.172***
EDUCATION LEVEL -.6971414959E-02 -.210
N=278, χ2= 76.67823***, Hosmer-Lemeshow chi-squared = 6.62311, P-value= .57779, McFaden =.20803, cell counts: y0 =105, y1= 173, *** 1%, ** 5%, * 10% Source: Survey Results, 2006.
SUMMARY AND IMPLICATIONS FOR POLICY
145
CHAPTER 8
SUMMARY AND IMPLICATIONS FOR POLICY
The chapter is organized as follows. Section 8.1 presents a summary of the major findings in
the study. Section 8.2 discusses the implications of the study for industry and policy in light
of the findings and section 8.3 suggests areas for further research in light of the changes
occurring in the dairy industry in Kenya.
8.1 Summary
The study has investigated two main issues among the market participating agents in the
Kenyan milk supply chains. The first issue was to identify and evaluate the determinants of
coordination mechanisms used in the Kenyan fresh milk supply chains. The second was to
identify and evaluate the determinants of supply chain performance in the milk supply chains.
The issues were investigated for transactions between milk producers and their buyers,
between retail outlets and their suppliers, and between the retail outlets and their buyers.
Coordination was defined by the kind of contracts used in transactions between the sellers and
the buyers of milk. Three types of coordination mechanisms were identified in the milk
supply chains; spot market based contracts, verbal contracts and written contracts. On the
other hand, supply chain performance was defined by the extent to which the supply chain
partners were satisfied with key aspects of their transactions with their partners and was
measured on likert type scales.
To investigate the two issues, primary data was collected on commercial dairy activities from
two districts in Kenya, Nakuru and Nyandarua districts. The data collected comprised of the
agents’ socioeconomic characteristics, farm/firm specific factors, transaction cost
characteristics and performance related aspects such as prices, milk quantities, milk quality,
information flows and communications, and transaction partner reputation and
trustworthiness. The data was collected using questionnaires that were personally
administered to milk producers and traders in the two districts between April and September
2005. Two econometric models were applied to analyze the collected data. A multinomial
logit model was applied to analyze the determinants of coordination mechanisms while an
ordered probit model was applied to analyze data for determinants of supply chain
performance. Both models were run in LIMDEP™ econometric software. Additional
descriptive analyses were carried in SPSS™ statistical software.

SUMMARY AND IMPLICATIONS FOR POLICY
146
Determinants of coordination mechanisms
The results of multinomial logit model showed that in all transactions between the milk sellers
and buyers, agents in Nakuru district favored employing verbal and written contracts but their
counterparts in Nyandarua district were more disposed to using spot market contracts.
Socioeconomic characteristics however had no influence on the kind of governance mode
used by the producers except for enterprise experience. Enterprise experience was significant
in explaining the use of verbal contracts only in producer-buyer transactions. The role of
gender was prominent in the traders’ transactions with the milk suppliers and milk buyers.
Male retail operators were likely to use spot market contracts while their female counterparts
were disposed to using verbal and written contracts. The age of the operator also played a role
in transactions between milk retailers and buyers such that older retail operators were inclined
to use spot market contracts while younger retail operators were more likely to use verbal and
written contracts.
The results also show that the three components of transaction costs (information and market
search, negotiation and monitoring costs) were significant in explaining the kind of
coordination mechanisms employed. In all the three transaction types, the length of credit
period played a significant role in determining the kind of coordination mechanisms used.
Short credit periods favored use of spot market contracts while long credit periods increased
the likelihood that verbal and written contracts would be used, which shows the importance of
monitoring and enforcement costs in the milk transactions. Monitoring costs were further
underlined by the importance attached to legal contracts in producers’ transactions with their
buyers. Legal contracts were not significant in trader transactions.
Market and information search problems were exemplified in various ways in the milk
transactions. In producer-buyer transactions, producers that did not have adequate market
information had a high probability of using spot market contracts while those that had access
to more information were more likely to use verbal and written contracts. On the other hand,
the effect of information on the type of coordination mechanisms in retailer-supplier
transactions depended on the type of information source. Two sources of price information
were significant in the retailer-supplier transactions. Information from traders increased the
likelihood of using relational based coordination mechanisms while government information
sources increased the likelihood of using spot market contracts in the transactions. The effect
of market information on retailer-buyer transactions was not significant.

SUMMARY AND IMPLICATIONS FOR POLICY
147
Further indicators of market search costs were reflected in distances and times required to
reach the buyers or sellers. Distance to market was significant in influencing the use of
written contracts in transactions between the producers and the buyers. Longer distances
increased the likelihood that written contracts would be used with similar results being
reflected in retailer-buyer transactions. However, in retailer-supplier transactions, the most
important component was the time required to reach the milk suppliers. Longer times to reach
suppliers were associated with spot market contracts while shorter times were associated with
verbal and written contracts.
The results also show that more negotiation costs were present in producer’s transactions with
the buyers. One measure of the negotiation costs was prices received or paid for the milk. In
producer-buyer transactions, low prices were associated with verbal and written contracts
while high prices were associated with spot market contracts. On the other hand, in
transactions between retailers and buyers, low prices were associated with spot market
contracts and high prices with verbal and written contracts. The lower spot market prices are a
result of the competition in the retail markets where buyers have many outlets to choose from.
In this case, retailers are price takers with little influence on the prices consumers pay.
However, the retailers seem to be able to negotiate with processing firms and other buyers for
favorable prices which may be attributed to the size of their operations.
Buyer/supplier availability was important in transactions between producers and their buyers
and between retailers and their milk suppliers. In both cases, low buyer/supplier availability
increased the likelihood that spot market contracts would be used while the presence of an
adequate number of buyers or suppliers increased the probability that verbal and written
contracts would be used in the transactions. The significance of buyer availability implies that
producers are compelled to transact in open markets with the implication that the anxiety to
sell their milk as fast as possible denies them bargaining strength in the market. Sales in the
open markets therefore prevail in the absence of adequate numbers of buyers, and in retailer-
supplier transactions, when low supplier unreliability and lack of personal relations among the
transacting parties prevail in the transactions. Another important factor in producers’ and
retailers’ transactions with their buyers and suppliers is the time needed to sell the milk which
indicates that shorter times to sell milk were associated with spot market contracts while
longer times to sell were associated with verbal and written contracts. This finding reinforces
the results on lack of buyers and the urgency to sell milk that characterizes the use of spot
market contracts and consequently contributes to the low bargaining power (especially)
among the milk producers. A summary of these results is presented in table 8.1 below

SUMMARY AND IMPLICATIONS FOR POLICY
148
Table 8.1 Determinants of coordination mechanisms in the milk supply chains
Factor Spot market contracts Verbal contracts Written contracts
Location Nyandarua Nakuru Nakuru Gender Males Females Females Age Older Younger Younger Experience Low High Not significant Trader Information sources
Low High High
Government information sources
High Low Low
Distance to partners Short Long Long Time to reach market Long Short Short Time to sell milk Long Short Not significant Prices of milk Lower for suppliers,
high for producers
High Lower for producers, high for retailers
Reliability/relations Low High High Buyer availability Low High Not significant Length of credit period Low High High Importance of legal contracts
Low High High
Source: Survey Results, 2006.
Determinants of supply chain performance
The ordered probit model results show that socioeconomic characteristics did not significantly
influence performance in the fresh milk supply chains at both producer and retailer stages of
the milk supply chain. But one firm specific factor, location of firm, was significant in the
traders’ transactions with their milk suppliers. Traders in Nyandarua district appear to
experience difficulties in getting milk supplies and are thus less satisfied in their transactions.
The difficulties in milk supplies in Nyandarua district could be attributed to the prevalence of
higher transaction costs arising from thin markets and infrastructural problems. Location did
not have a significant influence on performance in producer-buyer and retailer-buyer
transactions. Another significant firm specific factor in the retailer-supplier transactions was
the type of milk supplier. Milk supplies from other traders rather than from farmers led to
lower performance levels, a result attributed to high purchase prices and quality problems,
however, farm supplies did not guarantee higher performance possibly due to the higher
transaction costs associated with transacting with individual farmers.
The type of coordination mechanism used had a significant influence on the performance of
retailer-supplier transactions but not between producers and their buyers or retailers and their
buyers. However, in all cases, coordination mechanisms were positive in effect implying that
there was possibility of higher performance with respect to verbal and written contracts. Use
of spot market contracts was likely to lead to lower satisfaction levels than use of verbal and
written contracts.

SUMMARY AND IMPLICATIONS FOR POLICY
149
Transaction cost characteristics were significant at all stages of the fresh milk supply chain.
The main transaction cost characteristics influencing the level of performance at the producer
stage of the supply chain were mainly negotiation cost factors such as milk selling prices and
the length of time taken to sell the milk and information and market search factors
(information sources from traders). The results were also mirrored in retailer-supplier
transactions and retailer-buyer transactions, where similar factors were significant
determinants of supply chain performance in the milk transactions. Monitoring cost related
factors did not play a significant role in the producer-buyer performance but the presence of
partner reliability was an important safeguard in selecting the kind of transaction partners so
as to minimize the possibility of opportunism.
8.2 Implications of the study for policy
Changing institutional set up and liberalization
The changing institutional set up in the agricultural sectors in most developing countries does
not call for widespread and direct state interventions in industries that have been recently
liberalized. However, this does not imply that the government has no role to play in these
industries. The challenge facing governments in developing countries is in ensuring that the
benefits of institutional changes accrue to the largest portion of its populace, rather than to a
few individuals. In the agricultural sector, consumers and producers are the two major groups
of interest and the effects of the institutional changes should be seen in terms of how they
affect the two groups. Furthermore, the sustainability of the industries dependents on how
satisfied the consumers and producers are with the changes. Consumers’ interest lies in being
able to access agricultural products at affordable prices, that is, getting value for their limited
resources. For the producers, it is in being able to proportionally share in the benefits accruing
from their activities rather than all the rents accruing to a few agents in the industry. This
study has important implications for the two groups and on the sustainability of the benefits
accruing from the liberalization of the dairy industry and in extension, the entire agricultural
sector.
The implications of the institutional changes on coordination in the milk industry can be
looked at from the benefit-cost point of view. In moving from the single processing firm in
the pre-liberalization period, to the current regime where the number of participants in the
milk supply chain has increased tremendously, several points arise. First and foremost, the
large number of processing firms that came up after liberalization provided milk producers
with a chance to exercise their choice over who to trade with in order to maximize their net
SUMMARY AND IMPLICATIONS FOR POLICY
150
benefits. This benefit of choice however seems to be limited to a few regions while other
regions are yet to experience the benefits (Nyandarua district is an example here). Despite the
fact that Nyandarua district is one of the highest milk producing districts in the country,
farmers have not benefited much from the changes due to lack of milk processing firms in the
district. Empirical results have shown that when producers are faced with lack of adequate
buyers, low market information, and the urgency to sell the milk, they resort to using spot
market contracts. The results on performance also indicated that producers taking short times
to sell are likely to perform better in the market. Since most of the producers who use spot
market contracts come from Nyandarua district, it can be inferred that the performance of
milk producers in the district is low and that the exposure to the open market transactions has
not benefited them due to limited bargaining power. Therefore prevalence of spot market
contracts in Nyandarua district is an indicator of institutional and organizational failure rather
than market efficiency. These failures have been detrimental to both milk producers and
consumers of processed milk.
Farmer cooperative organizations
The nature of the production system that consists of many small producers means that
transaction costs are relevant to them. Their small sizes cannot allow them individually and
separately to reap economies of scale or impact favorably on the market. Their semi
commercial nature further implies that productivity is low. It is costly for the producers to
search for markets for their products. Transaction costs are therefore relevant to these
producers. One way of addressing the problem of transaction costs is through farmer
cooperative organizations.
Institutions in the dairy industry are undergoing changes. The dominant organizations before
liberalization were farmer cooperative organizations. But a large number of the cooperatives
have since failed and therefore deliberate steps are required to ensure that more cooperative
organizations and institutions are set up in the agricultural supply chains. In some areas
farmer groups are being formed as alternatives to cooperative societies. Brokers and agents
are also emerging in the dairy industry, buying milk from producers and selling to processing
firms and or other traders or consumers. Brokers and agents are trying to fill the gaps left by
cooperative societies. Smaller traders (mobile traders) have also come up to deliver milk from
the farms directly to the consumers, especially in the urban areas. The main difference
between these upcoming modes of organizations and farmer cooperatives is that they are
private enterprises. However, they play an important role in directing the farmers’ milk to the
SUMMARY AND IMPLICATIONS FOR POLICY
151
market. Until farmers themselves come up with their own organizations to use in organizing
their production for the market, the benefits in the milk supply chain will continue accruing to
the middlemen while farmers receive only marginal benefits for their milk. Empirical results
indicated that it will be difficult for farmers to have an impact in the market or endear
themselves to partners in the supply chains when acting singly. Middlemen and other retail
outlet operators prefer to transact directly with farmers due to favorable farm gate prices and
ability to monitor milk quality, however, direct farm supplies was not able to significantly
lead to high performance levels.
Cooperatives are supposed to provide small producers with a means of reducing transaction
costs they face through substituting individual information search, quality control, market
search and monitoring for the group activity. Transport costs can be lower through collective
action. The problem of small size productions is reduced by accumulating their quantities into
one unit. Cooperatives can also guarantee a more or less continuous supply of products for
other chain members. The failure of these member owned organizations further raises
transaction and other costs that the participants (especially producers) face in the market.
With the failure of cooperatives, horizontal co-ordination through collection and
transportation is lost for the producers. The results have indicated that retail operators
sourcing their milk directly from farmers were more likely to be satisfied or likely to perform
better compared to those who got their milk from other traders. Transaction costs were higher
for direct farm supplies since direct farm supplies involve searching for and transacting with
very many small farmers individually but compensated with favorable farm gate prices. In
such a case, the transaction costs faced by retailers outweigh the benefits arising from the
lower farm gate prices. Cooperative organizations can therefore play a vital role in reducing
the transaction costs (especially the bargaining costs) to ensure that they are not taken
advantage of due to their small sizes.
The results have consequences for the policy makers in charge of the cooperative movement
to assist in providing guidelines and education to farmers on the importance of cooperatives
and their role in the milk supply chains and essentially in identifying the causes for the failure
of farmer cooperative organizations. Cooperatives enable farmers to increase their role in the
milk supply chain and share in the rents available in the market with their consumers through
increased bargaining power in the market. Cooperatives increase the possibility of reducing
transaction costs for the producers and thus making them attractive partners to transact with in
the milk supply chain. Cooperative organizations should be strengthened to assist the small
scale farmers to achieve their goals.

SUMMARY AND IMPLICATIONS FOR POLICY
152
Importance of stable contractual arrangements
The study also has implications for the sustainability of the dairy enterprises in the country
especially the competitiveness of the milk supply chains. There is need to come up with
successful milk supply chains that are able to compete against each other in the market.
Farmers have to identify which supply chain partners they can link up with in order to deliver
affordable and quality milk products to consumers. This is due to the realization that full
commercialization of the dairy industry improves milk producers’ production methods hence
making them more efficient and competitive.
For sustainability and competitiveness to be achieved, the consumer has to be taken into
consideration. Milk prices must be within what the consumer can afford otherwise farmers
will not find it worthwhile to invest if they can not sell their milk. The implications are that
supply chain members have to add value in the supply chains for the benefit of the consumers.
Unnecessary costs must be eliminated in the supply chains. This requires foregoing short term
gains to establish supply chains that can bring value to the consumers. Close working
relations with supply chain partners is necessary to achieve competitiveness in the supply
chains. In this regard, the use of explicit contracts and relational based contracting will be
necessary coupled with information exchange. The results indicated that quantities of milk
handled under written contracts were generally higher than under alternative coordination
mechanisms. Performance results also showed that agents using relational based contracting
were more likely to be satisfied in their transactions with their partners than those relying on
the spot market contracts to transact their milk. Verbal contracts are an important component
of the milk transactions, however, as the results demonstrate, verbal contracts are not
adequate to guarantee the producers and traders full sale of their milk. They are also restricted
within the locality of the agents. It therefore means that the highest potential for all
participants lies in being able to find markets beyond their localities where verbal contracts
may no longer be effective. Written contracts are therefore likely to play a crucial role to
safeguard all the agents involved. Use of written contracts should make it easier for the
farmers to increase their investments in their enterprises and consequently benefit from their
commercial activities.
Processing firms and milk prices
The importance of the processing firms in the milk supply chain is that they ensure that
consumers are able to access milk when they need it, and that farmers are given chance to

SUMMARY AND IMPLICATIONS FOR POLICY
153
expand their production due to the large quantities of milk the firms are able to buy. Though
the number of processing firms was initially high, some are now inactive and concentration is
going on in the industry. Some market power is thus exercised over the small producers in
matters regarding quality and quantity of the milk. However, the large number of small
producers may make it difficult to carry out monitoring activities due to the high transaction
costs involved. Buying in bulk or in larger quantities and regularity and stability of delivery is
of interest for the processors and other buyers. The prices paid for milk deliveries reflect the
differences in transaction costs, and consequently their performance differentials.
The main challenges facing processing firms in the milk supply chain is utilization of their
installed processing capacity. This problem is compounded by the fact that the prices of
processed milk are usually beyond the reach of most consumers. Processing firms thus incur
high fixed costs which are passed over to consumers further shrinking the consumer base for
processed milk. It is necessary for the processing firms to increase efficiency in milk
processing so as to keep the costs and prices to consumers low to stimulate more consumption
of milk. This will further improve capacity utilization and lead to further price reductions.
Uptake of milk from producers will also increase. Thus the findings have implications for the
management of the private firms involved in the dairy industry to increase their efficiency as
they are necessary for the sustainability and full commercialization of the dairy industry.
Information flows in the supply chains
The study identifies two major sources of market information and their importance in
affecting the amount of transaction costs in the milk supply chains: public and private
information sources. The study shows that agents that did not have advance price information
sold their milk using spot markets contracts while those who had the information entered into
verbal and written contracts. For the farmers, the source of market information was not
important rather the availability of the information. But for the traders, the effect of the
information depended on the source of the information. The information needs of producers
and traders are not exactly the same. Farmers prefer information that is generally available
irrespective of the sources. For the traders, information exchange among them led to more use
of verbal and written contracts while availability of public market information was likely to
increase use of spot market contracts.
Despite the differences in the information sources, public information is necessary to make
the market more transparent. The consequence is that public information sources improve the
market condition for all participants while private information is used to benefit only a few

SUMMARY AND IMPLICATIONS FOR POLICY
154
agents in the market. Furthermore, higher information availability was positively associated
with satisfaction in transactions with their partners. The results also point to the necessity of
setting up market information bureaus to assist market participants make informed decisions
in their transactions. This recommendation can be supported by the result that price
knowledge was more likely to lead to better contracts being crafted thus reducing
opportunistic tendencies among the supply chain partners. In this case, the role of the Kenya
Dairy Board should be re-evaluated to incorporate dairy information dissemination within the
dairy industry.
Infrastructural facilities and other public goods
The information problems facing the farmers and traders are also as a result of inability to
access markets due to poor transport infrastructure. Poor infrastructure is represented by poor
road conditions and lack of proper means of transport. This implies that distances may not
necessarily be long but that it takes a long time to get to the market. As such, agents are not
able to access the market on time. A remedy for this problem can be provided by the
government undertaking policies aimed at improving access to milk producing areas. This
will ensure faster access to the markets and consequently access the necessary information for
their transactions. Information costs are a vital component of fixed transaction costs that can
determine whether one participates in the market or not or whether a particular coordination
mechanism is optimal or not. Thus improvement of transport infrastructure and provision of
market information are vital interventions in reducing both the fixed transaction costs and the
subsequent variable transaction costs.
The interventions are based on the observation that the nature of the transaction costs faced
keep changing and can be affected by the supply chain partners or the government’s policies
regarding efforts to reduce the transaction costs. Such policies and efforts include
infrastructural reforms (such as road construction, provision of market information), and
mechanisms to improve legal redress that may arise from the contractual obligations of the
partners. This is basically in the provision of public goods that benefit all the participants in
the industry. Thus state can play an important role by providing or improving the institutional
environment and physical infrastructural facilities, which are public goods. This should be
able to address a number of transaction costs related to information and market search and
monitoring and enforcement costs. The number and types of transaction costs are likely to be
reduced for the benefit of the dairy industry and the agricultural sector as a whole.
SUMMARY AND IMPLICATIONS FOR POLICY
155
Government participation in business
There have been efforts by the government to participate in the dairy sector especially in the
processing of milk. However, the participation has been in terms of being one of the
processing firms on commercial basis and to act as a market leader to stabilize the industry.
Such efforts have not hindered the private sectors’ participation, as long as it is run purely on
commercial basis. The reason for the re-entry into the market was that the market was facing
problems following the failure of the sole milk processing firm after liberalization. Farmers
had limited outlets for their milk and the need to correct this situation led to revamping of the
Kenya Cooperative Creameries into a new firm New KCC Ltd, now a parastatal body. The
government’s investment in the firm should help stabilize the milk market and provide chance
for the farmers to come up with appropriate organizational forms that they can use to
negotiate with other supply chain members for their benefit. However, the government
should, with time, reduce its ownership in the firm in favor of private ownership (e.g. issue
shares to the public and farmers) to minimize political interference in its management and in
its commercial orientation.
8.3 Directions for further research
The role of information in both the kind of coordination mechanisms used and on the
performance of the supply chains has been shown to be significant. However, information
comes in different types. Private information supports formation of relational based
contracting modes to the exclusion of the market. Government or public sources of
information encourages not only the development of market based transactions but also
provides a basis for coming up with better relational based contracts especially written
contracts. There is need to design information systems that can serve the various parties in the
supply chains. In this regard, there is need to evaluate the relative merits and feasibility of the
various information sources and their implications for the participants in the milk supply
chain. It is also important to design how this information can be disseminated in the industry
and the costs that are likely to arise from the provision of the services and who is going to pay
for it. This will also help place the Kenya Dairy Board’s functions in perspective and the
possibility of the organization playing the role of information dissemination in the industry.
An evaluation of transaction costs and coordination at the production and trader/retailer levels
of the supply chain has been investigated. Furthermore, some downstream members in the
milk supply chain have been included in the study. For a holistic approach to the supply

SUMMARY AND IMPLICATIONS FOR POLICY
156
chain, other agents need to be incorporated in future studies. The agents include milk
processing firms and input suppliers as they play an equally vital role in the industry. Specific
interest is on the nature of transaction costs that the processing firms and input suppliers face
and how the costs affect their performance in order to minimize or eliminate them to create
value in the entire supply chain for the benefit of consumers. This will enable the alignment of
the supply chains for maximum effect in serving the consumers and benefiting the agents as
well.
Performance measurement has been arrived at based on subjective evaluations of the extent of
satisfaction with key aspects of the supply chain transactions. A further step in this
measurement process is to incorporate more quantitative supply chain performance measures
in the analysis. Quantitative supply chain performance measures are still developing and it
would be of interest to show how close or divergent the quantitative supply chain
performance measures are from the qualitative supply chain performance measures in the
milk supply chains.
The study has focused on small and medium scale milk producers as they constitute the
majority of the milk producers. It would be of interest to compare the transaction costs faced
by the small and medium scale producers on the one hand and the large scale milk producers
on the other. This will permit a full appreciation of the differences or similarities in the milk
production enterprises in the country that may be valuable for policy making purposes and
improvement of the commercial orientation of the milk producers.
Cooperative societies and farmer groups have been recommended as some of the important
institutions that can assist the milk producers in increasing their bargaining power in their
supply chains and in the reduction of the myriad transaction costs facing the small and
medium scale commercial milk producers. An evaluation of performance of farmer
cooperative organizations vis-à-vis other private intermediaries (middlemen) may help
identify areas of weaknesses for the farmer organizations and help them to improve their
services.

References
157
References
Abdulai, A. and C. L. Delgado (1999). Determinants of Non-Farm Earnings of Farm Based
Husbands and Wives in Northern Ghana. American Journal of Agricultural Economics,
81(February): 117-130.
Akerlof, G. A. (1970). The market for ‘‘Lemons’’: Quality Uncertainty and the Market
Mechanisms. Quarterly Journal of Economics, 84(3): 488-500
Alchian, A. and H. Demsetz (1972). Production, Information Costs, and Economic
Organization. American Economic Review, 62(5):777-795.
Allen, D. and D. Lueck (1992). Contract Choice in Modern Agriculture: Cash Rent Versus
Cropshare. Journal of Law and Economics, 35(October): 397-426
Allen, W. D. (1999). Transaction Costs. Department of Economics, Simon Fraser University.
http://encyclo.finlaw.com/0740book.pdf. Accessed 10.12.2005.
Aust, P. (1997). An Institutional Analysis of Vertical Coordination versus Vertical
Integration: The Case of the US Broiler Industry. Staff Paper No 97-24. Department of
Agricultural Economics, Michigan State University.
Barney, J. B. and H. William (1996). Organizational Economics: Understanding the
Relationship Between Organizations and Economic Analysis. In Clegg S.R.; C. Hardy,
and N.R. Walter (eds.), Handbook of Organization Studies. Sage Publications Ltd.,
London, pp. 115-148.
Beamon, B. M. (1999). Measuring Supply Chain Performance. International Journal of
Operations and Production Management, 19 (3): 275-292.
Beers, G, A.; J. M. Beulens; and J. H. Trienekens (1996). ‘Global Reference Information
Models for Product Chains in Agriculture: A Case of Apples and Pears’, in Hagelaar G.
(ed.). Proceedings of the 1st International Conference on Chain Management in Food
and Agri-Business. Wageningen Agricultural University, The Netherlands, pp. 205-217.
Bellemare, F. M. and C. B. Barret (2006). An Ordered Tobit Model of Market Participation:
Evidence from Kenya and Ethiopia. American Journal of Agricultural economics,
88(2):324-337.
Benham, A. and L. Benham (2000). Measuring the Costs of Exchange. In: Ménard, C. (ed.).
Institutions, Contracts and Organizations: Perspectives from New Institutional
Economics. Edward Elgar, Cheltenham, UK.

References
158
Benham, A. and L. Benham (1998). Measuring Costs of Exchange. Paper Prepared for the 2nd
Annual Meeting of the International Society for New Institutional Economics.
September 17-19. http://www.isnie.org/ISNIE98/Benham-Benham.doc. Accessed
January 2006.
Boger, S. (2001a). Agricultural Markets in Transition: An Empirical Study on Contracts and
Transaction Costs in the Polish Hog Sector. Institutional Change in Agriculture and
Natural Resources. Volume 4. Shaker Verlag, Aachen.
Boger, S. (2001b). Quality and Contractual Choice: A Transaction Cost Approach to the
Polish Hog Sector. European Review of Agricultural Economics. 28(3): 241-261.
Bolstorf, P. (2003). Measuring the Impact of Supply Chain Performance. Logistics Today,
Vol. 12. Penton Publishing.
Brewer, P. C. and T. W. Speh (2000). Using the Balanced Scorecard to Measure Supply
Chain Performance. Journal of Business Logistics, 21 (1):75 – 93.
Buvik, A. and O. Andersen (2002). The Impact of Vertical Coordination on Ex Post
Transaction Costs in Domestic and International Buyer-Seller Relationships. Journal of
International Marketing, 10(1):1-24.
Buvik, A., and G. John (2000). When Does Vertical Coordination Improve Industrial
Purchasing Relationships? Journal of Marketing, 64(4):52-64
Casson, M. (1991). The Economics of Business Culture: Game Theory, Transaction Costs and
Economic Performance. Oxford University Press, New York.
CBS (2006). Statistical Abstract, 2005. Ministry of Planning and National Development,
Kenya. Government Printer, Nairobi.
Chen, I. J and A. Paulraj (2004). Understanding Supply Chain Management: Critical Research
and a Theoretical Framework. International Journal of Production Research. 42(1):
131-163.
Clague, C. (Ed.) (1997). Institutions and Economic Development: growth and governance in
less-developed and post-socialist countries, John Hopkins University Press, Baltimore.
Coase, R. H. (1937). The Nature of the Firm. Economic, 4: 386-405.
Daganzo, C. F. (2003). A Theory of Supply Chains: Lecture Notes in Economics and
Mathematical Systems. Springer. Berlin.
References
159
Davis, L. (1986). Comment. In Engerman, S. L. and R. E. Gallman, Eds. Long term Factors
in American Economic Growth. Vol. 51 of Studies in Income and Wealth Series.
University of Chicago Press, Chicago.
De Janvry, A.; M. Fafchamps, and E. Sadoulet (1991). Peasant Household Behaviour with
Missing Markets. Some Paradoxes Explained. The Economic Journal. 101: 1400-1417.
de Treville, S. and A. P. Hameri (2002). From Supply Chain to Demand Chain: The Role of
Lead Time Reduction in Improving Demand Chain Performance, Working Paper IUMI
0208
Debrah, S. and B. Anteneh (1991). Dairy Marketing in Ethiopia: Markets of First Sale and
Producers' Marketing Patterns. ILCA Research Report 19, ILCA (International
Livestock Centre for Africa) Addis Ababa, Ethiopia.
http://www.ilri.cgiar.org/InfoServ/Webpub/Fulldocs/X5534e/x5534e00.htm Accessed
on 30.4.2006
Dewatripont, M. and G. Roland (1996). Transition as a Process of Large Scale Institutional
Change. Economics of transition, 4 (1):1-30.
Douma, S. and H. Schreuder (2002). Economic Approaches to Organizations. 3rd ed. Prentice
Hall. Essex, London.
Douma, S. W. and H. Schreuder (1991). Economic Approaches to Organizations. Prentice
Hall International (UK) Ltd, London.
Doward, A. (1999). A Risk Programming Approach for Analysing Contractual Choice in the
Presence of Transaction Costs. European Review of Agricultural Economics, 26(4): 479-
492.
Doward, A. (2001). The Effects of Transaction Costs, Power and Risk on Contractual
Arrangements: A Conceptual Framework for Quantitative Analysis. Journal of
Agricultural Economics, 52(2): 59-73.
Downy, D. W. (1996). ‘The challenge of Food and Agri Products Supply Chains’, in
Trienekens J.H. and P.J.P. Zuurbier (eds.), Proceedings of the 2nd International
Conference on Chain Management in Agri and Food Business, Wageningen
Agricultural University, May, The Netherlands, pp. 1-13.

References
160
Drabernslott, M. (1995). Agricultural Industrialization: Implications for Economic
Development and Public Policy. Journal of Agricultural and Applied Economics, 27(1):
13-20.
Drugger, W. M. (1983). The Transaction Cost Analysis of Oliver Williamson: A New
Synthesis. Journal of Economic Issues, XVII (1): 95-114.
Dyer, J. H. (1997). Effective Inter-firm Collaboration: How Firms Minimize Transaction
Costs and Maximize Transaction Value. Strategic Management Journal, 18(7): 535-556.
Eggertson, T. (1999). Economic Behaviour and Institutions: Cambridge Survey of Economic
Literature. Reprint. Cambridge University Press, Cambridge.
Ejupu, E.; J. F. K. Kirsten, and M. Makhura (1999). Food Security in a Commercializing
Rural Economy: Initial Findings from a Case Study in Uganda. Agrekon, 38(4):827-838
Fafchamps, M. (1992). Cash Crop Production, Food Price Volatility, and Rural Market
Integration in the Third World. American Journal of Agricultural Economics, 74.
(February): 90-99
Fafchamps, M. (2004). Market Institutions in Sub-Saharan Africa: Theory and Evidence. The
MIT Press. Cambridge, Massachusetts.
Fafchamps, M. and B. Minten (2001). Property Rights in a Flea Market Economy. Economic
Development and Cultural Change, 49 (2): 229-268.
Fahlbeck, E. (1996). Transaction Cost Determinants in Co-operatively Organized Slaughter
Business in Sweden. In Fahlbeck, E (ed.) Essays in Transaction Cost Economics.
Uppsala: Swedish University of Agricultural Sciences.
FAO (2006). FAOSTAT Data. http://faostat.fao.org/faostat/ Accessed February 2006.
FitzRoy, F.R.; J.A. Zoltan, and A. G. Daniel (1998). Management and Economics of
Organization, Prentice Hall Europe.
Frank, D. and D. R Henderson (1992). Transaction Costs as Determinants of Vertical
Coordination in the Us Food Industry. American Journal of Agricultural Economics,74:
941-950
Furutbon E. G. and R. Richter (2005). Institutions and Economic Theory: The Contributions
of the New Institutional Economics. 2nd ed. University of Michigan Press,
Gabre-Madhini, E. (2001). Market Institutions, Transaction Costs and Social Capital in the
Ethiopian Grain Market. IFPRI Research Report 124. Washington, D.C.

References
161
Gimenez C. and E. Ventura (2003). Supply Chain Management as a Competitive Advantage
in the Spanish Grocery Sector. International Journal of Logistics Management, 14 (1):
77-88.
Girgzdiene, V.; M. Hartman; A. Kuodys; V. Vaikutis, and J. Wandel (1999). Industrial
Organisation of the Food Industry in Lithuania: Results of an Expert Survey in the
Dairy and Sugar Branch. IAMO Discussion Paper No 21. Halle.
Goetz, S. J. (1992). A Selectivity Model of Household Food Marketing Behaviour in Sub-
Saharan Africa. American Journal of Agricultural Economics, 74 (May): 444-452.
Greene, W. H. (2003). Econometric Analysis. 5th ed. Prentice Hall, New Jersey.
Grosh, B. (1994). Contract Farming in Africa. An Application of New Institutional
Economics. Journal of African Economies, 3(2):231-261.
Hall, P. A., und D. Soskice, (2001): An Introduction to Varieties of Capitalism. In: Hall, P.
A., und D. Soskice (Eds.): Varieties of Capitalism: The Institutional Foundations of
Comparative Advantage. Oxford University Press, Oxford.
He, P. and M. Yang (1999). Case Analysis on the Formation of Transaction Costs for
Marketing by Farmers. Chinese Rural Economy. No 16:40-44.
Hernández-Espallardoa M. and N. Arcas-Lario (2003). The effects of authoritative
mechanisms of coordination on market orientation in asymmetrical channel
partnerships. International Journal of Research in Marketing, 20:133–152
Hieber R. (2002). Supply Chain Management: A Collaborative Performance Approach. VDF,
Zürich.
Hobbs, J. E and M.Y. Linda (1999). Increasing Vertical Linkages in Agrifood Supply Chains.
A Conceptual Model and Some Preliminary Evidence. Research Discussion Paper No.
35, Aug. 1999. University of Seskatchewan. http://agecon.lib.umn.edu/montana/rdp35.pdf
Accessed 4.1.2006.
Hobbs, J. E. (1996). A Transaction Cost Approach to Supply Chain Management. Supply
Chain Management, 1(2): 15-27.
Hobbs, J. E., Kerr, W. A., and Gaisford, J. D. (1997). The Transformation of the Agrifood
System in Central and Eastern Europe and the New Independent States. Wallingford,
Uk: CAB International.

References
162
Hobbs, J.E. (1997). Measuring the Importance of Transaction Costs in Cattle Marketing.
American Journal of Agricultural Economics, 79 (November): 1083-1095.
Hobbs, J.E. and Kerr, W.A. (1999). Transaction Costs. The Current State of Economic
Science, 4: 2111-2133.
Holloway, G.; C. Nicholson; C. Delgado; S. Staal and S. Ehui (2000). Agro-Industrialization
through Institutional Innovation, Transaction Costs and Cooperatives and Market
Development in the East African Highlands. Agricultural Economics, 23: 279-288.
http://www.ifpri.org/pubs/abstract/124/rr124.pdf. Accessed 10.11.2005.
Iyengar, D. (2005). Effect of Transaction Cost and Coordination Mechanisms on the Length
of the Supply Chain. PhD dissertation, University of Maryland, College Park.
http://hdl.handle.net/1903/3178, Accessed on 2/5/2005
Jabbar, M.A.; E. Tambi, and G. Mullins (1997). A Methodology for Characterizing Dairy
Marketing Systems. Market-Oriented Smallholder Dairying Research - Working
Document 3. ILRI, Nairobi. http://www.fao.org/Wairdocs/ILRI/x5467E/x5467e00.htm#Contents.
Accessed on 28.4.2006.
Johnson, S.; J. McMillan, and C. W. Christopher (1999). Contract Enforcement in Transition.
CESifo Working Paper Series
Joskow, P. L. (1985). Vertical Integration and Long Term Contracts: The Case of Coal
Burning Electric Generating Plants. Journal of Law, Economics and Organization, 1(1):
33-80.
Joskow, P. L. (1987). Contract Duration and Relationship Specific Investments: Empirical
Evidence from Coal Markets. The American Economic Review, 77(1):168-185.
Kaplan, R. S. and D. P. Norton (1996). The Balanced Scorecard. Harvard Business Press,
Boston, Massachusetts.
Karanja, A. M. (2003). The Dairy Industry in Kenya: The Post Liberalization Agenda.
Tegemeo Institute Working Papers No. 1.
Karanja, A.M. and J.K. Nyoro (2002). Coffee Prices and Regulation and Their Impact on
Livelihoods of Rural Community in Kenya. Tegemeo Papers, October.
Kedaitiene, A. and H. Hockman (2002). Milk and Milk Processing Industry in Lithuania: An
Analysis of Horizontal and Vertical Integration. IAMO Discussion Paper No. 44. Haale,
Germany.

References
163
Key, N; E. Sadoulet, and A. de Janvry (2000). Transaction Costs and Agricultural Household
Supply Response. American Journal of Agricultural Economics, 82 (May): 245-259
Klein, B. (1985). Self Enforcing Contracts. Journal of Institutional Change and Theoretical
Economics, 141 (4): 594-600.
Klein, B.; R.G. Crawford and A. Alchian (1978). Vertical Integration, Appropriable Rents,
and the Competitive Contracting Process. Journal of Law and Economics, 21 (2): 297-
326.
Klein, P. (1999). New Institutional Economics. Available: http://encyclo.findlaw.com/
0530book.pdf.
Koford, K and J. B. Miller (1999). A Model of Contract Enforcement in Early Transition.
Paper Presented at the 1999 ISNIE Conference, September 16-18, Washington, D.C.
Kydd J. and A. Doward (2003). Implications of Market and Coordination Failures for Rural
Development in Least Developed Countries. Paper Presented at the Development
Studies Association Annual Conference, Strathclyde University, Glasgow, 10-12
September.
Launonen, R.; A. Karinpaa; L. Marangu, and S. Munae (1985). Rural Dairy Development in
Meru: A Socio-Economic Study of Smallholder Milk Production, Consumption, and
Marketing. Institute of Development Studies, University of Helsinki.
Leathers, H. and S. Kähkönen (1998). Is there Life after Liberalization? Transaction Costs
Analysis of Maize and Cotton Marketing in Zambia and Tanzania. IRIS working paper
211. Morill Hall. Center for Institutional Reform and the Informal Sector.
Macberth D.K. and N. Ferguson (1994). Partnership Sourcing; An Integrated Supply Chain
Approach. Pitman Publishing, London.
MacFaden, D. (1984). Econometric Analysis of Qualitative Response Models. In Grilliches,
Z. and M. Intrilligator (eds). Handbook of Econometrics. Vol. 2. Amsterdam, North
Holland.
Makhura, M; J. Kirsten, and C. Delgado (2001). Transaction Costs and Smallholder
Participation in the Maize Market in the Northern Province of South Africa. Paper
Presented at the 7th Eastern and Southern Africa Regional Conference, 11th-15th
February 2001.

References
164
Makhura, Moraka Thomas (2001). Overcoming Transaction Costs Barriers to Market
Participation of Smallholder Farmers in the Northern Province of South Africa.
Unpublished PhD Thesis. University of Pretoria Thesis and Dissertations.
Masten, S. E. (2000). Transaction Cost Economics and the Organization of Agricultural
Transactions. Industrial Economics, 9: 173-195.
Masten, S.E. (1996). Empirical Research in Transaction cost economics: Challenges,
Progress, Directions. In: Groenewagen, J. (ed). Transaction cost economics and Beyond.
Kluwer, Boston.
Masten, S.E.; J.W. Meehan, and E. A. Snyder (1991). The Costs of Organization. Journal of
Law, Economics and Organization, 7(1): 1-25.
Masuku, M. B, and J. F. Kirsten (2004). The Role of Trust in the Performance of Supply
Chains: A Dyad Analysis of Smallholder Farmers and Processing Firms in the Sugar
Industry in Swaziland. Department of Agricultural Economics, University of Pretoria.
Menard, C. (1995). Markets as Institutions versus Organizations as Markets? Disentangling
Some Fundamental Concepts. Journal of Economic Behavior & Organization, 28(2):
161-182.
Ménard, C. (2000). A New Approach to the Agro Food Sector: New Institutional Economics.
In : Trienekens, J.H. and Zuurbier, P. (eds). Chain Management in Agribusiness and the
Food Industry. Proceedings of the Fourth International Conference. Wageningen,
Netherlands. Wageningen Pers, 11-21.
Mentzer, J. T.; W. DeWitt; J.S. Keeber; S. Min; N. W. Nix; C. D. Smith, and Z. G. Zacharia
(2001). Defining Supply Chain Management. Journal of Business Logistics. 22(2):1-25.
Milgrom, P. and J. Roberts (1992). Economics, Organization, and Management. Prentice
Hall, New Jersey.
Minot, N. (1999). Effect of Transaction Costs on Supply Response and Marketed Surplus:
Simulations Using Non Separable Household Models. MSSD Discussion Paper no 36.
Washington DC. International Food Policy Research Institute.
Minot, N. (2000). Generating Disaggregated Poverty Maps: An Application to Vietnam.
World Development, 28(2): 319-331

References
165
Ngigi, M. (2002). An Evaluation of the Impacts of Transaction Costs and Market Outlet Risks
on Market Participation of Smallholder Dairy Farmers in Central Kenya. Unpublished
Ph.D. Dissertation, University of Nairobi.
Ngigi, M. (2005). The Case of Smallholder Dairying in Eastern Africa, EPTD Discussion
Papers 131, International Food Policy Research Institute (IFPRI).
North D.C. (1990). Institutions, Institutional Change and Economic Performance. Cambridge
University Press, Cambridge.
North, D. C. (2000). Revolution in Economics. In C. Ménard (ed.). Institutions, Contracts and
Organizations. Perspectives from New Institutional Economics. Edward Edgar,
Cheltenham.
North, D. C. (2005). Institutions and the Performance of Economies over Time. In Ménard C.,
and M.M. Shirley: Handbook of New Institutional Economics. Springer, Netherlands.
Nyoro, J. (2002). Kenya’s Competitiveness in Domestic Maize Production: Implications for
Food Security. Tegemeo Institute Papers, Egerton University, Kenya
Nyoro, J. K.; M. W. Kiiru and T. S Jayne (1999). Evolution of Kenya’s Maize Marketing
Systems in the Post Liberalization Era. Tegemeo Working Paper 2a. Tegemeo Institute,
Egerton University, Kenya.
Omamo, S. W. (1998). Transport Costs and Smallholder Cropping Choice. An Application to
Siaya District , Kenya. American Journal of Agricultural Economics, 80 (February):
116-123.
Omamo, S. W., and L. O. Mose (2001). Fertilizer Trade under Market Liberalization:
Preliminary Evidence from Kenya. Food Policy, 26:1-10.
Omore A.; H. Muriuki; M. Kenyanjui; M. Owango and S. J. Staal (1999). The Kenya Dairy
Subsector: A Rapid Appraisal. Smallholder Dairy (Research and Development) Project
Report. Nairobi, Kenya.
Onyango, H. O.; G.A. Kodhek; J. Omiti, and J. K. Nyoro (2003). Revitalizing Agricultural
Productivity in Kenya. In: Kimenyi, S.M.; J.M. Mbaku and N. Mwaniki (eds).
Restarting and Sustaining Economic Growth and Development in Africa, the Case of
Kenya. Contemporary Perspectives on Developing Societies. Ashgate Publishing ltd.
Paarlberg, D. (1993). The Case for Institutional Economics. American Journal of Agricultural
Economics, 75 (August): 823-827.

References
166
Pingali, P.; K. Yasmeen, and M. Meijer (2005). Commercializing Small Farms: Reducing
Transaction Costs. ESA Working Paper No. 05-08, FAO.
Pint, E. M., & L. H. Baldwin (1997). Strategic Sourcing: Theory and Evidence from
Economics and Business Management, Report MR-865-PAF. Santa Monica: RAND.
Porter, M.E. (1985). Competitive Advantage: Creating and Sustaining Superior Performance.
The Free Press, New York.
Randolf, T and L. Ndung’u (2000). Gender and transaction costs: a conjoint analysis of
choice of livestock health services among smallholder dairying Kenya. Paper presented
at the XXIVth conference of the IAAE, August 18-24, Berlin.
Recannatini, F. and R. Ryterman (1999). Disorganization or Self Organization? Paper
Presented at the Third Conference of the International Society for New Institutional
Economics (ISNIE), Held in September in Washington, D.C.
Renkow, M.; D. G. Hallstrom, and D. D. Karanja (2004). Rural Infrastructure, Transaction
Costs and Market Participation in Kenya. Journal of Development Economics, 73: 349-
367.
Roland, G. and T. Verdier (1997). Transition and the Output Fall. CEPR Discussion Papers
1636.
Sadoulet, E. and A. de Janvry (1995). Quantitative Development Policy Analysis. The John
Hopkins University Press.
Scarborough V. and J. Kydd (1992). Economic Analysis of Agricultural Markets: A Manual. Chatham, U.K.: Natural Resources Institute (N.R.I.). NRI Marketing Series 5. pp 1-83.
Scherer F M. (1970). Industrial Market Structure and Economic Performance. Rand- McNally, Chicago, USA.
Schmidt, P. and R. P. Strauss (1975). The Prediction of Occupations Using Mode Multiple
Logit Models. International Economic Review, 16 (2): 471 – 486.
Shepherd W G. (1979). The Economics of Industrial Organization. Prentice Hall, Englewood Cliffs, NJ, USA.
Simon, H.A. (1991). Organizations and Markets. Journal of Economic Perspective, 5
(Spring): 25-44.
Spencer, M. and R. Zeckhauser (1971). Insurance, Information, and Individual Action.
American Economic Review, 61(2):380-387.

References
167
Staal S. J.; I. Baltenweck; M. M. Waithaka; T. De Wolf and L. Njoroge (2002). Location and
Uptake: Integrated Household and GIS Analysis of Technology Adoption and Land Use,
with Application to Smallholder Dairy Farms in Kenya. Agricultural Economics, 27:
295-315.
Staal, S. J.; C. Delado; I. Baltenweck and R. Kruska (2000). Spartial Aspects of Producer
Milk Price Formation in Kenya. A Joint Household GIS Approach. Paper Submitted to
the IAAE meeting, Berlin, August.
Staal, S.; C. Delgado and C. Nicholson (1997). Smallholder Dairying under Transaction Costs
in East Africa. World Development, 25(5): 779-794.
Staal, S.J. (2004a). Competitiveness of the Smallholder Dairy Enterprises in Kenya. The
Smallholder Dairy Project, Nairobi.
Staal, S.J. (2004b). The Demand for Dairy Products in Kenya. The Smallholder Dairy Project,
Nairobi.
Stigler, G.J. (1961). The Economics of Information. The Journal of Political Economy,
69(3):213-225
Stiglitz, J. (1998). Markets, Market Failures and Development. In Eicher, C., and J. Staatz
(eds.). International Agricultural Development, 3rd ed. Baltimore: John Hopkins
University Press.
Stijnen D. A. J. M; R. P. M. de Graaf and J.van der Roest (1998). Analyzing the Veal
Production Supply Chain: An Integrated Approach: Proceedings of the Third
Conference on Chain Management in Agribusiness and the Food Industry, Wageningen
University and Research Center, May.
Strasberg, P. J; T. S. Jayne; T. Yamano; J. Nyoro; D. Karanja, and J. Straus, (1999). Effects of
Agricultural Commercialization on Food Crop Input Use and Productivity in Kenya.
MSU International Development Working Paper No. 71. Department of Agricultural
Economics. East Lansing Michigan State University.
Train, K. (1993). Qualitative Choice Analysis: Theory, Econometrics, and an Application to
Automobile Demand. MIT Press, Cambridge, Mass.
Udry, C. (1996). Gender, Agricultural Production and the Theory of the Household. The
Journal of Political Economy, 104(5):1010-1046

References
168
UNSD (2006). Population and Vital Statisitics Report: Series A.
http://unstats.un.org/unsd/demographic/products/vitstats/default.htm Accessed may
2006.
Vakis R.; E. Sadoulet, and Alain de Janvry (2002). Transaction Costs and the Role of
Bargaining and Information: Evidence from Peru. Agricultural and Resource
Economics, University of California, Berkeley.
http://are.berkeley.edu/~sadoulet/papers/TC-wp.pdf
Vakis, R.; E. Sadoulet and A. de Janvry (2003). Measuring Transaction Costs from Observed
Behavior: Market Choices in Peru. http://are.berkeley.edu/rvakis/tc.pdf
Venkatraman N., and V. Ramanujan (1987). Measuring Business Economic Performance: An
Examination of Method of Convergence. Journal of Management, (Spring):109-122
von Bailey, D. and L. Hunnicutt (2001). The Role of Transaction Costs in Market Selection:
Market Selection in Commercial Feeder Cattle Operations. Proceedings of the
American Agricultural Association in Long Beach, CA July 28-31.
Wallis, J. J., and D. C. North (1986). Measuring the Transaction Sector in the American
Economy. In Engerman, S.L. and R.E. Gallman, (eds.), Long Term Factors in American
Economic Growth, Vol. 51 of Studies in Income and Wealth Series, University of
Chicago Press, Chicago.
Whan I.; G. K. and T. Suh (2004). Factors Affecting the Level of Trust and Commitment in
Supply Chain Relationships. The Journal of Supply Chain Management: A Global
Review of Purchasing and Supply, 40 (2) Spring.
Wikipedia (2006). Wikipedia: the free encyclopedia. Wikipedia Foundation, Boston.
http://en.wikipedia.org/wiki/Economics Accessed on 6.1.2006.
Williamson, O.E. (1971). The Vertical Integration of Production: Market Failure
Considerations. American Economic Review, 61(1971):112-13.
Williamson, O.E. (1975). Markets and Hierarchies: Analysis and Antitrust Implications. Free
Press, New York.
Williamson, O.E. (1981). The Modern Corporation: Origins, Evolution, Attributes. Journal of
Economic Literature, 19:1537-568.
Williamson, O.E. (1985). The Economic Institutions of Capitalism. The Free Press, New
York.

References
169
Williamson, O.E. (1989). Transaction Cost Economics. In. Schmalense, R. and R. (eds). The
Handbook of Industrial Organization. New York: North Holland. (Chapter 3.)
Williamson, O.E. (1991). Comparative Economic Organization: The Analysis of Discrete
Structural Alternatives, The Administrative Science Quarterly, 36: 269-296
Williamson, O.E. (1996). The Mechanisms of Governance. Oxford University Press, New
York.
Williamson, O.E. (2000). The New Institutional Economics: Taking Stock, Looking Ahead.
Journal of Economic Literature, Vol. 3.
Williamson, O.E. (2005). Transaction Cost Economics. In Ménard C., and M.M. Shirley
(eds). Handbook of New Institutional Economics. Springer, Amsterdam.
Winter-Nelson A. and A. Temu (2005). Impacts of Prices and Transaction Costs on Input
Usage in a Liberalizing Economy: Evidence from Tanzanian Coffee Growers.
Agricultural Economics 33(3):243-253.
Wooldridge, J.M. (2002). Econometric Analysis of Cross Section and Panel Data. MIT Press,
Cambridge, Massachusetts.
Zaibet, L.T., and E.G. Dunn (1998). Land Tenure, Farm Size, and Rural Market Participation
in Developing Countries: The Case of the Tunisia Olive Sector. Economics
Development and Cultural Change, 46(4): 831-48.
Zuurbier P.J.P. (1994). Structure and Strategy: The Seed Industry Structure and Firm
Strategies. In Hagelaar G. (ed.), Proceedings of the 1st International Conference on
Chain Management in Food and Agri-Business. Wageningen Agricultural University,
The Netherlands, pp. 148-168.
Zuurbier P.J.P. (1996). Market Structure and Vertical Co-ordination. In Trienekens J.H. and
P.J.P. Zuurbier (eds.), Proceedings of the 2nd International Conference on Chain
Management in Agri and Food Business. Wageningen Agricultural University, May,
The Netherlands, pp. 307-322.
Zuurbier, P. J.P and Bremmers H. (1997). Analyzing Farmer Coop Relations: An Adjusted
TCE approach. Wagenigen Agricultural University. Nl. Anais do I Workshop sobre
AgriChain management. Faculdade de Economía, Administracao e Contabilidade da
Universidade de Sao Pablo. Riberao Preto. Novembro.

References
170

Appendices
171
Appendices
Appendix 1: Questionnaires for Milk Producers
Questionnaire Number
Enumerator _________________
Sub-location _________________
Division _________________
District _________________
Please answer the following questions to the best of your knowledge.
1. When did you begin keeping dairy animals and with how many cows? Please state the year and the number
of cows.
Year Number of cows
2. What kind of milk products do you currently handle? Please provide also information about the milk
products as requested in the table.
Product Average
quantity per day
Units of measure
Do you sell product? Yes/No
How long it takes to sell product
Quantity able to sell before expiry or spoilage
Fresh milk Yoghurt Cheese Mala/fermented Other (specify) 3. a) What type of milk cows do you keep? Please tick the appropriate ones and also indicate their numbers.
Type Number 1) Indigenous cows 2) Cross breeds 3) Pure breeds (Grade)
b) Which one of the following grazing systems best describes your dairy operation? Please tick as
appropriate?
1) Zero grazing system
2) Open grazing without supplements
3) Open grazing with supplements
4) Tethering
5) Other, specify
4. a. How much milk do you currently produce per day on average? Please state also the units of
measure. Highest amount per day Lowest amount produced

Appendices
172
b) What quantity of the milk is consumed by your family per day on average? Please fill in the box the
amount and the units of measure used.
Amount units of measure
b. Considering the amount of milk in the question above (question 4 above), how does this amount
compare to what you produced in the previous year and what you expect in the coming year? Please tick as applicable. Compared to this year, last year was …. Next year is expected to be ……..
More More
The same The same
Less Less
5. a) What is the size of your dairy related workforce? Please state their number.
Permanent ___________________________ Casual ___________________________ Family labor ___________________________
b) What major costs do you usually incur in your milk operations? Please provide also information about
the costs by filling in and ticking as applicable.
Cost component Quantity/amount Frequency Trend over last five years Increasing Constant Decreasing Wages Power Fuel Water Forages and hay Veterinary and drugs Feed/concentrates Transport costs Others (specify) (NB: frequency = daily, weekly, bi-weekly or monthly) 6. Who are the main buyers of your milk products? Please provide also the following information about them
in the table below.
Type of buyer Quantity bought
Units Distance in km
Average time
Transport means
Transport costs
Who delivers/ collects
Commi-ssions
Neighbors Hotels Milk bar/kiosk Cooperatives Farmer groups Processors Mobile traders
Brokers Others(specify)

Appendices
173
7. What reasons explain why you trade with your current buyers? Please tick as applicable. a) Neighbors
Reasons True Partly true Not true Out of habit Reliability Better credit terms Better prices Cost of finding a new buyer is high Personal relations and contacts Presence of legal contracts Others (specify)
b) Hotels
Reasons True Partly true Not true Out of habit Reliability Better credit terms Better prices Cost of finding a new buyer is high Personal relations and contacts Presence of legal contracts Others (specify)
c) Milk bars/kiosk
Reasons True Partly true Not true Out of habit Reliability Better credit terms Better prices Cost of finding a new buyer is high Personal relations and contacts Presence of legal contracts Others (specify)
c) Cooperatives
Reasons True Partly true Not true Out of habit Reliability Better credit terms Better prices Cost of finding a new buyer is high Personal relations and contacts Presence of legal contracts Others (specify)

Appendices
174
d) Processors
Reasons True Partly true Not true Out of habit Reliability Better credit terms Better prices Cost of finding a new buyer is high Personal relations and contacts Presence of legal contracts Others (specify)
e) Mobile traders
Reasons True Partly true Not true Out of habit Reliability Better credit terms Better prices Cost of finding a new buyer is high Personal relations and contacts Presence of legal contracts Others (specify)
f) Others, please specify
Reasons True Partly true Not true Out of habit Reliability Better credit terms Better prices Cost of finding a new buyer is high Personal relations and contacts Presence of legal contracts Others (specify)
8. Which of the following best describes the buying frequency of your customers? Please indicate by ticking as
applicable below.
Type of buyer Regular buyer Irregular buyer Neighbors Hotels Milk bar/kiosk Cooperatives Farmer groups Processors Mobile traders Brokers Others(specify)

Appendices
175
9. Which of the following best captures your knowledge of milk prices in the market? Please tick one for each
of your buyers?
Type of buyer I always know prices in advance
I sometimes know prices in advance
I hardly know prices in advance
Other please specify
Neighbors Hotels Milk bar/kiosk Cooperatives Farmer groups Processors Mobile traders Brokers Others(specify)
10. How useful are each of the following as sources of market price information for your milk? Please tick as
appropriate using the scale: 1 = not useful 2= a little useful 3= useful 4= very useful
1 2 3 4 Information source Not useful A little useful useful Very useful
From neighbors and other producers From traders and buyers From government organizations Through mass media (radio, TV, Newspapers) Through negotiations Others, please specify
11. In the table below you are requested to provide information on your buyers by filling as appropriate in the table.
Type of buyer Price units Price over last one year
Quantity sold under each method of payment
low High cash In kind
Credit sales
Length of credit
Quantity paid within credit period
Neighbors Hotels Milk bar/kiosk Cooperatives Farmer groups Processors Mobile traders Brokers Others(specify)

Appendices
176
12. For each of the buyers of your milk, what kind of selling arrangements do you use? Please provide also
information about the agreements by filling in the table below.
Quantity sold under each type of selling agreement No
agreements Verbal agreements Written agreements
Type of buyer Quantity Duration of agreements
Quantity Duration of agreement
Quantity
Neighbors Hotels Milk bar/kiosk Cooperatives Farmer groups Processors Mobile traders Brokers Others(specify)
13. If you were to increase the quantity of milk produced for example by 50% (half), how much would you be
able to sell successfully) Please tick one. I would be able to sell all of it I would be able to sell part of it I would not be able to sell at all I don’t know
14. Please indicate by ticking how often you experienced shortages and excess milk production in your enterprise over the last year.
Always Sometimes Rarely Never Shortages Excess supplies
15. How serious are each of the following problems in your trading with your buyers) Please indicate the
seriousness by ticking using a scale of 1- very serious, 2-serious, 3-moderate and 4- not a problem. 1 2 3 4 Type of problem Very serious Serious Moderate Not a problem
Milk is not collected Milk goes bad while being transported or handled There are not enough buyers in the market Water/chemicals are added to milk by buyers Our buyers fail to pay us on time Prices are sometimes too low Others, please specify

Appendices
177
16. What quantity of your milk is wasted on average at each of the following points? Please indicate also how
frequent this problem occurs on average in a month by filling below.
Point where loss occurs Quantity lost or wasted How frequent (times) problem occurs in a month
On farm during and after milking During transport Suring storage (spoilage) Failure to collect or deliver milk Others (please specify)
17. In cases of milk scarcity, how much milk are you normally able to offer each of your buyers on average?
Please tick as appropriate for each of your buyers.
Type of buyer Full share Less than full share None Neighbors Hotels Milk bar/kiosk Cooperatives Farmer groups Processors Mobile traders Brokers Others(specify)
18. In cases of excess milk production, what happens to the extra milk? Please tick the appropriate ones form
the list below.
Sell at reduced prices Use at home Find new buyers for it Convert into other milk products to sell later Dispose or give away free Others, (please specify)
19. What other arrangements would you prefer for your milk given your available resources and abilities? Please tick the appropriate arrangement below.
I would prefer to increase amounts of milk I produce and sell I would prefer to produce less I would prefer no change Others, please specify
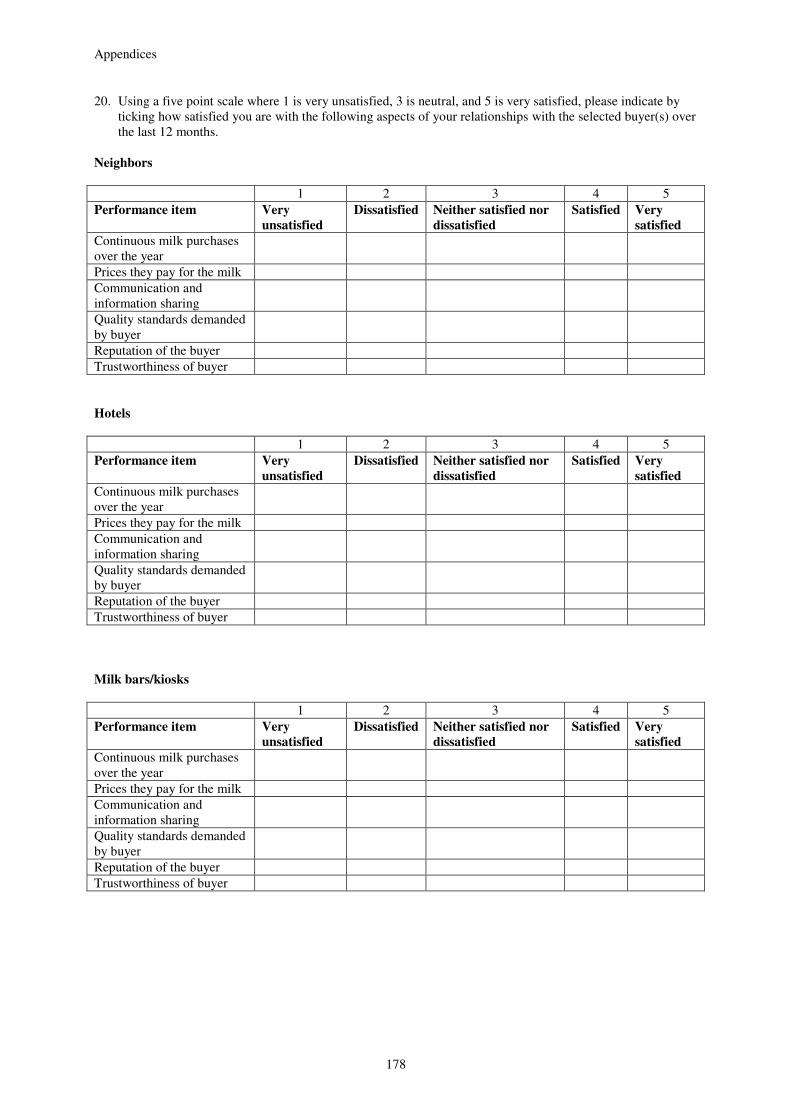
Appendices
178
20. Using a five point scale where 1 is very unsatisfied, 3 is neutral, and 5 is very satisfied, please indicate by ticking how satisfied you are with the following aspects of your relationships with the selected buyer(s) over the last 12 months.
Neighbors
1 2 3 4 5 Performance item Very
unsatisfied
Dissatisfied Neither satisfied nor
dissatisfied
Satisfied Very
satisfied
Continuous milk purchases over the year
Prices they pay for the milk Communication and information sharing
Quality standards demanded by buyer
Reputation of the buyer Trustworthiness of buyer Hotels
1 2 3 4 5 Performance item Very
unsatisfied
Dissatisfied Neither satisfied nor
dissatisfied
Satisfied Very
satisfied
Continuous milk purchases over the year
Prices they pay for the milk Communication and information sharing
Quality standards demanded by buyer
Reputation of the buyer Trustworthiness of buyer Milk bars/kiosks
1 2 3 4 5 Performance item Very
unsatisfied
Dissatisfied Neither satisfied nor
dissatisfied
Satisfied Very
satisfied
Continuous milk purchases over the year
Prices they pay for the milk Communication and information sharing
Quality standards demanded by buyer
Reputation of the buyer Trustworthiness of buyer

Appendices
179
Cooperatives
1 2 3 4 5 Performance item Very
unsatisfied
Dissatisfied Neither satisfied nor
dissatisfied
Satisfied Very
satisfied
Continuous milk purchases over the year
Prices they pay for the milk Communication and information sharing
Quality standards demanded by buyer
Reputation of the buyer Trustworthiness of buyer
Other farmer groups
1 2 3 4 5 Performance item Very
unsatisfied
Dissatisfied Neither satisfied nor
dissatisfied
Satisfied Very
satisfied
Continuous milk purchases over the year
Prices they pay for the milk Communication and information sharing
Quality standards demanded by buyer
Reputation of the buyer Trustworthiness of buyer
Processors
1 2 3 4 5 Performance item Very
unsatisfied
Dissatisfied Neither satisfied nor
dissatisfied
Satisfied Very
satisfied
Continuous milk purchases over the year
Prices they pay for the milk Communication and information sharing
Quality standards demanded by buyer
Reputation of the buyer Trustworthiness of buyer

Appendices
180
Mobile traders
1 2 3 4 5 Performance item Very
unsatisfied
Dissatisfied Neither satisfied nor
dissatisfied
Satisfied Very
satisfied
Continuous milk purchases over the year
Prices they pay for the milk Communication and information sharing
Quality standards demanded by buyer
Reputation of the buyer Trustworthiness of buyer
Brokers
1 2 3 4 5 Performance item Very
unsatisfied
Dissatisfied Neither satisfied nor
dissatisfied
Satisfied Very
satisfied
Continuous milk purchases over the year
Prices they pay for the milk Communication and information sharing
Quality standards demanded by buyer
Reputation of the buyer Trustworthiness of buyer
Others, please specify
1 2 3 4 5 Performance item Very
unsatisfied
Dissatisfied Neither satisfied nor
dissatisfied
Satisfied Very
satisfied
Continuous milk purchases over the year
Prices they pay for the milk Communication and information sharing
Quality standards demanded by buyer
Reputation of the buyer Trustworthiness of buyer
Please tell us more about yourself now by ticking one
21. Sex of respondent (please tick one)
Male Female

Appendices
181
22. Position in enterprise
Owner Employee Other, please specify
23. Year of birth
24. Your Highest Education level attained (please tick) None Class 1-4 Class 5-8 Form I-II Form III-IV A-level College University Adult literacy Other (please specify)
Thanks a lot for your patience and responses If there is any other information that you would like us to know about your operations, please feel free to express or write them in the space provided here.

Appendices
182
Appendix 2: Questionnaire for milk retail outlets
Questionnaire Number
Field Researcher _________________
Sub-location _________________
Division _________________
District _________________
Please answer the following questions to the best of your knowledge. 1. When did you begin your milk operations? Please state the year you began.
2. In the table below, you are requested to provide information about the dairy products your firm trades in. Please provide information about the products by filling in the table below.
Price range Milk product Average quantity per day
Unit of measure
Highest Lowest
How long it takes to sell product
Quantity able to sell before expiry or spoilage
Pasteurized milk
Yoghurt UHT Fresh farm milk
Ice cream Cheese Other (specify)
. 3. What type of retail outlet do you operate?
Type a) Grocery shop b) Milk Bar/mini dairy c) Mobile trader d) Other (please specify)

Appendices
183
4.
a. How much milk do you currently handle per day on average? Please state also the units of measure. Amount per day units
b. Amount during peak season low season
c. What is the maximum amount of milk you can handle in a day?
5. Considering the amount of milk in the question above (question 4 above), how does this amount compare to
what you produced in the previous year and what you expect in the coming year? Please tick as applicable. Compared to this year, last year was …. Next year is expected to be ……..
More More
The same The same
Less Less
6. a) What is the size of your dairy related workforce? Please state their number. Permanent ___________________________ Casual ___________________________ Family labor ___________________________
b) What major costs do you usually incur in your milk operations? Please provide also information about
the costs by filling in and ticking as applicable.
Cost component Quantity/amount Frequency Trend over last five years Increasing Constant Decreasing Wages Power Fuel Water Rent Licenses Packing costs Transport costs Others (specify) (NB: frequency = daily, weekly, bi-weekly or monthly)
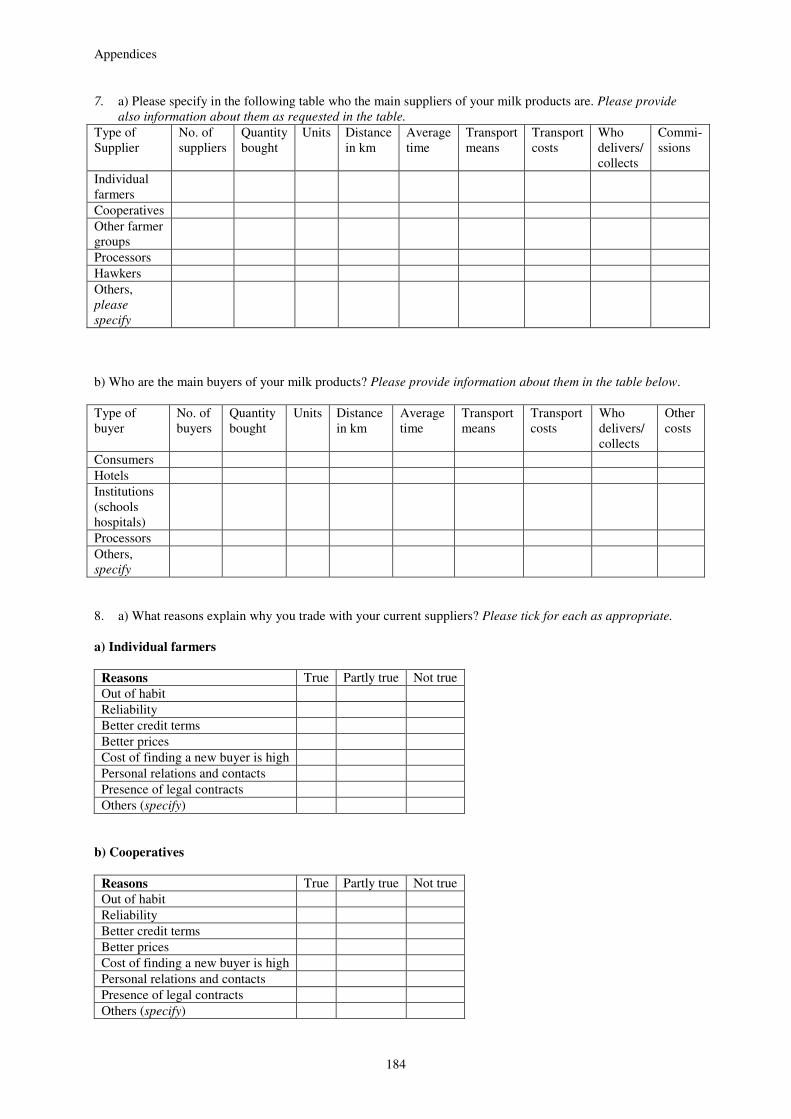
Appendices
184
7. a) Please specify in the following table who the main suppliers of your milk products are. Please provide
also information about them as requested in the table.
Type of Supplier
No. of suppliers
Quantity bought
Units Distance in km
Average time
Transport means
Transport costs
Who delivers/ collects
Commi-ssions
Individual farmers
Cooperatives Other farmer groups
Processors Hawkers Others, please
specify
b) Who are the main buyers of your milk products? Please provide information about them in the table below. Type of buyer
No. of buyers
Quantity bought
Units Distance in km
Average time
Transport means
Transport costs
Who delivers/ collects
Other costs
Consumers Hotels Institutions (schools hospitals)
Processors Others, specify
8. a) What reasons explain why you trade with your current suppliers? Please tick for each as appropriate. a) Individual farmers
Reasons True Partly true Not true Out of habit Reliability Better credit terms Better prices Cost of finding a new buyer is high Personal relations and contacts Presence of legal contracts Others (specify)
b) Cooperatives
Reasons True Partly true Not true Out of habit Reliability Better credit terms Better prices Cost of finding a new buyer is high Personal relations and contacts Presence of legal contracts Others (specify)
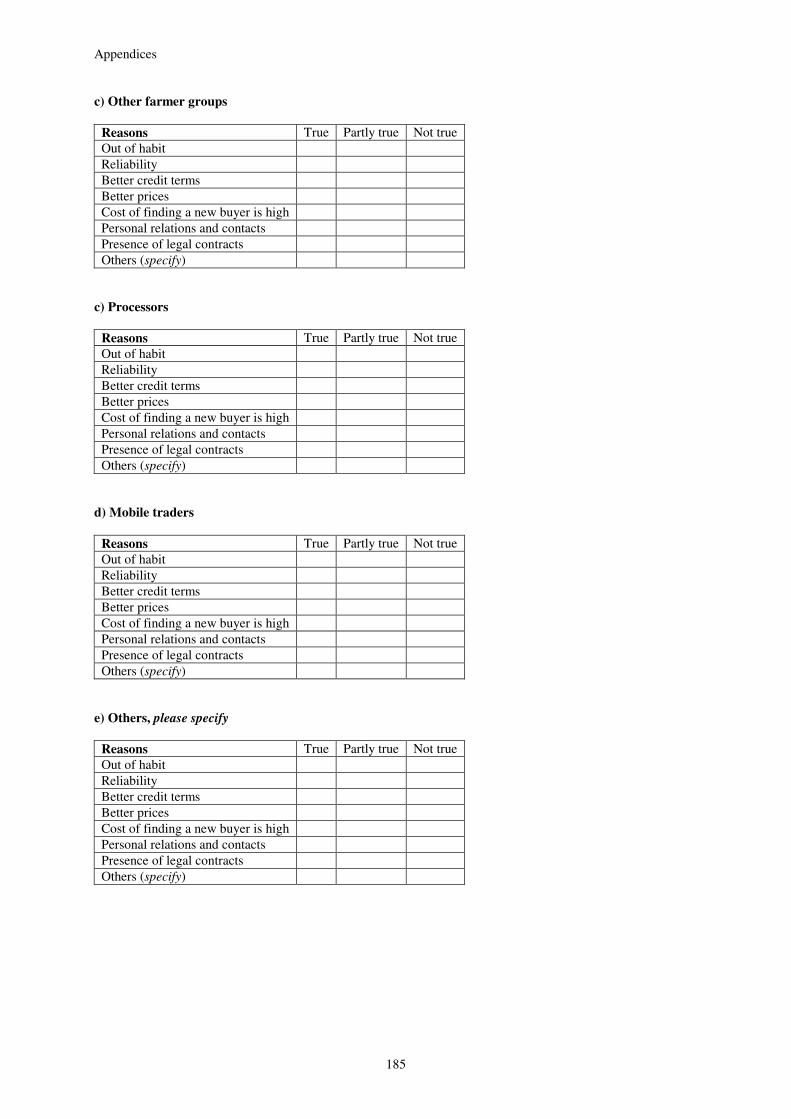
Appendices
185
c) Other farmer groups
Reasons True Partly true Not true Out of habit Reliability Better credit terms Better prices Cost of finding a new buyer is high Personal relations and contacts Presence of legal contracts Others (specify)
c) Processors
Reasons True Partly true Not true Out of habit Reliability Better credit terms Better prices Cost of finding a new buyer is high Personal relations and contacts Presence of legal contracts Others (specify)
d) Mobile traders
Reasons True Partly true Not true Out of habit Reliability Better credit terms Better prices Cost of finding a new buyer is high Personal relations and contacts Presence of legal contracts Others (specify)
e) Others, please specify
Reasons True Partly true Not true Out of habit Reliability Better credit terms Better prices Cost of finding a new buyer is high Personal relations and contacts Presence of legal contracts Others (specify)

Appendices
186
b) What reasons explain why you trade with your current buyers? Please tick for each as appropriate. a) Consumers
Reasons True Partly true Not true Out of habit Reliability Better credit terms Better prices Cost of finding a new buyer is high Personal relations and contacts Presence of legal contracts Others (specify)
b) Hotels
Reasons True Partly true Not true Out of habit Reliability Better credit terms Better prices Cost of finding a new buyer is high Personal relations and contacts Presence of legal contracts Others (specify)
c) Institutions (Schools and Restaurants)
Reasons True Partly true Not true Out of habit Reliability Better credit terms Better prices Cost of finding a new buyer is high Personal relations and contacts Presence of legal contracts Others (specify)
c) Processors
Reasons True Partly true Not true Out of habit Reliability Better credit terms Better prices Cost of finding a new buyer is high Personal relations and contacts Presence of legal contracts Others (specify)

Appendices
187
f) Others, please specify
Reasons True Partly true Not true Out of habit Reliability Better credit terms Better prices Cost of finding a new buyer is high Personal relations and contacts Presence of legal contracts Others (specify)
9. a) Which of the following best describes the buying frequency of your customers? Please indicate as
applicable below.
Type of buyer Regular buyer Irregular buyer Consumers Hotels Institutions Processors Others(specify)
b) How would you classify the frequency with which you transact with your suppliers? Please indicate as
applicable in the table below.
Type of supplier Regular buyer Irregular buyer Individual farmers Cooperatives Farmer groups Processors Mobile traders Others(specify)
10.
b. Which of the following best captures your knowledge of milk prices in the market? Please tick one
for each of your buyers?
Type of buyer I always know prices in advance
I sometimes know prices in advance
I hardly know prices in advance
Other please specify
Consumers Hotels Institutions Processors Others(specify)

Appendices
188
b) Which of the following best captures your knowledge of milk prices in the market? Please tick one
for each of your suppliers?
Type of supplier I always know prices in advance
I sometimes know prices in advance
I hardly know prices in advance
Other please specify
Individual farmers
Cooperatives Farmer groups Processors Mobile traders Others(specify)
11. a) How useful are each of the following as sources of market price information for your milk? Please tick as
appropriate for your buyers using the scale: 1 = not useful 2= a little useful 3= useful 4=
very useful
Milk suppliers 1 2 3 4 Information source Not useful A little useful useful Very useful
From neighbors and other producers From traders and buyers From government organizations Through mass media (radio, TV, Newspapers) Through negotiations Others, please specify
b) How useful are each of the following as sources of market price information for your milk? Please
tick as appropriate for your suppliers using the scale: 1 = not useful 2= a little useful 3= useful
4= very useful
Milk buyers 1 2 3 4 Information source Not useful A little useful useful Very useful
From neighbors and other producers From traders and buyers From government organizations Through mass media (radio, TV, Newspapers) Through negotiations Others, please specify
12. a) In the table below you are requested to provide information on your buyers. Please fill in the table as
applicable.
Price units Price over last one
year Quantity sold under each method of payment
low High cash In kind
Credit sales
Type of buyer Length of credit
Quantity paid within credit period
Consumers Hotels Institutions Processors Others(specify)
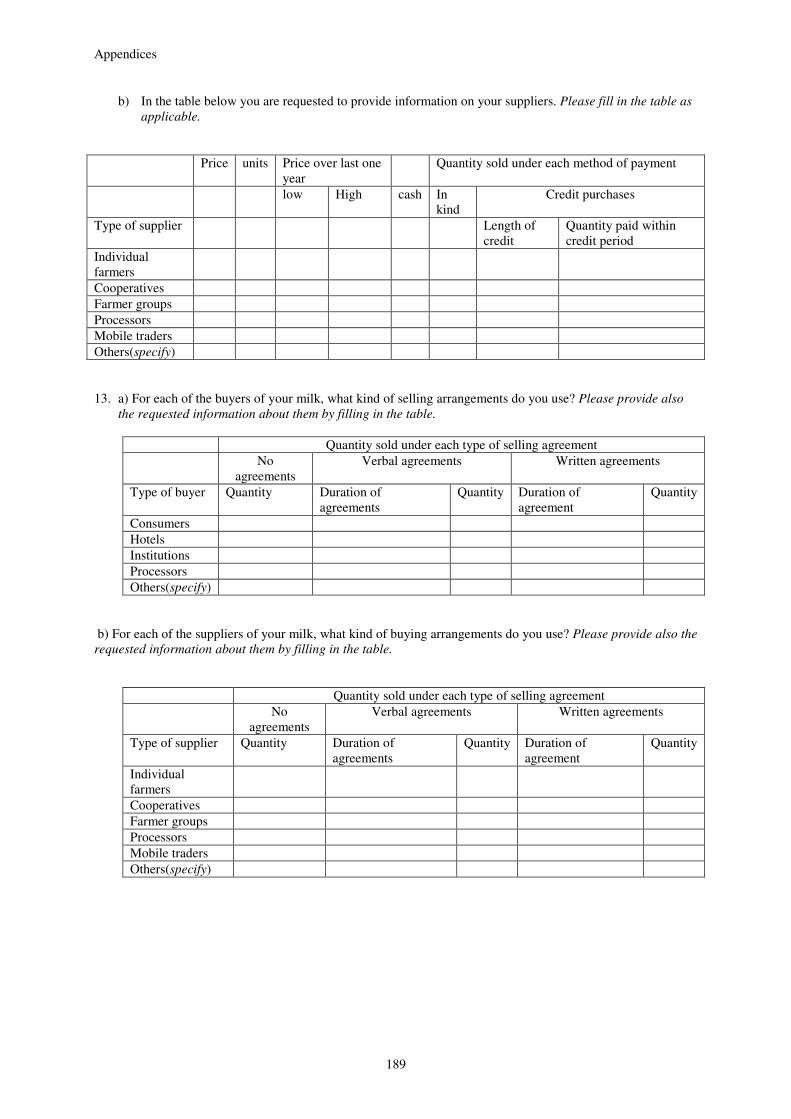
Appendices
189
b) In the table below you are requested to provide information on your suppliers. Please fill in the table as
applicable.
Price units Price over last one year
Quantity sold under each method of payment
low High cash In kind
Credit purchases
Type of supplier Length of credit
Quantity paid within credit period
Individual farmers
Cooperatives Farmer groups Processors Mobile traders Others(specify) 13. a) For each of the buyers of your milk, what kind of selling arrangements do you use? Please provide also
the requested information about them by filling in the table.
Quantity sold under each type of selling agreement No
agreements Verbal agreements Written agreements
Type of buyer Quantity Duration of agreements
Quantity Duration of agreement
Quantity
Consumers Hotels Institutions Processors Others(specify)
b) For each of the suppliers of your milk, what kind of buying arrangements do you use? Please provide also the
requested information about them by filling in the table.
Quantity sold under each type of selling agreement No
agreements Verbal agreements Written agreements
Type of supplier Quantity Duration of agreements
Quantity Duration of agreement
Quantity
Individual farmers
Cooperatives Farmer groups Processors Mobile traders Others(specify)

Appendices
190
14. If you were to increase the quantity of milk you handle for example by 50% (half), how much would you be able to sell successfully) Please tick one.
I would be able to sell all of it I would be able to sell part of it I would not be able to sell at all I don’t know
15. Please indicate by ticking how often you experienced shortages and excess milk in your business over the last year.
Always Sometimes Rarely Never Shortages Excess supplies
16. a) How serious are each of the following problems in your trading with your buyers? Please indicate the
seriousness by ticking using a scale of 1- very serious, 2-serious, 3-moderate and 4- not a problem. 1 2 3 4 Type of problem Very serious Serious Moderate Not a problem
Milk is not collected Milk goes bad while being transported or handled There are not enough buyers in the market Water/chemicals are added to milk by buyers Our buyers fail to pay us on time Prices are sometimes too low Others, please specify
b) How serious are each of the following problems in your trading with your suppliers? Please indicate the
seriousness by ticking using a scale of 1- very serious, 2-serious, 3-moderate and 4- not a problem. 1 2 3 4 Type of problem Very serious Serious Moderate Not a problem
Milk is not collected Milk goes bad while being transported or handled There are not enough buyers in the market Water/chemicals are added to milk by buyers Our buyers fail to pay us on time Prices are sometimes too low Others, please specify 17. How much of your milk is wasted on average at each of the following points? Please indicate how frequent
this problem occurs on average in a month below.
Point where loss occurs Quantity lost or wasted How frequent (times) problem occurs in a month
On farm during and after milking During transport During handling storage (spoilage) By processors and traders Failure to collect or deliver milk Others (please specify)

Appendices
191
18. In cases of milk scarcity, how much milk are you normally able to offer each of your buyers on average? Please tick as appropriate for each of your buyers.
Type of buyer Full share Less than full share None Consumers Hotels Institutions Processors Others(specify)
19. In cases of milk scarcity, how much milk are you normally able to receive from each of your suppliers on
average? Please tick as appropriate for each of your buyers.
Type of supplier Full share Less than full share None Individual farmers Cooperatives Farmer groups Processors Mobile traders Others(specify)
20. In cases of excess milk production, what happens to the extra milk? Please tick the appropriate ones.
Sell at reduced prices Use at home Find new buyers for it Convert into other milk products to sell later Dispose or give away free Others, (please specify)
21. What other arrangements would you prefer for your milk given your available resources and abilities? Please tick one.
I would prefer to increase amounts of milk I produce and sell I would prefer to produce less I would prefer no change Others, please specify

Appendices
192
22. a) Using a five point scale where 1 is very unsatisfied, 3 is neutral, and 5 is very satisfied, please indicate by ticking how satisfied you are with the following aspects of your relationships with the selected buyer(s) over the last 12 months.
Consumers
1 2 3 4 5 Performance item Very
unsatisfied
Dissatisfied Neither satisfied nor
dissatisfied
Satisfied Very
satisfied
Continuous milk purchases over the year
Prices they pay for the milk Communication and information sharing
Quality standards demanded by buyer
Reputation of the buyer Trustworthiness of buyer Hotels
1 2 3 4 5 Performance item Very
unsatisfied
Dissatisfied Neither satisfied nor
dissatisfied
Satisfied Very
satisfied
Continuous milk purchases over the year
Prices they pay for the milk Communication and information sharing
Quality standards demanded by buyer
Reputation of the buyer Trustworthiness of buyer Institutions (schools, hospitals)
1 2 3 4 5 Performance item Very
unsatisfied
Dissatisfied Neither satisfied nor
dissatisfied
Satisfied Very
satisfied
Continuous milk purchases over the year
Prices they pay for the milk Communication and information sharing
Quality standards demanded by buyer
Reputation of the buyer Trustworthiness of buyer

Appendices
193
Processors
1 2 3 4 5 Performance item Very
unsatisfied
Dissatisfied Neither satisfied nor
dissatisfied
Satisfied Very
satisfied
Continuous milk purchases over the year
Prices they pay for the milk Communication and information sharing
Quality standards demanded by buyer
Reputation of the buyer Trustworthiness of buyer Others, please specify
1 2 3 4 5 Performance item Very
unsatisfied
Dissatisfied Neither satisfied nor
dissatisfied
Satisfied Very
satisfied
Continuous milk purchases over the year
Prices they pay for the milk Communication and information sharing
Quality standards demanded by buyer
Reputation of the buyer Trustworthiness of buyer
22. b) Using a five point scale where 1 is very unsatisfied, 3 is neutral, and 5 is very satisfied, please indicate by ticking how satisfied you are with the following aspects of your relationships with the selected suppliers(s) over the last 12 months. Individual farmers
1 2 3 4 5 Performance item Very
unsatisfied
Dissatisfied Neither satisfied nor
dissatisfied
Satisfied Very
satisfied
Continuous milk purchases over the year
Prices they pay for the milk Communication and information sharing
Quality standards demanded by buyer
Reputation of the buyer Trustworthiness of buyer

Appendices
194
Cooperatives
1 2 3 4 5 Performance item Very
unsatisfied
Dissatisfied Neither satisfied nor
dissatisfied
Satisfied Very
satisfied
Continuous milk purchases over the year
Prices they pay for the milk Communication and information sharing
Quality standards demanded by buyer
Reputation of the buyer Trustworthiness of buyer Other farmer groups
1 2 3 4 5 Performance item Very
unsatisfied
Dissatisfied Neither satisfied nor
dissatisfied
Satisfied Very
satisfied
Continuous milk purchases over the year
Prices they pay for the milk Communication and information sharing
Quality standards demanded by buyer
Reputation of the buyer Trustworthiness of buyer
Processors
1 2 3 4 5 Performance item Very
unsatisfied
Dissatisfied Neither satisfied nor
dissatisfied
Satisfied Very
satisfied
Continuous milk purchases over the year
Prices they pay for the milk Communication and information sharing
Quality standards demanded by buyer
Reputation of the buyer Trustworthiness of buyer
Mobile traders
1 2 3 4 5 Performance item Very
unsatisfied
Dissatisfied Neither satisfied nor
dissatisfied
Satisfied Very
satisfied
Continuous milk purchases over the year
Prices they pay for the milk Communication and information sharing
Quality standards demanded by buyer
Reputation of the buyer Trustworthiness of buyer

Appendices
195
Others, please specify
1 2 3 4 5
Performance item Very
unsatisfied
Dissatisfied Neither satisfied nor
dissatisfied
Satisfied Very
satisfied
Continuous milk purchases
over the year
Prices they pay for the milk
Communication and
information sharing
Quality standards demanded
by buyer
Reputation of the buyer
Trustworthiness of buyer
Please tell us more about yourself now by ticking one
23. Sex of respondent (please tick one)
Male Female
24. Position in enterprise Owner Employee Other, please specify
25. Year of birth
26. Your Highest Education level attained (please tick) None Class 1-4 Class 5-8 Form I-II Form III-IV A-level College University Adult literacy Other (please specify)
Thanks a lot for your patience and responses If there is any other information that you would like us to know about your operations, please feel free to express or write them in the space provided here.

Appendices
196
Map 1 Map of Kenya showing the research area
Source: www.4-siteplanning.com/. ../maps-large.html Accessed on 3.5.2006

Appendices
197
Curriculum Vitae
Eliud Abucheli Birachi, (MSc).
Date and
place of birth:
In Kakamega, Kenya in November 1970
Citizenship Kenyan
Education
April 2004-
July 2006
PhD Thesis, in the Departments of Food Economics and Consumption Studies and, Agricultural Economics
(Specialization in Agribusiness Management), Christian-Albrechts-University Kiel, Germany
Tittle: Determinants of Coordination and Supply Chain Performance: The Case of Fresh Milk Supply Chains in Kenya
1997 - 1999
Wageningen University & Research Center, The Netherlands. Masters of Science in Agricultural Economics & Management
Specialization: Management Studies.
Research Thesis on Supply Chain Management in the cut flower industry: The case of the Netherlands
1990 - 1995
Egerton University, Njoro, Kenya. Bachelor of Agribusiness Management
1986-1989 Ingotse High School: The Kenya Certificate of Secondary Education (KCSE), mean grade B plain. University entrance
examinations.
Working History
2003-2006
1999- to date
Study leave at Egerton University, Kenya
Assistant lecturer, Department of Agricultural Economics &
Business Management, Egerton University, Njoro, Kenya.
1996 - 1997
Teaching Assistant, Department of Agricultural Economics & Business Management, Egerton university, Njoro, Kenya.