determinants of learning achievement in uganda.€¦ · both areas, the learning environment in...
TRANSCRIPT

Determinants of learning achievement in Uganda. By
Ibrahim Kasirye Economic Policy Research Centre, Uganda.
Email: [email protected]; [email protected]
February 2009 Abstract1 In this study we present evidence on the impact of individual and school characteristics on grade 6 pupil achievement using a rich dataset from Uganda. We deal with an important selection issue in Uganda—the non-random allocation of children into schools due to a high school dropout rate. We do so by employing a combination of fixed effects and including variables capturing sample selection. Our empirical results reveal that teacher training is important for improving school performance. Indeed, having the mandatory two years of teacher training is more important than a teacher’s own cognitive ability. On the other hand, access to classroom resources raise children’s cognitive outcomes—a child having either an own place to sit significantly impacts on learning outcomes. Consequently, efforts to improve children’s cognitive outcomes should concentrate on providing in service teacher training as well as ensuring that classrooms are properly furnished. JEL classification: I21,015 Keywords: primary pupil achievement, school quality, Uganda
1 Acknowledgement: This work was funded by the African Economic Research Consortium (AERC). I am grateful to Finn Tarp, John Strauss, and Stephen Younger for helpful discussions about this paper. I also benefited from comments from Paul Schultz, Steve Kayizzi Mugerwa, David Sahn, and participants at AERC’s biannual workshop, Nairobi, Dec. 2008. Any errors are mine. I would like to thank the Southern and Eastern Africa Consortium for Monitoring Education Quality (SACMEQ) for making the data available through the Economic Policy Research Centre.

1
1. Introduction
The goal of achieving “quality education for all” is far from being realized in most
countries in sub-Saharan Africa (SSA). Although many children in the sub region
enrolled into primary schools during the 1990s, many left school without attaining the
minimum proficiency in literacy and numeracy (World Bank, 2004). As a result,
policy makers and researchers are increasingly concerned with low education quality
in the era of increased education spending. They have realized that poor education
outcomes can have detrimental effects on a country’s economic and social
development. At the individual level, low learning achievement not only limits one’s
progression further in school but also negatively affects an individual’s future income
and productivity (Hanushek and Pace, 1995). Nevertheless, the recognition of the
problem of poor learning outcomes has not translated into the development of more
effective actions to improve education quality.
Issues of education quality have been central to Uganda’s human development
agenda. In 1997, the Government of Uganda (GoU) introduced the universal primary
education (UPE) policy whose objective was to provide free primary education to four
children per household2. Later, the implementation was scaled up to cater for all
children of primary school going age (6-12 years). The response to this new initiative
was outstanding. The number of pupils increased from 2.5 million in 1996 to 5.4
million in 1997, and by 2005, the total primary school population was above 7.2
million pupils (Ministry of Education and Sports, 2006). In line with the increase in
the school population, GoU has devoted considerable resources to the provision of
education services. Between 1991 and 2004 the total education budget increased from
20 to 30 % of the national budget (Ministry of Education and Sports, 2004).
As education budget increased, priority shifted to primary education. For example,
during the 2007/2008 financial year 57 % of the total education budget of Ushs 752
billion (US$ 450 million) was devoted to primary education (MFPED, 2007)3. The
increased resources were used to recruit teaching personnel and set up school
2 In line with international development targets, the policy sought to provide equitable access to schooling to all children as well as eliminate gender disparities in primary school enrolment. 3 During the period 1999/2000 to 2005/6, primary education account for 66 percent of the education budget, the reduction to 57 % percent since 2006/7 was due to the introduction of the Universal Secondary Education (USE) policy which entailed providing additional resources to secondary schools in order to cope with the increased enrolment of UPE graduates.

2
infrastructure. In particular, the number of primary school teachers more than doubled
from 65,000 in 1996 to 150,000 by 2006. Similarly, in order to easy school
congestion, 88,000 new classrooms were constructed during the 1996-2003 period.
Notwithstanding the increased spending on primary school inputs, most of the funds
go to remunerations (about 90 %), and this crowded out other expenditures e.g.
textbooks and other classroom materials, which also impact on school quality.
There is limited information how successful pupils are educated in Uganda due to
paucity of the data. Most of the regular household surveys only collect information
relating to school enrolment and access to schools; as such, attempts to directly relate
student performance with household and school resources are rare. A unique
characteristic of the present study is the availability of comprehensive dataset of 2,452
pupils from the Southern and Eastern Africa Consortium for Monitoring Education
Quality (SACMEQ) survey, which tested grade 6 pupils in mathematics and reading.
The same survey also administered separate competency tests to subject teachers in
addition to interviewing head teachers regarding the organization and management of
their schools. Consequently, the survey offers the opportunity to analyze the
importance of family background, teacher quality, and school resources, on learning
achievement.
The overall objective of this paper is to understand how family background and
school inputs affect children’s cognitive outcomes and we use the standard education
production function to investigate this relationship. Given that schools in Uganda are
characterised by high drop outs, we do admit there is a selection problem in our
sample. Nonetheless, we do have a rich dataset and do control for sample selection in
our estimations. With exception of results based on urban and rural samples, when we
control for selection, our base results remain the same. We find that the most
important determinants are: the number of teachers with the mandatory two years of
teacher training; a child having an own place to sit. On the other hand, parental
education matters partially—the impact of higher education attainment for fathers on
learning is only significant for male learning achievement. However, most of the other
teacher characteristics as well as those relating to the head teacher do not appear to
significantly influence learning. Consequently, with the considerable success in
providing “hard” school infrastructure, if learning outcomes are to improve, the GoU

3
should concentrate more on availing “soft” infrastructure (particularly chairs and
desks) as well as providing in-service training for unqualified teachers.
The rest of the study is organized as follows. In the next section, we profile the
primary schooling environment in Uganda and the trends in pupil performance on test
scores and national examinations. This is followed by a survey of the related literature
in section 3. The methodology and data issues are discussed in section four. Section
five presents our findings while the implications of the study appear in section six.
2. Background to primary education schooling in Uganda
The Ugandan education system is divided into four levels: pre-primary, primary,
secondary and tertiary levels. There is no public provision of pre-primary schooling,
and consequently majority of children do not enroll in nursery schools. Primary
education consists of 7 years of schooling. Secondary education consists of 6 years
divided into two levels—the first level comprising grades 1-4 (ordinary level) and the
second level, grades 5 and 6 (advanced level). The tertiary level consists of
universities, technical colleges, and business schools. The school calendar is
composed of three terms, with the promotion to the next class based on the passing of
end of year (third term) exams. On the other hand, progression from one level to the
next (e.g. either from primary to secondary or from O-level to A-level) is through
national exams administered centrally by the Uganda National Examination Board.
Also, the Ugandan school system has a number of unique features—with the potential
of affecting our empirical estimations. First, unlike developed countries with school
districts, parents in Uganda are not restricted to schools within a particular
geographical area. Nonetheless, with the exception of urban areas, most parents enrol
children in the nearest schools. Second, within schools, pupils are randomly assigned
to classes regardless of cognitive abilities. Most schools have two classes per grade
with the exception of lower grades (grades 1 and 2) where some schools may have up
to three classes. Third, some pupils in urban areas receive remedial classes, especially
during school holidays. Finally, although the MoES has an automatic policy of
promotion to the next grade at the end of every school year, some school
4
administrators force pupils to repeat grades as means of improving school
performance4.
As earlier mentioned, the GoU introduced UPE in 1997 in order to provide equitable
access to schooling to all children as well as eliminate gender disparities in primary
school enrolment. As a result of the UPE initiative, the primary net enrollment rate
increased from 63 percent in 1992/93 to 85 % by 2005/06. Two groups benefited most
from the introduction of free primary education—girls and children from households
in the poorest quintile (Deninger, 2003). The enrolment rates for the poorest quintile
increased by 27 percentage points after the introduction of free education compared to
only 17 percentage points for the top quintile. Overall enrolment rates for girls
increased by 23 percentage points compared to only 19 percentage points for boys,
consequently the gender gap in enrolment was substantially reduced.
During the implementation of UPE, the government placed most emphasis on
recruiting teachers and construction of classrooms. Despite notable achievements in
both areas, the learning environment in Uganda is still crowded. By 2006, the total
number of teachers on the payroll was 150,135—an increase of over 30 % since 2000
(Ministry of Education and Sports, 2007). This large increase in the teaching
workforce resulted in a significant reduction in the pupil-teacher ratio—from 65:1 in
2000 to 52:1 by 20065. With regard to school infrastructure, by 2005, there were
102,500 classrooms in use of which 83 % were in public schools. Although the pupil
to classroom ratio declined from 96:1 in 2000 to 72:1 by 2006, the ratio remained
above the recommended class size (50:1) as such some pupils continued to receive
school instruction in the open or improvised facilities such as churches and mosques.
This fact was interpreted as a reduction in education quality especially by urban
parents. Consequent there was an increase in the private provision of education
4 Based on annual Education Statistical Abstract, over the 2000-2006 period, repeaters account for at least 11 per cent of the student population in primary schools. Furthermore, grade repetition is most prevalent in lower grade, especially grade 1. Based on a survey of 16 schools in central Uganda, Musisi et al. (2003) find that the three most cited reasons for repetition are: poor academic performance, parental decision, and regular absenteeism from class. The later factor suggests that in some cases, repetition is used as way of punishment for misdemeanours committed by the pupil. Indeed, according to UNESCO (2001), pupils who miss school for more than one month in term are forced to repeat the grade. 5 However, the pupil to teacher ratio remains above the recommended national average of 50:1.

5
services. At the end of 2006, private schools made up 19 % of all primary schools6
and 60 % of secondary—up from 5 and 50 % respectively in 1996 (Ministry of
Education and Sports, 2006).
Issues that continue to challenge the efficiency of the Ugandan primary education
system include the twin problem of high drop out and grade repetition rates as earlier
mentioned. As illustrated in Figure 1, about half of pupils who join primary one drop
out by the 6th grade and majority of pupils drop out immediately after grade 1.
Indeed, previous studies also show that school drop outs remain a serious challenge to
primary education in Uganda. The study by Nishimura et al. (2008) showed that UPE
only increased grade completion rates up to grade 5. Overall, by the end of the 7 year
primary cycle, less than half of the cohort that enrolled in primary one sits for PLE
exams. In Box 1 (in the appendix), we describe why pupils leave before completing
primary schooling.
Figure 1: Uganda Transition through primary school 2000 and 2001 Cohorts
100000 300000 500000 700000 900000
P1_2000
P2_2001
P3_2002
P4_2003
P5_2004
P6_2005
Cohort: Primary one 2000
Girls
Boys
0 200,000 400,000 600,000 800,000
P1_2001
P2_2002
P3_2003
P4_2004
P5_2005
P6_2006
Cohort: Primary one 2001
Source: Education abstracts (various issues)
6 Nonetheless, public schools account for 91 per cent of the primary school population (Ministry of Education and Sports, 2007).

6
Apart from the high dropout and grade repetition rates, Uganda it is still far from
achieving the objective of quality basic education for all. Learning achievement as
measured by competency in numeracy or literacy has been on the decline throughout
the implementation of UPE. For example, based on test scores administered under the
National Assessment of Progress in Education (NAPE) in 1999, only 46 % of male
and 36% of female grade-six pupils obtained the desired level of proficiency in
numeracy. By 2006, the corresponding rates had declined to 26 % and 15%
respectively (UNEB, 2007b)7. Furthermore, based on performance on international
school assessments, Uganda performs worse than its regional neighbours. Table 1
places Uganda’s learning achievement in the perspective of other regional countries
as assessed by the Southern African Consortium for Monitoring Education Quality
(SACMEQ) for grade 6 pupils. The table shows that Uganda is ranked ninth in
reading and eighth in mathematics and consistently performs worse than either Kenya
or Tanzania.
Table 1: Mean Reading and Mathematics Scores amongst Southern and Eastern
African Countries
# Country Reading
Score
Rank Maths
Score
Rank
1 Seychelles 582 (1) 554 (3)
2 Kenya 546 (2) 563 (2
3 Tanzania 546 (3) 522 (5)
4 Mauritius 536 (4) 584 (1)
5 Swaziland 530 (5) 516 (6)
6 Botswana 521 (6) 513 (7)
7 Mozambique 517 (7) 530 (4)
8 South Africa 492 (8) 486 (9)
9 Uganda 482 (9) 506 (8)
10 Zanzibar 478 (10) 478 (10)
11 Lesotho 451 (11) 447 (11)
12 Namibia 449 (12) 431 (14)
7 The large drop is partly explained by the fact that the previous pupils tested did not operate under the UPE scheme.

7
13 Zambia 440 (13) 435 (12)
14 Malawi 429 (14) 433 (13)
All Countries 500 500
Source: SACMEQ, 2005
The relative poor school performance may be partly explained by the massive
recruitment of teachers, some even unqualified (Ministry of Education and Sports,
2003) or the enrollment into school of pupils previously considered below average in
terms of innate ability—weak children kept out of school by their own parents. On the
other hand, such poor educational outcomes not only highlight internal inefficiencies
in the education system, but also cast doubts on Uganda’s ability to accumulate the
requisite human capital for sustainable economic development. In light of the
increased expenditure on key school inputs for Ugandan primary schools, it is
important to understand why knowledge and skills acquisition has not registered
similar improvements.
3. Literature Review
There is a vast and growing literature on analyzing issues of education outcomes;
Hanushek and Woessman (2008) provide a recent review of this literature 8. Example
of empirical studies in the recent past include: Das et al, (2007); Glewwe et al,
(2004); Woessman (2003); Glewwe et al (2001); Krueger (1999) and Case and
Deaton (1999). The main focus for most of the above studies is on the effect of class
size (as a measure of school quality) on learning outcomes. Evidence from developed
countries particularly the United States is mixed. Hanushek (1986, 2003) based
partially on extensive review of the USA literature concludes that school inputs such
as teacher salaries and classroom size do not matter for student test score
performance. Hanushek argues that increased school expenditures do not provide the
requisite incentives within schools to improve learning outcomes. Rather, it is mainly
family background in terms parental income and education that are most importantly
determinants of student performance.
8 The various education outcomes include: grade repetition; progression through school; performance on standardized tests; years of education attained; and post graduation earnings.

8
On the contrary, Card and Krueger (1992; 1996) and Krueger (2003) using different
measures of education outcomes, in particular post graduation earnings and
controlling for omitted variables such as student ability, find that lower class sizes
have strong and positive effects on future earnings. Differences in the results on class
size are attributed to different treatment of omitted variables such as student ability
and family background, which can lead to a spurious relation between school inputs
and student performance. Other studies focusing on developing countries also point to
school infrastructure to be an important factor for improved learning outcomes. For
example, Glewwe and Jacoby (1994) using a survey of 1600 households in Ghana that
tested students on mathematics, reading, and abstract reasoning investigate what kind
of resources are important determinants of learning achievement and school
completion. They find that providing blackboards and repairing school roofs that leak,
increases learning per year.
Parental education and parental preferences for their children have also been the focus
of research on student performance with consensus being that more educated parents
are likely to send their children to higher quality schools (See e.g. Case and Deaton,
1999; and Glewwe and Jacoby, 1994). Parental income has also been shown to have
an influence on student performance with children from well do to families being
positively correlated with higher test scores (Hanushek, 2003). Child nutrition and
health status are other household factors considered important for student
performance. For example, in study on the Philippines, Glewwe et al., (2001) find
significant impacts of early childhood nutrition on learning, delayed school
enrollment, and grade repetition.
Due to problems of measuring the numerous inputs into the education process,
experimental studies—that control for unobserved heterogeneity (e.g. innate ability,
motivation, and learning effort), have been used to study the impact of school
resources on learning outcomes (see e.g. Glewwe et al., 2004; Duflo, 2004; Angrist et
al., 2002; Hoxby, 2000; Angrist and Lavy, 1999). For example, in a study
investigating the effects of flip charts on test score performance in Kenya Glewwe et
al., (2004) find conflicting results when retrospective or randomized experiment
methods are utilised. First, retrospective estimates suggest that the presence of flip
charts in schools raises test scores by up to 20 % of a standard deviation. On the other

9
hand, estimates from a randomized experiment revealed that flip charts had no
significant effects on test scores. Although randomized experiments have a superior
sample selection strategy (by effectively controlling for unobserved determinants of
learning), they have a major draw back of being very expensive to undertake.
Due to the availability of international comparable data, some studies have
investigated student performance across countries. For example, Woessman (2003)
using the Third International Mathematics and Science study (TIMSS) database finds
that differences in the school incentive structure across countries and not differences
in education resources across countries to be the main determinant of student
performance9. The incentive structure can be created by: decentralization of decision-
making at the local level (district or school), for example through the recruitment and
firing of teachers; increasing competition between schools; and allowing teacher
autonomy in classroom operations, all of which positively impact on test score
performance. Indeed, other studies based on national level data also find results
pointing to the importance of incentive structure. For example, Hoxby (1996) utilizing
data from USA finds that strong teacher unions have a detrimental effect on student
performance.
Notwithstanding the limited data in developing countries, a number of studies have
analyzed determinants of learning achievement on the African continent10. For
example, Case and Deaton (1999) use variations in school quality between the
magisterial districts in South Africa to estimate the impact of school quality on
enrollment and test score performance. Under apartheid South Africa, education
resources and outcomes were differenced by race, with black households confined in
homelands with no access to high quality schools. School quality is defined in terms
of availability of teaching personnel, and schools with high pupil teacher ratio are
considered poorly resourced. Controlling for household background variables the
authors find strong and significant effects of pupil teacher ratio on test scores
performance and conclude that poorly resourced schools lower test scores.
9 Other international assessments include: OECD’s Programme for International Student Association (PISA) and UNESCO’s Southern African Consortium for Monitoring Education Quality (SACMEQ) assessments. 10 These include Glewwe and Jacoby (1994) in Ghana; Case and Deaton (1999) and Bhorat and Oosthuizen (2008) in South Africa; Michaelowa (2001) Glewwe et.al (2004) in Kenya; Bjorkman (2004) in Uganda; Das et.al (2005) in Zambia.

10
The education quality literature on Uganda has concentrated on school expenditures
and how they affect school organizations. Bjorkman (2004) evaluates the effects of
providing per student capitation grants to schools on the average district test score
performance in national primary leaving exams (PLE). Bjorkman examines school
performance before and after the introduction of the UPE program whose key element
was a per student capitation grant distributed directly to schools. Utilizing the
difference in difference methodology, the author compares test scores during the pre-
UPE and post-UPE periods (1995 and 2002). The results suggest that the per-student
capitation grant had a positive effect on average total district test scores. On the other
hand, a recent study based on a randomized evaluation in Northern Uganda finds that
take home rations conditional on school attendance boost math scores for only
children aged 11-14 years (Adelman et al. 2008). Notwithstanding the limited impact
of such food for education programs, in Uganda, they are externally driven by
donors—with limited uptake in other parts of the country not faced by civil war.
Although other studies have examined education outcomes in Uganda, a quantitative
study that combines school resources and family background of students in Uganda
has been largely ignored11. This is accordingly the focus of this study—to investigate
the effects of child, family and school resources on achievement tests in mathematics
and reading. The current debates on education quality in Uganda (discussed below)
provide another reason for undertaking this empirical investigation.
Uganda provides a good case for investigating issues of school quality for other
reasons as well. First, as earlier mentioned, current policy debates casts doubt on
whether supply side factors such as teachers, classrooms, and textbooks are the most
important factors for improved learning achievement given the fact that increased
education budgetary resources that have coincided with reduced learning
achievement. Indeed recent initiatives such as the introduction of the thematic
curriculum in 200712 and the proposed introduction of progression exams after four
11 Other studies examining education outcomes in Uganda include: Otteby (1999) and Grogan (2008) who examine school quality before and after UPE and Deininger (2003) focuses on educational attainment (years of schooling). 12 This entails the use of local languages as the medium of instruction in lower grades of primary school (Penny et al, 2008).

11
years of primary schooling are steps towards addressing some of the shortcomings of
present school system. Consequently, this study provides empirical evidence on how
successful students can be educated. Second, the study will also contribute to the
literature on education quality in Uganda that is still at its infancy. Finally, although
the focus of this current study is Uganda, the implications of the findings can be
extended to other SSA countries implementing UPE programs.
4. Methodology
4.1 Conceptual framework
The theoretical model utilized is based on the production function framework where
learning achievement (the outcome) is a result of combination of various inputs. This
framework is similar to that specified by Orazem and King (2008) and Glewwe and
Kremer (2006) as well as other studies investigating determinants of quality of
education in developing countries. In this framework, it is assumed that a household
maximizes a utility function whose main arguments are: each child’s learning, and
consumption of other goods. In addition, we assume that the utility from a child’s
schooling is subject to various constraints, in particular a budget and credit constraint.
Formally, the utility function can be specified as:
(1) ),( iii GAuU =
where iA is the child’s academic achievement and iG is the household consumption
possible after sending a child to school. The child’s learning achievement is
hypothesized to depend on: the child’s characteristics such as age, innate ability, and
health status; family background such as the parent’s education and parental
preferences for the child’s education; and school inputs including teachers, textbooks,
desks, and tables. This can be formally expressed as:
(2) ),,,( iikiik IXQSaA =
where ikA is the child’s academic performance from attending schoolk , iS is years of
schooling of the child; kQ is a vector of school quality; iX represents the child’s and

12
household characteristics; and iI represents a household’s school related expenditures
e.g. on school uniforms and exercise books. At the same time, the amount of school
and other goods consumed is limited by the budget constraint. This is expressed as
(3) 021 =−− ∑∑ iii GPIPY
where iY is the total income available to the household and 1P represents school
related costs such as: school fees; costs of scholastic materials; and the opportunity
cost of attending school. On the other hand, 2P represents the prices paid for
consumption of non school goods. The specification in Eq (2) does not consider
school prices (e.g. school fees and costs of scholastic materials) since they only
indirectly affect learning through their impact on years of schooling and school
inputs. In order to introduce such school related costs in our framework, we assume
that there is only one school available in the community; in this case, parents can
influence the characteristics as well as inputs of this particular school. In this case,
years of schooling and school inputs can be expressed as functions of school related
costs and other factors as indicated below.
(4) ),,,( 21PPXYQfS iiki =
(5) ),,,,( 21 PPXYQgI iiki =
Substituting Eq (4) and Eq (5) into Eq (2), we get the reduced form expression of
academic achievement as a function of school quality, household income, child and
household characteristics, and school related costs (Eq6).
(6) ),,,,( 21 PPXYQhA iikik =

13
4.2 Data
The paper uses two sources of data. The first dataset used comes from the Southern
and Eastern Africa Consortium for Monitoring Education Quality (SACMEQ) 2005
survey. This survey tested learning achievement of 42,000 pupils from 14 countries in
sub-Saharan Africa (SSA)13. The objective of the surveys was to examine the quality
of education provided by the primary education systems in SSA. The surveys were
conducted by the International Institute of Education Planning (IIEP) of UNESCO in
collaboration with the Ministries of Education of the respective countries.
The SACMEQ surveys employed a two-stage stratified sampling procedure. In
Uganda, the stratification variables were five regions (central, eastern, northern,
western and south western); and the size of school enrollment (large and small
schools). In the first stage, primary schools (the principal sampling unit) are selected
within the strata based on the probability-proportional to size criteria. For a defined
total school population of 9,688 schools, 163 schools were selected. In the second
stage, 20 grade-six pupils are randomly selected within the schools and administered
tests in mathematics and reading. In addition to the achievements tests, the survey
also collected background information on the sampled children and their families.
A teacher questionnaire was also administered to all grade 6 math and reading
teachers in schools attended by the sampled children in order to solicit background
information about their qualifications, training, and teaching experience. Furthermore,
tutor achievement tests were also administered to the subject teachers to gauge their
competency. Finally, a questionnaire was administered to head teachers to capture
information relating to overall school environment, staffing, resources and school
problems. Overall, 2,642 students were surveyed in Uganda and their tests score data
is matched with own characteristics; family background; and school characteristics, in
order to analyze the determinants of learning achievement14.
13 The countries are: Botswana, Kenya, Lesotho, Malawi, Mauritius, Mozambique, Namibia, Seychelles, South Africa, Swaziland, Tanzania, Uganda, Zambia, and Zimbabwe. 14 However, only 2,576 and 1,980 pupils completed the reading and math scores respectively and it is these particular numbers that we use in the estimation. According to SACMEQ, scripts of pupils who did not complete either of the tests were not graded.

14
In addition, we make use of administrative data. The second data set is from the
annual education statistical abstract by the Ministry of Education and Sports. The
abstract, which is based on annual returns by school head teachers to district
education offices, contain a number of indicators for education quality including:
number of qualified teachers, expenditure per pupil, pupil classroom ratios, and pupil
text book ratio organised by districts, of which there were 53 districts at the time of
the SACMEQ survey. The data that we use in this paper are text book ratio and per
capita expenditures in each district, which we have matched to the district from the
SACMEQ survey. Of these 53, at least 42 districts are surveyed in the SACMEQ
survey.
Our measures of learning achievement are the individual test scores on math and
reading tests. In particular, we use the standardized test scores for reading and
mathematics as the dependent variable. Furthermore, we account for the survey
design using the sampling weights for each child. Previous studies that have used this
particular dataset have been mainly cross-country despite large differences in the
school systems of the sampled countries (see e.g. Zhang, 2005; and Spreen et.al,
2005). For example, in East Africa, Tanzania and Uganda operate a 7 year primary
school cycle as opposed to the sequence of 8 years in Kenya’s. Consequently, a cross-
country analysis is likely to down play such important institutional differences. The
definitions of the variables we use are provided in Table A1.
4.3 Estimation Strategy
Following Glewwe (2002), the reduced form specification we estimate in this study
can be expressed as;
(7) )( kjikjkikijk QTXA ηεµδφβα ++++++=
where ijkA is the test score performance of student i in subject j in the thk school, jkT
is a vector of teacher characteristics for the thj subject in the thk school, iX are
individual and household characteristics as before, kQ represents school level
characteristics while iµ , kη , and jε represent unobserved individual, school, and

15
teacher factors that impact on learning. I estimate the same reduced form equation for
reading and math scores.
In estimating Eq (7) we assume a contemporaneous specification i.e. only current
inputs determine observed learning achievement. Furthermore, the ordinary least
squares (OLS) and school fixed effects procedures are employed in the estimation for
the reduced form equation15. Previous studies investigating determinants of education
outcomes (e.g. Orazem and King, 2008; Glewwe and Kremer, 2006; Case and
Deaton, 1999; and Hanushek 1996) point to a number of problems in the estimation
Eq (7). These include: omitted variable bias, sample selection bias, and measurement
error. Below we discuss how we address these problems during estimation.
Omitted variables: Omitted variable bias arises from the fact that it is not possible to
observe all factors that affect learning achievement such as innate ability of the child
and or teacher quality. If such omitted variables are correlated with observed
independent variables, then the estimated coefficients could be biased upwards or
downwards depending on the sign of correlation. A possible solution to minimizing
omitted variable bias is to include as many teacher related variables as possible. In the
estimation, we include at least 6 class-teacher related variables and we believe these
characteristics together with the child’s background characteristics reduce any bias
arising from such omitted variables. Furthermore, it is possible that learning
achievement may be correlated with unobserved factors specific to school e.g. the
presence of a good head teacher. Consequently, in order to allow for the possibility of
correlation between unobserved school factors, we estimate the school fixed effects
model by including dummy variables for all but one school. This accounts for bias
arising from the school effects on an individual child’s performance.
Sample selection bias: Another estimation challenge we attempt to deal with relates to
sample selection bias. This could arise from the fact that children may join school
late; repeat grades; dropout of school early; or are assigned to specific classes, all
leading to non-random allocation of students within schools. Although the SACMEQ
survey inquires whether a student has ever repeated a grade, this information is not
15 Other methods employed in the literature include the Hierarchical Linear Model that considers the various inputs to be aggregated at different levels.
16
utilized during estimation because of endogeniety concerns. Nonetheless, we estimate
a reduced form model for determinants of grade repetition to ascertain whether the
factors determining school performance may also explain grade repetition. Similarly,
we also account for school dropouts by including the ratio of grade 6 pupils to total
school population in some of our regressions. Also, we include a child’s own
demographic characteristics to capture aspects relating to age of joining school. In
addition, we also undertake separate estimation for urban and rural schools to account
for the fact that parents in urban areas have the ability to influence school choice. The
details of how our results may be affected by sample selection are provided in Section
5.3.
Measurement error: Finally, estimation problems may arise due to measurement
error, especially of inputs into the education production process. As earlier mentioned,
our framework ignores school inputs acquired over the years by matching individual
student data to current year teacher characteristics only. According to Hanushek
(2003), this mis-measurement is strongest if a child changes schools. However, due to
lack of baseline education achievement data, we do not control for past inputs used in
the education production process. We assume that current school resources are
reasonable proxies for previous inputs16. Consequently, our results should be
interpreted in the context of this limitation.
Also, given that the SACMEQ survey did not capture household expenditures, we
construct an index for household assets. Following studies that account for household
wealth in the absence of expenditure data (e.g. Ssewanyana and Younger, 2008; Sahn
and Stifel, 2003; and Filmer and Pritchett, 2001), we use factor analysis to construct
an asset index for the household. The following 11 household assets are used: having
a radio, having a television, having a telephone, having a fridge, having a motor cycle,
having a bicycle, having a car, and having electricity in the household. In addition, we
also include: the number of books at home; the number of cattle; and number of goats
owned by the household.
16 An alternative specification, where historical information is missing is the value added specification, which combines contemporaneous inputs with some a baseline measure of achievement; however, we do not have baseline data from our survey.

17
5. Empirical Results
5.1 Descriptive Results
As precursor to our regression results, we briefly discuss the descriptive statistics of
our sample. Table 2 provides the sample means of pupils by gender. Based on the
average performance on test scores, female pupils have a slight edge of males. In
terms of demographics, males in grade 6 are much older than their female
counterparts. In particular, about 53 % of female pupils are below 13 years compared
to only 36 % for males.
It is not only the fact that school drop outs are high in our sample, but also grade
repetition. Table 2 shows that more than half of samples have ever repeated a grade.
Worse still, at least 20% of pupils tested are currently repeating grade 6. This fact is
contrary to the Ministry of Education guidelines requiring automatic promotion of
pupils regardless of performance. Anecdotal evidence suggests that schools
introduced grade repetition in order to boost overall performance at PLE. The above
results pose serious challenges to our estimations—the sample is more likely to
capture pupils who are able to survive to grade 6 and as such is not representative of
children of school going age. Nonetheless, as earlier mentioned, we investigate
whether the factors that determine grade repetition are similar to that determining
school performance.
Table 2: Mean characteristics of pupils by gender
Variable Female Male
Average reading score 482.9 475.2 Average math score 510.3 504.5 Age=<12 0.311 0.180 Age=12 0.225 0.181 Age=13 0.196 0.248 Age=14 0.149 0.164 Age=>14 0.120 0.228
Total [1.00] [1.00] Pupil ever repeated a grade 0.516 0.507 Pupil currently repeating grade 6 0.200 0.213 Number of days absent from school 1.696 1.900 Pupil has own sitting place 0.915 0.864 Pupil has own writing place 0.761 0.721

18
Parental education Mother's Education: No school 0.133 0.164 Mother's Education: Some primary 0.326 0.379 Mother's Education: Completed primary 0.247 0.199 Mother's Education: Secondary 0.091 0.091 Mother's Education: Post secondary 0.074 0.077
Total [1.00] [1.00] Father's Education: No School 0.080 0.098 Father's Education: Some Primary 0.293 0.291 Father's Education: Completed Primary 0.168 0.210 Father's Education: Secondary 0.179 0.150 Father's Education: Post secondary 0.094 0.081
Total [1.00] [1.00] Pupil has a morning meal everyday 0.570 0.523 Pupil has a lunch meal everyday 0.708 0.638 Pupil has an evening meal everyday 0.865 0.848
Number of observations 1,148 1,471
In terms of household characteristics, Table 2 shows that there are no significant
differences in parental education between female and male pupils. However, the
educational attainment of mothers is considerably much lower than that of fathers. For
example, for female pupils, whereas only 16% of mothers have attained some
secondary or higher education, the corresponding rate for fathers is 27 %. In terms of
nutrition, females are just as likely as males to have either: a morning, a lunch, or an
evening meal. In the next sub-section, we examine the characteristics of schools in
our sample.
Table 3 provides the means of the school characteristics in our sample—both by
location and school ownership. First, it is evident that urban schools are concentrated
in specific sub-regions notably central and south western Uganda. Furthermore,
sampled private schools are only from two sub regions—Central and Northern
Uganda. More so, at least 40 % of the private schools are located in urban areas.
Second, with regard to the characteristics of the head teacher, majority are more likely
than not to be male. It is only in private schools where female head teachers appear as
the majority. Related, head teachers in private schools are much younger compared to
public schools. Third, only a few schools have electricity and these as expected are in
urban areas or are privately owned. Also, on average primary schools are about 10.8

19
kms and 3.2 kms away from the nearest secondary school in rural and urban areas
respectively. Finally, schools on average have about 700 pupils although private
schools have a lower school population—about 500 pupils. On the other hand, the
grade 6 population is on average 40 pupils with again private schools having a much
smaller population of females in grade 6.
Table 3: Means characteristics of the schools by location and ownership
Location Ownership Rural Urban Public Private
Regions Central Region 0.21 0.31 0.21 0.67 Eastern Region 0.36 0.22 0.35 0.00 Northern Region 0.17 0.18 0.16 0.33 South Western region 0.18 0.30 0.20 0.00 Western Region 0.09 0.00 0.07 0.00 Total [1.00] [1.00] [1.00] [1.00] Pupil classroom ratio 54.0 58.5 54.9 50.1 Head teacher is male 0.87 0.83 0.89 0.33 Average age of head teacher 42.2 42.1 42.5 34.8 Distance to the nearest secondary school (kms) 10.8 3.2 9.7 6.6 Number of teachers with 2 years of teacher training 7.2 8.1 7.5 2.1 Average number of pupils in the school (male) 345.0 332.2 346.6 252.6 Average number of pupils in the school (female) 330.2 363.2 339.2 244.1 Average number of pupils in grade 6 (male) 22.9 19.5 22.2 28.0 Average number of pupils in grade 6 (female) 18.4 20.9 18.9 17.4 Average number of streams in the school 13.8 13.9 14.0 10.1 Average number of grade 6 streams 1.0 1.0 1.0 1.0 Number of school inspections in the past 2 years 10.8 14.6 11.1 19.5 Number of full inspections in the past 2 years 1.9 3.9 2.0 8.8 School has a library 0.91 0.93 0.91 1.00 School has a electricity 0.06 0.22 0.07 0.41 Number of toilet squatting holes for boys 3.6 3.4 3.6 1.2 Number of toilet squatting holes for girls 3.5 4.3 3.7 1.2 School is located in an urban area - - 0.15 0.41 Average teacher performance on reading test 683.6 701.8 686.3 695.1 Average teacher performance on math test 822.1 788.1 814.3 877.0
Number of observations 1959 683 2489 153
In terms of teacher characteristics, Table 3 also shows that there are minimal
differences between rural and urban schools with regard to number of qualified
20
teachers. In particular, most schools have at least 7 teachers with the mandatory 2
years of teach training. Also, teachers in private schools consistently perform much
better than their public counterparts on performance tests—especially in mathematics.
On the other hand, it is mainly urban schools that receive school inspectors.
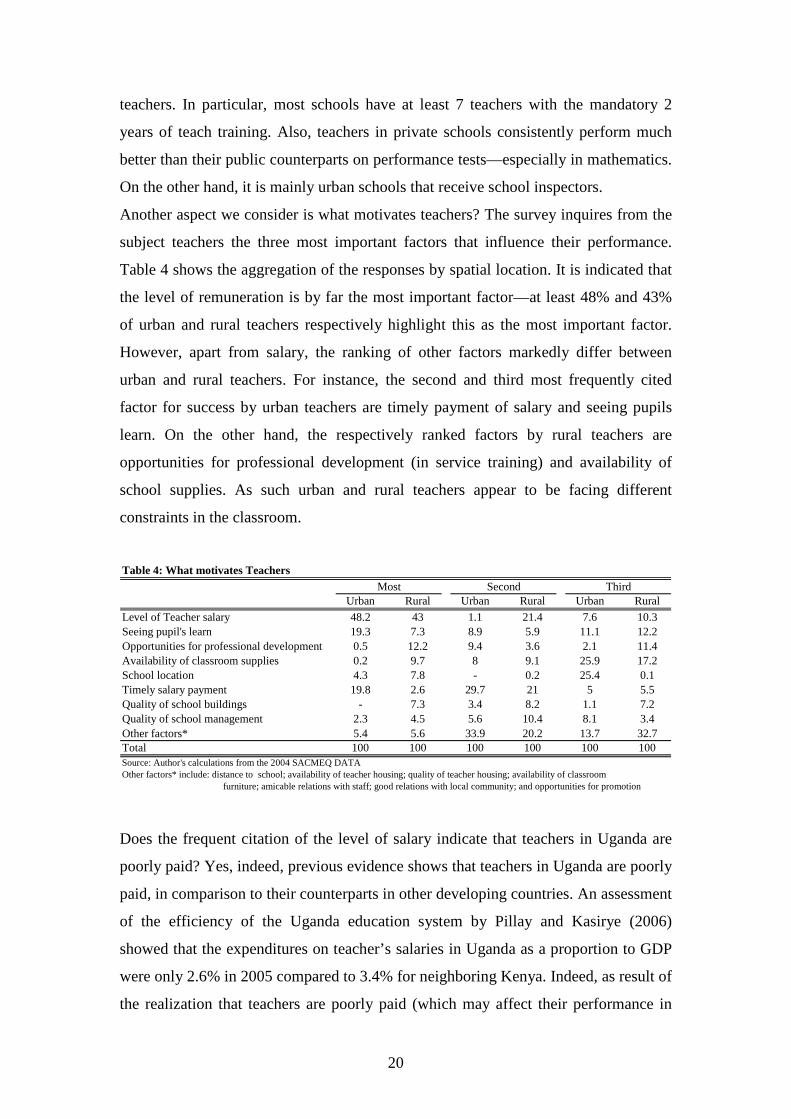
Another aspect we consider is what motivates teachers? The survey inquires from the
subject teachers the three most important factors that influence their performance.
Table 4 shows the aggregation of the responses by spatial location. It is indicated that
the level of remuneration is by far the most important factor—at least 48% and 43%
of urban and rural teachers respectively highlight this as the most important factor.
However, apart from salary, the ranking of other factors markedly differ between
urban and rural teachers. For instance, the second and third most frequently cited
factor for success by urban teachers are timely payment of salary and seeing pupils
learn. On the other hand, the respectively ranked factors by rural teachers are
opportunities for professional development (in service training) and availability of
school supplies. As such urban and rural teachers appear to be facing different
constraints in the classroom.
Urban Rural Urban Rural Urban Rural
Level of Teacher salary 48.2 43 1.1 21.4 7.6 10.3Seeing pupil's learn 19.3 7.3 8.9 5.9 11.1 12.2Opportunities for professional development 0.5 12.2 9.4 3.6 2.1 11.4Availability of classroom supplies 0.2 9.7 8 9.1 25.9 17.2School location 4.3 7.8 - 0.2 25.4 0.1Timely salary payment 19.8 2.6 29.7 21 5 5.5Quality of school buildings - 7.3 3.4 8.2 1.1 7.2Quality of school management 2.3 4.5 5.6 10.4 8.1 3.4Other factors* 5.4 5.6 33.9 20.2 13.7 32.7Total 100 100 100 100 100 100Source: Author's calculations from the 2004 SACMEQ DATAOther factors* include: distance to school; availability of teacher housing; quality of teacher housing; availability of classroom
Table 4: What motivates Teachers
furniture; amicable relations with staff; good relations with local community; and opportunities for promotion
Most Second Third
Does the frequent citation of the level of salary indicate that teachers in Uganda are
poorly paid? Yes, indeed, previous evidence shows that teachers in Uganda are poorly
paid, in comparison to their counterparts in other developing countries. An assessment
of the efficiency of the Uganda education system by Pillay and Kasirye (2006)
showed that the expenditures on teacher’s salaries in Uganda as a proportion to GDP
were only 2.6% in 2005 compared to 3.4% for neighboring Kenya. Indeed, as result of
the realization that teachers are poorly paid (which may affect their performance in

21
classrooms), and due to numerous threats of industrial action, the GoU has
considerably increased teacher’s salaries in the recent past. The average primary
teacher salary increased from Ushs 130,000 (US$ 75) per month in 2002/03 to Ushs
200,000 (US$ 125) per month during the 2006/7 financial year. However, the
SACMEQ survey does not inquire from the teachers the level of the current salary and
as such we are unable to use any variables capturing teacher’s pay in our regressions.
5.2 Regression estimates
Impact of individual characteristics on learning
The estimation of Eq (7) is undertaken in a series of steps and the results are
presented in Table 5 below. First, the naïve OLS model is estimated for both math and
reading scores (Columns 1 and 2) and this specification also includes regional
variables as well as district level information on pupil textbook ratios. Next, given the
fact the observations may be correlated within schools, we estimate the random and
fixed effects model. Below we discuss some of our key findings starting with the OLS
results.
Child Characteristics: Starting with child characteristics, it is indicated that learning
achievement is not invariant to gender. Female pupils are significantly disadvantaged
in both reading and math but the strongest disadvantage is in math. Specifically, girl’s
performance on reading and math is lower than that of boys by about 9% and 15%
respectively. In addition, we investigate whether female pupils performance better in
the presence of a female teacher by including an interaction term of female child and
female subject teacher. For both reading and math scores, the interaction term is
insignificant. Consequently, girls are not helped by the presence of a female teacher in
class17.
Second, younger children perform much better than their older counterparts (In this
particular case, the default category is children aged 15 years and above). The above
results may be partly explained by the massive late entry into school coupled with the
17 We also carried out separate regressions for girls and boys (reported in appendix A2). With the exception of a few variables notably: mother’s and father’s education for reading scores; head teacher experience and residence in Central Uganda, the results from the separate regressions are similar to those in Table 5.
22
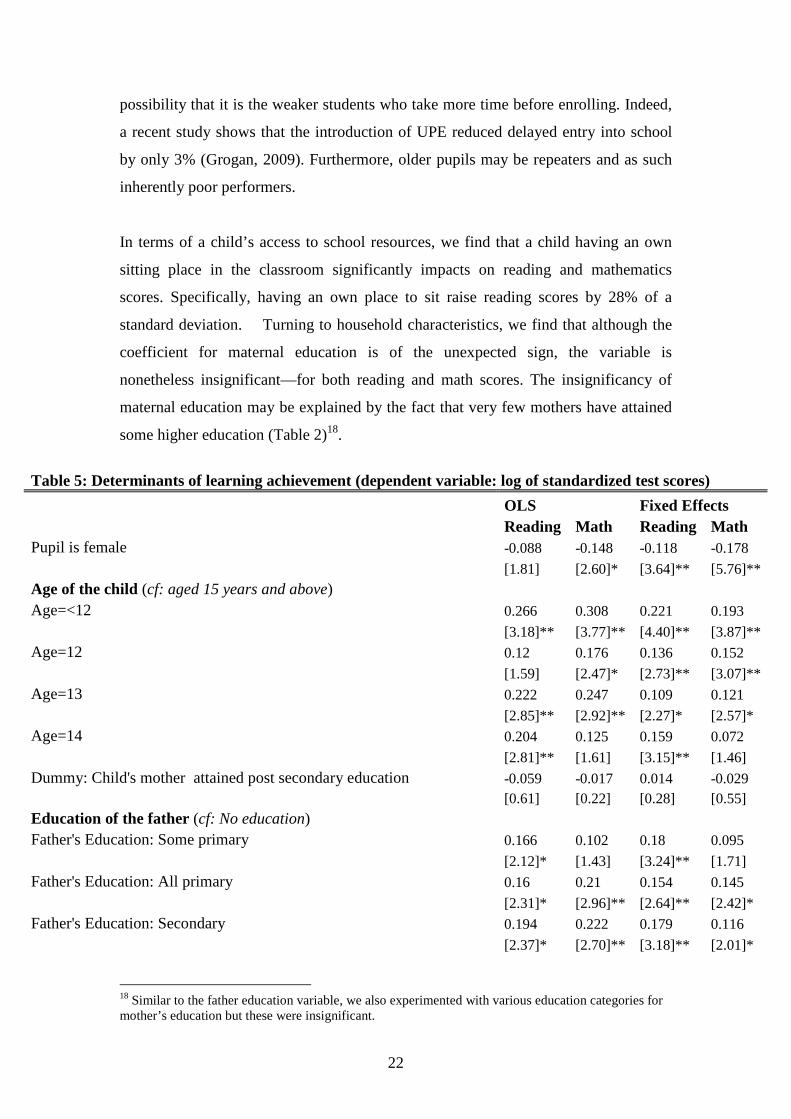
possibility that it is the weaker students who take more time before enrolling. Indeed,
a recent study shows that the introduction of UPE reduced delayed entry into school
by only 3% (Grogan, 2009). Furthermore, older pupils may be repeaters and as such
inherently poor performers.
In terms of a child’s access to school resources, we find that a child having an own
sitting place in the classroom significantly impacts on reading and mathematics
scores. Specifically, having an own place to sit raise reading scores by 28% of a
standard deviation. Turning to household characteristics, we find that although the
coefficient for maternal education is of the unexpected sign, the variable is
nonetheless insignificant—for both reading and math scores. The insignificancy of
maternal education may be explained by the fact that very few mothers have attained
some higher education (Table 2)18.
Table 5: Determinants of learning achievement (dependent variable: log of standardized test scores)
OLS Fixed Effects Reading Math Reading Math Pupil is female -0.088 -0.148 -0.118 -0.178 [1.81] [2.60]* [3.64]** [5.76]** Age of the child (cf: aged 15 years and above)
Age=<12 0.266 0.308 0.221 0.193 [3.18]** [3.77]** [4.40]** [3.87]** Age=12 0.12 0.176 0.136 0.152 [1.59] [2.47]* [2.73]** [3.07]**
Age=13 0.222 0.247 0.109 0.121 [2.85]** [2.92]** [2.27]* [2.57]* Age=14 0.204 0.125 0.159 0.072 [2.81]** [1.61] [3.15]** [1.46]
Dummy: Child's mother attained post secondary education -0.059 -0.017 0.014 -0.029 [0.61] [0.22] [0.28] [0.55] Education of the father (cf: No education) Father's Education: Some primary 0.166 0.102 0.18 0.095 [2.12]* [1.43] [3.24]** [1.71]
Father's Education: All primary 0.16 0.21 0.154 0.145 [2.31]* [2.96]** [2.64]** [2.42]* Father's Education: Secondary 0.194 0.222 0.179 0.116 [2.37]* [2.70]** [3.18]** [2.01]*
18 Similar to the father education variable, we also experimented with various education categories for mother’s education but these were insignificant.

23
Father's Education: post secondary 0.433 0.324 0.324 0.198 [4.46]** [3.64]** [5.14]** [3.11]** ln(Asset Index) 0.103 0.142 -0.06 -0.062 [1.19] [1.39] [1.39] [1.37] Pupil has own sitting place 0.283 0.096 0.307 0.15 [2.83]** [0.46] [5.42]** [2.61]** Subject teacher is female -0.054 -0.175 -0.316 0 [0.41] [0.87] [2.44]* [.] Interaction of female child with a female reading teacher 0.03 -0.062 0.034 0.131 [0.30] [0.44] [0.47] [1.33] Log of Performance on teacher test 0.05 -0.002 -0.004 0.039 [1.04] [0.02] [0.14] [0.23] Number of lessons taught per week -0.012 -0.005 0.001 -0.012 [3.23]** [0.78] [0.27] [0.42] Subject teacher regularly corrects homework 0.097 0.283 0.057 0.058 [1.54] [4.26]** [1.69] [1.69] Subject teacher satisfaction with school environment 0.043 0.062 0.091 0.129 [0.80] [1.02] [1.79] [0.17] Number of teachers with 2 years of teacher training 0.024 0.006 [2.79]** [0.63] Number of inspections in the past 2 years 0.002 -0.006 [0.32] [0.70] School has electricity 0.711 0.602 [2.89]** [2.45]* Pupil classroom ratio 0 -0.001 [0.33] [0.78] District pupil text book ratio for grade 4 to 7 0.037 0.105 [0.36] [0.74] Index of head teacher reports that pupils often having problems at school -0.058 0.075 [0.64] [0.53] Index of head teacher reports that teachers often having problems at school 0.115 -0.024 [1.26] [0.18] School is private 0.555 -0.252 [1.63] [1.08] Distance to nearest secondary school -0.003 -0.005 [1.48] [1.62] Pupils borrow books at school 0.035 0.046 [0.46] [0.28] Head teacher experience at present school 0.007 0 [0.47] [0.01] Number of lessons conducted per week (head teacher) 0.01 0.015 [1.86] [1.72] Duration of head teacher special training (months) 0.004 0.004 [1.79] [1.17]

24
urban -0.13 -0.064 [0.74] [0.32] Regions (cf: Northern Uganda) Central Region 0.051 -0.01 [0.26] [0.03] Eastern Region 0.239 0.132 [1.66] [0.56] South Western Region -0.027 0.07 [0.15] [0.28] Western Region -0.083 -0.46 [0.50] [1.76] Constant -1.219 -1.145 -0.486 -0.145
[2.61]** [1.17] [3.47]** [0.24]
Observations 2397 1788 2491 1845 R-squared 0.24 0.22 0.05 0.04
Number of groups 154 115
t statistics in brackets * significant at 5%; ** significant at 1%
On the other hand, increasing father’s education has the largest payoff with regard to
raising a child’s reading and math performance. In particular, a father having
completed primary school raises reading test scores by 16% of a standard deviation.
On the other hand, attaining some secondary and post secondary education raises
reading scores by 19% and 43% respectively. The impact of father’s education on
academic performance may operate via household income—households with highly
educated fathers may have higher socioeconomic status and thus are in position to
finance the acquisition of key education inputs.
Although our proxy indicator for household wealth (as measured by the asset index) is
of the expected sign, it is nonetheless insignificant19. On the other hand, we have
some significant school level variables that may be related to household wealth. In
particular, having electricity in the school has the largest effect on a child’s
performance—raising reading and math scores by 71% and 60 % of a standard
deviation respectively. Given that in most areas of Uganda it is affluent
19 In the asset index, we do not include some variables (not captured in the data) e.g. land ownership—which we feel would better capture the welfare status of agricultural households.

25
neighbourhoods that have electricity, our indicator for a school having electricity may
be proxing richer neighbourhoods20.
Policy Variables: As earlier mentioned, one of the disadvantages of our dataset is that
there are very few variables amenable to policy despite the numerous variables
captured in the survey. In combination with administrative data (at the district level),
we have access to five variables which we feel can be influenced by public policy.
These are: number of teachers with 2 years of teacher training; number of recent
school inspections; pupil-classroom ratio; and district pupil text book ratio.
Among the policy variables, only one appear as significant determinants of learning
achievement—teacher training (as illustrated by the separate regression reported in
Table A3 and A4 in the appendix, other policy are not significant—even on their
own). Indeed, teaching training is a key factor in explaining test scores—especially
reading scores, although the impact is relatively small in comparison to household and
characteristics (e.g. having electricity). Specifically, each additional teacher in the
school with the required two years teacher training years improves reading scores by
2.4 % of a standard deviation. On the other hand, the insignificancy of other policy
variables may be partly explained by the fact they may be measured with substantial
error. Indeed, as highlighted by Orazem and King (2008), a number of studies do not
find significant impact of class size related variables due to this specific
shortcoming21.
Teacher characteristics: Most of the subject teacher characteristics return
insignificant results. The few exceptions include, teaching load and correcting
homework provided to pupils. In particular, each additional lesson taught per week
reduces reading scores by 1.2% of standard deviation. In Uganda, teaching loads
range from 12-30 lessons per week for lower class teachers (grade 1-3) to 40-50
lessons per week for grades 4-7. A higher number of lessons per week may imply that
teachers do not have adequate time to prepare for classes. On the other hand, the
results for the variable capturing whether the subject teacher regularly corrects
20 In our regressions, having electricity at the school may also be accounting for a number of unobserved infrastructure inputs in the school process. 21 Other recent studies on SSA also find that most policy variables such as pupil-teacher ratio are insignificant (Bhorat and Oosthuizer, 2008).
26
homework indicate that this significantly boosts performance. Furthermore, correcting
homework has the largest impact for math scores. A math teacher regularly providing
and correcting homework increases math scores by about 28 % of a standard
deviation. This results points to the importance of feedback as means of gauging pupil
performance. Finally, most of the other explanatory variables e.g. spatial location and
the school environment are insignificant.
School Fixed: As earlier mentioned we also undertook random and fixed effects
estimations. The Langrage Multiplier test on the random effects model confirms that
school fixed effects are important. In particular, about 42 % of variation in reading
and math scores net of individual effects can be attributed to schools (not indicated in
the table). Indeed, the within school correlation is highly significant with chi-squared
test statistics of 923 and 613—for reading and math respectively. Furthermore, the
Hausman tests for both reading and math scores indicate that fixed effects estimation
is preferred to the random effects estimation. The school fixed effects regressions are
reported in columns 3 and 4. It is important to note from the onset that some of our
results for individual and household impacts on school performance do change
substantially as we move from OLS to fixed effects estimation—suggesting that
school variation is important.
5.3 Accounting for selection bias
Given the high dropout rates and grade repetition in the Uganda school system,
sample selection bias is a major concern in our estimations. In particular, the grade 6
pupils observed in our sample may not be representative of the population of
schooling going age. Despite the fact we can not adequately control for sample
selection (due to the nature of the dataset), nonetheless attempts are made to
investigate how sample selection may be affecting our results.
To this end, for each school, we calculate the ratio of grade 6 pupil to total school
population. In schools where dropouts are high, one can expect a lower ratio of grade
6 pupils to total school population and the opposite would be true. On the other hand,
a lower ratio may also be explained by recent school expansions—which would lead
to large student population in the lower classes. Table 6 profiles the ratio of grade 6

27
pupils based on observable school characteristics. The ratios are categorised into three
equal parts representing schools with: low, medium, and high grade 6 to school
population ratios. The table indicates that schools with the lowest grade 6 ratios are
mainly located in urban areas. Furthermore, most of the schools are located in
Northern and to a less extent in Eastern Uganda. In terms of pupil indicators, schools
with low grade 6 ratios on average have large class sizes. Overall, the table suggest
that low grade 6 ratios may be explained by recent school expansions due to UPE and
not school dropouts per se. Nonetheless, we include this particular variable—which
attempts to account for sample section in our regressions. Our results, reported in
Table A6 in the appendix, do not change with the inclusion of this particular variable.
Furthermore, the coefficients for ratio of grade 6 pupils insignificant22. Consequently,
our results may not be greatly affected by the fact the dataset has only grade 6 pupils
sampled from a system characterised by high school dropouts.
Table 6: Ratio of Grade 6 pupils to school population
School Characteristic Ratio of grade 6 pupils to school population Low Middle High
Average teacher score on math test 832 848 814 Average teacher score on reading test 708 713 618 Pupil classroom ratio 122 88 59 Pupil toilet ratio 168 134 81 District per capita expenditure 33,000 32,000 32,380 District pupil text book ratio 2.9 3 2.9 School is private 2% 6% 9% Distance to the nearest secondary school (kms) 8.4 7.1 8.8 School located in urban areas % 35.2 22.4 19.7 Regions Central 0.2 0.35 0.26 Eastern 0.26 0.29 0.28 Northern 0.38 0.09 0.13 South Western 0.07 0.17 0.1 Western 0.09 0.1 0.23
Total [1.00] [1.00] [1.00]
22 In order to explore further how sample selection bias affects our results, we experiment with two variables considered endogenous in our estimation—number of days absent from school and whether a student has ever repeated a grade. The results suggest that the correlates of school absence and grade repetition are different from the determinants of test scores (Table A6). Consequently, including the two particular variables in our main estimation would not help in accounting for selection bias.

28
Another potential source of endogeniety we investigate is with regard to the location
of the school i.e. whether in urban or rural area. As earlier mentioned, parents in
urban areas are able to select schools for their children and these are not necessarily
the nearest schools. Table A7 shows the separate regressions for urban and rural
schools. Some of the important variables for school performance differ markedly
between urban and rural pupils. For example, the presence of electricity in the school
is only important for rural areas. Similarly, whereas increase in age reduces
performance in reading text scores in urban areas, it has no effect in rural areas.
6. Discussion and conclusions
This study investigates the correlates of learning achievement in Ugandan primary
schools. We utilise a nationally representative survey of grade 6 pupils and estimate
standard OLS and school fixed effects education production functions based on
mathematics and reading tests. Like any other study in the education economics
literature, the present study has to deal with a number of potential biases especially
relating to omitted variables, sample selection, and school placements. Given the fact
that we do not have access to panel data, we are only able to partially control for some
of the above biases. For example, we investigate how sample selection bias may be
affecting our results. Furthermore, they are hardly any variables in the datasets that
qualify to serve as instruments for pupil test scores23, consequently, we do not utilise
the instrumental variables approach despite concerns of omitted variables.
One of the most interesting finding is that teacher’s pre-service training matters more
than the teacher’s own cognitive performance. Indeed, although it is good to have
smart teachers, having teachers who have been trained to teach is most preferred. This
finding is of particular importance in Uganda where the requirements for teacher
training were relaxed in late 1990s order to increase the supply of primary teachers.
As earlier mentioned, in response to bulge in UPE enrolment, the GoU embarked on a
massive recruitment of teachers—some of whom where are untrained. At the same
23 Although school attendance could be a possible instrument, it is still not possible to estimate a Heckman correction model for example, without information on non-students.

29
time, the government reduced the number of core Primary Teacher Training colleges
as a cost cutting measure.
Overall, our results suggest that the increase in unqualified teachers may partly
explain the decline in learning achievements witnessed during the implementation of
UPE. Overall, despite its importance, the proportion of untrained teacher in Ugandan
primary schools remains large. According to the 2006 Education Statistical Abstract,
at least 25 % of all primary school teachers were not trained (MoES, 2007). Majority
of untrained teachers are in remote and hard-to-reach areas that fail to attract qualified
teachers. Nonetheless, the lack of trained teachers may also be a result of
decentralisation of teacher recruitment to the districts. There is evidence to show that
some districts prefer recruiting personnel considered native to the district—to the
detriment of overall teaching quality (Pillay and Kasirye, 2006). Even then, sacking
all un-qualified teacher may not be a feasible option given the fact the pupil to teacher
ratio remains high even with the large numbers of unqualified personnel.
We also find that it is not only qualified teachers that matter for schooling but also
other inputs matter as much. In particular, a pupil having either a place to sit is
significantly influences learning achievement. During the implementation of UPE,
classroom furnishings have been some of the most neglected school inputs. Even then,
the situation is bound to continue as future earmarks for education do not show an
increase in the provision of desks and chairs. For example, of the planned capital
expenditures in primary school during the current Education Sector Strategic
Investment Plan (2004-2015), only 1 % of the Ushs 1,444 billion (US$ 850 million) is
earmarked for classroom furnishings (MoES, 2004). The bulk of the resources are
ring-fenced for classroom construction and staff training—90 and 9 % respectively. In
addition, as education expenditures are re-prioritised to make room for additional
universal secondary education expenditures, expenditures on classroom furnishings
are bound to be reduced further. As such, as all pupils move from make-shift
classrooms to permanent classrooms, some pupils are bound to continue receiving
instruction on the floor. Nonetheless, we find that a number of other important
variables do not significantly impact on either reading or math scores. We attribute
this to measurement problems in some of the key explanatory variables.

30
7. References
Adelman, S. et al. (2008) “The Impact of Alternative Food for Education Programs on Learning Achievement and Cognitive Development in Northern Uganda” mimeo University of Maryland. Angrist, J.D. et.al (2002) “Vouchers for private schooling in Columbia: Evidence from a randomized natural experiment”. America Economic Review. Vol.92.
pp.1535-1558. Angrist, J.D. and V. Lavy, (1999) “Using Maimonides Rule to Estimate the Effect of Class Size on Scholastic Achievement”. Quarterly Journal of Economics. Vol.114. pp.533-75. Bhorat, H and M. Oosthuizen (2008) “Determinants of Grade 12 Pass Rates in Post Apartheid South Africa Schooling System” forthcoming in the Journal of African Economies. Borjkham, M (2004) “Public Funding in the Educational Sector and its Effect on Test Scores: Evidence from the Primary Education Sector in Uganda”.
http://www.arts.cornell.edu/econ/mainwindow.shtml Card, D. and Krueger, A.B (1996) “Labour Market Effects of School Quality: Theory and Evidence”. In Gary Burtless (ed.), Does Money Matter? The Effect of School Resources on Student Achievement and Adult Success. pp.43-73. Washington, D.C: The Brookings Institution. _________, (1992) “School quality and black-white relative earnings: a Direct assessment”. Quarterly Journal of Economics. Vol.107, No. 1 (February). pp. 151-200. Case, A. and A. Deaton, (1999) “School inputs and educational outcomes in South
Africa”. Quarterly Journal of Economics. Vol.114, No. 3 (August). pp.1047- 84.
Das, J. et al. (2007) “Teacher shocks and Student Learning” Journal of Human Resources Vol.39 (4): 820-862 Deininger, K (2003) “Does Cost of Schooling Affect Enrollment by the Poor? Universal Primary Education in Uganda”. Economics of Education Review Vol.22. No.3 (June). pp.291-305. Duflo, E (2004) “The medium run Consequences of Education Expansion: Evidence From a large school construction program in Indonesia”. Journal of Development Economics. Vol.74, No. 1. pp 163-197. Duflo, E and M. Kremer (2008) “Use of Randomization in the Evaluation of Development Effectiveness” http://econ-www.mit.edu/files/765 Filmer, D and L. Prittchet (2001) “Estimating Wealth Effects without expenditure data or Tears: An application of Education Enrolment in States of India” Demography Vol. 38: No.1: 115-132. Glewwe, P (2002) “Schools and skills in developing Countries: Education Policies and Socioeconomic outcomes”. Journal of Economic Literature. Vol 40. No. 2: 436-482. Glewwe, P and M. Kremer (2006) “Schools, Teachers, and Educational Outcomes in Developing Countries”. In Eric A. Hanushek, Finis Welch (eds.), Handbook on the Economics of Educations. Amsterdam: North-Holland. Pp.946-983. Glewwe, P and H. Jacoby (1994) “Student achievement and schooling choice in low Income countries: Evidence from Ghana”. The Journal of Human Resources.
Vol. 29, No. 3. pp. 843-864. Glewwe, P., M.Kremer, S.Moulin and E.Zitzewitz (2004) “Retrospective vs.
Prospective Analysis of School Inputs: The Case of Flip Charts in Kenya”.

31
Journal of Development Economics. Vol.74. pp. 251-268. Glewwe, P., H.Jacoby and E.King (2001) “Early childhood nutrition and Academic
Achievement: A longitudinal Analysis”. Journal of Public Economics Vol.81, No.3. pp. 345-368.
Grogan, L (2009) “Universal Primary Education and School Entry in Uganda” Journal of African Economies Vol 18. No.1: 183-211. Hanushek, E. A and L. Woessmann (2008) “The Role of Cognitive Skills in Economic Development” Journal of Economic Literature Vol. 46. No. 3: 607- 668. Hanushek, E.A (2003) “The failure of input-based schooling policies” The Economic Journal. Vol.113, (February). pp.F64-F98. _________, (1996) “Measuring investment in education”. Journal of Economic Perspectives, Vol.10, No.1. pp.9-30. _________, (1986) “The Economics of schooling: production and efficiency in Public schools”. Journal of Economic Literature. Vol.24, No.3 (September). pp.1141-1177. Hanushek, E.A and R.R.Pace (1995) “Who Choose to teach (and why)?” Economics
of Education Review Vol.14, No.12 (June). pp.101-117. Heckman, J.J (1979) “Sample Selection Bias as a Specification Error” Econometrica Vol.47, No. 1. pp. 153-161. Hoxby, C.M (2000) “The Effect of class size on student achievement: new evidence from population variation”. Quarterly Journal of Economics, Vol. 115, pp.1239-1286. _______, (1996) “How teacher Unions Affect Education Production” Quarterly Journal of Economics Vol.111, No.3. pp.671-718. Krueger, A. B (2003) “Economic Consideration and Class Size” Economic Journal Vol. 113: 34-63. _______, (1999) “Experimental Estimates of Education Production Functions” Quarterly Journal of Economics Vol. 114 May: 497-532. Michaelowa, K (2001) “Primary Education Quality in Francophone sub-Saharan Africa: Determinants of Learning Achievement and Efficiency Considerations”. World Development Vol. 29. No. 10: Ministry of Education and Sports. (2007) Education Statistical Abstract 2006. Kampala, Ministry of Education and Sports. ______., (2006). Education Statistical Abstract 2005. Kampala, Ministry of Education and Sports. ______., (2004). Education Management Information System 2004. Kampala, Ministry of Education and Sports. ______., (2003). Education Statistical Abstract 2003. Kampala, Ministry of Education and Sports. Ministry of Finance Planning and Economic Development (2007) Increasing Investment, Employment, Productivity and Household Incomes through Public Expenditures: Background to the Budget 2007/2008. Kampala. Ministry of Finance Planning and Economic Development. Musisi N.B., et al (2003) “Attendance Patterns and Causes of Drop-Out in primary Schools in Uganda” mimeo Makerere Institute of Social Research. Nishimura, M et al (2008) “Impacts of the Universal Primary Education Policy on Education Attainment and Private Costs in rural Uganda” International Journal of Education Development Vol.28: 161-175 Orazem, P. F and E. M. King (2008) “Schooling in Developing Countries: The Role

32
of Supply, Demand and Government Policy” In Schultz, P and J. Strauss (eds.), Volume 4 Handbook of Development Economics: 3475-3559 Amsterdam: North-Holland. Otteby, K (1999) “The Effects of Universal Primary Education in Uganda” Unpublished undergraduate dissertation, University of Oxford, United Kingdom. Penny, A et al (2008) “Education Sector Reform: The Ugandan Experience” International Journal of Educational Development Vol 28: 268-285. Pillay, P and I.Kasirye (2006) Efficiency in the Education Sector in Uganda: Analysis and Recommendations. Mimeo Economic Policy Research Centre. SACMEQ (2005) The release of the SACMEQ data archives. 1 July. Harare:
SACMEQ. Retrieved 1 July 2005 from: http://www.sacmeq.org/access/announce1.pdf.
Sahn, D and D. Stifel (2003) “Exploring Alternative Measures of Welfare in the Absence of Expenditure Data” Review of Income and Wealth Vol.49. No.4:463-489.
Spreen, C. A et.al (2005) “What can we learn about improving Teaching and Learning from comparing policies across countries: A study of student learning achievement and Teacher Quality in Southern Africa”. Paper presented at The 2005 International Education Policy Research Conference in Paris.
Ssewanyana, S and S. Younger (2008) “Infant Mortality in Uganda: Determinants, Trends and the Millennium Development Goals” Journal African Economies. Vol. 17, No. 1:34-61.
UNEB (2007a) Database of Pupil Performance on Primary Leaving Exams by Districts (2000-2006). Kampala. Uganda National Examinations Board,
Uganda. Accessed January 2008. ______., (2007b) The achievements of primary school pupils in Uganda in English and Mathematics: national assessment of progress in education 2006. Kampala. Uganda National Examinations Board, Uganda. UNESCO (2001) Including the Excluded: Meeting Diversity in Education: Examples from Uganda” UNESCO World Bank (2004) World Development Report: Making services Work for poor people. Washington D.C. The World Bank. Wossman, L (2003) “School Resources, Education Institutions and Student Performance: The International Experience” Oxford Bulletin of Economics and Statistics. Vol.65, No.2. pp.117-170. Zhang, Y (2005) “Rural-Urban Gaps in Grade 6 Reading Literacy Scores in sub- Saharan Africa: Unequal Opportunities and Unequal Results”. Paper presented at the 2005 International Education Policy Research Conference in Paris.

33
8. Appendix
Box 1: Why do pupils drop out of school? In the table below we examine the reasons why individuals left school before completing primary schooling and the table suggests that the reasons why pupils dropout of school vary widely. Nonetheless, the table indicates that over time, cost remains the predominant reason for leaving school—both in rural and urban areas. For example, in 2005/06, 45 and 59 % of pupils out of school in rural and urban areas respectively cite cost as the key reason for dropping out. Although the UPE program provides free tuition, schools in urban areas are allowed to levy additional charges to cater for sanitation provision and related services. On the other hand, some schools in rural areas levy discretionary fees to provide lunch to pupils. Apart from discretionary school levies, parents are supposed to provide school uniforms as well as other school materials.
Rural Urban Rural Urban Rural UrbanCost of schooling too expensive 44.6 58.8 58.1 68.9 65.475.2Not willing to attend further 16 7.9 - - - -Sickness or clamity in the family 7.4 4.5 - - - -Parents did not want 6.8 4.7 16.1 15.9 11 9.1Poor academic progress 5.2 4.1 - - - -Help with home, family, or farmwork 4.4 2.6 7.1 3.2 7.6 3.8Pregnancy 4.1 3.8 3.6 2.2 3.5 1.4Other reasons 11.5 13.6 15.1 9.8 12.5 10.5
Total 100 100 100 100 100 100
Notes: Other reasons include: completed desired schooling, poor school quality, and schools being too far away
Reasons for droping out of school (individuals who never completed primary school), 1999/2000-2005/06 (%)
"-" The dashes imply that the particular response category was not included in the specific survey
2005/06 2002/03 1999/2000
Source: Author's calculations from the 2005/06, 2002/03, and 1999/2000 UNHS surveys

34
VariableStandardized reading scoreStandardized mathematics scoreGender (Female=1)Dummies for age of the childAge=<12Age=12Age=13Age=14Age=>14Ever repeated a gradeNumber of days absent from schoolParent's EducationMother's Education: No schoolMother's Education: Some primaryMother's Education: Completed primaryMother's Education: SecondaryMother's Education: Post secondaryFather's Education: No School Father's Education: Some PrimaryFather's Education: Completed PrimaryFather's Education: Secondary
Father's Education: Post secondary
Log of household Asset indexPupil has own sitting placeSubject teacher is femaleInteraction of female child with a female reading teacherLog of Performance on teacher testNumber of lessons taught per week Subject teacher reguraly corrects homeworkIndex of subject teacher satisfaction with school environmentNumber of teachers with 2 years of teacher trainingNumber of inspections in the past 2 yearsSchool has electricityPupil classroom ratioDistrict pupil text book ratio for grade 4 to 7Index of head teacher reports that pupils often having problems at schoolIndex of head teacher reports that teachers often having problems at schoolSchool is privateDistance to the nearest secondary school (kms)Pupils borrow books at schoolHead teacher's experience at current school Number of lessons conducted by headteacher per weekDuration of headteacher at in-sevice training (months)School is located in an urban areaRegionsCentral RegionEastern RegionNorthern RegionSouth Western regionWestern Region
Table A1: Definitions of the variables used

35
Boys Girls Boys GirlsAge of the child (cf: aged 15 years and above)Age=<12 0.255 0.317 0.281 0.379
[2.40]* [2.65]** [2.88]** [3.18]**Age=12 0.086 0.199 0.092 0.314
[1.01] [1.81] [0.99] [2.62]*Age=13 0.237 0.236 0.228 0.303
[2.66]** [2.25]* [2.47]* [2.20]*Age=14 0.125 0.346 0.065 0.247
[1.55] [2.72]** [0.79] [1.87]Dummy: Child's mother attained post secondary education -0.278 0.199 -0.107 0.066
[2.09]* [1.89] [1.06] [0.63]Education of the father (cf: No education)Father's Education: Some primary 0.267 0.014 0.127 -0.013
[2.83]** [0.10] [1.44] [0.13]Father's Education: All primary 0.287 0 0.215 0.186
[3.61]** [0.00] [2.41]* [1.27]Father's Education: Secondary 0.333 -0.03 0.176 0.154
[3.81]** [0.19] [1.79] [1.00]Father's Education: post secondary 0.552 0.214 0.257 0.294
[4.68]** [1.24] [2.17]* [1.64]ln(Asset Index) 0.1 0.112 0.064 0.134
[0.82] [1.24] [0.55] [1.20]Pupil has own sitting place 0.228 0.4 0.133 0.022
[2.28]* [2.90]** [0.80] [0.08]Subject teacher is female -0.034 -0.063 -0.136 -0.29
[0.25] [0.46] [0.64] [1.26]Log of Performance on teacher test 0.058 0.034 -0.004 0.009
[1.14] [0.72] [0.05] [0.10]Number of lessons taught per week -0.013 -0.01 -0.005-0.006
[3.18]** [2.44]* [0.80] [1.06]Subject teacher reguraly corrects homework 0.082 0.091 0.262 0.225
[1.14] [1.17] [4.05]** [2.70]**Reading teacher satisfaction with school environment 0.027 0.077 0.054 0.06
[0.44] [1.37] [0.86] [0.85]Number of teachers with 2 years of teacher training 0.021 0.029 0.005 0.006
[2.32]* [2.96]** [0.53] [0.61]Number of inspections in the past 2 years 0.003 0.0030.003 -0.007
[0.35] [0.52] [0.31] [0.97]School has electricity 0.739 0.695 0.646 0.621
[2.80]** [2.88]** [3.02]** [2.27]*Pupil classroom ratio 0 0 -0.002 -0.001
[0.20] [0.41] [1.06] [0.51]District pupil text book ratio for grade 4 to 7 0.009 0.05 -0.039 0.171
[0.09] [0.47] [0.30] [1.34]Index of head teacher reports that pupils often having problems at school -0.027 -0.078 0.111 0.031
[0.30] [0.81] [0.79] [0.21]Index of head teacher reports that teachers often having problems at school 0.083 0.148 0.016 -0.038
[0.88] [1.56] [0.12] [0.32]School is private 0.71 0.444 -0.283 -0.123
[1.76] [1.40] [0.86] [0.46]Distance to nearest secondary school -0.002 -0.005 -0.003 -0.011
[1.04] [1.66] [1.05] [2.29]*Pupils borrow books at school -0.013 0.153 -0.019 0.051
[0.16] [1.69] [0.11] [0.31]Head teacher experience at present school 0.023 -0.022 0.018 -0.025
[1.67] [1.24] [0.95] [0.77]Number of lessons conducted per week (headteacher) 0.008 0.009 0.007 0.022
[1.50] [1.75] [1.02] [2.31]*Duration of headteacher special training (months) 0.003 0.003 -0.001 0.007
[1.49] [1.43] [0.41] [2.18]*urban -0.203 -0.095 -0.191 -0.006
[1.06] [0.53] [1.09] [0.03]Regions (cf: Northern Uganda)Central Region 0.005 0.153 -0.012 0.007
[0.02] [0.75] [0.04] [0.02]Eastern Region 0.158 0.409 0.134 0.216
[1.07] [2.53]* [0.63] [0.86]South Western Region -0.11 0.11 -0.103 0.19
[0.55] [0.59] [0.39] [0.68]Western Region -0.032 -0.119 -0.341 -0.492
[0.19] [0.70] [1.45] [1.84]Constant -0.959 -1.77 -0.404 -1.529
[1.88] [3.80]** [0.47] [1.59]
Observations 1,354 1,043 1,028 760R-squared 0.23 0.29 0.2 0.34
t statistics in brackets* significant at 5%; ** significant at 1%
Table A2: Determinants of learning achivement by gender (dependent variable: log of standardized test Reading Mathematics

36
Dependent variable (log of standardized reading score) [1] [2] [3] [4] [5]
Number of teachers with 2 years of teacher training 0.028 0.024[2.91]** [2.43]*
Number of inspections in the past 2 years 0.001 0.003[0.08] [0.52]
Pupil classroom ratio 0.001 0[0.59] [0.48]
District pupil text book ratio for grade 4 to 7 0.05 0.074[0.49] [0.73]
Other Policy variables included ALL NO NO NO NONon-policy explanatory variables included YES YES YES YES YES
Constant -0.738 5.388 5.51 5.62 5.524[1.69] ] [39.48 ] [40.15] [41.69 ] [40.32]
Observations 2397 2491 2491 2491 2491R-square 0.21 0.23 0.22 0.25 0.22
Dependent variable (log of standardized math score) [1] [2] [3] [4] [5]Number of teachers with 2 years of teacher training 0.01 0.009
[1.02] [0.99]Number of inspections in the past 2 years -0.008 -0.012
[0.91] [1.39]Pupil classroom ratio -0.001 -0.001
[0.65] [0.69]District pupil text book ratio for grade 4 to 7 0.104 0.099
[0.73] [0.70]Other Policy variables included ALL No NO NO NONon-policy explanatory variables included YES YES YES YES YES
Constant -0.825 -0.822 -0.677 -0.572 -1.029[0.91] [1.15] [1.03] [0.68] [1.23]
Observations 1788 1845 1845 1788 1845R-squared 0.2 0.18 0.19 0.19 0.18
Table A3: Importance of policy variables in explaining performance on reading tests
Table A4: Importance of policy variables in explaining math achivement

37
(1) (2) (3) (4) Pupil is female -0.088 -0.088 -0.148 -0.149
[1.81] [1.81] [2.60]* [2.63]**Age of the child (cf: aged 15 years and above)Age=<12 0.266 0.268 0.308 0.312
[3.18]** [3.27]** [3.77]** [3.71]**Age=12 0.12 0.123 0.176 0.181
[1.59] [1.68] [2.47]* [2.55]*Age=13 0.222 0.223 0.247 0.248
[2.85]** [2.87]** [2.92]** [2.90]**Age=14 0.204 0.207 0.125 0.128
[2.81]** [2.95]** [1.61] [1.59]Dummy: Child's mother attained post secondary education -0.059 -0.059 -0.017 -0.015
[0.61] [0.61] [0.22] [0.20]Education of the father (cf: No education)Father's Education: Some primary 0.166 0.166 0.102 0.101
[2.12]* [2.13]* [1.43] [1.42]Father's Education: All primary 0.16 0.161 0.21 0.211
[2.31]* [2.31]* [2.96]** [2.93]**Father's Education: Secondary 0.194 0.193 0.222 0.219
[2.37]* [2.37]* [2.70]** [2.71]**Father's Education: post secondary 0.433 0.433 0.324 0.322
[4.46]** [4.47]** [3.64]** [3.67]**ln(Asset Index) 0.103 0.104 0.142 0.145
[1.19] [1.19] [1.39] [1.45]Pupil has own sitting place 0.283 0.285 0.096 0.101
[2.83]** [2.88]** [0.46] [0.51]Subject teacher is female -0.054 -0.055 -0.175 -0.186
[0.41] [0.41] [0.87] [0.87]Interaction of female child with a female reading teacher 0.03 0.028 -0.062 -0.064
[0.30] [0.27] [0.44] [0.45]Log of Performance on teacher test 0.05 0.051 -0.002 0.001
[1.04] [1.07] [0.02] [0.01]Number of lessons taught per week -0.012 -0.013 -0.005 -0.005
[3.23]** [3.34]** [0.78] [0.77]Subject teacher reguraly corrects homework 0.097 0.096 0.283 0.28
[1.54] [1.52] [4.26]** [4.27]**Subject teacher satisfaction with school environment 0.0430.045 0.062 0.064
[0.80] [0.80] [1.02] [1.06]Number of teachers with 2 years of teacher training 0.024 0.025 0.006 0.006
[2.79]** [2.84]** [0.63] [0.65]Number of inspections in the past 2 years 0.002 0.002 -0.006 -0.005
[0.32] [0.35] [0.70] [0.62]School is private 0 0.001 -0.001 -0.001
[0.33] [0.46] [0.78] [0.86]Pupil classroom ratio 0.037 0.039 0.105 0.107
[0.36] [0.39] [0.74] [0.75]District pupil text book ratio for grade 4 to 7 -0.058 -0.058 0.075 0.079
[0.64] [0.65] [0.53] [0.54]Index of head teacher reports that pupils often having problems at school 0.115 0.116 -0.024 -0.025
[1.26] [1.28] [0.18] [0.19]Index of head teacher reports that teachers often having problems at school 0.555 0.554 -0.252 -0.243
[1.63] [1.62] [1.08] [1.06]School has electricity 0.711 0.714 0.602 0.602
[2.89]** [2.88]** [2.45]* [2.41]*Distance to nearest secondary school -0.003 -0.003 -0.005 -0.005
[1.48] [1.45] [1.62] [1.61]Pupils borrow books at school 0.035 0.034 0.046 0.047
[0.46] [0.45] [0.28] [0.29]Head teacher experience at present school 0.007 0.007 0 0
[0.47] [0.47] [0.01] [0.01]Number of lessons conducted per week (headteacher) 0.01 0.010.015 0.015
[1.86] [1.86] [1.72] [1.70]Duration of headteacher special training (months) 0.004 0.004 0.004 0.004
[1.79] [1.82] [1.17] [1.20]urban -0.13 -0.132 -0.064 -0.062
[0.74] [0.75] [0.32] [0.31]Regions (cf: Northern Uganda)Central Region 0.051 0.049 -0.01 -0.01
[0.26] [0.25] [0.03] [0.03]Eastern Region 0.239 0.234 0.132 0.126
[1.66] [1.58] [0.56] [0.50]South Western Region -0.027 -0.021 0.07 0.083
[0.15] [0.12] [0.28] [0.35]Western Region -0.083 -0.092 -0.46 -0.467
[0.50] [0.54] [1.76] [1.70]Ratio of grade 6 pupils to school population 0.501 0.729
[0.25] [0.29]Constant -1.219 -1.267 -1.145 -1.235
[2.61]** [2.70]** [1.17] [1.41]
Observations 2,397 2,397 1,788 1,788R-squared 0.24 0.24 0.22 0.22
Reading MathematicsTable A5: How does sample selection affect test scores (OLS)

38
Dependent Variable: Number of Ever repeated Number ofEver repeated Days absent a grade Days absent a grade
Pupil is female -0.371 0.022 -0.163 0.029[2.75]** [0.73] [1.88] [1.29]
Age of the child (cf: aged 15 years and above)Age=<12 -0.313 -0.126 -0.324 -0.114
[1.89] [2.78]** [2.41]* [3.28]**Age=12 -0.07 -0.131 -0.278 -0.068
[0.37] [2.49]* [2.08]* [1.96]*Age=13 -0.153 -0.018 -0.246 0.021
[0.93] [0.38] [1.92] [0.64]Age=14 -0.095 -0.062 -0.008 -0.041
[0.69] [1.38] [0.06] [1.16]Dummy: Child's mother attained post secondary education -0.076 0.005 -0.137 -0.018
[0.44] [0.11] [1.00] [0.50]Education of the father (cf: No education)Father's Education: Some primary -0.302 -0.09 -0.267 -0.083
[1.73] [1.73] [1.80] [2.16]*Father's Education: All primary -0.273 -0.045 -0.351 -0.016
[1.41] [0.81] [2.25]* [0.38]Father's Education: Secondary -0.406 -0.074 -0.425 -0.059
[2.09]* [1.43] [2.81]** [1.52]Father's Education: post secondary -0.469 -0.141 -0.434 -0.094
[2.29]* [2.31]* [2.58]* [2.16]*ln(Asset Index) 0.076 0.019 0.03 0.038
[0.47] [0.53] [0.26] [1.25]Pupil has own sitting place -0.045 -0.007 0.071 -0.041
[0.23] [0.16] [0.47] [1.05]Reading teacher is female -0.214 0.039 0.258 -0.095
[1.05] [0.77] [0.75] [1.06]Interaction of female child with a female reading teacher 0.272 -0.014 0.149 0.003
[1.17] [0.22] [0.77] [0.05]Log of Performance on teacher test -0.151 -0.013 -0.078 -0.002
[1.77] [0.78] [1.14] [0.14]Number of lessons taught per week 0.006 0.001 0.007 -0.009
[1.06] [0.37] [0.64] [3.09]**Reading teacher reguraly corrects homework -0.069 -0.013 -0.035 -0.011
[0.64] [0.50] [0.39] [0.45]Reading teacher satisfaction with school environment 0.099 -0.036 0.063 -0.058
[1.14] [2.45]* [0.46] [1.65]Number of teachers with 2 years of teacher training -0.009 0.001
[0.64] [0.48]Number of inspections in the past 2 years 0.003 0.004
[0.24] [1.86]School has electricity 0.001 0
[0.72] [0.21]Pupil classroom ratio 0.286 -0.018
[1.71] [0.43]District pupil text book ratio for grade 4 to 7 -0.245 0.003
[1.94] [0.08]Index of head teacher reports that pupils often having problems at school 0.186 -0.015
[1.54] [0.46]Index of head teacher reports that teachers often having problems at school -0.026 0.14
[0.07] [2.44]*School is private -0.191 -0.017
[0.97] [0.39]Distance to nearest secondary school -0.009 -0.002
[1.55] [1.91]Pupils borrow books at school -0.034 0.026
[0.23] [0.80]Head teacher experience at present school 0.027 -0.005
[1.57] [1.04]Number of lessons conducted per week (headteacher) -0.009 -0.002
[0.99] [1.13]Duration of headteacher special training (months) -0.001 0
[0.20] [0.14]urban -0.304 -0.017
[1.65] [0.43]Regions (cf: Northern Uganda)Central Region 0.4 -0.09
[1.82] [1.70]Eastern Region 0.275 -0.04
[1.45] [0.78]South Western Region 0.381 0.057
[1.32] [0.82]Western Region 0.293 -0.04
[1.20] [0.66]Constant 1.633 0.669 2.198 0.905
[2.50]* [3.70]** [5.87]** [9.30]**
Observations 2,397 2,397 2,491 2,491R-squared 0.05 0.05 0.01 0.02Number of groups 154 154
Table A6: Can school absence and grade repetition explain selection bias? OLS Fixed Effects

39
Urban Rural Urban RuralPupil is female -0.053 -0.08 -0.138 -0.239
[0.57] [1.54] [1.95] [5.22]**Age of the child (cf: aged 15 years and above)Age=<12 0.721 0.155 0.172 0.323
[5.89]** [1.86] [1.55] [4.54]**Age=12 0.562 0.034 0.119 0.209
[4.37]** [0.47] [1.03] [2.92]**Age=13 0.547 0.137 0.131 0.156
[3.53]** [1.93] [1.13] [2.30]*Age=14 0.255 0.17 0.029 0.093
[1.36] [2.70]** [0.23] [1.32]Dummy: Child's mother attained post secondary education 0.043 -0.123 -0.113 -0.056
[0.38] [1.01] [1.15] [0.67]Education of the father (cf: No education)Father's Education: Some primary 0.414 0.181 0.046 0.182
[2.19]* [2.16]* [0.31] [2.22]*Father's Education: All primary 0.578 0.134 0.162 0.209
[2.37]* [1.84] [1.04] [2.39]*Father's Education: Secondary 0.629 0.147 0.18 0.156
[2.98]** [1.70] [1.19] [1.86]Father's Education: post secondary 0.756 0.404 0.196 0.341
[3.30]** [3.77]** [1.23] [3.62]**ln(Asset Index) 0.171 0.033 0.084 -0.012
[1.44] [0.35] [1.02] [0.19]Pupil has own sitting place 0.311 0.289 0.153 0.286
[1.74] [2.90]** [0.98] [4.23]**Subject teacher is female 0.443 -0.007 0.141 -0.356
[1.85] [0.05] [0.94] [2.44]*Interaction of female child with a female reading teacher -0.02 -0.045 0.078 0.359
[0.08] [0.50] [0.46] [1.84]Log of Performance on teacher test -0.205 0.073 0.205 -0.07
[2.15]* [1.74] [5.10]** [2.44]*Number of lessons taught per week -0.019 -0.014 -0.004 -0.013
[2.58]* [3.84]** [0.74] [6.38]**Subject teacher reguraly corrects homework 0.081 0.096 0.022 0.155
[1.06] [1.51] [0.32] [3.26]**Subject teacher satisfaction with school environment -0.438 0.05 -0.462 0.077
[1.74] [0.97] [6.56]** [2.88]**Number of teachers with 2 years of teacher training 0.039 0.023 0.061 0.013
[2.81]** [2.20]* [9.63]** [2.93]**Number of inspections in the past 2 years -0.021 0.013 -0.012 0.004
[2.07]* [1.69] [1.80] [0.98]School has electricity 0.192 1.448 0.059 1.158
[0.98] [4.39]** [0.59] [11.88]**Pupil classroom ratio 0.002 0 0.005 -0.002
[0.98] [0.02] [6.09]** [4.11]**District pupil text book ratio for grade 4 to 7 -0.084 -0.018 -0.179 -0.043
[0.59] [0.18] [2.31]* [0.86]Index of head teacher reports that pupils often having problems at school -0.551 0.009 -1.125 0.159
[3.38]** [0.10] [10.12]** [4.06]**Index of head teacher reports that teachers often having problems at school 0.51 0.039 0.312 -0.055
[2.97]** [0.44] [2.85]** [1.44]School is private 1.27 -0.19 -0.083 -0.413
[4.61]** [0.99] [0.58] [2.55]*Distance to nearest secondary school 0.046 -0.002 -0.027 -0.004
[1.74] [1.03] [2.05]* [2.55]*Pupils borrow books at school 0.452 -0.025 0.351 -0.255
[3.92]** [0.28] [4.02]** [4.91]**Head teacher experience at present school -0.036 0.013 0.052 -0.001
[1.17] [0.80] [2.45]* [0.12]Number of lessons conducted per week (headteacher) 0.007 0.008 0.039 0.001
[0.60] [1.62] [4.49]** [0.50]Duration of headteacher special training (months) 0.006 0.001 0.005 -0.003
[1.40] [0.57] [2.86]** [3.20]**Regions (cf: Northern Uganda)Central Region -1.013 0.216 0.199 -0.152
[2.83]** [0.98] [1.01] [1.90]Eastern Region -0.576 0.266 0.13 0.408
[2.21]* [1.78] [0.80] [6.07]**South Western Region -0.512 -0.037 -0.681 0.022
[1.16] [0.21] [2.51]* [0.21]Western Region -1.093 -0.104 0.93 -0.206
[2.73]** [0.60] [3.04]** [2.57]*Constant -1.927 -0.832 -2.609 0.399
[3.24]** [1.71] [7.44]** [1.64]Observations 660 1737 508 1280R-squared 0.45 0.24 0.49 0.33
t statistics in brackets* significant at 5%; ** significant at 1%
Reading MathematicsTable A7: Determinants of learning achivement by location (dependent variable: log of standardized test scores)