determinants of living arrangements of elderly in orissa: an … 228 - akshaya kumar...
TRANSCRIPT

Determinants of LivingArrangements of Elderly inOrissa: An Analysis
Akshaya Kumar Panigrahi

ISBN 81-7791-184-8
© 2009, Copyright ReservedThe Institute for Social and Economic Change,Bangalore
Institute for Social and Economic Change (ISEC) is engaged in interdisciplinary researchin analytical and applied areas of the social sciences, encompassing diverse aspects ofdevelopment. ISEC works with central, state and local governments as well as internationalagencies by undertaking systematic studies of resource potential, identifying factorsinfluencing growth and examining measures for reducing poverty. The thrust areas ofresearch include state and local economic policies, issues relating to sociological anddemographic transition, environmental issues and fiscal, administrative and politicaldecentralization and governance. It pursues fruitful contacts with other institutions andscholars devoted to social science research through collaborative research programmes,seminars, etc.
The Working Paper Series provides an opportunity for ISEC faculty, visiting fellows andPhD scholars to discuss their ideas and research work before publication and to getfeedback from their peer group. Papers selected for publication in the series presentempirical analyses and generally deal with wider issues of public policy at a sectoral,regional or national level. These working papers undergo review but typically do notpresent final research results, and constitute works in progress.

1
DETERMINANTS OF LIVING ARRANGEMENTS OF ELDERLY IN ORISSA: AN ANALYSIS
Akshaya Kumar Panigrahi∗
Abstract
India is home to a rapidly growing population of elderly persons. It is among the fastest growing ones in the world. Yet, there are very few studies documenting their welfare or focussing on the factors that determine their living arrangements. Some studies show that the traditional India joint family system is on the decline and more families are becoming nuclear. Given this background, it is importan t to explore the current nature of the living arrangements and its determinants. Studies focusing on the socio-economic and demographic correlates of living arrangements are rather scanty. Hence, this paper analyses the socio -economic and demographic correlates of the living arrangement choices of older persons in the state of Orissa. The data for the present work was taken from the 60th round of the National Sample Survey of the elderly in Orissa. The total sample size for Orissa was 1,238 old persons, with 660 males and 578 females. Both bivariate and multivariate techniques with Pearson’s chi-square test statistics were used for the analysis. A majority of the elderly (51.5 per cent), were in co-residence or lived with their spouses and children; roughly, one-third lived without the spouse but with children and a small proportion (2.5 per cent) lived with other relatives and non-relatives. The major demographic factors considered her e that determine the living arrangements of the elderly are, age, sex, marital status, and surviving children. The socio -economic factors include place of residence, education, caste, income and economic dependency. The variables, like age, sex, marital status, number of surviving children, education, income and economic dependency, play an important role in determining the living arrangements of the elderly in Orissa. In view of the changing socio-economic and demographic scenario, increasing education and income and a simultaneous decline in fertility, there is a likelihood of a higher proportion of elderly Indians living alone in the future. Therefore, the policies and programmes for the elderly have to be appropriately designed to address the needs of those who live alone.
Keywords: elderly, ageing, demographic, socio economic, living arrangements, Orissa, India.
Introduction
Demographic trends since the second half of the last century in many developing countries have shown
an unprecedented increase in the 60-plus population in absolute as well as relative terms. The rapid
social and economic change in these countries has potentially profound implications for the future of the
elderly. At the global level the number of elderly persons is projected to increase from 606 million in
2000 to 1.9 billion in 2050. The increase is expected to be dramatic in the less developed region s where
the number of older people will increase from 375 million in 2000 to 1.6 billion in 2050 (United Nations,
2002).
The magnitude of increase in the population of elderly persons depends upon the pace of
demographic transition. World fertility rate has fallen from five children per woman in 1950 to less than
three in 2000. There was a continuous decline thereafter to two children per woman (United Nations,
2003). Similarly, life expectancy has also recorded significant improvement over the second half of the
last century. This led to a considerable shift in the age structure of the population - shrinking at the
younger ages and bulging at the older ones.
India has one of the fastest growing populations of elderly persons in the world (Rajan, Mishra
and Sarma, 2000; Alam and Mukherjee, 2005; Gulati and Rajan, 1990; Sengupta and Agree, 2003;
∗ PhD Scholar, Institute for Social and Economic Change, Bangalore – 560 072 .

2
NSSO, 1998). India’s population increased from 361 million in 1951 to 1027 million in 2001 and the
number of older people increased from 19 million (5 per cent of the total population) to 77 million (7.6
per cent of the total population) during the same time period (see table -1). It is projected that the
elderly population in India will increase to 169 million by 2025 and to 324 million by 2050 (United
Nations, 2002).
Such a rapid rise in the elderly population poses several challenges. Lack of guaranteed and
sufficient income to support themselves, absence of social security, loss of social status and recognition,
non-availability of opportunities for creative use of time and persistent ill health are some of the
daunting problems faced by the elderly in the country. Providing a decent and comfortable living
arrangement for them continues to be a major challenge.
Table 1 : India’s Demographic Scenario of Ageing from 1950-2050
Growth Rate (percentage) Years Population (60+) (In million)
Percentages of total population Total Population 60+ Population
1950 19 5.6 2.0 2.0 1975 38 6.2 2.1 2.9 2000 77 7.6 1.5 2.7 2025* 169 12.5 0.8 3.2 2050 324 20.6 0.4 2.2
Source: United Nations, 2002. World Population Ageing 1950-2050.
*medium variant
Living arrangements for the elderly was not an issue a few decades ago in most developing
countries, including India, because the elderly are expected to be cared for by the family. However,
issues concerning household structure and support for older persons in developing countries are
becoming increasingly important. Along with an ageing population these countries are also experiencing
socio-economic and demographic changes. Since last few decades there has been a rise in economic
growth, literacy levels, urbanisation and modernisation, women bearing fewer children and people living
longer and healthier lives. All this brought about significant changes in India. The effects of these trends
on families, households, kin networks and subsequent support for older persons are complex and not
well documented. It is generally accepted that the size and complexity of the households decrease
along with industrialisation and urbanisation. In traditional rural societies families are often more
extended than in modern urbanised societies where the independent nuclear family is predominant. In
the process, extended kinship ties weaken and the nuclear family becomes an independent unit. This
weakening of ties with family members reduces social interaction and financial and physical support for
the older generation. Separate living arrangement s are required for them as countries develop.
Therefore in this context, the living arrangement issues of the elderly need attention because the ir
welfare depends on it. Given this backdrop of rapid demographic and family changes, it is important to
explore the current nature of living arrangement s.

3
Living Arrangements of the Elderly : A Review
Although there are many studies on the type of living arrangements for the elderly, the reasons for
seeking a particular type of living arrangement by the elderly remain relatively unknown (Palloni, 2001;
Kinsella and Phillips, 2005). These studies have identified a number of factors such as age, sex,
occupation, education, place of residence, number of children etc., as the important variables that
shape the living arrangement (United Nations, 2005; Yadava, Yadava and Sarma , 1996; Jaiprakash,
1999). Velkoff (2001) found that living arrangements are influenced mainly by financial well being,
marital status, family size and structure as well as cultural traditions. However, the relative importance
of each of these factors has hardly been examined carefully.
Living arrangements are generally studied as a dichotomous outcome - whether living alone or
with others. The studies mentioned attempted to identify the factors responsible for the elderly living
alone or in co-residence. Data from western countries show s that more than 60 per cent of the elderly
aged 65 and above live either alone or with the spouse (Palloni, 2001). Data from developing countries
shows a much smaller number of elderly living alone. However, a general agree ment among
researchers is that there is an increasing trend of the elderly persons living alone or with the spouse
even in India. The NSSO report of the 52nd round shows that 15 per cent of the elderly in rural areas
and 12.5 per cent in urban areas live alone or with the spouse.
A strong association is usually observed between socio-economic factors and the decision to
co-reside among the elderly persons (Chakraborty, 2004; Yadava, Yadava and Sarma, 1996; Jaiprakash,
1999; Sahayam, 1988; Zimmer, Chayovan, Lin and Natividad, 2003). For instance, co-residence is
inversely related to the socio-economic background of the family. The decision of the elderly to live
alone is often determined by the economic resources available with them. It is generally argued that
elders with fewer resources tend to co-reside with their children compared to those with better
resources. If the elderly are provided with some form of social security like old age pension, health
insurance etc., the probability of them living alone would systematically go up. But empirical evidence
does not support this argument fully (Pal, 2004: Bhattacharya, 2005). The contradictory argument is
that if the elderly have some economic independence, the children, particularly the unemployed, will be
more inclined to reside with them and take advantage of the available resources. Even the NSSO data
reveals a higher incidence of the elderly living alone or with the spouse in rural areas. Various small-
scale surveys on the elderly also bring out the dismal conditions in which they live alone in the Indian
context (NSSO, 1998; Rajan, Mishra and Sarma, 1999b).
The education level of the elderly is yet another important variable determining their living
arrangement. It was found that with an increase in the level of education, the pattern of co-residence
systematically diminishes (Andrade and DeVos, 2002; Bongaarts and Zimmer 2001; Pal, 2004; Zimmer,
Hermalin and Lin, 2001).
Yet another important variable of interest is the number of surviving children and its impact on
the co-residence pattern. From a broad range of studies, it is known that co-residence of older parents
and at least one adult child is a central feature of the filial support system in most of the developing
countries (Bongaarts and Zimmer, 2001). Studies generally supported the view that the number of living
children is positively related to the probability of elders living with them (Martin, 1989). With a drastic
4
decline in fertility in many states of India , co-residence with children becomes increasingly difficult. In
addition, the educated adult children tend to migrate to urban areas in search of employment leaving
behind elderly parents (Rajan, Mishra and Sarma 1999b; Bongaarts and Zimmer, 2001). In the Indian
context, it is not merely the number of children available but their gender and marital status that also
determines the co-residence pattern. In India, unlike in western societies, sons are more likely to co-
reside with their parents (Bongaarts and Zimmer, 2001; Chaudhury, 2004; Gulati and Rajan, 1990;
Silva, 1994; Zachariah, 2001).
Studies in India also found significant gender differentials in the living arrangements of the
elderly, but they are attributed to the higher incidence of widowhood due to the longer life expectancy
of women (Chakraborti, 2004; Knodel, 1999; Knodel and Ofstedal, 2003; NSSO, 1998; Rajan, Mishra
and Sarma, 2000).
The joint family system that persisted in the country in the past, has given way to nuclear
families. As a result, the earlier concept of children providing support to the elderly has also undergone
drastic changes. This may also be due to other factors like modernisation, urbanisation and the erosion
of traditional cultural values that existed in the country (Bhattacharya, 2005; Mason, 1992; Rajan,
Mishra and Sarma, 2000; Sahayam, 1988; Shah, 1999; Sumangala, 2003).
Although it is important to find out the significance of each of these factors in determining co-
residence of the elderly, there are certain inherent limitations for such an analysis. The relationship of
each of these variables with living arrangements depends mainly upon the cultural context in which
such studies are undertaken. For instance, while availability of resources with the elderly may enhance
the chances of them living alone in the West, the reverse may not be true in the Indian context because
the children might be more willing to co-reside with such parents (Pal, 2004). Therefore, studies on the
determinants of living arrangement should also be carried out within a specific cultural context.
Why living arrangements of elderly?
India is still characterised by its traditional ways of living where several generations live jointly within
the same household. With improved health infrastructure and increased life expectancy, the elderly are
expected to live longer. The joint family system is on the decline and more and more families are
becoming nuclear. Apart from this, the elderly in India are facing several other challenges, such as lack
of guaranteed and sufficient income to support themselves, absence of social security, loss of social
status and recognition, non-availability of opportunities for creative use of their time and persistent ill
health. St udies have shown that a higher proportion of the elderly are living miserable lives without any
hope. Ensuring a decent and comfortable living arrangement for them continues to be a major
challenge. Given this background, it is important to explore the current nature of living arrangements
and its determinants. Studies focusing on the socio-economic and demographic correlates of living
arrangements are rather scanty. Hence, this paper analyses the socio-economic and demographic
correlates of the living arrangement s of older persons in Orissa.
5
Objectives of the paper
The paper, against this backdrop, attempts to examine the following objectives :
1. To examine the determinants of living arrangements of the elderly in Orissa.
2. To examine the socio-economic, demographic and gender differentials in living arrangements
among the elderly in Orissa.
3. To study the regional variations in the living arrangements of the elderly in Orissa.
Study area
The study was undertaken in the state of Orissa which is in the eastern part of India and is one of the
poorest states in the country. At the same time, Orissa has a larger population of elderly persons
compared to the other states. It has the fifth largest population of elderly people in India. Old age
dependency ratio is also high in Orissa (NSS, 2006). Studies have shown that disabilities among the
elderly are also higher in Orissa (Srivastava and Mishra, 2005). A higher level of poverty combined with
larger share of the old age population is a serious challenge in terms of providing a comfortable living
arrangement for the elderly in Orissa.
Data and Methodology
The data for the present paper was taken from the 60th round (Schedule no. 25.0) of the National
Sample Survey of the elderly for Orissa; this survey was conducted by the National Sample Survey
Organ isation (NSSO) of India, which primarily focused on the health care, education and on the
problems of the elderly (persons aged 60 years or above). This survey provides information on the older
members of the households, the number of surviving sons, daughters and dependents, economic
status, usual activities, living arrangements, whether physically immobile, disabilities, self-reported
health status, chronic health conditions, ownership and management of assets, management of social
and religious matters, daily chores and on the availability of food, clothing and medicine. The total
sample size for Orissa was 1,238 old persons, with 660 men and 578 women.
Bivariate and multivariate statistical tools were used to establish the determinants of living
arrangements for the elderly in Orissa. In the first part of the data analysis the paper used the bivariate
cross tabulation with chi-square test statistics to find out the relevant significant differences in living
arrangements for the elderly given their background characteristics. To establish the strong association
an attempt was made to use the logistic regression analysis by controlling some of the important
variables such as age, sex, number of surviving sons, economic independency etc.
Analysis and Discussion
The determinants that influence the likelihood of the elderly living alone form the focus of this paper.
The elderly are considered to be ‘living alone’ if they live alone or with the spouse and no other kin. ‘Co-
residence ’ or ‘not living alone’ is when the elderly person lives with any one kin, including children. The
NSSO’s data provided information on whether or not the older individual lived alone, with spouse only,
with spouse and children, with children only or with other relatives and non-relatives. The socio-

6
economic and demographic factors were studied to find out the significant co-variates in the living
arrangement choices.
Table 2 shows the different living arrangement s of the elderly in Orissa. It is clear from this
table that 15.6 per cent of the elderly live alone in Orissa and the rest (84.4 per cent) are in co-
residence. It is interesting to note that the proportion of elderly persons who live alone in Orissa was
slightly higher than the Indian average of 14.5 per cent (Chaudhuri and Roy, 2007). However, studies
have shown that the proportion of elderly who live alone in most of the European countries is much
higher (Grundy, 2000). Studies in other South East Asian countries too have shown that a much higher
proportion of elderly live alone (Martin, 1989).
Table 2 : Distribution of Living Arrangements of Elderly by Demographic Variables in Orissa
Living Arrangements of Elderly (%) Total
Demographic Variables Living
Alone
Living with Spouse and
other Members
Living without
Spouse but with
Children
Living with
others Total Observations
(N) Percentage
Age* 60-69 17.3 54.0 26.7 2.0 100 860 69.5 70-79 11.9 43.9 40.5 3.6 100 300 24.2 80 and above 7.3 46.8 40.7 5.2 100 78 6.3 Sex* Male 18.6 68.3 12.2 1.0 100 660 53.3 Female 11.9 32.0 51.6 4.5 100 578 46.7 Marital Status* Never married 12.9 NA 65.1 22.0 100 7 0.6 Currently married 18.9 76.9 3.7 0.5 100 820 66.2 Widowed 8.7 2.7 82.0 6.5 100 407 32.9 Divorced/separated 24.8 NA 75.2 0.0 100 4 0.3 Surviving Children* 0 50.5 16.6 8.5 24.3 100 49 4.0 1 12.4 35.3 46.8 5.5 100 129 10.4 2 25.2 42.6 29.2 3.1 100 173 14.0 3+ 11.9 57.6 29.7 0.8 100 887 71.6 Surviving Sons* 0 42.9 27.4 16.2 13.5 100 149 12.0 1 12.4 48.4 36.8 2.4 100 366 29.6 2 12.2 61.0 26.4 0.5 100 368 29.7 3+ 11.1 54.0 34.4 0.5 100 355 28.7 Surviving Daughters* 0 18.8 33.3 41.8 6.1 100 230 18.6 1 15.1 54.0 27.8 3.1 100 348 28.1 2 13.6 56.4 29.0 0.9 100 339 27.4 3+ 15.1 56.6 27.1 1.1 100 321 25.9 Observations (N) 193 638 376 31 1238 100 Percentage 15.6 51.5 30.4 2.5 100 100 *p < 0.001 *Pearson’s chi- square test statistics
Source: Author’s calculation
A majority of the elderly (51.5 per cent), who were in co-residence, live with their spouses and
children; roughly, one-third lived without spouse but with children and a small proportion (2.5 per cent)
7
lived with other relatives and non-relatives. These findings were almost in line with the expected
behaviour of elderly Indians - most elders lived with their children because of strong traditional value
systems. However, the proportion of the elderly living alone is likely to increase in the near future
because of the various socio-economic and demographic changes taking place in Indian society.
Therefore, it is interesting to analyse the important factors that determine the living arrangements of
the elderly in Orissa.
Demographic Determinants of Living Arrangements of the Elderly in Orissa
The major demographic factors considered here that determine the living arrangements of the elderly in
Orissa are age, sex, marital status, and their surviving children.
Age and Living Arrangements
Studies have shown that age of the elderly was one of the important determinants of living
arrangements. For the present analysis, the age of the elderly has been categorised as younger old,
older old and oldest old, in the age groups of 60-69, 70-79 and 80 and above, respectively. The
corresponding percentage of younger old, older old and oldest old in the sample was 69.5, 24.1 and 6.3
per cent respectively.
Table-2 presents the association between the age of the elderly and their living arrangements
in Orissa. It is quite evident from this table that as they got older, the proportion of elderly living alone
decreased. The proportion of elderly living alone was highest in the age group 60 -69 years (17.3 per
cent). This proportion reduced to 11.9 per cent when the elderly moved to the age group 70-79 years
and it reduced further to 7.3 per cent when the elderly reached 80 years and above, indicating lesser
chances of the elderly living alone when they grow older. This may be the due to their declining
capacity for self-care as they grow older. Studies conducted elsewhere also reported similar findings
(Shah et al. 2002; Liang, Gu and Krause, 1992; Ramashala, 2001; Zimmer and Kim, 2002). Further,
irrespective of the age, living with spouse and children was the most common living arrangement
observed in Orissa. It was also interesting to observe that a positive relationship existed between the
age of the elderly and living without spouse, but with children. As their age increased, the proportion of
the elderly living without spouse but with children also increased. This could be because of the fact that
as they got older there was a higher chance of widowhood. They lived with the ir children, but without
the spouse. Similarly, the proportion of elderly living with others also increased with age. As in many
other countries, age turned out to be an important determinant of living arrangements in Orissa also.
Higher the age of the elderly lesser was their chance of living alone. Pearson’s chi-square test statistic
also confirmed that the age and living arrangement relationship was statistically significant.
This relationship may however be quite complex because there was a negative relationship
between age and living alone; this may not be solely due to age alone, but due to reasons of an
economic nature as well. As the elderly grow older they may depend economically on others and
therefore they co-reside with others when compared to the younger old who are economically active.
Hence, the relationship between age and living arrangement s may be due to economic reasons rather

8
than age, per se. Therefore, further analysis was required to deduce the exact relationship between age
and living arrangements considering other economic variables.
Gender and Living Arrangements
The gender of the elderly was another important demographic indicator that determined their living
arrangements. Table -2 presents the relationship between the gender of the elderly and their living
arrangements. The table shows that in Orissa the proportion of elderly men who lived alone (18.6 per
cent) was higher than that of elderly women who lived alone (11.9 per cent). This is in contrast with the
pattern observed elsewhere in the world where more elderly women lived alone than elderly men.
Nevertheless, it may be quite possible in the Indian context, because traditionally, women were not
expected to live alone and therefore this proportion was lower.
Among those who were in co-residence, majority of the males (68.3 per cent) lived with
spouse and children; majority of the females (51.6 per cent) lived without spouse but with children.
Studies conducted elsewhere have also shown that more males, rather than females, lived with their
spouses (Bia n, et al. 1998; Chan, 1997; Bongaarts and Zimmer, 2001; Knodel and Ofstedal, 2003;
Panda, 1997; Shah, et al. 2002; Zimmer, 2005). As mentioned earlier, this may be due to higher
incidence of widowhood among elderly females than among elderly males (Chan, 1997; Sobieszczyk,
Knodel and Chayovan, 2003; Lee and Palloni, 1992; NSS, 1998; 2006, United Nations, 2005; Shah et al.
2002). Here again, it may be difficult to establi sh the relationship between gender and living
arrangements unless the marital status was controlled. The next attempt therefore is to look at the
differentials in living arrangement s according to marital status.
Marital Status and Living Arrangements
Unlike other countries, the association between marital status and living arrangements may not be very
prominent here, mainly because, marriage is almost universal in India. However, an attempt was made
to look into the relationship between marital status and living arrangements. The marital status of the
elderly was divided into four categories: never married, currently married, widowed, and
divorced/separated. In this sample, majority of the elderly were either currently married (66.2 per cent)
or widowed (32.9 per cent) while a small proportion was divorced/separated (0.3 per cent ). The
proportion of never married (0.6 per cent) was negligible in this sample.
Table 2 also presents the association between marital status and living arrangements of elderly
persons in Orissa. Since the number of persons who were never married and divorced/separated was
very small, comparisons were made only for those who were currently married versus widowed. It can
be seen from the table that a relatively higher proportion of currently married elderly live d alone (18.9
per cent) compared to the elderly who were widowed (8.7 per cent). However, majority of the widowed
(82.0 per cent ) lived with their children. It could be true in the Indian traditional context that the
widowed elderly are generally looked after by their children. The χ2 test also confirmed the existence of
a significant difference in living arrangements of elderly according to their marital status.

9
Surviving Children and Living Arrangement
Another important demographic factor that determines the living arrangement s of the elderly is the
presence of surviving children. It is generally believed that, in traditional societies including India,
children are considered as security during old age. In this sample, the percentage of elderly, with no
children, one child, two children, and three or more childr en was 4.0, 10.4, 14.0, and 71.6 per cent
respectively.
Table 2 presents the association between number of surviving children and living
arrangements of elderly in Orissa. Majority of the elderly with no surviving children either lived alone
(50.5 per cent ) or with others (24.3 per cent). It was possible that some of them had no children. As
expected, the number of children was negatively associated with living alone. For example, only 12.4
per cent of the elderly lived alone when they had one surviv ing child whereas 50.5 per cent of the
elderly lived alone when they did not have any children. Studies conducted elsewhere also generally
supported the view that the number of children positively related to the probability of living with them
(Bian, et al. 1998; Burch and Mathews, 1987; Martin, 1989; Rajan and Kumar, 2003; Zimmer and
Kwong, 2003). More the number of surviving children better are the chances of the elderly t o co-reside
with them. It is possible that when there are more children, at least one of them will take care of the
elderly. Migration in search of livelihood may be another reason. The break-down of the joint family
system is also a factor. The χ2 test also confirmed a significant difference in living arrangements for the
elderly based on the number of surviving children.
Surviving Sons and Living Arrangements
Apart from the number of surviving children, the gender composition also determined the living
arrangements of the elderly. In India, the son is considered as the most important care provider for
parents in their old age. In the study sample, it was found that 12.0 per cent of the elderly did not have
a surviving son, 29.6 per cent had only one, 29.7 per cent had two, and 28.7 per cent had three and
more.
Table 2 presents the distribution of the elderly with the number of surviving sons. It is evident
from the bi-variate analysis that the number of surviving sons is negatively associated with elderly living
alone in Orissa. For example, 42.9 per cent of the elderly with no surviving son lived alone compared
with 12.4 per cent of the elderly with one surviving son. The proportion of elderly living alone further
declined with an increase in the number of surviving sons. Similarly, the proportion of elderly living with
other members also declined with an increase in the number of surviving sons. The result of Pearson’s
chi-square test was also significant with respect to number of surviving sons.
Surviving Daughters and Living Arrangements
The number of surviving daughters is also equally important in determining the living arrangements of
the elderly. In this sample, 18.6 per cent of elderly did not have any surviving daughters, 28.1 per cent
had one, 27.4 per cent had two, and 25.9 per cent had 3 or more. It is interesting to note that only
18.8 per cent of the elderly without any daughters lived alone whereas 42.9 per cent of the elderly with
no sons lived alone, indicating the importance of living sons in determining the living arrangements of

10
the elderly. Further, the proportion of elderly living alone did not vary much with respect to number of
surviving daughters, indicating the importance of sons in determining the ir living arrangements.
From the above discussion, it is clear that the demographic variables like age, gender and
number of surviving sons affect the living arrangement choices of the elderly. In Orissa, younger olds,
males, and elderly with no surviving sons lived alone compared with their counterparts elsewhere.
Table 3: Distribution of Demographic Indicators and Living Arrangements of Elderly across Geographical Regions within Orissa
Coastal Southern Northern Total
Living alone (%) N Living
alone (%) N Living alone (%) N Living
alone (%) N
Age 60-69 16.1 419 20.9 144 17.5 297 17.3* 860 70-79 10.6 173 20.1 26 12.1 101 11.9 300 80 and above 0.3 42 38.4 7 9.6 29 7.3 78 Sex Male 16.5 337 24.0 89 19.7 234 18.6* 660 Female 10.4 297 19.2 88 11.1 193 11.9 578 Marital Status* Currently married 16.1 431 26.7 117 20.5 272 18.9 820 Widowed 8.1 198 11.9 58 8.0 151 8.7 407 No. of surviving children* 0 49.1 15 62.3 19 38.2 15 50.5 49 1 27.2 49 7.1 34 3.3 46 12.4 129 2 20.9 85 29.2 30 30.0 58 25.2 173 3+ 9.8 485 15.9 94 14.1 308 11.9 887 No. of surviving son* 0 50.5 56 48.5 34 34.9 59 42.9 149 1 11.3 174 14.2 62 13.2 130 12.4 366 2 10.0 201 11.5 45 15.8 122 12.2 368 3+ 10.7 203 23.3 36 7.6 116 11.1 355 Surviving daughters 0 16.8 86 25.3 59 16.2 85 18.8* 230 1 17.9 185 24.9 48 6.6 115 15.1 348 2 11.3 188 18.1 44 15.9 107 13.6 339 3+ 9.8 175 11.9 26 23.6 120 15.1 321 Total 13.7 634 21.5 177 15.8 477 15.6 1238 N= no. of observations p* < 0.001
Source: Author’s calculation
Regional variations in living arrangement
Geographically, Orissa is divided into three regions - northern, southern and coastal. An attempt was
also been made to see whether the living arrangement pattern was different in these three
regions.Table -3 presents the living arrangement pattern of the elderly according to these geographical
distinction. The table clearly shows that the proportion of elderly living alone was much higher in the
southern region (21.5 per cent) than the northern (15.8 per cent) and coastal regions (13.7 per cent).
Here again, in all the three regions a higher proportion of younger olds lived alone compared to those
elderly who are 80 and above, but at each age, the southern region had a higher proportion of elderly
living alone compared to the northern and coastal regions. Similarly, in all these three regions, the
proportion of elderly living alone was higher among males and elderly with no surviving children.

11
Further, in every category, the proportion of elderly living alone was higher in the southern region than
the northern and coastal regions. Hence, irrespective of the demographic characteristics, the proportion
of elderly living alone was much higher in southern region than in the other two regions.
Socio-Economic Determinants of Living Arrangements of Elderly in Orissa
The socio-economic and cultural factors have the strongest impact on the living arrangement s of the
elderly in any part of the world. The major socio-economic variables considered for the analysis were
place of residence, education, occupation, caste and income of the elderly. Since the income of the
elderly is not directly available from the NSS data, other variables like monthly expenditure pattern, land
ownership, state of economic independence and number of dependants were taken as proxy variables
that determine the economic status of the elderly.
Place of Residence and Living Arrangements
Table-4 presents the living arrangements of the elderly according to their place of residence. In the
sample, 80 per cent of the elderly were from rural areas and 20 per cent from urban areas. The data
showed that, although co-residence was the most common living arrangement in both areas, a slight ly
higher proportion (15.6 per cent ) of the elderly from rural areas lived alone compared to their urban
counterparts (14.5 per cent ). Similar findings were recorded in studies conducted in India and
els ewhere also (Knodel and Chayovan, 1997; NSS, 2006; Panda, 1997; Zimmer and Kim, 2002). As
expected, among the elderly who were in co-residence, the most common arrangement irrespective of
their residence was living with spouse and children. Further, a small proportion of the elderly lived with
other relatives or non-relatives. Here, the Pearson’s chi -square test statistics was not significant
suggesting that there was no marked difference in the living arrangements of elderly in Orissa on the
basis of their place of residence.
Education and Living Arrangements
The education level of the elderly also plays an important role in determining their living arrangements.
It was found that with increase in their educational level, the pattern of co-residence systematically
diminished (Andrade and De Vos, 2002; Bongaarts and Zimmer, 2001; Pal, 2004; Martin, 1989; Shah, et
al 2002). Generally, older persons with less education were more likely to live in traditional extended
family households than those with better education. However, contradictory findings were observed
across various countries. Studies show that the average proportion living with children was higher
among those with some education in Africa, Latin America and the Caribbean, and among those in Asia
with no education.
In Table-4, it can be seen that the highest proportion living alone (32.3 per cent) was among
the elderly with the highest (more than higher secondary) level of education compared to elderly who
were illiterate (15.5 per cent) or had education up to the secondary level (14.3 per cent ). Hence it is
evident that a certain level of minimum education was necessary for people to decide about living
alone. The Pearson’s chi-square test statistic was significant here too, meaning that there was a
significant difference in the living arrangements of elderly based on the level of education.

12
Caste and Living Arrangements of Elderly Persons
It may be of some interest to see whether caste plays any important role in determining the living
arrangements because many authors have pointed out that the living arrangements of elderly were
determined more by cultural rather than by economic consequences. Since most of the cultural
variables have not been collected in this survey data, a detailed analysis of the impact of cultural
variables on living arrangements cannot be carried out at this stage.
An attempt was made to assess whether or not caste played any important role in determining
the living arrangements of the elderly in Orissa. Table -4 presents the caste and living arrangements of
elderly in Orissa. It can be seen from the table that, although major differentials in living alone are
perceptible in different caste groups, a slightly higher proportion of other caste (upper caste) groups
lived alone compared to scheduled castes, schedule tribes and other backward castes. However, these
findings are not sufficient to draw major conclusions. The chi-square test statistic was found to be
insignificant with the association of caste and living arrangements of elderly persons in Orissa. From this
analysis, it is evident that there was no difference in the living arrangements of elderly in Orissa based
on caste.
Income and Living Arrangements
The income of the elderly is one of the important determinants of their economic status. Studies in
developed countries have concluded that majority of the elderly with higher income prefer to live alone
than those with lower incomes for various reasons. However, results from developing countries give a
mixed picture. As already pointed out, the direct income of the elderly was not collected through the
NSSO survey. Instead, per capita monthly expenditure, ownership of land and information on economic
independence can be used as the best proxy to determine the economic status of the elderly persons.
Table-4 provides the pattern of living arrangements of elderly based on the monthly per capita
expenditure. It is generally presumed that, higher the per capita expenditure, higher the income. Unlike
the findings in the developed countries, there was no clear-cut evidence to support the notion that
elderly persons with higher expenditure (presumably people of higher income) lived alone. Pearson’s
chi-square test statistics was not significant; it means that, the living arrangement s of the elderly did
not change according to their income.
Possession of Land and Living Arrangements
Although the per capita monthly expenditure pattern did not seem to have any effect on the choice to
live alone, what is attempted next is to look at the association between land ownership and living
arrangements. Possession of land is another important variable that determines the economic status of
the elderly. Table-4 shows that the ownership of land did not influence the living arrangement because
the proportion of elderly living alone did not show any clear pattern and the majority lived in co-
residence irrespective of whether or not they possessed land. It was found that t he association between
possession of land and living arrangements was not significant. It means that there was no significant
difference in the living arrangements based on possession of land. The possible reason could be that to

13
ensure inheritance of the land and household property the surviving children were forced to live with
their parents.
Therefore, it is clear that economic variables, such as monthly per capita expenditure and
ownership of land, did not influence the living arrangements of the elderly in Orissa because the cultural
variables were shaping the living arrangement choices. Yet another reason could be that these variables
did not really measure the economic status of the elderly individual. It measured only the economic
status of the household. It is probable that the economic status of the individual may be more
important in shaping the ir living arrangement s rather than that of the household. In order to assess the
economic status of the elderly per se, the variable state of economic dependence was considered next.
Table 4 : Distribution of Socio-Economic Determinants of Living Arrangements of Elderly in Orissa
Living Arrangements of Elderly (%) Total
Socio economic Variables Living alone
Living with spouse and
other members
Living without
spouse but with children
Living with
others Total
Observations (N) Percentage
Place of Residence Rural 15.6 50.8 31.1 2.6 100 984 79.5 Urban 14.5 55.7 27.3 2.5 100 254 20.5 Social Caste ST 13.3 42.7 38.8 5.2 100 217 17.5 SC 15.3 57.5 25.1 2.1 100 232 18.7 OBC 15.0 53.5 29.8 1.7 100 483 39.0 Upper Class 18.6 48.9 29.9 2.6 100 306 24.7 Level of Education* Not literate 15.5 40.6 40.3 3.6 100 808 65.3 Literate up to secondary 14.3 75.4 9.8 .5 100 396 32.0 More than secondary 32.3 65.9 1.8 100 34 2.7 Monthly PP Expenditure(Rs.) Less than Rs.250 13.4 49.7 33.5 3.4 100 250 20.2 Between Rs. 251 to 500 17.6 52.4 27.4 2.6 100 645 52.1 Between Rs. 501 to 1000 11.8 46.4 40.1 1.7 100 267 21.6 Greater than 1001 14.8 65.7 17.3 2.1 100 76 6.1 State of Economic Dep*. Not dependent on others 28.0 60.6 9.8 1.6 100 338 27.3 Partially dependent on others 12.6 68.0 17.9 1.5 100 209 16.8 Fully dependent on others 10.0 41.6 45.0 3.5 100 691 55.8 No. of Dependants* 0 58.0 41.0 1.0 100 17 5.0 1 43.2 48.8 7.5 .5 100 100 29.6 2 32.9 52.8 9.6 4.7 100 104 30.8 3 and above 2.7 83.1 14.0 .2 100 117 34.6 Land Ownership (hectors) Less than 0.2 15.4 50.9 31.7 2.0 100 610 49.4 Between 0.2 to 1 16.6 49.1 31.0 3.2 100 411 33.3 Between 1.01 to 3.0 12.4 58.0 26.8 2.8 100 184 4.9 Above 3.01 11.6 49.4 33.3 5.7 100 30 2.4 Observations (N) 193 638 376 31 1238 100 Percentage 15.5 51.2 30.7 2.6 100 100 *P < 0.001
Source: Author’s calculation

14
State of Economic Dependence and Living Arrangements
The state of economic dependence of the elderly is categor ised as those who are not dependent,
partially dependent, and fully dependent on others. The main aim of linking the state of economic
dependence with living arrangements was to find out how economic dependence decided the living
arrangements of the elderly in Orissa. Table -4 presents the data on living arrangements based on the
state of economic independence. The data shows that only about 28 per cent of the elderly were
economically independent in Orissa. Majority of the elderly either depended fully (55 per cent ) or
partially (17 per cent ) on others. This table clearly shows that the decision to live alone often depended
on economic independence. Nearly 28 per cent of the economically independent elderly lived alone; this
proportion was much less for elderly who were fully (10 per cent) or partially dependent (12.6 per cent)
on others. The effect of economic independence on living alone was strong even after controlling for
their age. Even among the older olds (those who were 70 and above) 31.1 per cent lived alone when
they were fully independent compared to those who were fully or partially dependent on others (Table-
5). This finding confirmed the fact that the income of the elderly per se was more important than the
income of the household in determining the living arrangement. Pearson’s chi-square test statistics was
significant, which implies that there was a clear difference in the living arrangements with reference to
the state of economic independence.
Table 5: Age, State of Economic Dependence and Living Arrangements of Elderly in Orissa
60-69 (%) 70 + (%) State of Economic Dependence Living in co
residence Living alone
Total (N) Living in co residence
Living alone
Total (N)
Not dependent on others 72.6 27.4 100 (284) 69.0 31.0 100 (56)
Partially dependent on others 87.4 12.6 100 (160) 87.0 13.0 100 (48)
Fully dependent on others 88.1 11.9 100 (416) 93.0 7.0 100 (274)
Total 82.7 17.3 100 (860) 89.1 10.9 100 (378) Source: Author’s calculation
The co-residence of elderly with their children is often visualised as a unidirection al relationship
where the elderly needs support and therefore co-residence ensures maximum benefits to the elderly.
However, studies have shown that the economically active elderly make a substantial contribution to the
household (Chan, 1997; Hermalin, 199 7). Studies have also shown that the presence of dependents on
the elderly also encouraged co-residence. In this context, it is interesting to see whether or not the
elderly support ed others economically. In order estimate the number of dependents on the elderly, a
question was asked in the survey to the non-dependents of the elderly.
It is of interest to note that, nearly 95 per cent of the economically independent elderly had
dependents. Roughly, 30 per cent of the elderly had one or two and nearly 35 per cent had three or
more. Pearson’s chi-square test statistics was significant; there was a marked difference in the living
arrangements of elderly based on the number of dependents. This establishes the fact that in co-
residence, the elderly may not always be the recipient of care and support; they also supported others
in multiple ways.
15
Table 6: Distribution of Socio Economic Indicators and Living Arrangements of Elderly across Geographical Region with in Orissa
Coastal Southern Northern Total
Socio Economic Variables Living alone (%)
N Living alone (%)
N Living alone (%)
N Living alone (%)
N
Place of residence Rural 12.7 495** 20.8 148 17.5 341* 15.6 984 Urban 21.8 139 33.7 29 0.4 86 14.5 254
Social caste ST 9.0 20 18.6 73 10.8 124 13.3 217 SC 15.1 146 30.4 20 11.4 66 15.3 232 OBC 10.8 257 18.4 55 20.2 171 15.0 483 Upper Class 17.1 211 31.4 29 17.9 66 18.6 306 Level of education Not literate 12.1 398* 23.6 141** 16.5 270 15.5* 808 Literate up to secondary 14.3 215 9.6 34 15.1 147 14.3 396
More than secondary 51.7 21 0.0 2 0.0 10 32.3 34
Per capita exp. (Rs.) Less than Rs.250 7.8 70 16.2 83 15.2 97 13.4 250 Between Rs. 251 to 500 14.6 351 29.0 75 19.1 218 17.6 645 Between Rs. 501 to 1000 13.2 169 15.0 14 8.8 84 11.8 267
Greater than 1001 19.2 44 20.3 5 7.3 28 14.8 76
Possession of land (hectares) Less than 0.2 14.1 338** 29.6 80* 12.9 192 15.4 610 Between 0.2 to 1 14.0 214 24.4 58 17.8 139 16.6 411 Between 1.01 to 3.0 13.0 72 7.3 35 17.7 78 12.4 184
Above 3.01 0.0 10 0.0 4 21.0 18 11.6 30
State of eco. Dep.* Not dependent on others 25.2 168 40.2 47 27.5 125 28.0 338 Partially dependent on others 8.6 104 22.6 51 11.3 53 12.6 209 Fully dependent on others 9.6 362 10.3 79 10.4 249 10.0 691
No. of dependents* 0 48.4 10 97.7 4 51.5 3 58.0 17 1 48.6 45 20.8 10 42.0 45 43.2 100 2 20.5 53 64.5 21 34.8 30 32.9 104 3+ 2.9 59 0.0 12 3.1 46 2.7 117
Total 13.7 634 21.5 177 15.8 477 15.6 1238 N= no. of observations p* < 0.001 p** < 0.05
Source: Author’s calculation
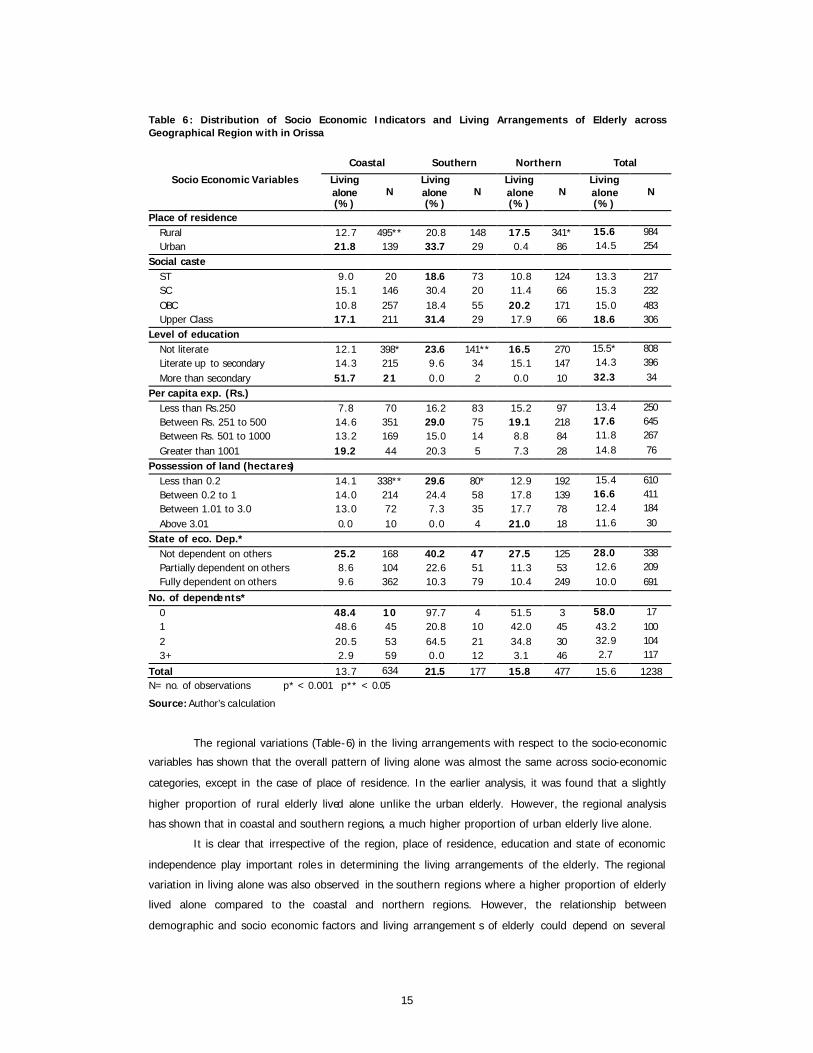
The regional variations (Table-6) in the living arrangements with respect to the socio-economic
variables has shown that the overall pattern of living alone was almost the same across socio-economic
categories, except in the case of place of residence. In the earlier analysis, it was found that a slightly
higher proportion of rural elderly lived alone unlike the urban elderly. However, the regional analysis
has shown that in coastal and southern regions, a much higher proportion of urban elderly live alone.
It is clear that irrespective of the region, place of residence, education and state of economic
independence play important roles in determining the living arrangements of the elderly. The regional
variation in living alone was also observed in the southern regions where a higher proportion of elderly
lived alone compared to the coastal and northern regions. However, the relationship between
demographic and socio economic factors and living arrangement s of elderly could depend on several
16
other factors. Therefore a multivariate analysis is necessary to find out the determinants of the living
arrangements of the elderly.
Analysis of Logistic Regression
The analysis and discussions of the previous sections clearly indicate that there are differe ntials in living
arrangement based on socio-economic and demographic factors. But the relative contribution of these
variables cannot be studied using the bivariate tables presented earlier, although they have provided
fruitful insight into the nature of the relationship. Since the living arrangement is governed by a host of
socio-economic and demographic variables, it is necessary to control the effect of other varia bles in
order to find out the net effect of each of the individual variables. Clearly there is a need for
multivariate analysis to find out the net effect of each variable. In order to quantify the net effect of the
background variables on living arrangements the logistic regression analysis was carried out. Since in
the present analysis the dependent var iable was dichotomous by nature [whether living alone (1) or in
co residence (0)] the logistic regression model was the appropriate technique to assess the influence of
explanatory variables on the dependent variable. The independent variables in the model were split it
into three categories - demographic, social and economic. Under demographic variables age, sex,
marital status, number of surviving sons and daughters were included as explanatory variables. The
social and economic variables included place of residence, level of education, caste, monthly per capita
expenditure (as proxy of income), possession of land and state of economic independence were the
explanatory variables.
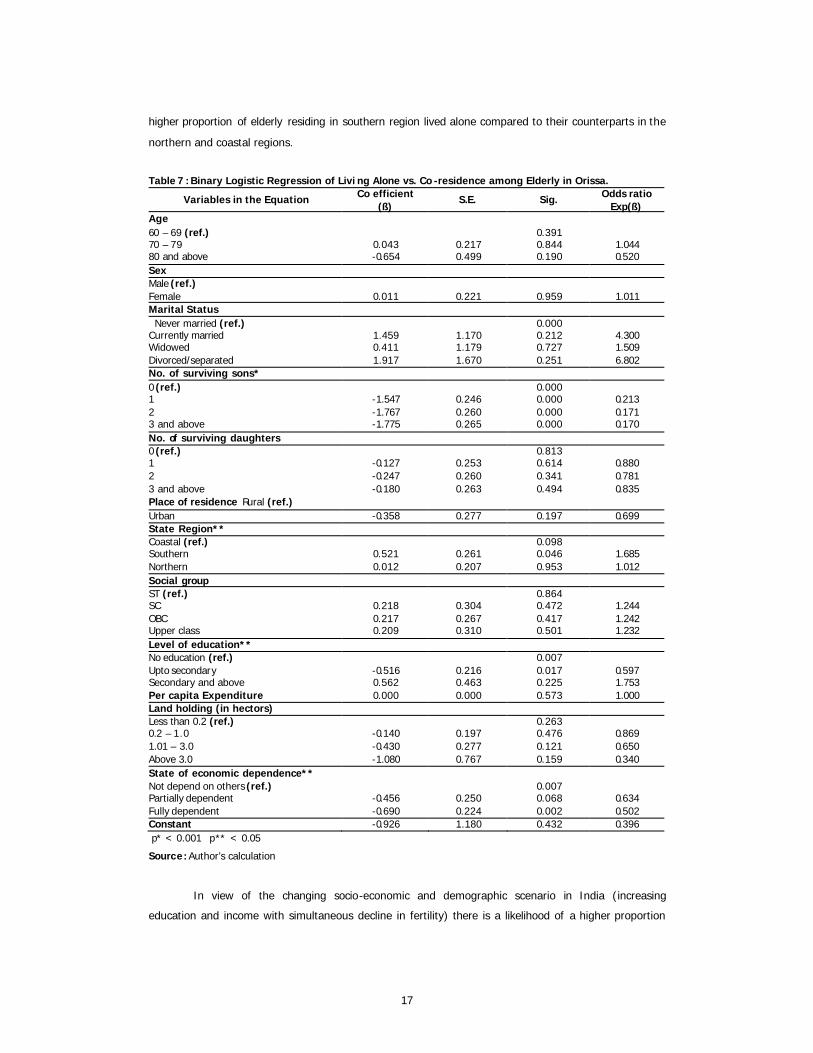
The results of the logistic regression analysis are presented in Table 7. The results confirmed
that after controlling different background variables, the number of surviving sons, level of education
and state of economic independence and region turned out to be the most significant variables in
determining the living ar rangements of the elderly in Orissa. Although the bivariate analysis showed the
existence of differentials in living arrangements with respect to the demographic variables such as age,
sex and marital status, they were not significant in predicting the liv ing arrangement choices when the
effect of other variables was controlled.
Conclusion
It was observed that as the number of surviving sons increased, significant ly fewer elderly lived alone.
The presence of sons was an important variable that determined co-residence. However, in order to get
a more detailed picture, characteristics of children, their marital status, location and income would also
be useful to determine the living arrangements. Unfortunately, it was not available.
Similarly, the likelihood of the elderly with higher education living alone was much higher
compared to those who were either illiterate or had a few years of schooling. Economic independence
was also an important variable in determining the chances of living alone. There was less likelihood of
the elderly living alone when they were fully or partially dependent on others indicating the significance
of individual income over household income in determining the living arrangement. Similarly, the region
was also a significant variable that determined the chances of living alone. In Orissa, a significantly
17
higher proportion of elderly residing in southern region lived alone compared to their counterparts in the
northern and coastal regions.
Table 7 : Binary Logistic Regression of Livi ng Alone vs. Co -residence among Elderly in Orissa.
Variables in the Equation Co efficient (ß)
S.E. Sig. Odds ratio Exp(ß)
Age 60 – 69 (ref.) 0.391 70 – 79 0.043 0.217 0.844 1.044 80 and above -0.654 0.499 0.190 0.520 Sex Male (ref.) Female 0.011 0.221 0.959 1.011 Marital Status Never married (ref.) 0.000 Currently married 1.459 1.170 0.212 4.300 Widowed 0.411 1.179 0.727 1.509 Divorced/separated 1.917 1.670 0.251 6.802 No. of surviving sons* 0 (ref.) 0.000 1 -1.547 0.246 0.000 0.213 2 -1.767 0.260 0.000 0.171 3 and above -1.775 0.265 0.000 0.170 No. of surviving daughters 0 (ref.) 0.813 1 -0.127 0.253 0.614 0.880 2 -0.247 0.260 0.341 0.781 3 and above -0.180 0.263 0.494 0.835 Place of residence Rural (ref.) Urban -0.358 0.277 0.197 0.699 State Region** Coastal (ref.) 0.098 Southern 0.521 0.261 0.046 1.685 Northern 0.012 0.207 0.953 1.012 Social group ST (ref.) 0.864 SC 0.218 0.304 0.472 1.244 OBC 0.217 0.267 0.417 1.242 Upper class 0.209 0.310 0.501 1.232 Level of education** No education (ref.) 0.007 Upto secondary -0.516 0.216 0.017 0.597 Secondary and above 0.562 0.463 0.225 1.753 Per capita Expenditure 0.000 0.000 0.573 1.000 Land holding (in hectors) Less than 0.2 (ref.) 0.263 0.2 – 1.0 -0.140 0.197 0.476 0.869 1.01 – 3.0 -0.430 0.277 0.121 0.650 Above 3.0 -1.080 0.767 0.159 0.340 State of economic dependence** Not depend on others (ref.) 0.007 Partially dependent -0.456 0.250 0.068 0.634 Fully dependent -0.690 0.224 0.002 0.502 Constant -0.926 1.180 0.432 0.396 p* < 0.001 p** < 0.05
Source: Author’s calculation
In view of the changing socio-economic and demographic scenario in India (increasing
education and income with simultaneous decline in fertility) there is a likelihood of a higher proportion

18
of elderly Indians living alone in the future. Therefore, the policies and programmes for the welfare of
the elderly have to address the needs of those who live alone.
Policy and Suggestions
Following are some of the policy and suggestions be taken into consideration for the wellbeing of the
elderly:
1. The family as the natural fundamental unit of society has to be strengthened as a support system
for the provision of care and protection for older persons. It was observed that the emotional,
social, physical and economic support provided by the family was indispensable and cannot be
replaced by any other institution. For this reason attention should be given to promote co-residence
through housing policies and financial incentives for those households where the elderly are family
members.
2. The traditional institution for the care of older persons, the family is undergoing a transformation in
response to demographic changes. The support systems for older persons need to be re examined
with a view to improving their scope and effectiveness.
3. Special attention should be given to vulnerable older persons such as the poor, the widows, the
childless, the minorities, the disabled and the sick whose families are unable to support them and
those who are destitute and have no family.
4. Ensuring a proper living condition is a national concern. Policies and programmes should ensure
that older persons have a reasonable and adequate living environment. For this reason incentives
should be given to facilitate home up gradation and initiate appropriate housing schemes for older
persons who live alone either by choice or by circumstances.
5. To bring active older persons into the economic and social mainstream.
6. Strengthen the service infrastructure to meet the social, emotional, health, financial and
development needs of the elderly population.
References
Alam, Moneer and M Mukherjee (2005). Ageing, Activities of Daily Living Disabilities and the need for
Public Health Initiatives: Some Evidence from a Household Survey in India. Asia Pacific
Population Journal, Vol. 20, No. 2, pp. 47-76.
Andrade, Flavia Cristina Drumond and Susan De Vos (2002 ). An Analysis of Living Arrangements
among Elderly Women in Brazil. Madison: University of Wisconsin.
Bhattacharya, Prakash (2005). Implications of an Aging Population in India: Challenges and
Opportunities. Institute of Charted Financial Analysis of India.
Bian, F et al (1998 ). Intergenerational Relations in Urban China: Proximity Contact and Help to Parents.
Demography, Vol. 35, Pp. 115-24.
Bongaarts, John and Zachary Zimmer (2001). Living Arrangements of Older Adults in the Developing
World: An Analysis of DHS Household Survey. Working Paper, No. 148. Population Research
Division, Population Council.

19
Burch, Thomas K and Beverly J Mathews (1987). Household Formation in Developed Countries.
Population Development Review, Vol. 13, Pp. 495-511.
Chakraborti, Rajagopal Dhar (2004). The Graying of India: Population Ageing in the Context of Asia.
New Delhi: Sage Publication.
Chan, Angelique (1997). An Overview of the Living Arrangements and Social Support Exchanges of
Older Singaporeans. Asia Pacific Population Journal, Vol. 12, No. 4, Pp. 35-50.
Chaudhury, Rafiqual Huda (2004 ). Ageing in Nepal. Asia Pacific Population Journal, Vol. 19, No. 1, pp.
61-80.
Chaudhuri, A and Kakoli Roy (2007). Gender Differences in Living Arrangements amongst the Elderly in
India. San Francisco State University. Paper presented at Western Economic Association
International and Population Association of America.
Grundy, E (2000). Co residence of Mid-Life Children with Their Elderly Parents in England and Wales:
Changes between 1981 and 1991. Population Studies, Vol. 54, Pp. 193-206.
Gulati, S C and S Irudaya Rajan (1990). Social and Economic Implications of Population Aging in Kerala,
India. Demography India, Vol. 19, No.2, pp. 235-50.
Hermalin, Albert I (1997). Drawing Policy Lessons for Asia from Research on Ageing. Asia Pacific
Population Journal, Vol. 12, No. 4, Pp. 89-102.
Jai Prakash, Indira (1999). Ageing in India. Report Submitted to World Health Organisation, Geneva.
Kinsella, Kevin and David R Phillips (2005). Global Aging: The Challenge of Success. Population Bulletin,
Vol. 60, No. 1, Population Reference Bureau.
Knodel, John (1999). Demography of Asian Ageing: Past Accomplishments and Future Challenges. Asia
Pacific Population Journal, Vol. 14, No. 4, pp. 39-56.
Knodel, John and Napaporn Chayovan (1997). Family Support and Living Arrangements of Thai elderly.
Asia Pacific Population Journal, Vol. 12, No. 4, Pp. 51-68.
Knodel, John E, Mary Beth Ofstedal (2003). Gender and Aging in the Developing World: Where Are the
Men?. Population and Development Review, Vol. 29, No. 4, Pp. 677-98.
Lee, Yean Ju and Albert Palloni (1992). Changes in the Family Status of Elderly Women in Korea.
Demography, Vol. 29, No. 1, Pp. 69-92.
Liang, Jersey, Shengzu Gu and Neal Krause (1992). Social Support among the Aged in Wuhan, China.
Asia Pacific Population Journal, Vol. 7, No. 3, Pp. 33-62.
Martin, L G (1989). Living Arrangements of the Elderly in Fiji, Korea, Malaysia and Philippines.
Demography, Vol. 26, No. 4, Pp. 627 -43.
Mason, Karen Oppenheim (1992). Family Change and Support of the Elderly in Asia: What do We
Know?. Asia Pacific Population Journal, Vol. 7, No. 3, pp. 13-32.
NSS (1998). The Aged in India: A Socio-Economic Profile, 52 nd Round, Report No. 446, National Sample
Survey Organisation, New Delhi.
NSS (2006). Morbidity, Health Care and the Condition of the Aged. 60 t h Round, Report No. 507, National
Sample Survey Organization, New Delhi.
Pal, Sarmistha (2004). Do Children Act as security in Rural India ? Evidence from an analysis of elderly
living arrangements, Cardiff Business School, Column Drive.
20
Palloni, Alberto (2001 ). Living Arrangements of Older Persons. Population Bulletin of the United Nations,
No. 42/43, pp. 54-110.
Panda, Pradeep Kumar (1997). Living arrangements of the elderly in rural Orissa. Working Paper,
No.277. Thiruvananthpuram: Centre for Development Studies.
Rajan, S Irudaya (2006). Population Ageing and Health in India . Mumbai: Cehat Publications.
Rajan, S Irudaya, U S Mishra and P Sankar Sarma (1999 b). India’s Elderly: Burden or Challenges?. New
Delhi: Sage Publications.
Rajan, S Irudaya, U S Mishra and P Sankar Sarma (2000). Ageing in India. Indian Social Science
Review , Vol. 2, No. 1, pp.1-48.
Rajan, S Irudaya and Sanjay Kumar (2003). Living Arrangements among Indian Elderly: New Evidence
from National Family Health Survey. Economic and Political Weekly, Vol.38, No. 1, Pp. 75-80.
Ramashala, Mapule F (2001). Living Arrangements, Poverty and the Health of Older Persons in Africa.
Population Bulletin of the United Nations, No. 42/43, Pp. 360 -75.
Sahayam, M Deva (1988 ). Aged Females: The Most Deprived Among the Deprived. The Indian Journal
of Social Work, Vol. XLIX, No. 3, pp.261 -269.
Sengupta, Manisha and Emily M Agree (2003 ). Gender, Health, Marriage and Mobility Difficulty among
Older Adults in India. Asia Pacific Population Journal, Vol. 18, No. 4, pp. 53-65.
Shah, A M (1999). Changes in the Family and Elderly. Economic and Political Weekly, Vol. 34, No. 20,
pp. 1179-82.
Shah, Nasra M et al (2002). Living Arrangements of Older Women and Men in Kuwait. Journal of Cross
Cultural Gerontology, Vol. 17, No. 4. Pp. 337-55.
Silva, W Indralal (1994). How Serious is Aging in Sri Lanka and What can be done about it? Asia Pacific
Population Journal, Vol. 9, No. 1, pp. 19 -36.
Sobieszczyk, Teresa, John K Knodel and Napaporn Chayovan (2003). Gender and Well Being among
Older People: Evidence from Thailand. Ageing and Society, Vol. 23, Pp. 701 -35.
Srivastava, H C and Nihar Ranjan Mishra (2005). Living Arrangement and Morbidity Pattern among
Elderly in Rural India. Mumbai: International Institute for Population Sciences.
Sumangala, P R (2003). Retired People and Their Participation in Family Activities. Man in India, Vol. 83,
No. 1, pp. 221-25.
United Nations (2005). Living Arrangements of Older Persons around the World. New York: Department
of Economic and Social Affairs Population Division. ST/ESA/STAT/SER.A/240.
United Nations (2003). World Population Prospects: The 2002 Revision, Vol. I. New York: Department of
Economic and Social Affairs Population Division. ST/ ESA/SER/222.
United Nations (2002 ). World Population Ageing 1950-2050. New York: Departments of Economic and
Social Affairs Population Division. ST/ESA/SER.A/207.
Velkoff, Victoria A (2001). Living Arrangements and Well being of the Older Population: Future Research
Direction. Population Bulletin of the United Nations, Nos. 42/43. pp. 376-85.
Yadava, K N S, Surendar S Yadava and C L N Sharma (1996). A Study of Socioeconomic Factors and
Behavioural Problems of the Aged Persons in Rural Northern India. Demography India, Vol. 25,
No. 1, pp. 21-34.

21
Zachariah, K C (2001). Coping with Demographic Transition. Economic and Political Weekly, Vol. 36, No.
21, pp. 1938-40.
Zimmer, Zachary (2005). Health and Living Arrangement Transitions among China’s Oldest -Old.
Research on Aging, Vol. 27, No. 5, Pp. 526-55.
Zimmer, Zachary, Albert I Hermalin and Hui-Sheng Lin (2001). Whose Education Counts? The Impact of
Grown Children’s Education on the Physical Functioning of Their Parents in Taiwan. Policy
Research Division Working Paper, No. 146. New York: Population Council.
Zimmer, Zachary and Julia Kwong (2003). Family Size and Support of Older Adults in Urban and Rural
China: Current Effects and Future Implications. Demography, Vol. 40, No. 1, Pp.23-44.
Zimmer, Zachary, Napaporn Chayovan, Hui-Sheng Lin and Josefina Natividad (2003). How Indicators of
Socioeconomic status relate to Physical Functioning of older adults in three Asian Countries.
Policy Research Division Working Paper, No. 172. New York: Population Council.
Zimmer, Zachary and Sovan Kiry Kim (2002). Living Arrangements and Socio-demographic Conditions of
Older Adults in Cambodia. Working Paper, No. 157. New York: Policy Research Division,
Population Council.

167 Significance of Income GeneratingActivities under Micro-Finance: A Studyof Micro-Finance Groups in WayanadDistrict, KeralaEmil Mathew
168 Financing Rural Drinking Water Supply: ACase Study of KarnatakaVeerashekharappa, K V Raju and S Manasi
169 Employment Security of the UnorganisedSector Workers in KarnatakaD Rajasekhar and J Y Suchitra
170 Non-Agricultural Employment for YoungWomen in India: Status, Opportunity andWays ForwardD Rajasekhar
171 Community Contribution forEnviornmental Sanitation: Myth orReality?Veerashekharappa
172 Does Repayment Indicate the Success ofMicro-Finance Programme?Emil Mathew
173 Community Participation in Rural WaterSupply: An Analysis Using HouseholdData from North KeralaNisha K R
174 Urbanisation in a Forward Looking Statpeof India: Patterns Issues and PolicyG S Sastry
175 Contract Labour Act in India: A PragmaticViewMeenakshi Rajeev
176 Issues of Unaccounted for Water in theUrban Water SectorG S Sastry
177 Liberalisation and Efficiency of IndianCommercial Banks: A Stochastic FrontierAnalysis
H P Mahesh
178 Power Sharing in the Panchayats ofOrissaPratyusna Patnaik
179 Can Career-Minded Young WomenReverse Gender Discrimination?Alice W Clark and T V Sekher
180 People’s Participation in EnvironmentalProtection: A Case Study of PatancheruGeetanjoy Sahu
181 Efficiency and BureaucracyAnitha V
182 Reproductive and Child HealthProgrammes in the Urban Slums ofBangalore City: A Study on Unmet Needsfro Family Welfare ServicesC S Veeramatha
183 Demographic Change and GenderInequality: A Comparative Study ofMadhya Pradesh and KarnatakaC M Lakshmana
184 Increasing Ground Water Dependencyand Declinin Water Quality in UrbanWater Supply: A Comparative Analysis ofFour South Indian CitiesK V Raju, N Latha and S Manasi
185 Impact of Land Use Regulations onSuburbanisation: Evidence from India’sCitiesKala Seetharam Sridhar
186 Socio-Economic Determinants of WomenLeadeship at the Grass - RootsK C Smitha
187 Groundwater for Agriculural Use in India:An Institutional PerspectiveSarbani Mukherjee
188 Comparative Study of Traditional Vs.Scientific Shrimp Farming in West Bengal:A Technical Efficiency AnalysisPoulomi Bhattacharya
189 Urban and Service Delivery in Bangalore:Public-Private PartnershipSmitha K C and Sangita S N
190 Social Capital in Forest GovernanceRegimesSangita S N
191 Agriculture in Karnataka: A HistoricalView After the Fall of SerirangapatanaR S Deshpande and Malini Tantri
192 Personality Traits and AdministratorsAnitha V
193 Sustainability of Indian Agriculture:Towards an Assessment V M Rao
194 Emerging Development Issues of GreaterBangaloreG S Sastry
195 Rural Infrastructure Development Fund:Need for a Track ChangeMeenakshi Rajeev
196 Emerging Ground Water Crisis in UrbanAreas — A Case Study of Ward No. 39,Bangalore CityK V Raju, S Manasi and N Latha
197 In Pursuit of India’s Export earningadvantage: An Assessment of IT-EnabledServices IndustryMeenakshi Rajeev
198 A Patriarchal Link to HIV/AIDS in IndiaSkylab Sahu
199 Collective Action and Property Rights:Some Critical Issues in the Context ofKarnatakaK G Gayathri Devi
200 State, Society and Inclusive Governance:Community Forests in Andhra Pradesh,Karnataka and OrissaS N Sangita
201 Urban Poverty and Links with theEnvironment: An ExplorationK G Gayathri Devi
Recent Working Papers

202 Groundwater Over-exploitation, Costsand Adoption Measures in the Central DryZone of KarnatakaAnantha K H and K V Raju
203 Changing Child Population: Growth,Trends and Levels in KarnatakaC M Lakshmana
204 Awareness About HIV/AIDS AmongKarnataka Woment: An Analysis of RCH2002-04 DataK S Umamani
205 The Microfinance Promise in FinancialInclusion and Welfare of the Poor:Evidence from Karnataka, IndiaNaveen K Shetty
206 Structure of Central Himalayan ForestsUnder Different Management Regimes:An Empirical StudySunil Nautiyal
207 Poverty and Natural Resources:Measuring the Links (Some Issues in theContext of Karnataka)K G Gayathri Devi
208 Federalism and Decentralisation in India:Andhra Pradesh and Tamil NaduV Anil Kumar
209 Capital, ‘Development’ and CanalIrrigation in Colonial IndiaPatric McGinn
210 Gender, Ecology and Development inKarnataka: Situation and Tasks AheadK G Gayathri Devi
211 Greenhouse Gases Emission and PotentialCorbon Sequestration: A Case Study ofSemi-Arid Area in South IndiaLenin Babu and K V Raju
212 Emerging Trends in Managing DrinkingWater – Case Studies of Coastal Villagesin KarnatakaManasi S, Latha N and K V Raju
213 Spatio-Temporal Analysis of ForestsUnder Different Management RegimesUsing Landsat and IRS ImagesSunil Nautiyal
214 Traditional Knowledge System(Medicine): A Case Study of ArakalgudTaluk, Karnataka, IndiaB K Harish, K Lenin Babu
215 Tribal Movement in Orissa: A StruggleAgainst Modernisation?Patibandla Srikant
216 Technological Progress, Scale Effect andTotal Factor Productivity Growth inIndian Cement Industry: PanelEstimation of Stochastic ProductionFrontierSabuj Kumar Mandal and S Madheswaran
217 Fisheries and Livelihoods in TungabhadraBasin, India: Current Status and FuturePossibilitiesManasi S, Latha N and K V Raju
218 Economics of Shrimp Farming: AComparative Study of Traditional Vs.Scientific Shrimp Farming in West BengalPoulomi Bhattacharya
219 Output and Input Efficiency ofManufacturing Firms in India: A Case ofthe Indian Pharmaceutical SectorMainak Mazumdar, Meenakshi Rajeevand Subhash C Ray
220 Panchayats, Hariyali Guidelines andWatershed Development: Lessons fromKarnatakaN Sivanna
221 Gender Differential in Disease Burden: It’sRole to Explain Gender Differential inMortalityBiplab Dhak and Mutharayappa R
222 Sanitation Strategies in Karnataka: AReviewVeerashekharappa and Shashanka Bhide
223 A Comparative Analysis of Efficiency andproductivity of the Indian PharmaceuticalFirms: A Malmquist-Meta-FrontierApproachMainak Mazumdar and Meenakshi Rajeev
224 Local Governance, Patronage andAccountability in Karnataka and KeralaAnand Inbanathan
225 Downward Dividends of GroundwaterIrrigation in Hard Rock Areas of SouthernPeninsular IndiaAnantha K H
226 Trends and Patterns of Private Investmentin IndiaJagannath Mallick
227 Environmental Efficiency of the IndianCement Industry: An Interstate AnalysisSabuj Kumar Mandal and S Madheswaran
Price: Rs. 30.00 ISBN 81-7791-184-8
INSTITUTE FOR SOCIAL AND ECONOMIC CHANGEDr V K R V Rao Road, Nagarabhavi P.O., Bangalore - 560 072, India
Phone: 0091-80-23215468, 23215519, 23215592; Fax: 0091-80-23217008E-mail: [email protected]; Web: www.isec.ac.in