determinants of merger and acquisition activity in ...eprints.qut.edu.au/2315/1/2315.pdf ·...
TRANSCRIPT
This is the author’s version of a paper that was later published as:
Worthington, Andrew C. (2004) Determinants of merger and acquisition activity in Australian cooperative deposit-taking institutions. Journal of Business Research 57(1):pp. 47-57.
Copyright 2004 Elsevier
Determinants of merger and acquisition activity in Australian cooperative deposit-taking institutions
Andrew C. Worthington*
School of Economics and Finance, Queensland University of Technology, GPO Box 2434, Brisbane, QLD 4001, Australia
Abstract
A two-stage procedure is employed to evaluate the determinants of merger and acquisition (M&A) activity in Australian credit unions over the period 1992/93 to 1994/95. In the first stage, data envelopment analysis is used to calculate technical and scale efficiency indices for a sample of credit unions. The second stage uses a multinomial logit model to relate credit union efficiency scores, along with other managerial, regulatory and financial factors, to the probability of credit unions acquiring or being acquired by another credit union. The results indicate that asset size and quality, management ability, earnings and liquidity are a significant influence on the level of M&A. One primary influence on credit union acquisitions would appear to be the perceived compatibility in associational bond and membership.
Keywords: Mergers and acquisitions, Credit unions, Data envelopment analysis, Technical and scale efficiency.
For most of their history, credit unions have operated within a well-defined, institution-
specific, regulatory sub-sector of the Australian financial system. However, in the period
following deregulation Australian credit unions were forced to adapt to a newly competitive
environment. The most discernible response has been a dramatic increase in merger and
acquisition (M&A) activity. In point of fact, competitive pressures for consolidation are not
confined to Australia and are relatively commonplace for financial mutuals and other small
deposit-taking institutions throughout the world. In the United States restrictions on
expansion through branches and acquisitions across state lines have been progressively
dismantled through the weakening of the Glass-Stegall Act and the recent passage of the
Riegle-Neal Banking Act (Cyree et al., 2000). These and other competitive pressures have
seen a dramatic increase in interstate and intrastate acquisitions among credit unions and
* Tel.: +61-7-3864-2658; fax: +61-7-3864-1500. E-mail address: [email protected]
2
S&Ls (Shaffer, 1993; Grabowski et al., 1995) and a renewed emphasis on the examination of
financial and productive performance in financial mutuals (Cebenoyan et al., 1993;
Grabowski et al., 1993; Fried et al., 1996). In the United Kingdom building societies are the
major financial mutuals and are likewise the subject of increasing empirical attention in this
regard [see, for example, Piesse and Townsend (1995), Drake and Weyman-Jones (1996) and
Thompson (1997)]. The close correspondence of the role and competitive environment of
financial mutuals in Australia, the United States and the United Kingdom, amongst others,
provides a compelling rationale for the examination of M&A activity in alternative
institutional milieus.
However, examination of existing empirical evidence on the managerial, regulatory and
financial determinants of financial institution mergers suggests that the motives for mergers in
cooperative deposit-taking institutions vary substantially from those found in, say,
commercial banks. One aspect of this process is the major behavioural differences between
the private ownership claims found in mutual organisations and their joint stock equivalents.
Thompson (1997, p. 38), for example, has argued, “this is curious since, at least in the context
of an Anglo-American type of corporate governance system, it is the threat of a hostile take-
over which represents the ultimate disciplinary sanction for managers who depart from
shareholder value maximisation. By contrast, most countries’ mutual sectors are so
constituted that hostile acquisition is impossible”. Accordingly, there is the suggestion that
structural change in cooperative financial services is essentially restricted to ‘friendly’
mergers, and that there is a large degree of acquiescence by regulatory authorities in this
matter (Thompson, 1997).
Likewise, decision rules in cooperative enterprises primarily rest on democratic principles,
rather than ownership concentration. Traditionally, this has been used to suggest that the
appropriate behavioural assumption in cooperative institutions is the maximisation of member
services rather than profits. However it has also been suggested by Garden and Ralston
(1999), amongst others, that the process of deregulation, and the increased competition from
the entry of new market participants (e.g. mortgage specialists, insurance companies, etc.),
has meant that management and regulators have increasingly shaped the objectives of credit
unions towards a more commercial orientation. In this manner, any pre-existing ideological
imperatives found in credit unions have been constrained by the need to function in a highly
competitive financial market.
3
Accordingly, any analysis of the motives for merger activity in cooperative deposit-taking
institutions is likely to involve the complex interaction of a large number of factors.
Furthermore, it is likely that these motives have changed substantially during the recent
program of financial reform. On one hand, the behavioural objectives of cooperative deposit-
taking institutions, including credit unions, are relatively complex, and should take account of
the overriding objective of maximising member services. On the other, the process of
deregulation in the Australian financial services industry has emphasised the role of
management and regulators, with a corresponding emphasis on improving efficiency and
financial viability. A careful analysis of these divergent forces should therefore add to our
knowledge about the factors determining the pattern of structural change in Australia
financial services, and provide at least some idea of the effectiveness of recent
microeconomic reform, especially in regard to some of the smaller deposit-taking institutions.
In this paper an attempt is made to examine the determinants of M&A activity in
Australian credit unions. The paper itself is divided into four main sections. The first section
focuses on the characteristics of credit unions in Australia, especially those that are likely to
impact upon decisions concerning merger and acquisition activity. The second section deals
with the specification of those variables posited to influence the recent pattern of M&A. The
third section presents the empirical results of the analysis. The paper ends with some brief
concluding remarks in the final section.
1. Merger and acquisition in the cooperative financial sector
Credit unions are generally presented as maintaining an objective and culture unlike that of
any other Australian financial institution. Similarly, and despite the recent program of
microeconomic reform, credit unions and other cooperative societies operating in Australia
receive differing treatment under the regulatory system to all other financial institutions,
including commercial banks. These impact upon the process of merger and acquisition in the
credit union industry, and correspondingly on empirical efforts to model this process. Several
salient points are noted.
The first key consideration is that credit unions in Australia operate on a cooperative basis,
principally by borrowing from and providing finance to their members. And in general, these
institutions have maintained the key principle of ‘mutuality’: implying ‘one member, one
vote’, regardless of the size of the individual member’s deposits or loans (Garden and
4
Ralston, 1999). When combined with the fact that a credit union cannot acquire shares in
another, the suggestion is that a merger of credit unions must be agreed to by both parties; a
hostile take-over of a sound credit union therefore being difficult, if not impossible, to
achieve (Brown et al., 1999). Likewise, in Australia liquidation of credit unions has been
extremely rare, and it is widely understood that the exit of credit union in financial distress is
likely to occur through merger rather than liquidation. In most instances, and well before any
question of insolvency, regulators have evaluated possible partners for merger and facilitated
the exit of an unsound credit union.
The second key consideration is that a credit union’s overriding objective is generally
accepted to be maximisation of member benefits rather than profit-maximisation. However,
there is evidence that the objectives of credit unions have increasingly been shaped by
management towards a more conventional profit-orientation. The most obvious reason is that
decisions by management with respect to member services are made in the context of a highly
competitive financial sector. This has meant that long-standing practices in the commercial
banking sector have been recently adopted in cooperative deposit-taking institutions. One
example is the widespread adoption of a ‘user-pays’ system of charges with respect to deposit
accounts. Another reason for the erosion of the member-services orientation is associated with
the strengthening asset growth rate for credit unions. There is the suggestion that the rapid
growth of credit unions has heightened the power of management at the expense of member
control. For example, O’Brien (1993) has argued that commercial interests in credit unions
have progressively dominated any earlier philosophical or social commitments.
The third key consideration is that the regulatory environment within which Australian
cooperative deposit-taking institutions operate has also reoriented credit unions towards
profit-maximisation. Since the introduction of the Australian Financial Institutions Act 1992,
credit unions have been subject to a risk-weighted capital adequacy requirement of eight
percent, equivalent to that imposed on banks. They are also required to hold seven percent of
their liabilities as prime liquid assets, and a further six percent as liquid funds under an
operational liquidity requirement. The argument here is that since capital is usually held in the
form of retained earnings, the only way credit unions can build up sufficient reserves to allow
asset growth is through the accumulation of operating surpluses. Davis (1994, p. 44) has
argued that this process will necessarily focus management attention upon financial targets
not necessarily consistent with the credit union’s goals as a cooperative. More importantly, it
has been suggested that the stringent portfolio constraints on liquidity, capital and lending in
5
credit unions (including provisions that more than sixty percent of total assets are loans to
members), highlight merger as a means of increasing capital base and improving efficiency.
The final key consideration is that in spite of the erosion of the traditional objectives of
credit unions, there is still an emphasis on the common bond or affinity that defines
membership of individual credit unions. For example, a common bond technically restricts
membership of individual credit unions in Australia to three categories; namely, industrial
(employee) groups; community (geographic) groups; and parish (religious) groups. This
common bond is argued to be an important reason for the industry’s success to date, but it is
also a potential limitation on future growth. On one hand, it encourages member loyalty to the
institution (which in some instances may override the desire for the cheapest alternative form
of banking), while on the other it may restrict the extent of growth by an excessively
restricted potential customer base (Garden and Ralston, 1997). Though the process of merger
among Australian credit unions has seen a considerable weakening of these bonds, it also
suggests that more immediate concerns in finding a merger partner may be consideration of
consistency of purpose and geographic location as a means of preventing erosion of member
loyalty.
Accordingly, three possible characterisations of the merger process are likely to be found
when modelling mergers in Australian cooperative deposit-taking institutions. The first is that
the merger process reflects the reorientation of credit unions services towards profit-
maximisation, and is therefore predominately driven by managerial objectives. Thompson
(1997, p. 39) has argued that this mechanism is comparable to that provided by the market for
corporate control in the joint stock sector, which “works to eliminate underperforming
mutuals and transfer their assets to other societies within the sector”. The second
characterisation is that the merger process reflects direct intervention by regulators to promote
efficiency and stability within the financial system. Moreover, regulatory constraints placed
upon credit unions may highlight mergers as a means of increasing capital base and operative
efficiency in the increasingly competitive financial services industry. The final
characterisation is that notwithstanding the commercial and regulatory imperative discussed
earlier, the notion of a bond of association may exert a strong influence on merger activity
through both commercial and ideological concerns.
2. Empirical methodology
6
The data used in this study consists of annual observations of all Australian credit unions.
All data is sourced from the Australian Prudential Regulation Authority (APRA) and its
immediate predecessor the Australian Financial Institutions Commission (AFIC). The time
period selected is the three financial years 1992/93 to 1994/95. The total number of credit
unions in operation and the number of merging and acquiring credit unions vary over the
sample period. Of the 323 credit unions in operation in 1992/93, 19 institutions were
‘acquired’ in 1993/94 with 15 credit unions ‘acquiring’ one other credit union, and 2 credit
unions acquiring more than one credit union in the same year. Of the 304 credit unions
remaining in operation in 1993/93, 16 credit unions subsequently merged with 14 acquiring
credit unions in 1994/95. Of these, two credit unions were acquired by the same acquiring
credit union and one credit union merged with a building society. Finally, 9 credit unions
were acquired by 9 credit unions in 1995/96 from a total 1994/95 population of 290 credit
unions. A more extensive set of time-series data would, of course, be more valuable.
Unfortunately, a national framework for the prudential supervision of State-based non-bank
deposit-taking institutions (along with the requisite database) was only established with the
creation of AFIC in July 1992.
A pooled time-series, cross-sectional multinomial logit model with an assumption of
common effects is used to analyse the factors that influence M&A activity in cooperative
deposit-taking institutions. In any given year, a credit union has three possible (unordered)
outcomes: (i) be acquired by another credit union; (ii) acquire another credit union; or (iii)
maintain the status quo. Hence the following model is estimated:
( ) . ,...,1 ,0,Prob
1
'
'
Jje
ejY J
j
x
x
iij
ij
===
∑=
β
β
(1)
where the probability of the occurrence of the dependent variable, j (indicating each credit
union’s M&A status), is thought to depend on a set of financial, managerial and regulatory
factors, x, and β is a set of parameters to be estimated. Of course, several alternative models
could be equally well used. For example, Cyree et al. (2000) use a two-stage logistic
regression approach to estimate the probability of a particular growth strategy, contingent on
the choice of the bank to grow.
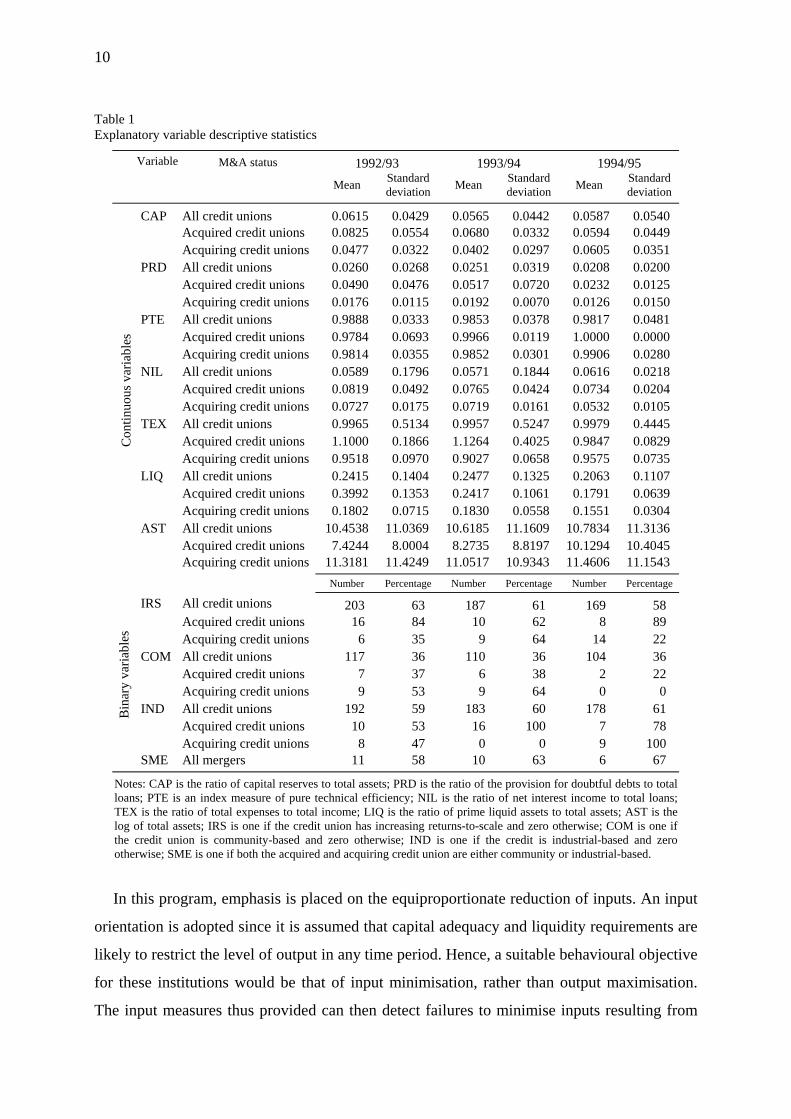
Descriptive statistics for the variables contained in the explanatory vector x for each of the
three financial years are presented in Table 1. These variables represent various aspects of
7
firm performance and are structured in accordance with a CAMEL (capital structure, asset
quality, management ability, earnings and liquidity) regulatory classification system. The
variables used to represent various aspects of credit union performance are comparable to
those employed by Thompson (1997) in an analysis of mergers in UK building societies.
The first variable in Table 1 relates to the role of capital structure in determining the
likelihood of merger or acquisition in credit unions. Capital is of particular concern in
depository financial institutions of this type because of their low net worth and highly
leveraged nature, which creates a potential for failure should there be a sudden withdrawal of
deposits. The measure of capital within each institution is defined as the ratio of reserves
(including permanent share capital, asset revaluations and retained earnings) to total assets
(CAP). All other things being equal, an acquired (acquiring) credit union should have a
relatively lower (higher) level of capital (Berger et al., 1993; 1999). A negative coefficient is
hypothesised for acquired credit unions and a positive coefficient for acquiring credit unions.
The second variable relates to the asset management activities of each credit union. Asset
quality measures are concerned with assessing the default or credit risk of the loan portfolio,
as well as the allocation of the asset portfolio between liquid investments and loans. One
measure used is the ratio of provision for doubtful debts expense to total loans (PRD). The ex
ante sign on this coefficient is thought to be positive (negative) for acquired (acquiring) credit
unions, reflecting in part the extent of asset diversification and the impact of asset risk on
merger activity.
The next two variables included in the regression relate to management ability vis-à-vis
technical efficiency and the scale of operations in relation to scale efficiency. The method
used to measure efficiency in these credit unions is based upon data envelopment analysis
(DEA), a mathematical programming approach to frontier estimation pioneered in Charnes et
al. (1978) and extended in Banker et al., (1984). Suitable introductions to DEA may be found
in Coelli et al. (1997) and Cooper et al. (2000). Measuring efficiency in this manner is
consistent with both the recent literature associated with the efficiency analysis of deposit-
taking institutions in general, including Elyasiani et al., (1994), Favero and Papi (1995),
Miller and Noulas (1996), and with a large number of past empirical approaches to efficiency
measurement in non-bank financial institutions, notably Piesse and Townsend (1995), Drake
and Weyman-Jones (1996) and Worthington (1998; 1999; 2000). Berger and Humphrey
(1997) provide a comprehensive survey of the various approaches to efficiency measurement
in financial institutions.

8
In brief, the advantages and disadvantages of the DEA approach to efficiency measurement
are as follows. To start with, one obvious problem with DEA is that in contrast to the
econometric approaches to efficiency measurement it is both nonparametric and
nonstochastic. Thus, no accommodation is made for the types of bias resulting from
environmental heterogeneity, external shocks, measurement error, and omitted variables.
Consequently, the entire deviation from the frontier is assessed as being the result of
inefficiency. This may lead to either an under or over-statement of the level of inefficiency.
However, there a number of benefits implicit in the mathematical programming approach
that makes it attractive on a theoretical level. First, given its nonparametric basis it is
relatively easy to alter the specification of inputs and outputs and thereby the formulation of
the production correspondence relating inputs to outputs. Thus, in cases where the usual
axioms of production activity breakdown (i.e. profit maximisation) then the programming
approach may offer useful insights into the efficiency of these types of industries. This is
especially the case with mutual financial institutions. Second, when using the alternative
econometric approach considerable structure is imposed upon the data from both stringent
parametric form and distributional assumptions regarding both inefficiency and, in the case of
stochastic frontiers, statistical noise. These considerations, and the natural emphasis of DEA
on the notion of ‘best-practice’ performance, make it an attractive method of measuring
efficiency in credit unions.
The computational procedure used to implement the DEA approach to efficiency
measurement is presented briefly as follows. Consider N credit unions each producing M
different outputs using K different inputs in a particular time period. The K×N input matrix, X,
and the M×N output matrix, Y, represent the data of all N credit unions, while for the
individual credit union these are represented by the vectors xi and yi. The efficiency of each
credit union can be determined from the solution to the following linear program:
000y- s.t.
min
i
,
≥≥−≥+
λλθλ
θλθ
XxY
i
(2)
where yi is the vector of outputs produced by the ith credit union, xi is the vector of inputs
used by the ith credit union, i runs from 1 to N, and j equals 1, 2, ..., N, θ is a scalar and λ is a
N×1 vector of constants. The value of θ will be the technical efficiency score for a particular
credit union. It will satisfy θ ≤ 1, with a value of 1 indicating a point on the frontier, and

9
hence a technically efficient credit union. The value of θ ≤ 1 identifies the amount of any
inefficiency that may be present.
10
Table 1 Explanatory variable descriptive statistics
Variable M&A status 1992/93 1993/94 1994/95 Mean Standard
deviation Mean Standard deviation Mean Standard
deviation
CAP All credit unions 0.0615 0.0429 0.0565 0.0442 0.0587 0.0540 Acquired credit unions 0.0825 0.0554 0.0680 0.0332 0.0594 0.0449 Acquiring credit unions 0.0477 0.0322 0.0402 0.0297 0.0605 0.0351 PRD All credit unions 0.0260 0.0268 0.0251 0.0319 0.0208 0.0200 Acquired credit unions 0.0490 0.0476 0.0517 0.0720 0.0232 0.0125 Acquiring credit unions 0.0176 0.0115 0.0192 0.0070 0.0126 0.0150 PTE All credit unions 0.9888 0.0333 0.9853 0.0378 0.9817 0.0481 Acquired credit unions 0.9784 0.0693 0.9966 0.0119 1.0000 0.0000 Acquiring credit unions 0.9814 0.0355 0.9852 0.0301 0.9906 0.0280 NIL All credit unions 0.0589 0.1796 0.0571 0.1844 0.0616 0.0218 Acquired credit unions 0.0819 0.0492 0.0765 0.0424 0.0734 0.0204 Acquiring credit unions 0.0727 0.0175 0.0719 0.0161 0.0532 0.0105 TEX All credit unions 0.9965 0.5134 0.9957 0.5247 0.9979 0.4445 Acquired credit unions 1.1000 0.1866 1.1264 0.4025 0.9847 0.0829 Acquiring credit unions 0.9518 0.0970 0.9027 0.0658 0.9575 0.0735 LIQ All credit unions 0.2415 0.1404 0.2477 0.1325 0.2063 0.1107 Acquired credit unions 0.3992 0.1353 0.2417 0.1061 0.1791 0.0639 Acquiring credit unions 0.1802 0.0715 0.1830 0.0558 0.1551 0.0304 AST All credit unions 10.4538 11.0369 10.6185 11.1609 10.7834 11.3136 Acquired credit unions 7.4244 8.0004 8.2735 8.8197 10.1294 10.4045
Con
tinuo
us v
aria
bles
Acquiring credit unions 11.3181 11.4249 11.0517 10.9343 11.4606 11.1543 Number Percentage Number Percentage Number Percentage
IRS All credit unions 203 63 187 61 169 58 Acquired credit unions 16 84 10 62 8 89 Acquiring credit unions 6 35 9 64 14 22 COM All credit unions 117 36 110 36 104 36 Acquired credit unions 7 37 6 38 2 22 Acquiring credit unions 9 53 9 64 0 0 IND All credit unions 192 59 183 60 178 61 Acquired credit unions 10 53 16 100 7 78 Acquiring credit unions 8 47 0 0 9 100
Bin
ary
varia
bles
SME All mergers 11 58 10 63 6 67
Notes: CAP is the ratio of capital reserves to total assets; PRD is the ratio of the provision for doubtful debts to total loans; PTE is an index measure of pure technical efficiency; NIL is the ratio of net interest income to total loans; TEX is the ratio of total expenses to total income; LIQ is the ratio of prime liquid assets to total assets; AST is the log of total assets; IRS is one if the credit union has increasing returns-to-scale and zero otherwise; COM is one if the credit union is community-based and zero otherwise; IND is one if the credit is industrial-based and zero otherwise; SME is one if both the acquired and acquiring credit union are either community or industrial-based.
In this program, emphasis is placed on the equiproportionate reduction of inputs. An input
orientation is adopted since it is assumed that capital adequacy and liquidity requirements are
likely to restrict the level of output in any time period. Hence, a suitable behavioural objective
for these institutions would be that of input minimisation, rather than output maximisation.
The input measures thus provided can then detect failures to minimise inputs resulting from
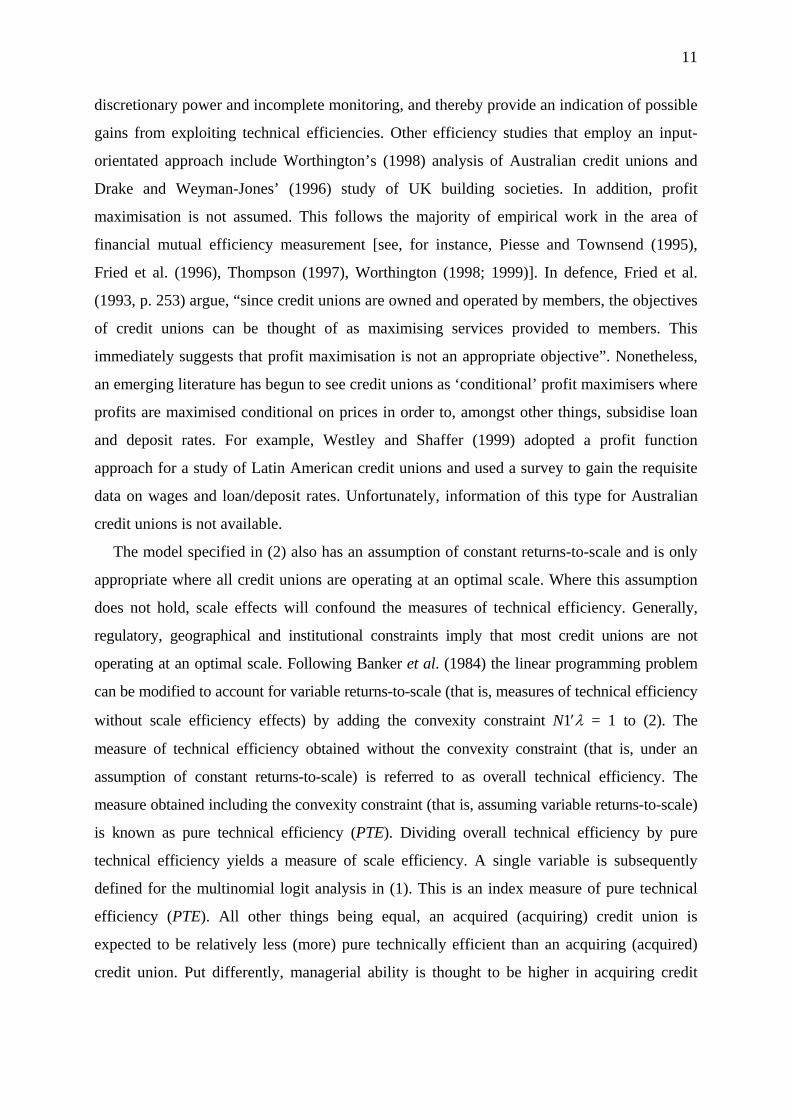
11
discretionary power and incomplete monitoring, and thereby provide an indication of possible
gains from exploiting technical efficiencies. Other efficiency studies that employ an input-
orientated approach include Worthington’s (1998) analysis of Australian credit unions and
Drake and Weyman-Jones’ (1996) study of UK building societies. In addition, profit
maximisation is not assumed. This follows the majority of empirical work in the area of
financial mutual efficiency measurement [see, for instance, Piesse and Townsend (1995),
Fried et al. (1996), Thompson (1997), Worthington (1998; 1999)]. In defence, Fried et al.
(1993, p. 253) argue, “since credit unions are owned and operated by members, the objectives
of credit unions can be thought of as maximising services provided to members. This
immediately suggests that profit maximisation is not an appropriate objective”. Nonetheless,
an emerging literature has begun to see credit unions as ‘conditional’ profit maximisers where
profits are maximised conditional on prices in order to, amongst other things, subsidise loan
and deposit rates. For example, Westley and Shaffer (1999) adopted a profit function
approach for a study of Latin American credit unions and used a survey to gain the requisite
data on wages and loan/deposit rates. Unfortunately, information of this type for Australian
credit unions is not available.
The model specified in (2) also has an assumption of constant returns-to-scale and is only
appropriate where all credit unions are operating at an optimal scale. Where this assumption
does not hold, scale effects will confound the measures of technical efficiency. Generally,
regulatory, geographical and institutional constraints imply that most credit unions are not
operating at an optimal scale. Following Banker et al. (1984) the linear programming problem
can be modified to account for variable returns-to-scale (that is, measures of technical efficiency
without scale efficiency effects) by adding the convexity constraint N1′λ = 1 to (2). The
measure of technical efficiency obtained without the convexity constraint (that is, under an
assumption of constant returns-to-scale) is referred to as overall technical efficiency. The
measure obtained including the convexity constraint (that is, assuming variable returns-to-scale)
is known as pure technical efficiency (PTE). Dividing overall technical efficiency by pure
technical efficiency yields a measure of scale efficiency. A single variable is subsequently
defined for the multinomial logit analysis in (1). This is an index measure of pure technical
efficiency (PTE). All other things being equal, an acquired (acquiring) credit union is
expected to be relatively less (more) pure technically efficient than an acquiring (acquired)
credit union. Put differently, managerial ability is thought to be higher in acquiring credit
12
unions than acquired credit unions. A negative (positive) coefficient is expected for acquired
(acquiring) credit unions.
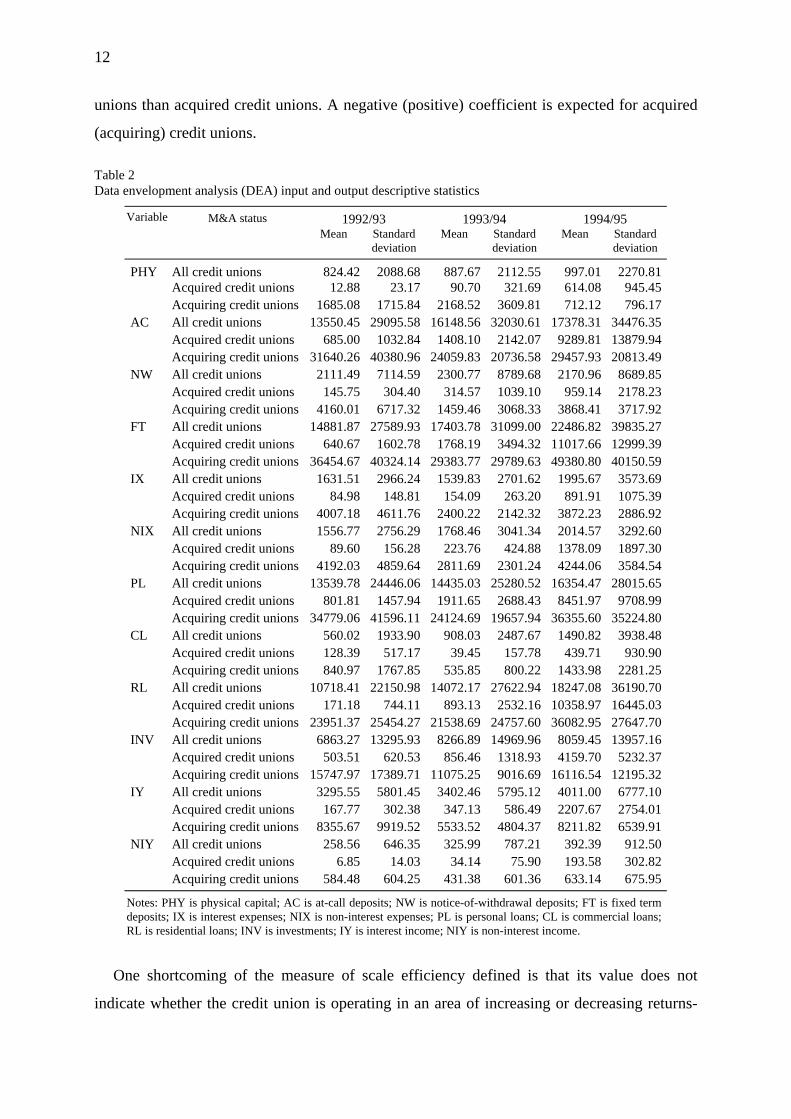
Table 2 Data envelopment analysis (DEA) input and output descriptive statistics
Variable M&A status 1992/93 1993/94 1994/95 Mean Standard
deviation Mean Standard
deviation Mean Standard
deviation
PHY All credit unions 824.42 2088.68 887.67 2112.55 997.01 2270.81 Acquired credit unions 12.88 23.17 90.70 321.69 614.08 945.45 Acquiring credit unions 1685.08 1715.84 2168.52 3609.81 712.12 796.17AC All credit unions 13550.45 29095.58 16148.56 32030.61 17378.31 34476.35 Acquired credit unions 685.00 1032.84 1408.10 2142.07 9289.81 13879.94 Acquiring credit unions 31640.26 40380.96 24059.83 20736.58 29457.93 20813.49NW All credit unions 2111.49 7114.59 2300.77 8789.68 2170.96 8689.85 Acquired credit unions 145.75 304.40 314.57 1039.10 959.14 2178.23 Acquiring credit unions 4160.01 6717.32 1459.46 3068.33 3868.41 3717.92FT All credit unions 14881.87 27589.93 17403.78 31099.00 22486.82 39835.27 Acquired credit unions 640.67 1602.78 1768.19 3494.32 11017.66 12999.39 Acquiring credit unions 36454.67 40324.14 29383.77 29789.63 49380.80 40150.59IX All credit unions 1631.51 2966.24 1539.83 2701.62 1995.67 3573.69 Acquired credit unions 84.98 148.81 154.09 263.20 891.91 1075.39 Acquiring credit unions 4007.18 4611.76 2400.22 2142.32 3872.23 2886.92NIX All credit unions 1556.77 2756.29 1768.46 3041.34 2014.57 3292.60 Acquired credit unions 89.60 156.28 223.76 424.88 1378.09 1897.30 Acquiring credit unions 4192.03 4859.64 2811.69 2301.24 4244.06 3584.54PL All credit unions 13539.78 24446.06 14435.03 25280.52 16354.47 28015.65 Acquired credit unions 801.81 1457.94 1911.65 2688.43 8451.97 9708.99 Acquiring credit unions 34779.06 41596.11 24124.69 19657.94 36355.60 35224.80CL All credit unions 560.02 1933.90 908.03 2487.67 1490.82 3938.48 Acquired credit unions 128.39 517.17 39.45 157.78 439.71 930.90 Acquiring credit unions 840.97 1767.85 535.85 800.22 1433.98 2281.25RL All credit unions 10718.41 22150.98 14072.17 27622.94 18247.08 36190.70 Acquired credit unions 171.18 744.11 893.13 2532.16 10358.97 16445.03 Acquiring credit unions 23951.37 25454.27 21538.69 24757.60 36082.95 27647.70INV All credit unions 6863.27 13295.93 8266.89 14969.96 8059.45 13957.16 Acquired credit unions 503.51 620.53 856.46 1318.93 4159.70 5232.37 Acquiring credit unions 15747.97 17389.71 11075.25 9016.69 16116.54 12195.32IY All credit unions 3295.55 5801.45 3402.46 5795.12 4011.00 6777.10 Acquired credit unions 167.77 302.38 347.13 586.49 2207.67 2754.01 Acquiring credit unions 8355.67 9919.52 5533.52 4804.37 8211.82 6539.91NIY All credit unions 258.56 646.35 325.99 787.21 392.39 912.50 Acquired credit unions 6.85 14.03 34.14 75.90 193.58 302.82 Acquiring credit unions 584.48 604.25 431.38 601.36 633.14 675.95
Notes: PHY is physical capital; AC is at-call deposits; NW is notice-of-withdrawal deposits; FT is fixed term deposits; IX is interest expenses; NIX is non-interest expenses; PL is personal loans; CL is commercial loans; RL is residential loans; INV is investments; IY is interest income; NIY is non-interest income.
One shortcoming of the measure of scale efficiency defined is that its value does not
indicate whether the credit union is operating in an area of increasing or decreasing returns-

13
to-scale. This may be determined by imposing non-increasing returns-to-scale in (2) by
replacing the N1′λ=1 restraint with N1′λ≤1. If the technical efficiency score under an
assumption of non-increasing returns-to-scale is equal to the score obtained under variable
returns-to-scale then decreasing returns to scale apply. If they are unequal then increasing
returns-to-scale exist for that credit union. The fourth variable defined is a dummy variable
indicating the presence of increasing returns-to-scale (IRS). In the short-term, scale may be
beyond the control of managers, however it is expected that credit unions operating at a
smaller than optimal scale may be acquired.
The inputs and outputs employed in the DEA approach are detailed in Table 2 (in
thousands of Australian dollars), and follow the intermediation approach to modelling
financial institution behaviour. In this approach credit unions combine physical capital (PHY),
at call deposits (AC), notice-of-withdrawal deposits (NW) and fixed term deposits (FT), along
with interest (IX) and non-interest expenses (NIX), to produce personal loans (PL),
commercial loans (CL) residential loans (RL), investments (INV), interest (IY) and non-
interest income (NIY). In terms of specific studies, the approach is most consistent with the
value-added intermediation approach used by Berg et al. (1993), Favero and Papi (1995) and
Fried et al. (1996).
The simple descriptive statistics in Table 2 already highlight some interesting differences
between acquiring and acquired credit unions and credit unions as a whole. Turning first to
acquired credit unions, in each of the three years one-tailed t-tests for equality of means
(assuming unequal variances) reject the null hypothesis of equality at the .05 level for each of
the twelve variables. These tests then indicate that the average dollar value of physical capital,
deposits and loans (across various categories), investments and interest and non-interest
expenses and income in acquired credit unions is significantly less than that across credit
unions as a whole. Identical one-tailed t-tests are conducted for acquiring credit unions. In
this instance, one-tailed t-tests for equality of means (assuming unequal variances) reject the
null hypothesis of equality at the .05 level for all variables in all years with the exception of
NW and CL in 1992/93, RL, INV, IY and NIY in 1993/94 and PHY, NW, PL, CL and NIY in
1994/95. When compared to credit unions as a whole, acquired credit unions have lower mean
values across all balance sheet and profit and loss items, while acquiring credit unions
generally have higher mean values, though some exceptions are noted.
The next two explanatory variables in Table 1 relate to credit union profitability; namely,
the ratio of net interest income to total loans (NIL) and the ratio of total expense to total
14
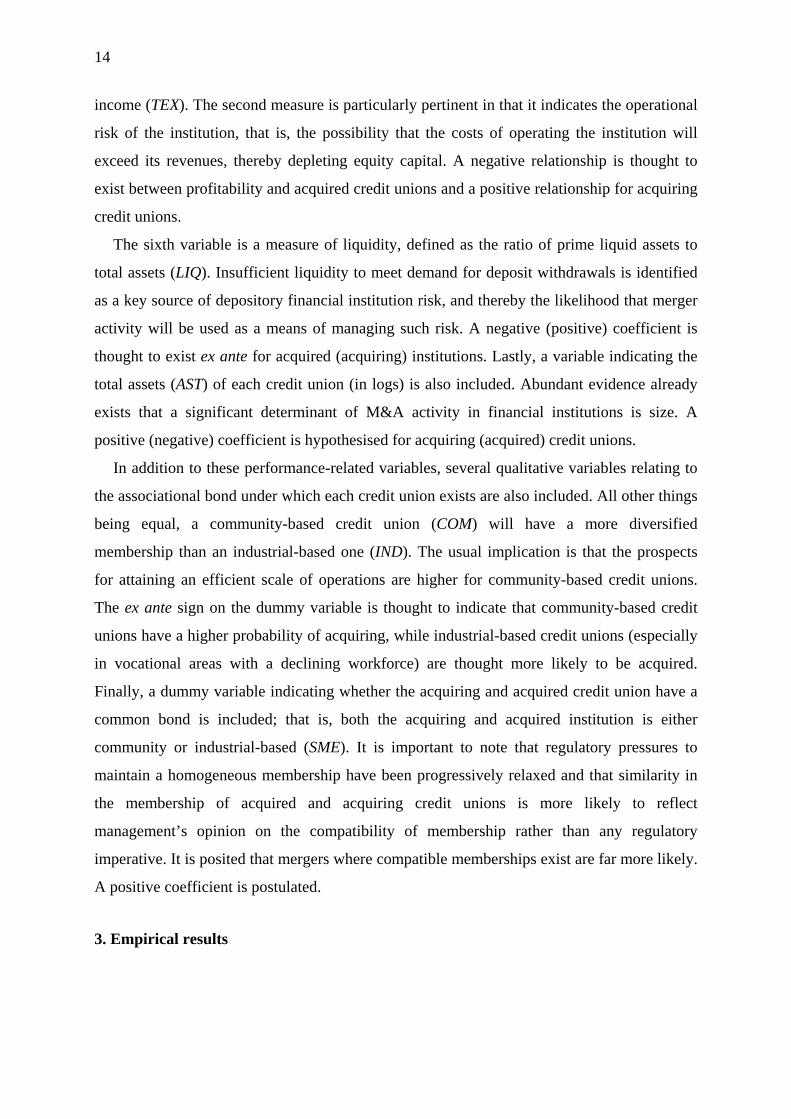
income (TEX). The second measure is particularly pertinent in that it indicates the operational
risk of the institution, that is, the possibility that the costs of operating the institution will
exceed its revenues, thereby depleting equity capital. A negative relationship is thought to
exist between profitability and acquired credit unions and a positive relationship for acquiring
credit unions.
The sixth variable is a measure of liquidity, defined as the ratio of prime liquid assets to
total assets (LIQ). Insufficient liquidity to meet demand for deposit withdrawals is identified
as a key source of depository financial institution risk, and thereby the likelihood that merger
activity will be used as a means of managing such risk. A negative (positive) coefficient is
thought to exist ex ante for acquired (acquiring) institutions. Lastly, a variable indicating the
total assets (AST) of each credit union (in logs) is also included. Abundant evidence already
exists that a significant determinant of M&A activity in financial institutions is size. A
positive (negative) coefficient is hypothesised for acquiring (acquired) credit unions.
In addition to these performance-related variables, several qualitative variables relating to
the associational bond under which each credit union exists are also included. All other things
being equal, a community-based credit union (COM) will have a more diversified
membership than an industrial-based one (IND). The usual implication is that the prospects
for attaining an efficient scale of operations are higher for community-based credit unions.
The ex ante sign on the dummy variable is thought to indicate that community-based credit
unions have a higher probability of acquiring, while industrial-based credit unions (especially
in vocational areas with a declining workforce) are thought more likely to be acquired.
Finally, a dummy variable indicating whether the acquiring and acquired credit union have a
common bond is included; that is, both the acquiring and acquired institution is either
community or industrial-based (SME). It is important to note that regulatory pressures to
maintain a homogeneous membership have been progressively relaxed and that similarity in
the membership of acquired and acquiring credit unions is more likely to reflect
management’s opinion on the compatibility of membership rather than any regulatory
imperative. It is posited that mergers where compatible memberships exist are far more likely.
A positive coefficient is postulated.
3. Empirical results
15
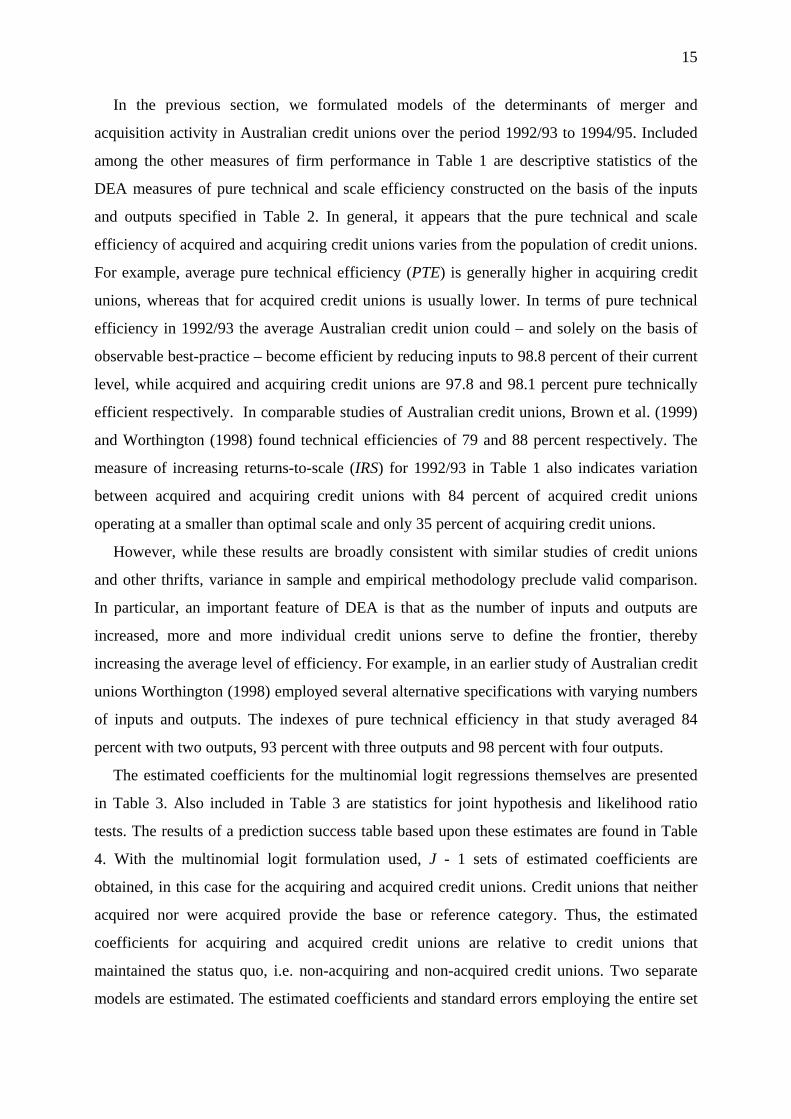
In the previous section, we formulated models of the determinants of merger and
acquisition activity in Australian credit unions over the period 1992/93 to 1994/95. Included
among the other measures of firm performance in Table 1 are descriptive statistics of the
DEA measures of pure technical and scale efficiency constructed on the basis of the inputs
and outputs specified in Table 2. In general, it appears that the pure technical and scale
efficiency of acquired and acquiring credit unions varies from the population of credit unions.
For example, average pure technical efficiency (PTE) is generally higher in acquiring credit
unions, whereas that for acquired credit unions is usually lower. In terms of pure technical
efficiency in 1992/93 the average Australian credit union could – and solely on the basis of
observable best-practice – become efficient by reducing inputs to 98.8 percent of their current
level, while acquired and acquiring credit unions are 97.8 and 98.1 percent pure technically
efficient respectively. In comparable studies of Australian credit unions, Brown et al. (1999)
and Worthington (1998) found technical efficiencies of 79 and 88 percent respectively. The
measure of increasing returns-to-scale (IRS) for 1992/93 in Table 1 also indicates variation
between acquired and acquiring credit unions with 84 percent of acquired credit unions
operating at a smaller than optimal scale and only 35 percent of acquiring credit unions.
However, while these results are broadly consistent with similar studies of credit unions
and other thrifts, variance in sample and empirical methodology preclude valid comparison.
In particular, an important feature of DEA is that as the number of inputs and outputs are
increased, more and more individual credit unions serve to define the frontier, thereby
increasing the average level of efficiency. For example, in an earlier study of Australian credit
unions Worthington (1998) employed several alternative specifications with varying numbers
of inputs and outputs. The indexes of pure technical efficiency in that study averaged 84
percent with two outputs, 93 percent with three outputs and 98 percent with four outputs.
The estimated coefficients for the multinomial logit regressions themselves are presented
in Table 3. Also included in Table 3 are statistics for joint hypothesis and likelihood ratio
tests. The results of a prediction success table based upon these estimates are found in Table
4. With the multinomial logit formulation used, J - 1 sets of estimated coefficients are
obtained, in this case for the acquiring and acquired credit unions. Credit unions that neither
acquired nor were acquired provide the base or reference category. Thus, the estimated
coefficients for acquiring and acquired credit unions are relative to credit unions that
maintained the status quo, i.e. non-acquiring and non-acquired credit unions. Two separate
models are estimated. The estimated coefficients and standard errors employing the entire set
16
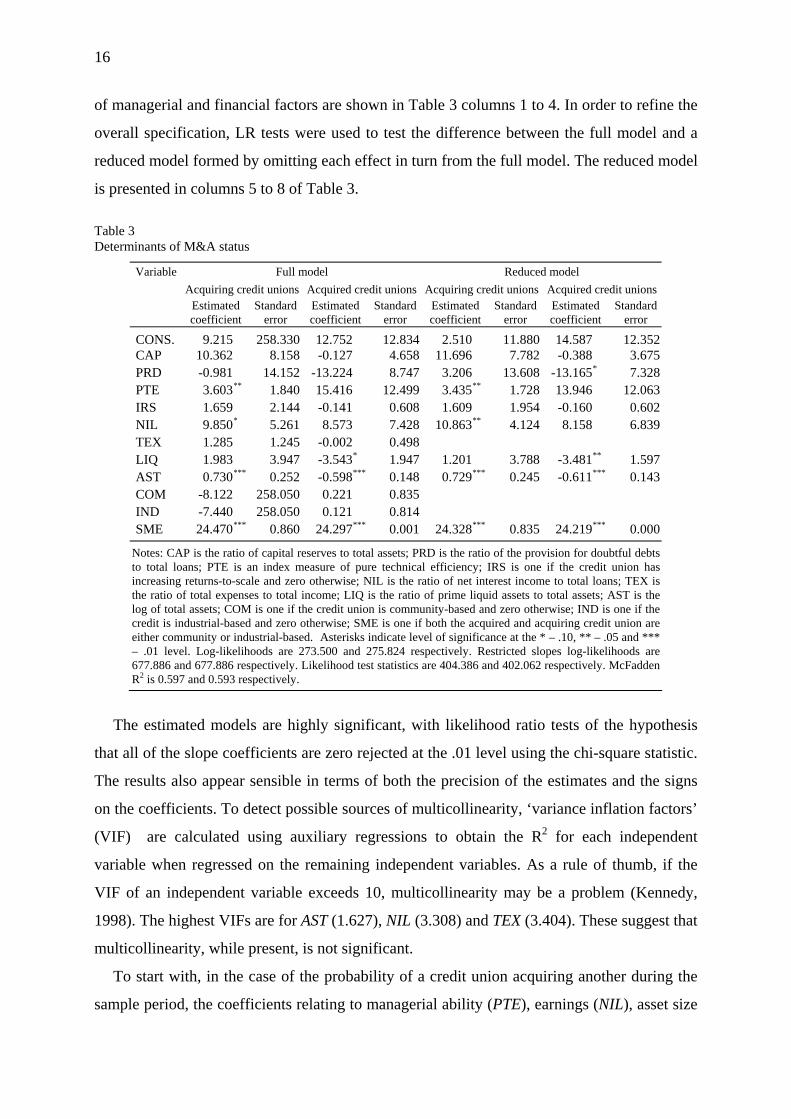
of managerial and financial factors are shown in Table 3 columns 1 to 4. In order to refine the
overall specification, LR tests were used to test the difference between the full model and a
reduced model formed by omitting each effect in turn from the full model. The reduced model
is presented in columns 5 to 8 of Table 3.
Table 3 Determinants of M&A status
Variable Full model Reduced model Acquiring credit unions Acquired credit unions Acquiring credit unions Acquired credit unions Estimated
coefficient Standard
error Estimated coefficient
Standard error
Estimated coefficient
Standard error
Estimated coefficient
Standard error
CONS. 9.215 258.330 12.752 12.834 2.510 11.880 14.587 12.352CAP 10.362 8.158 -0.127 4.658 11.696 7.782 -0.388 3.675PRD -0.981 14.152 -13.224 8.747 3.206 13.608 -13.165 * 7.328PTE 3.603** 1.840 15.416 12.499 3.435** 1.728 13.946 12.063IRS 1.659 2.144 -0.141 0.608 1.609 1.954 -0.160 0.602NIL 9.850* 5.261 8.573 7.428 10.863** 4.124 8.158 6.839TEX 1.285 1.245 -0.002 0.498 LIQ 1.983 3.947 -3.543* 1.947 1.201 3.788 -3.481 ** 1.597AST 0.730*** 0.252 -0.598*** 0.148 0.729*** 0.245 -0.611 *** 0.143COM -8.122 258.050 0.221 0.835 IND -7.440 258.050 0.121 0.814 SME 24.470*** 0.860 24.297*** 0.001 24.328*** 0.835 24.219 *** 0.000
Notes: CAP is the ratio of capital reserves to total assets; PRD is the ratio of the provision for doubtful debts to total loans; PTE is an index measure of pure technical efficiency; IRS is one if the credit union has increasing returns-to-scale and zero otherwise; NIL is the ratio of net interest income to total loans; TEX is the ratio of total expenses to total income; LIQ is the ratio of prime liquid assets to total assets; AST is the log of total assets; COM is one if the credit union is community-based and zero otherwise; IND is one if the credit is industrial-based and zero otherwise; SME is one if both the acquired and acquiring credit union are either community or industrial-based. Asterisks indicate level of significance at the * – .10, ** – .05 and *** – .01 level. Log-likelihoods are 273.500 and 275.824 respectively. Restricted slopes log-likelihoods are 677.886 and 677.886 respectively. Likelihood test statistics are 404.386 and 402.062 respectively. McFadden R2 is 0.597 and 0.593 respectively.
The estimated models are highly significant, with likelihood ratio tests of the hypothesis
that all of the slope coefficients are zero rejected at the .01 level using the chi-square statistic.
The results also appear sensible in terms of both the precision of the estimates and the signs
on the coefficients. To detect possible sources of multicollinearity, ‘variance inflation factors’
(VIF) are calculated using auxiliary regressions to obtain the R2 for each independent
variable when regressed on the remaining independent variables. As a rule of thumb, if the
VIF of an independent variable exceeds 10, multicollinearity may be a problem (Kennedy,
1998). The highest VIFs are for AST (1.627), NIL (3.308) and TEX (3.404). These suggest that
multicollinearity, while present, is not significant.
To start with, in the case of the probability of a credit union acquiring another during the
sample period, the coefficients relating to managerial ability (PTE), earnings (NIL), asset size

17
(ASS) and similarity in associational bond (SME) are significant and conform to the
hypothesised sign. The results indicate that the larger (AST), more profitable (NIL) and more
pure technically efficient (PTE) a credit union relative to the average credit union in the
sample that maintains the status quo, the more likely it will acquire another credit union.
Thompson (1997) likewise found that credit union size (by assets) was significant in
determining takeover status in UK mutuals. These results are broadly comparable to the
reduced model except that the levels of significance of the individual coefficients have
generally increased.
Turning to the acquired credit unions, the estimated coefficients in both the full and
reduced model indicate that credit unions that are smaller in terms of the size of total assets
(AST), have a lower level of liquidity (LIQ) and are of the same associational bond (SME) as
the acquiring credit union are more likely to be acquired, relative to the average credit union
that is neither acquired nor acquires another. The fact that pure technical efficiency, as a
proxy for managerial ability, is insignificant, accords with Brown et al. (1999, p. 15) who
concluded on the basis of univariate statistics that ‘exiting’ credit unions “…were as efficient
as the industry as a whole but included a number of small credit unions”. The major
difference between the full and reduced model for acquired credit unions is that the ratio of
provision for doubtful debts expense to total loans (PRD) is significant and negative
suggesting that credit unions with a highly risky asset portfolio are less likely to be acquired,
relative to a credit union that maintains the status quo. These results have important
implications for the Australian credit union industry, especially in regards to efficiency. For
example, since acquiring credit unions have higher efficiency on average than the acquired,
the industry should become more efficient as a whole through M&A activity. However, this is
based on the assumption that the efficiency of the acquired credit union is raised to the level
of the acquiring credit union.
Finally, the ability of the full and reduced models to accurately predict M&A outcomes in
credit unions is examined. Table 4 provides the predicted results for each different model. Of
the forty acquiring credit unions in the sample, the full model predicted 24 cases (60.0%)
correctly, and incorrectly identified 4 cases (10.0%) as acquired credit unions and 24 cases
(30%) as neither acquiring nor acquired credit unions. In terms of acquired credit unions, the
full model correctly predicted 22 cases (50.0%), and incorrectly identified 22 cases (50.0%)
as either acquiring credit unions or neither acquired nor acquiring credit unions. Lastly, of the
833 non-acquiring/acquired credit unions, the full model correctly identified all (100.0%) as
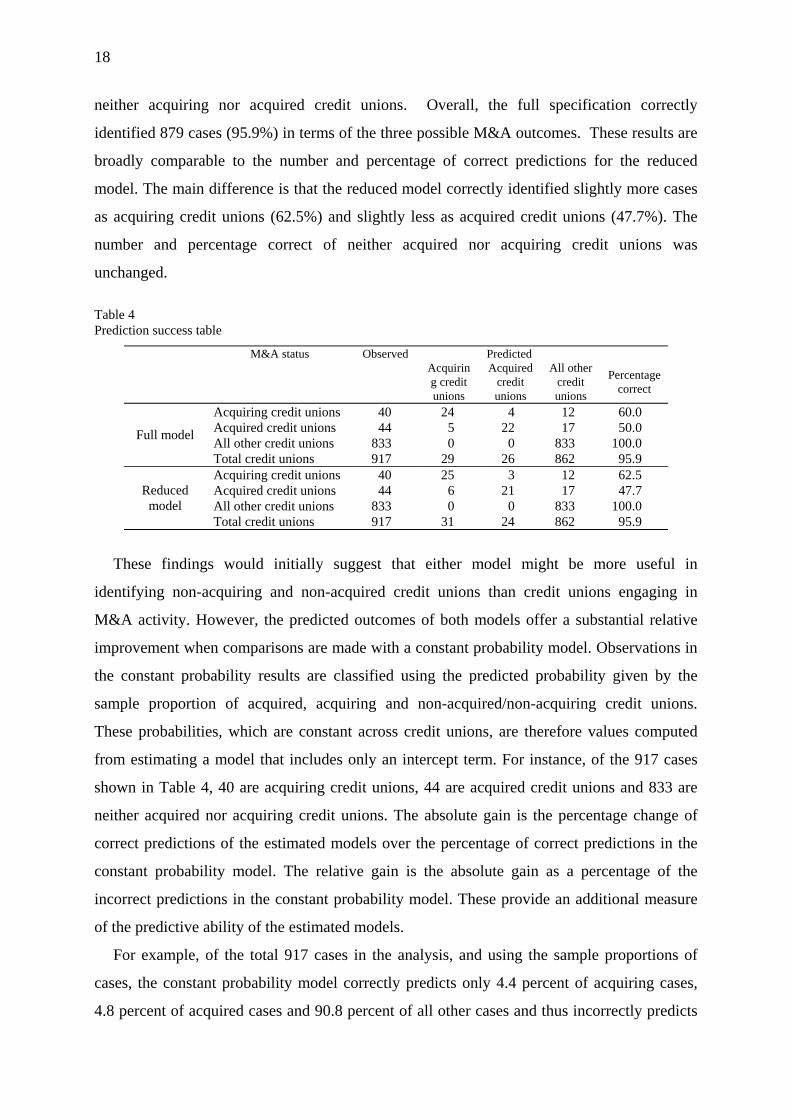
18
neither acquiring nor acquired credit unions. Overall, the full specification correctly
identified 879 cases (95.9%) in terms of the three possible M&A outcomes. These results are
broadly comparable to the number and percentage of correct predictions for the reduced
model. The main difference is that the reduced model correctly identified slightly more cases
as acquiring credit unions (62.5%) and slightly less as acquired credit unions (47.7%). The
number and percentage correct of neither acquired nor acquiring credit unions was
unchanged.
Table 4 Prediction success table
M&A status Observed Predicted
Acquiring credit unions
Acquired credit unions
All other credit unions
Percentage correct
Acquiring credit unions 40 24 4 12 60.0 Acquired credit unions 44 5 22 17 50.0 All other credit unions 833 0 0 833 100.0 Full model
Total credit unions 917 29 26 862 95.9 Acquiring credit unions 40 25 3 12 62.5 Acquired credit unions 44 6 21 17 47.7 All other credit unions 833 0 0 833 100.0
Reduced model
Total credit unions 917 31 24 862 95.9
These findings would initially suggest that either model might be more useful in
identifying non-acquiring and non-acquired credit unions than credit unions engaging in
M&A activity. However, the predicted outcomes of both models offer a substantial relative
improvement when comparisons are made with a constant probability model. Observations in
the constant probability results are classified using the predicted probability given by the
sample proportion of acquired, acquiring and non-acquired/non-acquiring credit unions.
These probabilities, which are constant across credit unions, are therefore values computed
from estimating a model that includes only an intercept term. For instance, of the 917 cases
shown in Table 4, 40 are acquiring credit unions, 44 are acquired credit unions and 833 are
neither acquired nor acquiring credit unions. The absolute gain is the percentage change of
correct predictions of the estimated models over the percentage of correct predictions in the
constant probability model. The relative gain is the absolute gain as a percentage of the
incorrect predictions in the constant probability model. These provide an additional measure
of the predictive ability of the estimated models.
For example, of the total 917 cases in the analysis, and using the sample proportions of
cases, the constant probability model correctly predicts only 4.4 percent of acquiring cases,
4.8 percent of acquired cases and 90.8 percent of all other cases and thus incorrectly predicts
19
95.6 percent of acquiring cases, 95.2 percent of acquired cases and 9.2 percent of all other
cases. The full model alone thus represents a 55.6 percent absolute increase and a 58.1
relative increase over the constant probability model for acquiring cases, a 45.2 percent
absolute and 47.5 percent relative increase for acquired cases, and a 9.2 percent absolute and
100.0 percent relative increase over all other cases. This indicates that the models employed
are very useful for predicting credit union M&A activity. Of course, these results are qualified
in the sense that the ability of the model to categorise credit unions is conducted using in-
sample data, whereas out-of-sample data (if available) would provide a more accurate and
less biased indicator of predictive ability.
4. Concluding remarks
The present study uses a multinomial logit model to investigate the influence of financial,
managerial and regulatory factors on the probability of a credit union acquiring or being
acquired during the period 1992/93 to 1994/95. The current paper extends empirical work in
this area in at least two ways. First, and as far as the author is aware, it represents the first
attempt to test these purported factors in the Australian institutional milieu. This is quite apart
from the fact that very few studies have examined the M&A process of financial mutuals in
general. Second, the paper incorporates nonparametric measures of pure technical and scale
efficiency as factors in the M&A process. This allows a more thorough examination of the
role of managerial ability and optimal scale size in M&A activity.
The study has identified several significant influences on M&A activity in Australian
credit unions. These include measures of financial performance, such as asset size, asset
management and liquidity, and regulatory factors, including affinity of associational bond.
The results also indicate that managerial ability, as proxied by nonparametric measures of
pure technical efficiency, is an important influence on M&A in credit unions, at least as far as
acquiring credit unions are concerned. This is a matter of some importance to regulators in
Australia. The suggestion is that M&A activity could potentiality increase the efficiency of
the industry as a whole assuming the efficiency of the acquired credit union is raised to that of
the acquiring credit union. If this is the case, then regulators interested in industry wide
efficiency gains could assist this process by, say, matching prospective acquiring (more
efficient) credit unions with suitable (less efficient) acquisitions. Other possible policy
changes by regulators could include the provision of advisory services to credit unions
20
regarding M&A procedure and assisting acquiring credit unions to quickly transfer more
efficient practices to operations that have been acquired. The ability of these models to
accurately predict M&A outcomes in credit unions was also examined. Of the acquiring credit
unions in the sample, the full model predicted 60 percent of cases correctly, 50 percent of
acquired cases correctly, and correctly identified all of the credit unions that neither acquired
nor were acquired. This suggests that relatively parsimonious models can provide accurate
predictions of M&A activity, at least in regards to financial mutuals.
There are at least four ways in which this research may be extended. First, it would be
useful to extend the methodology employed in the current study to measure post-merger
efficiency. This would provide more direct evidence as to whether mergers are beneficial to
the process of efficiency improvement in the banking system. A second extension would be to
more rigorously define the extant posited determinants of M&A activity, and extend the set of
explanatory variables within the confines of the available data. For example, the data
collected by the Australian Prudential Regulation Authority (APRA) also contains
information relating to the number of members, branches and agencies. These may serve to
identify whether M&A are undertaken for the purpose of acquiring distribution networks
and/or membership. Finally, similar techniques to the present study could be used to analyse
the determinants of M&A activity in related industry sectors, such as building societies, life
insurance companies and commercial banks. This may serve to highlight additional issues of
concern to policy-makers and other interested parties.
Acknowledgements
The author would like to thank participants at the 28th Annual Conference of Economists, La Trobe University, seminar participants at the University of Southern Queensland, and two anonymous referees for helpful comments on an earlier version of this paper. The assistance of the Australian Prudential Regulation Authority (APRA) in providing the requisite data and the financial support of an Australian Research Council (ARC) grant is also gratefully acknowledged.
References
Banker RD, Charnes A, Cooper WW. Some models for estimating technical and scale inefficiencies in data envelopment analysis. Mgt Sci 1984;30(9):1078–1092.
Berg AA, Førsund FR, Hjalmarsson L, Suominen M. Banking efficiency in the Nordic countries. J Bank & Fin 1993;17(2-3):371–388.
Berger AN, Demsetz RS and Strahan PE. The consolidation of the financial services industry: causes, consequences and implications for the future. J Bank & Fin. 1999;23(2-4):135–194.
21
Berger AN, Humphrey DB. Efficiency of financial institutions: International survey and directions for future research. Eur J Oper Res. 1997;98(2): 175–212.
Berger AN, Hunter WC, Timme SG. The efficiency of financial institutions: A review and preview of research past, present, and future. J Bank & Fin 1993;17(2-3):221–249.
Brown R, Brown R, O’Connor I. Efficiency, bond of association and exit patterns in credit unions: Australian evidence. Ann Pub & Coop Econ 1999;70(1):5–23.
Cebenoyan AS, Cooperman ES, Register CA, Hudgins SC. The relative efficiency of stock versus mutual S&Ls: A stochastic frontier approach. J Fin Serv Res 1993;7(2):154–170.
Charnes A, Cooper WW, Rhodes E. Measuring the efficiency of decision making units. Eur J Oper Res 1978;2(6):429–444.
Coelli T, Rao DSP, Battese GE. An introduction to efficiency and productivity analysis. Boston: Kluwer, 1997. Cooper WW, Seiford LM, Tone K. Data envelopment analysis: A comprehensive text with models, applications,
references and DEA-solver software. Boston: Kluwer, 2000. Cyree KB, Wansley JW, Boehm TP. Determinants of bank growth choice. J. Bank & Fin 2000;24(5):709–734. Davis K. Prudential regulation and cooperative financial institutions. Aust J Mgt 1994;8(1):31–46. Drake L, Weyman-Jones TG. Productive and allocative inefficiencies in U.K. building societies: A comparison
of non-parametric and stochastic frontier techniques. Manch Sch 1996;64(1):22–37. Elyasiani E, Mehdian S, Rezvanian R. An empirical test of association between production and financial
performance: The case of the commercial banking industry. App Fin Econ 1994;4(1):55–59. Favero CA, Papi L. Technical efficiency and scale efficiency in the Italian banking sector: A non-parametric
approach. App Econ 1995;27(4):385–395. Fried HO, Lovell CAK, Turner JA. An analysis of the performance of university-affiliated credit unions. Comp
Oper Res 1996;23(4):375–384. Fried HO, Lovell CAK, Vanden Eekaut P. Evaluating the performance of US credit unions. J Bank & Fin.
1993:17(2-3): 251–265. Garden KE, Ralston DE. The x-efficiency and allocative efficiency effects of credit union mergers. J Int Fin
Mkts, Inst Mny 1999;9(3):285-301 Grabowski R, Mathur I, Rangan N. The role of takeovers in increasing efficiency. Mgl Decis Econ
1995;16(3):211-223. Grabowski R, Rangan N, Rezvanian R. Organisational forms in banking: An empirical investigation of cost
efficiency. J Bank & Fin 1993;17(2-3):531–538. Kennedy P. A Guide to Econometrics. Blackwell: Oxford, 1998. Miller SM, Noulas AG. The technical efficiency of large bank production. J Bank & Fin 1996;20(1):495–509. O’Brien KP. Thrift institutions: Building societies, credit unions and friendly societies, in The Australian
Financial System, MK Lewis, RH Wallace, eds., Longman Cheshire, Melbourne. 1993, pp. 83–135. Piesse J, Townsend R. The measurement of productive efficiency in UK building societies. App Fin Econ 1995;
5(2):397–407. Shaffer S. Can megamergers improve bank efficiency? J Bank & Fin 1993; 17(2-3):423–436. Thompson S. Take-over activity among financial mutuals: An analysis of target characteristics. J Bank & Fin
1997;21(1):37–53. Westley GD, Shaffer S. Credit union policies and performance in Latin America. J Bank & Fin
1999;23(9):1303–1329. Worthington AC. Cost efficiency in Australian non-bank financial institutions: A non-parametric approach. Acc
& Fin. 2000;40(1): 75–97. Worthington AC. Measuring technical efficiency in Australian credit unions. Manch Sch 1999;67(2):231–248. Worthington AC. Testing the association between production and financial performance: Evidence from a not-
for-profit cooperative setting. Ann Pub & Coop Econ 1998;69(1):67–84.