determinants of physical therapy use by compensated workers with musculoskeletal disorders
TRANSCRIPT

Determinants of Physical Therapy Use by Compensated Workerswith Musculoskeletal Disorders
Janneke Berecki-Gisolf • Alex Collie •
Roderick J. McClure
Published online: 7 August 2012
� Springer Science+Business Media, LLC 2012
Abstract Purpose The study aim was to quantify phys-
iotherapy service distribution among compensated workers
with musculoskeletal disorders, and identify risk factors for
under- and overuse. Andersen and Newman’s model of
service use determinants was adapted for a compensated
population, to provide a conceptual basis for the analyses.
Methods WorkSafe Victoria (Australia) workers’ com-
pensation claims were analysed retrospectively. Workers
with musculoskeletal disorders resulting in at least 10 days
off work were included if their claim commenced between
1-1-2001 and 1-1-2005 (n = 36,995). Physiotherapy use
over 4 years of follow-up was determined from service
payment data. Regression models were used relating indi-
vidual level predictors, regional physiotherapist supply and
the role of individual physiotherapists to service use.
Results Physiotherapy was used by 26,026 (70 %) workers.
Young age, male gender, working as a labourer, disorders
of the joints, and not being hospitalised were associated
with non-use. Use above the 90th percentile ([125 sessions
over 4 years) was considered ‘high use’: high users
accounted for 41 % of all use. Age 50–60, female gender,
working as tradespersons, and substantial hospital costs
were associated with high use. For workers living in the
most disadvantaged areas, use was positively associated
with supply. Negative binomial modelling of the role of
physiotherapists indicated that service providers were
associated with the number of sessions used. Conclusions
Physiotherapy services were not underused, but a small
group of patients had very high use. Recommendations to
limit overuse should be aimed at physiotherapists, and
these could include effective monitoring of adherence to
proposed treatment plans.
Keywords Physiotherapy � Workers’ compensation �Health service use � Musculoskeletal disorders
Introduction
Work-related injury and illness constitute a substantial
societal burden in terms of personal, social and economic
costs. In Australia in 2009–2010, about 640,700 (5.3 %) of
the 12 million people who were employed at some time
during the preceding year experienced a work-related
injury or illness [1]. The total amount paid by universal, no
fault workers’ compensation schemes in Australia in
2008–2009 was $6.9 billion, consisting of $3.8 billion of
direct payments (incapacity benefits such as income
replacement, permanent impairment lump sum entitlements
and legal costs), $1.6 billion in medical and other services
including rehabilitation and $1.5 billion insurance opera-
tional and administration costs [2].
The most common condition for which Australian
workers’ compensation claims are lodged are musculo-
skeletal disorders, (i.e., approximately 43 % of injury and
disease-related claims [3]) and physiotherapy is the allied
health service contributing to the largest portion of medical
costs (approximately 17 % [4]). The role of physiotherapy
in the management of musculoskeletal disorders is to help
reduce pain, restore function and educate patients about
how to manage their condition.
J. Berecki-Gisolf (&) � R. J. McClure
Monash Injury Research Institute, Monash University, Building
70 Clayton Campus, Melbourne 3800, Australia
e-mail: [email protected]
A. Collie
Institute for Safety, Compensation and Recovery Research
(ISCRR), Monash University, Level 11, 499 St Kilda Road,
Melbourne 3004, Victoria, Australia
123
J Occup Rehabil (2013) 23:63–73
DOI 10.1007/s10926-012-9382-0

Optimal use of allied health services requires that they
are provided to those who need them, and discontinued
when the services no longer contribute to recovery. Perhaps
the most widely cited, developed and discussed behav-
ioural model of health services use was first presented by
Andersen and Newman in 1973 [5, 6]. However, as this
model was designed to facilitate equitable distribution of
health services in the United States, the applicability of
the original model to health service use behaviour in an
Australian compensated workforce may be limited.
In Australia all jurisdictions have ‘no-fault’ workers’
compensation schemes providing income replacement and
coverage of medical costs to injured workers. Because under
these schemes the injured worker does not have substantial
out of pocket costs it would be expected that enabling factors
such as household income contained in the Anderson and
Newman model would be less likely to be an important
driver of service use. Drivers not included in the original
model are likely to be found within the definitions and reg-
ulations of the compensation scheme policy itself, i.e.,
boundaries regarding eligibility, choice of provider, and
duration and intensity of use are set by the scheme. The
interaction between the insurance schemes and health care
providers may also play a role in service uptake and con-
tinued use as full medical coverage may provide an incentive
for some health care providers to seek workers’ compensa-
tion patients and to protract the services they provide [7].
Previous studies have shown that receiving workers’ com-
pensation was positively associated with physiotherapy use
by individuals with lower back pain [8, 9], and that the cost
per episode of care was higher for workers’ compensation
patients than for patients with other insurance sources [7].
Together, these findings suggest that determinants of service
use for workers’ compensation patients are distinct from
those of other patients; service use drivers in this population
need to be assessed in order to achieve equity in service use
and optimal injury outcomes for workers.
The aims of this study were to quantify the distribution
of physiotherapy services among compensated workers
with musculoskeletal disorders, identifying non-users as
well as over-users. Andersen and Newman’s model of
service use determinants was extended for application in a
fully compensated population, and this was used as a
conceptual basis for studying determinants of physiother-
apy uptake and overuse. We hypothesised that despite
reimbursement of the cost, physiotherapy services are not
equitably distributed among compensated workers, and that
service uptake is determined by individual level factors
such as type and severity of the injury, but also by health
service characteristics, such as supply of physiotherapists
in the region. Furthermore we hypothesised that the health
service provider plays a role in determining the intensity of
physiotherapy use. In addressing the study aims, we
provide insight into opportunities to prevent unwanted
variation of physiotherapy services among compensated
workers with musculoskeletal disorders.
Methods
Conceptual Model
In 1973, Andersen and Newman proposed a theoretical
framework for health service uptake in the United States.
The purpose of the model was to explain patterns in use
that might assist the design of interventions to achieve
equitable distribution of services [5]. The framework
consists of societal determinants (including new technolo-
gies), health services system, and individual determinants
of health services utilisation. Various uses for and additions
to the model by others have been discussed by Andersen in
1995 [6]. In a fully compensated workforce, however,
financial barriers to allied health service use are removed,
under conditions set by the compensation system. We
therefore suggest that for application in this particular
setting the following additions would need to be made to
the Andersen and Newman model.
1. Compensation System The key addition is the com-
pensation system: eligibility for service reimburse-
ment, service provider choices, duration and frequency
of visits, and reimbursement caps are all determined by
compensation scheme policy.
2. Regulator The compensation scheme (in Australia) as
well as the health services system are regulated by the
government: for example, WorkSafe’s statutory obliga-
tions are spelt out in several acts of parliament such as the
Accident Compensation Act 1985 [10] and the Accident
Compensation (WorkCover Insurance) Act 1993 [11].
3. Provider Incentives A subset of compensated patients
within a population of partially or non-compensated
patients may create provider incentives of service
utilisation: this theoretical component is added to the
health services system
4. Individual Incentives Compensation scheme policy
may give rise to novel service use incentives for the
individual. For example, within the WorkSafe Victoria
scheme, a Certificate of Capacity is needed if the
injured workers has time off work or needs to work
modified duties. The initial certificate needs to be
completed by a medical practitioner, but an ongoing
Certificate of Capacity can be completed by a phys-
iotherapist, chiropractor or osteopath [12]: this may
provide an individual incentive for allied health ser-
vice use. Pending common law claims may also pro-
vide an incentive to continue treatment for the injury.
64 J Occup Rehabil (2013) 23:63–73
123

Thus we have developed a model (Fig. 1) based on
Andersen and Newman’s framework enhanced with pro-
posed drivers specific to a compensation environment, to
explain allied health service use in a compensated popu-
lation of injured workers. In this study, the proposed model
serves as a conceptual aid for analysing physiotherapist use
among compensated workers with musculoskeletal disor-
ders. Only parts of the model are applied to the data, and it
is not the purpose of this study to validate the full model. It
is anticipated that other parts of the conceptual model will
be tested in other studies using different data sets. For
example, the impact of compensation scheme factors can
be analysed in future studies with a mixed dataset of
compensated and non-compensated patients and societal
influence can be later explored by looking at changes in
uptake over the time period in which technology and
societal norm transitions took place.
In this study, drivers of allied health service use are
examined (Fig. 1). The type of allied health service is
physiotherapy, and the unit of analysis is the number of
sessions. No distinction is made based on the type of
therapy offered or the practice site, other than that the
study is limited to practices within the state of Victoria,
Australia. The model determinants explored in this study
are need and predisposing factors (individual level deter-
minants), and physiotherapy supply as a measure of
resources (health service system). The role of physiother-
apists in the uptake of services is also examined, to gain
insight into the possible effects of provider incentives
(health service system); i.e., is the total number of services
used dependent on the choice of provider.
Study Population and Setting
WorkSafe Victoria provides workers’ compensation insur-
ance for employers. Following a workplace injury or disease,
workers may be eligible to receive income replacement, and
medical and rehabilitation expenses, regardless of who was
at fault. For medical and like expenses, an excess of around
AU$630 must be paid by the employer and further costs are
paid by WorkSafe. Approximately 85 % of the Victorian
workforce receive workers’ compensation from WorkSafe
Victoria. The other 15 % are either sole traders (who do not
need to register for workers’ compensation in Victoria),
employees of self-insurers, or workers covered under the
Comcare workers’ compensation scheme (mainly federal
government employees).
Data Sources
This study was based on the Compensation Research
Database (CRD) held by the Institute for Safety, Com-
pensation and Recovery Research in Melbourne, Australia.
The CRD contains WorkSafe workers’ compensation
administrative claims data with information on the occu-
pation and industry, worker demographics, injury type,
claim cost and records of payments made. The payments
data include details of every WorkSafe reimbursed health
Fig. 1 Proposed adaptation of
Andersen and Newman’s health
care utilisation framework:
additions for determinants of
allied health service uptake in a
compensated population are
indicated in grey Italics
J Occup Rehabil (2013) 23:63–73 65
123

service payment, including the service date. The medical
expenses excess paid by employers was not included in the
dataset. Prior to the data being made available to
researchers, the records were stripped of identifying
information including claim numbers and claimant name
and contact details. Non-identifying claim ID numbers
were assigned to each claim in the database. Institutional
ethics approval was gained from Monash University
Human Research Ethics Committee for use and disclosure
of the claims information.
From the CRD, a retrospective cohort was defined and
followed for a period of 4 years.
Study Sample
The study sample consisted of men and women with work-
related musculoskeletal disorders resulting in ten or more
days off work, for which they received income replacement
with a first weekly payment dating between 1st January
2001 and 31st December 2004 (n = 36,995). Musculo-
skeletal disorders consisted of sprains/strains of joints and
adjacent muscles (54 %), dorsopathies, disorders of the
vertebrae and discs (24 %), disorders of muscle, tendons
and soft tissues (10 %), synovitis, tenosynovitis, bursitis,
occupational overuse syndrome or repetitive strain injury
(9 %), and arthropathies, disorders of the joints (2 %).
Variables
Outcomes
Physiotherapy use was determined from the CRD payment
records of physiotherapy sessions. All types of physio-
therapy services were included; the most common were
standard consultations, long consultations, group consulta-
tions, initial consultations, and hydrotherapy. Physiother-
apy services are reimbursed by WorkSafe if the service
provider is registered with WorkSafe as well as the Phys-
iotherapy Board of Australia. Physiotherapy is considered
to be a primary contact service, and referral is not required.
Reasonable costs are covered, up to a specified maximum
amount [12]. Physiotherapy, osteopathic and chiropractic
treatment are considered by WorkSafe to be similar, and
these treatments are not reimbursed simultaneously. For this
reason, persons who did not use physiotherapy but used
osteopathy or chiropractic services instead were excluded
from the modelling of physiotherapy uptake (any vs. none).
Only payments made within 4 years from the start of the
claim were taken into account; i.e., the follow-up period
was limited to 4 years. Most of the claim activity can be
expected in the first year, but the follow-up was extended
to 4 years in order to capture a potential long right tail in
service use. Repeat injuries are likely to result in a new
claim; extensive physiotherapy use per claim is therefore
unlikely to result from repeat injuries. Repeat claims by the
same claimant are common and repeat claims can be for
the same affliction and bodily location [13].
For each claim, the number of physiotherapy sessions
was determined. ‘High use’ of physiotherapy was defined
as the top 10 % of users. The 90th percentile of physio-
therapy visits over 4 years was at 125 visits: this was set as
the threshold for ‘high use’.
Individual Level Determinants
Occupational and demographic details (age and sex) were
derived from the claims data. Age refers to claimant age at
the time of injury/illness. Occupation was categorised into
nine occupation group codes using the Australian and New
Zealand Standard Classification of Occupations (ANZ-
SCO) [14].
Health Care System
The number of physiotherapists per local government area
in Victoria in 2006 [15] was combined with the Australian
Bureau of Statistics estimated resident population per local
government area in 2006 [16] to derive the number of
physiotherapists per capita. Workers’ postal codes were
converted to Local Government Area codes and for each
worker, the number of physiotherapists per capita in their
residential area was calculated. Physiotherapists per capita
were categorised as low, medium, high and very high based
on the distribution in quartiles (\p25, p25–50, p50–75 and
[p75, respectively).
The WorkSafe service payments data contained a unique
dummy identifier for each physiotherapist; this is referred to
as the Service Provider ID and used to analyse the impact of
service providers on physiotherapy uptake. Because many
service providers had multiple WorkSafe patients in their
practice, service use differences between service providers
could be analysed.
Statistical Analysis
The data for this paper were analysed using SAS software,
Version 9.2 (SAS Institute Inc., Cary, NC, USA: 2008).
Modelling of Individual Level Factors
The association between individual factors and service use
was tested in two models: a logistic regression model
relating any uptake versus no uptake to individual predic-
tors (Model 1), and a logistic regression model relating
high use ([p90) vesus ‘normal’ use to individual predictors
(Model 2). For Model 2, only persons with one or more
66 J Occup Rehabil (2013) 23:63–73
123
physiotherapy visits were included. Both models were
adjusted for all listed predisposing and need variables.
Modelling of Physiotherapists Per Capita
Similar models were constructed to test the association
between physiotherapists per capita and physiotherapy
uptake (Models 3 and 4): both models were adjusted for
individual-level determinants (need and predisposing fac-
tors). To separate the effect of physiotherapists per region
from the effect of regional differences in socioeconomic
status, models were run separately on datasets grouped by
socio-economic index for area (SEIFA) derived from
indicators of relative advantage or disadvantage such as
income, education, employment occupation and housing
within patients’ residential postcodes [17]. For this study,
deciles for SEIFA ranking within Victoria were used [17]:
the lowest 10 % of areas are given a decile number of one
and the highest 10 % of areas are given a 10.
Modelling of the Physiotherapy Provider Role
Statistical modelling of the role of physiotherapists in
determining service use was complicated by the large
number of physiotherapists in the dataset, some of whom
had only one or two WorkSafe patients in their practice. In
the dataset there were 1957 physiotherapists for 26,026
patients: 484 physiotherapists saw only one WorkSafe
patient; 174 saw only two; and 771(39 %) physiotherapists
saw ten or more.
To facilitate analysis of the physiotherapist role in ser-
vice overuse, several data subsamples were created. Sam-
pling was used to reduce the number of categories in the
physiotherapy provider variable: samples were limited to
physiotherapists with multiple WorkSafe patients. First,
from therapists seeing 10 or more WorkSafe patients, a
random selection of 51 was made (every 15th physiother-
apist was selected after sorting the data by dummy client
ID). The data was reshuffled and two more random subs-
amples from this group were created. Second, this process
was repeated, this time sampling from physiotherapists
who saw at least 5 patients. Third, the process was repe-
ated, but sampling from therapists who saw at least 20
patients. Finally, another four data sets were created by
dividing all data from physiotherapists who saw at least 10
patients, into the four categories of regional physiothera-
pists per capita: low, medium, high and very high.
A regression model relating uptake to Provider ID was
constructed. A Poisson distribution was tested but because
of over-dispersion of the data, a negative binomial
regression model was used (Model 5). Individual-level
factors were included in the model to account for differ-
ences in practitioners’ case mix (i.e., in terms of patients’
injury severity and patient demographics) that might
explain potential differences in the average patient use per
practitioner. The null model (without Provider ID) and the
full model were run on all data subsets. To test whether the
service provider contributes to the overall number of
physiotherapy sessions, the fit of the baseline model was
compared with that of the full model, using the log like-
lihood ratio test.
Results
Of the 36,995 persons with musculoskeletal disorders,
26,026 (70 %) did and 10,969 (30 %) did not seek reim-
bursement for physiotherapy services during the 4-year
follow-up period. Of those who did not use physiotherapy
services, 404 (4 %) used osteopathic services and 1,089
(10 %) used chiropractic services. One in four persons with
work-related musculoskeletal disorders did not make use of
either physiotherapy, osteopathy or chiropractic services.
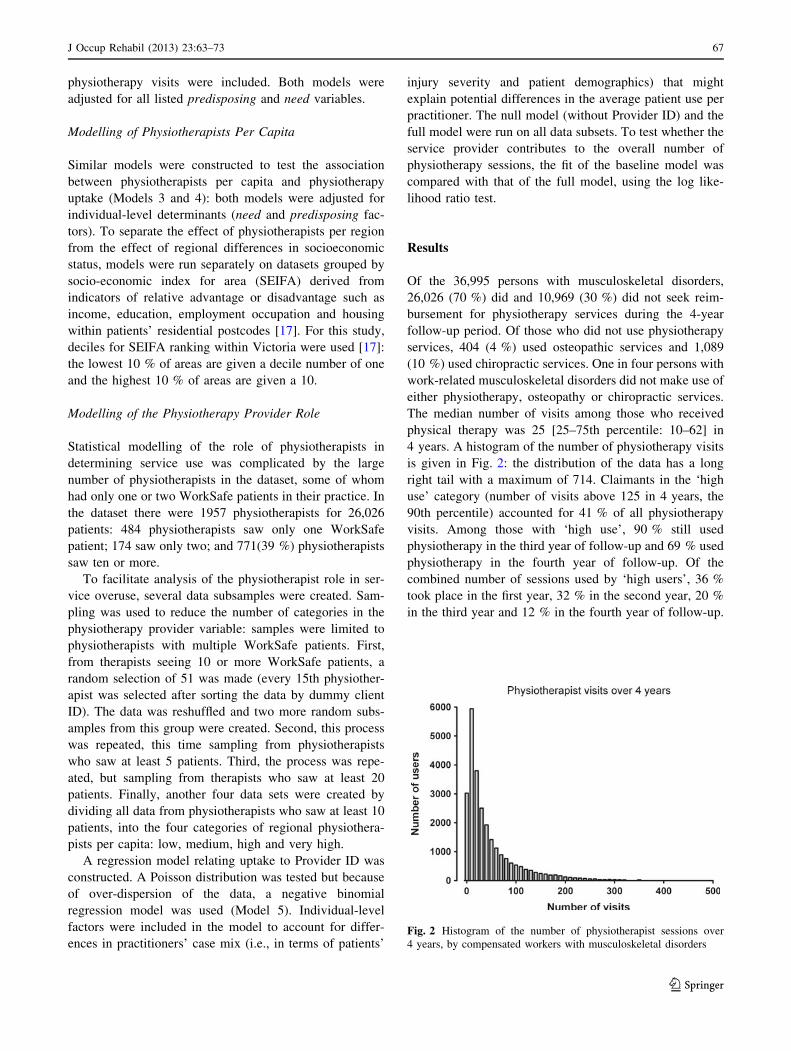
The median number of visits among those who received
physical therapy was 25 [25–75th percentile: 10–62] in
4 years. A histogram of the number of physiotherapy visits
is given in Fig. 2: the distribution of the data has a long
right tail with a maximum of 714. Claimants in the ‘high
use’ category (number of visits above 125 in 4 years, the
90th percentile) accounted for 41 % of all physiotherapy
visits. Among those with ‘high use’, 90 % still used
physiotherapy in the third year of follow-up and 69 % used
physiotherapy in the fourth year of follow-up. Of the
combined number of sessions used by ‘high users’, 36 %
took place in the first year, 32 % in the second year, 20 %
in the third year and 12 % in the fourth year of follow-up.
Fig. 2 Histogram of the number of physiotherapist sessions over
4 years, by compensated workers with musculoskeletal disorders
J Occup Rehabil (2013) 23:63–73 67
123

Individual Level Factors
Physiotherapy underuse was modelled as no use versus use
(Table 1: Model 1). Younger workers, particularly those
under 20, men, and labourers were most likely to not use
physiotherapy services. Workers with arthropathies
(disorders of the joints), and those without hospital stay
were also more likely to not use physiotherapy. High use
(above the 90th percentile for use; more than 126 services
over four years) was more common with increasing age,
with a maximum for those aged in their late 50 s. High use
was also more common among women, and among
Table 1 Individual determinants of physiotherapy use
Variable No use ‘Normal’ use High use Model 1 Model 2
N = 10,969
%
N = 23,434
%
N = 2,592
%
No use versus use
OR [95 % CI]
High versus
‘normal’ use
OR [95 % CI]
Predisposing factors
Age
Under 20 4 2 1 1.4 [1.2–1.7] 0.6 [0.4–1.2]
20–24 9 6 3 1 REF 1 REF
25–29 10 9 7 0.7 [0.7–0.8] 1.5 [1.1–1.9]
30–34 12 12 9 0.7 [0.6–0.8] 1.5 [1.2–2.0]
35–39 12 14 12 0.7 [0.6–0.8] 1.7 [1.3–2.2]
40–44 14 16 18 0.7 [0.6–0.8] 2.0 [1.6–2.6]
45–49 14 15 18 0.7 [0.7–0.8] 2.2 [1.7–2.9]
50–54 13 14 17 0.8 [0.7–0.8] 2.3 [1.7–2.9]
55–59 8 8 12 0.7 [0.7–0.8] 2.7 [2.1–3.5]
60–64 4 4 4 0.8 [0.7–0.9] 2.3 [1.7–3.2]
65? 1 1 1 0.7 [0.5–1.0] 1.7 [0.9–3.0]
Sex
Male 69 62 56 1.6 [1.5–1.7] 0.6 [0.6–0.7]
Female 31 38 44 1 REF 1 REF
Occupation
Managers and administrators 2 2 2 1.0 [0.9–1.2] 0.8 [0.6–1.1]
Professionals 9 11 10 1.0 [0.9–1.1] 0.7 [0.6–0.8]
Associate professionals 7 7 6 0.9 [0.8–1.0] 0.7 [0.6–0.9]
Tradespersons and related workers 21 19 18 1 REF 1 REF
Advanced clerical and service workers 1 1 1 1.0 [0.8–1.3] 0.9 [0.6–1.4]
Intermediate clerical, sales & service workers 9 11 10 1.0 [0.9–1.1] 0.7 [0.6–0.9]
Intermed.production & transport workers 20 21 23 0.9 [0.8–0.9] 1.1 [1.0–1.2]
Elementary clerical, sales & service workers 4 4 3 0.9 [0.8–1.1] 0.6 [0.5–0.8]
Labourers and related workers 27 24 27 1.1 [1.0–1.2] 1.0 [0.9–1.2]
Need
Affliction
Sprains/strains of joints/muscles 53 54 62 1 REF 1 REF
Arthropathies 3 2 1 1.7 [1.5–2.0] 0.4 [0.3–0.5]
Dorsopathies 23 25 22 0.7 [0.7–0.8] 0.8 [0.7–0.9]
Disorders of muscle/tendons/soft tissues 11 10 8 1.2 [1.1–1.3] 0.7 [0.6–0.8]
Synovitis, tenosynovitis, bursitis, OOS or RSI 9 9 7 1.2 [1.1–1.3] 0.6 [0.5–0.7]
Hospital amount
None 73 52 32 1 REF 1 REF
\2,500 22 29 27 0.5 [0.5–0.5] 1.5 [1.3–1.6]
C2,500 5 19 41 0.2 [0.1–0.2] 3.5 [3.1–3.8]
In modelling no use versus use of physiotherapy services, those who did not use physiotherapy but used osteopathy or chiropractic services
instead were excluded. Model 1 and Model 2 contain all listed predisposing and need factors
68 J Occup Rehabil (2013) 23:63–73
123

tradespersons and intermediate production and transport
workers. Workers with sprains/strains of joints/muscles
were most likely to have high physiotherapy service use, as
were those with high hospital bills.
Physiotherapists Per Capita
The supply of physiotherapists per local government area
ranged from zero to 3.4 physiotherapists per 1,000 capita.
The majority of patients (90 %) lived in an area with at
least 0.09 physiotherapists per 1,000 capita; the median
was 0.5. There was no clear pattern of association with
service use (Table 2: Model 3) or with high service use
(Model 4). Although statistically significant in the models
(p \ 0.0001 for both models), the resulting odds ratios for
regions with low, median, high and very high number of
physiotherapists per capita are difficult to interpret. To
separate the effect of socioeconomic status from the supply
of physiotherapists, Model 3 and 4 were re-run on data of
those living in regions with SEIFA deciles 1–2, 3–4, 5–6,
7–8 and 9–10 (Fig. 3). For the lowest SEIFA deciles,
greater supply is associated with less ‘none use’ and more
‘high use’, but this pattern does not include the ‘very high’
physiotherapy supply category. Because very high numbers
of physiotherapists per region are generally found in den-
sely populated urban areas, it might not be possible to fully
separate accessibility of services from other, individual-
level drivers of service uptake. For the SEIFA deciles
3–10, the results do not show a consistent pattern.
Provider ID
The role of service providers in physiotherapy uptake was
tested using a fully adjusted negative binomial model, run
on a number of data subsets (Table 3). Service provider
was a significant predictor of the number of sessions, in all
data subsets (log likelihood ratio test p \ 0.0001). Across
physiotherapists with C5, C10, and C20 WorkSafe patients
in the dataset, provider ID was associated with service use;
this association held true across each of the four levels of
physiotherapists per capita.
Discussion
Among compensated workers with musculoskeletal disor-
ders resulting in time off work, 70 % used physiotherapy
services in relation to their injury/illness at least once during
the 4 years following the start of their workers’ compensa-
tion claim. Non-use was more common among men, among
workers aged under 25 years and among those without
hospital costs. Those with the top 10 % of physiotherapy
visits accounted for over 40 % of all visits: these persons
were categorised as high users. High users were more likely
to be in their late 50 s, more likely to be female, and to work
as tradespersons; high use was also positively associated
with hospital costs. Service use was not associated with
physiotherapists supply in a dose–response manner, except
for areas with relative socio-economic disadvantage where
greater supply was associated with less ‘non use’ and more
‘high use’. Service use was distributed differentially across
physiotherapists, which suggests service providers them-
selves play a role in determining the number of services used
by workers’ compensation patients.
Underuse
This study is based on WorkSafe payments for medical and
like expenses; an employer-paid excess of around AU$630
must be reached first. Non-use as presented here is therefore
an underestimate of non-use, as physiotherapy sessions may
have been captured in the employer-paid medical excess.
Physiotherapy use in this compensated worker sample was
much more common than has been reported in other studies.
Freburger et al. [18] reported physiotherapy referral rates
around 20 % for patients with musculoskeletal conditions
(including fractures) in the US; in a US study by Carter et al.,
outpatient physiotherapy use by persons with these condi-
tions was 7 % [19]. Among workers compensated for back
injury in Quebec, 18 % were referred for physiotherapy by
their physician [20]. In a population of patients with acute
lower back pain in North Carolina, physiotherapy use was
reported by 13 % [9]; these patients were either referred by a
provider or self-referred. Among patients with chronic
Table 2 Supply of
physiotherapists. In modelling
no use versus use of
physiotherapy services, those
who did not use physiotherapy
but used osteopathy or
chiropractic services instead
were excluded
Models were adjusted for needfactors (affliction type, bodily
location, hospital amount)
Variable No use
%
‘Normal’ use
%
High use
%
Model 3 Model 4
No use
versus use
OR [95 % CI]
High versus
‘normal’ use
OR [95 % CI]
Physiotherapists
per capita
Low 25 26 27 1 REF 1 REF
Median 25 23 21 1.2 [1.1–1.3] 0.9 [0.8–1.0]
High 26 28 31 1.0 [0.9–1.1] 1.1 [1.0–1.3]
Very high 23 24 21 1.1 [1.0–1.1] 0.9 [0.8–1.0]
J Occup Rehabil (2013) 23:63–73 69
123

lower back pain in another North Carolina study, 30 % had
seen a physiotherapist in the previous year [8]. In a popu-
lation- based Canadian study of health care utilisation,
physiotherapy use was reported by 17.2 % of persons with a
lower back disorder versus 6.6 % of persons without a lower
back disorder [21].
Fig. 3 Health service use uptake by physiotherapists per capita:
logistic regression models were run separately per SEIFA state deciles
(1–2 are the most disadvantaged, 9–10 are the most advantaged), to
separate physiotherapists per region from socioeconomic status of the
region. Left any physiotherapist use versus none; right high uptake
versus ‘normal’ uptake of physiotherapist services. All models were
fully adjusted for individual-level factors
Table 3 Service provider determinants
WorkSafe
patients per
provider
Supply of
physio-
therapists
Data
sampling
ratio
Patients
Providers
Full model: individual
predictors and provider ID
Null model: individual
predictors only
Log Likelihood
ratio test Full
versus Basic
model
N N N Deviance DF Deviance DF p value
Subsample 1 C10 All regions 1:15 1,781 51 2,005 1703 2,037 1753 \0.0001
Subsample 2 C10 All regions 1:15 1,583 51 1,780 1505 1,810 1555 \0.0001
Subsample 3 C10 All regions 1:15 1,636 51 1,854 1558 1,885 1608 \0.0001
Subsample 4 C5 All regions 1:20 1,008 54 1,135 927 1,150 980 \0.0001
Subsample 5 C20 All regions 1:8 2,129 55 2,407 2047 2,442 2101 \0.0001
Subsample 6 C10 Low 1:1 5,734 634 6,389 5073 6,550 5706 \0.0001
Subsample 7 C10 Medium 1:1 4,906 576 5,477 4302 5,626 4877 \0.0001
Subsample 8 C10 High 1:1 5,999 575 6,718 5397 6,890 5971 \0.0001
Subsample 9 C10 Very High 1:1 4,534 571 5,047 3936 5,198 4506 \0.0001
To enable modelling of the effect of service providers on uptake, only physiotherapists with a minimum number of WorkSafe patients in the
database were selected (data sub-sampling details are given below)
Negative binomial regression models were used to test the associations between the number of physiotherapy sessions and service providers.
Models were adjusted for all individual predictors (listed in Table 1)
70 J Occup Rehabil (2013) 23:63–73
123

The difference in physiotherapy utilisation reported in
our study compared to previous studies can be partly
attributed to differences in (i) patient population and (ii)
health care system. Different populations could be expec-
ted in that studies have respectively considered referral
rates, and utilisation rates. Referral implies that patients
have already sought care, which introduces a (severity-
related) patient inclusion criterion. Additionally, our
patient population consisted of persons with at least
2 weeks off work because of their injury and might
therefore be considered to have more severe injuries than
the total population of injured workers. The fact that our
study was limited to a demographic eligible for workers’
compensation may also help explain the higher physio-
therapy rates reported in our study, as the literature sug-
gests that persons above retirement age (who were not in
our study) are less likely to use physiotherapy [19, 21].
Possibly a more important reason, however, for the dra-
matic difference in numbers of physiotherapy visits in our
study population related to the fact that these visits did not
require a doctor referral and were reimbursed by workers’
compensation. This eliminated two barriers to service use:
out of pocket costs, and the need for a physician referral.
The merits of physiotherapy as first-contact care for
musculoskeletal conditions has been discussed by Overman
et al. [22] and they concluded that for lower back pain,
physiotherapists can provide safe, effective and efficient
first-contact care in an organised outpatient setting. In this
study population non-use of physiotherapy was relatively
rare: only one in four persons did not receive physiother-
apy, osteopathy or chiropractic services. Men were more
likely than women to not use physiotherapy, which is
consistent with previous reports of women being more
likely than men to use physiotherapy services [19, 21].
Within this working-age population, non-use of physio-
therapy was also common among those aged under 25. The
results indicated a tendency for physiotherapy supply to
limit service use only for workers living in areas with
relative socio-economic disadvantage. Overall, these
results therefore suggest that among patients with costs
reimbursed by workers’ compensation, adequate physio-
therapy supply and no requirement for referrals, physio-
therapy services are not underused. The present results
indicate that these services are well utilised in a workers’
compensation population: how physiotherapy impacts
outcomes in terms of disability, pain and return to work is
yet to be explored in future studies.
Overuse
The mean number of services used by individuals with at
least one physiotherapy session was 49, but these highly
skewed data are better described by the median: 25 visits.
To compare our results to literature, the number of visits
for those with affliction location coded as ‘lower back’
(29 % of cases) were calculated: mean 50 and median 27
visits. This is much higher than previous reports for lower
back pain: a mean of 15.6 visits was reported by Freburger
et al. [8]; Jette et al. [7] reported a median of 11 and a mean
of 8 visits; and Mielenz et al. [9] reported a mean of 8.5
visits. The result closest to our study was an average of
24.5 actual treatment days during a 2-years follow-up of
Quebec workers’ compensation recipients, reported by
Ehrman-Feldman et al. [20]. This suggests a role of
workers’ compensation in leading to an elevated average
number of sessions per patient: this is further supported by
the reported 36 % increase in cost per episode of care for
patients with workers’ compensation compared to episodes
charged to other insurance carriers [7].
The distribution of physiotherapy service use was highly
skewed with a small percentage of patients (10 %)
responsible for a large percentage of use (41 %). On a
population level, a skewed distribution of health care
expenditure has been described previously: in the US, five
percent of the population accounts for the majority of
health expenditures [23]. This phenomenon can be partly
explained by differences in health care needs across the
population (the highest users could have greater health care
needs; those with low health care use may simply be in
good health), and differences in insurance status (medical
expenditures of the top users in the insured group were
considerably higher than those of top users in the uninsured
group). The skewed distribution in the current study,
however, is more difficult to interpret. All had musculo-
skeletal conditions resulting in work disability (therefore
setting a threshold in ‘need’) and all received reimburse-
ment for injury-related health services, removing any
utilisation differences driven by out-of-pocket payments. In
our study, high users were more likely to be in their late
50 s, to be female, to work as tradespersons, to have had
substantial hospital costs (which is likely a reflection of
injury severity). In previous studies women have been
associated with increased health care utilisation [24, 25].
Part of the gender difference in service use is explained by
chronic health conditions, pregnancy and birth [24] (and
therefore a difference in need). Whether the gender dif-
ference in physiotherapy use for work-related musculo-
skeletal is due to differences in injury severity, prevalence
of chronic conditions complicating recovery, or predis-
posing factors, remains to be investigated.
To our knowledge, this is the first study to assess not
only individual predictors and supply, but to include the
role of physiotherapists in determining drivers of utilisation
and overuse. Physiotherapy providers were statistically
significantly associated with the number of sessions used,
which indicates that high use is not only a product of
J Occup Rehabil (2013) 23:63–73 71
123

individual need, predisposing and enabling factors.
Because service provider information in our data was
limited to a de-identified provider ID, providers could not
be grouped by practice type and size, available equipment,
or expertise: this information may help to clarify practi-
tioner differences. The results from this study do show that
service use is skewed and that efforts to limit overuse
should focus not only on high-end users, but also on
physiotherapists providing high-end use.
Conceptual Model
In this study we present a framework of (allied) health
service use drivers, based on the model by Andersen and
Newman [5]. This model has provided a useful guide to
exploring underuse and overuse of physiotherapy by
compensated workers, but this study has by no means
validated the model or touched upon every aspect of it. The
role of the model in this study was to place the analysis in a
greater context. Future studies to clarify the role of the
compensation system in service uptake and injury out-
comes could include analysing system changes and time
trends; analysing the impact of service use on injury out-
comes (in terms of return to work, return to health, quality
of life); and studying the interactions between the health
care system and the compensation system. The effect of
societal norms on injury outcomes can be studied by
examining time trends, such as the transition in attitudes
toward repetitive strain injury [26].
Study Limitations
The main limitation of this study is that it is entirely based
on administrative claims records. Because of the absence of
other linked administrative data sources and survey data,
information on several important health service use drivers
was missing: (1) Physical functioning. Because the par-
ticipants all had two or more weeks off work, work ability
was limited in all participants, but we did not measure
physical functioning. (2) Depression. Among high utilisers
of medical care in the US, depression has been associated
with higher resource utilisation [27]. (3) Health service use
prior to injury: this is reported to be increased in injured
compared to non-injured persons in Manitoba, Canada
[28]. Previous health service use can provide insight into
predisposing factors driving allied health service use: e.g.,
those who have previously attended a chiropractor might
be more likely to do so again after an injury. (4) Health
service use other than that reimbursed with workers’
compensation health benefits. Among hospital workers
with work-related musculoskeletal disorders in British
Columbia, publicly funded health care use increased before
and after injury, compared with non-injured workers, even
though they received workers compensation health benefits
[29]. Furthermore, the results presented in our study do not
include the medical expenses excess paid by employers.
The workers’ compensation reimbursed physiotherapy use
reported in our study is therefore an underestimate of all
physiotherapy use by the study subjects.
Policy Recommendations
Service overuse places a strain on resources that is not
likely to be justified by better injury outcomes; inappro-
priate and unjust treatments may have a negative impact on
recovery. It is in the interest of workers, employers and
workers’ compensation authorities to prevent overuse of
services. The results of this study support a physiothera-
pist-based approach to policy recommendations for limit-
ing service use.
Under the current WorkSafe Physiotherapy guidelines,
physiotherapists are required to submit a physiotherapy
management plan by the fifth consultation [12]. The
management plan includes a section asking for specific
goals relating to work and function, with an estimated date
of achievement; it also asks for a proposed total number of
services and an estimated discharge date. Very high use
could be managed by effective monitoring (1) the reason-
ableness of the proposed goals and required number of
sessions; (2) adherence to the treatment plan; and (3) the
requirement for a new treatment plan after the patient has
exceeded a set number of sessions, with a justification of
how additional physiotherapy will contribute to recovery.
A more general approach would include additional
training for therapists treating work-related injuries and
illness. Although a Canadian knowledge translation ini-
tiative, aimed to provide physiotherapists with best practice
information regarding work disability prevention, did not
substantially alter self-reported clinical practice and out-
comes [30], a mandatory training for WorkSafe-registered
physiotherapists followed by provision of support for good
practice as well as accountability may help to improve
outcomes for work-related injuries. An effective way to
ensure application of the information in practice would be
to implement an outcomes-based quality assurance process
for analysis of provider performance, as is used by the
Workers’ Compensation Board of Alberta.
Conclusions
Among workers with musculoskeletal disorders resulting in
time off work, physiotherapy services were not underused.
There was, however, a small group of users with very high
use: this was more common among persons in their late
50 s, women, tradespersons, and those with substantial
72 J Occup Rehabil (2013) 23:63–73
123

hospital costs. Physiotherapy supply was associated with
use only among workers living in the least socio-eco-
nomically advantaged areas. Individual physiotherapists
played a role in service use: the results indicated that the
total number of sessions attended was partly determined by
the choice of service provider. Recommendations to limit
overuse should target physiotherapists, and these could
include a mandatory training program for treating work-
related injuries. Monitoring of adherence to proposed
treatment plans and overall practice statistics may also help
to prevent service overuse and improve injury outcomes.
Acknowledgments The research was supported by funding from
WorkSafe Victoria and the Transport Accident Commission (TAC).
Conflict of interest The research was funded, at least partly, by
WorkSafe Victoria (Australia).
References
1. Australian Bureau of Statistics. Work-Related Injuries
2009-102011 Contract No.: 6324.0.
2. Safe Work Australia. Key Workers’ Compensation Information,
Australia. 2011 [cited 2011]; Available from: http://www.safe
workaustralia.gov.au/AboutSafeWorkAustralia/WhatWeDo/Publi
cations/Pages/KeyWCbooklet2011.aspx.
3. Australian Safety and Compensation Council. Work-related
musculoskeletal disease in Australia2006.
4. HWCA Australia. National Compendium of Medical Costs in Aus-
tralian Workers Compensation. 2000 [cited 2011]; Available from:
http://www.hwca.org.au/documents/medical_comp_amended.pdf.
5. Andersen R, Newman JF. Societal and individual determinants of
medical care utilization in the United States. Milbank Mem Fund
Q Health Soc. 1973;51:95–124.
6. Andersen RM. Revisiting the behavioral model and access to
medical care: does it matter? J Health Soc Behav. 1995;36:1–10.
7. Jette AM, Smith K, Haley SM, Davis KD. Physical therapy
episodes of care for patients with low back pain. Phys Ther
1994;74:101–10; discussion 10–5.
8. Freburger JK, Carey TS, Holmes GM. Physical therapy for
chronic low back pain in North Carolina: overuse, underuse, or
misuse? Phys Ther. 2011;91:484–95.
9. Mielenz TJ, Carey TS, Dyrek DA, et al. Physical therapy utili-
zation by patients with acute low back pain. Phys Ther. 1997;77:
1040–51.
10. Victorian Consolidated Legislation. Accident Compensation Act.
1985; Available from: http://www.austlii.edu.au/au/legis/vic/con
sol_act/aca1985204/.
11. Victorian Consolidated Legislation. Accident Compensation
(Workcover Insurance) Act. 1993; Available from: http://www.
austlii.edu.au/au/legis/vic/consol_act/acia1993420/.
12. WorkSafe Victoria. Information on Physiotherapy. 2011 [cited
2011]; Available from: http://www.worksafe.vic.gov.au/wps/wcm/
connect/wsinternet/worksafe/home/forms?and?publications/edu
cational?material/information?for?physiotherapy.
13. Ruseckaite R, Collie A. Repeat workers’ compensation claims:
risk factors, costs and work disability. BMC Public Health. 2011;
11:492.
14. Australian Bureau of Statistics. ANZSCO–Australian and New
Zealand Standard Classification of Occupations. First Edition ed.
Trewin D, Pink B, editors2006.
15. Service and Workforce Planning. Physiotherapy Labour Force
Victoria 2006. Available from: http://docs.health.vic.gov.au/docs/
doc/509075D0D40C2027CA2578520003D45E/$FILE/physio-
report-2007-final.pdf.
16. Australian Bureau of Statistics. Regional Population Growth,
Australia. 2009-10; Available from: http://www.abs.gov.au/Aus
stats/[email protected]/mf/3218.0.
17. Australian Bureau of Statistics. SEIFA: Socio-Economic Indexes
for Areas. 2006.
18. Freburger JK, Holmes GM, Carey TS. Physician referrals to
physical therapy for the treatment of musculoskeletal conditions.
Arch Phys Med Rehabil. 2003;84:1839–49.
19. Carter SK, Rizzo JA. Use of outpatient physical therapy services
by people with musculoskeletal conditions. Phys Ther. 2007;
87:497–512.
20. Ehrmann-Feldman D, Rossignol M, Abenhaim L, Gobeille D.
Physician referral to physical therapy in a cohort of workers
compensated for low back pain. Phys Ther 1996;76:150–6; dis-
cussion 6–7.
21. Lim KL, Jacobs P, Klarenbach S. A population-based analysis of
healthcare utilization of persons with back disorders: results from
the Canadian Community Health Survey 2000–2001. Spine (Phila
Pa 1976) 2006;31:212–218.
22. Overman SS, Larson JW, Dickstein DA, Rockey PH. Physical
therapy care for low back pain. Monitored program of first-con-
tact nonphysician care. Phys Ther. 1988;68:199–207.
23. Berk ML, Monheit AC. The concentration of health care
expenditures, revisited. Health Aff (Millwood). 2001;20:9–18.
24. Cleary PD, Mechanic D, Greenley JR. Sex differences in medical
care utilization: an empirical investigation. J Health Soc Behav.
1982;23:106–19.
25. Bertakis KD, Azari R, Helms LJ, Callahan EJ, Robbins JA.
Gender differences in the utilization of health care services.
J Fam Pract. 2000;49:147–52.
26. Quintner JL. The Australian RSI debate: stereotyping and med-
icine. Disabil Rehabil. 1995;17:256–62.
27. Pearson SD, Katzelnick DJ, Simon GE, et al. Depression among
high utilizers of medical care. J Gen Intern Med. 1999;14:461–8.
28. Cameron CM, Purdie DM, Kliewer EV, McClure RJ. Differences
in prevalence of pre-existing morbidity between injured and non-
injured populations. Bull World Health Organ. 2005;83:345–52.
29. Koehoorn M, Cole DC, Hertzman C, Lee H. Health care use
associated with work-related musculoskeletal disorders among
hospital workers. J Occup Rehabil. 2006;16:411–24.
30. Gross DP, Lowe A. Evaluation of a knowledge translation ini-
tiative for physical therapists treating patients with work dis-
ability. Disabil Rehabil. 2009;31:871–9.
J Occup Rehabil (2013) 23:63–73 73
123