determinants of recycling behavior: a uc berkeley...
TRANSCRIPT
Kao Saechao Recycling determinants May 7 2007
p. 1
Determinants of Recycling Behavior: A UC Berkeley Case Study
Kao Saechao
Abstract Recycling lessens the need to extract the planet’s limited raw material resources. Understanding the factors that influence or promote recycling behavior can lead to more efficient recycling programs. Housing types are one examples of the many factors that can affect recycling. Residences halls (Res Halls), fraternities, and sororities are separate housing options on the University of California, Berkeley (UCB) campus. Each housing type presents a different environment and has a separate management for its recycling programs. Four categories of explanatory variables related to recycling behavior (internal motivators, external motivators, internal facilitators, and external facilitators) are examined to determine their influential value on student recycling for aluminum, plastic, and glass beverage containers. Self-reported recycling rates and assessment of each explanatory variable were attained through questionnaires given to student participants. Students living in Residential Halls were found to have higher recycling rates for all the different material types. However, the study did not reveal any consistent findings the relationship between housing type and student recycling rates.
Kao Saechao Recycling determinants May 7 2007
p. 2
Introduction
Understanding what affects our recycling behaviors can lead to better and more effective
recycling programs in our communities. There are many factors that influence human recycling
behavior and previous research on this topic has led to the discovery of many different
explanatory variables. Hornik et al (1995) reviewed approximately 70 of these studies and found
four recurring classes or categories of variables that were best used to determine recycling
behavior: Internal Facilitators (IF), External Facilitators (EF), Internal Motivators (or Incentives)
(IM), and External Motivators (or Incentives) (EM). Internal Motivators are psychological
factors that lead individuals to be self-motivated in continuing a certain act or task (Do Valle et
al 2004). External Motivators are psychological factors that motivate individuals in continuing
an act through things they cannot control (Hornik et al 1995, Werner and Makela 1998, Bratt
1999). Internal Facilitators are factors that provide individuals with the knowledge and mental
capacity to complete a task properly. External Facilitators can be characteristics of the
surrounding physical environment that allow for the completion of a task and also barriers that
can discourage individuals from doing a task.
Corraliza and Berenguer (2000) examined how the interaction between personal variables
(Internal Motivators and Facilitators) and situational variables (External Motivators and
Facilitators) affected recycling behavior. The situational variables referred to the physical
environment such as placement and size of collection bins while the personal variables referred
to cultural values and beliefs. According to the study, individuals recycle only when the situation
or their environment provided them with the opportunity to do so regardless of their moral stance
or amount of knowledge. Corraliza and Berenguer (2000) also noted that low levels of moral
obligation to recycle did not mean people did not recycle at all and a variable which normally
has a strong influence on a person’s behavior will not always produce the same results when
other variables are present. Therefore, the different categories of variables do interact with each
other and all types of variables must be taken into account when trying to determine what
influences an individual’s recycling behavior.
In a study completed by Do Valle et al (2005), various attitude-behavioral theories and
models were combined to produce a more complex, but complete, model that better predicted
human recycling behavior. The combined model utilizes all the different variable categories that
predicts recycling behavior and allows for the incorporation or consideration of multiple
Kao Saechao Recycling determinants May 7 2007
p. 3
variables before an action is carried out. The Theory of Planned Behavior (TOPB) was a main
structural component to Do Valle et al’s combined behavioral model and it is also widely used in
many other research studies on environmental psychology and behavior. TOPB allows for better
prediction of pro-environmental behavior because it considers specific attitudes towards
recycling rather than more global questions such as whether individuals think recycling is good
or bad. Another reason why Do Valle et al elected to use TOPB is because it does find a link
between the different factors affecting recycling behavior, unlike in Hornik et al’s (1995)
proposed model. TOPB finds direct and indirect relationships between the variables: attitude
towards act, subjective norm (i.e. peer pressure), Perceived Behavioral Control (PBC) (beliefs
about how difficult or controllable a task is), Specific knowledge (about how, where, when, and
what to recycle), and lastly perceived performance and convenience of recycling.
The TOPB, combined with models about internal motivations, values, and knowledge,
contributed to Do Valle et al’s combined model. This resulting model has a complex web where
there are many paths to actual recycling behavior and none of them have to be linear.
Recycling participation can greatly be affected by an individual’s physical and social
environment or by the amount of organization and structure within those environments. Different
social structures and recycling programs can vary from community to community which
translates to differences in the program efficiency, participation rates, and recycling frequency.
Werner and Makela (1998) investigated the motivations that influenced recycling behavior.
The study revealed that the more knowledge and personal satisfaction people receive from
recycling, the more likely they are to do it on a long term basis. The study claims that making a
task mandatory does not necessarily change behavior; rather, the best way to get people to do
something is to make the task a fun and positive experience. Integrating competition into the
activity can act on some people’s drive to participate or try harder. Werner and Makela presents
the idea that introducing an exciting or interactive recycling program into a community can
increase the recycling rates depending on how well-developed the program is. Therefore, it may
be interesting to measure how advanced the recycling programs are for different communities
and to then compare the recycling rates amongst the different communities.
Cheung et al (1999) applied the TOPB on wastepaper recycling by college students in Hong
Kong and found out that TOPB in addition to knowledge was not a good predictor of recycling
behavior. However, past behavior and habits did affect recycling participation because the
Kao Saechao Recycling determinants May 7 2007
p. 4
repetitive acts overpowered TOPB. This study reveals that the environment or housing location
does not necessarily affect student recycling behavior because their previous behavior prior to
moving into the dormitories were not amended after the move. It will be interesting to see if the
same holds for the college students here at UC Berkeley. This study further supports Corraliza
and Berenguer’s (2000) idea that some variables can overshadow others and negate their
influences. The failure to increase recycling participation in Cheung et al’s (1999) study could
also have been due to the quality of the college’s recycling program which was not revealed.
As found in these past studies, the four main classes of variables (IF, EF, IM, EM) are critical
factors that can influence pro-environmental attitudes and action. My study utilizes Hornik et al’s
(1995) model to assess whether each variable played a role in determining the recycling behavior
of students living in the Greek houses and in Units 1 and 2 of the campus’s residential halls (Res
Halls). Do Valle et al’s (2005) model does take into account the relationships between variables
but it deals more with personal values, attitudes, and the individual’s perception of their access
or ability to complete a task. It neglects taking into account the true physical environmental
conditions and limitations that can hinder an act. This is one of the reasons why I elected to use
Hornik et al’s framework for my study. Since I am looking at different housing types, there are
certain physical limitations and amenities that are present at each housing type. Examples of
limitations and amenities are ample space for recycling bins, funding for the recycling programs,
and recycling coordinators or managers.
Although Cheung et al did not find a link between housing locations and recycling
participation, very few studies have examined this relationship so it warrants further study. Their
study took place in Hong Kong so cultural differences in attitudes, behavior, and governance
could have potentially affected their results. Additionally, my study also examines Greek houses
which were not included in Cheung et al’s (1999) study. Cheung et al’s (1999) study did not look
specifically at whether a certain housing type affects a student’s recycling behavior, but whether
their past behavior could be altered after entering a new environment and getting increased
knowledge. Management and structure of recycling programs for each of the housing types does
vary widely on the UC Berkeley campus; therefore, re-examining the relationship between
housing type and recycling behavior can still be worthwhile.
My hypotheses are: (H1) Students living in the Res Hall units have the highest recycling
rates and (H2) Fraternities have the lowest recycling rates. I am assuming that the organization or
Kao Saechao Recycling determinants May 7 2007
p. 5
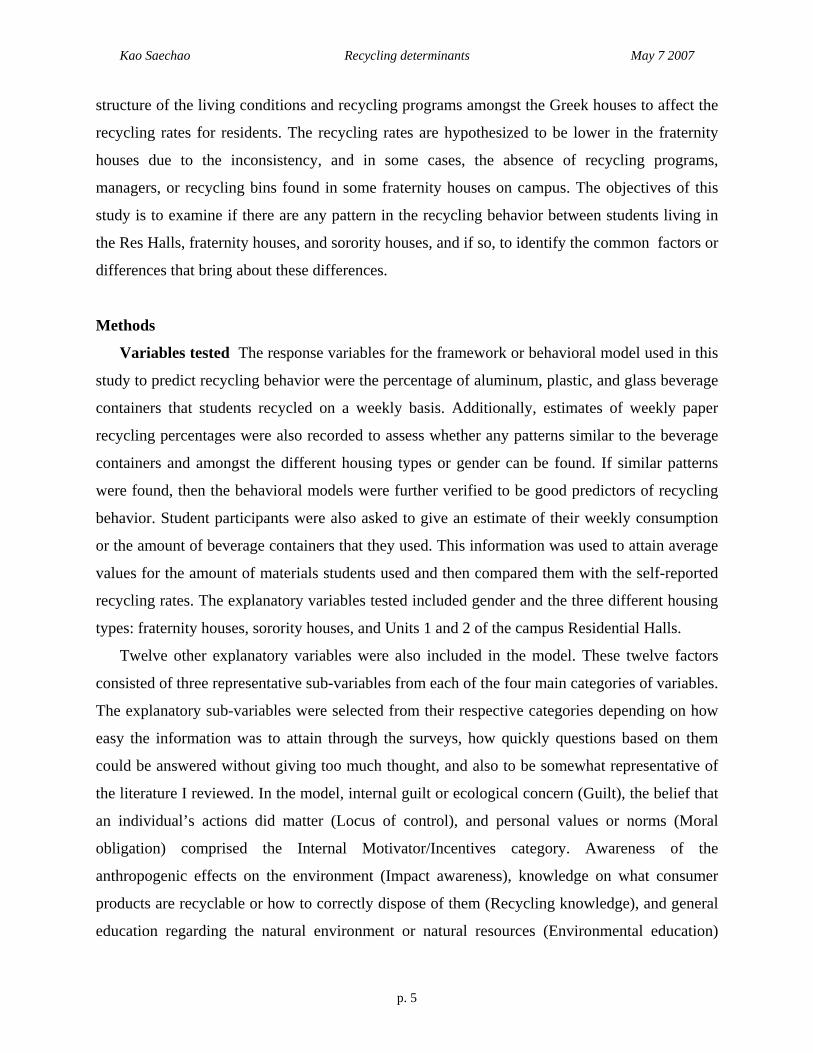
structure of the living conditions and recycling programs amongst the Greek houses to affect the
recycling rates for residents. The recycling rates are hypothesized to be lower in the fraternity
houses due to the inconsistency, and in some cases, the absence of recycling programs,
managers, or recycling bins found in some fraternity houses on campus. The objectives of this
study is to examine if there are any pattern in the recycling behavior between students living in
the Res Halls, fraternity houses, and sorority houses, and if so, to identify the common factors or
differences that bring about these differences.
Methods
Variables tested The response variables for the framework or behavioral model used in this
study to predict recycling behavior were the percentage of aluminum, plastic, and glass beverage
containers that students recycled on a weekly basis. Additionally, estimates of weekly paper
recycling percentages were also recorded to assess whether any patterns similar to the beverage
containers and amongst the different housing types or gender can be found. If similar patterns
were found, then the behavioral models were further verified to be good predictors of recycling
behavior. Student participants were also asked to give an estimate of their weekly consumption
or the amount of beverage containers that they used. This information was used to attain average
values for the amount of materials students used and then compared them with the self-reported
recycling rates. The explanatory variables tested included gender and the three different housing
types: fraternity houses, sorority houses, and Units 1 and 2 of the campus Residential Halls.
Twelve other explanatory variables were also included in the model. These twelve factors
consisted of three representative sub-variables from each of the four main categories of variables.
The explanatory sub-variables were selected from their respective categories depending on how
easy the information was to attain through the surveys, how quickly questions based on them
could be answered without giving too much thought, and also to be somewhat representative of
the literature I reviewed. In the model, internal guilt or ecological concern (Guilt), the belief that
an individual’s actions did matter (Locus of control), and personal values or norms (Moral
obligation) comprised the Internal Motivator/Incentives category. Awareness of the
anthropogenic effects on the environment (Impact awareness), knowledge on what consumer
products are recyclable or how to correctly dispose of them (Recycling knowledge), and general
education regarding the natural environment or natural resources (Environmental education)
Kao Saechao Recycling determinants May 7 2007
p. 6
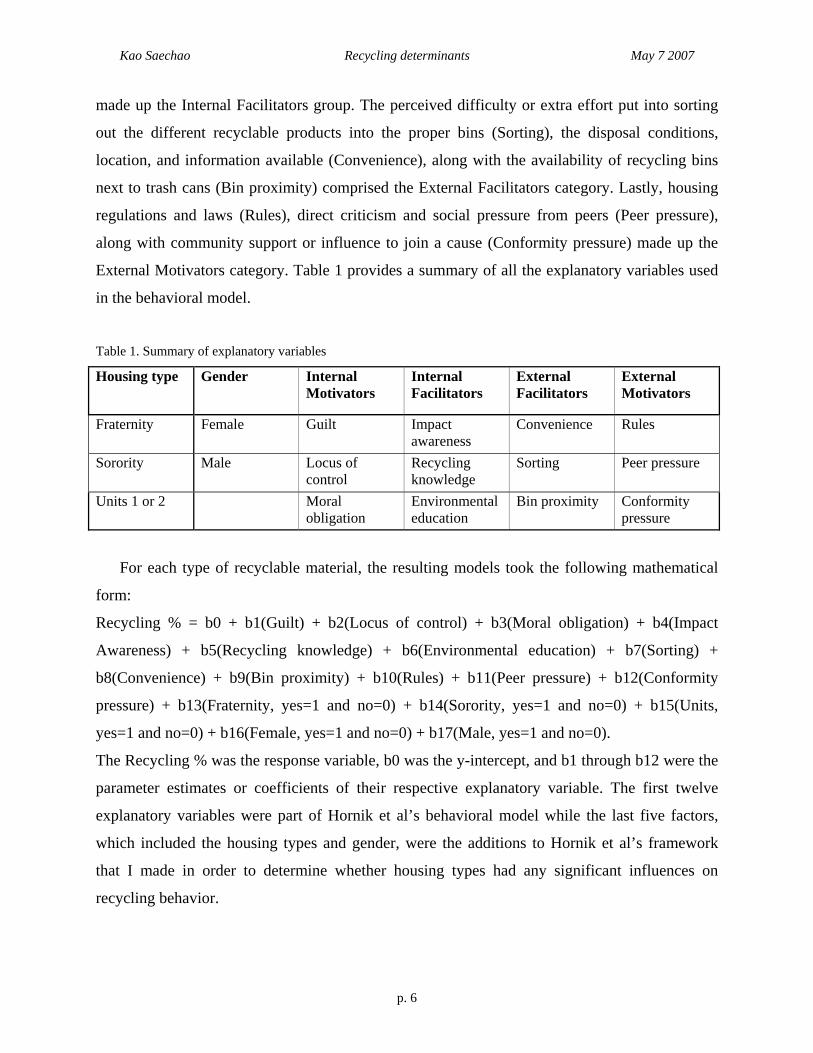
made up the Internal Facilitators group. The perceived difficulty or extra effort put into sorting
out the different recyclable products into the proper bins (Sorting), the disposal conditions,
location, and information available (Convenience), along with the availability of recycling bins
next to trash cans (Bin proximity) comprised the External Facilitators category. Lastly, housing
regulations and laws (Rules), direct criticism and social pressure from peers (Peer pressure),
along with community support or influence to join a cause (Conformity pressure) made up the
External Motivators category. Table 1 provides a summary of all the explanatory variables used
in the behavioral model.
Table 1. Summary of explanatory variables
Housing type Gender Internal Motivators
Internal Facilitators
External Facilitators
External Motivators
Fraternity Female Guilt Impact awareness
Convenience Rules
Sorority Male Locus of control
Recycling knowledge
Sorting Peer pressure
Units 1 or 2 Moral obligation
Environmental education
Bin proximity Conformity pressure
For each type of recyclable material, the resulting models took the following mathematical
form:
Recycling % = b0 + b1(Guilt) + b2(Locus of control) + b3(Moral obligation) + b4(Impact
Awareness) + b5(Recycling knowledge) + b6(Environmental education) + b7(Sorting) +
b8(Convenience) + b9(Bin proximity) + b10(Rules) + b11(Peer pressure) + b12(Conformity
pressure) + b13(Fraternity, yes=1 and no=0) + b14(Sorority, yes=1 and no=0) + b15(Units,
yes=1 and no=0) + b16(Female, yes=1 and no=0) + b17(Male, yes=1 and no=0).
The Recycling % was the response variable, b0 was the y-intercept, and b1 through b12 were the
parameter estimates or coefficients of their respective explanatory variable. The first twelve
explanatory variables were part of Hornik et al’s behavioral model while the last five factors,
which included the housing types and gender, were the additions to Hornik et al’s framework
that I made in order to determine whether housing types had any significant influences on
recycling behavior.
Kao Saechao Recycling determinants May 7 2007
p. 7
Data collection This study was conducted at the University of California, Berkeley campus.
Five fraternity and five sorority organizations were randomly selected from the Greek directory
to voluntarily participate in the study. Students living in Unit 1 and Unit 2, the Res Halls, were
also randomly recruited since they were located in close proximity to the Greek houses. Students
walking in pairs or very small groups near the Res Hall buildings were the main targets to be
recruited in the study since they were easier to manage than larger groups. They were also
thought to be more willing to stop and participate since they had accompaniment.
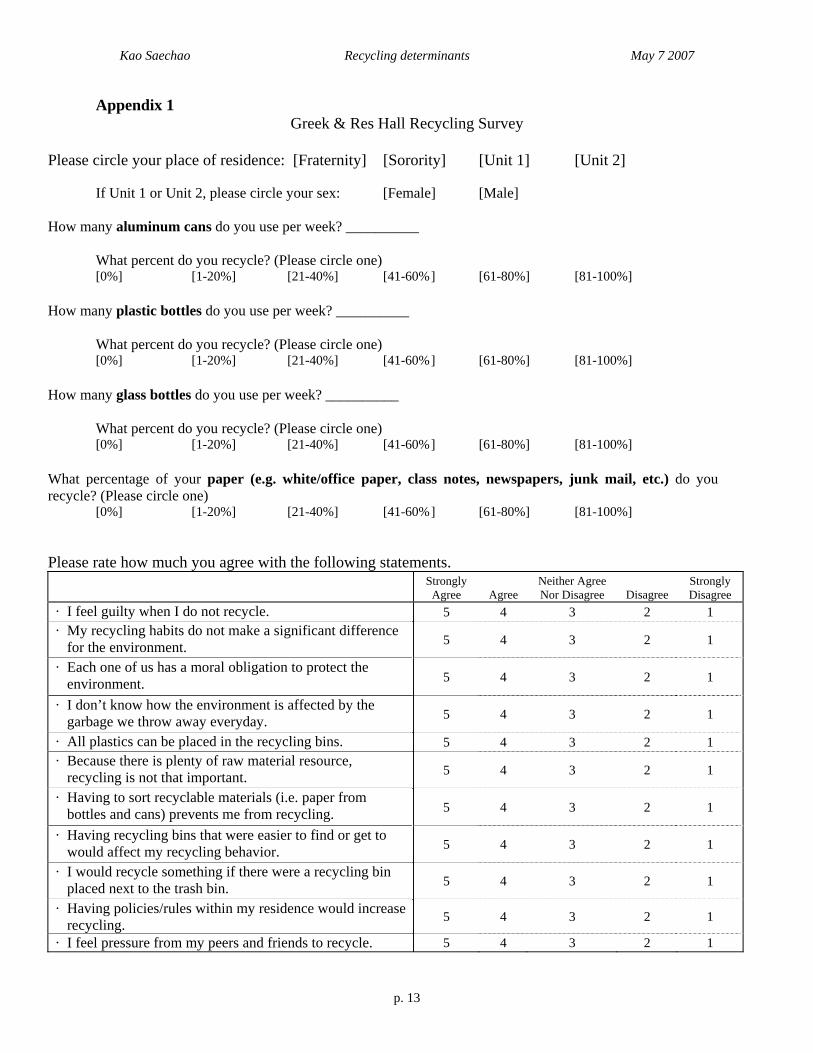
The administered surveys consist of multiple questions based on Likert-type 5-point scales
(see Appendix 1: Sample Questionnaire). Survey participants were asked to identify the degree
to which they agreed or disagreed with statements on the questionnaires. This Likert-type
questionnaire method had been widely used in many similar studies (Corraliza and Berenguer
2000, Do Valle 2004, Meneses and Palacio 2005).
Data analysis The questionnaire data were analyzed through a combination of JMP IN
Version 5.1 software and Microsoft Office Excel 2003 software. Using Excel, basic data
distributions tables and graphical figures were constructed to compare totals and average values
amongst the different response and explanatory variables. Using JMP IN, the stepwise regression
analysis was conducted after fitting a model to the data. The selection process for most
significant factors involved setting the stepwise direction to ‘Mixed’ with the ‘Prob to Enter’
value set at 0.250 and the ‘Prob to Leave’ value set at 0.100. After the stepwise process has
found the most active explanatory variables, a standard least squares regression analysis was
completed with the active variables. This process produced the coefficients or parameter
estimates for all significant active variables along with their standard errors and probability
statistics (p-values). This regression analysis was completed for each of the four different
recyclable material types. For each recyclable material, two trials were conducted. The first trial
was strictly limited to the twelve explanatory variables from Hornik et al’s framework. The
second trial was conducted with the housing types and gender included with the other twelve
explanatory variables. Then the two trials for the same recyclable material types were compared
to one another to see if similar explanatory variables appeared in the final mathematical models.
Lastly, the models for each material type were compared to each other to see if the same
explanatory variables were present.
Kao Saechao Recycling determinants May 7 2007
p. 8
Results
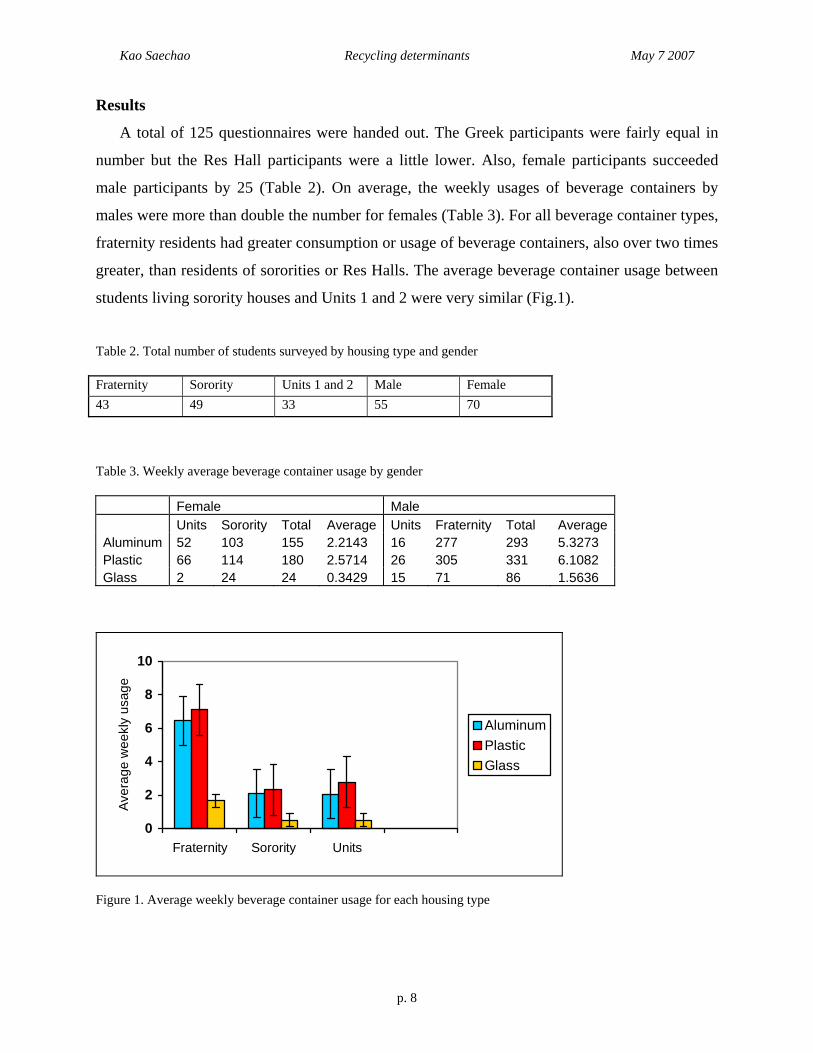
A total of 125 questionnaires were handed out. The Greek participants were fairly equal in
number but the Res Hall participants were a little lower. Also, female participants succeeded
male participants by 25 (Table 2). On average, the weekly usages of beverage containers by
males were more than double the number for females (Table 3). For all beverage container types,
fraternity residents had greater consumption or usage of beverage containers, also over two times
greater, than residents of sororities or Res Halls. The average beverage container usage between
students living sorority houses and Units 1 and 2 were very similar (Fig.1).
Table 2. Total number of students surveyed by housing type and gender Fraternity Sorority Units 1 and 2 Male Female 43 49 33 55 70
Table 3. Weekly average beverage container usage by gender Female Male Units Sorority Total Average Units Fraternity Total Average Aluminum 52 103 155 2.2143 16 277 293 5.3273 Plastic 66 114 180 2.5714 26 305 331 6.1082 Glass 2 24 24 0.3429 15 71 86 1.5636
0
2
4
6
8
10
Fraternity Sorority Units
Aver
age
wee
kly
usag
e
AluminumPlasticGlass
Figure 1. Average weekly beverage container usage for each housing type
Kao Saechao Recycling determinants May 7 2007
p. 9
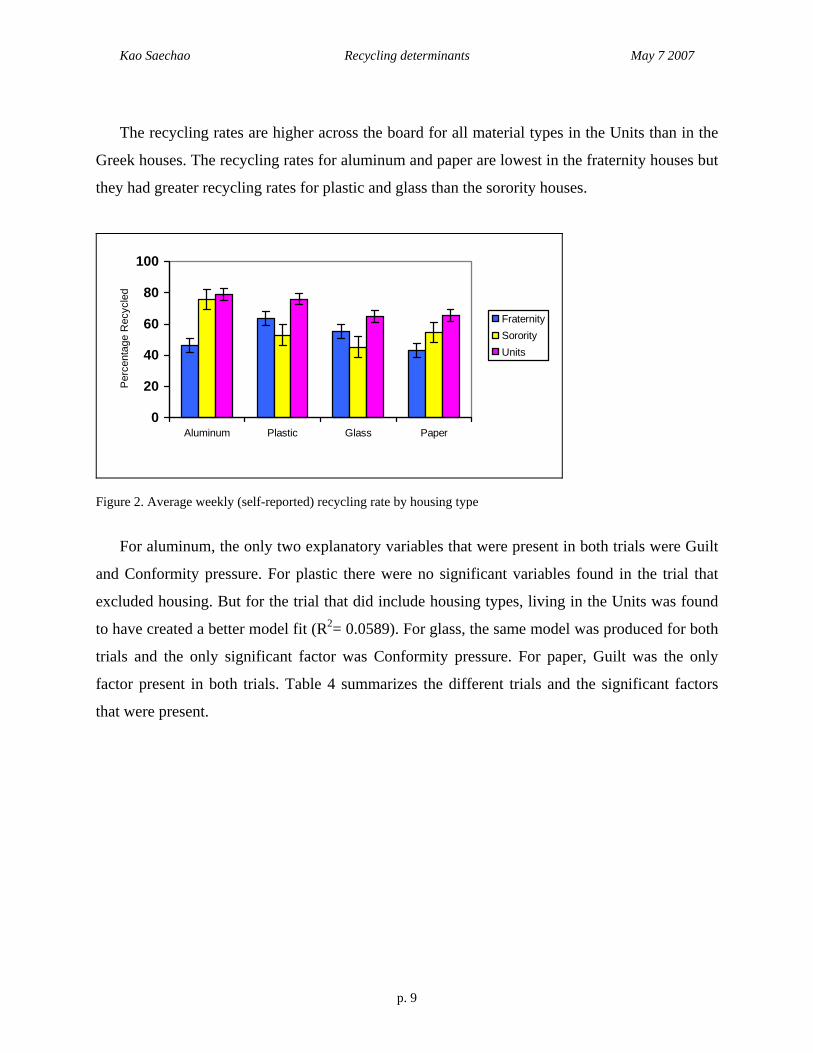
The recycling rates are higher across the board for all material types in the Units than in the
Greek houses. The recycling rates for aluminum and paper are lowest in the fraternity houses but
they had greater recycling rates for plastic and glass than the sorority houses.
0
20
40
60
80
100
Aluminum Plastic Glass Paper
Per
cent
age
Rec
ycle
d
FraternitySororityUnits
Figure 2. Average weekly (self-reported) recycling rate by housing type
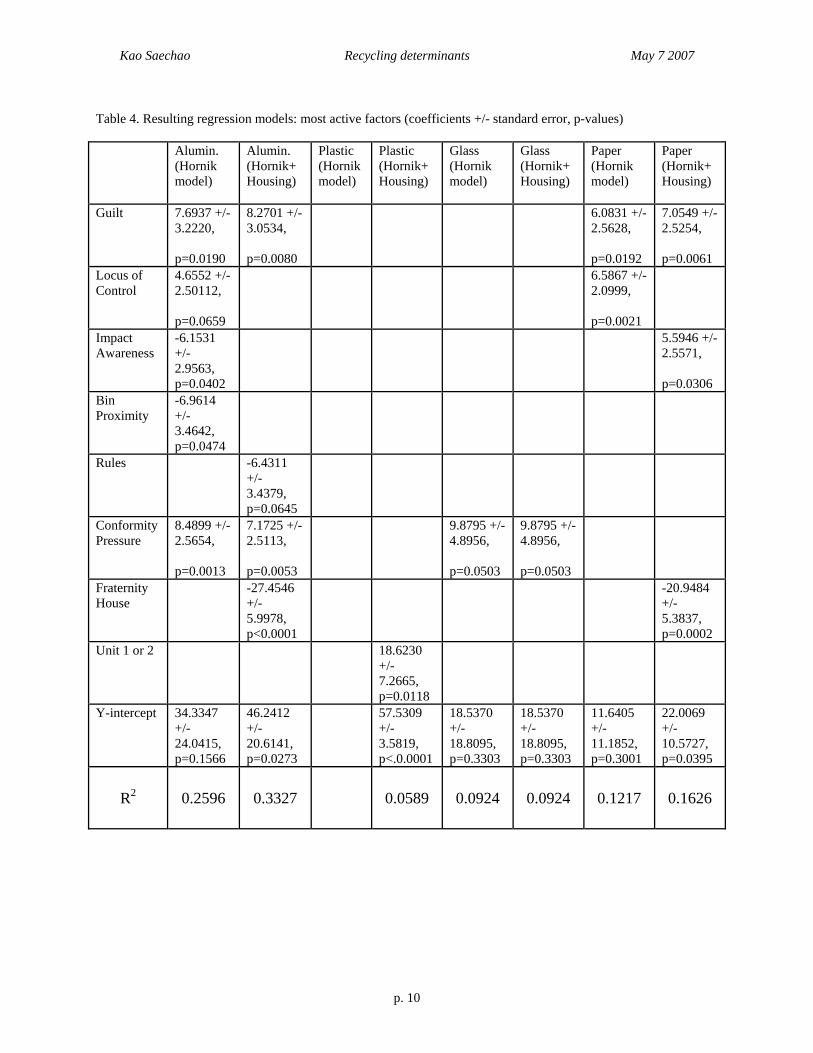
For aluminum, the only two explanatory variables that were present in both trials were Guilt
and Conformity pressure. For plastic there were no significant variables found in the trial that
excluded housing. But for the trial that did include housing types, living in the Units was found
to have created a better model fit (R2= 0.0589). For glass, the same model was produced for both
trials and the only significant factor was Conformity pressure. For paper, Guilt was the only
factor present in both trials. Table 4 summarizes the different trials and the significant factors
that were present.
Kao Saechao Recycling determinants May 7 2007
p. 10
Table 4. Resulting regression models: most active factors (coefficients +/- standard error, p-values) Alumin.
(Hornik model)
Alumin. (Hornik+Housing)
Plastic (Hornik model)
Plastic (Hornik+Housing)
Glass (Hornik model)
Glass (Hornik+Housing)
Paper (Hornik model)
Paper (Hornik+Housing)
Guilt 7.6937 +/- 3.2220, p=0.0190
8.2701 +/- 3.0534, p=0.0080
6.0831 +/- 2.5628, p=0.0192
7.0549 +/- 2.5254, p=0.0061
Locus of Control
4.6552 +/- 2.50112, p=0.0659
6.5867 +/- 2.0999, p=0.0021
Impact Awareness
-6.1531 +/- 2.9563, p=0.0402
5.5946 +/- 2.5571, p=0.0306
Bin Proximity
-6.9614 +/- 3.4642, p=0.0474
Rules -6.4311 +/- 3.4379, p=0.0645
Conformity Pressure
8.4899 +/- 2.5654, p=0.0013
7.1725 +/- 2.5113, p=0.0053
9.8795 +/- 4.8956, p=0.0503
9.8795 +/- 4.8956, p=0.0503
Fraternity House
-27.4546 +/- 5.9978, p<0.0001
-20.9484 +/- 5.3837, p=0.0002
Unit 1 or 2 18.6230 +/- 7.2665, p=0.0118
Y-intercept 34.3347 +/- 24.0415, p=0.1566
46.2412 +/- 20.6141, p=0.0273
57.5309 +/- 3.5819, p<.0.0001
18.5370 +/- 18.8095, p=0.3303
18.5370 +/- 18.8095, p=0.3303
11.6405 +/- 11.1852, p=0.3001
22.0069 +/- 10.5727, p=0.0395
R2 0.2596 0.3327 0.0589 0.0924 0.0924 0.1217 0.1626
Kao Saechao Recycling determinants May 7 2007
p. 11
Discussion
The data did support the first hypothesis that students living in the Res Halls, Units 1 and 2,
did have higher recycling rates. However, hypothesis 2 was not fully supported by the results.
Although students living in fraternity houses did have lowest recycling rates for aluminum and
paper, it was found that they had higher recycling rates for plastic and glass. The results from the
modeling analysis do not strongly support the idea that housing types do have any effect on
recycling behavior. Therefore, my extension of Hornik et al’s (1995) framework failed.
Some factors that could have affect the study are that maybe I had bad data or not enough
data. Some possible flaws with the survey design were that I did not leave the response variables
open to participants to fill in. I opted to have them select from a few ranges of answer in order to
reduce the time participants spent on the questionnaire. This was a tactic I used so participants
would not feel burdened to think critically about the questions. Also, maybe I could have
selected different representative variables for the study. Some students may have over estimated
while some may have underestimated their usage and or recycling rates. However, the lack of
any good support for my models does not mean that housing types do not affect recycling
behavior at all. Future studies can look into measuring actual recycling rates and maybe assess
how well developed of a recycling program exists within the different house types. Examples of
this can include recording bin sizes, bin quantity, or funding.
Acknowledgements
Thank you to Lisa Bauer for helping me get started on this project with ideas. Thank you to
the ES 196 instructors for all their hard work and assistance.
Kao Saechao Recycling determinants May 7 2007
p. 12
References
Bratt, C. 1999. The impact of norms and assumed consequences on recycling behavior. Environment and Behavior 31:630-656.
Cheung, S.F., D.K.S. Chan, and Z.S.Y. Wong. 1999. Reexamining the theory of planned
behavior in understanding wastepaper recycling. Environment and Behavior 31:587-612. Corraliza, J.A. and J. Berenguer. 2000. Environmental values, beliefs, and actions: a situational
approach. Environment and Behavior 32:832-848. Do Valle P.O., E. Reis, J. Menezes, and E. Rebelo. 2004. Behavioral determinants of household
recycling participation: the Portuguese case. Environment and Behavior 36:505-540. Do Valle P.O., E. Rebelo, E. Reis, and J. Menezes. 2005. Combining behavioral theories to
predict recycling involvement. Environment and Behavior 37:364-396. Hornik J., J. Cherian, M. Madansky, and C. Narayana. 1995. Determinants of recycling behavior:
a synthesis of research results. The Journal of Socioeconomics 24:105-127. Meneses, G.D. and A.B. Palacio. 2005. Recycling behavior: a multidimensional approach.
Environment and Behavior 37:837-860. Werner, C.M. and E. Makela. 1998. Motivations and behaviors that support recycling. Journal of
Environmental Psychology 18:373-386.
Kao Saechao Recycling determinants May 7 2007
p. 13
Appendix 1 Greek & Res Hall Recycling Survey
Please circle your place of residence: [Fraternity] [Sorority] [Unit 1] [Unit 2]
If Unit 1 or Unit 2, please circle your sex: [Female] [Male]
How many aluminum cans do you use per week? __________
What percent do you recycle? (Please circle one) [0%] [1-20%] [21-40%] [41-60% ] [61-80%] [81-100%]
How many plastic bottles do you use per week? __________
What percent do you recycle? (Please circle one) [0%] [1-20%] [21-40%] [41-60% ] [61-80%] [81-100%]
How many glass bottles do you use per week? __________
What percent do you recycle? (Please circle one) [0%] [1-20%] [21-40%] [41-60% ] [61-80%] [81-100%]
What percentage of your paper (e.g. white/office paper, class notes, newspapers, junk mail, etc.) do you recycle? (Please circle one)
[0%] [1-20%] [21-40%] [41-60% ] [61-80%] [81-100%] Please rate how much you agree with the following statements.
Strongly Agree Agree
Neither Agree Nor Disagree Disagree
Strongly Disagree
· I feel guilty when I do not recycle. 5 4 3 2 1 · My recycling habits do not make a significant difference
for the environment. 5 4 3 2 1
· Each one of us has a moral obligation to protect the environment. 5 4 3 2 1
· I don’t know how the environment is affected by the garbage we throw away everyday. 5 4 3 2 1
· All plastics can be placed in the recycling bins. 5 4 3 2 1 · Because there is plenty of raw material resource,
recycling is not that important. 5 4 3 2 1
· Having to sort recyclable materials (i.e. paper from bottles and cans) prevents me from recycling. 5 4 3 2 1
· Having recycling bins that were easier to find or get to would affect my recycling behavior. 5 4 3 2 1
· I would recycle something if there were a recycling bin placed next to the trash bin. 5 4 3 2 1
· Having policies/rules within my residence would increase recycling. 5 4 3 2 1
· I feel pressure from my peers and friends to recycle. 5 4 3 2 1
Kao Saechao Recycling determinants May 7 2007
p. 14
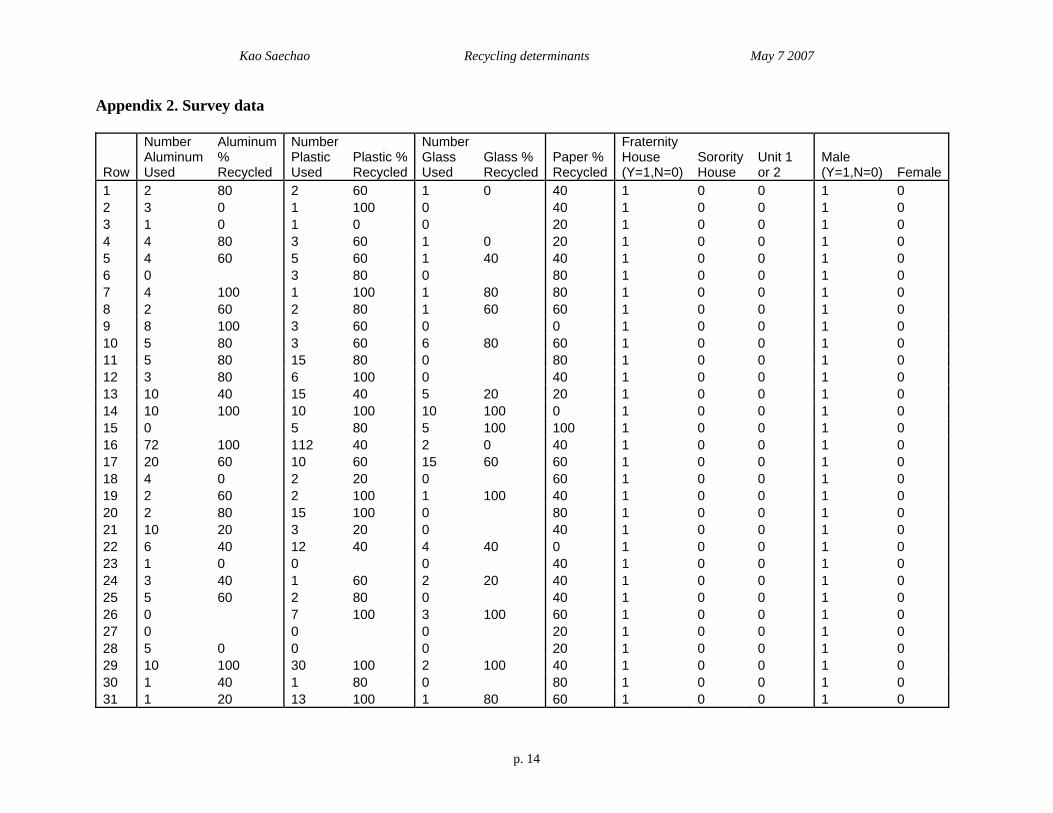
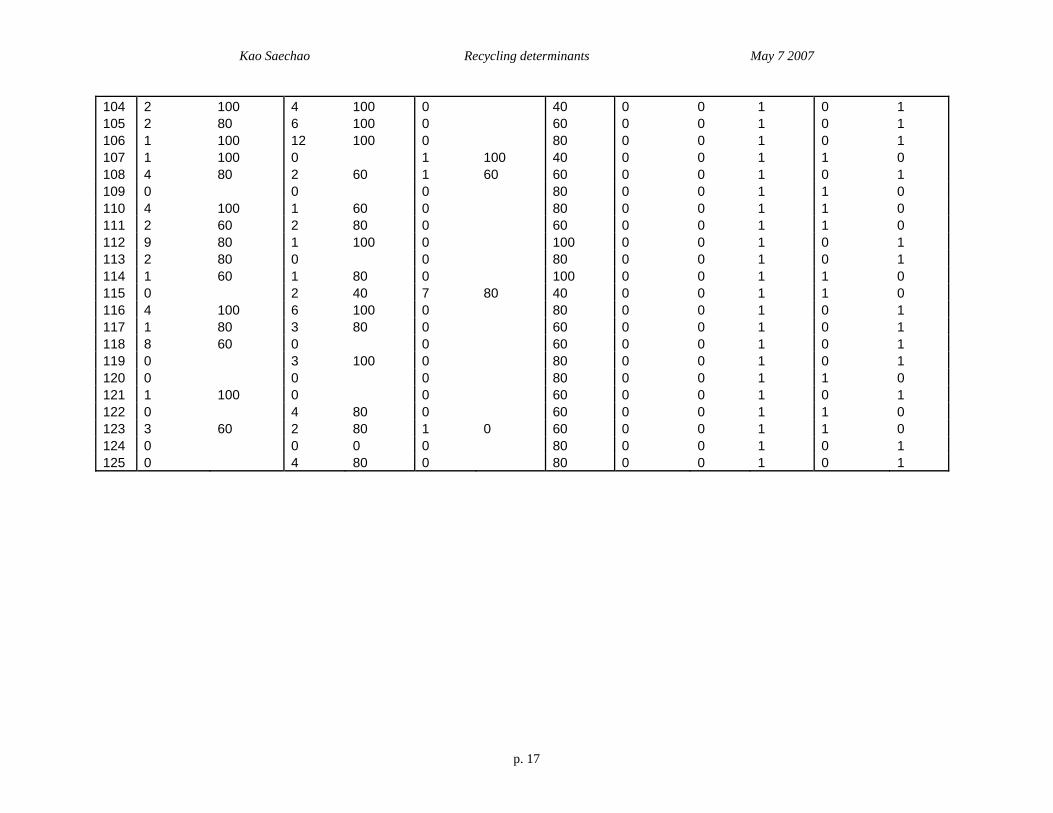
Appendix 2. Survey data
Row
Number Aluminum Used
Aluminum % Recycled
Number Plastic Used
Plastic % Recycled
Number Glass Used
Glass % Recycled
Paper % Recycled
Fraternity House (Y=1,N=0)
Sorority House
Unit 1 or 2
Male (Y=1,N=0) Female
1 2 80 2 60 1 0 40 1 0 0 1 0 2 3 0 1 100 0 40 1 0 0 1 0 3 1 0 1 0 0 20 1 0 0 1 0 4 4 80 3 60 1 0 20 1 0 0 1 0 5 4 60 5 60 1 40 40 1 0 0 1 0 6 0 3 80 0 80 1 0 0 1 0 7 4 100 1 100 1 80 80 1 0 0 1 0 8 2 60 2 80 1 60 60 1 0 0 1 0 9 8 100 3 60 0 0 1 0 0 1 0 10 5 80 3 60 6 80 60 1 0 0 1 0 11 5 80 15 80 0 80 1 0 0 1 0 12 3 80 6 100 0 40 1 0 0 1 0 13 10 40 15 40 5 20 20 1 0 0 1 0 14 10 100 10 100 10 100 0 1 0 0 1 0 15 0 5 80 5 100 100 1 0 0 1 0 16 72 100 112 40 2 0 40 1 0 0 1 0 17 20 60 10 60 15 60 60 1 0 0 1 0 18 4 0 2 20 0 60 1 0 0 1 0 19 2 60 2 100 1 100 40 1 0 0 1 0 20 2 80 15 100 0 80 1 0 0 1 0 21 10 20 3 20 0 40 1 0 0 1 0 22 6 40 12 40 4 40 0 1 0 0 1 0 23 1 0 0 0 40 1 0 0 1 0 24 3 40 1 60 2 20 40 1 0 0 1 0 25 5 60 2 80 0 40 1 0 0 1 0 26 0 7 100 3 100 60 1 0 0 1 0 27 0 0 0 20 1 0 0 1 0 28 5 0 0 0 20 1 0 0 1 0 29 10 100 30 100 2 100 40 1 0 0 1 0 30 1 40 1 80 0 80 1 0 0 1 0 31 1 20 13 100 1 80 60 1 0 0 1 0
Kao Saechao Recycling determinants May 7 2007
p. 15
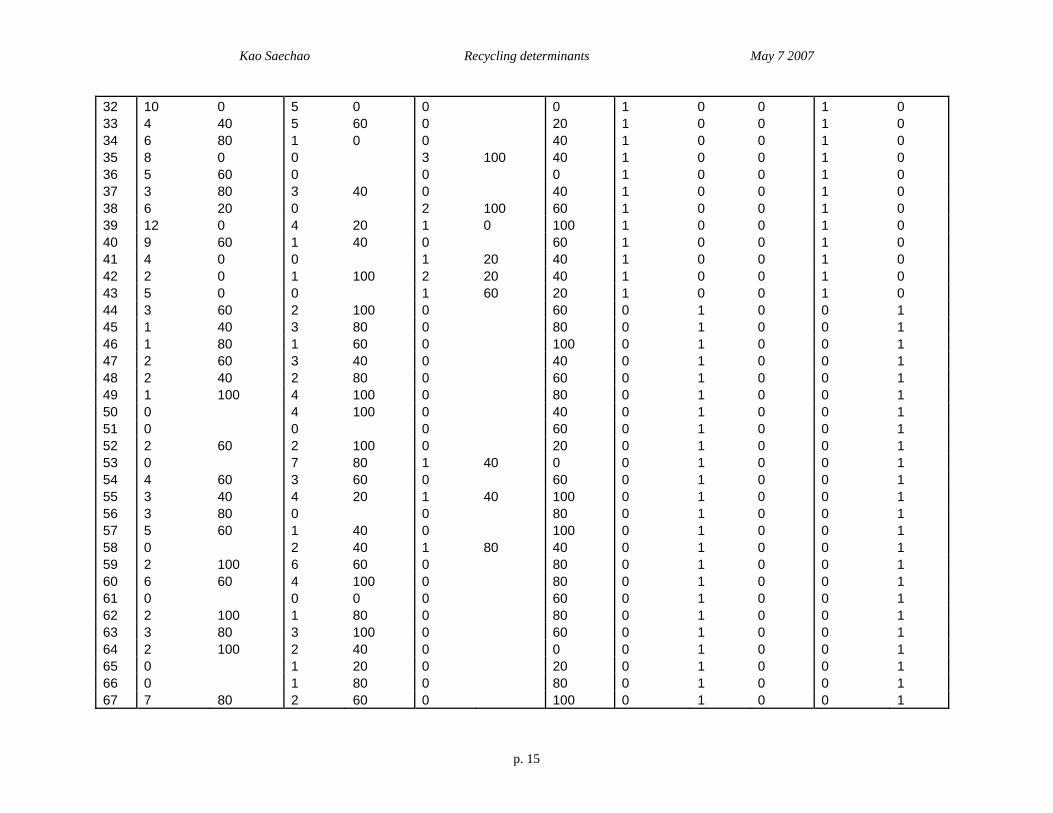
32 10 0 5 0 0 0 1 0 0 1 0 33 4 40 5 60 0 20 1 0 0 1 0 34 6 80 1 0 0 40 1 0 0 1 0 35 8 0 0 3 100 40 1 0 0 1 0 36 5 60 0 0 0 1 0 0 1 0 37 3 80 3 40 0 40 1 0 0 1 0 38 6 20 0 2 100 60 1 0 0 1 0 39 12 0 4 20 1 0 100 1 0 0 1 0 40 9 60 1 40 0 60 1 0 0 1 0 41 4 0 0 1 20 40 1 0 0 1 0 42 2 0 1 100 2 20 40 1 0 0 1 0 43 5 0 0 1 60 20 1 0 0 1 0 44 3 60 2 100 0 60 0 1 0 0 1 45 1 40 3 80 0 80 0 1 0 0 1 46 1 80 1 60 0 100 0 1 0 0 1 47 2 60 3 40 0 40 0 1 0 0 1 48 2 40 2 80 0 60 0 1 0 0 1 49 1 100 4 100 0 80 0 1 0 0 1 50 0 4 100 0 40 0 1 0 0 1 51 0 0 0 60 0 1 0 0 1 52 2 60 2 100 0 20 0 1 0 0 1 53 0 7 80 1 40 0 0 1 0 0 1 54 4 60 3 60 0 60 0 1 0 0 1 55 3 40 4 20 1 40 100 0 1 0 0 1 56 3 80 0 0 80 0 1 0 0 1 57 5 60 1 40 0 100 0 1 0 0 1 58 0 2 40 1 80 40 0 1 0 0 1 59 2 100 6 60 0 80 0 1 0 0 1 60 6 60 4 100 0 80 0 1 0 0 1 61 0 0 0 0 60 0 1 0 0 1 62 2 100 1 80 0 80 0 1 0 0 1 63 3 80 3 100 0 60 0 1 0 0 1 64 2 100 2 40 0 0 0 1 0 0 1 65 0 1 20 0 20 0 1 0 0 1 66 0 1 80 0 80 0 1 0 0 1 67 7 80 2 60 0 100 0 1 0 0 1
Kao Saechao Recycling determinants May 7 2007
p. 16
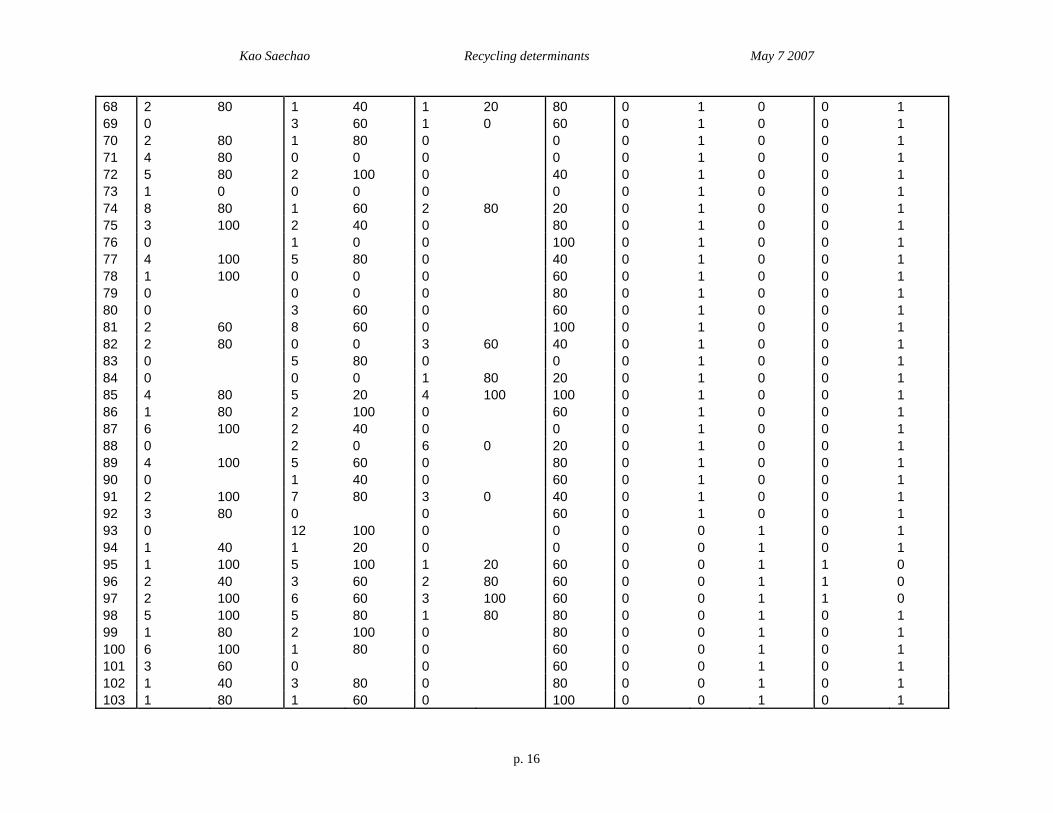
68 2 80 1 40 1 20 80 0 1 0 0 1 69 0 3 60 1 0 60 0 1 0 0 1 70 2 80 1 80 0 0 0 1 0 0 1 71 4 80 0 0 0 0 0 1 0 0 1 72 5 80 2 100 0 40 0 1 0 0 1 73 1 0 0 0 0 0 0 1 0 0 1 74 8 80 1 60 2 80 20 0 1 0 0 1 75 3 100 2 40 0 80 0 1 0 0 1 76 0 1 0 0 100 0 1 0 0 1 77 4 100 5 80 0 40 0 1 0 0 1 78 1 100 0 0 0 60 0 1 0 0 1 79 0 0 0 0 80 0 1 0 0 1 80 0 3 60 0 60 0 1 0 0 1 81 2 60 8 60 0 100 0 1 0 0 1 82 2 80 0 0 3 60 40 0 1 0 0 1 83 0 5 80 0 0 0 1 0 0 1 84 0 0 0 1 80 20 0 1 0 0 1 85 4 80 5 20 4 100 100 0 1 0 0 1 86 1 80 2 100 0 60 0 1 0 0 1 87 6 100 2 40 0 0 0 1 0 0 1 88 0 2 0 6 0 20 0 1 0 0 1 89 4 100 5 60 0 80 0 1 0 0 1 90 0 1 40 0 60 0 1 0 0 1 91 2 100 7 80 3 0 40 0 1 0 0 1 92 3 80 0 0 60 0 1 0 0 1 93 0 12 100 0 0 0 0 1 0 1 94 1 40 1 20 0 0 0 0 1 0 1 95 1 100 5 100 1 20 60 0 0 1 1 0 96 2 40 3 60 2 80 60 0 0 1 1 0 97 2 100 6 60 3 100 60 0 0 1 1 0 98 5 100 5 80 1 80 80 0 0 1 0 1 99 1 80 2 100 0 80 0 0 1 0 1 100 6 100 1 80 0 60 0 0 1 0 1 101 3 60 0 0 60 0 0 1 0 1 102 1 40 3 80 0 80 0 0 1 0 1 103 1 80 1 60 0 100 0 0 1 0 1
Kao Saechao Recycling determinants May 7 2007
p. 17
104 2 100 4 100 0 40 0 0 1 0 1 105 2 80 6 100 0 60 0 0 1 0 1 106 1 100 12 100 0 80 0 0 1 0 1 107 1 100 0 1 100 40 0 0 1 1 0 108 4 80 2 60 1 60 60 0 0 1 0 1 109 0 0 0 80 0 0 1 1 0 110 4 100 1 60 0 80 0 0 1 1 0 111 2 60 2 80 0 60 0 0 1 1 0 112 9 80 1 100 0 100 0 0 1 0 1 113 2 80 0 0 80 0 0 1 0 1 114 1 60 1 80 0 100 0 0 1 1 0 115 0 2 40 7 80 40 0 0 1 1 0 116 4 100 6 100 0 80 0 0 1 0 1 117 1 80 3 80 0 60 0 0 1 0 1 118 8 60 0 0 60 0 0 1 0 1 119 0 3 100 0 80 0 0 1 0 1 120 0 0 0 80 0 0 1 1 0 121 1 100 0 0 60 0 0 1 0 1 122 0 4 80 0 60 0 0 1 1 0 123 3 60 2 80 1 0 60 0 0 1 1 0 124 0 0 0 0 80 0 0 1 0 1 125 0 4 80 0 80 0 0 1 0 1
Kao Saechao Recycling determinants May 7 2007
p. 18
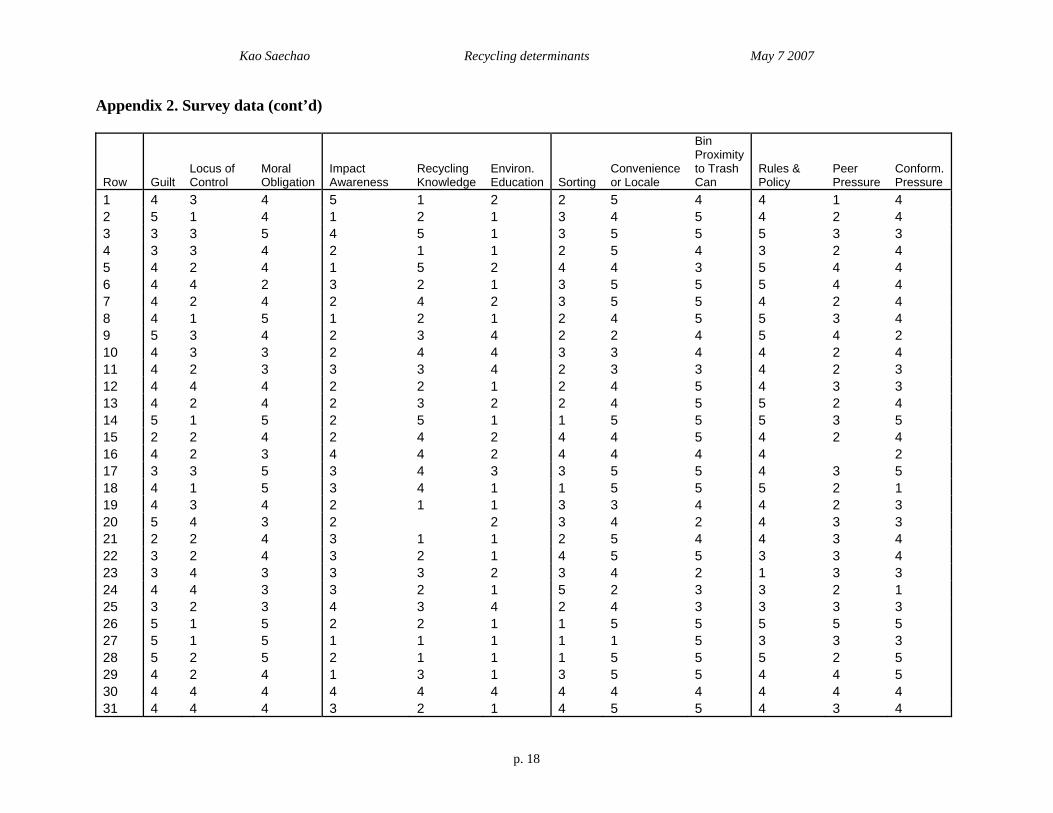
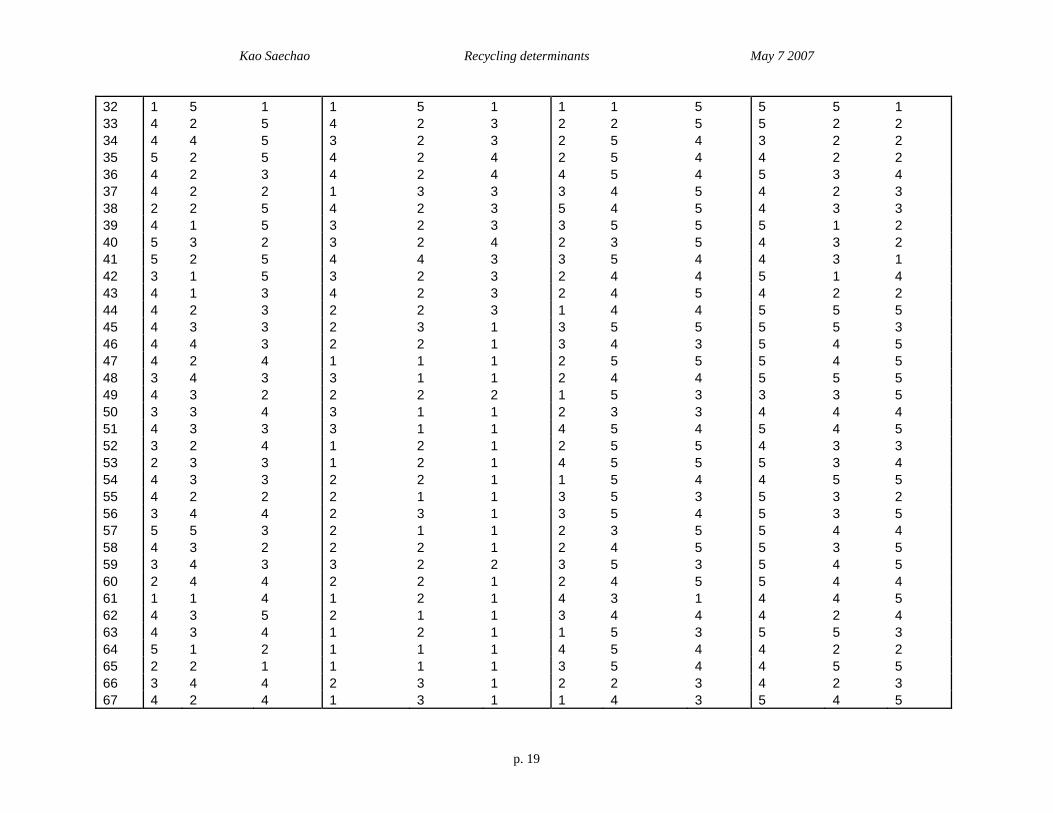
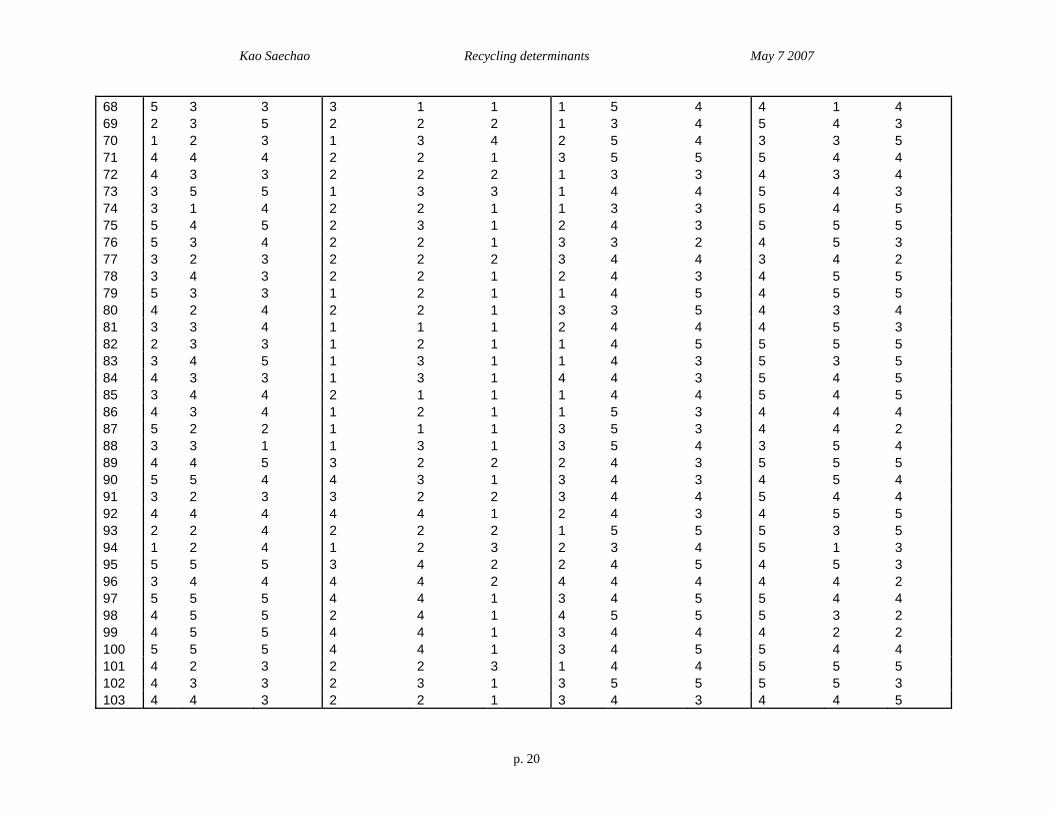
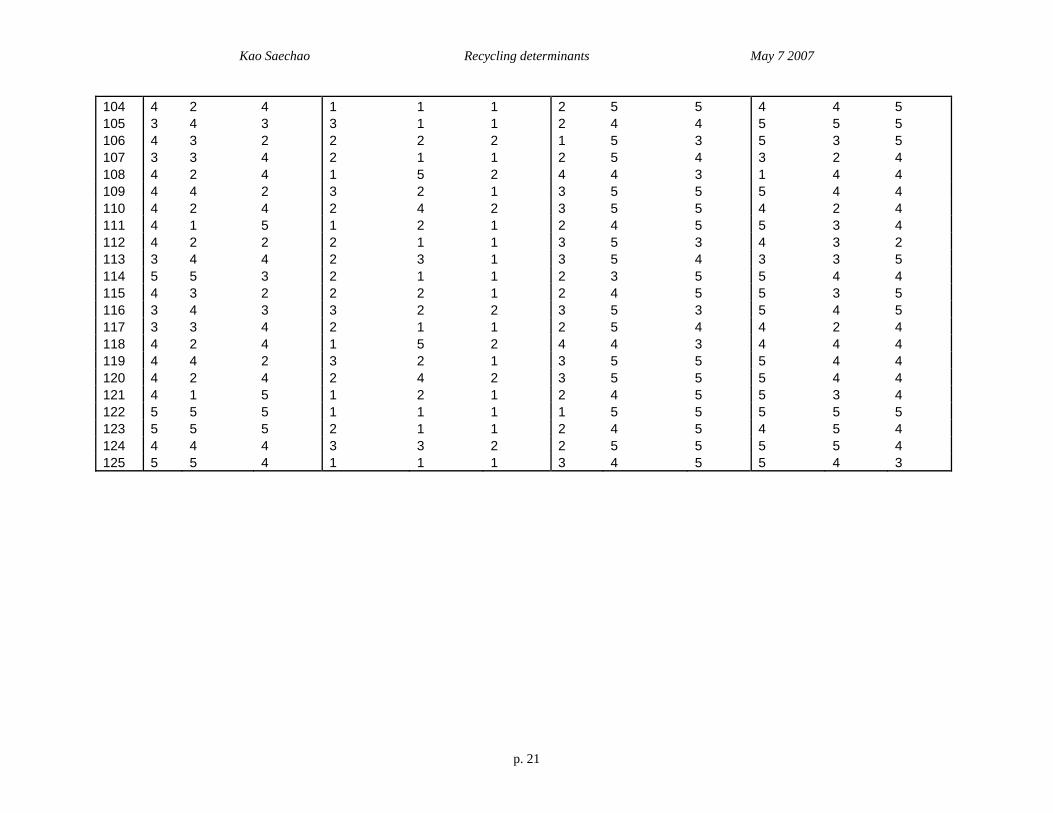
Appendix 2. Survey data (cont’d)
Row Guilt Locus of Control
Moral Obligation
Impact Awareness
Recycling Knowledge
Environ. Education Sorting
Convenience or Locale
Bin Proximity to Trash Can
Rules & Policy
Peer Pressure
Conform. Pressure
1 4 3 4 5 1 2 2 5 4 4 1 4 2 5 1 4 1 2 1 3 4 5 4 2 4 3 3 3 5 4 5 1 3 5 5 5 3 3 4 3 3 4 2 1 1 2 5 4 3 2 4 5 4 2 4 1 5 2 4 4 3 5 4 4 6 4 4 2 3 2 1 3 5 5 5 4 4 7 4 2 4 2 4 2 3 5 5 4 2 4 8 4 1 5 1 2 1 2 4 5 5 3 4 9 5 3 4 2 3 4 2 2 4 5 4 2 10 4 3 3 2 4 4 3 3 4 4 2 4 11 4 2 3 3 3 4 2 3 3 4 2 3 12 4 4 4 2 2 1 2 4 5 4 3 3 13 4 2 4 2 3 2 2 4 5 5 2 4 14 5 1 5 2 5 1 1 5 5 5 3 5 15 2 2 4 2 4 2 4 4 5 4 2 4 16 4 2 3 4 4 2 4 4 4 4 2 17 3 3 5 3 4 3 3 5 5 4 3 5 18 4 1 5 3 4 1 1 5 5 5 2 1 19 4 3 4 2 1 1 3 3 4 4 2 3 20 5 4 3 2 2 3 4 2 4 3 3 21 2 2 4 3 1 1 2 5 4 4 3 4 22 3 2 4 3 2 1 4 5 5 3 3 4 23 3 4 3 3 3 2 3 4 2 1 3 3 24 4 4 3 3 2 1 5 2 3 3 2 1 25 3 2 3 4 3 4 2 4 3 3 3 3 26 5 1 5 2 2 1 1 5 5 5 5 5 27 5 1 5 1 1 1 1 1 5 3 3 3 28 5 2 5 2 1 1 1 5 5 5 2 5 29 4 2 4 1 3 1 3 5 5 4 4 5 30 4 4 4 4 4 4 4 4 4 4 4 4 31 4 4 4 3 2 1 4 5 5 4 3 4
Kao Saechao Recycling determinants May 7 2007
p. 19
32 1 5 1 1 5 1 1 1 5 5 5 1 33 4 2 5 4 2 3 2 2 5 5 2 2 34 4 4 5 3 2 3 2 5 4 3 2 2 35 5 2 5 4 2 4 2 5 4 4 2 2 36 4 2 3 4 2 4 4 5 4 5 3 4 37 4 2 2 1 3 3 3 4 5 4 2 3 38 2 2 5 4 2 3 5 4 5 4 3 3 39 4 1 5 3 2 3 3 5 5 5 1 2 40 5 3 2 3 2 4 2 3 5 4 3 2 41 5 2 5 4 4 3 3 5 4 4 3 1 42 3 1 5 3 2 3 2 4 4 5 1 4 43 4 1 3 4 2 3 2 4 5 4 2 2 44 4 2 3 2 2 3 1 4 4 5 5 5 45 4 3 3 2 3 1 3 5 5 5 5 3 46 4 4 3 2 2 1 3 4 3 5 4 5 47 4 2 4 1 1 1 2 5 5 5 4 5 48 3 4 3 3 1 1 2 4 4 5 5 5 49 4 3 2 2 2 2 1 5 3 3 3 5 50 3 3 4 3 1 1 2 3 3 4 4 4 51 4 3 3 3 1 1 4 5 4 5 4 5 52 3 2 4 1 2 1 2 5 5 4 3 3 53 2 3 3 1 2 1 4 5 5 5 3 4 54 4 3 3 2 2 1 1 5 4 4 5 5 55 4 2 2 2 1 1 3 5 3 5 3 2 56 3 4 4 2 3 1 3 5 4 5 3 5 57 5 5 3 2 1 1 2 3 5 5 4 4 58 4 3 2 2 2 1 2 4 5 5 3 5 59 3 4 3 3 2 2 3 5 3 5 4 5 60 2 4 4 2 2 1 2 4 5 5 4 4 61 1 1 4 1 2 1 4 3 1 4 4 5 62 4 3 5 2 1 1 3 4 4 4 2 4 63 4 3 4 1 2 1 1 5 3 5 5 3 64 5 1 2 1 1 1 4 5 4 4 2 2 65 2 2 1 1 1 1 3 5 4 4 5 5 66 3 4 4 2 3 1 2 2 3 4 2 3 67 4 2 4 1 3 1 1 4 3 5 4 5
Kao Saechao Recycling determinants May 7 2007
p. 20
68 5 3 3 3 1 1 1 5 4 4 1 4 69 2 3 5 2 2 2 1 3 4 5 4 3 70 1 2 3 1 3 4 2 5 4 3 3 5 71 4 4 4 2 2 1 3 5 5 5 4 4 72 4 3 3 2 2 2 1 3 3 4 3 4 73 3 5 5 1 3 3 1 4 4 5 4 3 74 3 1 4 2 2 1 1 3 3 5 4 5 75 5 4 5 2 3 1 2 4 3 5 5 5 76 5 3 4 2 2 1 3 3 2 4 5 3 77 3 2 3 2 2 2 3 4 4 3 4 2 78 3 4 3 2 2 1 2 4 3 4 5 5 79 5 3 3 1 2 1 1 4 5 4 5 5 80 4 2 4 2 2 1 3 3 5 4 3 4 81 3 3 4 1 1 1 2 4 4 4 5 3 82 2 3 3 1 2 1 1 4 5 5 5 5 83 3 4 5 1 3 1 1 4 3 5 3 5 84 4 3 3 1 3 1 4 4 3 5 4 5 85 3 4 4 2 1 1 1 4 4 5 4 5 86 4 3 4 1 2 1 1 5 3 4 4 4 87 5 2 2 1 1 1 3 5 3 4 4 2 88 3 3 1 1 3 1 3 5 4 3 5 4 89 4 4 5 3 2 2 2 4 3 5 5 5 90 5 5 4 4 3 1 3 4 3 4 5 4 91 3 2 3 3 2 2 3 4 4 5 4 4 92 4 4 4 4 4 1 2 4 3 4 5 5 93 2 2 4 2 2 2 1 5 5 5 3 5 94 1 2 4 1 2 3 2 3 4 5 1 3 95 5 5 5 3 4 2 2 4 5 4 5 3 96 3 4 4 4 4 2 4 4 4 4 4 2 97 5 5 5 4 4 1 3 4 5 5 4 4 98 4 5 5 2 4 1 4 5 5 5 3 2 99 4 5 5 4 4 1 3 4 4 4 2 2 100 5 5 5 4 4 1 3 4 5 5 4 4 101 4 2 3 2 2 3 1 4 4 5 5 5 102 4 3 3 2 3 1 3 5 5 5 5 3 103 4 4 3 2 2 1 3 4 3 4 4 5
Kao Saechao Recycling determinants May 7 2007
p. 21
104 4 2 4 1 1 1 2 5 5 4 4 5 105 3 4 3 3 1 1 2 4 4 5 5 5 106 4 3 2 2 2 2 1 5 3 5 3 5 107 3 3 4 2 1 1 2 5 4 3 2 4 108 4 2 4 1 5 2 4 4 3 1 4 4 109 4 4 2 3 2 1 3 5 5 5 4 4 110 4 2 4 2 4 2 3 5 5 4 2 4 111 4 1 5 1 2 1 2 4 5 5 3 4 112 4 2 2 2 1 1 3 5 3 4 3 2 113 3 4 4 2 3 1 3 5 4 3 3 5 114 5 5 3 2 1 1 2 3 5 5 4 4 115 4 3 2 2 2 1 2 4 5 5 3 5 116 3 4 3 3 2 2 3 5 3 5 4 5 117 3 3 4 2 1 1 2 5 4 4 2 4 118 4 2 4 1 5 2 4 4 3 4 4 4 119 4 4 2 3 2 1 3 5 5 5 4 4 120 4 2 4 2 4 2 3 5 5 5 4 4 121 4 1 5 1 2 1 2 4 5 5 3 4 122 5 5 5 1 1 1 1 5 5 5 5 5 123 5 5 5 2 1 1 2 4 5 4 5 4 124 4 4 4 3 3 2 2 5 5 5 5 4 125 5 5 4 1 1 1 3 4 5 5 4 3