determinants of risk tolerance and investment behaviour846375/fulltext01.pdf · religion) and (i)...
TRANSCRIPT

Student
and Economics
Spring semester 2015
1st Year Master’s thesis, 15 ECTS
Determinants of risk tolerance and investment
behaviour:
A study of French and Swedish Business School students
Authors: Yann Massol Alexis Molines
Supervisor: Anna Thorsell

I
Acknowledgement
We would like to thank everyone who has helped us during the writing of this thesis. We
would especially like to express our deepest feelings to our thesis supervisor, Anna Thorsell,
for many helpful comments and suggestions. We were very lucky to be supervised by Anna,
her help was invaluable for us to finish our research on time. Further we would also like to
show our gratitude t the e S h si ess a E i s r i i s the
opportunity to write this thesis and providing us with all the resources needed to successfully
complete the study. Finally, we are giving our sincere feelings to Miss Lions (Senior Lecturer
at Umea University), Miss Berbara (Center for Personal and Professional Development at
ICN Business School) and Mister Celse (Associate Professor in Organizational Behaviour at
Burgundy School of Business) for their help in the distribution of our survey.
Yann Massol and Alexis Molines
e , the 18th
of May 2015

II
Abstract
Through this paper, our first wish is t st y st e t’s i est e t beha i r a risk
tolerance and the possible connection between these two concepts. By comparing the features
of student investors with those of adults, we want to know if risk tolerance and investment
behaviour biases arise after years of trading, influence of peers, evolution of marital status or
if they are already present in young adults. Risk tolerance and financial behaviours are two
concepts that should be analysed in order to understand portfolio decisions and market
behaviour.
“W at ar t d t r a t r k t ra a d v t t b av r t d t a d
is there a relationship between risk tolerance and investment behaviour?”
In order to answer the research question, a quantitative process with a deductive approach
was conducted. The data were collected from French and Swedish Business School students
with the help of a questionnaire.
Various analyses on the possible influence of demographics such as gender, nationality,
religion and field of study on the level of students’ risk t era e a beha i r biases
(overconfidence, cognitive dissonance and regret) were performed.
The e piri a res ts sh we that st e ts ’t rea t as a ts. Th s, either ati a ity, r
gender, nor religion play a role in influencing their risk tolerance. Nevertheless, one
significant relationship between field of study and the level of risk tolerance was observed.
We concluded that the field of study might influence the risk tolerance of students.
With respect to investment behaviour, more correlations were discovered. If overconfidence
is not influenced by our demographics, different levels of cognitive dissonance seem to be in
relationship with st e t’s re i i a ie st y. A s , re ret see s t be i e e by
their nationalities, religions and field of studies. These findings appear to be in contradiction
with previous research regarding the whole population. It may be evidence that st e ts ’t
react as adults when it comes to investment behaviour in the financial markets.
Finally, the last analysis suggests a possible relationship between risk tolerance and
investment behaviour for students. The empirical results show that overconfident students
have a high level of risk tolerance. Similarly, risk tolerant students own a high degree of
cognitive dissonance.
All these results could be analysed more thoroughly by future scholars. Right now portfolio
managers and brokers are only evaluating the risk profile of their customers before investing
their money. However, if behavioural biases play a role in influencing the risk tolerance of
investors, they also should be assessed. This would allow having a better understanding of
i est r’s psy h y.

III
TABLE OF CONTENTS
1. INTRODUCTION .................................................................................................................. 1
1.1 INVESTMENT BEHAVIOUR AND ITS BIASES .................................................................... 1
1.2 RISK TOLERANCE AND ITS DETERMINANTS .................................................................. 2
1.3 A SPECIFIC FOCUS ON STUDENTS ................................................................................... 3
1.4 RESEARCH GAPS ............................................................................................................ 4
1.5 SIGNIFICANCE OF THE RESEARCH ................................................................................. 4
1.6 RESEARCH QUESTION .................................................................................................... 5
2. SCIENTIFIC METHODOLOGY .............................................................................................. 6
2.1 ONTOLOGY .................................................................................................................... 6
2.2 EPISTEMOLOGY ............................................................................................................. 6
2.3 PRE-UNDERSTANDINGS .................................................................................................. 6
2.4 LITERATURE REVIEW .................................................................................................... 7
2.5 RESEARCH APPROACH ................................................................................................... 8
2.6 RESEARCH DESIGN....................................................................................................... 10
3. THEORETICAL FRAMEWORK ........................................................................................... 12
3.1 KEY CONCEPTS ............................................................................................................ 12
3.1.1 Theory of emerging adulthood ................................................................................ 12
3.1.2 Risk and risk tolerance ............................................................................................ 12
3.1.3 Behavioural finance ................................................................................................. 14
3.1.4 Investment behaviour biases .................................................................................... 14
3.1.5 Relationship between risk tolerance and investment behaviour ............................. 16
3.1.6 Relationship between stockholding and demographics ........................................... 17
3.2 HYPOTHESES ................................................................................................................ 18
3.3 CONCEPTUAL MODEL .................................................................................................. 19
4. PRACTICAL METHOD ....................................................................................................... 20
4.1 DATA COLLECTION METHODS ..................................................................................... 20
4.2 STYLE OF QUESTIONNAIRE .......................................................................................... 20
4.3 SAMPLE ........................................................................................................................ 22
4.4 QUANTITATIVE DATA ANALYSIS .................................................................................. 23
4.4.1 Cronbach’s alpha .................................................................................................... 23
4.4.2 Descriptive statistics ................................................................................................ 23
4.5 QUALITY CRITERIA ..................................................................................................... 25
4.6 ETHICAL CONSIDERATIONS ......................................................................................... 26
5. EMPIRICAL FINDINGS AND ANALYSIS ............................................................................. 27
5.1 DEMOGRAPHICS........................................................................................................... 27
5.2 CRONBACH’S ALPHA ................................................................................................... 28
5.3 STATISTICAL ANALYSIS ............................................................................................... 29
5.3.1 Risk tolerance and its determinants......................................................................... 29
5.3.2 Overconfidence and its determinants ...................................................................... 30
5.3.3 Cognitive dissonance and its determinants ............................................................. 31

IV
5.3.4 Regret and its determinants ..................................................................................... 33
5.3.5 Is there a relationship between risk tolerance and investment behaviour of
students? ........................................................................................................................... 34
5.4 OTHER FINDINGS ......................................................................................................... 35
6. DISCUSSION ...................................................................................................................... 37
7. CONCLUSION .................................................................................................................... 41
7.1 ANSWER TO OUR RESEARCH QUESTION ...................................................................... 41
7.2 CONTRIBUTION ............................................................................................................ 42
7.2.1 Research contribution.............................................................................................. 42
7.2.2 Practical contribution.............................................................................................. 42
7.3 PROBLEM WE FACED ................................................................................................... 43
7.4 RECOMMENDATIONS FOR FURTHER RESEARCH ......................................................... 44
LIST OF REFERENCES ............................................................................................................ 1
APPENDIX A ........................................................................................................................ 12
APPENDIX B ......................................................................................................................... 16
APPENDIX C ........................................................................................................................ 16
APPENDIX D ........................................................................................................................ 17
APPENDIX E ......................................................................................................................... 17
APPENDIX F ......................................................................................................................... 18
APPENDIX G ........................................................................................................................ 18
APPENDIX H ........................................................................................................................ 19

V
LIST OF FIGURES
FIGURE 1: CONCEPTUAL MODEL ............................................................................................... 19

VI
LIST OF TABLES
TABLE 1: QUANTITATIVE RESEARCH PROCESS (BRYMAN & BELL, 2011, P. 151) ........................ 9
TABLE 2: “SIG.” VALUES FOUND USING SHAPIRO-WILK'S TESTS ............................................... 24
TABLE 3: “SIG.” VALUES FOUND USING LEVENE’S TESTS .......................................................... 25
TABLE 4: CRONBACH’S ALPHA.................................................................................................. 29
TABLE 5: STATISTICS RELATED TO RISK TOLERANCE ................................................................. 29
TABLE 6: STATISTICS RELATED TO OVERCONFIDENCE ............................................................... 30
TABLE 7: STATISTICS RELATED TO COGNITIVE DISSONANCE ..................................................... 31
TABLE 8: STATISTICS RELATED TO REGRET ............................................................................... 33
TABLE 9: STATISTICS RELATED TO RISK TOLERANCE AND OUR INVESTMENT BIASES ................. 34

1
1. Introduction
People are facing risk in their daily life. Willingness to take risk can be analysed by looking
at someone behaviour in the street, on the road while driving and in many other cases. In
finance, being aware of financial risk is an important matter to achieve investment goals. Risk
tolerance and financial behaviour are two concepts that should be analysed in order to
understand portfolio decisions. In the present thesis, we will study the correlation, with
respect to students, between some demographics (gender, nationality, field of study and
religion) and (i) risk tolerance and (ii) investment behaviour with a focus on three major
biases: overconfidence, regret and cognitive dissonance. We will then investigate if there is a
correlation between risk tolerance and investment behaviour for students. We start this thesis
by an overall presentation of the main questions that motivated us to write this thesis: why are
investment behaviour and risk tolerance interesting topics? Why are students interesting?
Why should they react differently from others? How do we contribute to research? To
practice? Then, we present the literature review, concerning risk tolerance and investment
behaviour that has set the theoretical foundation of this paper. Finally, we analyse the main
research gaps and formulate our research question and the purposes of this thesis.
1.1 Investment behaviour and its biases
In the last two decades, a new field known as behavioural finance has become to emerge in
the finance industry. Today, lots of financial institutions propose financial services built on
results based on behavioural finance. For example, contribution pension plans use findings
grounded in behavioural finance in order to help people to invest their retirement money.
Likewise, many hedge funds and asset managers use strategies based on behavioural finance
in order to improve their investment strategies and their overall portfolio returns.
Behavioural finance, as its name would suggest, try to improve our knowledge of financial
markets and its different participants by using expertise from behavioural sciences like
sociology and psychology (Ricciardi and Simon, 2000, p. 1). This concept is in contradiction
with the traditional finance paradigm, which aims at understanding financial decisions by
supposing markets and its participants (named the economic agents) are rational, which
means that they should act in order to maximize their self-interests (Ritter, 2003, p. 429).
Even if this concept sounds attracting and have been argued by many researchers, it involves
strong assumptions regarding the financial markets and human behaviours. It supposes, for
instance, that economic agents understand all the effects of their actions and that they fully
integrate and process all the available information. Furthermore, it assumes that financial
markets are stable (i.e. the fundamental value of a security is reflected by its price) and that
traders correct the influence of irrational market participants (Barberis and Thaler, 2003, p.
1055).
However, it seems that financial markets and its participants do not have all of these
characteristics (Kahneman, 1973, p. 238). People take choices that differ from those of
rational agents: they may have social considerations, like not investing in tobacco firms
(Kahneman and Tversky, 1979, p. 270), they have limitations to resolve complicated
problems and they face difficulties to treat information (Simon, 1957). Moreover, traders are
limited in their possibilities to correct non-rational behaviours (Barberis and Thaler, 2003, p.
1055). Consequently, classic finance theories may not reflect financial behaviour accurately.
Many papers confirm this proposal and demonstrate that the traditional paradigm is too

2
restrictive. For example, bond and stock returns can be predicted by using macroeconomic
ariab es a i est r’s se ti e t eas res (White aw, 1994, p. 522, Cre ers, 2002, p.
1228, Avramov, 2004, p. 701, Baker and Wurgler, 2007, p. 129). Therefore, market prices
’t re e t a i r ati . y trast, er s re e t st ies pr e that behavioural
i a e the ries a exp ai phe e a that the tra iti a i a e the ries a ’t. F r
instance Daniel, Hirshleifer and Subrahmanyam (1998, p. 1839), Barberis, Shleifer and
Vishny (1998, p. 307) give clarification about the low/high returns of stocks in the wake of
bad/good earning perspectives. Also, Shefrin and Statman (1984, p. 255) prove that
behavioural finance is able to explain why companies pay dividends despite dividends have
tax disadvantages. Moreover, results from behavioural finance appear to be reliable in order
to improve investment strategies for retirement (Benartzi and Thaler, 2004, p. 173).
Baltussen (2003, p. 32) demonstrates that behavioural finance can, in many situations,
explain more accurately than the financial finance paradigm, the behaviour of financial
markets and its participants. Many questions are still unresolved by this field of study. For
instance, when do people become excessively pessimistic or optimistic? What consequences
does it have on markets? How do people construct their portfolios? Given that behavioural
finance is to be continued, we wanted to try to participate to the development of this field.
Thus, we will analyse the correlation between three major biases of investment behaviour:
overconfidence, regret and cognitive dissonance with some demographics: gender,
nationality, religion and field of study. In addition, we found some previous works held on
the possible relationship between risk tolerance and investment behaviour. It appears that
some biases such as regret and overconfidence could have an impact on the risk tolerance of
an individual. Given that investors risk attitude is elastic, it could change easily with
economic and emotional factors. (Ackert, Church and Deaves, 2003, p. 33-39, Gervais et al.,
2011, p. 1735-1777, Malmendier and Tate, 2005, p. 2661-2700). Further explanations about
these investment biases and their possible influence on risk tolerance are detailed in the
theoretical framework.
1.2 Risk tolerance and its determinants
Risk t era e, a i i i a ’s attit e t war s withsta i risk, is a i p rta t p e t
in investing. It impacts both financial service consumers and providers. For financial service
consumers, risk tolerance is a key element to determine the optimal composition of assets in a
portfolio with respect to the risk and the relative return (Droms, 1987, p. 114). For fund
managers, Jacobs and Levy (1996, p. 10 - 16) demonstrate that the incapacity to efficiently
determine investor risk aversion can create homogeneity among investment funds. In
addition, Schirripa and Tecotzky (2000, p. 29 - 40) assert that it is possible to optimize the
standard Markowitz portfolio optimization process by gathering investors with different risk
tolerance into a single efficient portfolio by conserving the groups average risk tolerance.
In spite of its significance in the financial service industry, there are still some unsolved
q esti s re ar i the “ eter i a ts” risk t era e. E e i ts a t rs ha e bee
tested, a brief literature review of the results shows a lack of consensus. Also, to the best of
our knowledge, no papers are focusing on student risk tolerance and the possible connection
between this last concept and investment behaviour. Thus, we will try to analyse this specific
issue.
Each investor has his own level of risk tolerance depending on several factors. According to
previous researchers, some demographics can significantly influence risk tolerance. They

3
found relationships between risk tolerance and gender. Thus, women should be more risk
averse than men (Bajtelsmit & Bernasek (1996, p. 1), Powell and Ansic (1997, p. 605) and
Grable (2000,p. 625 - 630). Then, individuals with higher education are generally more risk
tolerant (Haliassos and Bertaut, 1995, p. 1110; Sung & Hanna, 1996,p. 11). For Cummings et
al (1971), nationality can play a role in impacting the risk tolerance of someone. But
according to Bartke and Schwarze (2008), nationality is not relevant to explain risk tolerance
differences between countries. The differences observed are related to other factors such as
religion. Religious people are in general more risk averse than atheists (Miller and Hoffmann,
1995, p. 63). Discrepancies are also found in risk taking behaviours among religions. Other
determinants such as age or wealth can influence risk-taking behaviours. Nevertheless, we
will not focus deeply on them, as there are determinants that a ’t i e e st e t’s attit e
toward risk. Despite these findings, risk tolerance is a field of study very controversial and
lots of researchers do ’t i re ati ships with risk t era e a these pre i s a t rs ( i
more details in the theoretical part of this thesis).
The goal of this current article is to find consensus about the following determinants
concerning risk tolerance: gender, nationality and religion. We will also investigate a new
demographic (field of study) in order to study if there is relationship with risk tolerance.
Previous findings show a relationship between the level of education of an individual and his
risk tolerance. Here, we want to analyse if there is a specific link between the field of study
attended by a student and its risk tolerance given that all our respondents are students from
Business Schools, they are already part of the people with high level of education. As we test
our demographics independently with risk tolerance and with investment behaviour, we will
analyse if it is possible to find any relationship between risk tolerance and investment
behaviour. Lastly, as it is explained in part 1.5 of this thesis (“St e ts’ risk t era e a
i est e t beha i r”), we wi st y i st e ts rea t as the whole population when it
comes to their investments.
1.3 A specific focus on students
Most of the researches dealing with risk tolerance and investment behaviours in industrialized
societies try to explain the differences between some demographics inside a whole
population. However, as far as we know, none of them specifically focus on undergraduate
students. The present thesis will try to shed light on these topics given that people during the
transition to adulthood (18 – 26 years old) react neither as adults nor as adolescents. They
differ, for example, in moral decision-making, reasoning style, fairness and visual perception
(Henrich et al, 2010, p. 61). They are also different from adults and children in the way they
perceive risk (Arnett, 2000, p. 470). Risk taking during the transition to adulthood is a topic
analysed by numerous researchers who try to explain the elevated degree of risk taking
between childhood and adulthood (Arnett, 1992, p. 395; Romer, 2003). Recently, it has been
recognized that hazardous risk taking behaviours (drugs use, unprotected sex) peak during
this time of life. According to Arnett (2000, p. 470) in emerging adulthood (around 18-25),
risk taking is a common element, especially in modern, industrialized societies.
All in all, people during the transition to adulthood (18-25) react differently than adults and
adolescents. They are generally more risk prone than the others. In this way, this thesis will
try to examine if students also react differently than adults when it deals with stockholding
risk tolerance and investment behaviour. We will focus on students because they are in this
period of life called transition to adulthood and are the more prone to invest given their
educational background (Haliassos ans Bertaut, 1995, p. 1110). Also, during a first research

4
about stockholding among student investors at Umeå University, we found that the majority
of students making investments are attending business studies. Therefore, we decided not to
focus on the entire population of students but only on Business School students. By
comparing previous results with the specific case of undergraduate students, we should be
able to draw some guidelines about their risk aversion and investment attitudes.
1.4 Research gaps
After a brief literature review on the different parameters that affect risk tolerance and
investment behaviour, some research gaps were found. Most of them are due to the fact that
our research focuses on students. In fact, risk tolerance is a well-covered subject but at our
knowledge, no previous researches were done on students. In addition, we will investigate a
new determinant, field of study, to explore if there is any relationship between it and our
concepts. U ersta what a e ts st e ts’ risk t era e see s parti ar y se i e
that students are investing an increasing amount of money on stock market. For investment
behaviour, a very few amount of research analyse the correlations between our demographics
and our three investment biases (as it can be seen in our theoretical framework). This is
surprising for us because almost all investors present behavioural biases (Ricciardi and
Simon, 2000, p. 1). Thus, we would like to participate to this field by getting a better
understanding of factors susceptible to explain their origin and consequences. This thesis will
try to shed light on theses aspects by analyzing if students react as the whole population with
respect to these parameters.
1.5 Significance of the research
This paper is a good reference to consider for stock-investors. Investing is not just analysing
numbers and making decisions to buy or sell various assets (Baker and Ricciardi, 2014). It
encompasses both technical and behavioral considerations. This thesis provides a
comprehensive view of the main biases present in individuals. To be aware of their influence
on our decisions could help investors to reduce them by defining clear strategies.
Scholars will also benefit from our study. Indeed, we want to analyze if students react as
adults when it comes to risk tolerance. By comparing the features of student investors with
those of adults we want to know if risk tolerance and investment biases arise after years of
trading, influence of peers, evolution of marital status or if they are already present in the
student years of an individual.
This paper is also destined to students. We want to show them the importance of savings for
their future. Furthermore, our research will help them understanding their potential behavior
biases and consequently avoid them to make investment mistakes in the future. Finally, we
provide some guidelines to follow in order to limit their effects on future investments.
Also, lots of portfolio managers and brokers are nowadays assessing the profile of their
clients based on their risk profiles. However, we believe that the behavioral profile of the
client should be taken into account. If we determine that risk profiles are influenced by
behavioural biases, every professional should also evaluate the levels of overconfidence,
cognitive dissonance, and regret of their clients in order to find more relevant risk profiles.
Lastly, we also want to investigate through our questionnaire where students find their
advice/information before investing and what are their purposes behind their stock portfolios.

5
This could be helpful for financial professional service providers because students could be
part of a new generation of investors.
1.6 Research question
“W at ar t d t r a t r k t ra a d v t t b av r t d t a d
is there a relationship between risk tolerance and investment behaviour?”

6
2. Scientific methodology
2.1 Ontology
Objectivism states that social phenomena and their meanings exist independently of social
actors (Bryman & Bell, 2011 p. 20; Saunders et al., 2012, p. 130). As the main purpose of
this paper is t i esti ate the e raphi s i e i st e ts’ e isi s i the st k
market – which are considered as external to the researchers and independent of their mind
(Lagoard-Segot, 2015, p. 2) – objectivist approach appears to be more appropriate than
constructionism. This latest ontological position asserts that social entities and their meanings
are constructed and easily shaped. Therefore, it required studying the subjective meanings
motivating the different social actors so as to comprehend their acts and their meanings
(Bryman & Bell, 2011 p. 21). However, through this paper, all the demographics affecting
st e t’s risk t erance and investment behavior exist “ t there” a a be si ere as
unique. At this e , str ti is es ’t it with r paper.
2.2 Epistemology
Epistemology deals with the nature of knowledge, or what is recognized as acceptable
knowledge (Bryman & Bell, 2011, p. 15; Saunders et al., 2012, p. 132). Epistemology
assumptions show the procedure that should be followed and the principles that rule the study
of reality. One of the main questions within epistemology is whether we can employ the
measures and procedures used in natural sciences in order to study the social world (Bryman
& Bell, 2011, p. 15). There are four dominant orientations: realism, positivism, interpretivism
and pragmatism (Saunders et al., 2012, pp. 134-137). The purpose of the positivist orientation
is to produce general laws in order to predict behaviour (Fisher, 2010, p.19). We will follow
this orientation, as our goal is to understand the determinants that influence different levels of
risk tolerance and behavioural biases of student investors. Following a positivist position
implies that knowledge can only be get by analysing social phenomena. This will be our case
i e that we wi raw si s ab t st e t’s risk t era e a i est e t beha i rs
from our observations based on our questionnaire. Positivist researchers also use measures
a pr e res r at ra s ie es (Sa ers et a ., 2012, p. 134) a ’t take a pers a
position but they are rather external observers. The creation of new theories is the
consequence of testing hypothesis (Bryman & Bell, 2011, p. 15). For this matter, we will use
a self-completion questionnaire, based on previous professional ones in order to collect our
data. The research will therefore be conducted in a very neutral way. Then, the data will be
analysed and tested with our hypotheses. Finally, our findings will confirm or reject previous
theories.
2.3 Pre-understandings
According to Gilje and Grimen (2007, p.179), one of the fundamental suppositions within
scientific philosophy is that it is very difficult to understand the world for researchers without
pre- ersta i s. A si i i a t part a i i i a ’s pre-understandings comes from his
past experiences and his knowledge of a subject (Gilje & Grimen, 2007, p. 183). This has an
effect on the way he understands the nature of the world (Hartman, 2004, p.191) and the
interactions with other individuals (Gilje & Grimen, 2007, p. 183). If we fail to deal with our
presuppositions, our results may be a reflected image of something existing in our pre-
understandings. Our decision to study st e t’s i a ia risk t era e a st e t’s

7
investment behaviour arises from our financial background as well as our sharp interest for
stock investment (we are both investing money on the financial markets and we wanted to
ersta s what a e t st e ts’ i est e t) a r pre i s w rki experie es ( e
us did an internship as a mergers and acquisitions analyst, the other completed an internship
as a hedge fund valuation controller). We believe that our different experiences (we have
lived outside France for more than two years, either for working or studying) is an undeniable
asset for us in order to keep openness and objectivity in our thesis. In fact, we have met a lot
of people from different horizons and cultures and it improved our open mindedness. Also,
the different internships that we have done taught us to tackle a problem with integrity and
objectivity. We have conducted a strong literature review and discovered lot of findings on
our subject. It has helped us in conducting our research in the same way as similar studies,
without any bias from our knowledge. Moreover, we based our survey on previous surveys
held by professional to be sure that our pre-understandings will not get in the way of this
thesis.
2.4 Literature review
We built our theoretical framework on previous research. For researchers, it is fundamental to
select a broad and varied literature review that covers many aspects of a subject (Patel &
Davidson, 2011, p. 69). In order to gain as many knowledge as possible, we started with a
broad approach in our literature review by reading many papers related to risk and
investment. Then, we narrowed our research by focusing on risk tolerance and investment
behaviour that are the center of our thesis.
To determine validity and objectivity of sources employed is fundamental for researcher in
order to effect quality of the thesis (Patel & Davidson, 2011, p. 69). In order to have as little
bias as possible (Saunders et al., 2012, pp. 73- 77) in this thesis, we have tried to analyse the
content of the sources used in an analytical way. To find academic articles linked to our
subject, we have used databases from Umeå University Library (EBSCO for example).
Google Scholar has also been very useful for us to find relevant academic articles. Whenever
we used Google School we always checked that the articles were peer-reviewed so as to
ensure the relevance of the articles.
Using keywords is very helpful to find articles in a particular area (Ejvegård, 2003, p. 84). In
our case, we used the following key words: risk tolerance, risk aversion, investment
behaviour, financial biases, overconfidence, regret, cognitive dissonance, household
stockholding, stock investment, stock market. We also looked for previous articles linked to
our demographics. At this end, to sharpen our research, we also utilized the keywords:
demographics, gender, income, wealth, nationality, education, and religion. We noted during
our literature search that no article related to our area dealt with students. The most
complicated part of our literature review was to find articles explaining why it was interesting
to focus on students in the area of risk tolerance and investment behaviour. In this case, we
searched articles linked to the words: transition to adulthood, risk taking between childhood
and adulthood, risk taking during emerging adulthood, students’ risk attitude, influence of
the professional world, evolution of the marital status, investment behaviour, investment
behaviour biases.
Ejvegård (2003, p. 45) also argues that a good way to find good articles and books is to
a a yse resear hers’ re ere e ists. D ri r resear h, we t that some authors and

8
some articles were particularly used. Naturally, we decided to use these sources because they
can be considered as works of reference in this area.
2.5 Research approach
A research, in order to be valid and easy to understand, needs to follow plans and procedures.
Researchers have to choose the research approach that fits the best to go from their broad
assumptions to detailed methods of data collection, analysis and interpretation (John W.
Creswell, 2014, p. 3). The overall decision involves choosing this approach to study the
desired subject. This decision has to be the philosophical assumptions the researcher are
going to bring to the study; the research designs; and the research methods of data collection,
analysis, and interpretation. The selection of a research approach has to be based on the
resear h pr b e a a yse , the writer’s pers a experie es, a the p te tia resp e ts
of the study.
Deduction, induction and abduction are three different methods that researchers can use to
match related theory and empirical data (Patel & Davidson, 2011, p. 23). Deductive
approaches develop propositions from current theories and make them testable in the real
world by confirming or rejecting them. These approaches draw conclusions about individual
phenomena (Patel & Davidson, 2011, p. 23). This method fits perfectly with our study. In our
case, while reviewing previous theories made on risk tolerance and investment behaviour, we
came up with hypotheses made by previous researchers. Thus, we decided to use a deductive
approach in order to be able to confirm or reject these previous hypotheses.
For Inductive approaches, the theory is systematically generated by the data gathered (e.g.,
Glaser and Strauss, 1967). The researcher can with these data study the research object,
without having made the survey according to a previously accepted theory, and formulate a
theory (Patel & Davidson, 2011, p. 23). Since collection of data with an inductive approach is
based on a particular situation, ti e, r r p pe p e, there is a risk t ’t k w
a ythi ab t the the ry’s s pe (Pate & Da i s , 2011, p. 23). This appr a h is t
suitable for our research because we go from theories to data analyses in order to confirm
them. We are not conducting this study to develop new theories from data collection.
The abductive approach is a mixture of deductive and inductive approaches. An abductive
approach is suitable if the goal of the researchers is to discover new findings — other
variables and other relationships. An inductive approach is used during the first step then the
hypothesis or theory is tested on new cases (Patel & Davidson, 2011, p. 23). For the second
step, the researcher works deductively with the original hypothesis or theory and then
develops and extends them to become more general (Patel & Davidson, 2011, p. 23).
In business research, after having chosen one approach, two main types of research process
can be used: qualitative and quantitative (Bryman & Bell, 2011, p. 27; Saunders et al., 2012,
pp. 159- 161). The differences between these methods are mostly between the link of the
theories analysed and research conducted, ontological considerations and epistemological
assumptions of the researchers (Bryman & Bell, 2011, p. 26). In contrast to numerical
methods used in natural sciences, qualitative research focus more on words and meanings
analysis than numerical methods (Saunders et al., 2012, p. 163). For quantitative research, a
deduction approach is often followed where the hypothesis are chosen according to the
previous theories analysed (Saunders et al., 2012, p. 162). One of the particularities of a

9
quantitative research is that its results can be generalized to other populations (Bryman &
Bell, 2011, pp. 163-165).
This paper, which focuses on students risk tolerance and investment behaviour, is done based
on general theories about these concepts and their components. Risk tolerance and
Investment behaviour are two subject already covered. We found previous theories made on
these two subjects. However, as we know, no one is focusing on student respondents. The
existing theories will allow us to decide which information are going to be collected, how to
interpret them, and how to relate our results to them (Patel & Davidson, 2011, p. 23). The
main benefit of using a quantitative research process with our deductive approach (see all the
steps of our research process in Table 1), is that it will allow us to generate derived
hypotheses which will confirm or reject the previous ones.
Table 1 - Quantitative research process (Bryman & Bell, 2011, p. 151)
Step 1 Elaborate theory In analysing previous research, we found that there
is a link between gender, religion, nationality and
the risk tolerance profile of individuals. As this
subject is already well covered, we decided to
analyse these variables with students. For
investment behaviour we only find previous
research about gender. We will contribute to the
field by doing a research about the correlation of
the same variables as risk tolerance but with
investment behaviour. At the end, we will try to
find a relationship between the level of risk
tolerance and the level of the investment biases of
students.
Step 2 Devise hypothesis Based on previous elaborated theories (step 1), we
defined all the hypotheses that were found
previously between the link of our variables and the
risk tolerance and some with investment behaviour
of an individual. In conducting this study, we will
be able to see if the same hypotheses can be applied
to a specific sample or if some variables, like
influence from the peers in a professional
environment or the evolution of the marital status
of a person are more accurate in defining its risk
tolerance and investment behaviour.
Step 3 Select research design We are using a cross sectional design as we will use
a survey in order to collect our data. The sample of
respondents is fixed and the point in time also but
various variables will be analysed
Step 4 Devise measure of
concepts
Our survey was constructed based on previously
made professional surveys, in order to define the
basic profile of our respondents along side with
their level of risk tolerance and investment

10
behaviour. (Its construction is developed in the
practical method part of this thesis).
Step 5 Select research site We decided to focus on students from French and
Swedish Business School.
Step 6 Select research subjects Our research subjects are students from French and
Swedish Business Schools. We are discussing more
about it in the part about our sample.
Step 7 Collect data In order to collect our data we made a survey based
on previous professional surveys. We used Google
Docs, which provide free tools to constructs online
surveys. We decided to do it on internet because of
our wide sample of respondents. It will allow us to
reach them quicker.
Step 8 Process data We will first export our data from Google Docs to
Excel. Then we will use the software SPSS to
process them.
Step 9 Analyse data We will perform t-tests and ANOVA tests
Step 10 Develop findings We will develop our findings and see if there is any
links between our variables and our concepts. After
this we will be able to confirm or reject previous
hypotheses.
Step 11 Write up conclusions To conclude our study, we will speak about our
hypotheses and if students are different from adults.
We will explain if there is further research that can
be done in this particular field of study, the
limitations we encounter and our contribution to
research and practice.
2.6 Research design
The research design chosen to conduct a study provides a framework for the collection and
analysis of data (Bryman & Bell, 2011, p. 717). Thus, the research design should be adapted
to the topic and the research question analysed. Different designs are available (Bryman &
Bell, 2011, p. 68). When conducting an experimental design, hypotheses are constructed and
tested with different samples and conditions, with a cross-sectional design, data are collected
during one point in time but in more than one case in order to collect data with different
variables. Close to this last design, the longitudinal design adds a variable of time where its
fixed in a cross-sectional design. For a case study design, the research is conducted in a
deeper way in one single case in order to get an in depth understanding of the case. In the
same way, the comparative design is comparing different case studies.
More than one design can be suitable with a research, therefore it is possible to mix them in
order to respond in the best possible way the requirements of the research. Through our

11
research questions, we want to gain a deeper understanding on the factors that affect risk
tolerance and investment. The study will be conducted in different cases (Students studying
in France and Sweden) but during one point in time. The information we are looking for are
general information, therefore a case study is not reliable for us. We believe that a cross-
se ti a esi wi it per e t y with r st y. This resear h esi , a s a e “S ia
s r ey esi ” wi a w s t e t q a titati e i r ati r m our sample of
respondents. Various variables will be linked to our main subjects. We will then analysed the
collected information in order to detect some patterns with the subjects and the respondents.
Thus, with a cross-sectional design, we will be able to get an answer to our research questions
and confirm or reject previous hypotheses made on the same subjects.

12
3. Theoretical framework
3.1 Key concepts
3.1.1 Theory of emerging adulthood
The theory of emerging adulthood (Arnett, 2000, p. 469 - 480) explains how in modern and
industrialized society the transition to adulthood is experienced by incorporating socio
historical influences. This theory argues that life in these Western societies, hold a unique
stage during the emergence to adulthood, where individuals experience life not like adult nor
as teenagers. In order to demonstrate why in that stage of life people are different with their
risk behaviour, Arnett (2005,p. 235 - 254) describes four features that may influence risk
taking behaviours: (a) experimentation due to identity exploration; (b) instability
(relationships, residence, and academic/work status); (c) self-focus involving low degree of
social control; and (d) optimism that can explain the ignorance of potential hazards.
Furthermore, for Ravert (2009, p. 376 - 396) in that stage of life, people can see the
opportunity to take certain risks.
For Tymula et al (2012) senseless choices could be explained by biological tendencies that
act on the brains of midlife adults to learn and to be flexible. To be able to understand the
differences in risk-taking between people from 12 to 90 years old, Tymula et al (2012)
studied 135 persons using a gambling game in which participant could choose between
winning a definite 5$ or taking the chance to win a much larger amount with the risk to get
nothing at all. They found that age plays a significant role in the difference of risk taking
behaviours. If the risks are known, midlife adults (18-25) are more risk averse than teenagers
and adults but if the risks are unknown, it is the opposite. According to this last experience,
emerging adults accept some uncertainty in not knowing in order to learn and to get new
knowledge.
3.1.2 Risk and risk tolerance
The ter “risk” is sed in a lot of different contexts and it is complicated to find a general
definition. Hillson (2001, p. 1) investigates different definitions of this concept and comes to
the conclusion that risk can be separated in three different categories: risk as something
e ati e, e tra r p siti e. Risk as s ethi e ati e a be e i e as “hazar , ha e
ss, r ha e ba seq e es r exp s re t is ha e” (Ir k , 1991, p. 2). A e tra
e i iti risk a be: “a ertai e e t r iti that, if it occurs, has a positive or a
e ati e e e t a pr je t’s bje ti e” (Pr je t Ma a e e t I stit te, 2000, p. 127). A
p siti e e i iti risk is “a pp rt ity that e a a a e i a e iberate way”
(O'Malley and Pat, 1996, p. 203). Accordi t Hi s ’s ate ries risk, this paper wi
have a neutral view of risk as the nature of the effects of financial investment are undefined
and can implicitly encompass both negative and positive effects (Hillson, 2001, p. 1).
Grable (2000, p. 625) e i es risk t era e as “the axi a t ertai ty that
s e e is wi i t a ept whe aki a i a ia e isi ”. A r i t Ya et a
(2005, p. 53) i a ia risk t era e is “the wi i ess t take i a ia risk”. Sahi a
Yilmaz (2009, p. 1) es ribe it as ”the a t ertai ty r i est e t ret r ati ity
tha a i est r is wi i t a ept whe aki a i a ia e isi ”. I this resear h, we
wi a pt Grab e’s e i iti risk tolerance, as st e ts’ i a ia i est e ts are
financial decisions.

13
Each investor has his own level of risk tolerance depending on several factors. First, it is
generally accepted that risk tolerance depends on gender. Several researchers demonstrate
that women have a lower risk tolerance than men (Bajtelsmit & Bernasek, 1996, p. 1, Powell
and Ansic, 1997, p. 605). However, Hanna, Gutter, and Fan (1998, p. 10 - 11) and Grable and
Joo (1999, p. 54) argue that gender is not a relevant factor that determines financial risk
tolerance. Other investigations expand the gender issue with the impact of marital status. Risk
tolerance is lower for single females, followed by unmarried females, married males and
finally single males (Yao and Hannah, 2005). Also, individuals without children are more
risk tolerant than couple with children (Grazier and Sloane, 2008, p. 938).
Age, is a second demographic that is thought to determine risk tolerance. McInish (1982, p.
125); Morin and Suarez (1983, p. 1201) and Palsson (1996, p. 772) argue that risk aversion
increase with years. However, this correlation is not necessarily linear ( Bajtelsmit and Van
Derhai, 1997, p. 62). Intuitively, this outcome can be explained due to the fact that young
investors have a higher number of years to recover from financial losses due to risky
investments. Nevertheless, recent papers show that age is not significant in explaining risk
aversion (Wang and Hanna, 1997, p. 28; Grable, 2000, p. 625; Gollier and Zeckhauser, 2002,
p. 197).
Education is another demographic that is frequently argued to increase financial risk
tolerance. Several papers have point out that individuals with higher education are generally
more risk tolerant (Haliassos and Bertaut, 1995, p. 1110; Sung & Hanna, 1996,p. 11).
However, Cole and Shastry (2009, p. 2) prove that people with an educational background in
finance will not be more risk tolerant than people with an education in another field of study.
This paper is only comparing students in finance with other students. At our knowledge,
except this paper, no researches are investigating the relationship between different field of
study and risk tolerance.
Wealth and income are two linked elements that are thought to have a positive correlation on
risk tolerance (Friedman, 1974, p. 210; Blume, 1978; Shaw, 1996, p. 627). However, for
Bernheim et al. (2001, p. 837), the distinction is not always clear-cut. In fact, people with a
good income can more easily undergo losses due to a risky investment.
Previous papers have also studied the influence of ethnicity, nationality and religion on risk
tolerance. According to Sung and Hanna (1996), ethnicity is a demographic that determines
risk tolerance. White people are more risk tolerant than black people and Hispanic people.
However, Weber and Hsee (1998, 2016), ar e that these i ere es ’t e r
ethnicity. There are linked to other aspects such as the number of children (Gutter et al, 1999,
p. 162).
Nationality is another factor that is hypothesized to impact risk tolerance (Cummings et al.
1971). However, Bartke and Schwarze (2008) believe that nationality is not relevant to
explain risk tolerance differences between countries. The differences observed are related to
other factors such as religion. Some papers show that religiosity is in general positively
related to risk aversion (Miller and Hoffmann, 1995, p. 63). Miller (2000) indicates that being
atheist in Western reflected risk-taking behaviour. Indeed, non-religious people tend to be
more risk prone. However, in Eastern, being irreligious was not linked to risk tolerance since
in these countries, being atheist was not considered as a risky behaviour. Nowadays, these
discrepancies are still visible (Hilary and Hui, 2009, p. 455). There are also differences in risk
14
taking behaviours among religions. Muslims are less risk tolerant than Christians for example
(Miller, 2000, p. 6). Some experiences have been made in order to analyse Protestants and
Catholics separately. Protestant movement shows an opposition to gambling and lots of them
see gambling as a guilty activity (Ozment, 1991, Ellison and Nybroten, 1999, p. 356). In
contrast, the Catholic Church movement is tolerant with moderate levels of gambling and is
less disapproving with these activities. Barsky et al. (1997, p. 537) demonstrate that Catholics
are more risk tolerant than Protestants, but less than Jews.
3.1.3 Behavioural finance
As introduced in the introduction, the major issue in behavioural finance is to explain why the
market participants - the economic agents - make irrational decisions contrary to supposition
of rational market participants. These errors impact returns and prices, provoking market
inefficiencies (like over or under-reactions to information) that can create market trends and
in some cases crashes (Lin, 2010, p. 325-350). Some researchers had explained the causes of
speculative bubbles with the use of behavioural framework (Liu and Song, 2001; Thaler,
1999 and Shiller, 1987). Market anomalies have been attributed to noise trading,
overconfidence, mimicry, and lack of attention from investors or over optimism (Elze, 2011,
p. 640). The field of behavioural finance applies insights from psychology to give us a better
understanding of financial decisions and their consequences on stock prices. Slovic (1972, p.
779 – 799) asserts, “A full understanding of human limitations will ultimately benefit the
decision-maker more than will naive faith in the infallibility his i te e t”.
Resear hers i the ie beha i ra i a e e t “ a ts” (base s r eys, ab rat ry
research, experiments or observations in a natural environment) concerning investment
beha i r a arra e the i “s per- a ts”. It is possible to analyse the psychology of
decision-making in many different ways. Kahneman and Tversky (1979, p. 263 - 291), the
pioneers of behavioural finance, first investigated how people think and react. Nowadays,
current researchers carry on to write on cognition. Additionally, they explore social
psychology and emotion. According to De Bondt et al (2008, p.3), the major findings of
behavioural finance can be categorized in three types of results. First, there is a list of
predictable mistakes make by the economic agents. These mistakes depend on context but are
however systematic. Researchers question psychological mechanisms in order to understand
how the human mind functions. Another type of result deals with the dynamics of security
prices. Noise traders (investors making decisions without the use of fundamental data) make
systematic errors because they over-react to good and bad news and follow trends, provoking
profit opportunities for experimented investors. The last type of findings is about how
decisions processes influence decision outcomes.
Thus, according to this field, it is fundamental to take into account the true nature of investors
(their bounded rationalities and their imperfections) in order to help them – as well as policy-
makers – to make wise decisions.
3.1.4 Investment behaviour biases
Lots of biases were found during previous analyses held on investment behaviour, but in this
thesis we are focusing on overconfidence, regret and cognitive dissonance.
eha i ra i a e e passes a y biases. The ast aj rity these biases ’t exist
independently because deep interactions exist among them. The following list - which is not

15
exhaustive - corresponds to the most commonly biases faced by investors (Baker and
Ricciardi, 2014): overconfidence, regret, financial cognitive dissonance, prospect theory,
representativeness, disposition effect, familiarity bias, worry, anchoring, self-attribution bias,
trend chasing bias (Ricciardi and Simon, 2000, p. 1). Others can be equally important with
respect to a particular situation.
At our knowledge, a very few amount of research, unlike risk tolerance, examine the
correlations between general demographics (gender, nationality, religion, field of study and
risk tolerance) and these biases when it comes to investment. This is a surprising result for us
because almost all investors present behavioural biases (Ricciardi and Simon, 2000, p. 1).
Thus, we would like to participate to this field by getting a better understanding of factors
susceptible to explain their origin and consequences. It may be helpful to give additional
elements to reduce them. The main objective of this paper is not to study all the biases -
because this field is very wide and relatively uncovered. Our aim is to investigate those that
are prevalent among investors and exist almost independently (in order to have consistent
results). According to these two criteria we will have a specific focus through this thesis on
overconfidence, regret and cognitive dissonance (Ricciardi and Simon, 2000, p. 1; Shiv,
Loewenstein, Bechara, Damasio, 2005, 435 - 439).
The overconfidence theory is indeed one of the major theories on investment behaviour
biases. O er i e e a be e i e as “a eresti ati the pr babi ities r a set
events. Operationally, it is reflected by comparing whether the specific probability assigned is
greater than the portion that is correct r a assess e ts assi e that i e pr babi ity”
(Mahajan, 1992, p. 330). As investors, we have a natural ability of failing or forgetting to
learn from our past mistakes such as a bad financial decision. Some previously held studies
and theories showed that men are more overconfident than women and that this
overconfidence decreases with experience. A little research was conducted among students at
the Stockholm University, about the propensity of a student to get a very good grade at the
next exam. They found that men are more confident to get a very good grade than women
(Bengtsson, Persson and Willenhag, 2004, p. 1). In this way, some researchers found that
men have more self-confidence than women (Deaux and Farris, 1977, p. 59, Beyer and
Bowden, 1997, p. 197) and that they have a better self-perception than women. When it
comes to investment behaviour, Barber and Odean (2000, p. 261) find that women are less
confident than men concerning their investment skills. Therefore, females trade less (45
per e t ess) a experie e wer tra i st tha e . The tra i sts re e w e ’s
returns by 1.7 percent compared with 2.6 percent for men. Still in the financial matter, men
argue that they are more talented than women (Prince, 1993, p. 175). The inefficiencies of the
markets, could be explained by the fact that overconfident investors have the tendency to
trade in high volume and therefore favorise speculative markets (Statman, Thorley, Vorkink,
2006, p. 1535), and speculative bubbles. Overconfident people underestimate the margins of
error likely to be committed (Shiller 1997). Barber and Odean (2001), identified that an
overconfident investor ignore the belief of rational investors because he is too proud of his
own belief. Nolte (2006, p. 7) claim that overconfidence on the market is temporary and can
arise after several trading successes. On the other hand, Lester et al (1989, p. 75) believe that
er i e e epe s the i i i a ’s be ie t s ee .
Financial cognitive dissonance is another fundamental element in behavioural finance.
Morton (1993) argues that individuals feel anxiety and tension when they face conflicting
beliefs. People try to reduce these conflicts (dissonances) in different ways. Either by
justifying or rationalizing their choices or by changing their past opinions. This theory is

16
particularly present in the stock market through investors who change beliefs or investment
styles to support their investments. A shining example occurred during the speculative bubble
in Internet stock. Many investors changed their investment strategies: the ones who were
following fundamental analysis (price / earnings ratio for example) decided to invest in
Internet companies where funda e ta a a ysis ’t app y beca se these ir s i ’t
have revenues and no financial track records (there were very young). The two ways to
exp ai the ha e i their i est e t sty e are (i) these i est rs ar e that i a “ ew
e y” the tra iti a i a ia r es ’t app y a d (ii) they ignored their traditional
ways of investing and bought these stocks based on price momentum (Ricciardi and Simon,
2000, p. 1). The influence of gender, nationality, religion and field of study on cognitive
dissonance has not been analysed - at our knowledge - by previous researchers when it comes
to the specific field of finance. However, some papers investigate the impact of these
demographics on cognitive dissonance (as a whole). Cooper (2007) claims that cognitive
dissonance is experienced by individuals everywhere, it is not limited to a specific culture or
country. However, different cultural values can lead to distinct cultural experiences.
American and European people are both motivated by feelings of guilt and feeling of shame
(they experience dissonance when they are rejected by others and disrupt social harmony)
contrary to Asian people who are mostly motivated by feelings of shame (they face
dissonance when they breach either a social standard or a personal standard). For the
influence of religion, according to Barlett, Drew, Fahle & Watts, (1974) individuals with
religious orientation and beliefs accept information that satisfies their beliefs and reject the
other. They have a tendency to self-justify their beliefs when contradicted (Batson, 1975;
Mahaffy, 1996). Self-justifying behaviour could cause cognitive dissonance (Aronson, Turner
& Carlsmith, 1963; Mahaffy, 1996).
Lastly the theory of regret stipulates that people assess their expected reaction to a future
situation. Bell (1982, p. 961 - 981) e i es re ret as “the e ti a se by pari a
i e t e r state e e ts with the state a re e h i e”. F r exa p e, “whe
choosing between an unfamiliar brand and a familiar brand, a consumer might consider the
regret of finding that the unfamiliar brand performs more poorly than the familiar brand and
th s be ess ike y t se e t the a i iar bra ” (I a and McAlister, 1994, p. 423).
Further example is when investors avoid selling one of their stocks that has declined in value
in order to avoid the regret of having made a bad investment choice and therefore report a
ss. T re e s h a ba ee i ab t this ast s e ari , the i est r a p r hase the “hot
or popular stock of the week” t w the r w i estors who did the same. In this case,
if the stock declines, the investor will rationalize his investment choices more easily. He will
reduce his emotional reactions or feelings (regret or anxiety) since lots of investors lost
money on the same bad investments (Ricciardi and Simon, 2000, p. 5). Sugden (1985, p. 77 -
99) argues that regret depends on two elements. The first one is linked to a subjective
evaluation of the quality of the decision taken. The second element is related to the evaluation
of an outcome that may have occurred. However, according to Ritov and Baron (1995, p.
127), issi s (whe the i i i a ’t k w the res t) are wer pare t a ti s. I
this way, investors who take risky investments should follow their investments daily.
3.1.5 Relationship between risk tolerance and investment
behaviour
For Thaler and Johnson (1990, p. 643-660), the risk attitude of a person is elastic and easily
changeable. Other research find that the risk tolerance of an individual can be influenced by
economic and emotional factors and that his risk tolerance changes according to his current
17
mood (Ackert, Church, and Deaves, 2003, p. 33-39). All of these changes in risk attitudes can
be explai e by the the ry re ret exp ai e ab e. “Re ret the ry rests tw
fundamental assumptions: first, that many people experience the sensations we call regret and
rejoicing; and, second, that in making decisions under uncertainty, they try to anticipate and
take a t th se se sati s” (Loomes and Sugden, 1982, p. 820). The feeling of regret is
stronger than the feeling of joy, thus investors tend to avoid regret situations. For example,
when the stock market is going up and that the consensus agrees that it will keep going this
way, investors tend to adapt their risk tolerance and invest in it in order to avoid missing
potential profits. In the opposite scenario, the risk tolerance can be decreased, as the investors
’t wa t t keep a st k losing value and have to deal with the regret associated with this
fall in value. MacKillop (2003, p. 62-64) believes that investors are more likely to change
their risk tolerance in accordance to the direction of the fluctuation of the market. In the same
way, Shefrin (2000) explains that recent fluctuations in the market exert strong influences on
the risk tolerance of professional investors. When it comes to overconfidence, according to
Pan and Statman (2010, p. 1 - 28), the risk tolerance of an investor can be influenced by his
overconfidence. An overconfident investor under evaluates risk. Thus, overconfident
investors tend to be more risk tolerant than the others. Following the results of the tests held
by Gervais et al. (2011, p. 1735-1777) and Malmendier and Tate (2005, p. 2661-2700),
er i e t CEOs te t be ess ser ati e a are re ike y t i est i “ ey
b r i i est e t”.
3.1.6 Relationship between stockholding and demographics
We will develop in this part, the differences in stockholding according to various
demographics. Thus, we will be able to explain, if needed, the difference in representation of
the demographics in the results of our questionnaire.
There is a difference in stockholding between countries (Guiso, Haliassos and Jappelli,
2002). In the United States and Sweden half of the population invest in stocks. In France, the
percentage decreases to 20%. Guiso, Haliassos and Jappelli (2002) explain these differences
by both the correlation of wealth and stockholdings (entrance costs are less expensive if a
large amount of money is invested) and the link between the amount of stocks held by
governments, banks and holding companies. It appears that stocks are much more available in
the UK, for example, where the government holds 5% of stocks than in France where 35% of
stocks are held by government, banks and holding companies.
Some researchers also find relationship between savings and financial education (Bayer,
Bernheim & Scholz 1996; Greenspan, 2001). Beverly and Sherraden (1999, p. 457) state,
“The extent to which an individual understands the process and benefits of asset
a ati is ike y t a e t his wi i ess t sa e”. Si i ar y, Boyce, et al (1998)
believe that financial education for high school students affect positively teenager financial
knowledge and savings behaviour. Therefore, teenagers with a financial background will be
more willing to save during their adult lives (Bernheim, Garrett & Maki, 2001, p. 435; Bayer,
Bernheim & Scholz, 1996).
Religion has been identified as an important parameter in economical behavior. Iannaccone
(1998) and Guiso et al (2003) find that religiosity is linked to a higher level of saving.
Arruñada (2010, p. 890 - 918) explains that the Catholic work ethic supports saving, by
lowering excessive consumption. Likewise, Renneboog and Spaenjers (2011) conclude that

18
“Cath i s a Pr testa ts si er the se es re tr sti , are re ab t ea i ey
to their children, and have longer planning horizons than non-re i i s h seh s”.
When it comes to Gender, we found few previous researches on the subject. Nevertheless, it
seems that women, on average, are less investing in stock markets than men (van Rooij et al.
2011). It could be explained by the fact that usually, women are less financially literate than
men (Lusardi, 2008, p.413-417).
3.2 Hypotheses
Despite a lack of consensus from previous papers on the factors influencing risk tolerance,
we will analyze the three ai e raphi s that we be ie e a e t st e t’s risk
tolerance: gender (Bajtelsmit & Bernasek, 1996, p. 1, Powell and Ansic, 1997, p. 605),
nationality (Cummings et al. 1971) and religion (Miller and Hoffmann, 1995, p. 63; Hilary
and Hui, 2009, p. 455). We can note that we w ’t focus on income and age as we focus on
students. We will also investigate if field of study – a demographic hardly taken into account
by scholars - could be responsible for different levels of risk tolerance. Given that education
is frequently argued to increase financial risk tolerance (Haliassos and Bertaut, 1995, p. 1110;
Sung & Hanna, 1996,p. 11) we expect to observe discrepancies related to field of study. We
will test each of these demographic and compare our results with previous findings in order
to see if students follow the same patterns as adults when it comes to risk tolerance.
Hypothesis 1: Demographics such as gender, nationality, religion and field of study are
re ate t i ere t e e s st e t’s risk t era e.
Our second analysis will focus on the same demographics. This time, we will investigate their
relationship with three behavioural biases: overconfidence, cognitive dissonance and regret.
Given that very few papers – contrary to risk tolerance - study the correlation of our
demographics with investment behavior, we hope that this paper will benefit to the field of
behavioural finance.
Hypothesis 2: Demographics such as gender, nationality, religion and field of study are
re ate t i ere t e e s st e t’s er i e e.
Hypothesis 3: Demographics such as gender, nationality, religion and field of study are
re ate t i ere t e e s st e t’s iti e issonance.
Hypothesis 4: Demographics such as gender, nationality, religion and field of study are
re ate t i ere t e e s st e t’s re ret.
The correlation between risk tolerance and investment behaviour is not clear despite they are
basic characteristics of investors. At first sight, risk tolerance seems to affect investment
behaviours. In fact overconfident traders invest in risky assets (Barber and Odean, 2001).
Thus we believe they are highly risk tolerant. Similarly, investors with a high level of
cognitive dissonance ’t hesitate t i est i pr isi se t rs ( ew te h ies) e e i
they a ’t app y their tra iti al strategies (if individual invest in new technology firms,
fundamental analysis ca ’t app y be a se most of these companies don’t ha e re e es r
financial tracks). We consider them as risk tolerant investors in the way that they invest in
unknown and risky sectors.

19
Hypothesis 5: There is a relationship between risk tolerance and investment behaviour of
students.
3.3 Conceptual model
The figure 1 represents our conceptual model and helps to understand what is investigated in
this research. Its foundation is based on previous research held in this area. The influence of
our demographics (gender, nationality, religion, field of study) will be tested with different
levels of risk tolerance, overconfidence, cognitive dissonance and regrets. We will also study
if there is a relationship between risk tolerance and investment behaviour.
Figure 1: Conceptual model

20
4. Practical method
4.1 Data collection methods
While conducting a research, primary data or secondary data can be collected (Saunders et
al., 2012, p. 304). If new data are collected for the purpose of the research, these are primary
data (Saunders et al., 2012, p. 304). If the data used for the basis of the analysis of a research
were already collected for others previous research, they are called secondary data and they
can be in the form of annual reports, historical tables or financial statements (Bryman & Bell,
2011, p. 312; Saunders et al., 2012, p. 304). In both qualitative and quantitative research, the
sources of data can be primary (Saunders et al., 2012, pp. 304; 307). An advantage of primary
data is that the collection is designed specifically for the purpose of the research conducted
and therefore fits the research question (Bryman & Bell, 2011, p. 320; Saunders et al., 2012,
pp. 319-320). Though, disadvantages are that primary data collection can be expensive and
time-consuming (Saunders et al., 2012, p. 317). Given our research question, we would like
to analyse if our demographics are related to risk tolerance and investment behaviour. These
variables were never tested on students, therefore we will collect primary data.
After evaluating various methods that we will be able to use, we decided to conduct a survey
for our data collection method. Our research question concerns generalization, and to answer
it we decided that a questionnaire would be the most suitable method. A questionnaire is
relatively cheap and easy to administer (Bryman & Bell, 2011, p. 232). Questionnaires are a
method to collect data through asking the same questions in a prearranged survey to a sample
of respondents (Saunders et al., 2012, p. 416). The use of questionnaire is a common and
efficient method to reach a large sample and gather all of the information. As our population
is wide (Business school students from France and Sweden), we believe that the use of a
questionnaire will be the best way for us to collect the data we need for our thesis. One
disadvantage though, is that as the respondent of a questionnaire is not known by the
researcher, it is impossible to get back to him to have more information (Saunders et al.,
2012, p. 419). That is why we developed and we pretested our questionnaire long before
sending it. Pre-testing allows improving the questionnaire in fixing any problem the
respondents may encounter while answering the questions (Saunders et al., 2012, p. 451).
According to Shiu et al. (2009, p. 65) it is important to pretest the questionnaire on
individuals that are representative of the targeted respondents. Thus, we asked students from
Business Schools to try our questionnaire and to report us any problems they met or any
unclear questions or answers they found. We then fixed everything that was reported.
Therefore the questionnaire was not changed after being send to our sample. Finally, As
Saunders et al. (2012, p. 420) state, we made our questionnaire in accordance with the
research question analysed and the purpose of the study.
4.2 Style of questionnaire
As the theories used in this study are already covered but the sample of respondents is new,
no data were available to answer our subject. Therefore we decided to create a survey based
on previous professional made surveys. For Saunders et al. (2012, p. 431), using previously
made surveys allow researchers to compare their findings with previous ones and assess
reliability. Lots of financial institutions are using surveys in order to understand the risk
tolerance profile of their customers (Grable 1999, p. 163; Reddy, 2010, p. 2; Sharieff, 2010,
p. 75; BMO Insurance, 2009, p. 2; Schwab, 2014). These surveys were tested, developed and

21
are widely used by professionals. As we wanted to analyse risk tolerance, we used the same
type of questions as the previously mentioned surveys in order to be more accurate. We also
added questions regarding investment behaviour based on previously conducted
questionnaire link to this topic (Zaiane and Abaoud, 2009, p. 18) or on experiments held by
researchers (Ricciardi and Simon, 2000, p. 1). The survey uses basic financial vocabulary for
the questions and the answers because we did ’t k w the i est e t k w e e the
person responding and we wanted that all the respondents understand it correctly. All of the
questions are compulsory multiple choices questions. This type of questions helps to guide
the respondents and allow us to get information useable. We also used a ranking system
developed by professionals: each answer with respect to risk tolerance, overconfidence,
cognitive dissonance and regret was allocated to a certain number of points (Grable and
Lytton, 1999, p.163; Schwab, 2014, p. 1). With respect to the answers, we established a risk
tolerance profile (risk averse, balanced risk profile or risk tolerant) and a level of
overconfidence, cognitive dissonance and regret.
Four constructs were incorporated in the questionnaire with a total of 20 items. The survey
was divided into 5 parts covering (i) the personal details of the respondents - (see Appendix
A, questions 1 to 9), (ii) their risk tolerance (Appendix A, questions 10 to 13), (iii) their
overconfidence (Appendix A, questions 14 to 16), (iiii) their regret (Appendix A, questions
17 and 18) and (iiiii) their cognitive dissonance (Appendix A, questions 19 and 20). In the
first part of the questionnaire we asked questions to have general information about the
respondents - including questions with respect to our demographics: gender, religion,
nationality and field of study.
We wanted only participants who are studying in a Business School in France or in Sweden
and who are investing money directly in the stock market. As we are looking to examine their
behaviours, they have to make their own choices of investment, thus analysing the results of a
student investing via a professional (mutual fund for instance) is not accurate for us. That is
why we i ’t keep the data from students who invest indirectly. Thus, the questions 1,2 and
7 e the q esti aire i a “N ” is a swere be a se the resp e t’s pr i e es ’t eet
our requirements. The second part of the questionnaire (question 10 to 13) allows us to draw
the risk tolerance profile of the respondent. We picked up these questions from the survey of
previous researchers: question 10 is based on Grable (1999, p. 163), questions 11 on Reddy
(2010, p. 2) and question 1 on BMO insurance (2009, p. 2). We chose these specific
questions because they are complementary and enable us to a have comprehensive risk
profile. One (question 10) describes the investment experience of the respondent, another
(question 11) the capacity of the respondent to tolerate a decrease of the value of its portfolio,
and the last one (question 12) its preference to chose one portfolio rather than another in
function of different returns and losses. The last part of the questionnaire (questions 14 - 20)
is about the investment behaviour of the respondent. Given that we wanted to have details
about three investments biases, we asked different questions. Questions 14, 15 and 16 deal
with overconfidence. Question 14 is about general confidence of a student (how does he feel
compared to the others). Question 15 deals with his confidence to beat the market in the next
three months. We asked question 16 to know the stock holding period of students. According
to Barber & Odean (2001), when investors are overconfident, they are inclined to overtrade.
Based on this question, we can expect a significant relation between self-confidence and
trading frequencies. Questions 17 and 18 are about cognitive dissonance. They allow us see if
- facing conflicting beliefs - the respondents change their opinions or rationalize their
choices. In questions 19 and 20, we analyse two concepts of the theory of regret. The
question 19 analyses the level of regret linked to a missed opportunity of investing in a

22
profitable investment. Question 20 focuses on the reluctance to report a lost. Theory of regret
deals with investors who prefer leave their losses going than sell their shares and report
losses.
The survey is a self-completed web-based questionnaire. We made it from Google Docs. Due
to the fact that our respondents study in various places in France and Sweden, postal
questionnaires would be too costly and time-consuming for us.
4.3 Sample
There are two main methods of choosing an appropriate sampling technique for a quantitative
study, probability sampling and nonprobability sampling (Bryman and Bell, 2011, p. 176).
We decided to use a convenience sampling, which is part of the non-probability. We chose
non-pr babi ity sa p i be a se we ’t appr xi ate the p p ati that wi be part
our sample (Churchill and Iacobucci, 2005, p. 326). Then, a convenience sampling, in order
to reach accessible and available respondents for us.
We have chosen to focus on student from French and Swedish Business Schools (see
introduction). Going back to our previous research results, we were very surprised to see that
lots of Swedish students already investing in stock markets. After further research, it appears
that Sweden is one of the Tier 1 countries in the world where the most households invest
money in stock markets alongside the United States (Guiso, Haliassos, Jappelli, 2002, p.
131). It can be explained, on one hand, that Sweden is considered to have one of the best
pension system in the world. In 2000, the Swedish government chose to switch its “pay as
y ” ati a retire e t pr ra with a ew pe si pr ra where part the Swe ish
workers income are invested in financial markets via pension funds (Karlsson, Massa,
Simonov, 2006, p. 4). With this new system, the government launched a massive advertising
campaign all over the country, which created a positive image of investing in financial
markets (Karlsson, Massa, Simonov, 2006, p. 5). According to Christelis, Georgarakos and
Haliassos (2010, p.21), owners of retirement accounts are more likely to hold stocks directly.
Thus, it is understandable that Swedish households level of stockholding is among the highest
in the world. In addition, Sweden mastered a quick recover from the last economic crisis. As
Stephan (2015, p.276) explains, Sweden has learned its mistakes from the financial crisis,
which happened in the country twenty-five years ago. Since then, the economy and the major
companies are much stronger. Swedish households are more confident in their country and
their companies. According to Guiso, Haliassos and Jappelli (2003, p. 132), France is a
country with a low rate of household stockholdings in Europe. It can be partially explained
be a se Fra e is e the try with the ar est s ia se rity syste , “H sehold
st kh i s are ar er where the s ia se rity syste is ess e er s” (G is , Ha iass s,
Jappelli, 2003, p. 132). Furthermore, a low stock holdings participation in this country can
also be explained by a low financial and computer literacy and financial transparency in
comparison to Sweden (Guiso, Haliassos, Jappelli, 2003, p. 157). Given these last facts, it
appears pretty obvious that France and Sweden are two countries very interesting to compare
within our research. Furthermore, it will be more practical for us to reach our respondents in
these two countries. To accomplish this we will send it to different Business Schools in
France and in Sweden.
For students from Umeå School of Business and Economics, ICN Business School and
Burgundy School of Business, as we are students in all of these three schools, it will be easy
for us to reach potential participants, with the help of our teachers. For other schools in

23
France and in Sweden, we will contact deans, teachers and head of research. We will send
them a descriptive email with all of the information about our research, why we need their
help and a direct link to our online survey. We hope they will be comprehensive and that they
will answer positively to our request. In order to reach are pote tia resp e ts, we ’t
want to use any kind of social medias.
4.4 Quantitative data analysis
To analyse the data collected we exported them from Google Drive to Excel and to SPSS, a
statistical analysis software (Saunders et al., 2012, p. 473). According to Bryman and Bell
(2011, p. 334) it is important to keep in mind how the researcher will analyse the data prior to
collect them. Thus, we are going to explain the statistical tools used to analyse our collected
data. By using SPSS to analyse our data, we will be able to measure the effects of gender,
religion, field of education and nationality on the risk tolerance and investment behaviour
profile of the respondents. For this, Cr ba h’s Alpha, t-tests and ANOVA tests will be used.
4.4.1 Cr ba ’ a p a
Sa ers et a ., (2012, p. 430) a Ej e r , (2003, p. 70) stated that a measure to be valid
and useable should be reliable. Complete reliability is compulsory for a measure to be valid
(Patel and Davidson 2011, p. 102). Reliability is linked to internal consistency, which means
that the answers must be correlated to the questions of the questionnaire and that therefore the
constructs are consistent (Saunders et al. 2012, p. 430). The most widely used method, among
thers, t a ate the e i ie t re iabi ity is Cr ba h’s A pha (Sa ers et a . 2012, p.
430). The alpha coefficient is between 0 and 1 (Saunders et al., 2012, p. 430). An alpha of 1
describes a perfect correlation between the data collected and the concept measured. To be
acceptable, the value of the alpha must be above 0.80 in order to determine that the same
things are measured by the scales combined, nevertheless for researchers, an alpha above 0.7
is acceptable (Bryman & Bell, 2011, p. 159). I ther w r s, we st ha e a Cr ba h’s
Alpha above 0.7 in order to have data useable for our study.
4.4.2 Descriptive statistics
To find the average value of a population, the mean is used. The mean is computed by
summing all the values from a population and divided by the total number of this population
(Alm & Britton, 2007). Moreover, the Standard deviation is a tool that measures the variation
or the distribution of the values of a population (Alm & Britton, 2007). The standard
deviation gives an indication of the distribution around the mean (Alm & Britton, 2007). In
order to test our hypotheses, we used a t-test and a one-way ANOVA test. A t- test is a
method that compares means between two groups (Miller, 1997) and this method has been
used to find if there were any differences between our demographics such as gender,
nationality and our concepts (Risk tolerance, overconfidence, cognitive dissonance and
regret). To test the possible differences between religion, field of study and our 4 concepts
ANOVA has been used. An ANOVA test has the same structure as a t- test but it is possible
to test between more than two groups (Miller, 1997). The significance level that has been
used in the statistical analysis in 5%. Before to examine our data with t-tests or one-way
ANOVA tests, an important part of the process requires to check if our data can be analysed
with these kinds of tests. In fact, we can actually use these two tests if our data meet six
different assumptions (there are the same for the two tests) in order to have reliable results
(Lund and Lund, 2013).

24
· Assumption 1: Our dependent variables (risk tolerance, overconfidence, cognitive
dissonance, regret) must be interval / ratio variables. It means that the distances
between categories are identical (Bryman and Bell, 2011). Thanks to our ranking
system, we allocated to the respondents a certain number of points for each variable.
Therefore, there are interval / ratio variables.
· Assumption 2: Our independent variables (gender, nationality, religion, field of study)
must consist of two (for the t-tests) or more (for the one-way ANOVA tests)
ate ri a . O r i epe e t ariab es sist ate ries that a ’t be r ere
(Bryman and Bell, 2011, p. 381). Therefore there are categorical.
· Assumption 3: There must be independence of observations (a respondent must not be
in two or more groups). We have independent groups (you are either a male or a
female for example) so this assumption is met. We can note that none of our
participants has the double-nationality French and Swedish.
· Assumption 4: There should be no significant outliers. We use rating scale answers in
r q esti aire, th s we a ’t ha e t iers.
· Assumption 5: Our dependent variables must be approximately normally distributed
for each group of the independent variables. We tested this hypothesis using Shapiro-
Wi k's tests SPSS. I this tests the “Si .” a e r dependent variables must be
higher than 0.05. The results found are presented in the table 2. We often violated this
assumption but we conducted the tests without considering it because ANOVA and t-
tests are still robust under application of non-normally distributed data when the
different sample sizes are not small (> 10) (Schmider et al, 2010, p. 150; Sawilowsky
et al, 1992, p. 352-360).
Table 2: “Sig.” values found using Shapiro-Wilk's tests
Risk Tolerance Over confidenceCognitive
DissonanceRegret
Male 0.000 0.000 0.000 0.000
Female 0.034 0.001 0.000 0.001
France 0.000 0.000 0.000 0.000
Sweden 0.018 0.001 0.000 0.003
Unaffiliated 0.005 0.001 0.000 0.001
Catholic 0.001 0.005 0.000 0.025
Protestant 0.016 0.002 0.000 0.000
Accounting / Finance 0.004 0.003 0.000 0.002
Marketing / Communication 0.076 0.083 0.000 0.003
Economy / Strategy / Stats 0.053 0.024 0.000 0.003
Management 0.000 0.003 0.000 0.016
Risk averse 0.000 0.000 0.002
Balanced risk profile 0.010 0.000 0.002
Risk tolerant 0.004 0.000 0.038
Dependent variables
"Sig." values found with Shapiro-Wilk's tests
Risk tolerance
Ind
epen
den
t va
ria
ble
s
Gender
Nationality
Religion
Field of Study

25
· Assumption 6: Homogeneity of variances is required. We tested this hypothesis using
Levene's tests on SPSS. In this test, the value found must be higher than 0.05. All our
outcomes are presented in the table 3. This assumption is fundamental because in
function of the results found we will have to perform specific tests. For the t-tests, if
we found a value above 0.05, we performed a t-test and if the value was 0.05 or less
(it means that we violated the assumption of homogeneity of variances), we
conducted a Welch t-test because our design is not unbalanced (there is not a
significant difference of participants between our different groups). For the one-way
ANOVA tests, if the value was higher than 0.05 we did a one-way ANOVA and
potentially tukey post-hoc tests (if we found statistical differences, the post-hoc tests
tell us which of our conditions is materially different from each other). If the value of
our homogeneity test was lower than 0.05, we performed a Welch ANOVA and
potentially Games-Howell post Hoc tests if we found statistical differences.
Table 3: “Sig.” values found using Levene’s tests
4.5 Quality Criteria
Reliability, replicability and validity are three quality criteria that must be respected in order
to have a valid paper. A study is reliable if its measures are consistent (it means that the
measure must be stable over time). Thus, if we use the same measures with other students
there should be minor variations of results. The analysis made with t-tests and ANOVA are
based on 95% confidence intervals. Thus, our results should be the same in the future except
if there is an evolution of thought from one generation to another. Internal reliability of the
s a es has bee e a ate with Cr ba h’s A pha (part 4.2), which enables to assess the
“re iabi ity parti ipa ts’ resp ses t the eas re e ts” (He s et a , 2006, p. 633).
Cr ba h’s A pha eter i es i the i i at rs that r the s a e are siste t r t
(Bryman & Bell, 2011, p. 159). Our different Cr ba h’s a phas - higher than 0.6 (Shelby,
2010, p. 143) - show that we have a good level of internal validity.
A study should also be replicable, it means that if another researcher wants to use the findings
of a previous research to develop his own, he should be able to do that with ours. As advised
by Bryman & Bell, (2011, p. 41), we tried to explain thoroughly every step of our research
procedure. In this way, if other scholars want to use our findings to develop their own
research, they will not encounter any problem. For this study we collected primary data in
order to compare previous findings with our sample of respondents. If other researchers want
to analyse the same variables with the same sample, or try another sample as we did, they
will be able to base their study on our research.
Risk Tolerance Overconfidence Cognitive Dissonance Regret
Gender 0.62 0.010 0.670 0.541
Nationality 0.905 0.142 0.012 0.298
Religion 0.149 0.122 0.002 0.005
Field of Study 0.000 0.406 0.000 0.098
Risk Tolerance 0.983 0.057 0.012
"Sig." values found
with Levene's tests
Dependent variables
Ind
epen
den
t vari
ab
les

26
Validity of a research can be assessed by analysing the integrity of its conclusion. Bryman &
Bell (2011, p. 42) consider it as the most important quality criterion in a research. The
validity of a research can be appreciated with four different measurements. First, the
measurements of a concept should reflect this concept. Do our measures reflect what they are
supposed to reflect? Our data were processed with Microsoft Excel and SPSS for the
ANOVA tests and the t-tests. These tests help us to investigate the correlation between our
independent variables (gender, nationality, religion, field of study) and our independent
variables (risk tolerance, overconfidence, cognitive dissonance and regret). Secondly, there
must be a causality of the measurement and the relationship between variables (Bryman &
Bell, 2011, p. 42). Since this study will determine the relationship between our independent
variables and dependent variables of our participants. We already know from past studies that
these demographics should play a role in influencing the level of the concepts. Besides
testing these influences, we will also conduct an analysis in order to see if the level of risk
tolerance and the level of the investment behaviour biases are connected. We will report only
statistically significant influences. Therefore, the internal validity is obtained. Thirdly, our
findings should be generalizable to other studies. To conduct this research we used previous
theories in order to compare them with our findings. As our results are from primary data and
are accurate, future researchers on the subject could use them alongside for their own
purposes. This research is studying a particular sample but the demographics analysed are
used in lot of researches. Therefore, as we did, the findings can be used to do a research
based on different samples. Finally, we have developed specific parts to explain the
limitations we encountered and some suggestions to avoid them. We also add information
about ideas that could be followed in order to conduct future researches on the same subject.
4.6 Ethical considerations
While conducting a research and processing data from respondents, there are some core rules
to follow. An important consideration of ethics in business research is to create a respectful
and trustful environment with the participants (Saunders et al., 2012, p.231). The respondents
should not be pressured to respond the survey (Saunders et al., 2012, p.237). It is very
important to make them comfortable in order to obtain their answers. For this purpose, we
ha e t exp ai i what they are i t be part , wi the ‘i r ati pri ip e’
e.g., why we need their help for our study (Patel & Davidson, 2011, p. 63) and respect their
h i es i they ’t wa t t be part it. T respe t these pri ip es, we ear y exp se i
our emails and in the introduction of our questionnaire, the purpose of this thesis (investigate
st e t’s risk t era e a i est e t beha i r). We a te that we i ’t press re r
participants because we first ask teachers and deans from different Business Schools if they
could forward our emails to their students. If their answer was positive, we didn’t r e their
students to answer it. They were free to participate or not to our research.
It is also fundamental of being nice and not hurting the potential participants (Bryman and
Bell, 2011, p. 128). This means that we have to get their approval in being part of the
research and we have to care about minimizing the risk of hurting them. Moreover, it is
important to be clear on the fact that the questionnaire is fully confidential and anonymous.
According to Bryman and Bell, (2011, p. 129) in order to collect honest answers from the
participant, the responses should be anonymous. We use Google Docs to create our online
survey. Then, we sent an email with a link that redirects the participants on a webpage with
the survey. All the answers were processed by Google Docs. During all the process,
respondents were anonymous and we had no possibility to identify them.

27
5. Empirical findings and analysis
In this chapter, we will present the empirical findings that we got during our data collection
process. We will summarize the distribution process of our survey, present the characteristics
of our respondents, check the reliability of our answers with the Cr ba h’s A pha a
finally discuss our findings. The survey was sent for the first time on the 8th of May and we
closed it on the 14th of May. We have contacted the deans of Stockholm School of
Economics, Gothenburg School of Business, Economics and Law, the IHM Business School
and Miss Lions (Business, Administration and Finance teacher) and Mister Frost (Director of
studies, Business, Administration and Marketing) at Umeå School of Business and
Economics. In France, we have contacted Miss Berbara (Center for Personal and Professional
Development) at ICN Business School and Mister Celse (Associate Professor in
Organizational Behaviour) at the Burgundy School of Business. We had three positive
answers from Misses Lions and Berbara and from Mister Celse. All of the other answers were
e ati e. Gi e a hi h rate parti ipati i Fra e, we i ’t ta t re s h s.
At the end of our data collection, we got a total of 367 answers, with 166 participants who
currently invest in the stock markets and 161 wh ’t. We wi i t etai s i the
following part.
5.1 Demographics
The first part of our survey was about the personal details of our respondents, including the
demographics we were testing and some personal questions about their purposes behind their
portfolios and the sources of their information about financial markets.
We filtered the respondents with the first questions, when we asked if they are currently
studying in a Business School and if they are investing money directly in the stock market (if
they answered no, the questionnaire ended). Thanks to these questions, we were able to target
the respondent we wanted to reach. Nevertheless we can point out that we got only 20
answers from people who are investing indirectly in the market. The difference between the
level of direct investment (90% of all our respondents) and indirect investment (10% of our
respondents) is significative. We explained in details i the “ ther i i s” part this
thesis, that lots of our respondents want to invest in order to get better understanding but also
for long term wealth creation. Investing indirectly is a good method for wealth creation
because in this case, market professionals invest the money of their clients. Thus, beginner
mistakes are avoided and bigger returns could be expected on the long run. Nevertheless,
investing directly, even if the returns could be lower, allow investors to make their own
choices and research and develop strategies based on their findings. Consequently this last
method of investing combine both self-learning and could lead to wealth creation. Which
should fit better with the purposes of student investors.
The respondents of our survey are 65% male and 35% female. Which is not surprising
because, on average, men participate more in the stock market than women (van Rooij et al.
2011).
Our second demographic is about nationality. As we distributed our survey only in French
and Swedish Business Schools, almost all the respondents were French or Swedish.
Nevertheless, we had more nationalities represented (such as Mexico, the Netherlands,

28
Germany and Morocco) but given that they were represented by very few respondents, we
decided not to take them into account in order to keep our results accurate. With the method
of distribution of our survey, we managed to reach more Business Schools in France than in
Sweden, thus, our participants are 71% French and 29% Swedish. After having compared the
total of respondents of each countries and the total of students investing, we found that 72.4%
of our Swedish respondents were investing against 44.6% for French. According to Guiso,
Haliassos and Jappelli (2002), in Sweden, half of the households invest in stock market and
only one quarter in France (More details are provided in the our theoretical framework). Even
if our research deals with students, we can see this difference. With these results it is possible
to conclude that there is a significant difference in stockholding between countries.
The fourth question was about religion. For the same purpose as explained in the previous
question, we decided to keep only the more representative ones. We removed Islam, Judaism
and Orthodoxy, because less than 5 respondents were in each of these categories. Our
participants are 34% Catholics, 17% Protestant and 49% unaffiliated. Which can be
surprising because according to Iannaccone, (1998) and Guiso et al (2003), religiosity is
linked to a higher level of saving. But they also said that Catholic appeared to value savings
more than Protestant.
The last question about our demographics was the field of study. We reached 51% of students
from Accounting / Finance, 17% from Economy / Strategy, 19% from Management and 13%
from Marketing. Here again, no surprise, Accounting / Finance people are learning how to
save their money in financial markets at school. According to Bayer, Bernheim & Scholz
(1996), there is a correlation between stock market participation and financial education.
Moreover, these results could be explained also, by the fact that only one Business,
Administration and Finance teacher at the Umeå School of Business and Economics
forwarded our questionnaire. Even, if the survey was sent to all of her students, we can
imagine that more finance students received it.
5.2 Cr ba h’s A pha
When a questionnaire is conducted, the internal reliability of the answers must be checked.
Each concept should be consistent with the questions of the questionnaire. To assess this
siste y, a Cr ba h’s A pha is p te . I r er t be siste t, the Alpha must be
more than 0.7 (DeVellis, 2003; Kline, 2005). An alpha higher than 0.6 is also accepted
(Shelby, 2010, p. 143). As we measure four different concepts (risk tolerance,
overconfidence, cognitive dissonance and regret) we have four different alphas, which are
represented in the table 4. According to these results, all our concepts are consistent with our
questions and are reliable for analysis. Regarding overconfidence, we can note that is alpha is
lower than 0.7. According to Dennick and Tavakol (2011, p. 54), a low value of alpha could
results from a small number of questions. Here, overconfidence was related to only 3
questions.

29
Table 4: Cronbach’s alpha
5.3 Statistical analysis
5.3.1 Risk tolerance and its determinants
Table 5: statistics related to risk tolerance
I r er t i esti ate i e er is re ate t i ere t e e s st e t’s risk t era e. We
use an independent-samples t-test. There are 108 male student participants and 58 female
student participants. We display the different data as mean ± standard deviation. As shown in
table 5, risk tolerance is lower for male students (7.47 ± 2.50) than for female students (7.79
± 2.39). However, if we refer to the independent t-test (table 5), we note that this difference
of 0.32 is not statistically significant because Sig (2-tailed) = 0.418 > 0.05 (95% confidence
i ter a s). I ther w r s, this st y s ests that e er es ’t a e t risk t era e whe it
e t st e ts (we a ’t reje t the hyp thesis).
We use an independent-samples t-test so as to study the influence of nationality on student
risk tolerance. There are 118 French student participants and 48 Swedish student participants
According to table 5, Swedish students (7.94 ± 2.33) have a higher level of risk tolerance
than for French students (7.44 ± 2.46). Nevertheless, if we analyse the independent t-test
(table 5), we see that this difference of 0.50 is not material because Sig (2-tailed) = 0.905 >
0.05 (95% confidence intervals). Therefore, this paper insinuates that nationality has no
corre ati with st e t’s risk t era e (we a ’t reje t the hyp thesis).
Concepts Cronbach's alpha
Risk tolerance 0.776
Overconfidence 0.635
Cognitive dissonance 0.757
Regret 0.713
Male Female France Sweden Unaffiliated Catholic ProtestantAccounting
/ Finance
Marketing
/ Com
Economy/
Strategy/
Stats
Management
Mean 7.47 7.79 7.44 7.94 7.71 7.27 7.82 7.96 7.41 6.28 8.07
Std. Dev 2.50 2.39 2.46 2.33 2.49 2.41 2.26 2.72 1.89 1.14 2.48
Number or
participants (n)108 58 118 48 82 56 28 84 22 28 32
Sig. 2-tailed
(t-test or Welch
t-test)
Sig. 2-tailed
(Anova or
Welch Anova)
Risk
Tolerance
Gender Nationality Religion Field of study
0.418 0.905
0.481 0.000

30
A one-way ANOVA is conducted to investigate if religion has a correlation with different
e e s st e t’s risk t era e. O r resp e ts are either a i iate ( = 82) r catholic
(n = 56) or protestant (n = 28). According to table 5, risk tolerance level increases from
“Cath i ” (7.27 ± 2.41), t “ a i iate ” (7.71 ± 2.49), t “Pr testa t” (7.82 ± 2.26). We
observe (table 5) that the differences are not statistically significant because Sig = 0.481 >
0.05, th s we ’t ha e t a p st-hoc test to understand the roots of these differences.
A r i y, re i i es ’t i e e st e t’s risk t era e (we a ’t reje t the
hypothesis).
We conduct a one-way Welch ANOVA in order to investigate if the level of risk tolerance is
related to the fields of study. Our respondents are either studying accounting / finance (n =
84) or marketing / communication (n = 22) or management (n = 28) or economy / strategy /
statistics (n = 32). Risk tolerance (table 5) increases from the economy, strategy and statistics
group (6.28 ± 1.14) to the marketing and communication group (7.41 ± 1.89), to the
accounting and finance group (7.96 ± 2.72) to the management group (8.07± 2.48).
According to table 5, “Si ” = 0.000 < 0.05, there re the e e risk t era e is statisti a y
different between students with different fields of study (95% confidence intervals). In order
to understand where the differences come from, we have to analyse the “Ga es-Howell post
h test” (Appendix B), which displays that, the increase of 1.68 from the economy, strategy
and statistics group to the economy and finance group is significantly different. Also, the
increase of 1.79 from the economy, strategy and statistics group to the management group is
material. With a 95% confidence level, we can highlight that students in marketing and
communication have the lowest level of risk tolerance. Students in economy, strategy or
statistics have the second lowest level of risk tolerance, those in accounting and finance the
third lowest level. Finally, students in management are the more prone to risk tolerance.
Therefore we accept the alternative hypothesis: field of study seems to be related to different
levels o st e t’s risk t era e.
In conclusion, field of study is the only one demographic related to different levels of
st e t’s risk t era e.
5.3.2 Overconfidence and its determinants
Table 6: statistics related to overconfidence
Male Female France Sweden Unaffiliated Catholic ProtestantAccounting
/ Finance
Marketing
/ Com
Economy/
Strategy/
Stats
Management
Mean 6.27 6.19 6.36 5.96 6.17 6.21 6.35 6.41 5.72 6.06 6.35
Std. Dev 2.50 1.21 1.46 1.20 1.44 1.13 1.47 1.38 1.45 1.11 1.37
Number or
participants (n)108 58 118 48 82 56 28 84 22 28 32
Sig. 2-tailed
(t-test or
Welch t-test)
Sig. 2-tailed
(Anova or
Welch Anova)
0.742 0.184
95% confidence level
Gender Nationality Religion Field of study
Over
confidence
0.73 0.142

31
We display the different data as mean ± standard deviation. As shown in table 6, male
students (6.27 ± 2.50) have a higher level of overconfidence than for female students (6.19 ±
1.21). If we refer to the independent Welch t-test (table 6), we note that this difference of
0.08 (95% confidence intervals) is not materially significant because Sig (2-tailed) = 0.73 >
0,05. To put it simply, this study suggests that gender has no relationship with different level
st e t’s er i e e (we a ’t reje t the null hypothesis).
Table 6 highlights that, overconfidence is higher for French students (6.36 ± 1.46) than for
Swedish students (5.96 ± 1.20). According to the independent t-test (table 6), we notice that
this difference of 0.40 is not materially significant because Sig (2-tailed) = 0.142 > 0.05.
Therefore, according to this investigation, nationality is not related to different levels of
st e t’s er i e e (we a ’t reje t the hyp thesis).
St e t’s er i e e (Table 6) increases from “ a i iate ” (6.17 ± 1.44), t
“Pr testa t” (6.21 ± 1.13), t “Cath i ” (6.35 ± 1.47). Ne erthe ess, these i ere es are t
statistically significant because the Sig value given by the ANOVA test equals 0.742 (it is
higher than 0.05), therefore we do ’t ha e t a p st-h test. A r i y, re i i es ’t
i e e er i e e whe it es t st e ts (we a ’t reje t the hyp thesis).
Overconfidence level increases from the marketing and communication group (5.72 ± 1.45),
to the economy, strategy and statistics group (6.06 ± 1.11), to the management group (6.35 ±
1.37), to the accounting and finance group (6.41 ± 1.38). The ANOVA test informs us that
the i ere es are t si i i a t be a se Si = 0.184 > 0.05 (it ea s that we ’t have to
do a post-hoc test. In other words, this study suggests that field of education has no
re ati ship with st e t er i e e (we a ’t reje t the hyp thesis).
A i a , e raphi s are re ate t i ere t e e s st e t’s er nfidence.
5.3.3 Cognitive dissonance and its determinants
Table 7: statistics related to cognitive dissonance
We display the different data as mean ± standard deviation. Cognitive dissonance is higher
for female students (3.40 ± 0.86) than for male students (3.36 ± 0.83). Nevertheless, if we
refer to the independent t-test (table 7), we note that this difference of 0.04 is not materially
Male Female France Sweden Unaffiliated Catholic ProtestantAccounting
/ Finance
Marketing
/ Com
Economy/
Strategy/
Stats
Management
Mean 3.36 3.40 3.31 3.52 3.51 3.11 3.50 3.55 2.77 2.84 3.93
Std. Dev 0.83 0.86 0.86 0.74 0.76 0.93 0.75 0.77 0.81 0.85 0.26
Number or
participants (n)108 58 118 48 82 56 28 84 22 28 32
Sig. 2-tailed
(t-test or
Welch t-test)
Sig. 2-tailed
(Anova or
Welch Anova)
0.025 0.000
Gender Nationality Religion Field of study
Cognitive
dissonance
0.795 0.124

32
significant because Sig (2-tailed) = 0.795 > 0.05. Apparently, gender has no correlation with
cognitive iss a e whe it es t st e ts (we a ’t reje t the hyp thesis).
Swedish students have a higher level of cognitive dissonance (3.52 ± 0.74) than French
students (3.31 ± 0.86) according to table 7. The Welch t-test related to these variables (table
7) proves that this difference of 0.21 (95% confidence intervals) is not material because Sig
(2-tai e ) = 0.124 > 0.05. F rther re, this st y s ests that ati a ity es ’t i e e
iti e iss a e (we a ’t reje t the hyp thesis).
Student cognitive dissonance level (table 7) increases from the catholic group (3.11 ± 0.93) to
the protestant group (3.50 ± 0.75) to the unaffiliated group (3.51 ± 0.76). According to the
We h ANOVA test, “Si ” = 0.025 < 0.05, there re the e e itive dissonance is
statistically different between students with different religions. In order to analyse where the
differences come from, we have to explore the “Ga es-H we p st h test” (Appendix C).
This test displays that the increase of 0.40 from the Catholic group to the unaffiliated group is
material. With a 95% confidence level, it appears from this investigation that Catholic
students have a lower level of cognitive dissonance than unaffiliated students. Therefore we
accept the alternative hypothesis: re i i has a rre ati with i ere t e e st e t’s
cognitive dissonance.
Students in marketing and communication have the lowest level of cognitive dissonance
(2.77 ± 0.81). Then, students in economy or strategy or statistics have second level of
cognitive dissonance (2.84 ± 0.85). Students in accounting and finance rank third (3.55 ±
0.77) a th se i a a e e t ra k rth (3.93 ± 0.26). A r i t ANOVA We h’s
test, “Si ” = 0.000 < 0.05, there re the e e iti e iss a e is statistically different
between students with different fields of study. In order to explore where the differences
e r , we ha e t a a yse the “Ga es-H we p st h test” (Appendix D). This test
displays that the increase of 0.77 from the marketing and communication group to the
economy and finance group is materially different. Also, the increase of 0.38 from the
accounting and finance group to the management group is significantly different. Similarly,
the increase of 0.70 from the economy, strategy and statistics group to the accounting and
finance group is statistically important. Also, the increase from (i) the marketing and
communication group and (ii) the economy, strategy and statistics group to the management
group are significantly different. Thus, we can reject the null hypothesis and accept the
a ter ati e hyp thesis: ie st y see s t ha e a re ati ship with the e e st e t’s
cognitive dissonance (with a 95% confidence level).
Finally, religion and field of study ha e a rre ati with i ere t e e s st e t’s
cognitive dissonance.

33
5.3.4 Regret and its determinants
Table 8: statistics related to regret
We display the different data as mean ± standard deviation. As shown in table 8, regret is
lower for female students (4.97 ± 1.30) than for male students (5.12 ± 1.36). If we observe
the independent t-test (table 8), we note that this difference of -0.15 is not statistically
significant because Sig (2-tailed) = 0.478 > 0.05. It appears that gender should not have a
rre ati with i ere t e e s st e t’s re ret (we a ’t reje t the hyp thesis).
Table 8 displays that regret is higher for French students (5.21 ± 1.36) than for Swedish
students (4.71 ± 1.20). If we refer to the independent t-test, we see that this difference of 0.50
(95% confidence intervals) is statistically significant because Sig (2-tailed) = 0.027 < 0.05.
This analysis suggests that nationality affects regret (we reject the null hypothesis).
Accordingly French students seem to have a higher level of regret than Swedish student.
Regret level (table 8) increases from the protestant group (4.57 ± 0.69) to the unaffiliated
group (5.07 ± 1.43), to the catholic group (5.30 ± 1.39). According to Welch ANOVA (table
8), “Si ” = 0.003 < 0.05, there re the e e re ret is statistically significantly different
between students with different religions. In order to investigate where the differences come
r , we ha e t a a yse the “Ga es-H we p st h test” (Appendix E). This test proves
that the increase of 0.50 from the protestant group to the unaffiliated group is significantly
different. Also, the increase of 0.19 from the protestant group to the catholic group is
significant. Thus, this study suggests that religion affects regret (we reject the null
hypothesis). Protestant students are the less prone to regret, followed by unaffiliated students
(second highest level of regret) and lastly by Protestant students (highest level of regret).
According to table 8, regret level increases from the management group (4.36 ± 1.34), to the
economy, strategy and statistics group (4.94 ± 1.01), to the accounting and finance group
(5.19 ± 1.35), to the marketing and communication group (5.68 ± 1.36). We note (figure 11)
that the differences are significant because Sig = 0.003 < 0.05, thus we have to do a tukey
post-hoc test (Appendix F) to understand the roots of these differences. According to this test,
the differences stem from the increase of 0.83 from the management group to the accounting
and finance group. Similarly, the increase of 1.32 from the management group to the
marketing and communication group is statistically significant. In other words, this study
suggests that field of study has a relationship with regret (we can reject the null hypothesis).
Male Female France Sweden Unaffiliated Catholic ProtestantAccounting
/ Finance
Marketing
/ Com
Economy/
Strategy/
Stats
Management
Mean 5.12 4.97 5.21 4.71 5.07 5.30 4.57 5.19 5.68 4.94 4.36
Std. Dev 1.36 1.30 1.36 1.20 1.43 1.39 0.69 1.35 1.36 1.01 1.34
Number or
participants (n)108 58 118 48 82 56 28 84 22 28 32
Sig. 2-tailed
(t-test or
Welch t-test)
Sig. 2-tailed
(Anova or
Welch Anova)
0.003 0.003
Gender Nationality Religion Field of study
Regret
0.478 0.027

34
To summarize, nationality, religion and field of study have a relationship with different levels
st e t’s iti e iss a e.
5.3.5 Is there a relationship between risk tolerance and investment
behaviour of students?
Table 9: statistics related to risk tolerance and our investment biases
The ranking scheme of our questionnaire allows us to draw a risk tolerance profile of the
respondents. They can potentially have between three points and thirteen points. Based on
Grable (1999), we allocated an averse-profile to the respondent if he ranks between three
points and six points. Similarly, if he ranks between seven and nine points we give him a
balanced risk profile and if the respondent has between ten and thirteen points we consider
him as risk tolerant. Thus, we can conduct a one-way ANOVA in order to investigate if the
risk tolerance profile has a correlation with different levels of overconfidence (ranked from
three to 10).
A one-way ANOVA is conducted to investigate if there is a correlation between risk
tolerance and overconfidence. Our respondents have either a risk-averse profile (n = 55) or a
balanced risk profile (n = 69) or a risk tolerant profile (n = 42). We display the different data
as mean ± standard deviation. According to table 9, overconfidence levels increase from the
balanced risk profile group (5.97 ± 1.36), to the risk-averse group (6.09 ± 1.01), to the risk
tolerant group (6.88 ± 1.52). We note (table 9) that the differences is significant because Sig
= 0.002 < 0.05. In order to analyse where these differences come from, we have to analyse
the tukey post hoc test (Appendix G). This test displays that the increase of 0.79 from risk-
averse students to risk tolerant students is materially different. Also, the increase of 0.91 from
student with a balanced risk profile to student risk with a risk tolerant profile is significantly
different. Thus, we can reject the null hypothesis and accept the alternative hypothesis: risk
tolerance seems to have a re ati ship with the e e st e t’s er i e e. Risk
tolerant students appear to have the highest level of overconfidence (with a 95% confidence
level). Risk-averse students have the second highest level of overconfidence, and students
with a balanced profile the lowest level.
OverconfidenceCognitive
dissonanceRegret
Mean 6.09 3.11 5.38
Std. Dev 1.21 0.90 1.07
Mean 5.97 3.46 4.88
Std. Dev 1.36 0.78 1.29
Mean 6.88 3.57 4.95
Std. Dev 1.52 0.77 1.64
Riske averse +
balanced risk profile +
risk tolerant
Sig.
(Anova or Welch Anova)0.002 0.012 0.056
Dependent variables
Risk tolerant
(n = 42)
Balanced risk profile
(n = 69)
Risk averse
(n = 55)
Risk
Tolerance
95% confidence level

35
We conduct a one-way ANOVA in order to investigate if there is a relationship between risk
tolerance and cognitive dissonance of students. This investment bias (table 9) increases from
the risk-averse group (3.11 ± 0.90) to the balanced group (3.46 ± 0.78), to the risk tolerant
group (3.57 ± 0.77). According to table 9, “Si ” = 0.012 < 0.05, there re the e e risk
cognitive dissonance is statistically different between students with different risk profiles
(95% confidence intervals). The tukey post hoc test (Appendix H) highlights that the increase
of 0.46 from the risk-averse group to the risk tolerant group is significantly different.
Similarly, the increase of 0.35 from the risk-averse group to balanced risk profile group is
material. With a 95% confidence level, we can highlight that risk tolerant students have also
the highest level of cognitive dissonance. They are followed by students with a balanced risk
profile (they rank second) and by risk-averse students (they rank third). Therefore we accept
the a ter ati e hyp thesis: risk t era e see s t be re ate t i ere t e e s st e t’s
cognitive dissonance.
Our last investigation allows us to see if there is a relationship between risk tolerance and
different e e s st e t’s re ret. A r i t table 9, st e t’s re ret i reases r
“ a a e risk pr i e” (4.88 ± 1.29), t “Risk t era t” (4.95 ± 1.64), t “Risk a erse” (5.68
± 1.07). Nevertheless, these differences are not statistically significant because the Sig value
i e by the We h ANOVA test eq a s 0.056 (it is hi her tha 0.05), there re we ’t
have to do a post-hoc test to understand the roots of these differences. Accordingly, different
e e s st e t’s re ret ’t i e e risk t era e (we a ’t reje t the hyp thesis).
A i a , er i e e a iti e iss a e i e e st e t’s risk t era e.
5.4 Other findings
In our questionnaire, we asked three questions (questions 8, 9 and 10) to be aware of the
purposes behind investments of our respondents, to investigate the sources of their
investment advice/information and to understand their financial knowledge. For these
questions, we let the students the opportunity to give more than one answer.
The purposes behind their financial investments were asked first (question 8). It appears that
26.5 % of the respondents invest to cover future short-term expenses and 62% with the idea
to create long-term wealth. These results are interesting because it shows that students think
more on the long run and are already concerned about their future. Before this investigation,
we thought that this consideration was more in mind of older people (those with a family and
a job). Therefore, this study can be helpful for financial advisors (banks or private financial
advisors) because it seems that long-term financial products like obligations or life insurances
(as a long-term savings instrument) seem to fit to students. We also wanted to know if having
a portfolio was a way for students to one-up the other - especially for those in accounting and
finance. Approximately 11% of our respondents invest in order to have a differentiation on
their curriculum. This number rises to 19% for the specific group of students in accounting
and finance. This is understandable because there is nowadays a strong competition among
newly graduated people in finance. After having spoke with various financial professionals
and recruiters, we found that investing your own money while you are still studying, even if it
is a small amount, could make a real difference for future job applications. In fact, lot of
bankers and recruiters are not just interested by the diplomas and the professional experiences
of their applicants, they are also focus on extracurricular activities. Thus, it could be a smart
move to have a portfolio for this matter.

36
Next, we asked the sources of information (question 9) in order to know where students find
their information/advice before investing. We were very surprised to see that 57% of them
are using financial statements, as this kind of analysis requires a minimum of financial
knowledge. Almost two-third of our respondents (64%) find information in newspapers. Due
to this high percentage, we think that we should have been more precise in this question
because we wanted to know if they are using real newspapers (and not online newspaper).
51% are using Internet, which is a pretty small amount given that Internet provides a wide
range of information and that students are very familiar with it. Here again, we should have
been more precise by dividing Internet in several categories (forums, online newspapers,
article, reports). We also noticed that lots of our respondents use professional information
(32% rea br kers’ tes). Fi a y, 31% invest in the wake of market rumors. This result is
very interesting because more than 80% of them have a risk tolerant profile (according to our
rating scale questionnaire).
The investment knowledge level of the respondents was finally asked (question 10). It
appears that 32% of our respondents have a limited knowledge, 43% a moderated knowledge,
21% a good knowledge and 4% are already experienced. Thus, 75% of the respondents are
not very familiar with the financial markets. This is in harmony with the results of question 8
(about investment purposes) because 57% of the respondents invest in order to improve their
knowledge of the financial markets. These results suggest that having a portfolio is a good
way to be familiar with investment.

37
6. Discussion
The first goal of our thesis is to participate to research in analyzing the correlation between
common demographics (gender, nationality, religion), a rarely investigated demographic
(field of study) and different levels of st e ts’ risk t era e. At this e we wi be ab e t
analyse if students react as the whole population. The second aim is to contribute to research
by a a yzi the re ati ship betwee these e raphi s a i ere t e e s st e t’s
investment biases (overconfidence, cognitive dissonance and regret). This last field is a
growing field of study with few works previously held on our topic. At our knowledge, only
gender is tested with overconfidence. Lastly, we wanted to study the relationship between
risk tolerance and these investment biases.
We start our discussion with the revision of our first hypothesis. Are demographics such as
e er, ati a ity, re i i a ie st y re ate t i ere t e e s st e t’s risk
tolerance?
After having analysed our data, our empirical findings showed no significant difference
between gender and risk tolerance when it comes to students. Comparing to previous studies,
it is generally accepted that gender is a factor of risk tolerance (Bajtelsmit & Bernasek, 1996,
p. 1, Powell and Ansic, 1997, p. 605). But according to Hanna, Gutter, and Fan (1998, p. 10 -
11) and Grable and Joo (1999, p. 54), gender is not a relevant factor, which explains the
difference in risk tolerance of an individual. Following our results, we will side with the
resear hers wh that this e raphi es ’t p ay a r e i risk t era e (e e i
they analyse the whole population and not just students). Therefore, we are rejecting our
hypothesis when it comes to the influence e er st e t’s risk t era e. The ,
nationality is one factor that is hypothesized to impact risk tolerance (Cummings et al. 1971).
However, our analysis showed no material difference between Swedish and French students.
We can conclude, as Bartke and Schwarze (2008) concluded before, that nationality is not
relevant to explain risk tolerance differences between countries. However, in our case, the
findings only encompass students. Our hypothesis is rejected with nationality. We think that
it could be very interesting for future researchers to analyse this relationship between
countries more different (Sweden and Japan for instance). Next, it is frequently argued that
the level of education of an individual could affect his risk tolerance (Haliassos and Bertaut,
1995, p. 1110; Sung & Hanna, 1996, 11). With our study, we wanted to contribute to this
specific aspect by going deeper in the analysis and comparing people from the same level of
education, but with different field of studies. Our results showed that the field of study was
influencing the risk tolerance of an individual. In the specific case of Business Schools, we
found that students in management are the more risk tolerant and that students in economy,
strategy or statistics are the more risk averse. With these results, we can think that
management students have less financial literacy than finance students, thus, investing in
risky assets could arise from a lack of knowledge of financial market risks. In their studies,
they are also learning how to deal with risky situations (how to manage a company in distress
situation for example), which could explain their high degree of risk tolerance (contrary to
students in marketing and communication). On the other side, economy, strategy or statistics
students are at the bottom of the risk tolerance ranking. It could be explained because this
field of study has a direct link with macro economy. Indeed, economy students, for instance,
study the roots of the biggest financial crisis, which are often linked to investment biases
(1929, 2000, 2007). For statistics students, they usually learn risk management during their
studies. We can assume that given they are aware of the risky nature of the markets, they are
prone to be risk averse. We can confirm our hypothesis, and we can say that field of study

38
i ht i e e st e t’s risk t era e. I a iti we ir a s the i i s C e a
Shastry (2009, p. 2) that show that people with an educational background in finance would
not be more risk tolerant than people with an education in another field of study. Finally, we
i ’t i the sa e res ts as artke a S hwarze (2008) with respe t t re i i a risk
tolerance (but in our case, we only focused on students). With our empirical findings we
f that re i i es ’t a e t st e t’s risk t era e a that there are si i i a t
differences in-between religions. It could be explained by the decrease of religion influence
on individuals, generation after generation. We can reject our hypothesis about the influence
re i i st e t’s risk t era e. O r e piri a i i s sh w that st e ts ’t rea t
as adults regarding risk tolerance (if we stick on the conclusions that have been the most
commonly argued by previous researchers). It is probably a consequence of both the theory
of emerging adulthood and the evolution of generational thinking.
We will now review the second hypothesis: Are demographics such as gender, nationality,
religion and field of study related to different levels st e t’s er i e e? We isp ay
the different data as mean ± standard deviation. Bengtsson, Persson and Willenhag (2004, p.
1) find that male students are more confident than female students when it comes to
expecting a good grade to a coming exam. From an investment behavioural point of view,
Barber and Odean (2000, p. 261) find that women are less confident than men concerning
their investment skills. Our results show no statistically difference between the
overconfidence of female students (6.19 ± 1.21) and male students (6.27 ± 2.50). Thus, the
hypothesis that gender influences the overconfidence of a student investor is rejected. For the
relationship between overconfidence and nationality, despite a higher score for French
students (6.36 ± 1.46) compare to the score of Swedish students (5.96 ± 1.20), the analysis
ateria y i ere es betwee these tw r ps. As we i ’t ha e pre i s
hyp theses t base r res ts , we wi say that ati a ity es ’t i e e si i i a t y
the overconfidence of a student investing in stocks. Our findings showed minor
overconfidence differences between religious students (Catholic and Protestant) and
unaffiliated students (we rejected our hypotheses about the possible influence of the religious
af i iati ). Last y, we a s is ere that ie st y ’t ha e a y rre ati with
i ere t e e s st e t’s er i e e. Gi e that we i ’t i a y rre ati with
our demographics, we can think that overconfidence could be more influenced by external
a te p rary a t rs (N te, 2006) r by the st e t’s i here t be ie i his r her abi ity t
succeed (Lester et al, 1989, p. 75). Thus, this investment bias seems not to belong to any
specific group.
With respect to our third hypothesis (are demographics such as gender, nationality, religion
a ie st y re ate t i ere t e e s st e t’s iti e iss a e?), we i ’t
find any research dealing with the influence of these demographics on cognitive dissonance
in the specific field of finance. At this end, we will base our findings on previous papers
dealing with cognitive dissonance as a whole. Our empirical findings showed no statistically
differences between female and male students regarding their cognitive dissonance.
Therefore our hypothesis on the possible relationship between gender and different levels of
st e t’s iti e iss a e is reje te . The se e raphi pare with iti e
dissonance is the nationality. Here again, no significant differences were found between
French and Swedish students. We can reject our hypothesis on the relationship between
nationality and the cognitive dissonance of a student investor. This result is consistent with
C per’s w rk (2007) that claims that dissonance is experienced by individuals everywhere,
it is not limited to a specific culture or country. However, different cultural values can lead to
distinct cultural experiences. Indeed, American and European people are both motivated by

39
feelings of guilt and feeling of shame contrary to Asian people who are mostly motivated by
feelings of shame. Given that cultural values in France and Sweden are very close we could
have expected to find no difference between students. However, if we had selected two
countries with different values, our results could have been different. According to our
findings, the level of the cognitive dissonance of a student might be influenced by his field of
study. Students in marketing and communication are the less prone to this bias, followed by
economy, strategy and statistics students. Students in accounting and finance have the third
highest level and students in management have the highest level. We confirm our hypothesis
on the relationship between the field of study of a student investor and his level of cognitive
dissonance. Our last demographic which is religion, might influence the level of cognitive
dissonance of individuals on the market. In comparing our three variables, we saw that
Catholic respondents were less cognitively dissonant than unaffiliated respondents and
Protestant respondents. According to Barlett, Drew, Fahle & Watts, (1974), individuals with
religious orientation and beliefs have a tendency to self-justify their beliefs when
contradicted. This behaviour could favor cognitive dissonance. Our results showed a higher
level of cognitive dissonance among Protestants, but according to this previous study, we
would have expected to see the Unaffiliated with the lowest level. Therefore, we can confirm
that the religion of a student investor might influence his level of cognitive dissonance. These
results are interesting because cognitive dissonance is observed when an investor change his
beliefs or investment styles to support his investments and students are individuals who are
actually learning knowledge. Thus, a change in beliefs or investment strategies is
ersta ab e be a se, w, they are ear i h w t i est their ey, they ’t ha e
definite strategies. This characteristic is visible with our respondents given that 57% launched
their portfolios to get a better understanding of the financial markets.
We will now investigate our fourth hypothesis (are demographics such as gender, nationality,
re i i a ie st y re ate t i ere t e e s st e t’s regret). According to
scholars, regret depends on both the comparison with an outcome that may have occurred and
feelings of responsibility (Sugden, 1985, p. 77 - 99; Fincham & Jaspers, 1980). Thus, this
bias arises in specific situations (Kahneman & Tversky, 1982, p. 160 - 173). However,
demographics such as gender, nationality, religion (but also marital status, income and
ber hi re ) ’t a e t re ret (Rit a ar , 1995, p. 119). O r e te ata
showed opposite results for students, with respect to the previously quoted demographics.
Even if we determined that the regret level of students is not significantly influenced by his
gender, we found that nationality, religion and field of study are correlated with different
st e t’s e e . I eed, our empirical results showed a significant difference between the
regret of French students (5.21 ± 1.36) and the regret of Swedish students (4.71 ± 1.20). We
also found that the regret level of investors can be influenced by their religious affiliation.
Our Protestant respondents had a score of regret of 4.57 (± 0.69), our unaffiliated respondents
had a score of 5.07 (± 1.43) and our Catholic respondents had a score of 5.30 (± 1.39).
Finally, management students are the ones with the lower level of regret, followed by the
economy and strategy students, then the accounting and finance students and lastly the
marketing and communication students. To explain these differences with previous research
we a (i) thi k that st e ts ’t rea t as the wh e population with respect to gender
(theory of emerging adulthood). We can also believe (ii) that our sample was not
representative enough or (iii) that our confidence level of 95% was too broad (maybe we
should have selected a confidence level of 99%). At this end, it could be interesting to see
future results focus on this topic.

40
Our research on the investment behavioural biases of students comes up with some
interesting findings. We found that the level of some of these biases can be correlated with
our demographics. Given that these biases are present in every individual investor, it is
important to be aware of them and to try to adapt our strategies in order to decrease their
effects on our investments. Some researchers had point out that it is important to implement
disciplined trading strategies and draw some guidelines to limit the effect of behavioural
biases. One should think about the following before investing money:
Why would I purchase the stock?
What is my investment time horizon?
What is my objective expected return for this investment one year from now? Why should I
do if the stock underperformed my objective?
How risky is this stock within my overall portfolio?
These are just guidelines but they can help an investor to focus on his first strategy. With our
finding on cognitive dissonance, we can say that students are prone to change their strategies.
Following these steps could help them to avoid some psychological trading mistakes.
Investment behaviour should be carefully studied in the future. Our results showed
differences among students. This research should thoroughly studied and extended to the
whole population of investors. If they are more aware of these biases, markets may react
more efficiently and investment losses could be decreased.
Our last goal was to analyse a possible relationship between the level of risk tolerance and
i ere t e e s st e t’s i est e t biases. O r e piri a res ts sh we s e patter s.
We found that the level of overconfidence and the level of risk tolerance of students are
related. More precisely, the more the students are overconfident, the more they are risk
tolerant. This result is in harmony with Pa a Stat a ’ t es (2010, p. 1 - 28).
Nevertheless, we found that students with a balanced level of risk tolerance appear to be the
less overconfident. We think that more research should be made on this particular field in
order to check the accuracy of these results. We also found a relationship between the risk
profile of students and their level of cognitive dissonance. A high level of risk tolerance
seems to go hand in hand with a high level of cognitive dissonance. This result is not
surprising because a risk tolerant student is often prone to change his investment habits. For
instance, he is not reluctant to change his investment style (chart analysis, P/E ratio) to invest
i pr isi se t rs. Fi a y, we i ’t i a y re ati ship betwee the risk pr i e a the
level of regret of our students. Regrets are mainly related to sentiments felt once an
investment has been made. The risk profile of investors has already influenced his
investments. Therefore, our findings are understandable. All these results could be analysed
more thoroughly by future scholars because they could be fruitful for professional investors.
Right now portfolio managers and brokers are only evaluating the risk profile of their
customers before investing their money. However, if behavioural biases play a role in
influencing the risk tolerance of investors, they also should be assessed. This would allow to
ha e a better ersta i i est r’s psy h y.

41
7. Conclusion
In this part we answer our research question, we explain our contributions, we expose the
problems we encountered and we make some recommendations for researchers who will
analyse this field of study in the future.
Thr h this paper, r irst wish was t st y st e t’s i est e t beha i r a risk
tolerance. Research gap were found (i) when dealing with students, (ii) in the investment
behavioural field and (iii) in the possible relationship between risk tolerance and investment
behavior.
7.1 Answer to our research question
Our research question is:
“W at ar t d t r a t r k t ra a d v t t b av r tudents and
is there a relationship between risk tolerance and investment behaviour?”
After the analysis of our empirical results, we found that when it comes to student investors
neither nationality, nor gender, nor religion play a role in influencing their risk tolerance.
Nevertheless, we found a significant relationship between the field of study and the level of
risk tolerance. We concluded that the field of study might influence the risk tolerance of
students (which is coherent because depending on their field of study, the financial
knowledge of students will be altered). Despite a lack of consensus from previous researchers
the eter i a ts i e i risk t era e, we that st e ts ’t rea t as a ts.
The discrepancies found could be related to the theory of emerging adulthood or to an
evolution of thought between generations.
For investment behaviour, though, we found more correlation with our determinants. We first
analysed the overconfidence of our respondents and the possible relationships with our
e raphi s. We i ’t i a y rre ati with this bias, which is not surprising because
i est r’s er i e e ay be (i) a te p rary beha i r (N te, 2006) r (ii) i ke t the
i i i a ’s be ie t s ee . Th s, er fidence seems not to belong to any specific
group. We also investigated cognitive dissonance. Our empirical findings showed that this
bias was correlated with religion and field of study. These results could be influenced by the
fact that we focus on students from two countries with relatively close cultural values. Most
of them are still learning how to invest and are more prone to change their investment
strate ies. Di ere t e e s st e t’s re ret see t be i e e by ati a ity, re i i
and field of study. These findings appear to be in contradiction with previous research. It may
be evidence that st e ts ’t rea t as a ts whe it es t i est e t beha i r the
financial markets.
Finally, our last analysis suggests a possible relationship between risk tolerance and
investment behavior of students. Our empirical results show that overconfident students have
a high level of risk tolerance. Similarly, risk tolerant students own a high degree of cognitive
dissonance. These intuitive results have been confirmed by our investigations.

42
7.2 Contribution
7.2.1 Research contribution
Investor's risk tolerance is mostly investigated with adults. It is understandable given that
investors on the financial markets are mainly workers or retired people. However, students
represent an entire generation, and lots of them are already investing in the markets, included
in stocks. Investigate their investment characteristics could help to better understand attitude
of real actors on the financial markets. Most of papers we read dealing with this subject have
a static approach to examine risk tolerance and investment biases: they are based on
observations made at a particular moment of the life of different investors. In our case, we
tried to have a dynamic approach through the analysis of students. Indeed, by comparing the
features of student investors with those of adults (through our literature review) we wanted to
know if risk tolerance and investment biases arise after years or if they are already present in
the student years of an individual.
Our result showed differences between the e raphi s a e ti st e t’s risk t era e
a th se i pa ti a t’s risk t era e. The sa e i i s were bser e with i est e t
behavior. To explain these discrepancies, we already highlighted the theory of emerging
adulthood and the evolution of thought from one generation to another. However, we do think
that these differences also reflect that investment behaviors and risk tolerance shape over
time. It may be a consequence of internal factors (intrinsic characteristics of each individual)
external factors (wedding, the birth of a child), or the consequences of years of trading and
experience gained. We believe that it could be very interesting for future papers to analyse
thoroughly the elements that mould the evolution of risk tolerance and investment behavior
over years.
Finally, we wanted to study the relationship between risk tolerance and investment behavior.
At first sight, risk tolerance seems to affect investment behaviors. However these two aspects
seem to be intertwined. When investors have a high level of risk tolerance they also have a
strong level of overconfidence and cognitive dissonance. But we can also say – for example -
that overconfident investors are highly risk tolerant and present cognitive dissonance. We
endeavored through our discussion to highlight the interactions existing between these
different concepts. This investigation is new and may lead to further research.
7.2.2 Practical contribution
Most of the portfolio managers and brokers are nowadays assessing the profile of their clients
based on their risk profiles. However, we showed in this paper that the investment behaviour
of individuals should be taken into account by professional in order to balance their assets in
a better way. If the relationship between investment biases and risk tolerance is confirmed in
the future, this paper may participate to enhance a better assessment of the profile of indirect
investors. If risk profiles are influenced by behavioural biases, every professional should also
evaluate the levels of overconfidence, cognitive dissonance, and regret of their clients.
Also, student investors are potential customers for asset managers, brokers, and investment
funds. If professional investors fully understand how students behave and what they are
ki r i the i a ia arkets, it be easier r the t eet st e ts’ expe tati s
and potentially invest for some of them. We found that 47% of our respondents invest for
learning purposes. It means that 53% of students who respond to our survey invest regardless

43
of this consideration. At this end - without statistically generalizing this result –
approximately half of students are present on the financial markets for other goals (future
short term expenses or long term wealth creation) and only 10% of them, based on our
sample, invest indirectly. Thus, this paper could help professional investors to improve their
ersta i st e ts’ ee . I esti r w ey r st e ts with a i i
assets could be an advantage to keep them as clients in the long run - when they will have a
better professional situation and more money.
This paper could also benefit students who invest (or want to invest) in the financial markets.
We shed light on the main investment biases present on the markets: overconfidence,
cognitive dissonance and regret. To be aware of behavioral biases could help students to
reduce them by implementing precise trading strategies. Even if students are present on the
financial markets for learning goals, we believe that it is fundamental to have some insights
of main mistakes that they could make.
7.3 Problem we faced
The first problem met during our research was the distribution of our questionnaire. We
wanted, in order to be as accurate as possible, to reach students from different Business
Schools by sending our survey to several deans and teachers. We hoped they could forward
r s r ey t their st e ts. Ne erthe ess, i Swe e , st the i ’t rep y t s r
rejected our request (except in Ume). In the end, we managed to collect data in Sweden only
from students studying at Umeå School of Business and Economics. We had also more
answers from French students. Indeed, our two French Business Schools accepted to release
our survey (it explains why we have approximately two-third of French respondents). This
had probably influenced our results and could explain the non-normal distribution of our
independent groups during our empirical analysis
In our questionnaire, we also found problems to analyse the answers related to the sources of
information/advice. We should have detailed our possible answers more thoroughly. We d
t that s e were i terre ate (st e ts a se i e ewspapers, br kers’ tes are
usually found on Internet also) and it could have been misleading for our respondents.
Finally, we might have collected not very accurate data for overconfidence. Our last analysis
showed that high level of overconfidence was in relation with high level of risk tolerance.
More surprisingly, we found that medium level of overconfidence was in relation with low
level of risk.
Give that r three Cr ba h’s A phas i ke t r q esti s ab t er i e e,
iti e iss a e a re ret were se t 0.7 (the Cr ba h’s a pha the q esti s
related to overconfidence was lower than 0.7), we assumed that our questions related to
behavioural biases (questions 14 – 20) were not common questions which could have been
hard to understand for some of our respondents. We also could have added more questions
but we were afraid to have a questionnaire with too many questions. Also, we supposed that
s e resp e ts wh ’t i est a swere r s r ey e e i we ear y stip ate that we
were only looking for answers from students investing in the stock markets. Thus we could
have collected some data that were not totally accurate.
During the analytical part, we came up with other limitations tied to the choice of our
determinants. One goal of our research was to analyse the impact of nationality on risk
tolerance and investment behavior. At this end, we selected two European countries with

44
different level of stockholding. However, France and Sweden are not so far apart from each
other. They are both European developed countries with similar cultural values. At this end,
we could have expected to find no significant difference between French students and
Swedish students. Perhaps we could have selected two countries with values, cultures,
religions, education systems or average income more pronounced. We could have selected
also more than two countries. Further research focusing on nationality should then compare
countries with differences more significant if they are looking for discrepancies in their
res ts. The sa e res ts appear with e er, we i ’t bser e a y parti ar i e e
this demographic on our dependent variables. Instead, we could have selected another
demographic never investigated (impact on the ranking of the Business School for example).
7.4 Recommendations for further research
Future researchers should try to avoid the limitations we encounter in our research. First of
all, a better representative sample is needed. In our case, we expected to have groups of
respondents (more than 10 participants) from at least five different Business School. It
assumes to reach people differently that we did. They may, for instance, send directly their
survey to relevant students from their target school (class delegates). They could also use
their network more efficiently in order to reach more relevant respondents. Researchers
should also pay attention to not collect data from people who are not investing in order to
a i a y bias i their res ts. We thi k that aski the a e resp e t's’ br ker be
effective to reach people who are actually investing.
Also, future researchers could focus on new demographics when it comes to risk tolerance of
investment behaviors. If they are dealing with students, they could investigate the influence
of the ranking of the school in order to analyse i st e ts r “t p” b si ess s h are
more risk tolerant / overconfident than people from schools more modest. Also, our
independent variables are the main investment biases. However, it exists a very high number
ther biases ( ir ati bias, pti is bias, her i …). Ha i a spe i i s
them could allow to participate to the development of behavioral finance.
The field of investment behavior is very important because the financial markets are present
worldwide and we saw recently that they can strongly affect the world economy. To avoid
irrationality, investors should be aware of how they can be influenced by specific events or
by temporary emotions. Future researchers on this field could use a qualitative process in
order to analyse these biases “ the r ”. Thr h the i ter iew well-targeted
investors, they could understand precisely the nature of their behavioural biases. We also
think that the investment behaviour of investors are impacted by specific events and
temporary emotions. Therefore, conducting research on specific cases seems to be a good
alternative procedure to obtain relevant findings. A good idea would be to test the influence
of various specific scenarios on individuals and see how they react.

1
List of references
A kert, L.F., .K. Ch r h, a R. Dea es. “E ti a Fi a ia Markets.” Economic
Review, 3, (2003), p. 33–39.
Arnett, J.J. (1992). Socialization and adolescent reckless behaviour: A reply to Jessor.
Developmental Review, 12, p. 391- 409.
Arnett, J. J. (2000). Emerging adulthood: A theory of development from the late teens
through the twenties. American Psychologist, 55, p. 469-480.
Arnett, J. J. (2005). The developmental context of substance use in emerging adulthood.
Journal of Drug Issues, 35(2), p. 235-254.
Aronson, E., Turner, J., & Carlsmith, J. (1963). Communicator credibility and
communication discrepancy as determinants of opinion change. The Journal of Abnormal and
Social Psychology, 67(1), p. 31-36.
Arruñada, B., (2010). Protestants and Catholics: similar work ethic, different social ethic.
Economic Journal 2010; 120, p.890-918.
Avramov, D. (2004). Stock Return Predictability and Asset Pricing Models. Review of
Financial Studies 17, p. 699-738.
Bajtelsmit, V. L., & Bernasek, A. (1996). Why do women invest differently than men?
Financial Counseling and Planning, 7, p. 1–10.
Bajtelsmit, V. L., and VanDerhai, J. L. (1997). Risk aversion and pension investment choices.
Philadelphia: University of Pennsylvania Press.
Baker, H. K. and Nofsinger, J. R. (2002). Psychological Biases of Investors,. Financial
Services Review 11:2, p. 97–116.
Baker, M. P., and Wurgler, J. (2007), Investor Sentiment in the Stock Market. Journal of
Economic Perspectives 21, p. 129-152.
Baker, H. K. and Ricciardi, V. (2014). How biases affect investment behavior. Investment &
Markets, Money & wealth, strategy & management.
Baltussen, G. (2000). Behavioral finance: an introduction, p. 1–43.
Barber, B. and Odean, T., (2001). Boys Will be Boys: Gender, Overconfidence, and Common
Stock Investment. The Quarterly Journal of Economics, Vol. 116, No. 1, Feb 2001.

2
Barberis, N., Shleifer, A. and Vishny, R. (1998). A model of investor sentiment. Journal of
Financial Economics 49, p. 307–343.
Barberis, N., Thaler, R. (2000). A survey of behavioral finance. Business, Education and
Technology Journal Fall 2000, p. 1-9.
Barberis, N. and Thaler, R. H. (2003). A survey of behavioral finance. Handbook of the
Economics of Finance, p. 1053-1128.
Barlett, D., Drew, P., Fahle, E., & Watts, W. (1974). Selective exposure to a presidential
campaign appeal. Public Opinion Quarterly, 38(2), p. 264-270.
Barsky, R.B., Juster, F.T., Kimball, M.S and Shapiro, M.D., (1997). Preference Parameters
and Behavioural Heterogeneity: An Experimental Approach in the Health and Retirement
Study. Quarterly Journal of Economics 112, p. 537–579.
Bartke, S. and Schwarze R. (2008). Risk-Averse by Nation or by Religion? Some Insights on
the Determinants of Individual Risk Attitudes. SOEP papers No. 131.
Batson, C. (1975). Rational processing or rationalization? The effect of disconfirming
information on a stated religious belief. Journal of Personality and Social Psychology, 32(1),
p. 176-184.
Bayer, P.J., Bernheim, B.D. and Scholz, J.K, (1996). The Effects of Financial Education in
the Workplace: Evidence from a Survey of Employers, NBER.
Bell, D. (1982). Regret in Decision Making Under Uncertainty. Operations Research, 30, p.
961-981.
Benartzi, S. and Thaler, R. H. (2004). Save more tomorrow: using behavioral economics to
increase employee saving. Journal of Political Economy 112, p. 164–187.
Bengtsson, C., Persson, M. and Willenhag, P., (2004), Gender and Overconfidence, Seminar
Paper n. 730, Stockholm University.
Bernheim, B. Douglas and Daniel M. Garrett, (1996). The Determinants and Consequences
of Financial Education in the Workplace: Evidence from a Survey of Households. NBER
Working Paper No. 5667.
Bernheim, B. Dou as, Da ie M. Garrett a Dea Maki, (2001).“The L -Term Effects of
Hi h S h Fi a ia C rri Ma ates,” Journal of Public Economics, June 2001. p.
435-65.

3
Bernheim, B. D., Skinner, J., & Weinberg, S. (2001). What accounts for the variation in
retirement wealth among U.S. households. American Economic Review, 91, p. 832–857.
Beverly, S., & Sherraden, M. (1999). Institutional determinants of savings: Implications for
low- income households. Journal of Socio-Economics, 28, p. 457-473.
Beyer, S., & Bowden, S. E. (1997) Gender differences in self-perceptions: Convergent
evidence from three measures of accuracy and bias, Personality and Social Psychology
Bulletin, 23, p. 157-172.
Blume, M. (1978). The changing role of the individual investor. New York: John Wiley and
Sons.
BMO Insurance. (2009). Investor Profile Questionnaire. Registered trade-mark of Bank of
Montreal.
Boyce, L.B. & Danes, S.M. (1998). Evaluation of the NEFE high school financial planning
program. National Endowment for Financial Education. Boulder, CO.
Bryman, A. & Bell, E. (2011). Business Research Methods. 3rd edition. Oxford: Oxford
University Press.
Chan, W.S. (2003). Stock price reaction to news and no-news: drift and reversal after
headlines, p. 224 - 259.
Christelis, D., Georgarakos, D., and M. Haliassos (2010). Differences in Portfolios across
Countries: Economic Environment versus Household Characteristics. Review of Economics
and Statistics.
Churchill, G.A. & Iacobucci, D. (2005). Marketing research: methodological foundations. 9th
edition. Mason, Ohio: Thomson/South-Western.
Cole, S., Shastry & G. K. (2009). Smart Money: The Effect of Education, Cognitive Ability,
Financial Literacy on Financial Market Participation. p. 1-55.
Cooper, M., Orlin, D. and Raghavendra, R. (2001). A rose.com by any other name, Journal
of Finance.
Cooper, J. (2007). Cognitive dissonance: Fifty years of a classic theory. Los Angeles, CA:
Sage.
Cremers, K. J. M. (2002). Stock Return Predictability: A Bayesian Model Selection
Perspective. Review of Financial Studies 15, p. 1223-1249.

4
Creswell, J. W., (2014). Educational Research: Planning, Conducting, and Evaluating.
Quantitative and Qualitative Research, 5th edition. Pearson Education.
Cummings, L. L., Harnett, D. L. and Stevens O. J. (1971). Risk, Fate, Conciliation and Trust:
An International Study of Attitudinal Differences among Executives. The Academy of
Management Journal 14(3), p. 285-304.
Daniel, K. D., Hirshleifer, D. and Subrahmanyam, A. (1998). Investor psychology and
security market under and overreactions. Journal of Finance 53, p. 1839–1886.
Daniel, K.D., Hirshleifer, D. and Teoh, S.H. (2002), Investors Psychology in Capital
Markets: Evidence and Policy Implications, Journal of Monetary Economics 49 (No. 1), p.
139-209.
Dea x, K., & Farris, E. (1977) Attrib ti a ses r e’s per r a e: The effects of sex,
norms, and outcomes, Journal of Research Personality, 11, p. 59-72.
De Bondt, W.F.M., (2005), The Psychology of World Equity Markets. Edward Elgar.
De Bondt, W., Gulnur Muradoglu, G., Shefrin, H, and Staikouras, S.K. (2008). Behavioral
Finance: Quo Vadis?, p. 2.
Dennick, M. and Tavakol, R. (2011). Maki se se Cr ba h’s a pha. International
Journal of Medical Education; 2:53-55
DeVellis R., (2003). Scale development: theory and application. Thousand Okas, CA: Sage.
Diaz, J., (2000). Religion and Gambling in Sin-City: A Statistical Analysis of the
Relationship Between Religion and Gambling Patterns in Las Vegas Residents. Social
Science Journal 37, p. 453-458.
Dreman, D.N., (1995). Exploiting Behavioral Finance: Portfolio Strategy and Construction,
Behavioral Finance and Decision Theory in Investment Management.
Droms, W. G. (1987). Investment asset allocation for PFP clients. Journal of Accountancy,
163, p. 114–118.
Ej e r , R. (2003). Vetenskaplig metod. Lund: Studentlitteratur. A Tale of Two Cultures :
Qualitative and Quantitative Research in the Social Sciences. Princeton : Princeton
University Press.
Ellison, C. G. and Kathleen A. Nybroten, K. A., (1999). Conservative Protestantism and
Opposition to State-sponsored Lotteries: Evidence from the 1997 Texas Poll. Social Science
Quarterly 80:356-369.

5
Else, G. (2010), Value investor anomaly: return enhancement by portfolio replication - an
empiric portfolio strategy analysis, p. 640.
Fisher, C. (2010). Researching and writing a dissertation, an essential guide for business
students. Third edition. Pearson Eduction Limited.
Fincham, F. D., & Jaspers, J. M. (1980). Attribution of responsibility: from man the scientist
to man as lawyer. In L. Berkowitz (Ed.), Advances in Experimental Social Psychology, 13, p.
81-138.
Friedman, B. (1974). Risk aversion and the consumer choice of health insurance option..
Review of Economics and Statistics, 56, p. 209–214.
Furstenberg, F. F. (2006). Growing up healthy: Are adolescents the right target group?
[Editorial]. Journal of Adolescent Health, 39, p. 303-304.
Gervais, S., J.B. Heaton, J.B., and Odean, T., (2011). Overconfidence, Compensation
Contracts, and Capital Budgeting. Journal of Finance, p. 1735–1777.
Gi je, N. & Gri e , H. (2007). Sa h s ete skaper as r ts tt i ar. teborg: Daidalos
(3rd edition).
Glaser, B. G., & Strauss, A. L. (1967). Discovery of grounded theory: Strategies for
qualitative research. Chicago: Aldine.
Gollier, C., & Zeckhauser, R. J. (2002). Horizon length and portfolio risk. Journal of Risk
and Uncertainty, 24, p. 195–212.
Grable, J. E., & Lytton, R. H. (1998). Investor risk tolerance: testing the efficiency of
demographics as differentiating and classifying factors. Financial Counseling and Planning
9, p. 61–74.
Grable, J. E., & Joo, S. (1999). Factors related to risk tolerance: a further examination.
Consumer Interests Annual, 45, p. 53–58.
Grable, J. E., & Lytton, R. H. (1999). Financial risk tolerance revisited: The development of a
risk assessment instrument. Financial Services Review, 8, p. 163-181.
Grable, J. E. (2000). Financial risk tolerance and additional factors that affect risk taking in
everyday money matters. Journal of Business and Psychology, 14, p. 625–630.
Grazier, S. and P. J. Sloane (2008), Accident Risk, Gender, Family Status and Occupational
Choice in the UK, Labour Economics 15(5), p. 938–957.

6
Gree spa , A a (2001), “The I p rta e E ati i T ay’s E y” re arks at the
Community Affairs Research Conference of the Federal Reserve System, April 6.
Guiso, L., Haliassos, M., Jappelli, T., (2003). Household Portfolios: An International
Comparison. Published in Economic Policy, vol. 36, p. 123-70.
Guiso, L., Haliassos, M., Jappelli, T., (2003). Stockholding in Europe. Palgrave Macmillan,
p. 2.
Gutter, M. S., Fox, J. J., Montalto, C. P. (1999). Racial differences in investor decision
making. Financial services review, 8, p. 149-162.
Haliassos, M., & Bertaut, C. C. (1995). Why do so few hold stocks? Economic Journal, 105,
p. 1110–1129.
Hanna, S., Gutter, M., & Fan, J. (1998). A theory based measure of risk tolerance.
Proceedings of the Academy of Financial Services, p. 10–11.
Henrich, J., Heine, S. J., Norenzayan, A. (2010). The weirdest people in the world?
Behavioral and brain sciences, 33, p. 61-35.
Iannaccone, L.R., (1998). Introduction to the economics of religion. Journal of Economic
Literature 1998;36:1465-95.
Inman, J. and McAlister, L. (1994). Do Coupon Expiration Dates Affect Consumer
Behavior? Journal of Marketing Research, 31, p. 423-428.
Irukwu, (1991). Risk Management in Developing Countries Lagos: Bima Publications, Bima
Africa Ltd.
Jacobs, B. I., & Levy, K. N. (1996), Residual risk: how much is too much? Journal of
Portfolio Management, 22, p. 10–16.
Kahneman, D., and Tversky, A. (1973). On the Psychology of Prediction. Psychological
review 80, p. 237-251.
Kahneman, D., and Tversky, A. (1979). Prospect Theory: An Analysis of Decision Under
Risk. Econometrica 47, p. 263-291.
Kahneman, D., & Tversky, A. (1982). The psychology of preferences. Scientific American,
246, p. 160-173.
Karlsson, A., Massimo M., and Simonov, A. (2006). Portfolio Choice and Menu Exposure.
aper presented at , rich.

7
Kline, R. B. (2005). Principles and practice of structural equation modeling (2nd ed.). New
York: Guilford Press.
Kumar, A., (2009), Who Gambles in the Stock Market. The journal of Finance. Volume 64,
Issue 4, p. 1889-1933.
Lagoarde-Segot, T. (2015). Diversifying finance research. From financialization to
sustainability.
Lester, F. K., Garofalo, J., Kroll, D. L. (1989). Self-Confidence, Interest, Beliefs, and
Metacognition: Key Influences on Problem-Solving Behavior. Affect and mathematical
problem solving, p. 75 - 88.
Lin, T.C.W. (2010). A behavioral framework for security risk. p. 325-350.
Liu, Q. and Song, F. (2001). The Rise and Fall of IT Stocks: Should Financial Analysts be
Blamed?, School of Economics and Finance, University of Hong Kong.
Loomes, G., and Sugden, R. (1982). Regret Theory: An Alternative Theory of Rational
Choice Under Uncertainty. Economic Journal, 92, p. 805–824.
Lund, A., Lund, M. (2013). Laerd statistics. Available here: https://statistics.laerd.com/.
Lusardi, A., Mitchell, O., (2008). Planning and financial literacy: How do women fare?
American Economic Review 98, p. 413-417.
Mahajan, J. (1992). The Overconfidence Effect in Marketing Management Predictions.
Journal of Marketing Research, 29, p. 329-342.
McInish, T. H. (1982). Individual investors and risk-taking. Journal of Economic
Psychology, 2, p. 125–136.
Miller, A. S. (2000). Going to Hell in Asia: The Relationship between Risk and Religion in a
Cross Cultural Setting. Review of Religious Research 42(1), p. 5-18.
Morin, R. A., & Suarez, A. F. (1983). Risk aversion revisited. Journal of Finance, 38, p.
1201–1216.
Morton, H. (1993). The Story of Psychology. Bantam Double Dell Publishing Group, Inc.
Nystrøm, M., Dahlberg, K., (2011). Pre-understanding and openness – a relationship without
hope? Scandinavian Journal of Caring Sciences.

8
Palsson, A. M. (1996). Does the degree of risk aversion vary with household characteristics.
Journal of Economic Psychology, 17, p. 771–787.
Hand, J. (2000). Profits Losses and Non-linear Pricing of IT Stocks, Working Paper,
University of North Caroline.
Higgins, E. T. (1997). Beyond pleasure and pain. American Psychologist, 52, p. 1280-1300.
Hilary, G. and Kai Wai Hui, K.W., (2009), Does religion matter in corporate decision making
in America? Journal of Financial Economics 93, p. 455-473.
Hilson (2001). Extending the risk process to manage opportunities.
Hoffmann , J.P., (2000). Religion and Problem Gambling in the U.S. Review of Religious
Research 41, p. 488-509.
Howell, D. C. (2010). Statistical methods for psychology (7th ed.). Belmont, CA: Wadsworth.
MacKillop, S. (2003). Confidence Builder. Investment Advisor, p. 62–64.
Mahaffy, K. (1996). Cognitive dissonance and its resolution: A study of lesbian Christians.
Journal for the Scientific Study of Religion, 35(4), p. 392-402.
Malmendier, U., and Tate, G., (2005). CEO Overconfidence and Corporate Investments.
Journal of Finance, p. 2661–2700.
Malmendier, U. and Tate, G., (2008) Who Makes Acquisitions? CEO Overconfidence and
the Market’s Rea ti . Journal of Financial Economics, p. 20–43.
Miller, A. S and Hoffman, J.P., (1995). Risk and Religion : An Explanation of Gender
Differences in Religiosity. Journal for the Scientific Study of Religion 34, p. 63-75.
N te, I., (2006). Retai I est rs’ Tra i eha i r i the F rei Ex ha e Market. A
Panel Duration Approach. University of Konstanz.
Ozment, S. (1991). Protestants: The birth of a revolution. New York: Doubleday.
Pan, C.H. and Statman, M., (2010). Beyond risk tolerance: regret, overconfidence,
personality and other investor characteristics. Santa Clara University, p. 1 -28.
Prince, M. (1993) Women, Men, and Money Styles, Journal of Economic Psychology, 14, p.
175-182.
Powell, M., & Ansic, D. (1997). Gender differences in risk behaviour in financial decision-
making: an experimental analysis. Journal of Economic Psychology, 18, p. 605–628.

9
Project Management Institute. (2000). A Guide to Project Management Body of Knowledge.,
Pennsylvania.
Ra ert, R. D. (2009). “Y ’re y y e”: Thi s e e st e ts rep rt i w
before it is too late. Journal of Adolescent Research, 24, p. 376-396.
Reddy, R. (2010). Questionnaire - An Analysis on Investor Behaviour on Various Investment
Avenues in India. Osmania University.
Renneboog, L., and Spaenjers, C., (2011). Religion, Economic Attitudes, and Household
Finance.Oxford Economic Papers, Vol. 64, No. 1, 2012.
Ricciardi, V. and Simon, H. K. (2000). What is behavioral Finance. Business, Education and
Technology Journal Fall 2000, p. 1-9.
Ritov, I., & Baron, J. (1995). Outcome knowledge, regret, and omission bias. Organizational
Behavior and Human Decision Processes, 64, p. 119-127.
Ritter, J. R. (2003). Behavioral finance. Pacific-Basin Finance Journal, p. 429-437.
Romer, D. (Ed.). (2003). Reducing adolescent risk: Toward an integrated approach..
Thousand Oaks, CA: SAGE.
Van Rooij, M.C.J., Lusardi, A., Alessie, R.J.M., (2011). Financial literacy and stock market
participation. Journal of Financial Economics.
Sahin, S. and Yilmaz, Ö. (2009). Measuring Risk Tolerance: Does The Methodology Matter?.
EconAnadolu 2009: Anadolu International Conference in Economics.
Saunders, M., Lewis, P. & Thornhill, A. (2009). Research Methods for Business Students. 5th
edition. Prentice Hill: Pearson Education.
Saunders, M., Lewis, P., & Thronhill, A. (2012). Research Methods for Business Students.
6th edition. Prentice Hill: Pearson Education.
Sawilowsky, S. S., & Blair, R. C. (1992). A more realistic look at the robustness and Type II
error properties of the t test to departures from population normality. Psychological Bulletin,
111, p. 352-360.
Schirripa, F. and Tecotzky, N. D. (2000). An optimal frontier. The journal of portfolio
management, Summer 2000, Vol. 26, No. 4,. p. 29-40.
10
Schmider, E., Ziegler, M., Danay, E., Beyer, L., Bühner, M. (2010). Is it really robust?
Reinvestigating the Robustness of ANOVA against violations of the normal distribution
assumption.
Schooley, D. K., & Worden, D. D. (1996). Risk aversion measures: comparing attitudes and
asset allocation. Financial Services Review, 5, p. 87–99.
Schwab. C. (2014). Investor Profile Questionnaire. Charles Schwab & Co., Inc.
Sharieff, N.U. (2010). Investment pattern of investors on different products. Asit c. mehta
investment intermediates ltd.
Shaw, K. L. (1996). An empirical analysis of risk aversion and income growth. Journal of
Labor Economics, 14, p. 626–653.
Shefrin, H. (2000). Beyond Greed and Fear: Understanding Behavioral Finance and the
Psychology of Investing. Cambridge: Harvard Business School Press.
Shefrin, H., (2005), Behavioral Corporate Finance, McGrawHill.
Shiller, R. J. (1987). Investor Behaviour in the October Stock Market Crash: Survey
Evidence, National Bureau of Economics Research, Working Paper Number 2446.
Shiller, R. J. (1997), Human Behavior and the Efficiency of the Financial System, in John
Taylor and Michael Woodford, eds., Handbook of Macroeconomics, 1C, p. 1305-40.
Shiu, E., Hair,. J, Bush, R., and Ortinau, D. (2009). Marketing Research. European Edition.
London: McGraw-Hill Higher Edition.
Shiv, B., Loewenstein, G., Bechara, A., Damasio, H., Damasio, A. R. (2005). Investment
Behavior and the negative side of emotion, Psychological Science vol. 16 no. 6, p. 435-439.
Simon, H. A. (1957). Models of man, New York: Wiley & Sons.
Slovic, P., (1972). Psychological Study of Human Judgment: Implications for Investment
Decision Making, Journal of Finance 27 (No. 4), p. 779-799.
Statman, M., Thorley, S. and Vorkink, K. (2006). Rev. Financ. Stud. (Winter 2006) 19 (4), p.
1531-1565.
Stephan, A. (2015). Financial crises and industrial development: The new Swedish model. In
F. Gerlach, M. Schietinger, & A. Ziegler (Eds.), A strong Europe – but only with a strong
manufacturing sector: Policy concepts and instruments in ten EU member states. Düsseldorf:
Schüren Verlag, p. 276-295.

11
Sugden, R. (1985). Regret, recrimination and rationality. Theory and Decision, 19, p. 77-99.
Sung, J., & Hanna, S. (1996). Factors related to risk tolerance. Financial Counsel and
Planning, 7, p. 11–20.
Thaler, R.H., and E.J. J h s . (1990). “Ga b i with the H se M ey a Tryi t
Break Even: The Effects of Prior Outcomes on Risky Choice”. Management Science, 36, p.
643–660.
Thaler, R., (1993), Advances in Behavioral Finance, Russell Sage Foundation.
Thaler, R., Tversky, A., Kahneman, D., & Schwartz, A. (1997). The effect of myopia and
loss aversion on risk taking: An experimental test. Quarterly Journal of Economics, 112, p.
647–660.
Thaler, R. (1999). The End of Behavioural Finance. Financial Analysts Journal,
November/December, p. 12.
Tymula, A., Belmaker, L. A. R., Roy, A. K., Ruderman, L., Manson, K., Glimcher, P. W., &
Le y, I. (2012). A es e ts’ risk-taking behavior is driven by tolerance to ambiguity.
Proceedings of the National Academy of Sciences, 109, p. 17135-17140.
Wang, H., & Hanna, S. (1997). Does risk tolerance decrease with age? Financial Counseling
and Planning, 8, p. 27–32.
Webber, E. U., Hsee, C. (1998). Cross-Cultural Differences in Risk Perception, but Cross-
Cultural Similarities in Attitudes Towards Perceived Risk. Management science, p. 1205-
1217.
Whitelaw, R. F. (1994). Time Variations and Covariations in the Expectation and Volatility
of Stock Market Returns. Journal of Finance 49, p. 515-541.
Yao, R., Gutter, M.S and Hanna, S.D. (2005). The Financial Risk Tolerance of Blacks,
Hispanics and Whites. Association for Financial Counseling and Planning Education.
Zaiane, S. and Abaoud, E., (2009). Investors Overconfidence: A survey on the Tunisian
Stock Market. Tunis Faculty.
Zuckerman, M. (1994). Behavioral expressions and biosocial bases of sensation seeking.
University Press Cambridge: Cambridge.

12
Appendix A - Questionnaire
1. Where do you come from?
a. France
b. Sweden
c. Other :
2. Are you currently studying in a French or Swedish Business School?
a. Yes.
b. No.
if no, the questionnaire will be ended.
3. Do you invest money in the stock market?
a. Yes
b. No
c.
if no, the questionnaire will be ended.
4. Gender?
a. Male
b. Female
5. What is your religion?
a. Unaffiliated
b. Catholic
c. Protestant
d. Islam
e. Judaism
f. Other:
6. What is your main field of study?
a. Accounting / Finance
b. Marketing / Communication
c. Management
d. Economy / Strategy / Statistics
e. Other:
7. How do you invest?
a. Directly (By myself)
b. Indirectly (a financial advisor invest my money)

13
I “I ire t y”, e q esti aire
8. What is the purpose behind your investments?
a. Self learning
b. Long term wealth creation
c. Future short term expenses
d. Resume (CV) differentiation
e. Other:
9. What is the source of your investment advice/information ?
a. Newspapers
b. Market Rumors
c. News Channels
d. Family or Friends
e. Internet
f. r ker’s tes
g. Certified Market Professional
h. Financial statements
i. Other :
10. What best describes your investment experience ?
a. Limited
b. Moderate
c. Knowledgeable
d. Experienced
11. Over any one-year period, what is the maximum drop in percentage of your
investment portfolio that you would be comfortable with?
a. 0 - 5% decline
b. 5 - 10% decline
c. 10 - 15% decline
d. 15 - 20% decline
e. 20 - 25% decline
12. Which of the following portfolios would you be likely to invest in?
a. Portfolio A - Earns an investment return of either 5% or a loss of 0%
b. Portfolio B - Earns an investment return of either 15% or a loss of 5%
c. Portfolio C - Earns an investment return of either 25% or a loss of 10%
d. Portfolio D - Earns an investment return of either 40% or a loss of 15%
e. Portfolio E - Earns an investment return of either 50% or a loss of 20%

14
13. When I invest my money, I am:
a. Most concerned about my investment losing value
b. Equally concerned about my investment losing or gaining value
c. Most concerned about my investment gaining value
14. Suppose that you are related to a group of people who have a similar background
and social status as you. Generally, when compared with them, you will most probably
feel that you are?
a. Better than average
b. About the same
c. Not as good as the average
15. When considering the next three months, do you have confidence in beating the
market as a whole?
a. Yes, very much
b. Yes, I have some confidence
c. No, I have no confidence at all
16. On average, how long do you hold your stocks in your portfolio?
a. Daily
b. Weekly
c. Monthly
d. Yearly
17. Do you feel comfortable to change your investment style (financial statement
analysis, chart analysis) to invest in very promising sectors?
a. Yes
b. No
18. You previously bought a stock at 20€ with the objective to sell it at 30€. Today, the
stock reach 30€ but all the consensus think it will keep increasing, what do you do ?
a. Follow my first objective, and sell at 30€
b. Keep the stock
19. You missed a 20% return on a stock your friend strongly recommended you because
you didn't invested in it, what do you think about it?
a. I will have other opportunities
b. It es ’t atter
c. I should have invested in it
d. I will follow his recommendations in the future
20. Consider this scenario:

15
An individual stock investment you own just drop by 25%. What would you do?
a. Sell all of my shares
b. Sell some of my shares
c. Do nothing
d. Buy more shares

16
Appendix B - Games-Howell post hoc (differences between risk
tolerance and field of study)
Appendix C - Games-Howell post hoc (differences between
cognitive dissonance and religion)

17
Appendix D - Games-Howell post hoc (differences between
cognitive dissonance and field of study)
Appendix E: Games-Howell post hoc (differences between regret
and religion)
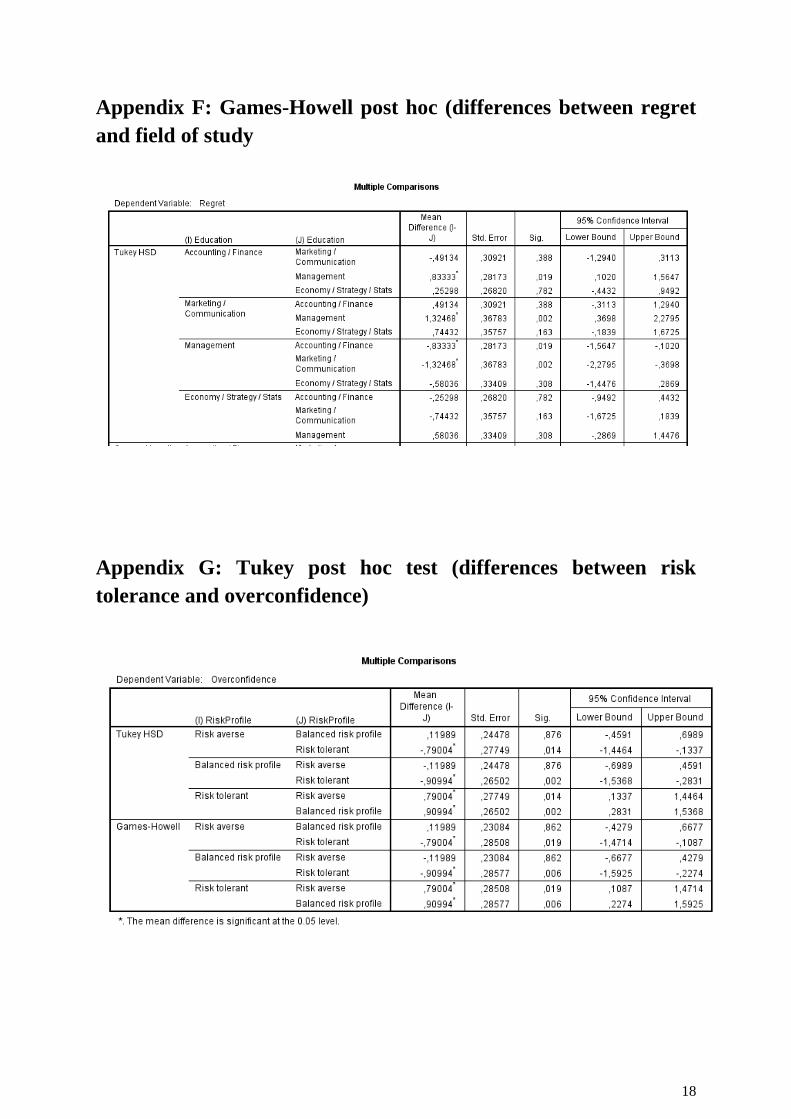
18
Appendix F: Games-Howell post hoc (differences between regret
and field of study
Appendix G: Tukey post hoc test (differences between risk
tolerance and overconfidence)
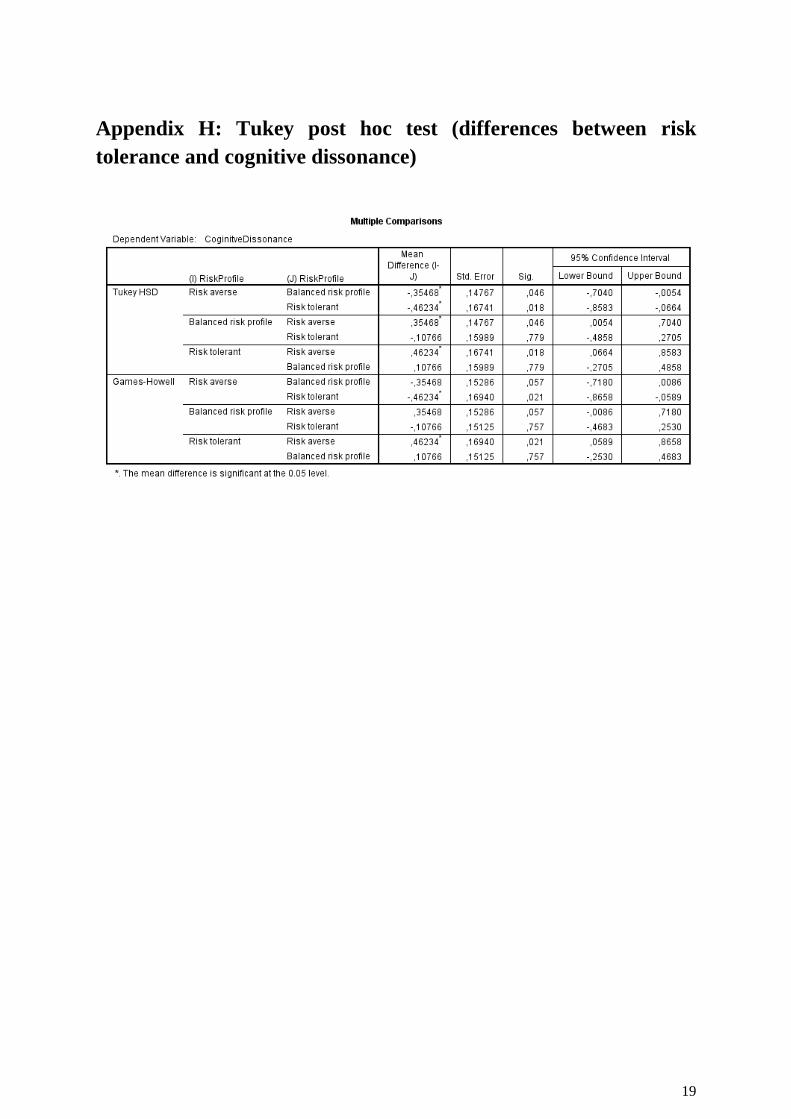
19
Appendix H: Tukey post hoc test (differences between risk
tolerance and cognitive dissonance)