determinants of tax revenue generation in tanzania
TRANSCRIPT

i
DETERMINANTS OF TAX REVENUE GENERATION IN
TANZANIA.
By
Mercy Bitababaje
A Dissertation Submitted in Partial Fulfillment of the
Requirements for Award of the Master of Science in Accounting and Finance
(MSc A&F) of Mzumbe University
December 2020

i
CERTIFICATION
We, the undersigned, certify that we have read and hereby recommend for
acceptance by the University of Mzumbe a dissertation entitled Determinants of Tax
Revenue generation in Tanzania in partial fulfilment of the requirements for the
award of degree of Master of Science in Accounting and Finance of Mzumbe
University.
________________
Major Supervisor
________________
Internal Examiner
________________
External Examiner
Accepted for Mzumbe University, Dar Es Salaam Campus College
___________________________________________________________

ii
CHAIRPERSON, DAR ES SALAAM CAMPUS COLLEGE BOARD
DECLARATION
AND
COPYRIGHT.
I Mercy Bitababaje, declare that this is my own original work and that has not been
presented and will not be presented to any other university for similar or any other
degree award.
Signature ____________________
Date_________________________
©2020
This dissertation is a copyright material protected under the Berne Convention, the
copyright Act 1999 and other international and national enactments, in that behalf ,
on full or in part , except for short extracts in fair dealings, for research or private
study, critical scholarly review or discourse with an acknowledgement, without the
written permission or discourse of Mzumbe University, on behalf of the author.

iii
ACKNOWLEDGMENT
I would like to thank God for the gift of life that I am still alive.
I would like to extend my special appreciation to my supervisor for his valued
guidance and directives provided to me during the entire process of this research to
the end.
I wish to thank Denis Elias and Abraham Nathaniel for the valuable assistance
offered to me from the beginning to the last minute.
I would like to offer my great appreciation to my entire classmates for the assistance
they provide to, to them all I say, “Thanks and may the Lord God bless you.”
Last but not least, I would like to extend my very special appreciation to my husband
Ohadi Mhelela and my son Howard for their full support during entire time of my
study.

iv
DEDICATION
I dedicate this research to my family for their spiritual and moral support and
encouragement that guided me towards this accomplishment.
v
ABBREVIATIONS
BOP Balance of Payment
CPI Corruption Perception Index
ERP Economic Recovery program
FDI Foreign Domestic Investment
GDP Gross Domestic Product
HICs High Middle-Income Countries
HIPC Highly Indepted Poor Country
IMF International Monetary Fund
KRA Kenya Revenue Authority
MSc A&F Master of Science in Accounting and Finance
OECD Organization for Economic Cooperation and Development
SADC Southern African Development Community
TRA Tanzania Revenue Authority
ZRB Zanzibar Revenue Authority

vi
ABSTRACT
Tax reforms in Tanzania begun in 1960, to rescue the country from budget deficit
resulted from a failure of the tax system to raise enough revenue to cover the
expenditure which was growing rapidly due to socio-economic and political
development resulted from Arusha Declaration of 1967. A correlation research
design was adopted. Secondary data was collected for a period of 20 years starting
from 1998 to 2017. Data collection included data for independent variables, which
were GDP, Corruption and reforms, and dependent variables, which were tax
revenue. These data were collected from the available online source where Tax
revenue data were collected from the Tanzania Revenue Authority website, GDP was
collected from Tanzania Data Portal and Corruption indices were collected from the
Transparency International website. A multiple regression analysis was computed to
establish the relationship that existed between the variables under study using
EViews. The trend analysis indicated that there is a positive trend of GDP and
Corruption over the period under study as the GDP and Corruption Perception Index
has been increasing over time. Multiple regressions were computed to predict
revenue from GDP, Corruption and tax reforms. Independent variables explained
71% of the variances in the variable. GDP, Corruption and tax reforms have a
significant positive effect on Tax revenue generation in Tanzania. From the findings,
the study concludes that GDP, Corruption as measured in Corruption Perception
Index and Tax reforms have a significant positive effect on collected tax revenue in
Tanzania.The study recommends that, the government through its responsible organs
should put in place measures to improve the collection of tax revenue, measures to
stimulate more and more economic growth and put more strategies to combat
corruption to increase revenue collection.
vii
TABLE OF CONTENTS
CERTIFICATION .................................................................................................................... i
DECLARATION AND COPYRIGHT. ....................................................................................ii
ACKNOWLEDGMENT .......................................................................................................... iii
DEDICATION ......................................................................................................................... iv
ABBREVIATIONS .................................................................................................................. v
ABSTRACT ............................................................................................................................. vi
LIST OF TABLES .................................................................................................................... x
LIST OF FIGURES ................................................................................................................. xi
CHAPTER ONE ........................................................................................................... 1
1.1 Introduction ............................................................................................................ 1
1.2 Background to the problem ................................................................................................ 1
1.3 Statement of the problem ................................................................................................... 5
1.3 General Research objective ................................................................................................ 7
1.4 Research questions ............................................................................................................. 7
1.5 Significance of the Study ................................................................................................... 7
1.6 Organization of the study ................................................................................................... 8
CHAPTER TWO .......................................................................................................... 9
LITERATURE REVIEW ............................................................................................. 9
2.1 Introduction ........................................................................................................................ 9
2.2 Theoretical Literature Review ........................................................................................... 9
2.2.1 Definition of key concepts .............................................................................................. 9
2.1.2 Theoretical underpinnings ............................................................................................. 10
2.1.3 Factors influencing tax revenues generation ................................................................. 14
2.2 Empirical Literature Review ............................................................................................ 15
2.2.1 The influence of Tax Reforms on Tax Revenue ........................................................... 16
2.2.2 The influence of Economic Factors on Tax revenue..................................................... 23

viii
2.2.3 The influence of Corruption on tax revenue generation ............................................... 29
2.3 Research Gap ................................................................................................................... 31
2.4 Conceptual Framework .................................................................................................... 31
CHAPTER THREE .....................................................................................................33
RESEARCH METHODOLOGY .................................................................................33
3.1 Introduction ...................................................................................................................... 33
3.2 Research Design ............................................................................................................... 33
3.3 Data Collection ................................................................................................................ 33
3.4 Data Analysis ................................................................................................................... 34
CHAPTER FOUR .......................................................................................................36
PRESENTATION OF THE FINDINGS ......................................................................36
4.1 Introduction ...................................................................................................................... 36
4.2 Findings ............................................................................................................................ 36
4.2.1 Trend Analysis Results ................................................................................................. 36
4.2.2. Regression Analysis Results ........................................................................................ 45
CHAPTER FIVE .........................................................................................................51
DISCUSSION OF THE FINDINGS .............................................................................51
5.1 Introduction ...................................................................................................................... 51
5.2 Discussion of Findings ..................................................................................................... 51
CHAPTER SIX ............................................................................................................54
SUMMARY, CONCLUSION AND RECOMMENDATION .......................................54
6.1 Introduction ...................................................................................................................... 54
6.2 Summary of the findings .................................................................................................. 54
6.3 Conclusion ....................................................................................................................... 55
6.4 Recommendations. ........................................................................................................... 55
6.5 Limitation of the Study .................................................................................................... 56

ix
6.6 Recommendation for further Studies. .............................................................................. 56
REFERENCES ............................................................................................................57
APPENDIXES .............................................................................................................65

x
LIST OF TABLES
Table 4. 1: Correlation test showing the link between corruption and tax revenue ... 38
Table 4. 2: Correlation test showing the link between tax reform and tax revenue ... 41
Table 4. 3: Correlation test showing the relationship between GDP and tax revenue45
Table 4. 4: Unit root test at levelI(0) .......................................................................... 45
Table 4. 5: Unit root test after first differencing ........................................................ 46
Table 4. 6: Randomness test for Revenue .................................................................. 47
Table 4. 7: Randomness test for GDP ........................................................................ 47
Table 4. 8: Randomness test for Corruption .............................................................. 48
Table 4. 9: Randomness test for Reforms .................................................................. 49
Table 4. 10: Regression result of the relationship between current tax reforms ....... 49

xi
LIST OF FIGURES
Figure 2. 1: Conceptualized relation between variables ............................................ 32
Figure 4. 1: Trend for GDP ........................................................................................ 36
Figure 4. 2: Tanzanian Corruption Perception Index trend for 1998 to 2017 ............ 37
Figure 4. 3: Tanzania Tax revenue trend for 1998 to 2017 ........................................ 39
Figure 4. 4: Trend for Reforms .................................................................................. 40
Figure 4. 5: Scatter plot showing GDP trend for the period 1998-2017 ................... 41
Figure 4. 6: Cyclical presence plot for GDP .............................................................. 42
Figure 4. 7: Scatter plot for tax revenuecollection ..................................................... 43
Figure 4. 8: Cyclical trends for revenue ..................................................................... 44

1
CHAPTER ONE
BACKGROUND AND PROBLEM SETTING
1.1 Introduction
Tax reforms are the way of changing the manners in which tax is collected or
managed to improve the tax system. The improvement could be increasing tax
revenue, reducing the tax burden to taxpayers, providing the incentive to taxpayers
and make a simple and friendly tax system to taxpayers and mostly improving tax
administration. The main reason mainly is obtaining and improving economic and
social benefits (Galbraith, 2019). If tax reforms are carried out in a manner that steers
a positive response and accountability together with improvement in the institution
ability, tax reforms may become a source for stimuli in increased good performance
in the government. From this point of view, tax is not only the responsibility of the
government and citizen but also about politics, power and how authority is utilized,
through formal and informal institutions (Fjeldstad, 2014).
TRA prepared two corporate plans, the first for 1998/99- 2002/03 period and the
second one for the 2003/04 -2007/08 period, which were known as the first
Corporate plan and second Corporate plan respectively. The first corporate plan
focused on the institution and capacity building for it excel and the second Corporate
plan focused on the implementation of second-generation reforms which aimed at
improving operational efficiency and making the system user friend to attract more
revenue from investors and taxpayers. TRA aims at making the tax system and
administration easy to understand and more openly which may trigger voluntary
compliance and improvement in revenue collection (Malima, 2013; Unpan, 2019).
1.2 Background to the problem
Over-dependence on a narrow tax base for revenue generation is a problem facing
many developing countries. The small taxed sources are more prone to external
forces, which poses a big problem in their tax system. The taxed sources were
imported duty and excise duty on mineral products whose prices are world market set

2
prices, which are not stable. Import duty and excise duty are the major sources of
revenue in these countries. As a result of the above problem, there was a need for tax
reforms in developing countries in the 1980s (Osoro, 1993).
Tax reforms in Tanzania began in the 1960s, of which major reforms took place in
the year 1970s. The reason behind the reforms was the failure of the tax system to
raise enough revenue to cover the expenditure which was growing rapidly due to
socio-economic and political development resulted from the Arusha Declaration of
1967. Revenue and equity were the main objectives behind the 1960s and 1970s
Tanzania tax reforms, also protection became a more important objective in the
1970s (Osoro, 1995). The 1969 sales tax act was the vessel for the revenue and
equity objective implementation. Sales Tax Act 1969, as cited in Osoro (1995).
The objective of introducing the new Sales-tax Act was to offset the decline in
import duty revenue because of import substitution industries growth and reduce
rural taxation. The main reform that took place in the 1970s was the introduction of a
progressive income tax in 1973. The Act was replaced by 1976 Act whereby import
duty rates were raised and excise duty abolition in the late 1970s Osoro, 1993 as
cited in Osoro (1995).
Starting From the mid-1970s to the 1980s decade, Tanzania faced a drought
calamity, which resulted in the country's large deficit in the fiscal budget and
Balance of Payment (BOP). To tackle this problem the country thought of external
financing which did not arrive. Even an attempt at negation with the IMF failed. As a
result, the Government had to rely on the available domestic resources. The
government was able to finance the deficit through borrowing and operating a
printing press. Measures used to control the BOP deficit were the introduction of
trade restrictions and exchange control to discourage imports of foreign goods
(Osoro, 1993).

3
Starting from 1984, the Government introduced Liberalization. The negotiation with
IMF in 1986 resulted in an inflow of foreign resources for financing the deficit.
Apart from the introduction of liberalization, the Economic Recovery program (ERP)
introduction took place in the same period. Several types of research were conducted
and it was recommended major tax should be made simple and rational by reducing
tax rates and introducing rate categories aiming improvement in compliance and
administration. To reduce and provide incentives to exporters, the Government
abolished all export taxes in the year 1985. In the year 1985, 1988 and 1990, import
duty and sales tax rate was declining. The Government reintroduced the excise duty
abolished in the 1970s in the year 1989 to make sales tax structure and tax
administration simple and rational. On the side of income tax, marginal tax rates
were reduced from 95%-75% in the fiscal year 1986/87 to 40% in the year
1990.These reforms aimed at improving workers after-tax income as their income
was diminishing throughout the year 1980s(Osoro, 1993).
The introduction of Liberalization in the year 1984, paved the way to private-sector
competition in the market followed by the abolition of all export restrictions by 1999.
Together with strong macroeconomic stabilization measures, the abolition of trade
restrictions resulted in a fall in inflation. Recovery of the economic and rapid growth
of business took place. Fiscal imbalances that emerged in 1993/1994 caused an
increase in excise duty rates in the year 1993/1994 – 1the year 1994/1995 to
compensate the revenue tax collection deficit. Domestic taxes from sales and income
declined while imports and customs duties grew very quickly. "Both the erosion of
the total tax ratio and the increased weight of trade taxes in total revenue led the
Tanzanian authorities to delay further reductions in tariff rates until measures were
put in place that improved tax and customs administration, reduced the scope of
exemptions, and broadened the domestic tax base"(Kaanan, 2000).
Despite all the reforms, Tanzania is still struggling with a budget deficit year by year.
The deficit indicates less tax revenue to finance government expenditure.

4
"Despite good progress in the late 2000s, the current level of tax revenues in
Tanzania remains one of the lowest in the world. The Government collected US$6
billion worth of revenues or approximately 12 % of GDP in 2014, enough to cover
almost three-quarters of government expenditure, but insufficient to fund much-
needed investments in infrastructure and social services"(World Bank, 2015).
Tax Reforms in Tanzania
TRA and Reforms
The Tanzania Revenue Authority, being a partial independent authority was
established in 1995, under the TRA Act No.11 of 1995. Since July 1995 when TRA
becomes operational, it is struggling to carry out its statutory functions established
under the TRA act, tax assessment, revenue collection, accountability to the
government and administration of the central government being its main
activities(Temu, 2014).
TRA prepared two corporate plans, the first for the 1998/99- 2002/03 period and the
second for the 2003/04 -2007/08 period, which was known as the first Corporate plan
and second Corporate plan respectively. The first corporate plan focused on the
institution and capacity building for it excel and the second Corporate plan focused
on the implementation of second-generation reforms which aimed at improving
operational efficiency and making the system user friend to attract more revenue
from investors and taxpayers. TRA aims at making the tax system and administration
easy to understand and more openly which may trigger voluntary compliance and
improvement in revenue collection (Unpan, 2019).
Various things have been implemented using reforms and modernization efforts in
the struggle to implement the first and second corporate plans. Tax reforms in
Tanzania aimed at increasing tax revenue while the tax rate remaining low as
possible (Temu, 2014) .

5
Motives of Tax Reforms in Tanzania.
Since 1992, the suffering of the fiscal problem in Tanzania has not ceased and this
was because of the huge budget deficiencies caused by huge government
expenditures while the revenue kept being low and with no growth. Similarly, tax
revenue collection was not satisfactory despite the introduction of partial
independent Revenue Authority (TRA) in the year 1996. Indeed, Tanzania revenue
collected from taxes for the year 1997 to 1998 was only 12.4% of the gross domestic
product (GDP) making it the worst among the member countries in revenue tax
collection. Also, TRA weaknesses including outdated business strategies unsuitable
infrastructure created a room for tax evasion and avoidance(Temu, 2014).
1.3 Statement of the problem
According to Fjeldstad (1995) reforms in tax are made to improve the tax revenue
collection to make the government self- reliant through collecting sufficient amounts
to finance its budget. Tax reform can reduce the level of tax and evasion thereby
increasing tax collection for financing the public goods and services.
The introduction of Tax reforms in Tanzania aimed to provide a solution to the major
fiscal crisis. Due to the crisis, tax reform intentions were to improve the revenue
collected through taxation. The main goal was making the government self –reliant
through the collection of a sufficient amount of revenue to cover the budget and
leave them with a surplus over and above the past period deficit (Fjeldstad, 1995).
Unexpectedly this has not to turn out to be true as many governments are struggling
in financing their budgets as they face a problem of the budget deficit. This is
witnessed by the budget deficits recorded from the year 1998 to 2017 found in
country economy .comand the current budget of Tanzania presented in the speech by
the minister for finance and planning on the budget for the financial year
2018/19.The budget has a deficit of 3.2 percentage of the GDP.Despite several
reforms that have been made before this period, still, the way forward is to increase

6
the tax base in order to capture more revenue from the taxpayers (Budget speech,
2018/19).
Because of the above-stated problem, there is a need for carrying out a study to
identify if the tax reforms have any significant contribution to tax revenue collection
or economic factors are the reasons for poor tax revenue collection (Gachanja, 2012).
There are several studies carried out on tax reforms in other countries but only a few
about Tanzania. Some examples include; Muriithi and Moyi (2003) on Tax reforms
and revenue mobilization in Kenya concluded that tax reforms had a positive impact
on the overall tax structure and the individual tax handles, even though the impact of
the reforms was not always uniform. Kanyi and Kalui (2014), on the effects of tax
policy reforms on tax revenue in Kenya, concluded that there was a large increase in
total tax revenue in Kenya which was a result of tax reforms. Zeng et al. (2013), on
the Impact of Economic Growth and Tax Reform on Tax Revenue and Structure:
Evidence from China Experience concluded that tax reforms are important in
steering the economic growth as well as the increase in tax revenue. For that reason,
economic growth as measured by GDP, tax reforms, and revenue growth are highly
related. The study shows that China's tax reforms have contributed to economic
growth though the growth was not constant in all periods.
Asaoluet al. (2015), on the Impact of Tax Reforms on Revenue Generation in Lagos
State, concluded that tax reforms had positively affected revenue generation in Lagos
state. Munene and Ndururu (2016), on the effect of Tax Reforms on Revenue
Collection at the Customs and Border Control Department of Kenya Revenue
Authority. In their findings, reforms were weakly positively related to tax revenues.
Except for Gachanja (2012) who concluded that tax reforms and tax revenue have a
significant negative relationship on his study on the effect of tax reforms and
economic factors on tax revenues in Kenya. Earlier studies identified several factors
affecting tax revenue among others, including corruption, GDP and Administration
of tax reforms. The researcher aims at conducting an intensive study on the
relationship between tax reforms and economic factors on collected tax revenue in

7
Tanzania. The researcher adopted the study carried out in Kenya on the “Effect of tax
reforms and economic factors in Kenya” by Gachanja (2012) in the context of
Tanzania.
1.3 General Research objective
To establish the determinants of tax revenues generation in Tanzania.
1.3.1 Specific Objectives
i. To examine the influence of tax reforms on tax revenues collection in
Tanzania
ii. To determine the role of gross domestic product (GDP) on tax revenues
collection in Tanzania
iii. To examine the influence of corruption on tax revenue generation in Tanzania
1.4 Research questions
i. What is the influence of tax reforms on tax revenues collection in Tanzania?
ii. What is the role of GDP in tax revenues collection in Tanzania?
iii. What is the effect of corruption on tax revenues generation in Tanzania?
1.5 Significance of the Study
The study enabled to obtain the following significances;
The study draws decision and recommendation for remedial action to improve the
existing situations in TRA tax reforms. Based on the findings and recommendation,
the government has a ground on which to base its improvement on formulating and
implementation of tax reforms.
The study enabled the expansion of the body of knowledge to professionals,
academicians, and the public in large. Through this research, Tanzania citizen
attained knowledge concerning tax reforms and revenue collection and how revenue
depends on tax reforms for its collection improvements. Also, the researcher
provided to the citizen the knowledge concerning their responsibility of paying Taxes
to the government for the development of our country.

8
The study is very significant to the researcher since it is a partial fulfilment for the
award of the degree of Master of Science in Finance and Accounting at Mzumbe
University.
1.6 Organization of the study
This study is organized into six chapters. After the first chapter which is the
introductory part, we have Chapter 2. This chapter presents different literatures
related to Tax reforms and revenue. Literature section is comprised of two parts
namely theoretical literature review and empirical literature review after which
comes the research gap and the conceptual frame wake.
Chapter 3 is covered by the research mythology. This part presented the research
design, data collection methods and data analysis.
Chapter 4 presents the research findings. Research finding section is comprised
Trend analysis, time series data test and regression analysis.
Chapter 5. This chapter presents the discussion of the findings of this study from
trend analysis and regression analysis.
Chapter 6. This is the last party of this study and its covers the following parts;
Summary of the findings, conclusion, recommendations, limitations of the study and
recommendation for further studies.
References. This section provides the different sources of materials used in this study
arranged in ascending order.

9
CHAPTER TWO
LITERATURE REVIEW
2.1 Introduction
This chapter presents a review of past literature of other scholars on tax reforms and
economic factors. The first part contains a presentation of theoretical literature
review which is comprised of Classical Tax theory, optimal tax theory and Ability to
Pay. The second part of this chapter gives a presentation of empirical literature
reviews on Tax reforms, Impact of Tax Reforms on Tax Revenue and Impact of
economic factors on Tax revenue. The third part of this chapter presents a research
gap.
2.2 Theoretical Literature Review
2.2.1 Definition of key concepts
Tax reform
Tax reforms refers to how the government revises and impose its country tax laws
and policy. They are the changes and introduction of new tax laws for the aim of
improving the existing tax system and the aim being an increase in Tax
Revenue(Kanyi&Kalui, 2014).
Tax revenues
Tax revenues are the income the government receives from the citizens as
government charges imposed on individuals and organizations on goods and
services, income, profits, and other kinds of taxes levied to different tax sources
(OECD, 2019).
Economic factors
Economic Factors are the factors that have influences on the economy. For the sake
of this study, the economic factors are Gross Domestic Product(GDP) and
Corruption.GDP is the sum of market value of all goods and services which are

10
completely produced within the boundary of the country. It includes goods and
services produced by the country citizens and foreigners. It is mostly calculated in
annual basis though it may be calculated in quarterly basis too. GDP gives a picture
of the country economy. The estimation of country’s economy and its growth rate is
done through the use of GDP (The Economic Times,2019).
Corruption is the abuse of power by the corrupt government officials for their
personal gain. Corruption affects adversely the economy as some rules and laws are
violated due to corruption. Because of corruption, people don’t pay their taxes or pay
lesser than they were supposed to pay and thus less Tax Revenue, Transparency
International (Grundler&Potrafkem 2019).
2.1.2 Theoretical underpinnings
The Classical Taxation Theory
The Classical Taxation Theory was predominant for ancient times. Adam Smith is
the core founder of this scientific taxation theory. Adam Smith defined the taxation
system as while making clear some important conditions regarding taxation system
formation. Adam Smith suggested four taxation principles (maxims) which are
Equity, Certainty (determination), convenience and economical (thrift) taxation
administration (Smith, 2005).
By equity, the maxim meant that taxpayer’s need to contribute to the state regarding
their respective abilities in proportion to the revenue they earn. Certainty
(determination) means a known amount of tax, manner of payment and period of
payments to taxpayers. Uncertainty of tax can influence bad behaviours to taxpayers
regarding tax compliance and it may stimulate corruption even if the taxpayers are
not corrupt. Convenience maxim is about convenient levying of a tax in terms of the
manner of payments and time of payment for the taxpayers to pay it. Economical
taxation administration means that in the act of collecting tax, only a few people
should be involved and only a few amounts of revenue collected should be used to
pay tax collectors while bringing the remaining huge collected tax revenue to the

11
government. The tax officers may tax more from taxpayers and bring less to the
government, which may lead to low revenue-increasing tax rates (Smith, 2005).
Reforming the tax system by putting the four maxims into consideration in the
formulation of tax systems, it will make possible for the tax collection authorities to
collect more tax revenue from taxpayers. The four maxims of the classical theory are
relevant for this study as tax reforms are aimed at tax revenue increase and by
forming tax policies by taking into consideration these maxims, it will make it easy
for the taxpayers to voluntarily comply with tax and the economical tax
administration will foster collected tax revenue savings.
Optimal tax theory
As presented in Munene, (2016), "The optimal tax theory was introduced by Mirrlees
in the year 1971. In recent years, some Scholars reviewed the theory including
Creedy (2009), O’Brien (2009) and Sorensen (2010)” (p.63). Karingi and Wanjara
(2005) argues that optimal tax theory gives directions on the selection and designing
of the tax instruments in a required tax system. According to Mayshar (1990) as cited
in Ndirangu (2014). Optimal tax theory deals with how to design and implement a
tax system for social welfare maximization taking into account the economic
setbacks. Social welfare depends on individual consumption as such; the tax system
selected has to maximize the summation of individual consumption. Revenue
collected from tax uses is funding for government expenditures, public goods and
wealth redistribution from rich to poor taxpayers. The optimal tax theory deals with
minimizing the discouragement at the same time attain the desired goal of wealth
redistribution and public services supply except for the taxes not affected with any
change in individual behaviour (Ndirangu, 2014).
Adam Smith put forward criteria as for a good tax system which is i) tax must match
the individual income ii) Certainty iii) User friend to taxpayers in terms of time for
payment and ways/manners of payments (Convenience) iv) Cost-efficient in
administration and collections (Smith, 2005).
12
As pinned out by Munene (2016), the optimal tax theory tells that income taxation is
a very important policy instrument in any economic system where equality is a
priority. Again, it states that progressive tax redistribution matches peoples' income.
The founder of theory observed that the use of the economic performance of the
people as the criteria for their importance in the economy decreases the desire of the
tax system for the absolute equity of the maximum social satisfaction of income
consumption, resulting in discouraging non-pleasant work.
"The preceding observation leads to some queries regarding the kind of principles
that are supposed to govern optimum income tax, the nature of the tax schedule, and
the degree of inequality upon the establishment of the tax schedule" (p.63) .Recent
improvements in optimal tax theory made it possible for the theory to be close to the
real world of policy setting internationally (Sorenson, 2010). According to O’Brien
(2009) as cited in Munene (2016), "the classical political economists came up with
normative analysis of tax policy which tended to follow a principles-oriented
approach where it was stated that a good tax system ought to satisfy certain desirable
criteria. According to this theory, the tax system should be productive, computable,
popular, equal, frugal, divisible, and incorruptible" (p.63). It is a typical example in
the circumstances where the social wellbeing matters suggested by the present tax
system decrease is not related to the declining level of taxpayers’ income, it would
probably be troublesome to stand for that kind of a system a result, reforming the
system would be necessary. The optimal tax theory can be used in reforming customs
systems to maximize tax revenue (Munene, 2010).
This theory of optimal taxation theory is relevant to this study on the relationship
between current reforms and collected tax revenue in Tanzania. As the theory
requires that, a tax system to be formulated must maximize social welfare taking into
account the economic setbacks. The social welfare depends on individuals'
consumption. The theory underpins this study because of the role of tax reforms in
improving the collection of tax revenue through formulating the tax policy and

13
systems that eliminate the loopholes for tax evasion, avoidance and corruption and
thus maximization of society’s’ social welfare.
Ability to pay theory
Mutie (2016) stated that, “This theory was advanced in the sixteenth century by the
Swiss philosopher Jean Jacques Rousseau (1712-1778), the French political
economist Jean-Baptiste Say (1767-1832) and the English economist John Stuart
Mill (1806-1873)’’ (p.11).
The ability to pay theory is a taxation theory, which insists on considering the
taxpayers, ability to pay before assigning to them the tax they should pay. This is a
progressive tax system, which imposes higher taxes to higher-income earners and
less tax to low-income earners. The theory postulates that higher-income earners can
pay higher taxes. Taxpayer’s income is a determinant of the control the person has
over his consumption or investments, it is important to bear in mind that ability to
pay does not increase as the personal income increase.
According to (Zolt and Bird, 2003; Rai, 2004; Chodorow, 2008; Batt, 2012; Guj,
Bacoum and Limerick, 2013) as cited in Chauke et al (2017), the very famous and
generally recognized theory of equality in taxation is the theory which allows
citizens to pay taxes to their governments depending on their ability to pay. It is
therefore fair and reasonable that the imposition of taxes has to depend on an
individuals' taxable capacity. If tax imposition on people base on the principle of
ability to pay, fairness objective of the tax system is of success and equal spread of
tax burden among the taxpayers' taking into account their ability to pay the taxes.
According to Rai (2004:58), as cited in Chaukeet al. (2017), a suitable tax system
needs to be equal and just which means tax burden should match ones' ability to pay.
According to (Fjeldstad& Moore, 2009; Fjeldstad&Heggstad, 2012) as cited in
Chauke et al. (2017), in the real world, the ability to pay theory requires to find those
who do not pay tax make them pay especially those who can pay. Through that, there
is an increase in the recovery of lost revenue amount and the revenue performance is

14
improved. According to (SARS, 2010:50; Cattarelli, 2011:64; SARS, 2011:3; SARS,
2012:4; SARS, 2014:26-29) as cited in Chauke et al. (2017), the most important part
in tax collection is to ascertain the taxpayers willing to pay and their ability to pay.
The ability to pay theory is of relevance to this study as regards its core principle
grounded on the taxpayer’s ability to pay. If tax reforms are for enhancing tax
revenue, then the reforms should consider including the element of the ability to pay
in its tax policies and systems to stimulate voluntary compliance of taxpayers, which
will result in an increased tax revenue collection.
According to Kinyua (2018), all theoretical considerations of the classical taxation
theory and scientific discussions of the scientific taxation theory (an inquiry into the
nature and causes of the wealth of the nations) give much attention to one singular
aspect; performance of taxation function and the achievement of the supply of state
revenue are based on the principle of equity and justice. Because of nature as many
decades and centuries passed by, the theoretical approach concerning the nature and
role of taxation changed due to complex economic relations and the increasing need
for the states regulatory function. Because of that new taxation theories were formed:
"among them, there were two directions of economic thought, which had the most
significant influence on the taxation policy of the countries with a developed market;
economy: the Keynesian and the neo-classical ones” (p.7).
2.1.3 Factors influencing tax revenues generation
Tax reforms
According to Fjeldstad (2014), Taxpayers ways of behaving can be changed through
the use of tax reforms and expenditure system and this will result in voluntary tax
payments and compliance. It is necessary to create a good balance between
broadening the tax base, compliance, and implementation. Before widening the tax
system, and making it legally accepted by most of the citizens, there is a need for
much effort that is continuous. Fjeldstad (2014) insisted that, regardless of the
importance of tax reforms, the sustainability of the reforms cannot be understood
without an understanding of the validity of the reform itself. Due to the effects of

15
taxation on distribution and incentives, there is a need for the social understanding
that taxation is for the interest of the whole. He recommended that; an effective tax
system should be built through tax reforms, tax administration training, and enhanced
accountability.
Economic factors
Gross domestic product (GDP
Laffer Curve is an economic theory that underpins the relationship between tax rates
and economic growth (GDP). It suggests that lower tax rates influence economic
growth. Arthur Laffer continues to suggest that tax rates that are fairly lower leaves
more money in the hands of the taxpayers who will in return spend the it and be
taxed. The lower tax rate stimulates more economic growth (GDP) because more of
the earning is saved after paying low taxes. More people are employed and the
employees spend their extra earnings. The economic growth (GDP) broaden the tax
bases and as a result more tax revenues are collected. (www.thebalance.com)
Corruption
“The rent-seeking theory of regulation is compatible with the view that regulation is
established by well-intentioned governments intending to solve problems of market-
failure.” Regardless of that, In the tollbooth view, the corrupt government officials
and Politian’s creates unnecessary regulations so that they can take advantage of the
created opportunities for their personal gain (Fitzsimons & Vincent, 2011). As the
consequence of this, public services become full of less needed administrative
processes in which the officials benefit through collecting charges for the services.
The rent- seeking theory provide a better clarification of the systematic corruption
that adversely affects the whole economy and revenue consequently (Fitzsimons &
Vincent, 2011).
2.2 Empirical Literature Review
Several kinds of research have been carried out to identify tax revenue determinants.
“Most studies focus on analysing the tax revenue share variation to differences in the
development level, the structure of the economy, size of the foreign sector, and other

16
socio-economic variables" (Gachanja, 2012). This part is classified into two sections.
Section one being reviews on tax reform and tax revenue and section two being a
review of tax revenue and economic factors
2.2.1 The influence of Tax Reforms on Tax Revenue
Empirical studies have established the role of tax reforms on tax revenues. For
instance
Asoluet al. (2012) in their study concluded that the tax reforms had a positive effect
on revenue generation in Lagos State Nigeria. The researcher informs that through
reforms more people were included in the taxpayers ‘net as there is an enormous
increase of taxpayers. Their study found that the large proportions of collected
revenue were from domestic sources. Since the main objective of tax systems is
revenue enhancement, as such the reforms should firstly aim at making sure the
reforms are properly carried out. Also, for the revenue performance to enhancement,
there is a need for enhancement of tax administration, employment increase, and
reduction in corruption and tax exemptions. There should be much focus on tax
collection enhancement, corruption reduction, and welfare enhancement.
Similarly, Kanyi and Kalui (2014) in their study found a significant increase in tax
revenue related to tax reforms. Review and restructuring of the administrative tax
system are a prerequisite for sustained development. Citizens need to have voluntary
tax compliance as a response to the government cry about the budget deficit and tax
gap.
The researchers recommended that the stakeholder’s concert is very important in the
entire process of tax policy formulation. Engaging stakeholders in the policy
formulation make them have a feeling of owning it and as a result, they voluntarily
comply with the tax. Minimizing a gap between the government and taxpayers will
make everything smoothly running.

17
The impact of tax reforms is clearly seen on tax structure thought; its impact on the
overall taxes keeps decreasing as time goes on. Tax reforms are very important in
facilitating the good performance of the system as well as facilitating the revenue
growth rate. Tax reforms are necessary for facilitating economic growth and
economic growth is very important in increasing tax revenue. As thus, economic
growth, tax reforms, and tax revenue have a greater relationship. From the research
findings, it is evident that tax reforms in China lead to economic growth, vivid
changes in the tax structure elements in the short run through are the effect is to stay
in the long run (Zeng et al., 2013).
On the other hand, Munene and Ndururu (2016), concluded that "The relationship
between customs enforcement reforms and tax revenue collection is weakly
positively correlated but not statistically significant” (p.66). The researchers
recommended more examination of the customs reform’s enforcement aiming at high
tax collection form an individual taxpayer to be carried out because of its massive
standard deviation.
Muriithi and Moyi (2003) on their study which applied buoyance and elasticity to
examine if the objectives were attained by the Tax reforms in Kenya. The findings
suggest that tax reforms have a positive relationship on the tax structure as a whole
and individual tax, but the effect of the reform isn't evenly equal. The effect of the
reform on direct taxes is bigger as compared to that of indirect taxes.
This is because of the commitment to direct tax reform that resulted in a simple tax
system and removal of tax avoidance and corruption rooms. Gachanja, (2012) on his
study on “the effect of tax reforms and economic factors on tax revenues in Kenya",
found that tax reforms have an important effect on tax revenue with a negative
correlation. Gachanja (2012) portrays that, for some time tax reforms lead to a
decrease in tax revenue and the expected function of reforms, which was improving
tax revenue, did not come true.

18
From his findings, he recommended that; there is a need for the Revenue Authority
to make a review on reform matters and the modernization programs and whether
some of the reforms undertaken contribute to revenue creation. This can be done
through a performance review using a strategic plan as a criterion and make some
necessary corrections.
Joss (2018) analysed the effect on revenue growth in Liberia of the tax reforms
introduced by the government.The results of the study show that there are still
substantial gaps and contradictions in tax policy. An interactive forum between
government and the private sector should be held to ensure positive fiscal reform,
particularly for companies, as a way of seeking mutual consensus on matters of
prime concern.
Jelilov and Isik (2015) explored the effect of tax reforms on Nigeria's economic
development between 1986 and 2012. The findings demonstrate that tax reforms
have a positive and significant link with economic growth, and that tax reforms
actually lead to economic growth. It was assumed that, beneficial tax reforms
strengthen the capacity of public authorities to pursue socially beneficial practices
that lead to real and per capita economic development.
Agbeyegbeet al(2006) analysed the relation between trade liberalisations, exchange
rate, and tax revenue for the period 1980-1996, which relates to the pooling of 22
sub-Saharan Africans. Two substitutes for trade liberalisation are used in this
analysis. They also analyse the effect on tax receipts and their main components of
other socio-economic variables in their study. The relationship between trade
liberalization and the fiscal income is responsive to the proxy used to calculate trade
liberalization by the generalized moment regression methods. They also noted that an
appreciation of the exchange rate and increased inflation have some connection with
lower tax revenues and important tax modules. They concluded that the market
liberalization associated with suitable macro-economic policies could be enforced in

19
a manner that would protect the return on tax revenue on the basis of their empirical
findings.
Mwakalobo (2009) analysed the tax revenues and the efficiency of the tax system in
Kenya responded to changing tax policies. The that trends in the buoyancy
coefficients of the total tax system and individual taxes confirmed this finding. The
study found that, tax buoyancy improved as a result of the economic reforms in
1987-91. The growth rate of sales and excise taxes increased to 1.10 in the reform
period from an average of 1.05 during the pre-reform period (1987-91). In 1992-96 it
then marginally declined to 1.02 and in 1997-2005 it rose to 1.09. The increase in tax
collections coincides with the time when, in the mid-1980s and the 1990s, the
government implemented tax reforms.
Bhattarai et al (2017) proposed a model policy measures for the US corporate
income tax reduction. Results indicated that, the reduction in the corporate income
tax rate has major positive effects on productivity, expenditure, capital training, jobs
and household well-being (for nearly all deciles). All the proposed reforms also lead
to an improved public sector.Findings were possible in the sense that derived model
was complemented by plausible assumptions of elasticity and involves price,
production, employment and investment adjustments resulting from tax policy
reforms.
Balatsky and Ekimova (2019) assessed various scenarios for the reforming of federal
income tax in Russia, aimed at replacing the flat tax with a phased magnitude.The
government project was found to be the best project, based on the three parameters
used in the analysis, to maintain the flat income scale and raise the rate from 13 to
15%. The other projects demonstrated a drastic over-estimation of tax revenue
growth, owing to incorrect estimates of population income distribution in the tenth
decile region.

20
Ouma (2019) examined the impact on total tax, direct and indirect tax incomes of the
1964-2016 tax reforms, economic growth and policy environment. Findings revealed
that: all taxes reacted positively to each of the tax changes; the reforms affected all
tax changes, due to GDP increasing as well; economic growth had a substantial
positive impact on all tax categories; government efficiency had a positive effect on
indirect tax; and that, despite statistical emphasis on state regulation of corruption in
tax income.
Zhang et al. (2018) assessed the effect of business tax loans on company fixed
investment using China's pilot on the 2004 reform in value added tax reform, which
creates a permanent 17% tax loan on fixed investment in six North-eastern industry
sectors. It was found that, in 2004-2007 the tax credit significantly increases the
fixed investments of eligible companies by 28% on average, compared with 2001-
2003, corresponding to the elasticity of user costs of 1.84. The tax benefit has greater
impacts on less financially challenged firms such as smaller businesses and
companies with higher cash flows. The outcome is generated primarily by responses
by domestic private companies and is resilient to requirements that tackle the
question of uncertainty.
Barro and Furman (2018) used a cost-of-capital framework to evaluate GDP's long-
term, stable and transition direction. With the legislation as it is written, it was
predicted that, a long-term rise in corporate productivity of 2.5%, which means a
GDP increase of 0.4 percent after ten years, or an improvement in the rate of growth
of 0.04 percentage point annually. If the 2019 law is made permanent, the estimates
are 4.8 per cent of long-term corporate output, 1.2 per cent of GDP after 10 years,
and 0.13 of growth rate growth. sensitivity analysis was carried out and disclosed
that, as interest rates rose because of fiscal uncertainty, GDP rises for the 10th year
would be 0.2% and 1.0% for each of the two scenarios.

21
Iglesias (2016) explored two hypotheses regarding the reforms in course taken by tax
authorities in Brazil. The first concerned the lack of attention with regard to the pre-
2011 pricing actions in the tobacco industry (instead of reducing prices after tax cuts,
the legal firms' net price rises above inflation and the overall costs). The second
hypothesis relates to contradictory industrial estimates of the scale of the black
market, which eventually eroded industry 's reputation with tax authorities. The
report believes that, the 2011 reform aimed at reversing the weaknesses of previous
policies and was successful.
Castiglione et al. (2018) examined the environmental taxation income determinants
for European countries. In addition to researching the most studied variables, such as
growth, consumption and environmental quality, other non-trivial variables are also
taken into account. The findings suggest that in Western EU and Eastern EU
countries the above-mentioned drivers have a heterogeneous impact on
environmental tax revenue owing to the hardly inadequate policy contexts of latter
economic systems and their perplexing development patterns.
Hines (2017) provided a further metric of corporate tax obligations based on data in
budget tax expenditure. The measure suggests that, without any deductions,
exclusions or tax loans, the burden of U.S. corporation taxes in 2017 is
approximately equal to that of the corporate tax rates of 31.7% to 34.8%. Efficient
business taxation system architecture supports enterprises with competitive economic
spill overs and places lower pressures on the sectors and activities that are most tax
sensitive.
Prichard et al. (2019) offered a conceptual basis for designing more effective tax
reform and enforcement strategies. The framework provides for parallel investment
in regulation, facilitation and trust to be combined. Their framework proposes to rely
more on an on-site analysis of binding limitations, combined with close attention to
understanding politics and trust drivers in particular contexts, to guide analysis on
how various investment can be integrated, evaluated or synthesized.

22
Livoi (2017) carried out a study to examine the impact of corporate tax compliance
reforms on strategy, administration and technology. There was a survey of domestic
taxes workers at the KRA headquarters. Evidence showed that tax changes had an
inverse impact on corporate tax enforcement. Results suggest that the intended goal
was not accomplished by tax reforms.
Morales and Medina (2017) assessed the impacts on formal employment and average
wages of firms of the Colombian tax reform for 2012. They built a panel of
companies based on the administrative records of their employees.They predicted
that, the adoption of the legislation resulted in an optimistic and substantial increase
in formal employment of approximately 213,000 employees at established pre-
reform firms. The effect of the reforms on the average wages paid by companies was
also positive for certain sizes of enterprises, although in the short term the overall
impact was quite modest.
Muzurura and Sikwila (2018) explored the intersection of taxation policies, private
fixed domestic expenditure, and economic development in Zimbabwe from 1998 to
2015 through the use of the Ordinary Least Square regression. Their findings indicate
that tax revenue channeled to efficient public expenditure including highways,
bridges, railways, electricity, transport and other communications systems would
certainly rise private fixed domestic investment productivity. Policymakers face the
key obstacle of developing tax laws that minimize tax evasion, reduce corruption,
raise domestic revenue and adequately protect the tax base while reducing the
increasingly global world excess burden on businesses.
Liuet al. (2017) built two-stage dynamical models to determine how the tax reform
impacts the coal and coal-fired power sectors. Market situations of deficit and over-
supply are examined separately. The developed model suggested that, tax reform
would reduce the price of both coal and the profitability of the coal industry if the tax
collected on every ton of coal is held at the same standard as before, regardless of
whether the market is in a shortage or over-supply situation. The strengthened
purchasing power would, however, intensify the impact of the tax reform.

23
Jibao and Prichard (2016) explored the reasons behind the relative progress of the
Sierra Leone property tax reform plan. This acknowledges the political value of
influencing policy results and stresses policy approaches that have helped to address
both political and technical obstacles to reform. This outlines three related points.
First, long-term, realistic local partnerships are required which support the local
capacity, contribute to challenge the political opposition and build up an electoral
district for reform. Second, a broader emphasis should be given to politically divisive
attempts to increase transparency, public engagement and compliance within the
leaders, as they are vital to the success and survival of the programme. Third,
focusing on the same politically divisive reform elements will enable external actors
properly evaluate the magnitude of local policy commitments to change early on and
thus prioritize funding and initiatives for reform more efficiently.
2.2.2 The influence of Economic Factors on Tax revenue.
Gross Domestic Product (GDP) and tax revenue generation
According to Gachanja (2012), the effect of tax reforms and economic factors on tax
revenues in Kenya through trend analysis and regression analysis. The trend analysis
found that, Kenyan GDP and tax revenues were rising over time from the year 2000.
From his graphical representation, the relationship between GDP and tax revenue is
linear. This meant GDP has an influence on the growth rate of tax revenue in Kenya.
Gachanja also carried out a regression analysis and revealed that GDP had a
significant positive effect on the tax revenue.
Zeng et al. (2013) conducted a study to analyse the effect of growth of economic and
taxation reform on revenue and structure of taxation. Their results through regression
analysis indicated that, all independent variables had similar coefficients except for
GDP, which had the highest coefficient, and thus GDP had the most contribution on
Tax Revenue in China. Meanwhile, Tanzi and Devoid, (2000) conducted a study on
corruption, growth and Public Finances. In their findings they found that; there a
decrease of the revenue – GDP ratio by 1.5%, tax –GDP ratio by 2.7% and an

24
increase of non- tax revenue- GDP ratio by 1.3% with the increase of corruption
index by only one point.
Apart from that, it has been established that, GDP (economic growth) had a positive
and significant effect on all categories of tax revenue (Ouma, 2019). We find a
positive and significant effect of per capita GDP and of the share of the value added
of agriculture on tax revenues.
Boukbech, et al. (2018) investigated the determinants for tax revenues in developed
countries.It was found that, GDP per capita and agriculture's added value are
associated significantly and positively with tax revenue. The level of transparency
had a favourable yet marginal effect on income from taxes. Also, there was a
negative but not major effect on the growth of the population. The implications of
inflation and government expenditure are important and optimistic for the
determinants of tax effort. Their results further suggested that, there are considerably
negative relationships between the tax initiative and the variables of "public aid
provided" and "foreign debt."
Makame (2015) assessed the effect of VAT and collection of revenue on GDP in
Zanzibar. The study showed that value added tax is advantageous for the economy of
Zanzibar. It was also found that, VAT in Zanzibar is statistically significant to ZRB
revenues.The findings indicate that Zanzibar needs to be able to generate sufficient
revenue to meet the challenges of their spending in terms of social facilities supply
and the operating costs of the government in order to achieve their long - term
economic growth.
Adegbie and Fakile (2011) assessed income tax and economic growth in Nigeria.
GDP was used to calculate corporate income tax in Nigeria and its oil profits tax, its
business sales tax and its customs and taxes. Findings showed that, a significant
obstacle to revenue output exists between corporate income tax and Nigerian
productivity expansion, and tax avoidance and fraud.

25
Owolabi and Okwu (2011) assessed VAT contribution to the production of the state
economy of Lagos. Aspects of progress included growth, environmental
sustainability, progress of the education sector, youth and social development,
development of the agrarian sector, development of the health sector and
development of the transport sector.The findings show that VAT revenue has made a
significant contribution to the growth of the respective sectors. The positive
contribution, however, was statistically important only in the growth of the
agricultural sector.
Unegbu and Irefin (2011) evaluated VAT impacts in relation to economic and human
developments of developing nations between 2001 and 2009, regression,
discriminant analysis and ANOVA have revealed the very significant effect of VAT
allocations on the state's expenditure trend during this era. It was also noted that
citizenship perceptions across state administrative regions indicate that VAT has a
minimal effect on the economic and human developments in the Adamawa State
between 2001 and 2009.
Lee and Gordon (2005) examined how tax policies impact the rate of growth of a
nation by using cross-country data from 1970–97. Their results showed the
substantial negative association between statutory corporate tax rates and cross-
sectional disparities in overall economic growth.
Ade et al. (2018) explored the tax revenue output characteristics of all 15 countries in
the Southern African Development Community from 1990 to 2010 through panel
data.The findings clearly underlined the strong position of taxation (tax rate and tax
policy variable harmonization) in raising the region's tax revenues (along with other
significant determinants) and provide empirical support for anecdotal evidence that
has existed. The empirical results also confide that the FDI affects the amount of
income from tax received in the SADC and the presence of the reverse causal
mechanism (that is, the causality of FDI and taxation or conversely).

26
Ahmed and Muhammad (2010) examined the factors for buoyancy of tax in a
number of developing countries (total reaction of tax revenue to national income
adjustments and discretionary tax policies). For 11 years (1998-2008), the
researchers utilized panel data for 25 states, including seven African countries
(Zimbabwe was the only SADC country included), and used the least pooled method
for the analysis of the results. Findings revealed that, manufacturing, production,
utilities, monetisation and budget deficit resource affects tax buoyancy positively,
while the increase in subsidies negatively impacts buoyancy of tax.
Palil and Mustapha (2011) analyse tax enforcement determinants in Malaysia, aimed
at increasing the collection of tax revenue. The findings showed that fiscal awareness
has a major impact on tax enforcement and ultimately, on income collection, while
tax awareness rates the signing between the respondents differs fictitiously. The
findings also showed the tax compliance is affected by audit expectations,
perceptions of government expenditure, fines, personal/financial constraints and the
impact of reference groups.
Gupta (2007) discussed the key indicators of the performance of tax revenue in
developed countries, including SSA, with the application of a large data set for 120
countries. The consequence is that variables such as per capita GDP, market
flexibility and external assistance have a huge effect on the economic results.
Corruption, political stability and direct and indirect tax share (in particular VAT) are
also considerations.Results indicated that, further increases in tax rates (especially on
mobile factor production) are neither feasible nor desirable given the present tax
level, and increased tax competition in Africa. The rise in tax rates leads to tax
avoidance and evasion, tax inversion, rising administrative tax costs and wealth
control and corporations' enforcement costs. Alternatively, the expansion of the tax
base (and the incorporation of the informal sector into the tax net) is an effective way
to generate domestic revenue and boost tax system understanding.

27
Garikai (2009) explores the buoyancy of tax determinants in the SADC. The study
found that, on the basis of panel data for 14 10 SADC countries from 1994 to 2005,
that monetization, external aid growth and growth in fiscal deficit (i.e. increased
government spending on collected tax revenue) have adverse repercussions on
annual fiscal booster and the tax execution in the SADC. The growth in fiscal deficit
can be decreased by reducing government spending or tax income. Variables as
growth and government spending in the agricultural and industrial (mining and
manufacturing) sectors contribute positively to fiscal stimulus whereas openness to
trade and economic development (ECON) tends to be insignificantly fictitious.
Between 2000-2009, Bonga (2017) used panel data collection for nineteen countries
for the empirical study of tax buoyancy determinants. Monetization is one of the
variables identified as influencing annual tax growth. Empirical findings affirm its
meaning. The findings have shown that the manner in which monetization is
managed in developed countries has a negative impact on annual tax increase.
Several variable influencing tax buoyancies were the growth of national income
contribution in the agricultural and manufacturing, foreign aid growth, fiscal deficit
development and the development of overall expenditure. The determinants of tax
growth were suggested according to the theory of tax handling. The study provided
such findings as the quality aspect of tax output was taken into account, which many
of the previous authors have overlooked.
Wawire (2017) suggests that, VAT growth elasticities are all higher than one. The
calculations show that the overall GDP elasticity of VAT revenues is smaller than
that of monetary GDP elasticity. Proposing the presence of an underground economy
in Kenya during the study period, the results found that, VAT revenues adapt to
changes in their determinants with substantial delays and that VAT revenues are
prone to strange circumstances. The study shows that VAT revenues in Kenya are
highly responsive to changes, particularly in international trade. The challenge is
therefore to create a stable VAT system that allows tax revenues to grow as the
economy grows rapidly.

28
Karingi and Wanjara (2005) revealed that, the 1980 's tax modernisation plan tried to
reform the tax system in order to raise more revenue, redistribute wealth and create a
sustainable tax system. The major reforms in the field of income tax included rising
tax cuts, reducing the highest marginal rates and rising tax relief, to shield low-
income earners from inflation-led creeps. There has been a systematic shift in policy
to indirect taxes, as investment and growth are more beneficial than direct taxes. The
analysis revealed that industrial taxes had declined due to enforcement by the World
Trade Organization (WTO) and national integration blocks with the trade rules.
Menichini (2020) used the company's dynamic model to investigate the Laffer tax
rate determinants (i.e. the tax rate for corporate income which maximizes tax
revenues). Depending on a typical parameterisation of the model, one of the key
determinants was the complexity of the production process, market costs of the
investment and operating costs. Results showed that, the Laffer tax rate for a
representative company is about 68 percent and, in the US, industry varies from 64 to
74 percent. Also, it was found that, over the business cycle the sales maximization
rate procyclical comports in an organisation.
Mbatia (2018) examined the effects of international loans and grants on tax revenues
for the period 1990-2014 for 42 sub-Saharan African countries. The findings show
that, in conjunction with all nations, concessional loans and grants have a negative
effect on tax revenues. Likewise, in lower-middle and lower-income countries. Since
most of these countries have provided loan reduction under the Highly Indebted Poor
Country (HIPC) initiative, it was contended that receiving Governments expect debt
to be always forgiven and therefore view all loans and grants as a “free” source of
funds. It discouraged taxpayers who seek responsibility for their taxation. The High
Middle-Income Countries (HICs), however, responded differently. Across these
nations, loans and subsidies have a positive effect on tax revenue. The consequence
of loans was that high-income countries were inadmissible for debt relief and
obligated to refund their loans.
29
Also, there was positive association between grants and tax revenue explained by the
fact that, HICs attained a considerable level of growth, implying that productivity
and transparency of additional resource added to the taxation systems in income
systems.
2.2.3 The influence of Corruption on tax revenue generation
Except for non-tax revenue, low revenue of all types relates to high levels of
corruption. Corruption and individual income taxes are highly correlated due to the
room for negotiation between the taxpayers and the tax officers. Corruption and
individual income taxes collected as a percentage of GDP are inversely proportion.
With a one-point increase in corruption, there is a decrease in individual income tax
as a percentage of GDP by 0.63%. On the other hand, the graphical representation of
the relationship between tax revenue and corruption Gachanja (2012) shows that
lower tax revenues were associated with a higher corruption index and higher tax
revenue was associated with a lower corruption index. Gachanja (2012) carried out a
regression analysis and he found out that Corruption had a significant positive effect
on the tax revenue.
Again, Epaphra and Massawe (2017) found that, Corruption had a significant
negative effect on the total amount of tax generated. This effect is big in indirect
taxes more than direct taxes. Corruption affects tax administration, tax audits and the
image of the institutions. High corruption influences tax payers in entering informal
economy leading to a loss of Tax revenue.
Furthermore, good governance and lower corruption rates was found to have a
positive effect on Tax revenue. Good governance and lower level of corruption
signify the competency and efficiency of the government (Arif& Rawat, 2018).
Imam and Jacobs (2014) assessed the effects of corruption on Middle East revenue
generation in various tax categories. Researchers found that the low-income
collection as a share of GDP there is partly due to inequality compared with other
middle-income regions and other taxes are more harmful. Taxation involving regular

30
contact between tax authorities and people, such as foreign trade taxes, tend to be
more corrupt than most other forms of taxes.
Arif and Rawat (2018) reported that, in the process of raising income, developing
countries face a range of institutional challenges. Corruption in tax authorities is one
of the major issues. The second big issue of low-income generation is poor
governance efficiency. One of the main characteristics of political uncertainty is
unstable and changing government behaviour, which hampers the process of long-
term system reform. Within this context, the standard of governance as a whole is
also important. It is widespread agreed that, tax evasion and public-sector corruption
are social phenomenon that can substantially reduce tax revenue and severely injured
economic growth and development.
In order to define goals of further tax adjustment, Ombati (2018) analysed the output
of tax revenue as well as tax planning and administrative reforms for the period
1996-2005. The influence of inflation on tax revenue is seen in the empirical study.
This is less optimistic and even inelastic, while indirect and not direct taxes are
capable of improving the tax system's versatility. Tax development challenges
include farm and informal taxation, the elimination of fiscal vacancies, a high level
of effectiveness, high dissent in tariff rates, comprehensive and rigid custom laws,
low VAT response to changes, limited capability to manage large volumes of returns
and zero-rated transaction refund. Moreover. In terms of the time taken to prepare
and file tax returns, Kenya's tax system is burdensome.
Rosoiu (2015) conducted a study to examine, for the period 1998-2014, the effect of
government expenditure and government revenues on Romanian economic
development.Results indicated that, as the government's aim was to establish a
sustainable economic development, all decisions concerning fiscal policy had this
effect. It was revealed that, GDP rose in both situations which influenced positive
expenditure shock from the government and positive tax revenue shock.

31
Castro and Camarillo (2014) employed dynamic and static panel data analysis to
examine the effect of institutional, structural, and social determinants on taxation of
revenues among 34 Organization for Economic Cooperation and Development
(OECD) countries. The study focused for the period from 2001 to 2011. The findings
reflect a positive effect on the dependent variable induced by gross domestic product
per capita, business and civic freedoms, and a negative effect on the agriculture and
foreign investment in financial development.
2.3 Research Gap
The researcher aims to conduct a study similar to Gachanja 2012 study on “the effect
of tax reforms and economic factors on Tax revenues in Kenya” in Tanzania context
to obtain valid and reliable findings through widening the research period and the use
of time line series design instead of longitudinal design that was used by Gachanja
and see if the same or similar results obtained in Kenya will hold in Tanzania.
2.4 Conceptual Framework
According to Magenta and Magenta (2003) and Smith (2004) as cited in Kinyua
(2018), the conceptual framework is a hypothesized pictorial model defining the
model under study. The conceptual framework shows the relationship that exists
between the variables involved in the study. The variables under the study must
include dependent and independent variables. The conceptual framework role is to
give an understanding of the variables under the study.
The level of collected tax revenue depends on tax reforms, GDP and corruption.
Figure 1 presents the conceptual relation between variables, independent variables
include Tax reforms measured by dummy variables, GDP measured by economic
growth and corruption measured by corruption perception index and the dependent
variable is Collected Tax revenue which is measured by the total amount of revenue
collected from taxes and other related fines.

32
Figure 2. 1: Conceptualized relation between variables
Source: Author 2019
Tax reforms is a way in which governments make changes in the existing tax laws
or introducing new tax laws in order to improve the tax system. It is an independent
variable measured by dummy variable.It is expected that, Tax Revenue will increase
as tax reforms are introduced to the tax system.
DGP is the Gross Domestic Product. This is a total market value of all finished
goods and services produced in a country. This includes goods and services produced
by both citizens and non -citizen. Provided that a good or service was produced in
Tanzania with citizens of Tanzania or foreigners, it will be included in GDP. GDP is
the independent variable which measures economic growth. Since GDP measures the
economic growth, it’s expected that, Tax Revenue will increase as GDP increases.
Corruption is the abuse of power by government officials for their personal gain.
This may involve higher level leader, low level leader and even politicians.
Corruption was measured using Corruption perception index. It is expected for
corruption to have a negative effect on Tax Revenue.
Tax Revenue is the government income obtained from levying and collecting taxes
from taxpayers. Tax revenue depends on the economic activities and on how good
the tax system is. Tax Revenue is the dependent variable measured in TZS Revenue
figure.
COLLECTED TAX
REVENUE
TAX REFORMS
GDP
CORRUPTION

33
CHAPTER THREE
RESEARCH METHODOLOGY
3.1 Introduction
This chapter gives an overview of the methodologies that the researcher used in this
study. The chapter provides methodology approaches which were employed to
collect, prepare,and analyse data regarding to tax reforms and revenues collection.
Specifically, it comprises the study area, research design, population and sampling
technique, data collection methods, data collection procedure, and data analysis
procedures.
3.2 Research Design
Research design is a research technique used in the research process in data
collection and data analysis in dealing with the research problem. This study adopted
time series as research design. Time series research design is a design which
examines the relationship between variables over equal time intervals and the time is
an important factor in this case. Time series research design make a use of available
secondary data and due to the availability of secondary data; the researcher adopted a
time series design. The merits of using time series design include understanding of
the past and predicting of the future. Time series study use secondary data which was
readily available.
3.3 Data Collection
Data collection is the whole procedure for gathering information regarding the
research area, problem or question (Makey&Gass, 2005). There are two data
collection techniques, which are primary data (data that is collected at the first time),
and secondary data (data which is the information that is already available and needs
only to be extracted). This study used quantitative secondary data. Secondary data
are readily available from the other sources and as such, there are no specific
collection methods (Business Jurgons,2020).

34
Data were collected annually for a period of 20 years starting from 1998 to 2017.
Data collection included data for GDP, corruption, reforms, and tax revenue; Tax
revenue data were collected from the Tanzania Revenue Authority website; GDP was
collected from Tanzania Data Portal; and corruption indices were collected from the
Transparency International website. All data were collected for the period of 20 years
where the first 10 years, 1998 to 2007 represented pre-reform period and the next 10
years, 2008 to 2017 represented post-reform period. Dummy variables were used to
measure the reforms. 1 and 0 values were coded for the reform period and pre-
reform period respectively.
3.4 Data Analysis
The study employs a multiple regression analysis because it is an economic model
used in predicting the value of a variable based on the value of other two or more
variables. Following that most time series variables are not stationary, using non
stationary variables in the model might lead to spurious regression which cannot be
used for precise prediction (Gujarati, 2003).Data tests were carried out to see if the
desirable properties of time series data are met.
The data analysis process was carried out with EViews. A regression analysis was
carried out for multiple regression analysis performances. Then the results found
were interpreted based on the Pearson correlation coefficient; the r-squaredand the
adjusted r- square. Again, for the interpretation of the significance value, F-statistics
were observed. The coefficient of variables involved in the model was observed and
interpreted for their influence based on their direction, whether positive or negative
effects and their significances in the mode using P –values.
TAX REV = a + β1 TAX_REF +β2 GDP + β3 CORR + µ
Where β1, β2, β3, and are coefficients
a is a constant
µ is an error term

35
TAX REV is the tax revenue (dependent variable) measured by the revenue figures
in TZS from the financial year 1998 to 2017.
TAX REF is the tax reforms (independent variable), it was measured by dummy
variables. A value of 1 was assigned to the after reforms period,0 value was assigned
to the pre reforms period.
GDP is the Gross Domestic Product (independent variable). It is the measure of
economic growth. The values of GDP were collected from 1998-2017
CORR is corruption (independent variable). Corruption was measured using
corruption perception indices from 1998-2017 using the figures that are available on
Transparency International website

36
CHAPTER FOUR
PRESENTATION OF THE FINDINGS
4.1 Introduction
This chapter represents the results in two sections, section one being a trend analysis
of Corruption index, Tax revenue and GDP and section two being a Regression
analysis which shows the results of regressions analysis
4.2 Findings
4.2.1 Trend Analysis Results
Figure 4. 1: Trend for GDP
10
20
30
40
50
GD
P in
billion
US
D
2000 2005 2010 2015 2020year
Source: Data Analysis (2019)
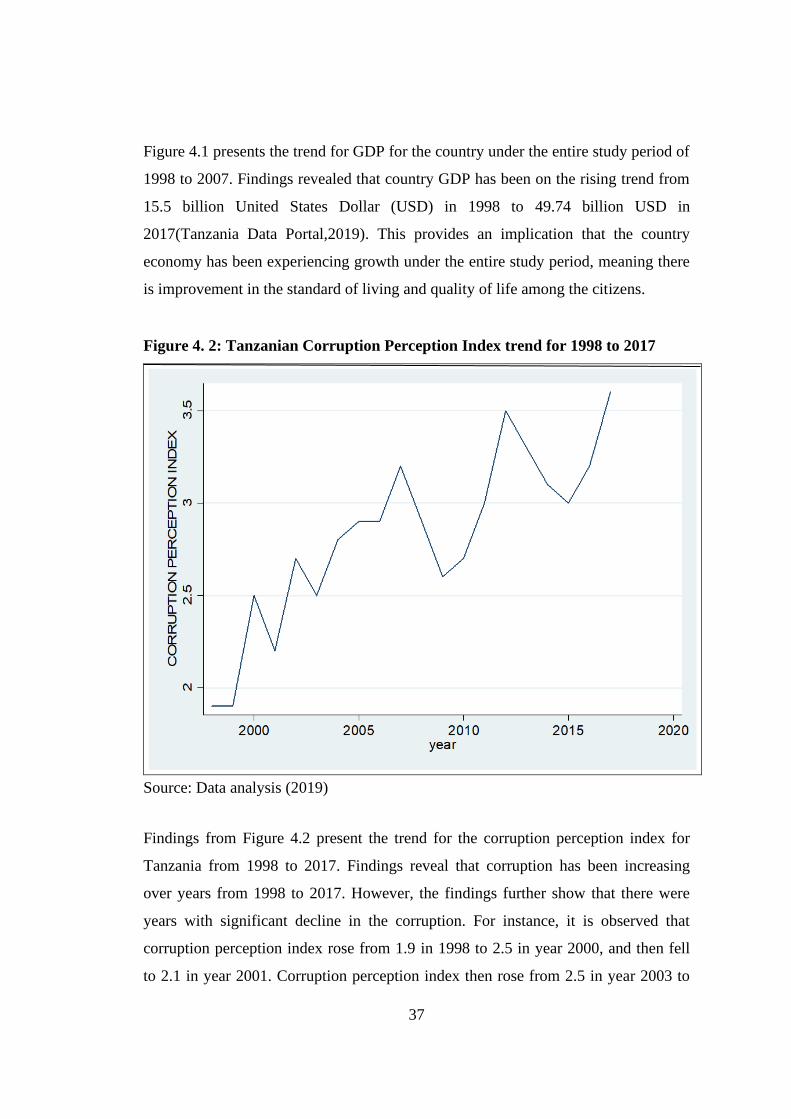
37
Figure 4.1 presents the trend for GDP for the country under the entire study period of
1998 to 2007. Findings revealed that country GDP has been on the rising trend from
15.5 billion United States Dollar (USD) in 1998 to 49.74 billion USD in
2017(Tanzania Data Portal,2019). This provides an implication that the country
economy has been experiencing growth under the entire study period, meaning there
is improvement in the standard of living and quality of life among the citizens.
Figure 4. 2: Tanzanian Corruption Perception Index trend for 1998 to 2017
Source: Data analysis (2019)
Findings from Figure 4.2 present the trend for the corruption perception index for
Tanzania from 1998 to 2017. Findings reveal that corruption has been increasing
over years from 1998 to 2017. However, the findings further show that there were
years with significant decline in the corruption. For instance, it is observed that
corruption perception index rose from 1.9 in 1998 to 2.5 in year 2000, and then fell
to 2.1 in year 2001. Corruption perception index then rose from 2.5 in year 2003 to
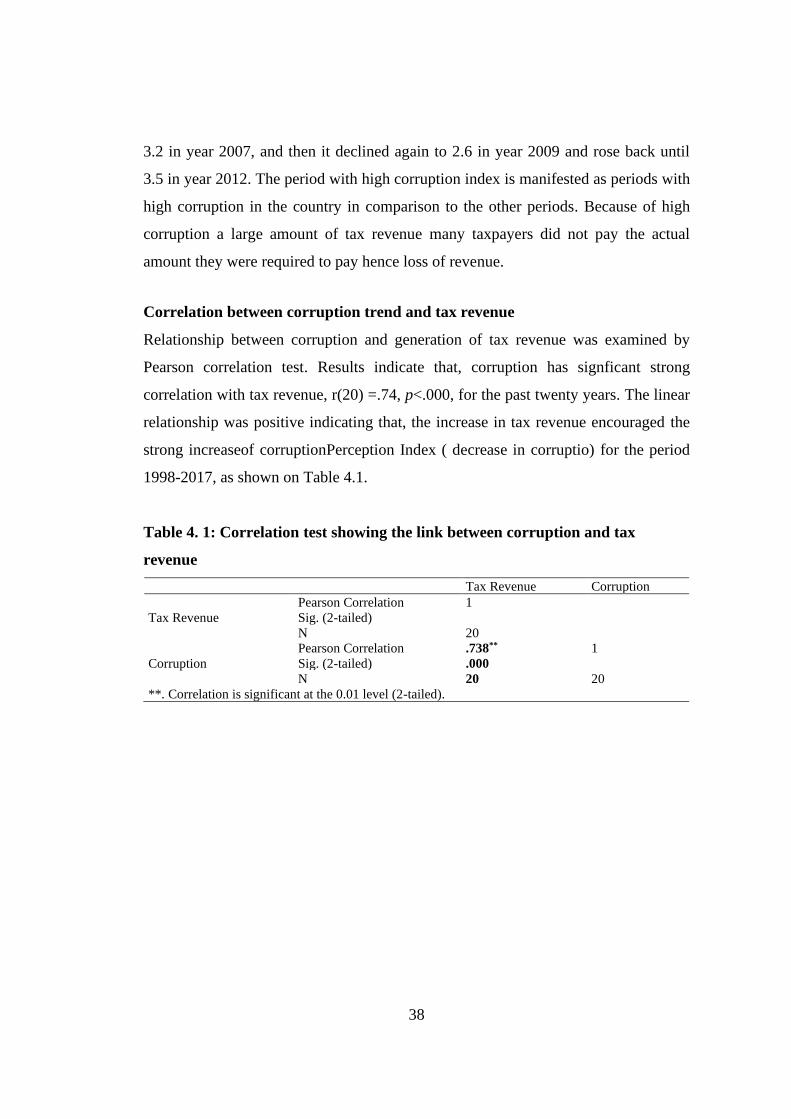
38
3.2 in year 2007, and then it declined again to 2.6 in year 2009 and rose back until
3.5 in year 2012. The period with high corruption index is manifested as periods with
high corruption in the country in comparison to the other periods. Because of high
corruption a large amount of tax revenue many taxpayers did not pay the actual
amount they were required to pay hence loss of revenue.
Correlation between corruption trend and tax revenue
Relationship between corruption and generation of tax revenue was examined by
Pearson correlation test. Results indicate that, corruption has signficant strong
correlation with tax revenue, r(20) =.74, p<.000, for the past twenty years. The linear
relationship was positive indicating that, the increase in tax revenue encouraged the
strong increaseof corruptionPerception Index ( decrease in corruptio) for the period
1998-2017, as shown on Table 4.1.
Table 4. 1: Correlation test showing the link between corruption and tax
revenue
Tax Revenue Corruption
Tax Revenue
Pearson Correlation 1
Sig. (2-tailed)
N 20
Corruption
Pearson Correlation .738** 1
Sig. (2-tailed) .000
N 20 20
**. Correlation is significant at the 0.01 level (2-tailed).

39
Figure 4. 3: Tanzania Tax revenue trend for 1998 to 2017
Source: Data Analysis (2019)
Figure 4.3 presents the trend for the revenue for Tanzania for the period covering
from 1998 to 20017. Findings show that revenues have an upward trend rising from
0.62 billion Tanzanian shillings (TZS) in 1998 to 15.19 billion TZS in 2017. This
entails that the government revenue have been significantly increasing over time.

40
Figure 4. 4: Trend for Reforms
Source: Data analysis (2019)
Findings from 4.4 present the trend on the reforms. It is evidenced that, Tanzania
under the entire study period experienced reforms from 2008 to 2017, while the
period from 1998 to 2007 has no reforms.
Correlation between tax reforms and tax revenue collection
Pearson correlation was also employed to determine the link between tax reforms
and revenue collection. It was revealed that, tax reforms significantly correlate with
tax revenue, r (20) =.802, p<.000. The relationship was strong and positive implying
that, tax reforms has significant influence on tax revenue generations for the period
1998-2017, as depicted on Table 4.2.

41
Table 4. 2: Correlation test showing the link between tax reform and tax
revenue
Tax Revenue Tax Reforms
Tax Revenue
Pearson Correlation 1
Sig. (2-tailed)
N 20
Tax Reforms
Pearson Correlation .802** 1
Sig. (2-tailed) .000
N 20 20
**. Correlation is significant at the 0.01 level (2-tailed).
Existence of cycles
The study employs period gram approach to identify the existence of cycles among
the study variables. However, it firstly displays scatter plots of the GDP trend in the
period of 20 years. Figure 4.5 presents the scatter plot which depict significant
increase of GDP from 1998-2017.
Figure 4. 5: Scatter plot showing GDP trend for the period 1998-2017

42
The period gram peaks at a frequency of slightly above 0.30 cycles per year. The
period gram indicates that there is a cycle with duration of about 33 years as shown
on Figure 4.6.
Figure 4. 6: Cyclical presence plot for GDP
Scatter plot was also constructed to portray the trend of collection of tax revenues for
the period 1998-2017. Figure 4.7 demonstrate the intensive increase of GDP which is
linear in nature.

43
Figure 4. 7: Scatter plot for tax revenue collection
The period gram peaks at a frequency of slightly less than 0.40 cycles per year,
indicating a 38 - to 40-year cycle in revenue as shown on Figure 4.8.
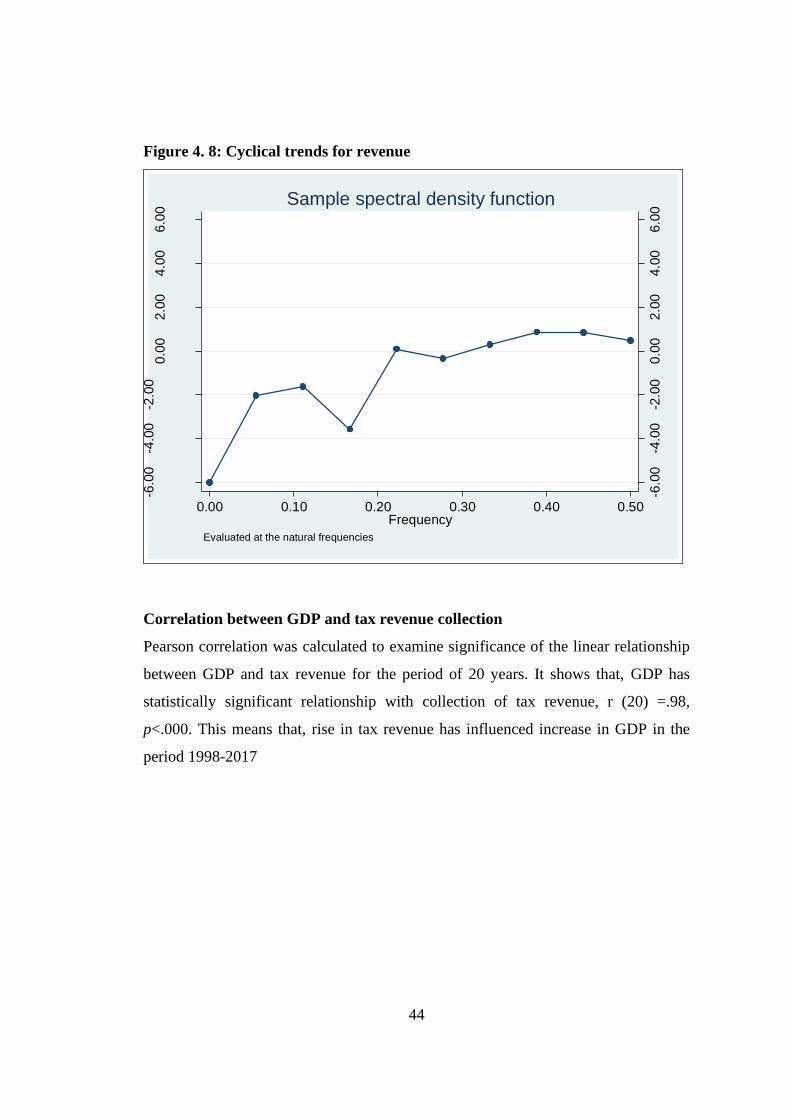
44
Figure 4. 8: Cyclical trends for revenue
-6.0
0-4
.00
-2.0
00.0
02.0
04.0
06.0
0
-6.0
0-4
.00
-2.0
00.0
02.0
04.0
06.0
0
Lo
g P
eri
od
og
ram
of d2
reve
nu
e
0.00 0.10 0.20 0.30 0.40 0.50Frequency
Evaluated at the natural frequencies
Sample spectral density function
Correlation between GDP and tax revenue collection
Pearson correlation was calculated to examine significance of the linear relationship
between GDP and tax revenue for the period of 20 years. It shows that, GDP has
statistically significant relationship with collection of tax revenue, r (20) =.98,
p<.000. This means that, rise in tax revenue has influenced increase in GDP in the
period 1998-2017
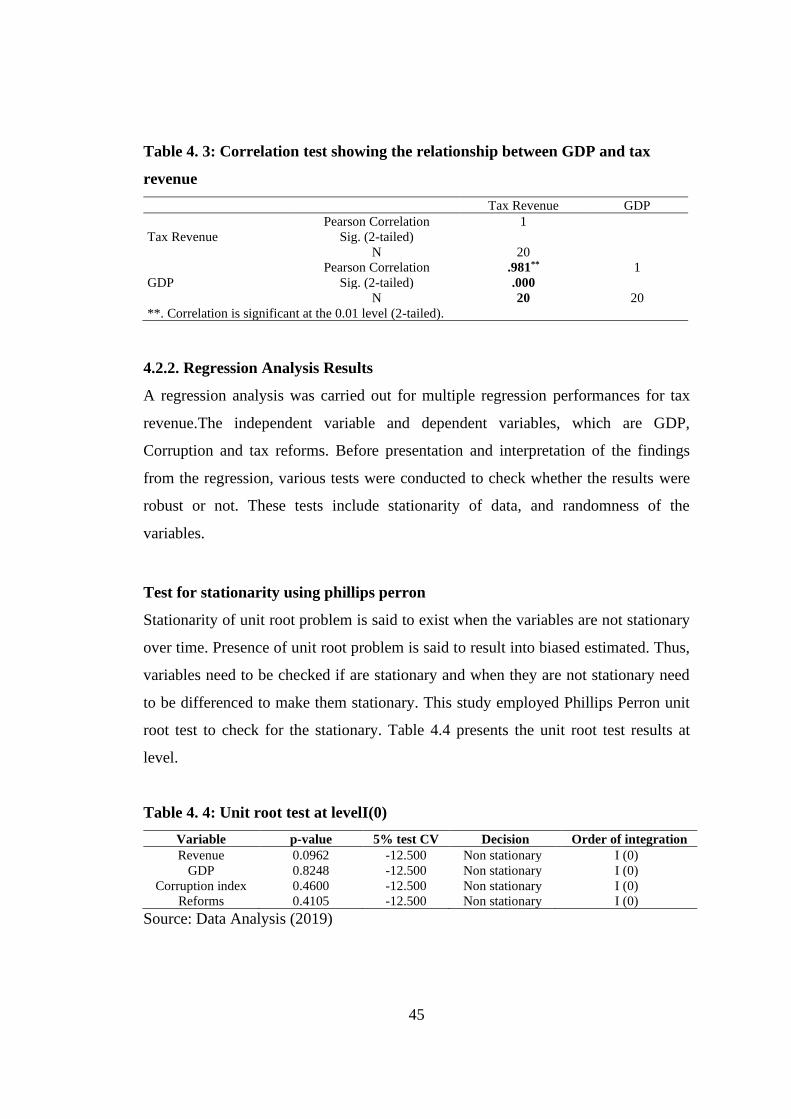
45
Table 4. 3: Correlation test showing the relationship between GDP and tax
revenue
Tax Revenue GDP
Tax Revenue
Pearson Correlation 1
Sig. (2-tailed)
N 20
GDP
Pearson Correlation .981** 1
Sig. (2-tailed) .000
N 20 20
**. Correlation is significant at the 0.01 level (2-tailed).
4.2.2. Regression Analysis Results
A regression analysis was carried out for multiple regression performances for tax
revenue.The independent variable and dependent variables, which are GDP,
Corruption and tax reforms. Before presentation and interpretation of the findings
from the regression, various tests were conducted to check whether the results were
robust or not. These tests include stationarity of data, and randomness of the
variables.
Test for stationarity using phillips perron
Stationarity of unit root problem is said to exist when the variables are not stationary
over time. Presence of unit root problem is said to result into biased estimated. Thus,
variables need to be checked if are stationary and when they are not stationary need
to be differenced to make them stationary. This study employed Phillips Perron unit
root test to check for the stationary. Table 4.4 presents the unit root test results at
level.
Table 4. 4: Unit root test at levelI(0)
Variable p-value 5% test CV Decision Order of integration
Revenue 0.0962 -12.500 Non stationary I (0)
GDP 0.8248 -12.500 Non stationary I (0)
Corruption index 0.4600 -12.500 Non stationary I (0)
Reforms 0.4105 -12.500 Non stationary I (0)
Source: Data Analysis (2019)
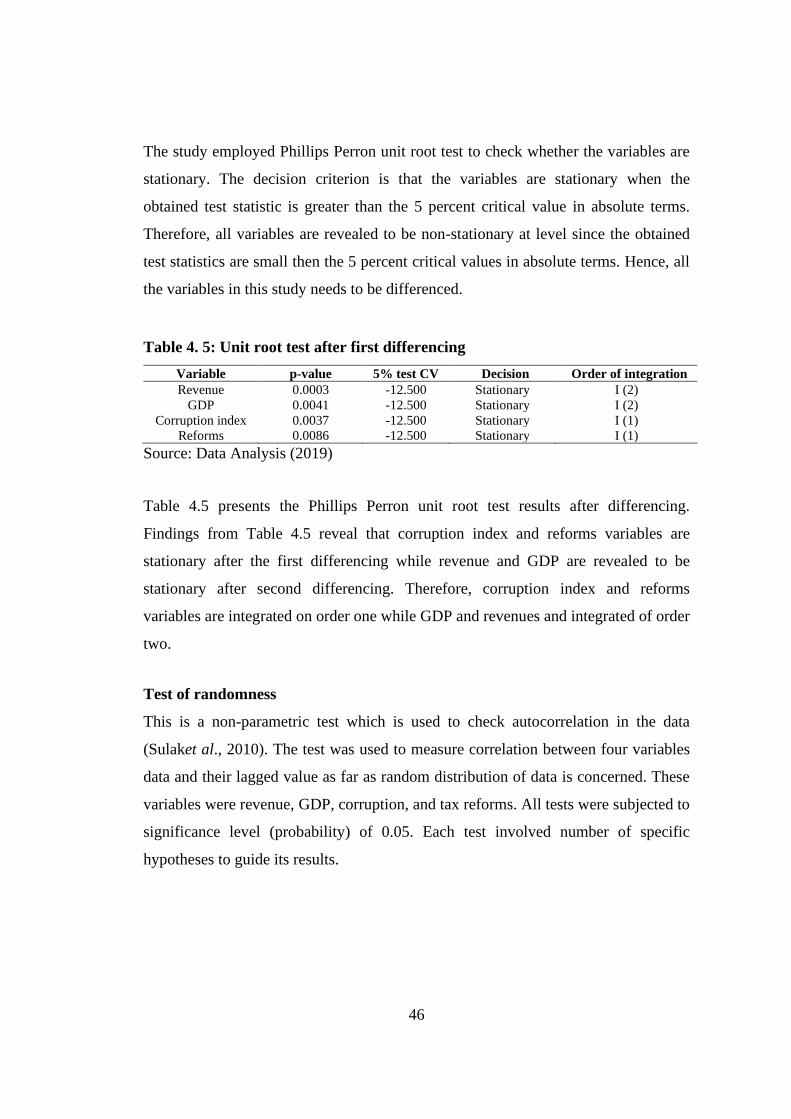
46
The study employed Phillips Perron unit root test to check whether the variables are
stationary. The decision criterion is that the variables are stationary when the
obtained test statistic is greater than the 5 percent critical value in absolute terms.
Therefore, all variables are revealed to be non-stationary at level since the obtained
test statistics are small then the 5 percent critical values in absolute terms. Hence, all
the variables in this study needs to be differenced.
Table 4. 5: Unit root test after first differencing
Variable p-value 5% test CV Decision Order of integration
Revenue 0.0003 -12.500 Stationary I (2)
GDP 0.0041 -12.500 Stationary I (2)
Corruption index 0.0037 -12.500 Stationary I (1)
Reforms 0.0086 -12.500 Stationary I (1)
Source: Data Analysis (2019)
Table 4.5 presents the Phillips Perron unit root test results after differencing.
Findings from Table 4.5 reveal that corruption index and reforms variables are
stationary after the first differencing while revenue and GDP are revealed to be
stationary after second differencing. Therefore, corruption index and reforms
variables are integrated on order one while GDP and revenues and integrated of order
two.
Test of randomness
This is a non-parametric test which is used to check autocorrelation in the data
(Sulaket al., 2010). The test was used to measure correlation between four variables
data and their lagged value as far as random distribution of data is concerned. These
variables were revenue, GDP, corruption, and tax reforms. All tests were subjected to
significance level (probability) of 0.05. Each test involved number of specific
hypotheses to guide its results.
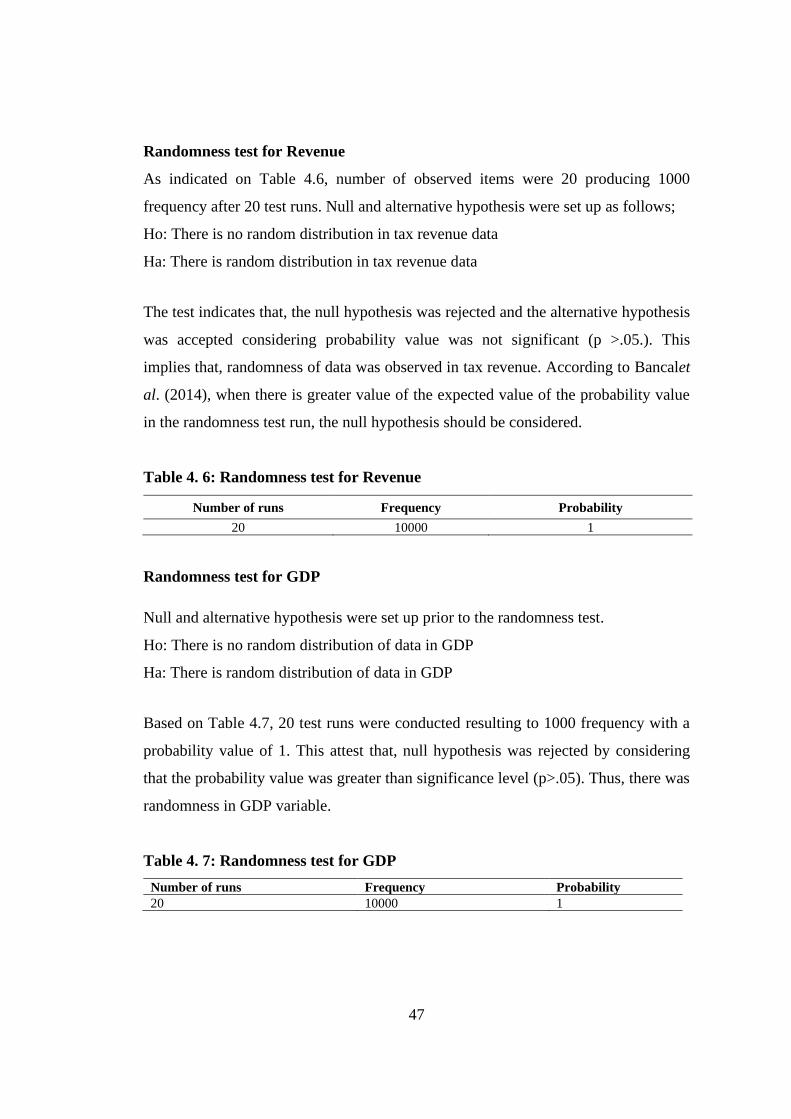
47
Randomness test for Revenue
As indicated on Table 4.6, number of observed items were 20 producing 1000
frequency after 20 test runs. Null and alternative hypothesis were set up as follows;
Ho: There is no random distribution in tax revenue data
Ha: There is random distribution in tax revenue data
The test indicates that, the null hypothesis was rejected and the alternative hypothesis
was accepted considering probability value was not significant (p >.05.). This
implies that, randomness of data was observed in tax revenue. According to Bancalet
al. (2014), when there is greater value of the expected value of the probability value
in the randomness test run, the null hypothesis should be considered.
Table 4. 6: Randomness test for Revenue
Number of runs Frequency Probability
20 10000 1
Randomness test for GDP
Null and alternative hypothesis were set up prior to the randomness test.
Ho: There is no random distribution of data in GDP
Ha: There is random distribution of data in GDP
Based on Table 4.7, 20 test runs were conducted resulting to 1000 frequency with a
probability value of 1. This attest that, null hypothesis was rejected by considering
that the probability value was greater than significance level (p>.05). Thus, there was
randomness in GDP variable.
Table 4. 7: Randomness test for GDP
Number of runs Frequency Probability
20 10000 1

48
Randomness test for Corruption
Assumption of randomness test was considered by constructing two hypotheses as
observed in previous tests;
Ho: There is no randomness in corruption variable
Ha: There is randomness in corruption variable.
Table 4.8 indicate that, number of tests which were ran ranged between 15 and 20
yielding frequencies (3 to 4284) and probability values (0.0003 to 0.4284). In regards
to the approximated mean frequency (1511) and its probability value (p>.05), null
hypothesis was rejected and alternative hypothesis was accepted. Results affirm that,
there was random distribution of data in GDP.
Table 4. 8: Randomness test for Corruption
Number of runs Frequency Probability
15 3 .0003
16 31 .0031
17 326 .0326
18 1511 .1511
19 3845 .3845
20 4284 .4284
Randomness test for Tax Reforms
The two hypotheses for this test were;
Ho: There is no randomness of values in tax reforms
Ha: There is randomness of values in tax reforms.
As portrayed on Table 4.9, the number of test runs ranged between 4 and 19.
Frequency was observed to incline from 9 to 1755 with highest probability value of
.1755. In regards to mean frequency (1721), the test was not significant (p>.05). This
implies that, null hypothesis was rejected and alternative hypothesis was accepted. In
other words, there was randomness in tax reforms values.
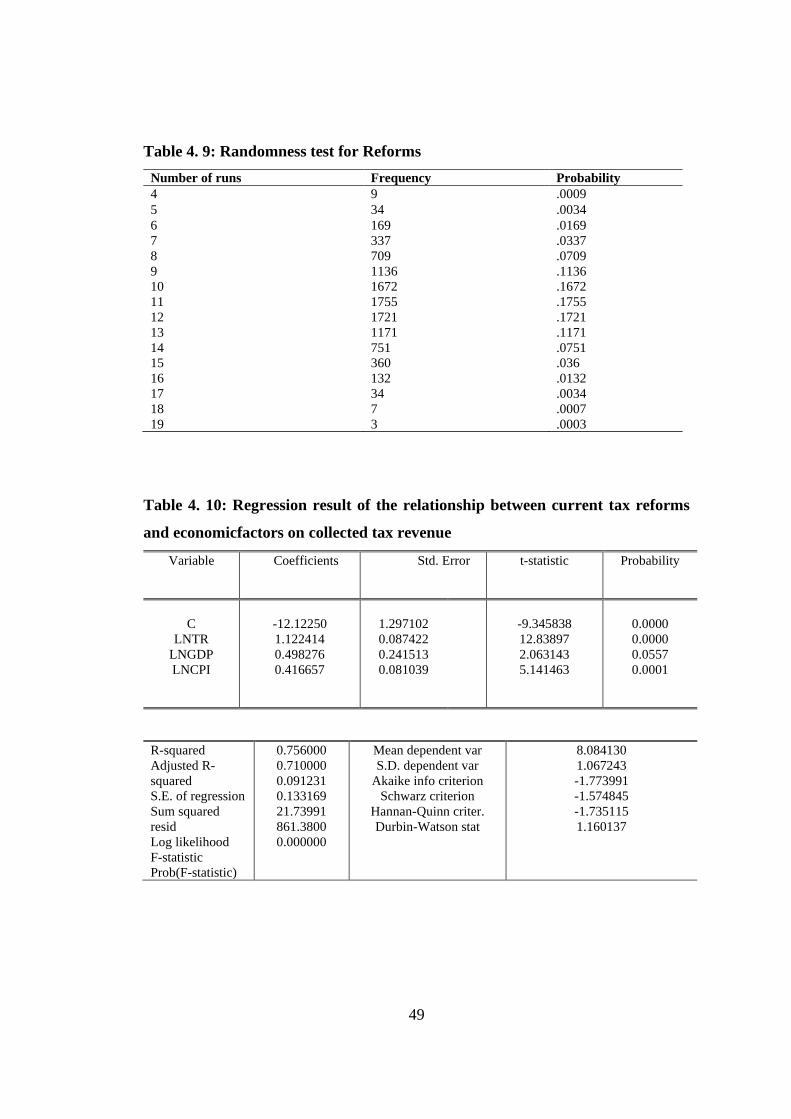
49
Table 4. 9: Randomness test for Reforms
Number of runs Frequency Probability
4 9 .0009
5 34 .0034
6 169 .0169
7 337 .0337
8 709 .0709
9 1136 .1136
10 1672 .1672
11 1755 .1755
12 1721 .1721
13 1171 .1171
14 751 .0751
15 360 .036
16 132 .0132
17 34 .0034
18 7 .0007
19 3 .0003
Table 4. 10: Regression result of the relationship between current tax reforms
and economicfactors on collected tax revenue
Variable
Coefficients Std. Error t-statistic
Probability
C
LNTR
LNGDP
LNCPI
-12.12250
1.122414
0.498276
0.416657
1.297102
0.087422
0.241513
0.081039
-9.345838
12.83897
2.063143
5.141463
0.0000
0.0000
0.0557
0.0001
R-squared
Adjusted R-
squared
S.E. of regression
Sum squared
resid
Log likelihood
F-statistic
Prob(F-statistic)
0.756000
0.710000
0.091231
0.133169
21.73991
861.3800
0.000000
Mean dependent var
S.D. dependent var
Akaike info criterion
Schwarz criterion
Hannan-Quinn criter.
Durbin-Watson stat
8.084130
1.067243
-1.773991
-1.574845
-1.735115
1.160137
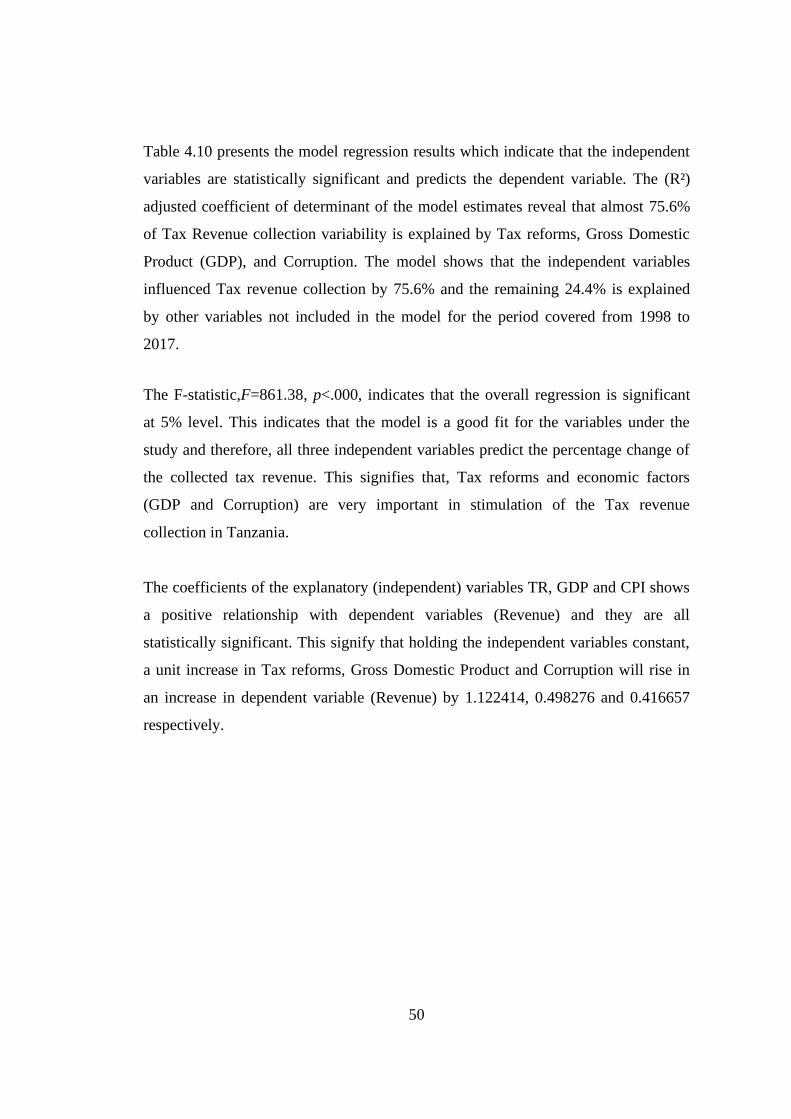
50
Table 4.10 presents the model regression results which indicate that the independent
variables are statistically significant and predicts the dependent variable. The (R²)
adjusted coefficient of determinant of the model estimates reveal that almost 75.6%
of Tax Revenue collection variability is explained by Tax reforms, Gross Domestic
Product (GDP), and Corruption. The model shows that the independent variables
influenced Tax revenue collection by 75.6% and the remaining 24.4% is explained
by other variables not included in the model for the period covered from 1998 to
2017.
The F-statistic,F=861.38, p<.000, indicates that the overall regression is significant
at 5% level. This indicates that the model is a good fit for the variables under the
study and therefore, all three independent variables predict the percentage change of
the collected tax revenue. This signifies that, Tax reforms and economic factors
(GDP and Corruption) are very important in stimulation of the Tax revenue
collection in Tanzania.
The coefficients of the explanatory (independent) variables TR, GDP and CPI shows
a positive relationship with dependent variables (Revenue) and they are all
statistically significant. This signify that holding the independent variables constant,
a unit increase in Tax reforms, Gross Domestic Product and Corruption will rise in
an increase in dependent variable (Revenue) by 1.122414, 0.498276 and 0.416657
respectively.

51
CHAPTER FIVE
DISCUSSION OF THE FINDINGS
5.1 Introduction
In this chapter, the researcher presents a discussion of the findings of this study. This
includes the discussion of the findings from time series data test analysis and
Regression analysis.
5.2 Discussion of Findings
Trend Analysis
The trend analysis inFigure 4.1 shows a steady increase in GDP in Tanzania over
years.Thee cause of this increase could be political stability which attracts investers
and external trade, infrastructure development, and an increase in economic
productivity.
Again Figure 4.2 shows a downward and upward trend in Corruption. Tanzania is
among the highly corrupt Country in the world as its Corruption Perception index
score is below 5. The trend shows that corruption increased in the year 2009 much
than it was in 2008 and it had a sharp increase up to 2012 where it was 3.5. From the
year 2013 to 2015, the corruption index decreased (Corruption rate increased) until
2016 where it starts to increase (Decrease in Corruption rate).Government steps
against corrupt officials and improvement in consistent application of anti-corruption
laws might be the reason for the steep decrease in Corruption from the year 2015 to
2017.
Furthermore, the results in Figure 4.3 show a steady increase in revenue and this
suggests that Tax revenue collection in Tanzania is being increasing over time. This
tremendous increase in revenue could have been caused with the increase in GDP
and reduction in corruption as illustrated in in Figure 4.1 and 4.2 respectively.

52
Regression Analysis
The findings of the study signify that Tax Revenue, Tax Reform, Corruption and
Gross Domestic Product are highly positively related.
The regression results in Table 4.10shows that the regression adjusted R-square of
the model is 75.6%. This manifests that Tax revenue collection in Tanzania depends
on the situation of Tax reforms and economic situations (GDP and Corruption). The
result informs us that Tax reforms and economic factors (GDP and Corruption)
influences Tax revenue collection in a greater extent in Tanzania. For Tanzania to
attain its budgetary needs through Collected Tax Revenue, the Tanzania government
needs to priorities much in proper tax reforms and economic development (economic
growth) through imposing tax systems which influences tax payers to pay Taxes
voluntarily and also provide proper and safe environment for economic activities
which results in economic development. These results are similar to (Asolu et al.,
(2012;Kanyi&Kalui, 2014; Zeng et al., 2013;Muriithi&Moyi, 2003).
It is manifested in the findings in chapter five that, Tax reforms successful
implementation would influence an increase in Collected Tax revenue. It is
suggested that Tax reforms could be used to increase collected Tax Revenue in
Tanzania. This is pinned under the classical theory which illustrates four maxims
which if taken into consideration during Tax Reforms, the Reform aim of increasing
Tax revenue is obtained. These results are consistent with(Asolu et al., (2012;
Kanyi&Kalui, 2014; Zeng et al., 2013; Muriithi&Moyi, 2003).In order for Tanzania
to increase its Collected Tax Revenue, the Tax policy makers are advised to
introduce Reforms which will attract tax payers to pay taxes and more sources of
income to tax should be sought of rather than depending on only few taxable group
of income.
As can be seen in Table 4.10, the variable coefficients for Tax Reforms is positive
Gross Domestic Product and Corruption are a positive and statistically significant.
This implies that an improvement in Tax reforms, GDP and decrease in Corruption
would increase the collected Tax revenue in Tanzania. So, it is suggested that the

53
government take all measures possible for improving Tax reforms, GDP and
decrease corruption in order to win over the problem of budget deficit.
According to the findings, Tanzania Collected Tax revenue depends on the direction
of the Tax reform after implementation. If tax reform implementation is not of
success it is obvious that Collected Tax revenue will be negatively affected i.e
collected Tax Revenue will decrease and if the implementation of Tax Reforms
succeeds, then there is an expected increase in Collected Tax revenue. Our findings
reveal that, Tax Reform could be used as a strategy for increasing Tax Revenue
Collection in Tanzania and its inconformity with the expectations that tax reforms
increases Tax Revenue. These results are similar to (Asolu et al., (2012;
Kanyi&Kalui, 2014; Zeng et al., 2013; Muriithi&Moyi, 2003).
Also, the positive and statistically significant coefficient of GDP and Corruption
manifest that, the level of collected Tax Revenue depends highly on the economic
development of a specific country. GDP coefficient is positive and strong significant
indicating that, as the level of economic development improves the taxable capacity
of taxpayers and tax bases increases and thus the capacity for imposing and
collecting tax revenue increases. This is in conformity with the expectations of Tax
Revenue increase as GDP increases. The results are in line with Zeng et al. (2013)
and Gachanja (2012).
Again, corruption coefficient is positive and statistically significant. This is contrary
to the expectation of decreasing Tax revenue. This can be explained by an observed
increase in Corruption Perception Index (Decrease in corruption over the period
under study. The findings show openly that if the government puts more and
effective purposeful efforts in combating corruption, it would be possible for
Tanzania to Collect even more Tax Revenue in the near Coming future. The results
are in line with Tanzi and Devood,2000).

54
CHAPTER SIX
SUMMARY, CONCLUSION AND RECOMMENDATION
6.1 Introduction
This is the last chapter of this study and it covers the following parts; summary of the
findings, conclusion, recommendations, limitations of the study and recommendation
for further studies.
6.2 Summary of the findings
Trend analysis indicates that there is a positive trend of GDP over the period under
study as the GDP has been increasing over time. Though Tanzania is among the
highly corrupt countries, the trend analysis revealed that Tanzania corruption
perception index has been improving as compared to how it was in the early days
under the study period. Revenue, as witnessed in the trend analysis, has also been
increasing over the period under study. The trend analysis reveals there were no
reforms from 1998 to 2007.
Multiple regressions were run to predict revenue from GDP, Corruption and tax
reforms. The variables were statistically significant, F= 861.38, p<. 000.The
regression analysis results indicate that the independent variables Corruption, Tax
reforms and GDP are positively related to the dependent variable (Revenue). The
adjusted R square shows that independent variables influence the dependent variable
by 71%. The model is a good fit for the variables as it passed the F-test 861.38 and
significance (0.0000). The variable coefficients show there is an existence of a linear
relationship between dependent variables and independent variables where Tax
reforms, GDP and CPI has a positive coefficient of 1.122414, 0.498276 and
0.416657 respectively. Tax reforms, GDP and CPI positively influences the Tax
revenue collected and the relationship is significant (p= 0.000), (p=0.0557) and (p<
.000) respectively. This indicates that for every one-unit increase in Tax reforms,

55
GDP and CPI there is an expected increase of Revenue by 1.122414, 0.498276 and
0.416657 respectively.
6.3 Conclusion
The study indicates that Tax reforms, GDP and Corruption as measured in
Corruption perception index has a positive and significant influence on Tax revenue
collection in Tanzania. This indicates that a rise in Tax reforms, GDP and Corruption
Perception Index (decrease in Corruption) largely influenced a rise of collected Tax
Revenue in Tanzania from the year 1998-2017. As such the study concludes that,
Tax reforms, GDP and Corruption has a significant positive influence on collected
Tax Revenue in Tanzania.
The study adopted a study conducted in Kenya in the context of Tanzania to see
whether the results would be alike or similar taking into account the widened
research period, the use of different research design and different population and
geographical area. The study findings were alike in GDP and different in Tax
reforms and Corruption was found to influence Tax revenue in a negative direction.
6.4 Recommendations.
The government through its responsible organs should put in place measures to
improve the collection of tax revenue by gaining public trust through quality public
service, simple and easy taxation procedures in administration and payments,
provision of education to both taxpayers and tax officials and through improving the
tax administration by staffing and hiring of professionals.
The government of Tanzania through the responsible board should put in place
measures to stimulate more and more economic growth that in return will result in a
rise in collected tax revenue.
In spite of the existing war of corruption, Tanzania needs to put more strategies to
combat corruption so that the collected tax revenue will increase to a large extent that
the tax revenue collected will cover the government expenditure.

56
6.5 Limitation of the Study
Difficulties in data the accessibility. The researcher used secondary data in his study
and mainly online data. It was a tough job to go around several websites searching
for the actual data needed which consumed most of the researchers' time because the
data was not timely obtained. The researcher prioritized the research work to make
sure this does not alter the quality of the obtained findings.
The failure to use probability sampling. Because the study did not use probability
sampling techniques, this poses a limitation in generalizing the obtained results to
other countries as well.
6.6 Recommendation for further Studies.
Other researchers should take research on Tax systems in Tanzania to identify what
could be the possible reason for insufficient revenue to cover the government budget
since the performed study found out that reform has a positive effect on collected tax
revenue in Tanzania.
The upcoming researcher could consider carrying out the same research but with a
different design, that allows for generalization of the results of the research findings.

57
REFERENCES
Ade, M., Rossouw, J., &Gwatidzo, T. (2018). Determinants of tax revenue
performance in the Southern African Development Community (SADC)
(No. 762).
Adegbie, F. F., &Fakile, A. S. (2011). Topic company income tax and Nigeria
economic development. European Journal of Social Sciences, 22(2),
309-319.
Agbeyegbe, T. D., Stotsky, J., &WoldeMariam, A. (2006). Trade liberalization,
exchange rate changes, and tax revenue in Sub-Saharan Africa. Journal
of Asian Economics, 17(2), 261-284.
Ahmed, Q.M and Muhammad, S.D (2010). Determinants of TaxBuoyancy:
Empirical Evidence from Developing Countries. European Journal of
Social Sciences, 13(3), 408-418.
Arif, I., & Rawat, A. S. (2018). Corruption, governance, and tax revenue: evidence
from EAGLE countries. Journal of Transnational Management, 23(2-3),
119-133.
Asaolu et al, (2015) Impact of Tax Reforms on Revenue Generation in Lagos State: A
Time Series Approach, Research Journal of Finance and Accounting
Vol.6, No.8, p. 90- 94
Balatsky, E. V., &Ekimova, N. A. (2019). Evaluating scenarios of a personal income
tax reform in Russia. Journal of Tax Reform, 5(1), 6-22.
Bancal, J. D., Sheridan, L., &Scarani, V. (2014). More randomness from the same
data. New Journal of Physics, 16(3), 033011.
Barro, R. J., & Furman, J. (2018). Macroeconomic effects of the 2017 tax reform.
Brookings papers on economic activity, 2018(1), 257-345.

58
Bhattarai, K., Head, M., Haughton, J., &Tuerck, D. G. (2017). Simulating corporate
income tax reform proposals with a dynamic CGE model. International
journal of economics and finance, 9(5).
Bonga, W. G. (2017). Empirical Examination of the Link between Value Added Tax
and Total Tax Revenues in Zimbabwe. DRJ's Journal of Economics &
Finance, 2(8), 05-14.
Boukbech, R., Bousselhami, A., &Ezzahid, E. (2018). Determinants of tax revenues:
Evidence from a sample of Lower Middle-Income countries. Applied
Economics and Finance, 6(1), 11-20.
Budget.https://economictimes.indiatimes.com/definition/gross-domestic-product
Castiglione, C., Infante, D., & Smirnova, J. (2018). Non-trivial factors as
determinants of the environmental taxation revenues in 27 EU countries.
Economies, 6(1), 7.
Castro, G. Á., & Camarillo, D. B. R. (2014). Determinants of tax revenue in OECD
countries over the period 2001–2011. Contaduría y administración,
59(3), 35-59.
Chauke, K. R., Sebola, M. P., & Mathebula, N. E. (2017). Reflection on the ability to
pay theory of taxation in the context of South African Municipalities.
International Conference on Public Administration and Development
Alternatives (IPADA).
Epaphra, M., &Massawe, J. (2017). Corruption, governance and tax revenues in
Africa. Business and Economic Horizons, 13(4), 439-467,
http://dx.doi.org/10.15208/beh.2017.31
Fitzsimons, V. G. (2007). Economic models of corruption. In Corruption and
development (pp. 46-74). Palgrave Macmillan, London.
Fjeldstad H-O and Rakner L, (2003) Taxation and tax reforms in developing
countries Illustrations from sub-Saharan Africa.pg 7-8

59
Fjeldstad O-H, (1995) Taxation and Tax Reforms in Tanzania: A Survey WP 4.pg 12
Fjeldstad O-H, (2014). Tax and Development: Donor Support to Strengthen Tax
Systems in Developing Countries. Wiley Online Library, Norway, pg 183
Gachanja D, (2012) The Effect of Tax Reforms and Economic Factors on Tax
Revenues in Kenya.
Galbraith, J. K. (2019). Sparse, inconsistent and unreliable: Tax records and the
World Inequality Report 2018. Development and Change, 50(2), 329-
346.
Garikai, B.W. (2009). An empirical Analysis of the Determinantsof Tax Buoyancy in
Developing Nations. An experience from the SADCEconomies using
Panel Data Analysis. MSc thesis, University of Zimbabwe: Department of
Economics, Faculty of social studies,University of Zimbabwe.
Gupta, S.A. (2007). Determinants of Tax Revenue Efforts in Developing Countries.
IMF Working Paper WP/07/184. Washington D.C.
Hines Jr, J. R. (2017). Business tax burdens and tax reform. Brookings Papers on
Economic Activity, 2017(2), 449-477.https://www.thebalance.com/what-
is-the-laffer-curve-explanation-3305566 10:25AM 8/5/2020
https://businessjargons.com/secondary-data-collection-methods.html
Iglesias, R. M. (2016). Increasing excise taxes in the presence of an illegal cigarette
market: the 2011 Brazil tobacco tax reform. RevistaPanamericana de
Salud Publica, 40, 243-249.
Imam, P. A., & Jacobs, D. (2014). Effect of corruption on tax revenues in the Middle
East. Review of Middle East Economics and Finance, 10(1), 1-24.
Jelilov, G., Abdulrahman, S., &Isik, A. (2015). The impact of tax reforms and
economic growth in Nigeria. The Empirical Economics Letters, 1100-
1115.

60
Jibao, S., & Prichard, W. (2016). Rebuilding local government finances after
conflict: Lessons from a property tax reform programme in post-conflict
Sierra Leone. The Journal of Development Studies, 52(12), 1759-1775.
Joss, M. C. (2016). An Assessment of Tax Policy Reform and Revenue Growth in
Liberia: 2005–2015.
Kaanan Q (2000), Tanzania's Experience with Trade Liberalization, Economic and
Development, A quarterly magazine of the IMF. Vol 37, No.2
https://www.imf.org/external/pubs/ft/fandd/2000/06/kanaan.htm
Kanyi P and Kalui F, (2014), The effects of tax policy reforms on tax revenue in
Kenya Journal of Management, Vol. 2 (31), pg 616.
Karingi, S. N., &Wanjala, B. (2005). The Tax Reform Experience of Kenya. United
Nations University. World Institute for Development Economic Research.
Research Paper, (2005/67), UNU-WIDER, Helsinki.
Kinyua N.G (2018) The Effect of I – tax on The Buoyancy of Tax Revenues in Kenya
Tax System.
Kothari C, R(2004), Research Methodology Methods and techniques, 2nded, New
Age International (P) Ltd., Publishers, New Delhi
Lee, Y., & Gordon, R. H. (2005). Tax structure and economic growth. Journal of
public economics, 89(5-6), 1027-1043.
Liu, H., Chen, Z., Wang, J., & Fan, J. (2017). The impact of resource tax reform on
China's coal industry. Energy Economics, 61, 52-61.
Livoi, G. M. (2017). The effect of tax reforms on corporate tax compliance to Kenya
Revenue Authority (Doctoral dissertation, KCA University).
Mackey A and Gass S, (2005) Second Language Research Methodology and Design,
Lawrence Erlbaum Associates, New Jersey.
61
Makamme, K. F. (2015). An assessment of the Impact of the VAT and Revenue
Collection on GDP: The Case of Zanzibar Revenue Board (Doctoral
dissertation, The Open University of Tanzania).
Malima, A. (2013). Enhancing Income Tax Collection in SMEs Customers
Perspective: A Case of Tanzania Revenue Authority (TRA), Kinondoni
(Doctoral dissertation, Mzumbe University).
Mbatia, C. N. (2018). Effect of foreign aid dependency on taxation revenue in Sub-
Saharan Africa (Doctoral dissertation, University of Cape Town).
Menichini, A. A. (2020). How do firm characteristics affect the corporate income tax
revenue? International Review of Economics & Finance, 65, 146-162.
Mirrlees, J. A. (1976). Optimal Tax Theory: A Synthesis, 6 J. Pub. Econ, 327, 341-
44.
Morales, L. F., & Medina, C. (2017). Assessing the effect of payroll taxes on formal
employment: The case of the 2012 tax reform in Colombia. Economía,
18(1), 75-124.
Munene R and Ndururu D, (2016) Effect of Tax Reforms on Revenue Collection at
the Customs and Border Control Department of Kenya Revenue
Authority. IOSR Journal of Business and Management (IOSR-JBM),
Volume 18, Issue 4.Ver. II Apr., pg 63,65-66
Muriithi M and Moyi E, (2003) Tax reforms and revenue mobilization in Kenya. The
African Economic Research Consortium, Nairobi, research paper, no.131
May pg 20.
Muzurura, J., &Sikwila, D. R. N. (2018). Taxation, Private Fixed Domestic
Investment Behaviour and Zimbabwe’s Economic Growth. American
Journal of Humanities and Social Sciences, 2(5), 26-39.

62
Mwakalobo, A. B. S. (2009). Economic reforms in East African countries: The
impact on government revenue and public investment. Open Access
Dissertations, 66.
Ndirangu, M.E (2014) The Effect of Taxpayer Education on Value Added Tax
Compliance by Motor Vehicle Part Dealers in Nairobi Central Business
District
OECD.https://www.oecdilibrary.org/taxation/taxrevenue/indicator/english_d988cf5-
en
Ombati, N. A. (2018). The effect of tax reforms on the efficiency of revenue
collection in Kenya (Doctoral dissertation, University of Nairobi).
Ossoro N, (1993) Revenue productivity implications of tax reform in Tanzania.
Centre for the Study of African Economies, University of Oxford,
London.Pg,1,8-9
Ossoro N, (1995). Tax reforms in Tanzania: Motivations, directions, and
implications. The African Economic Research Consortium. Nairobi,
Kenya.pg 2-3
Ouma, D. (2019). Revenue Effects of Tax Reforms, Economic Growth and Political
Environment in Kenya. African Journal of Economic Review, 7(1), 136-
153.
Owolabi, S. A., &Okwu, A. T. (2011). Empirical evaluation of contribution of value
added tax to development of Lagos State economy. Middle Eastern
Finance and Economics, 1(9), 24-34.
Palil, M.R. and Mustapha, A.F. (2011). Determinants of tax compliance in Asia: A
case of Malaysia. European Journal of Social Sciences,24(1).
Prichard, W., Custers, A., Dom, R., Davenport, S., &Roscitt, M. (2019). Innovations
in Tax Compliance: Conceptual Framework. The World Bank. Revenue
Authority. Wiley InterScience. Public Admin. Dev. 23, 166
63
Rosoiu, I. (2015). The impact of the government revenues and expenditures on the
economic growth. Procedia Economics and Finance, 32, 526-533.
Singh YK, (2006) Fundamentals of Research Methodology and Statistics, New Age
International (P) Limited, Publishers, New Delhi
Smith, A (2005) An Inquiry into The Nature and Causes of The Wealth of Nations.
An Electronic Classics Series Publication
Sorenson, (2010) The theory of optimal taxation: New developments and policy
relevance. pg242
Sulak, F., Doğanaksoy, A., Ege, B., &Koçak, O. (2010, September). Evaluation of
randomness test results for short sequences. In International Conference
on Sequences and Their Applications (pp. 309-319). Springer, Berlin,
Heidelberg.
Tanzania Budget Speech (2018/19), The estimates of government revenue and
expenditure for 2018/19. pg 27
Tanzi, V, and Davoodi H.R, (2000) Corruption, Growth, and Public Finances.
Political Economy of Corruption. IMF Working paper no. 00/182 Tax
reforms. https://en.wikipedia.org/wiki/Tax_reform, 4:22 PM. 30/01/2019.
Transparency International. What is
Corruption?https://www.transparency.org/en/what-is-corruption. May
13,2020.
Unegbu, A. O., &Irefin, D. (2011). Impact of VAT on economic development of
emerging nations. Journal of Economics and International Finance, 3(8),
492-503.
Unpan, (2019) Tanzania revenue authority, Aapam award for innovative
management TRA reforms and modernization efforts. Pg 6.
http://unpan1.un.org/intradoc/groups/public/documents/aapam/unpan032
895.pdf 3:45 pm,30/01/2019
64
Wawire, N. (2017). Determinants of value added tax revenue in Kenya. Journal of
Economics Library, 4(3), 322-344.
World Bank (2015), Tax Reforms Are Necessary to Help Tanzania Finance
Development and Solidify Economic Growth.
ttp://www.worldbank.org/en/news/press-release/2015/07/03/tax-reforms-
are-necessary-to-help-tanzania-finance-development-and-solidify-
economic-growth Dar es Salaam, July 3
Zeng, K., Li, S., & Li, Q. (2013). The impact of economic growth and tax reform on
tax revenue and structure: Evidence from China experience. Modern
Economy, 2013.
Zhang, L., Chen, Y., & He, Z. (2018). The effect of investment tax incentives:
evidence from China’s value-added tax reform. International tax and
public finance, 25(4), 913-945.

65
APPENDIXES
Table 1.1: Budget Deficits from 1998 to 2017 as percentage of GDP Year GDP
1998 0.13
1999 1.14
2000 0.73
2001 0.41
2002 0.73
2003 1.78
2004 2.43
2005 3.28
2006 3.39
2007 1.44
2008 1.92
2009 4.42
2010 4.7
2011 3.51
2012 4.06
2013 3.81
2014 2.91
2015 3.17
2016 2.08
2017 2.16
Source: Country economy .com
1998 to 2007 represents before reform period
2008 to 2017 represents after reform period