determinants of weee recycling behaviour in romania: a...
TRANSCRIPT

Int. J. Environ. Res., 8(2):353-366,Spring 2014ISSN: 1735-6865
Received 10 July 2013; Revised 20 Aug. 2013; Accepted 10 Sep. 2013
*Corresponding author E-mail: [email protected]
353
Determinants of WEEE Recycling Behaviour in Romania:A fuzzy Approach
Colesca, S.E.1* Ciocoiu, C.N.2 and Popescu, M. L.3
1Research Centre in Public Administration and Public Services, Academy of Economic Studies,Calea Serban Voda 22-24, Bucharest, Romania
2Department of Management, Academy of Economic Studies, Piata Romana 6, Bucharest, Romania3Doctoral School, Academy of Economic Studies, Calea Serban Voda 22-24, Bucharest, Romania
ABSTRACT: High levels of WEEE and limited capacities for disposal and recycling, together with thenecessity to transpose the European legislation into national law have shaped the profile of WEEE system inRomania. In order to improve the functionality of this system it is important to understand the citizens’behaviour towards WEEE recycling. Recent research conducted in different countries suggest that variousdeterminants, such as socio-economic and demographic factors, environmental knowledge, habits, conve-nience, motivations, can be used to analyse WEEE recycling behaviour. The results are contradictory anddemonstrate that the peculiarities of each country have different influences on how people engage in WEEEcollection and recycling. In the present paper, using hypotheses testing we have developed a WEEE recyclingbehaviour model for Romanians. It was assumed that socio-demographic factors and personal norms wouldpredict WEEE recycling attitude and attitude, contextual forces, knowledge and recycling habits would influ-ence WEEE recycling behaviour. The data, gathered using a survey, were processed using a fuzzy approach.The results showed that in the Romanian context the strongest determinants of WEEE recycling behaviour arepeople attitudes and habits. Moderate effects have recycling knowledge, pro-environmental norms and insti-tutional support, while gender, income, perception of availability of collection points and regulations haven’tany influence.
Key words: Recycling,WEEE, Pollution, Environment
INTRODUCTIONThe first concerns regarding WEEE emerged in
Romania after the year 2000 and were intensified afterthe accession to European Union on 1 January 2007.The emergence of EU regulations governing themanagement of WEEE (Directive 2002/96/EC (EC, 2003a)and Directive 2002/95/EC (EC, 2003b)) triggered a seriesof actions to implement the directives into national law.Since 2005, later than in other European countries, havebeen initiated specialized studies in the field (Fessé,2007).
An important problem facing the WEEE decisionmakers is to meet the target regarding the annualcollection rate. The new directive 2012/19/EU introduceshigher WEEE collection targets. Beginning with 2019EU member states have to recycle 85% of the WEEEgenerated on their territory or 65 % of the averageweight of equipment placed on the market in the three
preceding years (EC, 2012). According to a reportdeveloped by the Romanian Environmental ProtectionAgency (REPA, n.d.), in 2010 Romania had an annualWEEE collection rate of 1.4 kilograms per capita, avery small value, compared to the target imposed byregulations (4 kg / inhabitant).
The total EEE quantity existing in the Romanianhouseholds is around 25/30 kg/capita and the averageuse of the most equipments is higher than in otherEuropean countries (Gfk, 2011). Over 50% of thepopulation uses electronic equipments and appliancesuntil they break (Gfk, 2011). Exceptions are the mobilephones and the computers, which are replaced as newmodels with more performances are launched on themarket. Under these conditions, the Romanianhouseholds possess huge amounts of historic WEEE.A survey realized by Daedalus Millward Brown in 2011for ECOTIC and RECOLAMP (two associations that

354
Colesca, S.E. et al.
have taken the responsibilities of the manufacturersof electrical and electronic equipments) has shown that33.40% of the households in the urban areas possessnon functional WEEE (a decreasing rate compared to65.80% as it was in 2008). Although nobody surveyedrural communities, the socio-economic conditions ofthe inhabitants living in these areas lead to theassumption that the amounts of non-functional WEEEare much higher. Important factors in the genesis ofthese negative issues are the low level of educationconcerning WEEE and the lack of information regardingthe collection methods and collection points (Ciocoiuet al., 2010a, Ciocoiu et al., 2010b, Tartiu, 2011b). Theeconomic crisis had also an impact, people holding oldequipments in use for a longer period. To improveWEEE recycling, different programs have been initiated,including the extension of the network of WEEEcollection facilities, more frequent drop-off specialevents and retail collection programs.
Studies on the attitudes and behaviour ofindividuals or households towards WEEE recyclinghave been realized in the last 10-15 years. Among thepioneers in the field were Cooper and Mayers (2000) inUnited Kingdom. They investigated the WEEEconsumer attitude regarding the acquisition, use anddisposal of household appliances using face-to-faceinterviews and focus groups. Some conclusion of theirlarge study are that men and people of higher socio-economic status are more concerned about productsbecoming obsolete, while women and people of lowersocio-economic status are more concerned about costs.In terms of waste disposal services, householders wereinfluenced by convenience of collection and thepossibility to obtain some financial incentive whenreturn a product.
Another study for United Kingdom (conductedin Cardiff) was made by Darby and Obara (2005). Usinga large-scale postal questionnaire and semi-structuredinterviews they analysed household waste behaviourand attitudes towards the disposal of small EEE. Thefindings highlighted the lack of awareness regardingsmall items of WEEE and the special attitudinal issuesgenerated by their size and complexity.
Saphores et al. (2006) analysed in California thehousehold willingness to recycle e-waste at drop-offcentres. The findings have shown that convenienceand familiarity with recycling other waste, gender, age,and environmental beliefs are important determinantsof the willingness to recycle WEEE, while income andpolitical affiliation haven’t any influence.
Nixon and Saphores (2007) designed a studyapplied to 357 Californian households, with the goalto analyse people’s willingness to pay for the expansion
of the WEEE recycling infrastructure. The mostsignificant factors in explaining people’s willingnessto pay an advanced recycling fee for electronics were:age, income, beliefs about government and businessroles in protecting the environment, proximity to anexisting recycling centre, level of education, andenvironmental attitudes.
Gurauskienė (2008) analysed the main factors ofthe willingness to use electric and electronicequipments in a sustainable way and to participate inthe WEEE recycling. According to the author, the basicvariables in the analysis of WEEE household recyclingare: attitude, motivation, knowledge and behaviour.The success of the reduction of WEEE amounts andconsumer engagement in collecting old equipmentsdepends on finding ways to “close the loop”, to ensurethat discarded equipments are reused or recycled tomake new equipments. The conclusion was thateducation and information are the main tools to changethe attitude towards e-waste and involvement inacquiring habits to segregate e-waste from regularwaste.
Nixon et al. (2009) investigated the preferencesfor different types of e-waste recycling programs inCalifornia highlighting the impact of environmentalattitudes and beliefs on willingness to pay forrecycling. The authors designed four alternatives ofmodels based on interactions between 10 key variables.These variables include the costs and convenience ofrecycling, individual characteristics (such as age,ethnicity, gender), factors reflecting environmentalquality attitude and the beliefs about the role ofbusinesses and individuals in protecting theenvironment. They founded that environmentalattitudes and beliefs are statistically significant forwillingness to pay for e-waste recycling. Educationbecomes statistically significant when environmentalattitudes and beliefs are not included in the model.
Nnorom et al. (2009) analysed the willingness ofNigerians to participate in WEEE recycling, takingmobile phone recycling as a case study. The results ofa principal component analysis highlighted thatNigerians are willing to pay for green cell phones, themain drivers for this behaviour being age, generalawareness and concern about environment and thegeneral attitude towards the environment.
Wang et al. (2011) analysed the determinants ofbehaviour and willingness to participate in WEEErecycling for Beijing residents. The results of theirregression model, tested on 957 respondents, indicatedthat people living in Beijing are not very willing toparticipate in e-waste recycling. The main identifieddrivers of WEEE behaviour were: recycling habits,

Int. J. Environ. Res., 8(2):353-366,Spring 2014
355
economic benefits, residential conditions andconvenience of recycling facilities. The otherinvestigated factors, like environmental awareness,education, income and knowledge of environmentallaws haven’t been found to be statistically significant.
A national survey of U.S. households made bySaphores et al. (2012) has shown that the strongestpredictors of willingness to recycle WEEE are thepersonal/moral norms, environmental beliefs and socialexpectations. Other variables like gender, marital status,recycling convenience, knowledge of the potentialtoxicity of WEEE and prior e-waste recycling experiencehave a smaller impact, while familiarity to recycleconventional household waste, knowledge of e-wastelaws, household income, family size, and living in arural area don’t matter in explaining householdbehaviour.
Recently, Song et al. (2012) investigated thebehaviour, attitude and willingness to pay for WEEErecycling for people in Macaw. Using a logisticregression model the authors found that educationlevel, age and household income were significantfactors affecting WEEE behaviour.
Table 1. Determinants of WEEE recycling behaviour
Factor Question
Socio – econo mic a nd demographic fa ctors
Age Possible values: < 30; 30-45; 45-60 ; >6 0
Education Possible values: Middle school or less; High school; College or more
Income Possible values: < 500 RO N; 500-1 500 RON; 150 0-2500 RON; 2500-3500 RON; >3500 RO N
Gender Possible values: Male/Female
Household size Possible values: 1; 2; 3-4; >=5. Contextua l forces
Institutional support Do you consid er that there is institutional suppor t for the WE EE recycling?
Perception of availability of W EEE collection p oints
Ho w much do you appreciate that the network of W EEE collection points is developed ?
Perception of W EEE regulations
Do you appreciate that WEEE regulatio ns are clear and appropriate?
Personal norms
Pro-environmental norms Ho w much do you consider the effects on the environment when purchasing EEE?
K no wledge W EEE recycling knowledge Ho w better d o you know how to proper ly recycle W EEE?
H abits
Recycling habits Ho w often your family recycles waste (of any kind)? Attitud e tow ards WEEE recycling T o what extent do you agree with the idea of recycling WEE E? W EEE recycling behaviour Ho w often you recycle W EEE?
MATERIALS & METHODSTo enhance the efficacy of measures for stimulation
of WEEE recycling behaviour, it is essential toinvestigate the personal characteristics of those whoare inclined to recycle (Rode, 2012). Thus, the purposeof the research was to identify the determinants ofWEEE recycling behaviour in the Romanian context.In order to achieve the objective of the research, wehave synthesized a list of 13 variables that wereconsidered important for the analysis (Table 1). Toassess the intensity of each variable we have identifiedan associated question (Table 1).
Based on the selected factors was designed aWEEE recycling behaviour model (Fig. 1) composedby two main parts: attitudinal determinants andbehavioural determinants. Because many studies haveproven that structural variables, such as socio-demographics and specific personal beliefs, norms andvalues influence attitude and indirectly the behavior(Fishbein and Ajzen, 1975; Schwartz, 1970; Bortoletoet al., 2012), in the attitudinal determinants we haveincluded the age, income, education, gender, householdsize and the pro-environmental norms. In conformity

356
with Stern’s model (Stern 2000), the behaviouraldeterminants have comprised attitude, contextualforces, knowledge and recycling habits. The proposedmodel considered the existence of an attitude-behaviour gap.
To test the model 12 hypotheses were defined:H1:There is a relation between age and WEEE attitudeH2:There is a relation between education and WEEEattitudeH3:There is a relation between income and WEEEattitude.H4:There is a relation between gender and WEEEattitude.H5:There is a relation between household size andWEEE attitude.H6:There is a relation between pro-environmental normsand WEEE attitude.H7:There is a relation between WEEE attitude andWEEE recycling behaviour.H8:There is a relation between recycling habits andWEEE recycling behaviour.H9:There is a relation between WEEE knowledge andWEEE recycling behaviourH10:There is a relation between institutional supportand WEEE recycling behaviour
H11:There is a relation between perception ofavailability of collection points and WEEE recyclingbehaviour.H12:There is a relation between the perception ofWEEE regulation and WEEE recycling behaviour.
The aim was to test the hypotheses and determinethe strength of the relationships between variables.To meet this goal we conducted a fuzzy statisticalanalysis. A questionnaire composed of 34 questionswas designed to gather the data. The questionnairewas structured in three main parts. The first partextracted the socio-demographic features: gender, age,education, income, household size, profession, placeand type of residence. The second part comprisedquestions concerning various WEEE recyclingbehaviour determinants. Each item in the second partof the questionnaire was measured using a 100 pointsscale. These items, together with the socio-demographic variables were used in hypothesestesting. In the third part of the questionnaire wereintegrated additional questions with the goal to extractthe main incentives and barriers concerning thetransformation of WEEE attitude in WEEE behaviour.
Based on the questionnaire, a survey wasconducted in Romania in November - December 2012.
Fig. 1. WEEE recycling behaviour model
WEEE Recycling
357
Int. J. Environ. Res., 8(2):353-366,Spring 2014
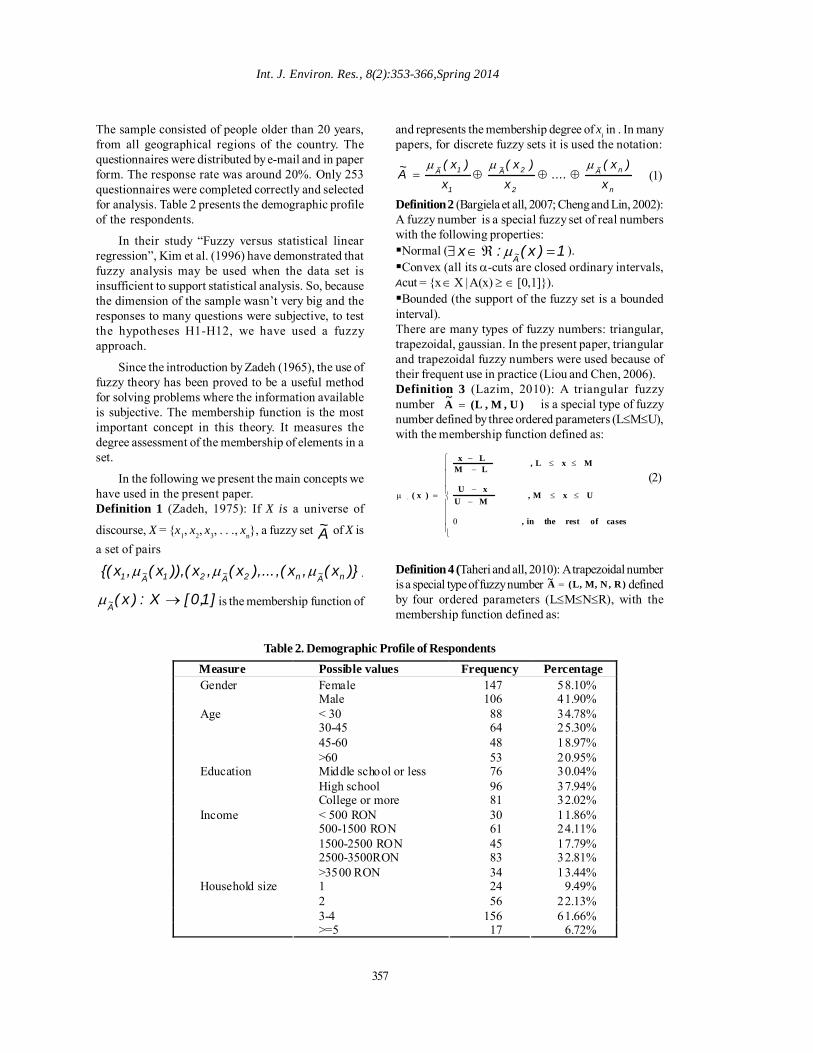
The sample consisted of people older than 20 years,from all geographical regions of the country. Thequestionnaires were distributed by e-mail and in paperform. The response rate was around 20%. Only 253questionnaires were completed correctly and selectedfor analysis. Table 2 presents the demographic profileof the respondents.
In their study “Fuzzy versus statistical linearregression”, Kim et al. (1996) have demonstrated thatfuzzy analysis may be used when the data set isinsufficient to support statistical analysis. So, becausethe dimension of the sample wasn’t very big and theresponses to many questions were subjective, to testthe hypotheses H1-H12, we have used a fuzzyapproach.
Since the introduction by Zadeh (1965), the use offuzzy theory has been proved to be a useful methodfor solving problems where the information availableis subjective. The membership function is the mostimportant concept in this theory. It measures thedegree assessment of the membership of elements in aset.
In the following we present the main concepts wehave used in the present paper.Definition 1 (Zadeh, 1975): If X is a universe of
discourse, X = {x1, x2, x3, . . ., xn}, a fuzzy set A~ of X isa set of pairs
)}x(,x(,...),x(,x()),x(,x{( nA~n2A~21A~1 µµµ .
]1,0[X:)x(A~
→µ is the membership function of
Table 2. Demographic Profile of RespondentsMeasure Possible values Frequency Percentage
Female 147 58.10% Gender Male 106 41.90% < 30 88 34.78% 30-45 64 25.30% 45-60 48 18.97%
Age
>60 53 20.95% Middle school or less 76 30.04% High school 96 37.94%
Education
College or more 81 32.02% < 500 RON 30 11.86% 500-1500 RON 61 24.11% 1500-2500 RON 45 17.79% 2500-3500RON 83 32.81%
Income
>3500 RON 34 13.44% 1 24 9.49% 2 56 22.13% 3-4 156 61.66%
Household size
>=5 17 6.72%
and represents the membership degree of xi in . In manypapers, for discrete fuzzy sets it is used the notation:
Definition 2 (Bargiela et all, 2007; Cheng and Lin, 2002):A fuzzy number is a special fuzzy set of real numberswith the following properties:Normal ( ).Convex (all its α-cuts are closed ordinary intervals,
Acut = {x ∈ X | A(x) ≥ ∈ [0,1]}).Bounded (the support of the fuzzy set is a bounded
interval).There are many types of fuzzy numbers: triangular,trapezoidal, gaussian. In the present paper, triangularand trapezoidal fuzzy numbers were used because oftheir frequent use in practice (Liou and Chen, 2006).Definition 3 (Lazim, 2010): A triangular fuzzynumber is a special type of fuzzynumber defined by three ordered parameters (L≤M≤U),with the membership function defined as:
Definition 4 (Taheri and all, 2010): A trapezoidal numberis a special type of fuzzy number definedby four ordered parameters (L≤M≤N≤R), with themembership function defined as:
(1)n
nA~
2
2A~
1
1A~
x)x(
....x
)x(x
)x(A~
µµµ⊕⊕⊕=
1)x(:xA~
=ℜ∈∃ µ
)U,M,L(A~
=
(2)
⎪⎪⎪⎪
⎩
⎪⎪⎪⎪
⎨
⎧
≤≤−−
≤≤−−
=µ
casesofrestthein,
UxM, MUxU
MxL, LM
Lx
)x(A ~
0
)R,N,M,L(A~ =
358
Colesca, S.E. et al.
(3)
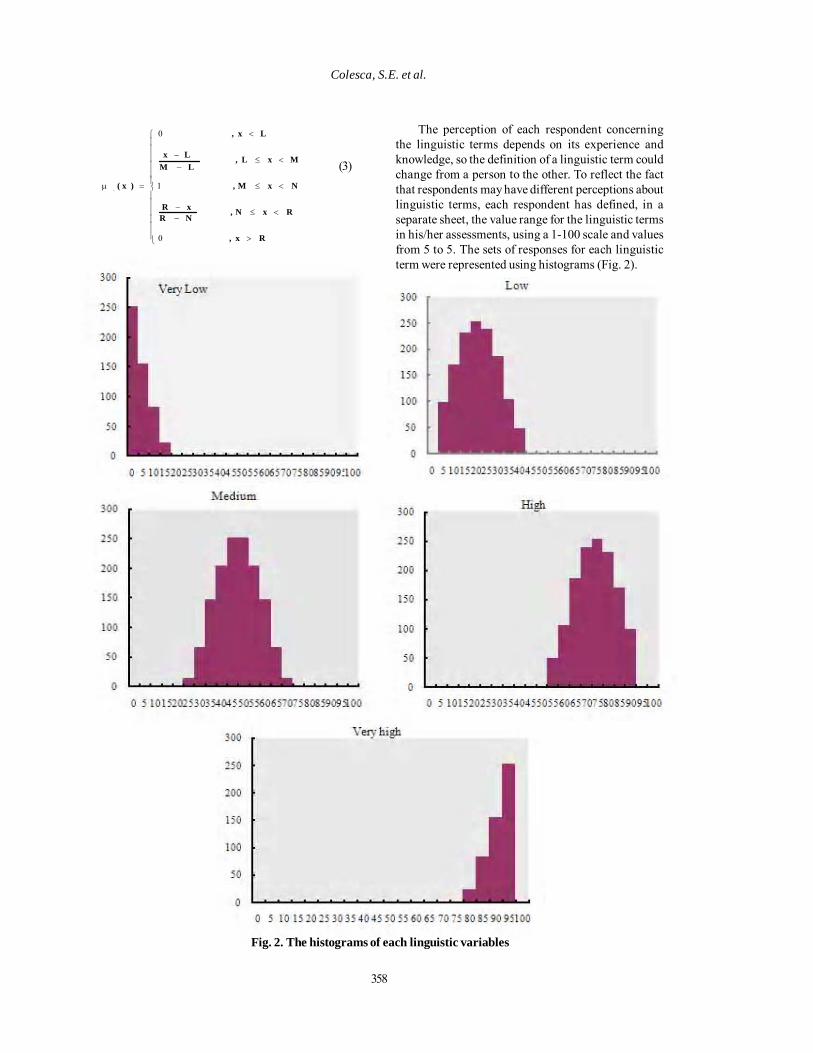
The perception of each respondent concerningthe linguistic terms depends on its experience andknowledge, so the definition of a linguistic term couldchange from a person to the other. To reflect the factthat respondents may have different perceptions aboutlinguistic terms, each respondent has defined, in aseparate sheet, the value range for the linguistic termsin his/her assessments, using a 1-100 scale and valuesfrom 5 to 5. The sets of responses for each linguisticterm were represented using histograms (Fig. 2).
⎪⎪⎪⎪⎪⎪
⎩
⎪⎪⎪⎪⎪⎪
⎨
⎧
>
<≤−−
<≤
<≤−−
<
=µ
Rx,
RxN, NRxR
NxM,
MxL, LM
Lx
Lx,
)x(A~
0
1
0
Fig. 2. The histograms of each linguistic variables

359
Int. J. Environ. Res., 8(2):353-366,Spring 2014
Based on the histograms, the Very Low and VeryHigh linguistic terms was characterized by trapezoidalfuzzy numbers, and Low, Medium and High bytriangular fuzzy number.For triangular fuzzy numbers we have used the followingrule: if (Li,Ui)A, is the response of the ith respondent forthe A~ linguistic term (i=1..n, n=number of respondents),
then in..iA~ LminL1=
= , in..iA~ UmaxU1=
= and A~M = the
integer mean of the interval with the most number ofresponses.For trapezoidal fuzzy numbers we have used thefollowing rule: if (Li,Ui)A, is the response of the ith
respondent for the linguistic term (i=1..n, n=number of
Table 2. Demographic Profile of Respondents
Measure Possible values Frequency Percentage Female 147 58.10% Gender Male 106 41.90% < 30 88 34.78% 30-45 64 25.30% 45-60 48 18.97%
Age
>60 53 20.95% Middle school or less 76 30.04% High school 96 37.94%
Education
College or more 81 32.02% < 500 RON 30 11.86% 500-1500 RON 61 24.11% 1500-2500 RON 45 17.79% 2500-3500RON 83 32.81%
Income
>3500 RON 34 13.44% 1 24 9.49% 2 56 22.13% 3-4 156 61.66%
Household size
>=5 17 6.72%
respondents), then , , and equalled the minimum andmaximum of the interval with the most number ofresponses.The final calculations for the values of fuzzymembership function of each linguistic term are shownin Table 3. Fig. 3 shows the graphical representationof the membership function for linguistic terms.
Each respondent has its own perceptions andopinions in the evaluation of each statement. The useof the membership function to represent therespondent degree of its feelings will give better results.So the next step was the fuzzification of eachrespondent response.
Let’s note with Rij the rating made by respondenti to the statement j. Rij, a crisp value, has partial
Fig. 3. Membership function for linguistic variables
µ a(x
)
360
WEEE Recycling
memberships in various linguistic terms. Themembership in a linguistic term could be calculatedusing the rules defined in (2) and (3). For exampleµVL(35)=0, µL(35)=0.43, M(35)=0.25, µH(35)=0.0,µVH(35)=0.0 (Fig.2). If L={VL, L, M, H, VH} is the set oflinguistic terms, the fuzzy number of Rij is
VH)(Rµ
H)(Rµ
M)(Rµ
L)(Rµ
VL)(Rµ
)µ(R ijVHi jHi jMi jLi jVL
i j⊕⊕⊕⊕=
(4)
For hypotheses testing we have used themethodology proposed by Nguyen and Wu (2006) in“Fundamentals of Statistics with Fuzzy Data”. In thefollowing we present the definitions of the main lemmasused in the analysis.
Lemma 1 (Yao, and Huang, 2004): If L={L1,...,Lk}is a set of k-linguistic variables on a discussion domainU, and
a sequence of random fuzzy sample on U, the fuzzysample mean is defined by:
⎭⎬⎫
⎩⎨⎧
=⊕⊕= n..1i,L
)x~(...
L)x~(
)x~(k
iL
1
iLi
k1µµ
µ
k
n
1iiL
1
n
1iiL
L
)x~(n1
.. .L
)x~(n1
)X~(k1 ∑∑
== ⊕⊕=µµ
µ
(5)
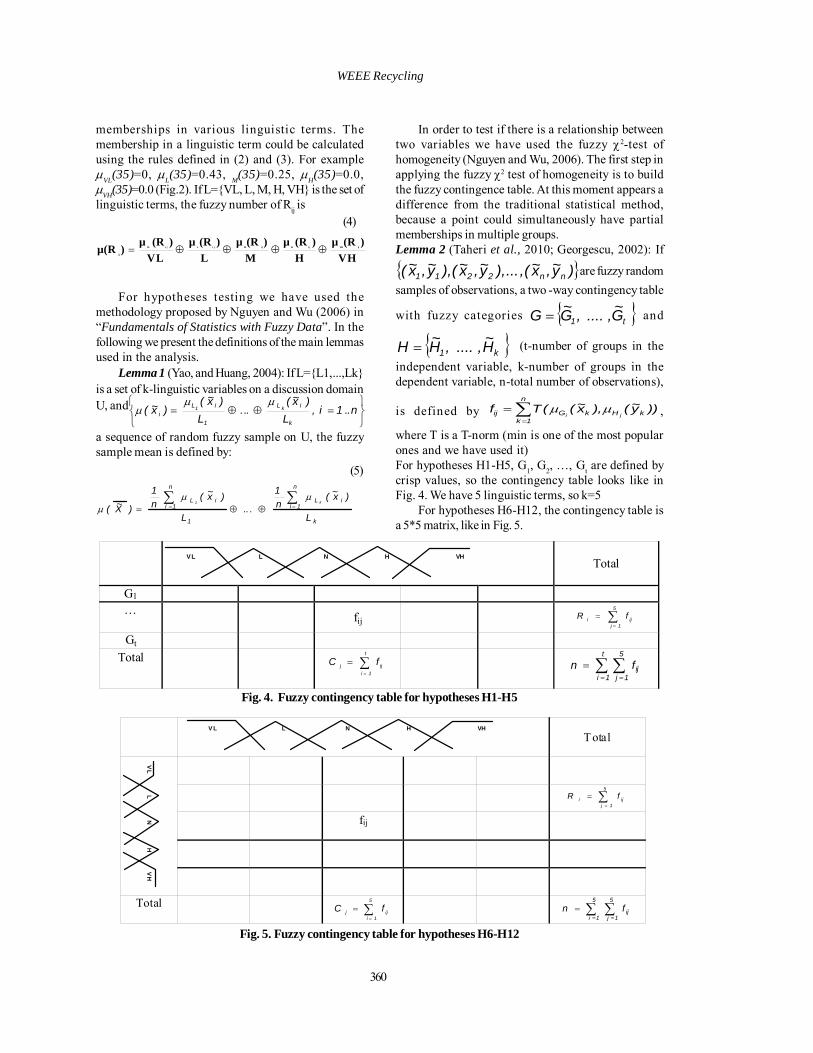
In order to test if there is a relationship betweentwo variables we have used the fuzzy χ2-test ofhomogeneity (Nguyen and Wu, 2006). The first step inapplying the fuzzy χ2 test of homogeneity is to buildthe fuzzy contingence table. At this moment appears adifference from the traditional statistical method,because a point could simultaneously have partialmemberships in multiple groups.Lemma 2 (Taheri et al., 2010; Georgescu, 2002): If
{ })y~,x~(,...),y~,x~(),y~,x~( nn2211 are fuzzy randomsamples of observations, a two -way contingency table
with fuzzy categories { }t1 G~,....,G~G = and
{ }k1 H~,....,H~H = (t-number of groups in the
independent variable, k-number of groups in thedependent variable, n-total number of observations),
is defined by ))y~(,)x~((Tf kH
n
1kkGij ji
µµ∑=
= ,
where T is a T-norm (min is one of the most popularones and we have used it)For hypotheses H1-H5, G1, G2, …, Gt are defined bycrisp values, so the contingency table looks like inFig. 4. We have 5 linguistic terms, so k=5
For hypotheses H6-H12, the contingency table isa 5*5 matrix, like in Fig. 5.
Total
G1 … fij
∑=
=5
1jiji fR
Gt Total ∑
=
=t
1iijj fC ∑ ∑
= ==
t
1i
5
1jijfn
VL L N H VH
Fig. 4. Fuzzy contingency table for hypotheses H1-H5
Total
∑=
=5
1jiji fR
fij
Total ∑=
=5
1iijj fC ∑ ∑
= ==
5
1i
5
1jijfn
V L L N H VH
VL
LN
HV
H
Fig. 5. Fuzzy contingency table for hypotheses H6-H12

361
Int. J. Environ. Res., 8(2):353-366,Spring 2014
For each hypothesis we defined the nullhypothesis H0: The analysed variables are statisticallyindependent (no significant relationship), and Ha: Thevariables are related.
Based on contingency tables we calculated χ2
using lemma 4 (Nguyen and Wu, 2006)
If χ2≥χ2α(t-1)*(k-1) under the significance level α, then H0
is rejected.
The χ2 test shows only if there is a statisticalrelationship between two variables, but doesn’tevaluate the relative strength of it. To measure thecorrelation between two variables we have used the τGoodman Kruskal measure of association (Reynolds,1984) (7). If τ equals zero there is no association betweenvariables, if equals 1 there is a perfect association.
Where results indicated a relationship betweentwo variables, in order to analyse which groups of theindependent variable caused the resulted behaviour,we have calculated the adjusted standardized residuals(ASRij) (Argesti, 2002).
A larger absolute value of the adjustedstandardized residual shows a more significantassociation between the analysed variables.
RESULTS & DISCUSSIONTable 4 summarizes the results of χ2 tests for
hypotheses H1-H12: 8 hypotheses are supported and
nC*R
E,E
)Ef( jiij
Gi Hj ij
2iji j2 =
−= ∑ ∑
∈ ∈
χ (6)
Table 4. Hypotheses resultsHypothesis χ2 χ2
0.05(t-1)*(k-1) Supported τ H1 25.312 21.026 Yes 0.417 H2 10.099 9.488 Yes 0.159 H3 28.081 26.296 Yes 0.138 H4 7.538 15.507 No - H5 9.840 21.026 No - H6 63.121 26.296 Yes 0.167 H7 297.79 26.296 Yes 0.532 H8 117.71 26.296 Yes 0.480 H9 48.532 26.296 Yes 0.294 H10 15.692 26.296 Yes 0.272 H11 7.565 26.296 No - H12 5.876 26.296 No -
i j
5
1j
t
1i j
ijj2i
t
1i
i1
1
21 f*C
fCE,R*
nRn
E,E
EE ∑∑∑= ==
−=
−=
−=τ
(7)
4 not. Fig. 6 presents the validated WEEE behaviourrelationship model.
As shown in Table 6 and in Fig. 6 the WEEErecycling attitude is correlated with age, education,income and personal and moral norms. Other variables,such as gender and number of members in thehousehold, are not statistically significant. From thesocio-economic and demographic variables, age is themost significant determinant of WEEE attitude (τ=0.417), followed by income and education level.
While most of the studies on WEEE recyclingbehavior agree that age is a significant factor, there aredifferences regarding the type of correlation (positiveor negative). Our study revealed that as age increase,there is a noticeable decrease of the positive attitudetowards WEEE recycling. The results are oposite withthose obtained by Saphores et al. (2012) showing theolder people are more willing to engage in WEEErecycling. In Romania, there are different culturalpatterns. The mobile phones, MP3 players and laptopsare the most replaced EEE products, while ubiquitousproducts like fridges or washing machines are replacedonly when breaks (Daedalus Millward Brown, 2010).The fashion to have the newest models of iPads, mobilephones, iPhones or laptops reached young Romanianpeople. A survey conducted by Daedalus MillwardBrown (2010) has shown that 33.20% of respondentsreplaces the mobile phone at maximum six months,usually until a new model is launched. Only 11.60%keeps it for more than three years, and another 12.60%for more than five years. Opposite, there are manypeople older then 65 years that use the same fridge formore than 30 years and never used in their life an ITCproduct. So, the powerfull difference betweengenerations regarding the use of technology couldexplain that younger are more inclined towards WEEErecycling than elders.
The results of the present study show thateducation has a modest impact on WEEE recycling
)n
C1(*)
nR1(*E
)Ef(ASR
jiij
ijijij
−−
−= (8)

362
Colesca, S.E. et al.
Fig. 6. Validated WEEE behaviour model
attitude (τ= 0.159). As education increases, increasesand the positive attitude towards WEEE recycling.High educated people are more environmentallyconscious and more likely to participate in WEEErecycling programs. But it is important to make thedifference between education and WEEE knowledge.Being highly educated not necessarily imply a highlevel of knowledge about how WEEE is recycled.
The weakest correlation in the proposed model isbetween income level and WEEE recycling attitude (τ=0.138). The analysis showed that people with higherlevels of income are more positive with the ideea ofWEEE recycling. WEEE replacement requires largeramounts of money. Higher-incomes people can moreeasily afford to buy new EEE products and to replacethe old ones. From another point of view, using EEEfor a large period of time represents a method of savingfor people with lower income. The level of welfare inRomania is modest compared to other Europeancountries. An ICPE study (2006) revealed that theaverage use of large appliances in Europe is of 8-10years, while in Romania is 13-17 years. Receiving adiscount on the purchase of a new equipment whenthey give in return an old one, seems to be the mostimportant way to stimulate recycling for respondentswith low incomes. 58.30% of the respondents with theincome lower than 1500 RON (~350 Euros) respondedthat they have used the take-back as recycling method.
Variables like gender and household size haven’tfound to be statistically significant for WEEE recycling
attitude. The results are oposite to the findings ofSaphores et al. (2012), who found that family size has apositive impact on e-waste recycling and gender playsa minor role. Maybe, in the Romanian context, theformation of individual attitude towards WEEE isinfluenced more by household attitude and doesn’tdepend on gender or household size.
The socio-demographic factors explain only a partof attitude. The results have also confirmed theexistence of a corelation between pro-environmentalnorms and WEEE recycling attitude (τ= 0.167).Individual’s choice to consider the effects on theenvironment when purchasing EEE is the expressionof the WEEE awareness and of the posibilities to takeaction in WEEE issues.
People’s beliefs are important drivers of theirbehaviour. But many times, between beliefs and actionsthere are important differences, external factors maypreventing a positive intention to be converted intobehaviour. Thus, the correlation between attitude andbehaviour it isn’t perfect. In our investigation, theattitude toward WEEE recycling was measured usingthe extent of agreement with the idea of recycling andWEEE behaviour by the frequency of recycling. Theresult of the study is consistent with previous researchin recycling (Wan et al., 2012; Chen and Tung, 2010):there is a relation between attitude and recyclingbehaviour. Even the hypothesis was accepted, themeasure of association between variables was not verystrong, t =0.532. An analysis of the external factors

explaining this difference has shown that the maininhibitors for the conversion of attitude in behaviourare: the lack of information about the places wherenon-functional products can be disposed (43.48%),commodity (5.93%), lack of time (15.81%), distance torecycling facilities (13.04%), intention to repair(21.74%), while the main incentives are: releasing spacein the households (68.77%), obtaining discounts atthe acquisition of a new product (17.79%), the desireto protect the environment from harmful effects(13.44%). The maximum adjusted standardized residual(8.94) corresponds to VH (attitude) - H (behaviour)cell in the contingency table, so people with a positiveattitude towards WEEE recycling are more like toengage in WEEE recycling.
Results from previous research have shown thathousehold waste recycling is a stable behaviour(Bagozzi and Dabholkar, 1994; Pieters, 1991; Dahab etal., 1995), having powerful drivers as personal habitsand household routine (Stern, 2000). Consistent withthese findings, our analysis showed that one of thestrongest correlation, t =0.480, is between recyclinghabits and WEEE recycling. The surprise was that64.43% of respondents rated better the frequency ofWEEE recycling than the frequency of recycling othertype of waste. One explication for this result could bethe following. In Romania the rate of recycling wasteis very low, around 2% in 2009 (FRD, 2011). Separatecollection is implemented only in some pilot locations.The main method used for household recycling isselling recyclable waste to specialized companies.Using this system are recycled paper, cardboard,plastics, glass and metals. These products havegenerally low value and big volumes and many timesthe money received are less than the transportationcosts, so the general trend is to throw all wastetogether. WEEE benefited from the take-back programs.Until 2008 there was a boom of the domestic EEEconsumption and a lot of people preferred to obtain aprice reduction giving in place an old product.Manystudies highlighted the importance of knowledge inshaping WEEE recycling behaviour (Gurauskienë,2008; Saphores et al., 2012). A person who intends toparticipate in recycling, but does not know how to do,or has an incorrect knowledge of the rules, will notparticipate properly (Tucker, 2003). In our study therespondents were asked to rate their perception ofknowledge about how WEEE is recycled. Theprocessing of responses reflected that there is a relationbetween WEEE knowledge and WEEE recyclingbehaviour (t =0.294). However, in order to betterunderstand the links between people WEEE knowledgeand behavior the questionnaire comprised threeadditional questions:
•How do you recycle WEEE? (with 7 possibleresponses)•Please check the name of the association responsiblefor WEEE collection you have heard (with 7 possibleresponses)•Please check the name of the WEEE collectingcampaign you have heard (with 7 possible responses)
The results showed that unfortunately there arestill Romanians who don’t participate in WEEErecycling because they are not sufficiently informedabout recycling facilities and campaigns. Some of themeven throw WEEE together with other types of waste,without knowing how dangerous are (15.02%). Thedistribution of responses for the method of WEEEdisposal is presented in Fig. 7.
Even many people responded that haveknowledge about WEEE recycling, when asked aboutthe name of collection campaigns and associationsresponsible for WEEE collection the responses weredisappointing.More than 70% of respondents specifiedmaximum 1 association and 1 campaign. Moreover, themain declared barrier for not participating in recyclingwas the lack of information about the places wherenon-functional products can be disposed (43.48%).When the perceived knowledge exceeds the realknowledge, people might recycle incorrectly (Pieters,1991). This result shows that decision makers shouldtake proper actions in order to increase the educationand information levels concerning WEEE recycling.
Without the implementation of large-scale WEEErecycling programs it is very difficult to obtain highrates of WEEE collection. Hicks et al. (2005) mentionthat the institutional support for WEEE recycling isvery important, especially in developing countries. InRomania, the formal WEEE collecting system is basedon three collection channels (Ciocoi et al., 2010a):„single day” collection actions – actions organized
at fixed dates with the goal to collect WEEE fromhouseholds;the „take-back” system – the retailers offer a discount
when buying a new equipment of the same type;collection centers – where the consumers can dispose
WEEE free of charge.
Beside the formal system, there is a powerfulinformal WEEE system (Ciocoiu and Tartiu, 2012). Peoplego from house to house and collect WEEE and othertype of waste (Tartiu, 2011a). The same people collectWEEE thrown at trash bins. A big problem of the informalsector is that WEEE is recycled using high pollutingtechnologies causing threat to environment and humanhealth. Another problem is that the most of informalcollectors aren’t registered under the country’s WEEEmanagement system and they don’t report the collected
Int. J. Environ. Res., 8(2):353-366,Spring 2014
363

waste, this fact being an important barrier in achievingthe collection rate imposed by the European Directive.
The present study confirmed that there is a relationbetween how Romanians perceive the institutionalsupport and WEEE recycling behaviour (τ =0.272).42.29% of surveyed people responded that disposeWEEE using the formal system, while 29.25% disposein the informal system. The amounts disposed in theinformal system aren’t so high like in China (Liu et al.,2006), where the 94% of households dispose WEEEusing informal sector, but are still far from desiredvalues. In order to reduce the negative impacts causedby informal recycling, the Romanian decision makershave to develop a powerful formal sector and todecrease the size and role of the informal sector.
The analysis showed that there isn’t any relationbetween the perception of the availability of collectionpoints and WEEE recycling behaviour. Asked if theyknow how much is developed the network of collectionpoints in their region, many respondents (45.85%)rated the question with low scores (corresponding toVery Low and Low linguistic terms). At anotherquestion only 10 persons (3.95%) reported that WEEEdisposal was made at collection points. The mostpreferred recycling methods were: the take backprograms (28.85%) and donations to other people(22.53%) (Figure 7). Even if people have knowledgeabout the existence of recycling centres, they preferanother way of recycling, the main barrier for WEEEdisposal in collection points being the was the lack ofinformation about these (43.48%).
Another hypothesis that hasn’t been confirmedis the relation between the perception of WEEEregulations and WEEE recycling behaviour. In the thirdpart of the questionnaire, the respondents were asked
if they know that recycling and disposal of WEEE isgoverned by specific regulations. 204 persons (80.63%)responded Yes, 23 (9.09%) No and 26 (10.28%)responded that they have low knowledge about thesubject. Despite this high rate of positive responses,when asked to rate the perception on WEEEregulations, the most of the responses were in the rangeNeutral - Very Low (57.70%). The explication is thatpeople can recycle based on own initiative, withoutthe constraints of any regulation.
CONCLUSIONThe growth of e-waste caused by increased levels
of consumption became a problem in Romania in thelast few years because the WEEE management systemis still in its infancy. The very fast rate of innovation inelectronics convinced people to buy new types ofproducts or to replace the old ones with other moreefficient. Some Romanians are willing to collect andrecycle the old equipments, but most of them don’tknow how the recycling could be done, where are thecollection points and what are the negative impacts ofWEEE over the environment. In this context, thepurpose of the present study was to identify andanalyse the main determinants of the Romanians’behaviour towards WEEE recycling. The necessity toincrease the effectiveness of the WEEE managementsystem and to meet the collection target imposed bythe European Union requires such an analysis.
Like other studies in the field, in the present paperwe have explored the links between socio-economicand demographic variables and WEEE recyclingattitude. The results show the existence of correlationsbetween WEEE recycling attitude and age, educationand income, while gender and household size haven’tbeen found to be relevant. Young people, bettereducated and with knowledge about environmental
WEEE Recycling
364
Fig .7. Distribution of responses for the method of WEEE disposal

protection are more likely to be implied in WEEErecycling than other categories of people.
The analysis showed that the strongestdeterminants of WEEE recycling behaviour are peopleattitudes and habits. People coming from families witha recycling culture tend to be more involved in WEEErecycling. The development of recycling habits is along process and unfortunatelly, Romania occupiesthe last position in EU regarding selective wastecollection (Tartiu, 2011a). Under these conditions,WEEE stakeholders should take various actions in orderto stimulate the forming of recycling habits.
The study is underlining the importance ofeducation and the value of knowledge regarding theprocess of WEEE collecting and recycling. If peopleare not informed about these issues then it is difficultto achieve the goal of a healthy electronic wastemanagement system. Improving knowledge on WEEErecycling represents a relatively easy way of action.This can be done by an efficient promotion of recyclingcampaigns and a powerful involvement of theeducation system. Currently, the collectiveassociations of producers together with the RomanianMinistry of Education promote a national program forselective WEEE collection in schools, but the actioncould be extended in universities.Stern (2000) considersthat contextual forces are major drivers forenvironmentally behaviour. From contextual forcesonly the correlation with institutional support has beenconfirmed. This result supports Stern’s idea that whencontextual factors are not very important, thenattitudes, personal capabilities and habits can have astronger impact on influencing behaviour.
Another reason for developing this research refersto the fact that studies on the determinants of WEEErecycling behavior are very few and it does not appearto be any research that explores the attitude andbehavior of consumers towards WEEE recycling inRomania. In this context, our empirical results showthat is necessary to know more about WEEE recyclingand to participate actively to the recycling processwith all that involve it.
REFERENCESArgesti, A. (2002). Categorical data analysis. Wiley,Hoboken.
Bagozzi, R. P. and Dabholkar, P. A. (1994). ConsumerRecycling Goals and Their Effect on Decisions to Recycle:A Means-End Chain Analysis. Psychology & Marketing,11,313-340.
Bagozzi, R., Gürnao-Canli, Z. and Priester, J. (2002). TheSocial Psychology of Consumer Behaviour. Open UniversityPress, Buckingham.
Bargiela, A., Pedrycz, W. and Nakashima, T. (2007).Multiple regression with fuzzy data. Fuzzy Sets andSystems, 158, 2169 – 2188.Chen, M. F. andTung, P. J. (2010). The moderating effect ofperceived lack of facilities on consumers’ recycling intentions.Environment and Behaviour, 42 (6), 824-844.
Cheng, C. H. and Lin, Y. (2002). Evaluating the best mainbattle tank using fuzzy decision theory with linguistic criteriaevaluation. European Journal of Operational Research, 142,174–186.
Ciocoiu, N., Burcea, S. and Tartiu, V. (2010a). The WEEEmanagement system in Romania Dimension, Strengths andWeaknesses. Theoretical and Empirical Researches in UrbanManagement, 6 (15), 5-22.
Ciocoiu, N., Burcea, S. and Tartiu, V. (2010b). Environmentalimpact of ICT and implications for e-waste management inRomania. Economia. Seria Management, 13 (2), 348-60.
Ciocoiu, C. N. and Tartiu, V. (2012). The role of informalsector within WEEE management systems: A Romanianperspective. Theoretical and Empirical Researches in UrbanManagement, 7 (1), 27-38.
Cooper, T. and Mayers, K. (2000). Prospects for HouseholdAppliances. Urban Mines, Halifax.Daedalus Millward Brown(2010, 2011) Colectare selectivã si reciclare. http://ww.ecotic.ro/. Accessed 20 November 2012.
Dahab, D. J., Gentry, J. W. and Su, W. (1995). New waysto reach non-recyclers: an extension of the model of reasonedaction to recycling behaviours. In: Kardes FR, Sujan M(eds) Advances in Consumer Research, Association forConsumer Research, Provo, UT, pp 251-256.
Darby, L. and Obara, L. (2005). Household recyclingbehaviour and attitudes towards the disposal of smallelectrical and electronic equipment. Resources, Conservationand Recycling, 44, 17-35.
EC, (2003a). European Council, Directive 2002/95/EC ofthe European Parliament and of the Council of 27 January2003 on the restriction of the use of certain hazardoussubstances in electrical and electronic equipment. Brussels.
EC, (2003b). European Council , Directive 2002/96/EC of theEuropean Parliament and of the Council of 27 January 2003 onwaste electrical and electronic equipment (WEEE). Brussels.
EC, (2012). European Council , Directive 2012/19/EU of theEuropean Parliament and of the council of 4 July 2012 onwaste electrical and electronic equipment (WEEE). Brussels.
Fessé, B. (2007). Technical Assistance for Waste fromElectrical and Electronic Equipment (WEEE) DirectiveImplementation. Ministry of Environment and SustainableDevelopment, Bucharest.
Fishbein, M. and Ajzen, I. (1975). Belief, Attitude, Intentionand Behavior: An introduction to theory and research.Addison-Wesley, Reading, MA.
FRD, (2011) Solid waste management and recycling inRomania. FDR Center MarketEntry Services. http://www.frdcen ter. ro/assets/Waste-Management-and-Recycling-Romania-May-2011-demo-report.pdf.
Int. J. Environ. Res., 8(2):353-366,Spring 2014
365

Georgescu, V. (2002). Chi-squared-based vs. entropy-basedmechanisms for building fuzzy discretizers, inducers andclassifiers. Fuzzy Economic Review, 7 (1), 3-27.
Gfk, (2011) Gfk Romania. http://www.gfk-ro.com. Accessed7 January 2013.
Gurauskiene, I. (2008). Behaviour of Consumers as One ofthe Most Important Factors in E-Waste Problem.Environmental Research, Engineering and Management, 4(46), 56-65.
Hicks, C., Dietmar, R. and Eugster, M. (2005). The recyclingand disposal of electrical and electronic waste in China:legislative and market responses. Environmental ImpactAssessment Review, 25 (5), 459-471.
ICPE, (2006). Studiu pentru determinarea costurilor privindgestionarea deºeurilor de echipamente electrice ºi electroniceºi determinarea numãrului necesar de puncte de colectare înRomânia. Institutul de Cercetari Electrotehnice - ICPEcontract no. 362/2006. http://www.deseurielectrice.ro/alte/studiu_costuri_gestionare_DEEE.pdf. Accessed 15December 2012.
Kim, K. J., Moskowitz, H. and Koksalan, M. (1996). Fuzzyversus statistical linear regression. European Journal ofOperational Research, 92 (2), 417–434.
Lazim, A. and Wahab, N. (2010). A fuzzy decision makingapproach in evaluating ferry service quality. ManagementResearch and Practice, 2 (1), 94-100.
Liu, X., Tanaka, M. and Matsui, Y. (2006). Generationamount prediction and material flow analysis of electronicwaste: Case study in Beijing. Waste Management & Research,24(5), 434-445.
Liou, T. S. and Chen, C. W. (2006). Subjective appraisal ofservice quality using fuzzy linguistic assessment.International Journal of Quality & Reliability Management,23(8), 928-943.
Nguyen, H. T. and Wu, B. (2006). Fundamentals of Statisticswith Fuzzy Data. Springer-Verlag Berlin, Heidelberg.
Nixon, H. and Saphores, J. D. (2007). Financing electronicwaste recycling Californian households’ willingness to payadvanced recycling fees. Journal of EnvironmentalManagement, 84, 547–559.
Nixon, H, Saphores, J-D., Ogunseitan, O. and Shapiro, A.A.(2009). Understanding preferences for recycling electronicwaste in California—the influence of environmental attitudesand beliefs on willingness to pay. Environment and Behavior,41(1), 101–124.
Nnorom, I. C., Ohakwe, J. and Osibanjo, O. (2009). Surveyof willingness of residents to participate in electronic wasterecycling in Nigeria: a case study of mobile phone recyclingJournal of Cleaner Production, 17 (18), 1629–1637.
Pieters, R. G. M. (1991). Changing Garbage DisposalPatterns of Consumers: Motivation, Ability andPerformance. Journal of Public Policy and Marketing, 10(2), 59-76.
Reynolds, H. T. (1984). Analysis of Nominal Data:Quantitative Applications in the Social Science. SAGEPublications, Beverly Hills.
REPA, (2012). Romanian Environmental Protection AgencyInformaþii privind gestionarea deºeurilor de echipamenteelectrice i electronice (DEEE).
Rode, S. (2012) E-waste management in Mumbaimetropolitan region: Constraints and opportunities,Theoretical and Empirical Researches in Urban Management,7 (2), 89-103.
Saphores, J. D., Nixon, H., Ogunseitan, O. A. and ShapiroA. A. (2006) Household willingness to recycle electronicwaste: an application to California. Environment andBehavior, 38, 183–208.
Saphores, J. D., Ogunseitan, O. A. and Shapiro, A. A. (2012)Willingness to engage in a pro-environmental behavior: Ananalysis of e-waste recycling based on a national survey ofU.S. households. Resources, Conservation and Recycling,60, 49–63.
Song, Q., Wang, Z. and Le, J. (2012). Residents’ behaviors,attitudes, and willingness to pay for recycling e-waste inMacau. Journal of Environmental Management, 106, 8-16.
Stern, P. (2000). Toward a Coherent Theory ofEnvironmentally Significant Behavior. Journal of SocialIssues, 56 (3), 407-424.
Schwartz, S.H. (1970). Moral decision making and behavior.In: Macauley J, Berkowitz L (eds) Altruism and helpingbehavior, Academic Press, New York, pp 127–141.
Taheri, S., Hesamian, G. and Viertl R. (2010). Contingencytables with fuzzy categories. Report No SM-2010-2. ViennaUniversity of Technology, Vienna.
Tartiu, V. (2011a). Selective collection of municipal waste inRomania: Characteristics and challenges. ManagementResearch and Practice, 3 (3), 53-62.
Tartiu, V. (2011b). Evaluation of attitudes & knowledgeregarding municipal waste among students. Case study:Bucharest Academy of Economic Studies. Economia. SeriaManagement, 14 (1), 263-276.
Tuker, P. (2003). Understanding Recycling Behaviour.University of Paisley, Paisley.
Yao, J. S. and Huang, T. T. (2004). Fuzzy Statistical AnalysisBased on Rating Items as the Linguistic Variables. TamsuiOxford Journal of Mathematical Sciences, 20 (2), 377-391.
Wan, C., Cheung, R. and Shen, G. Q. (2012). Recyclingattitude and behaviour in university campus: a case study inHong Kong. Facilities, 30 (13/14), 630–646.
Wang, Z., Zhang, B., Yin, J. and Zhang, X. (2011).Willingness and behavior towards e-waste recycling forresidents in Beijing city, China. Journal of CleanerProduction, 19, 977- 984.
Zadeh, L. A. (1965). Fuzzy Sets. Information and Control,8 (2), 338-353 .
Zadeh, L. A. (1975). The concept of a linguistic variable andits application to approximate reasoning. InformationSciences, 8 (3), 199-249.
ş
Colesca, S.E. et al.
366