determination of bubble size distribution in a …
TRANSCRIPT

http://dx.doi.org/10.5277/ppmp160214
Physicochem. Probl. Miner. Process. 52(2), 2016, 690−702 Physicochemical Problems
of Mineral Processing
www.minproc.pwr.wroc.pl/journal/ ISSN 1643-1049 (print)
ISSN 2084-4735 (online)
Received July 4, 2015; reviewed; accepted November 23, 2015
DETERMINATION OF BUBBLE SIZE DISTRIBUTION
IN A LABORATORY MECHANICAL FLOTATION CELL
BY A LASER DIFFRACTION TECHNIQUE
Reyhane MAZAHERNASAB, Rahman AHMADI
Faculty of Engineering and Technology, Imam Khomeini International University (IKIU), Qazvin, Iran.
[email protected] (R. Mazahernasab)
Abstract: In this study, a laser diffraction technique (LDT) was used to measure size distribution of
bubbles generated in a two-phase system in a laboratory mechanical flotation cell. In LDT, a laser light
beam passed through the bubbles inside the measurement cell and the scattered light was recorded by
detectors. In order to show the effectiveness of LDT, an image analysis technique (IAT) was applied in
parallel to measure the size of bubbles. To determine the bubble size by IAT, around 200 images were
taken in each test. In addition, the important operating parameters of the mechanical flotation cell
affecting the bubble size distribution, including the impeller speed, aeration rate and frother
concentration, were investigated. The response parameter in this study was Db(50) which represent the
size of bubble at which there is 50% of the distribution.
The results of this study showed that the LDT and IAT techniques were in a good agreement when
Db(50) was in the range of -800+400 µm and there was a discrepancy for Db(50) in the range of -400+100
µm. Furthermore, Db(50) decreased from 727 to 284 µm when impeller speed increased from 700 to 1200
rpm. Additionally, an increase in the aeration rate from 1 dm3/min to 2.5 dm3/min led to a rise in Db(50)
from 418 to 456 µm. Finally, increasing the frother concentration from 10 to 60 ppm reduced the Db(50)
from 704 to 387 µm.
Keywords: bubble size distribution, mechanical flotation cell, Laser Diffraction Technique (LDT), Image
Analysis Technique (IAT), effective parameters
Introduction
Flotation is one of the most widely used methods for separation of valuable minerals
particularly base metals. It is well documented that a bubble size distribution has a
direct influence on the flotation performance (Grau and Heiskanen, 2005; Zhang et al.,
2010). An image analysis technique (IAT), a standard technique in bubble size
distribution measurement, has had significant advancements in the equipment,
software and processing procedure. However, problems such as time consuming

Determination of bubble size distribution by a laser diffraction technique 691
analysis, bubbles overlap and perspective in images still exist in this method. A laser
diffraction technique (LDT) was introduced in the mid 1970’s but its instrumentation
has only had a strong development in the past two decades. This technique is
classified as a non-destructive and non-intrusive method and relies on the fact that the
laser diffraction angle is inversely proportional to the particle size (Xu, 2002). LDT
uses optical models to determine the particle/bubble size from measurement data. One
of these models is the Fraunhofer model in which the pattern of scattered light is
predicted by a disc at the time of exposure to the laser beam. The Fraunhofer model
has shown satisfactory results for some particles but it has not been able to describe
the light scattering accurately (Ma et al., 2000). The accepted theory for all materials
and in all circumstances that accurately predicts the behavior of light scattering is the
Mie theory. This theory is derived from the Maxwell equations describing
electromagnetic radiation for the light scattered by a homogeneous sphere under
uniform illumination. In the Mie model, information on the optical properties of
particles and dispersants such as a refractive index is essential.
LDT has been applied by a laser particle size analyzer (LPSA) to measure the size
of the particles/bubbles in an aqueous or aerial environment. A typical LPSA system
consists of a laser light source of He-Ne, which is a red light with the wavelength of
633 µm in the axis of device, LED which is a blue light with the wavelength of 455
µm out of axis of device, wet or dry dispersing units, Fourier lens, suitable detectors
and a PC for signal processing and reporting the results (Ma et al., 2000). In LDT, the
focused laser light beam passes through the suspended sample and is scattered by
either particles or bubbles in various angles. Light scattering is recorded by silicon
detectors or light-sensitive diodes. Then, a computer calculates the experimental size
distribution, Emes, through an optical model (Stojanovic and Markovic, 2012) and
predicts the scattering pattern, Ecal, using the mathematical procedures. The size
distribution is then determined by comparison of Emes and Ecal until the sum of the
squared errors reaches to a minimum value. Finally, the statistics of bubble
distribution are calculated from the results using the derived diameter, D[m,n], given
by:
D[m, n]= [∑ 𝑣𝑖 𝑑𝑖
𝑚−3
∑ 𝑣𝑖 𝑑𝑖𝑛−3 ]
1
𝑚−𝑛 (1)
where vi and di are the volume fraction and geometric diameter of size band i,
respectively. LDT which is applicable for measuring the particle size range from 0.1 to
3000 µm according to ISO13320-1 (1999), has successfully been used to measure dry
solids, colloidal particles, and emulsions. Regarding non-solid particle measurement,
this method was developed in the size distribution determination of colloidal gas
afrons (CGA), which is a type of foam used in a separation process (Couto et al.,
2004). Additionally, some researchers have used this technique to determine the size
distribution of fine bubbles in the micrometer and nanometer scales. Fan (2008)
determined the size of pico bubbles produced by a Venturi tube in a plexiglass column

R. Mazahernasab, R. Ahmadi 692
using a laser particle size analyzer. The bubble size range in the pico bubbles moving
from the column to LPSA was determined to be between 0.1 µm and 100 µm. In
another study, Couto et al. (2008) measured the size distribution of bubbles in
dissolved air flotation (DAF) using LDT. By comparing LDT with a fluid flow
dynamics method, they confirmed that the results of LDT are reproducible and
reliable. However, it is worth to note that the volume of dissolved air in DAF is 3-4%
which is much lower than that of 20-30% in the actual flotation process. Moreover, the
number of bubbles in DAF is very low in comparison to the real flotation process
(Rubio et al., 2007). Ahmadi (2013) designed a nano-micro bubble producer device on
a basis of hydrodynamic cavitation and used LDT to measure the nano-micro bubble
size distribution. He evaluated LDT as a fast and reliable method for bubble size
measurement. One advantage of LDT is that the size analysis of sample could be
performed in less than one minute and therefore, it can be used in industrial operations
due to the easy and fast repetition.
According to the literature review, the IAT has mostly been used to measure the
size of bubbles generated in the mechanical flotation cells in the range of millimeter in
size. Furthermore, the LDT has only been applied for measurement of bubbles with
sub-micron sizes and hence, there is no comprehensive study to use this method in
measuring the millimeter size range bubbles. Moreover, LDT and IAT have not been
compared with each other in the bubble size measurement application. In this paper,
LDT and IAT were simultaneously used to measure the size distribution of bubbles
generated in a laboratory mechanical flotation cell. Then, LDT results were
qualitatively and quantitatively compared with the IAT results. Finally, the effect of
the operating variables of the laboratory mechanical flotation cell on the bubble size
was investigated.
Materials and methods
In this study, the bubbles were produced in a laboratory Denver flotation cell which
was constructed with special dimensions of 17×15×25 cm representing the length,
width, and height, respectively, and a hole on one wall located at 2 cm above the
bottom of the cell for quick transmission of generated bubbles to the bubble size
measurement device. In all experiments, double-distilled water was used to prepare the
aqueous solutions and methyl isobutyl carbinol (MIBC) with molecular weight of
102.17 g/mol from Aldrich Sigma was applied as a frother to generate bubbles. The
aeration rate was controlled by an air flow meter with accuracy of 0.5 dm3/min
calibrated with oxygen. To prepare the aqueous solution in the flotation cell, the
frother was added to water and mixed for 2 minutes. Then, the air was introduced into
the cell with adjusted areation rate.
The laser particle size analyzer (LPSA), model MS2000 manufactured by Malvern
Company, UK, was applied to measure the size distribution of bubbles using LDT.
Figure 1 shows the equipment used in the LDT measurements. As displayed in Figure

Determination of bubble size distribution by a laser diffraction technique 693
1, the flotation cell was placed next to LPSA and the bubbles generated inside the
flotation cell were continuously transferred into the measurement cell of the LPSA
using pressure difference. In LPSA, the Mie optical model was selected to calculate
the bubble size distribution. To increase the accuracy of the results, each measurement
was repeated four times and the median bubble diameter was calculated on a
volumetric basis. The average of four measurements was shown as Db(50) which
represents the size of bubble at which there is 50% of the distribution.
Fig. 1. Equipment used in LDT measurements:
1) flotation machine, 2) flotation cell, 3) LPSA, 4) PC
To investigate the effectiveness of the LDT results, the IAT measurements were
also conducted. Figure 2 shows the equipment used in the IAT measurments. The
equipment displayed in Figure 2 includes a bubble viewer, digital camera and light
source. The bubble viewer consists of a sampling tube and a viewing chamber with
certain dimensions created out of Plexiglas. The 15° slope of the chamber makes the
bubbles to move almost as a single layer near the viewing chamber screen and
decreases overlapping of the bubbles in pictures. A digital camera, Canon 5D Mark П
with micro lens, was positioned in a fixed location and the imaging depth was adjusted
based on the presence of the majority of bubbles. In addition, the measurement scale
was placed exactly at the focal plane and the sharp and clear bubbles were selected for
the processing step, whereas the blurry bubbles were removed. The light source
producing cool light was perpendicular to the rear panel. To increase the accuracy of
the measurements, at least 200 images were taken in each test out of which a few were
randomly chosen for the processing step, in which the cross-sectional area and
consequently the diameter of bubbles known as “projected area diameter” were
determined. Finally, the Db(50) and size distributions of bubbles were calculated.
To confirm the reproducibility of bubble size measurements, four measurements
were performed under the same conditions in each test. The coefficient of variation of
measurements was 1.64 % which was acceptable according to BS ISO 13320-1(1999).

R. Mazahernasab, R. Ahmadi 694
Moreover, the weighted residual values of tests, which represent the fit of the
calculated data obtained by model with the measured data, were in the range of 0.46-
0.75%. The weighted residual value less than 1% indicates a good and acceptable fit
and greater than 1% indicates the wrong choice of refractive index values.
Fig. 2. Equipment used in IAT measurements:
1) digital camera, 2) bubble viewer, 3) light source
Results and discussion
Effect of impeller speed
The impeller speed of the mechanical flotation cell is one of the most effective
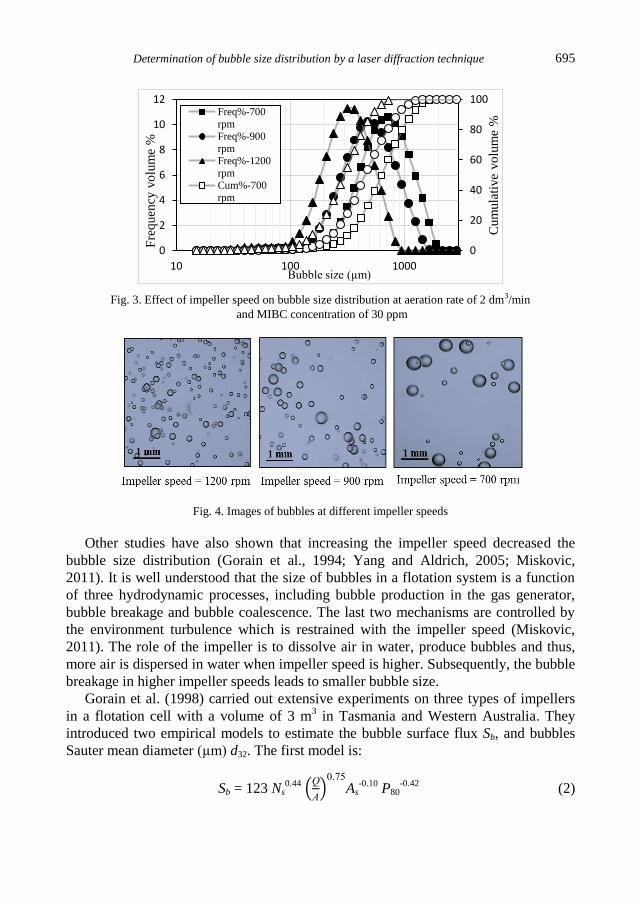
parameters on the bubble size generated inside the cell. Figure 3 shows the effect of
impeller speed on the bubble size distribution at aeration rate of 2 dm3/min and MIBC
concentration of 30 ppm. As shown in Fig. 3, increasing the impeller speed from 700
to 1200 rpm shifted the bubble size distribution to finer sizes and decreased the Db(50)
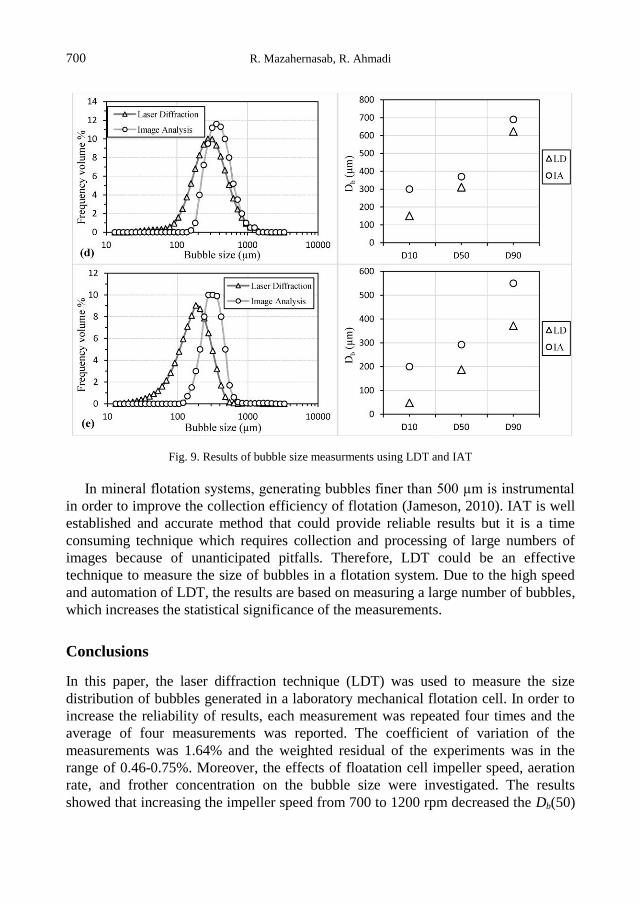
of bubbles from 727 to 284 µm. Figure 4 displays the image of bubbles at different
impeller speeds. It is clear from Figure 4 that the smallest bubbles were generated
when the impeller speed was at its highest value of 1200 rpm.
Determination of bubble size distribution by a laser diffraction technique 695
Fig. 3. Effect of impeller speed on bubble size distribution at aeration rate of 2 dm3/min
and MIBC concentration of 30 ppm
Fig. 4. Images of bubbles at different impeller speeds
Other studies have also shown that increasing the impeller speed decreased the
bubble size distribution (Gorain et al., 1994; Yang and Aldrich, 2005; Miskovic,
2011). It is well understood that the size of bubbles in a flotation system is a function
of three hydrodynamic processes, including bubble production in the gas generator,
bubble breakage and bubble coalescence. The last two mechanisms are controlled by
the environment turbulence which is restrained with the impeller speed (Miskovic,
2011). The role of the impeller is to dissolve air in water, produce bubbles and thus,
more air is dispersed in water when impeller speed is higher. Subsequently, the bubble
breakage in higher impeller speeds leads to smaller bubble size.
Gorain et al. (1998) carried out extensive experiments on three types of impellers
in a flotation cell with a volume of 3 m3 in Tasmania and Western Australia. They
introduced two empirical models to estimate the bubble surface flux Sb, and bubbles
Sauter mean diameter (µm) d32. The first model is:
Sb = 123 Ns0.44
(Q
A)
0.75
As-0.10
P80-0.42
(2)
0
20
40
60
80
100
0
2
4
6
8
10
12
10 100 1000
Cum
ula
tive
vo
lum
e %
Fre
quen
cy v
olu
me
%
Bubble size (µm)
Freq%-700
rpm
Freq%-900
rpm
Freq%-1200
rpm
Cum%-700
rpm

R. Mazahernasab, R. Ahmadi 696
where Ns is the peripheral impeller speed (m/s), Q aeration rate (cm3), A section area
(cm2), As aspect ratio of impeller and P80 is the size of sieve through which 80% of
particles pass (µm). The second model is:
d32 = 6 Jg
Sb (3)
where, Jg is the superficial gas velocity (cm/s). According to the Gorain models (Eqs.
2 and 3), increasing the impeller speed increases the bubble surface flux, which
consequently reduces the Sauter mean diameter of bubbles.
Effect of aeration rate
Figure 5 shows the effect of aeration rate on bubble size distribution at impeller speed
of 900 rpm and MIBC concentration of 30 ppm. As exhibited in Fig. 5, increasing the
aeration rate from 1 to 2.5 dm3/min increases Db(50) from 418 to 456 µm. It means
that the size of the bubbles shifts toward larger sizes and wider distributions. Figure 6
demonstrates the image of bubbles at different aeration rates. It can be seen from that
the size of bubbles was larger at higher aeration rates (Figure 6).
Fig. 5. Effect of aeration rate on bubble size distribution
at impeller speed of 900 rpm and MIBC concentration of 30 ppm
Many studies have indicated that increasing the aeration rate in a mechanical
flotation cell results in generating larger bubbles (Gorain et al., 1994; Bai and Thomas,
2001; Yang and Aldrich, 2005; Gomez and Finch, 2007; Zhang et al., 2014). Grau and
Heiskanen (2005) reported that the effect of aeration rate on the bubble size is related
to the air cavities behind the impeller blades, which become larger when the aeration
rate increases. Therefore, energy consumption decreases which leads to rise in the
maximum size of stable bubble. O'Connor et al. (1989) introduced a model, which
predicts the bubble diameter db, in two-phase and three-phase systems:
db = kvgx (4)
0
20
40
60
80
100
0
2
4
6
8
10
12
10 100 1000
Cum
ula
tive
vo
lum
e %
Fre
quen
cy v
olu
me
%
Bubble size (µm)
Freq%-1 l/min
Freq%-2 l/min
Freq%-2.5
l/min
Cum%-1 l/min

Determination of bubble size distribution by a laser diffraction technique 697
where k is a constant, vg superficial gas velocity, and x is 0.40 for two-phase systems.
Fig. 6. Images of bubbles at different aeration rates
The O'Connor model (Eq. 4) shows that the aeration rate and bubble diameter have
a direct relationship. Sada et al. (1978) suggested that the direct relationship between
aeration rate and bubble size is due to higher bubble coalescence at high aeration rates.
Effect of frother concentration
Figure 7 displays the effect of MIBC concentration on bubble size distribution at
impeller speed of 900 rpm and aeration rate of 2 dm3/min. As shown in Fig. 7,
increasing the frother concentration from 10 to 60 ppm reduces the Db(50) from 704 to
387 µm and moves the bubble size distribution toward finer sizes. Figure 8 shows the
image of bubbles at different MIBC concentrations. It is evident from Fig. 8 that
bubble size decreases at higher concentration of MIBC.
Fig. 7. Effect of MIBC concentration on bubble size distribution
at impeller speed of 900 rpm and aeration rate of 2 dm3/min
0
10
20
30
40
50
60
70
80
90
100
0
2
4
6
8
10
12
14
16
18
20
10 100 1000
Cum
ula
tive
vo
lum
e %
Fre
quen
cy v
olu
me
%
Bubble size (µm)
Freq%-10 ppm
Freq%-30 ppm
Freq%-60 ppm
Cum%-10 ppm
Cum%-30 ppm
Cum%-60 ppm

R. Mazahernasab, R. Ahmadi 698
Fig. 8. Images of bubbles at different MIBC concentrations
Increasing the frother concentration could reduce the surface tension and prevent
bubble coalescence which consequently result in producing finer bubbles (O'Connor
et al., 1989; Comely et al., 2002). However, there are some studies suggesting that the
bubble size is not solely controlled by the surface tension. Gupta et al. (2007) studied
the relationship between the bubble size and surface tension in the presence of two
frothers including MIBC and DF-1012. They demonstrated that when DF-1012 is used
as frother, although the surface tension is lower, the bubble size is larger in
comparison to applying MIBC with the same concentration. Moreover, Moyo (2005)
showed that adding some salts to the aqueous solution makes the bubbles finer, while
increases the surface tension. Azgomi (2006) explained the effect of frother on the
bubble size using the bubble coalescence prevention mechanism. He indicated that the
frother molecules at the air/liquid interface create hydrogen bonds with water and
make the liquid film on the bubble surface more stable. Bubble coalescence prevention
is expressed based on the frother critical coalescence concentration (CCC) concept
which means that the bubbles are produced in small sizes and frother prevents them
from coalescence. Furthermore, Azgomi (2006) suggested that only a part of bubbles
coalescence prevention takes place at CCC and there is another factor having a direct
impact on the bubbles size, such as the surface tension.
Comparison of LDT and IAT
In order to investigate the effectiveness of LDT in measuring bubble size, the results
of LDT and IAT experiments carried out in this study were compared together.
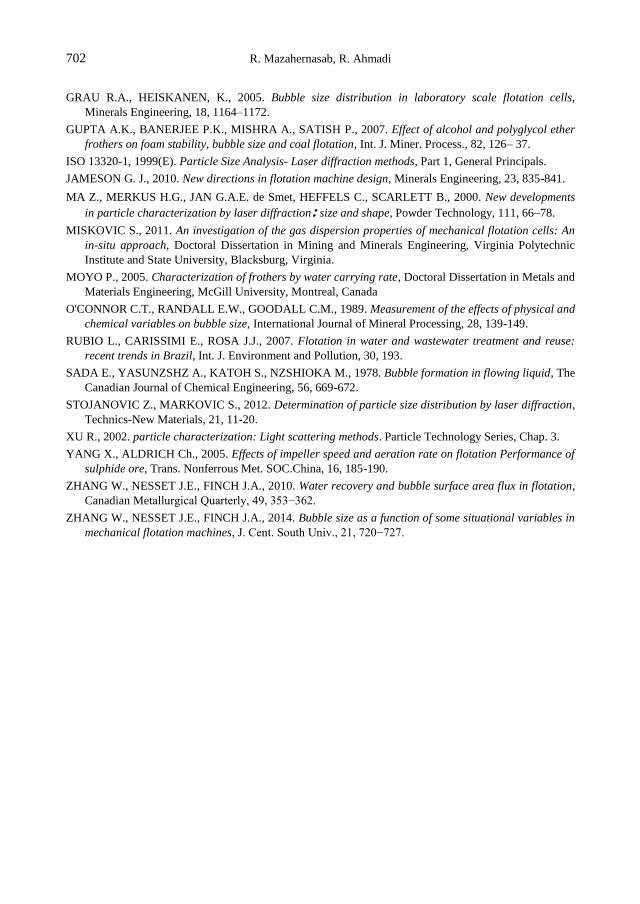
Figures 9 compares the results of bubble size measurements using LDT and IAT. As
shown in Figure 9, the results of LDT and IAT are in a good correlation when Db(50)
is in the range of -800+400 µm (Figures 9a, 9b and 9c). However, as seen in Figure 8,
the exact value of bubble size obtained by IAT is slightly larger than that measured by
LDT. The slightly larger bubble size in IAT could be explained by the fact that in IAT
measurements, bubbles move vertically and in a longer distance during sampling and
before imaging. Therefore, the bubbles have a higher possibility to coalesce in IAT in
comparison to LDT measurements, in which bubbles move in a horizontal and shorter

Determination of bubble size distribution by a laser diffraction technique 699
path toward the measurement device. Additionally, longer measurement time in IAT
increases the possibility of bubble coalescence leading to larger bubble size
measurements.
As shown in Figures 9d and 9e, there is a significant difference between the LDT
and IAT results when Db(50) is in the range of -400+100 µm. It is clear from Figure
10b that the IAT measurements are larger than the LDT measurements. It could be due
to the ineffectiveness of IAT in detecting and measuring the bubbles finer than 200
µm since IAT has mostly been used for determination of the bubbles larger than 200
µm (Azgomi et al., 2007; Gupta et al., 2007; Finch et al., 2008; Miskovic, 2011).
R. Mazahernasab, R. Ahmadi 700
Fig. 9. Results of bubble size measurments using LDT and IAT
In mineral flotation systems, generating bubbles finer than 500 µm is instrumental
in order to improve the collection efficiency of flotation (Jameson, 2010). IAT is well
established and accurate method that could provide reliable results but it is a time
consuming technique which requires collection and processing of large numbers of
images because of unanticipated pitfalls. Therefore, LDT could be an effective
technique to measure the size of bubbles in a flotation system. Due to the high speed
and automation of LDT, the results are based on measuring a large number of bubbles,
which increases the statistical significance of the measurements.
Conclusions
In this paper, the laser diffraction technique (LDT) was used to measure the size
distribution of bubbles generated in a laboratory mechanical flotation cell. In order to
increase the reliability of results, each measurement was repeated four times and the
average of four measurements was reported. The coefficient of variation of the
measurements was 1.64% and the weighted residual of the experiments was in the
range of 0.46-0.75%. Moreover, the effects of floatation cell impeller speed, aeration
rate, and frother concentration on the bubble size were investigated. The results
showed that increasing the impeller speed from 700 to 1200 rpm decreased the Db(50)

Determination of bubble size distribution by a laser diffraction technique 701
from 727 to 284 µm due to intensifying the cell turbulence. Moreover, increasing the
aeration rate from 1 to 2.5 dm3/min led to an increase in Db(50) from 418 to 456 µm. It
was a result of growth in bubble coalescence. Finally, increasing the frother
concentration from 10 to 60 ppm reduced the Db(50) from 704 to 387 µm.
To examine the reliability of the LDT results, the image analysis technique (IAT)
was simultaneously applied to measure the bubble size. The comparing results showed
that the LDT and IAT are in a good agreement for measuring the bubble size in the
range of -800+400 µm. However, there was a discrepancy between LDT and IAT
when Db(50) was in the range of -400+100 µm. In overall, the similarity between the
measured size distributions by two techniques was satisfactory specifically for bubbles
larger than 200 µm. This study demonstrated that the LDT could provide the bubble
size distribution close to that obtained from IAT. The advantages of LDT including
the ease, high speed and wide range of bubble size measurement introduce this
technique as an attractive alternative to IAT for rapid measurement of bubble size in
the mechanical flotation cells.
References
AHMADI R., 2013. Flotation of fine particles from mine tailings by coalescent of nano-microbubbles,
Doctoral Dissertation in Mineral Processing, Faculty of Engineering, Tarbiat Modarres University,
Tehran, Iran.
AZGOMI F., 2006. Characterizing frothers by their bubble size control properties, Master Dissertation in
Metals and Materials Engineering, McGill University, Montreal, Canada.
AZGOMI F., GOMEZ C.O., FINCH J.A., 2007. Correspondence of gas holdup and bubble size in
presence of different frothers, Int. J. Miner. Process., 83, 1–11.
BAI H., THOMAS B., 2001. Bubble formation during horizontal gas injection into downward flowing
liquid, Metallurgical and Materials Transactions B, 32, 1143-1159.
COMELY B.A., HARRIS P.J., BRADSHAW D.J., HARRIS M.C., 2002. Frother characterization using
dynamic surface tension measurements, International Journal of Mineral Processing, 64, 81-100.
COUTO H.J.B., MELO M.V., MASSARANI G., 2004. Treatment of milk industry effluent by dissolved
air flotation, Brazilian Journal of Chemical Engineering, 21, 83-91.
COUTO H.J.B., DANIAL G. Nunes, REINER N., SILVIA C.A. França, 2008. Micro-bubble size
distribution measurements by laser diffraction technique, Minerals Engineering, 22, 330-335
FAN M., 2008. Picobubble enhanced flotation of coarse phosphate particles, Doctoral Dissertation in
Mineral Processing, College of Engineering, The University of Kentucky, China.
FINCH J.A., NESSET J., ACUNA C., 2008. Role of frother on bubble production and behaviour in
flotation, Miner. Eng., 21, 949−957.
GOMEZ C.O., FINCH J.A., 2007. Gas dispersion measurements in flotation cells, International Journal
of Mineral Processing, 84, 51-58.
GORAIN B.K., FRANZIDIS J.P., MANLAPIG E.V., 1994. Studies on impeller type, impeller speed and
air flow rate in an industrial scale flotation cell- part1: effects on bubble size distribution, Minerals
Engineering, 8, 615-635.
GORAIN B.K., FRANZIDIS J.P., MANLAPIG E.V., 1998. The empirical prediction of bubble surface
area flux in mechanical flotation cells from cell design and operation dat', Minerals Engineering, 12,
309-322.
R. Mazahernasab, R. Ahmadi 702
GRAU R.A., HEISKANEN, K., 2005. Bubble size distribution in laboratory scale flotation cells,
Minerals Engineering, 18, 1164–1172.
GUPTA A.K., BANERJEE P.K., MISHRA A., SATISH P., 2007. Effect of alcohol and polyglycol ether
frothers on foam stability, bubble size and coal flotation, Int. J. Miner. Process., 82, 126– 37.
ISO 13320-1, 1999(E). Particle Size Analysis- Laser diffraction methods, Part 1, General Principals.
JAMESON G. J., 2010. New directions in flotation machine design, Minerals Engineering, 23, 835-841.
MA Z., MERKUS H.G., JAN G.A.E. de Smet, HEFFELS C., SCARLETT B., 2000. New developments
in particle characterization by laser diffraction: size and shape, Powder Technology, 111, 66–78.
MISKOVIC S., 2011. An investigation of the gas dispersion properties of mechanical flotation cells: An
in-situ approach, Doctoral Dissertation in Mining and Minerals Engineering, Virginia Polytechnic
Institute and State University, Blacksburg, Virginia.
MOYO P., 2005. Characterization of frothers by water carrying rate, Doctoral Dissertation in Metals and
Materials Engineering, McGill University, Montreal, Canada
O'CONNOR C.T., RANDALL E.W., GOODALL C.M., 1989. Measurement of the effects of physical and
chemical variables on bubble size, International Journal of Mineral Processing, 28, 139-149.
RUBIO L., CARISSIMI E., ROSA J.J., 2007. Flotation in water and wastewater treatment and reuse:
recent trends in Brazil, Int. J. Environment and Pollution, 30, 193.
SADA E., YASUNZSHZ A., KATOH S., NZSHIOKA M., 1978. Bubble formation in flowing liquid, The
Canadian Journal of Chemical Engineering, 56, 669-672.
STOJANOVIC Z., MARKOVIC S., 2012. Determination of particle size distribution by laser diffraction,
Technics-New Materials, 21, 11-20.
XU R., 2002. particle characterization: Light scattering methods. Particle Technology Series, Chap. 3.
YANG X., ALDRICH Ch., 2005. Effects of impeller speed and aeration rate on flotation Performance of
sulphide ore, Trans. Nonferrous Met. SOC.China, 16, 185-190.
ZHANG W., NESSET J.E., FINCH J.A., 2010. Water recovery and bubble surface area flux in flotation,
Canadian Metallurgical Quarterly, 49, 353−362.
ZHANG W., NESSET J.E., FINCH J.A., 2014. Bubble size as a function of some situational variables in
mechanical flotation machines, J. Cent. South Univ., 21, 720−727.