determination of coefficient of thermal expansion … of coefficient of thermal expansion effects on...
TRANSCRIPT
1. Report No.
FHWA/LA.11/451
2. Government Accession No. 3. Recipient's Catalog No.
4. Title and Subtitle
Determination of Coefficient of Thermal Expansion Effects on Louisiana’s PCC Pavement Design
5. Report Date
December 2011
6. Performing Organization Code
LTRC Project Number: 07-2C
State Project Number: 736-99-1450
7. Author(s)
Hak-Chul Shin and Yoonseok Chung
8. Performing Organization Report No.
9. Performing Organization Name and Address
Department of Civil and Environmental Engineering
Louisiana State University
Baton Rouge, LA 70803
10. Work Unit No.
11. Contract or Grant No.
07-2C / 736-99-1450
12. Sponsoring Agency Name and Address
Louisiana Department of Transportation and Development
P.O. Box 94245
Baton Rouge, LA 70804-9245
13. Type of Report and Period Covered
Final Report, 2/01/07 – 4/31/09
14. Sponsoring Agency Code
15. Supplementary Notes
Conducted in Cooperation with the U.S Department of Transportation, Federal Highway Administration
16. Abstract
With the development of the Mechanistic Empirical Pavement Design Guide (MEPDG) as a new pavement design tool, the
coefficient of thermal expansion (CTE) is now considered a more important design parameter in estimating pavement
performance including cracking, faulting, and international roughness index (IRI). This study was conducted to measure
typical CTE values of Portland cement concrete (PCC) pavements having various aggregates used in Louisiana and to
investigate the relationship between CTE and other critical variables such as aggregate types, age of concrete, dimension of
specimen, amount of course aggregate in mixture, relative humidity, and concrete mechanical properties. AASHTO TP 60-00
was used for measuring concrete CTE and a recently new standard test method, AASHTO T 336-09, was adopted to replace
the TP 60-00. A calibration factor was developed to convert the CTE values measured by AASHTO TP 60-00 to that of the
new standard testing method. From the analysis of measured data, it was found that aggregate types, coarse aggregate
proportion, and relative humidity have a significant influence on CTE. This finding was confirmed with a statistical analysis of
variance (ANOVA). CTE tests and mechanical property tests were also performed at different ages to provide input data for
Level 1 design of MEPDG. Based on the results of the MEPDG analysis, current maximum joint spacing [20 ft. (6.1 m)] in
jointed plain concrete pavement (JPCP) can be adjusted to 15 or 18 ft. (4.6 or 5.5 m) when Kentucky limestone is used as a
coarse aggregate.
17. Key Words
Pavement Design, CTE, MEPDG, Joint spacing
18. Distribution Statement
19. Security Classif. (of this report)
not applicable
20. Security Classif. (of this page)
21. No. of Pages
98
22. Price
TECHNICAL REPORT STANDARD PAGE

Project Review Committee
Each research project will have an advisory committee appointed by the LTRC Director.
The Project Review Committee is responsible for assisting the LTRC Administrator or
Manager in the development of acceptable research problem statements, requests for
proposals, review of research proposals, oversight of approved research projects, and
implementation of findings.
LTRC appreciates the dedication of the following Project Review Committee Members in
guiding this research study to fruition.
LTRC Manager
Tyson Rupnow, Ph.D., P.E.
Concrete Research Engineer
Members
Zhongjie “Doc” Zhang, Pavement & Geotechnical Research Administrator
Jeff Lambert, Pavement & Geotechnical Section
Philip Arena, FHWA
Chris Abadie, Materials Research Administrator
John Eggers, Construction Section
Scott Ashmore, James Construction Group
Mark Stinson, FHWA
Mike Ricca, Section 40
Directorate Implementation Sponsor
William H. Temple, P.E
DOTD chief engineer

Determination of Coefficient of Thermal Expansion Effects on
Louisiana’s PCC Pavement Design
by
Hak-Chul Shin
Yoonseok Chung
Department of Civil and Environmental Engineering
Louisiana State University
Baton Rouge, LA 70803
LTRC Project No. 07-2C
State Project No. 736-99-1450
conducted for
Louisiana Department of Transportation and Development
Louisiana Transportation Research Center
The contents of this report reflect the views of the author/principal investigator who is
responsible for the facts and the accuracy of the data presented herein. The contents do
not necessarily reflect the views or policies of the Louisiana Department of
Transportation and Development or the Louisiana Transportation Research Center. This
report does not constitute a standard, specification, or regulation.
December 2011


iii
ABSTRACT
With the development of the Mechanistic Empirical Pavement Design Guide (MEPDG)
as a new pavement design tool, the coefficient of thermal expansion (CTE) is now
considered a more important design parameter in estimating pavement performance
including cracking, faulting, and international roughness index (IRI). This study was
conducted to measure typical CTE values of Portland cement concrete (PCC) pavements
having various aggregates used in Louisiana and to investigate the relationship between
CTE and other critical variables such as aggregate types, age of concrete, dimension of
specimen, amount of course aggregate in mixture, relative humidity, and concrete
mechanical properties. AASHTO TP 60-00 was used for measuring concrete CTE and a
recently new standard test method, AASHTO T 336-09, was adopted to replace the TP
60-00. A calibration factor was developed to convert the CTE values measured by
AASHTO TP 60-00 to that of the new standard testing method. From the analysis of
measured data, it was found that aggregate types, coarse aggregate proportion, and
relative humidity have a significant influence on CTE. This finding was confirmed with a
statistical analysis of variance (ANOVA). CTE tests and mechanical property tests were
also performed at different ages to provide input data for Level 1 design of MEPDG.
Based on the results of the MEPDG analysis, current maximum joint spacing [20 ft. (6.1
m)] in jointed plain concrete pavement (JPCP) can be adjusted to 15 or 18 ft. (4.6 or 5.5
m) when Kentucky limestone is used as a coarse aggregate.


v
ACKNOWLEDGEMENTS
The U.S Department of Transportation, Federal Highway Administration (FHWA), the
Louisiana Department of Transportation and Development (LADOTD), and the
Louisiana Transportation Research Center (LTRC) financially supported this research
project.
The authors would like to acknowledge Randy Young, Matt Tircuit, and Keith Beard for
their assistance in producing the CTE specimens and completing the hardened concrete
testing.


vii
IMPLEMENTATION STATEMENT
This study was conducted to measure the CTE of concrete specimen having various
coarse aggregates widely used in pavement construction in Louisiana. This study
provided the direct input data for MEPDG: (1) thermal properties (CTE, thermal
conductivity, and heat capacity) of three different coarse aggregate concretes (Kentucky
limestone, gravel, and Mexican limestone) and (2) concrete mechanical properties with
ages (compressive strength, flexure strength, and modulus of elasticity) of each coarse
aggregate concrete. The thermal properties with three different types of coarse aggregate
were tabulated in Appendix B and can be used as input data in the MEPDG analysis to
predict the performance of PCC pavement. Based on both the MEPDG analysis and the
case study of other states, current maximum joint spacing [20 ft. (6.1 m)] can be adjusted
to 15 or 18 ft. (4.6 or 5.5 m) joint spacing when Kentucky limestone is used as coarse
aggregate. The findings of MEPDG analysis should be re-evaluated once the DARWin-
ME software is available.


ix
TABLE OF CONTENTS
ABSTRACT ....................................................................................................................... iii
ACKNOWLEDGEMENTS ................................................................................................. v
IMPLEMENTATION STATEMENT ............................................................................... vii
TABLE OF CONTENTS .................................................................................................... ix
LIST OF TABLES .............................................................................................................. xi
LIST OF FIGURES ......................................................................................................... xiii
INTRODUCTION ............................................................................................................... 1
OBJECTIVE ........................................................................................................................ 7
SCOPE ................................................................................................................................. 9
METHODOLOGY ............................................................................................................ 11
Apparatuses ............................................................................................................ 11
CTE ............................................................................................................. ….11
Thermal Conductivity and Heat Capacity........................................................ 13
Concrete Mixture Design ................................................................................. 14
Effect of Aggregates Types on CTE ................................................................ 17
Effect of Aging on CTE ................................................................................... 17
Effect of Dimension on CTE ........................................................................... 17
Effect of Coarse Aggregate Proportion on CTE .............................................. 17
Effect of Relative Humidity on CTE ............................................................... 18
Effect of Concrete Mechanical Properties on CTE ......................................... 21
Correction Factor (CF) for the Overestimated CTE ........................................ 23
DISCUSSION OF RESULTS ........................................................................................... 27
Effect of Aggregates Types on CTE ...................................................................... 27
Effect of Aging on CTE ......................................................................................... 28
Effect of Dimension on CTE ................................................................................. 29
Effect of Coarse Aggregate Proportion on CTE .................................................... 30
Effect of Relative Humidity on CTE ..................................................................... 32
Effect of Relative Humidity on Thermal Conductivity ......................................... 36
Effect of Concrete Mechanical Properties on CTE ................................................ 37
Other Results .......................................................................................................... 39
Correction Factor (CF) for the Overestimated CTE .............................................. 39
MEPDG Analysis (version 1.0) ............................................................................. 41
Stress Analysis Caused by Non-linear Temperature and Moisture Gradient ........ 45
CONCLUSIONS ............................................................................................................... 47
RECOMMENDATIONS ................................................................................................... 49
ACRONYMS, ABBREVIATIONS, AND SYMBOLS .................................................... 51
REFERENCES .................................................................................................................. 53
APPENDIX ........................................................................................................................ 57

x
APPENDIX A .................................................................................................................... 59
AASHTO TP-60 .................................................................................................... 59
APPENDIX B .................................................................................................................... 67
Thermal and Mechanical Properties in MEPDG ................................................... 67
APPENDIX C .................................................................................................................... 69
CTE Test Procedure (HM-251) and Raw Data from CTE Test Results ................ 69
Raw Data from CTE Test Result ....................................................................................... 72
APPENDIX D .................................................................................................................... 75
Overview of Inputs in MEPDG Software .............................................................. 75
APPENDIX E .................................................................................................................... 79
Reliability Summary of MEPDG Result (Kentucky limestone, 18 ft.
joint spacing) .......................................................................................................... 79

xi
LIST OF TABLES
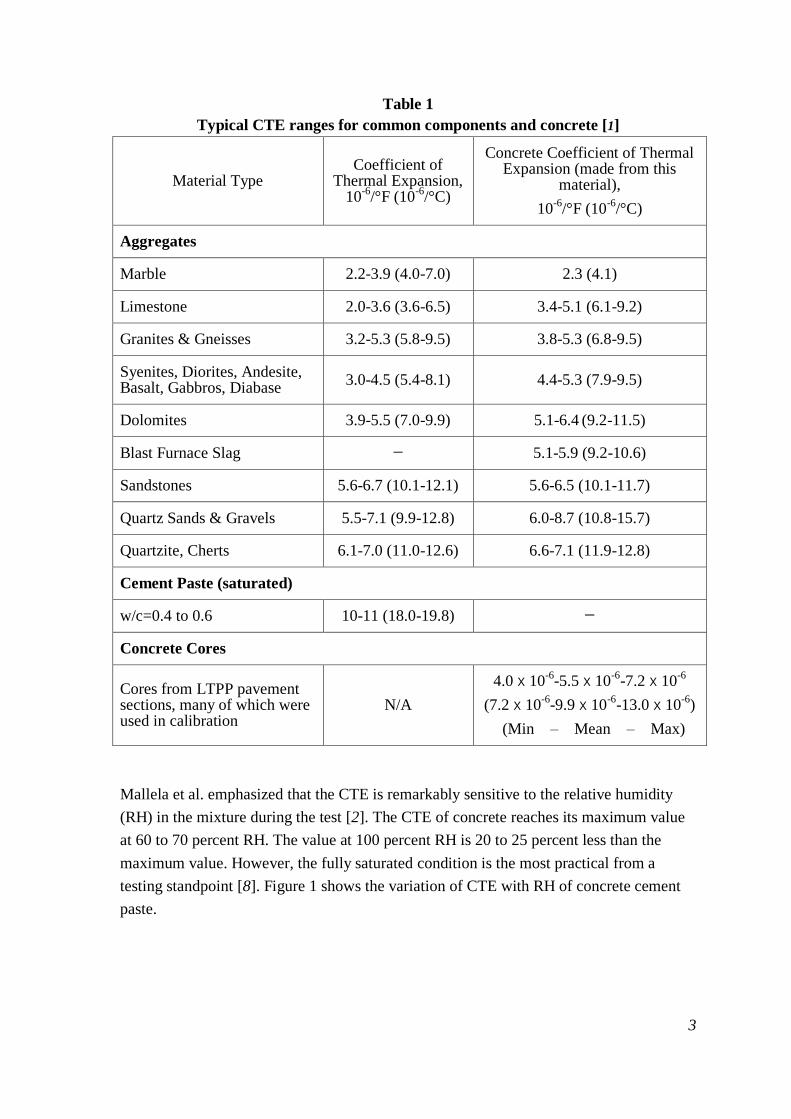
Table 1 Typical CTE ranges for common components and concrete [1] ........................... 3
Table 2 Concrete mixture designs .................................................................................... 15
Table 3 Mechanical properties of concrete mixtures ........................................................ 16
Table 4 CTE of the reference materials from two independent laboratories .................... 24
Table 5 Summary of ANOVA results ............................................................................... 27
Table 6 Chloride permeability based on charge passed .................................................... 36
Table 7 CTE values comparison between AASHTO TP 60-00 and
AASHTO T 336-09 ............................................................................................ 39
Table 8 ANOVA results of correction factor .................................................................... 40
Table 9 Thermal properties ............................................................................................... 67
Table 10 CTE unit conversion chart ................................................................................. 67
Table 11 Mechanical properties ........................................................................................ 68
Table 12 Reliability summary of MEPDG result ............................................................. 79


xiii
LIST OF FIGURES
Figure 1 Variation of CTE with moisture content of cement paste [5] ................................ 4
Figure 2 Temperature distribution in PCC slab (April, Urbana, IL) [11] ............................ 5
Figure 3 Temperature distribution in PCC slab (November, Urbana, IL) [11] .................... 6
Figure 4 Estimate of moisture profile in PCC slab [12]....................................................... 6
Figure 5 CTE measuring apparatus (HM-251) .................................................................. 11
Figure 6 Time vs displacement and temperature plot ........................................................ 12
Figure 7 Temperature vs strain plot ................................................................................... 12
Figure 8 Experimental procedure for determining thermal conductivity and heat
capacity ............................................................................................................... 13
Figure 9 Estimated typical response to a step input of temperature: (a) pure thermal
dilation, (b) thermal shrinkage, and (c) hygrothermal dilation [13] ................... 19
Figure 10 Dilation of solid particles caused by capillary relaxation with increasing
temperature [13] .................................................................................................. 20
Figure 11 Combination of three components of thermal dilation for various RH [13] ..... 20
Figure 12 Relative humidity measuring device (rapid RH) ............................................... 21
Figure 13 Compressive strength with concrete ages .......................................................... 22
Figure 14 Modulus of elasticity with various concrete ages .............................................. 22
Figure 15 Splitting tensile with various concrete ages (outlier of Kentucky limestone
at 28 days) ......................................................................................................... 23
Figure 16 Flexural strength with various concrete ages (outlier of Kentucky limestone
at 14 days) ......................................................................................................... 23
Figure 17 Old and new reference specimen ....................................................................... 25
Figure 18 Overview of upgraded HM-251 software .......................................................... 26
Figure 19 CTE with different aggregate types ................................................................... 28
Figure 20 CTE at several different ages of mixture ........................................................... 29
Figure 21 CTE of cylindrical and prismatic specimen ....................................................... 29
Figure 22 Effect of aggregate content on the thermal expansion of concrete [5] .............. 30
Figure 23 CTE vs proportion of coarse aggregate (Kentucky limestone) in concrete
mixture............................................................................................................... 31
Figure 24 CTE calculation by Hansen's model .................................................................. 32
Figure 25 Change of relative humidity in water ................................................................ 33
Figure 26 Representative CTE vs RH ................................................................................ 34
Figure 27 Expansion and contraction CTE vs RH ............................................................. 34
Figure 28 Rapid chloride permeability test ........................................................................ 35
Figure 29 Relationship between moisture content and weight change .............................. 36
Figure 30 Relationship between thermal conductivity and weight change ........................ 37
Figure 31 CTE vs compressive strength ............................................................................ 38
Figure 32 CTE vs modulus of elasticity ............................................................................. 38

xiv
Figure 33 Comparison of CFs at various aggregate types and proportions ....................... 40
Figure 34 Mean joint faulting vs joint spacing .................................................................. 43
Figure 35 Transverse cracking vs joint spacing ................................................................. 43
Figure 36 Terminal IRI vs joint spacing ............................................................................ 44
Figure 37 PCC pavement deformation under temperature, moisture, and loading [24] .... 45
Figure 38 Stress distribution through the slab thickness .................................................... 46
Figure 39 Overview of software ........................................................................................ 75
Figure 40 Design life, AADTT, slab thickness, and joint spacing..................................... 76
Figure 41 Thermal properties and mixture properties ........................................................ 76
Figure 42 Strength properties ............................................................................................. 77
Figure 43 Reliability summary of MEPDG result, faulting ............................................... 79
Figure 44 Reliability summary of MEPDG result, slab cracking ...................................... 80
Figure 45 Reliability summary of MEPDG result, IRI ...................................................... 80

INTRODUCTION
The National Cooperative Highway Research Program (NCHRP) released the
Mechanistic Empirical Pavement Design Guide in 2004. The MEPDG provides an
advanced pavement design analysis to determine both the structural response and
performance prediction within the design life of PCC pavement. The input parameters are
categorized by three groups, traffic, climatic, and materials data, and each group consists
of a hierarchical method that involves three levels. Level 1 provides the highest level of
reliability and can be used for heavy traffic pavement design. Level 2 provides the
intermediate level of reliability and is similar to the AASHTO pavement design guide.
Level 3 provides the lowest level of reliability and can be applied to the relatively less
significant pavement design. In order to obtain the highest reliability level of design, the
concrete mechanical properties for 7, 14, 28, and 90 days are used for Level 1 input
parameters in MEPDG.
The coefficient of thermal expansion has been widely considered as a fundamental
property of PCC pavement but has never played an important role in the thickness design
procedure for PCC pavement until recently. In the MEPDG developed through the
NCHRP 1-37A project, the CTE became a direct input parameter that was closely related
to the pavement performance [1]. Therefore, it was imperative to measure accurate CTE
for PCC pavement to predict critical pavement distresses within the designed years.
Mallela et al. found that increased CTE generally resulted in increasing cracking, joint
faulting, and International Roughness Index (IRI) in jointed plain concrete pavements
(JPCP) [2].
The current AASHTO test method (TP 60) measuring the CTE of hydraulic cement
concrete was first published in 2000 and reconfirmed in 2006 [3]. AASHTO TP 60 is the
only standard for measuring CTE, even though several researchers have suggested
improvements for a more accurate CTE. AASHTO TP 60 is attached in Appendix A. The
accuracy and repeatability of AASHTO TP 60 completely depend on the stability of
displacement reading at both 50°F and 122°F (10˚C and 50˚C), but investigation found
that both displacement readings are not stable. Won suggested a new regression model
that used the relationship between temperature and displacement changes from 59˚F to
113˚F (15˚C to 45˚C) since the temperature gradient through the cylindrical specimen
was not uniform between 50˚F and 59˚C (10˚C and 15˚C) and between 113˚F and 122˚F
(45˚C and 50˚C) [4]. Both methods provided the same CTE mean values [4.45 με/°F
(8.01 με/°C)], but the variation between the heating and cooling cycle of the proposed
regression model [0.03 με/°F (0.06 με/°C)] was much less than that of AASHTO TP 60
[0.13 με/°F (0.24 με/°C)]. The conversion table of CTE unit is provided in Appendix B.

2
CTE for PCC pavement is generally influenced by (1) types and volumetric proportion of
coarse aggregate in the mixture, (2) relative humidity in the mixture during the test, (3)
strength parameters of the mixture, and (4) the age of the mixture [2], [4], and [5].
According to Mindess et al., the CTE of limestone and quartzite are 3.3 με/°F and 6.1 to
7.2 με/°F (6 με/°C and 11 to 13 με/°C), respectively [5]. The CTE of cement pastes
ranges between 10 and 11.1 με/°F (18 and 20 με/°C). Due to the differences in the CTE of
concrete ingredients, the proportion of coarse aggregate in concrete mixtures should be
considered when the CTE is estimated. In a case of concrete having crushed limestone
with siliceous sand, the CTE decreases steeply when the amount of crushed limestone
increases. This is because the CTE of limestone is much smaller than that of cement paste
[5]. However, with quartz gravel and siliceous sand, the concrete CTE increases slowly
with the increase of the amount of quartz gravel. Typical CTE ranges for various
aggregates and cement paste are presented in Table 1.
Mallela et al. tested 673 cores representing hundreds of pavement sections throughout the
United States as part of the long term pavement performance (LTPP) program [2]. The
general range of CTE values of PCC is between 5 and 7 με/°F (9 and 12.6 με/°C), and
concrete made from igneous aggregates has CTE values around 5.2 με/°F or 5.3 με/°F
(9.4 με/°C or 9.5 με/°C) and that made from sedimentary rock has a typical value of 6
με/°F (10.8 με/°C). The mean CTE value of the entire data set is 5.7 με/°C (10.3 με/°C).
Alungbe et al. found that CTEs of three different aggregates (porous limestone, river
gravel, and dense limestone) were significantly different from one another at ages 28 and
90 days [6]. The water/cement ratio (0.53, 0.45, and 0.33) and cement content (508 lb/yd3,
564 lb/yd3, and 752 lb/yd
3) did not statistically show significant effects on the CTE.
Kohler et al. observed that the difference in CTE of oven-dried specimen between the
expansion and contraction was remarkable, and the difference was reduced during the
first 10 to 15 hours [7]. The expansion CTE decreased considerably, while the contraction
CTE stayed constant. This is because a rise in temperature decreases capillary tension and
causes water to enter the gel pores. The intrusion of water in the gel pores causes swelling
in addition to the normal thermal expansion, but no swelling is possible when the cement
paste is dry or saturated due to the absence of capillary tension. Thus, the coefficient of
thermal expansion in the two extreme cases is lower than that of partially saturated
conditions.
3
Table 1
Typical CTE ranges for common components and concrete [1]
Material Type Coefficient of
Thermal Expansion, 10
-6/°F (10
-6/°C)
Concrete Coefficient of Thermal Expansion (made from this
material),
10-6
/°F (10-6
/°C)
Aggregates
Marble 2.2-3.9 (4.0-7.0) 2.3 (4.1)
Limestone 2.0-3.6 (3.6-6.5) 3.4-5.1 (6.1-9.2)
Granites & Gneisses 3.2-5.3 (5.8-9.5) 3.8-5.3 (6.8-9.5)
Syenites, Diorites, Andesite, Basalt, Gabbros, Diabase
3.0-4.5 (5.4-8.1) 4.4-5.3 (7.9-9.5)
Dolomites 3.9-5.5 (7.0-9.9) 5.1-6.4 (9.2-11.5)
Blast Furnace Slag − 5.1-5.9 (9.2-10.6)
Sandstones 5.6-6.7 (10.1-12.1) 5.6-6.5 (10.1-11.7)
Quartz Sands & Gravels 5.5-7.1 (9.9-12.8) 6.0-8.7 (10.8-15.7)
Quartzite, Cherts 6.1-7.0 (11.0-12.6) 6.6-7.1 (11.9-12.8)
Cement Paste (saturated)
w/c=0.4 to 0.6 10-11 (18.0-19.8) −
Concrete Cores
Cores from LTPP pavement sections, many of which were used in calibration
N/A
4.0ⅹ10-6
-5.5ⅹ10-6
-7.2ⅹ10-6
(7.2ⅹ10-6
-9.9ⅹ10-6
-13.0ⅹ10-6
)
(Min – Mean – Max)
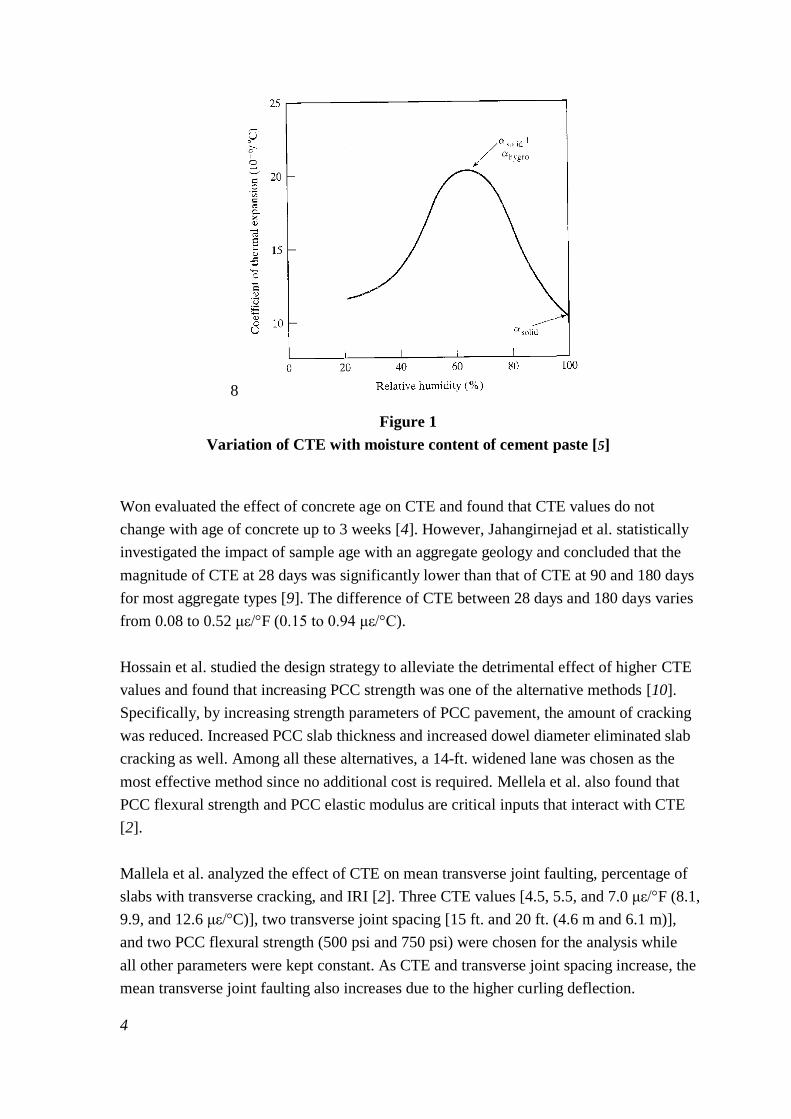
Mallela et al. emphasized that the CTE is remarkably sensitive to the relative humidity
(RH) in the mixture during the test [2]. The CTE of concrete reaches its maximum value
at 60 to 70 percent RH. The value at 100 percent RH is 20 to 25 percent less than the
maximum value. However, the fully saturated condition is the most practical from a
testing standpoint [8]. Figure 1 shows the variation of CTE with RH of concrete cement
paste.
4
8
Figure 1
Variation of CTE with moisture content of cement paste [5]
Won evaluated the effect of concrete age on CTE and found that CTE values do not
change with age of concrete up to 3 weeks [4]. However, Jahangirnejad et al. statistically
investigated the impact of sample age with an aggregate geology and concluded that the
magnitude of CTE at 28 days was significantly lower than that of CTE at 90 and 180 days
for most aggregate types [9]. The difference of CTE between 28 days and 180 days varies
from 0.08 to 0.52 με/°F (0.15 to 0.94 με/°C).
Hossain et al. studied the design strategy to alleviate the detrimental effect of higher CTE
values and found that increasing PCC strength was one of the alternative methods [10].
Specifically, by increasing strength parameters of PCC pavement, the amount of cracking
was reduced. Increased PCC slab thickness and increased dowel diameter eliminated slab
cracking as well. Among all these alternatives, a 14-ft. widened lane was chosen as the
most effective method since no additional cost is required. Mellela et al. also found that
PCC flexural strength and PCC elastic modulus are critical inputs that interact with CTE
[2].
Mallela et al. analyzed the effect of CTE on mean transverse joint faulting, percentage of
slabs with transverse cracking, and IRI [2]. Three CTE values [4.5, 5.5, and 7.0 με/°F (8.1,
9.9, and 12.6 με/°C)], two transverse joint spacing [15 ft. and 20 ft. (4.6 m and 6.1 m)],
and two PCC flexural strength (500 psi and 750 psi) were chosen for the analysis while
all other parameters were kept constant. As CTE and transverse joint spacing increase, the
mean transverse joint faulting also increases due to the higher curling deflection.

5
Increased CTE causes a high percentage of slabs with transverse cracking; for the longer
slab length of 20 ft. (6.1 m), transverse cracking increases remarkably even in the
increase at the smaller CTE values. Higher CTE generally results in increased IRI
because of increased transverse joint faulting and transverse cracking.
Temperature and moisture gradients in PCC pavement are considered important factors
that cause curling and warping stresses. As the variation of temperature and moisture
throughout the slab thickness increases, the severe loss of support develops in PCC
pavement. Thompson et al. observed that the temperature gradient along with slab depth
was non-linear and showed large daily and seasonal variation as shown in Figure 2 and
Figure 3 [11]. Jansen investigated the moisture gradient in the PCC pavement by using a
computer model based on laboratory and field measurements [12]. Figure 4 shows that
the top surface of pavement is at 50 percent saturation, while the bottom of pavement is at
100 percent saturation. The variance of moisture is only remarkable within the top 2 in.
(50.8 mm) of PCC slab and the bottom of slab has more than 80 percent saturation.
Figure 2
Temperature distribution in PCC slab (April, Urbana, IL) [11]

6
Figure 3
Temperature distribution in PCC slab (November, Urbana, IL) [11]
Figure 4
Estimate of moisture profile in PCC slab [12]
7
OBJECTIVE
The objectives of this research were to measure typical CTE values of concrete mixtures
used for PCC pavement structures in accordance to the AASHTO TP 60-00; to
investigate the relationship between CTE and other critical variables such as aggregate
types, age of concrete, dimension of specimen, amount of course aggregate in mixture,
relative humidity, and concrete mechanical properties; and to assist in the implementation
of MEPDG for PCC pavement design in Louisiana. The recommendations for the coarse
aggregate type in the mixture and maximum joint spacing in JPCP are provided based on
the results of the MEPDG analysis. This study also calculated the curling stresses in the
PCC pavement due to non-linear temperature and moisture gradients throughout the slab
thickness. The second objectives were to re-measure the CTE of the concrete specimen in
accordance to the recently adapted AASHTO T 336-09, and find calibration factors to
convert the CTE values measured by AASHTO TP 60-00 without further measurements.


9
SCOPE
Three aggregates widely used in Louisiana, Kentucky limestone, gravel, and Mexican
limestone, were chosen for the coarse aggregate of concrete mixture, and CTE tests were
performed to find the aggregate effects on CTE. CTE is also measured at various ages (3,
5, 7, 14, 28, 60, and 90 days); various coarse aggregate proportions (20, 64, 80 percent of
coarse aggregates); and various relative humidities (between 30 and 100% RH) of
specimens to verify the factor that has the most critical impact on CTE. After finding the
relationship between CTE and other critical variables, the results of CTE and mechanical
property tests were used to run the MEPDG analysis. The results of the MEPDG analysis
were PCC pavement distresses such as mean joint faulting, transverse cracking, and
terminal IRI. Appropriate coarse aggregate type and joint spacing in JPCP can be
recommended by comparing the results of the MEPDG analysis to the specification. CTE
tests of three coarse aggregate types (Kentucky limestone, gravel, and Mexican limestone)
and two various coarse aggregate proportions (20 and 80 percent of coarse aggregates)
were performed in accordance to AASHTO T 336-09 to calibrate the incorrect CTE
values measured by AASHTO TP 60-00.


11
METHODOLOGY
Apparatuses
CTE
To measure the CTE of concrete, a HM-251 CTE measuring system manufactured by
Gilson/Challenge technology was used. Figure 5 shows the apparatus.
Figure 5
CTE measuring apparatus (HM-251)
The HM-251 strictly follows AASHTO TP 60 mentioned earlier. The HM-251 is divided
into three parts: measuring frame, system cabinet with water bath, and a heating/cooling
circulator. The measuring frame is designed for a typical cylindrical specimen, and its
height can be adjusted depending on the specimen heights. A precise linear variable
displacement transducer (LVDT) with a resolution of 0.122*10-8
in. (3.1*10-8
mm) and
total travel distance of 0.05 in. (1.27 mm) is installed on the top of the frame and
measures the length change of concrete specimen automatically. The material of the
measuring frame is A304 stainless steel, which is used to eliminate corrosion of the
frame. A calibration bar [8 in. (203.2 mm)] made with the same material as the measuring
frame is used to calibrate the length change of the frame itself. During the calibration
process, the calibration factor of the stainless frame was measured and directly used for
the calculation of concrete CTE. The water bath mounted in the system cabinet is of
appropriate size to place the measuring frame. A temperature probe is installed inside the
LVDT
Measuring frame
Water level control reservoir
Temperature probe
Water bath
System cabinet Heating/cooling
circulator
12
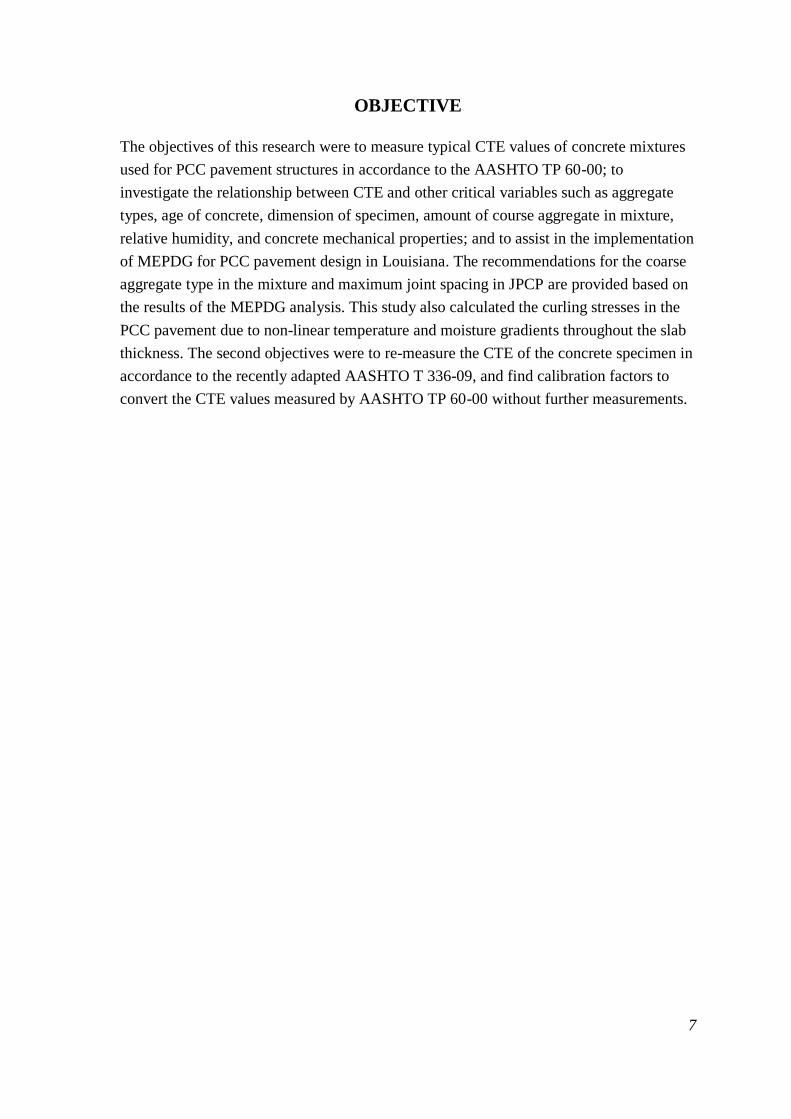
water bath to measure water temperature continually. The water level in the bath is
maintained constant by a water level control reservoir to prevent the effect of evaporation
during heating. The heating/ cooling circulator is separated from the water bath because
its vibration can affect the measurement of the LVDT. The heating/cooling circulator is
controlled by the HM-251 software to increase and decrease the water temperature
between 50°F and 122°F (10°C and 50°C). When the temperature changes from 50°F and
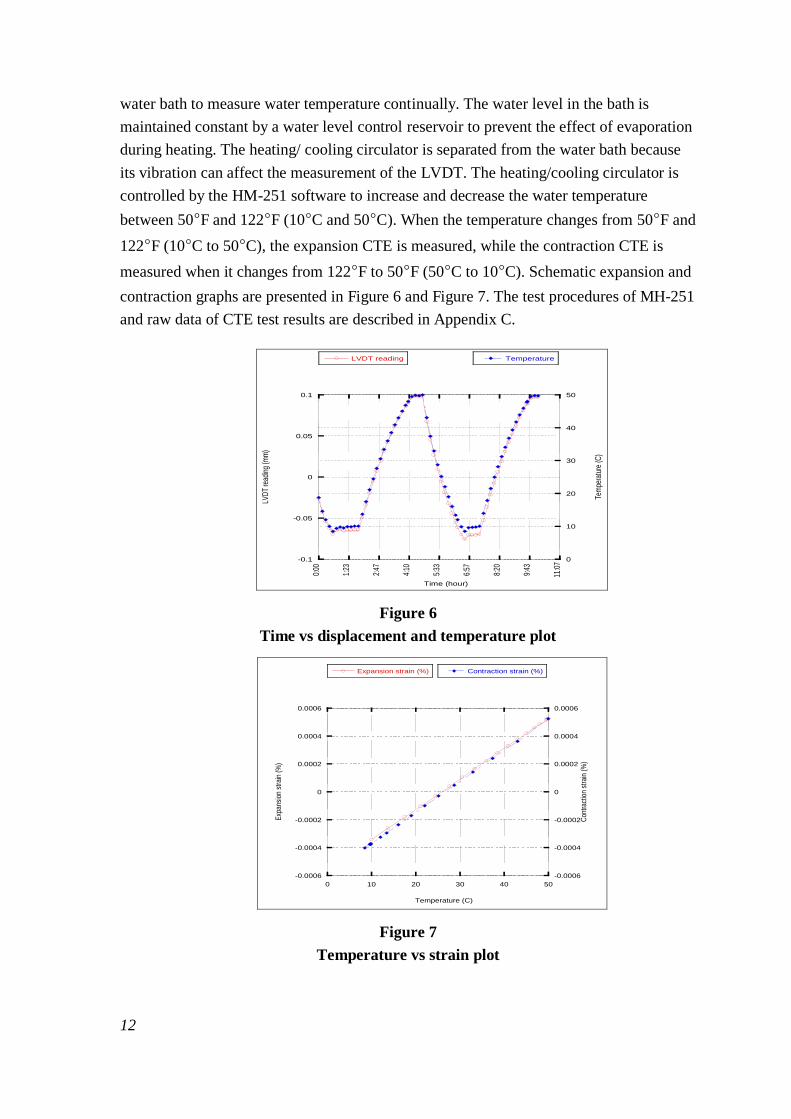
122°F (10°C to 50°C), the expansion CTE is measured, while the contraction CTE is
measured when it changes from 122°F to 50°F (50°C to 10°C). Schematic expansion and
contraction graphs are presented in Figure 6 and Figure 7. The test procedures of MH-251
and raw data of CTE test results are described in Appendix C.
-0.1
-0.05
0
0.05
0.1
0
10
20
30
40
50
0:00
1:23
2:47
4:10
5:33
6:57
8:20
9:43
11:0
7
LVDT reading Temperature
LVD
T re
adin
g (m
m)
Tem
pera
ture
(C)
Time (hour)
Figure 6
Time vs displacement and temperature plot
-0.0006
-0.0004
-0.0002
0
0.0002
0.0004
0.0006
-0.0006
-0.0004
-0.0002
0
0.0002
0.0004
0.0006
0 10 20 30 40 50
Expansion strain (%) Contraction strain (%)
Exp
ansi
on s
trai
n (%
)
Con
trac
tion
stra
in (
%)
Temperature (C)
Figure 7
Temperature vs strain plot

13
The test is terminated when the difference between expansion CTE and contraction CTE
is within 0.2 με/°F (0.3 με/°C), and the average value of two CTEs becomes a
“representative” CTE. Otherwise, the software adjusts the temperature for another cycle
and calculates the CTE. The CTE of concrete is calculated by the following equation:
(1)
where,
ΔLa = actual length change of specimen during temperature change,
Lo = initial length of specimen at room temperature, and
ΔT = measured temperature change (increase = positive, decrease = negative).
The fabricated concrete specimen is of cylindrical shape and its dimensions are 4 in.
(101.6 mm) in diameter by 8 in. (203.2 mm) in height. The concrete specimen was
ground to reduce the height to 7.5 in. (190 mm) to match the height of the calibration bar
provided with the CTE device.
Thermal Conductivity and Heat Capacity
Quickline-30 manufactured by Anter Corporation is multi-functional equipment used for
measuring surface temperatures, thermal conductivity, heat capacity, and thermal
diffusivity. This method takes a few minutes to reach steady-state conditions. The factors
influencing the measurement of the readings are quality of thermal contact between the
probe and specimen, temperature differences between the surface specimen and room
temperature, dimensions of the sample, and moisture content. Measurement range of
thermal conductivity is 0.08-2W/m-K, and the precision is ±10 percent of the reading
value. Measurement temperature is -40°F to 752°F (-40°C to 400°C), and it typically
takes 16-20 minutes. Figure 8 shows the schematic figure of Quickline-30.
Figure 8
Experimental procedure for determining thermal conductivity and heat capacity

14
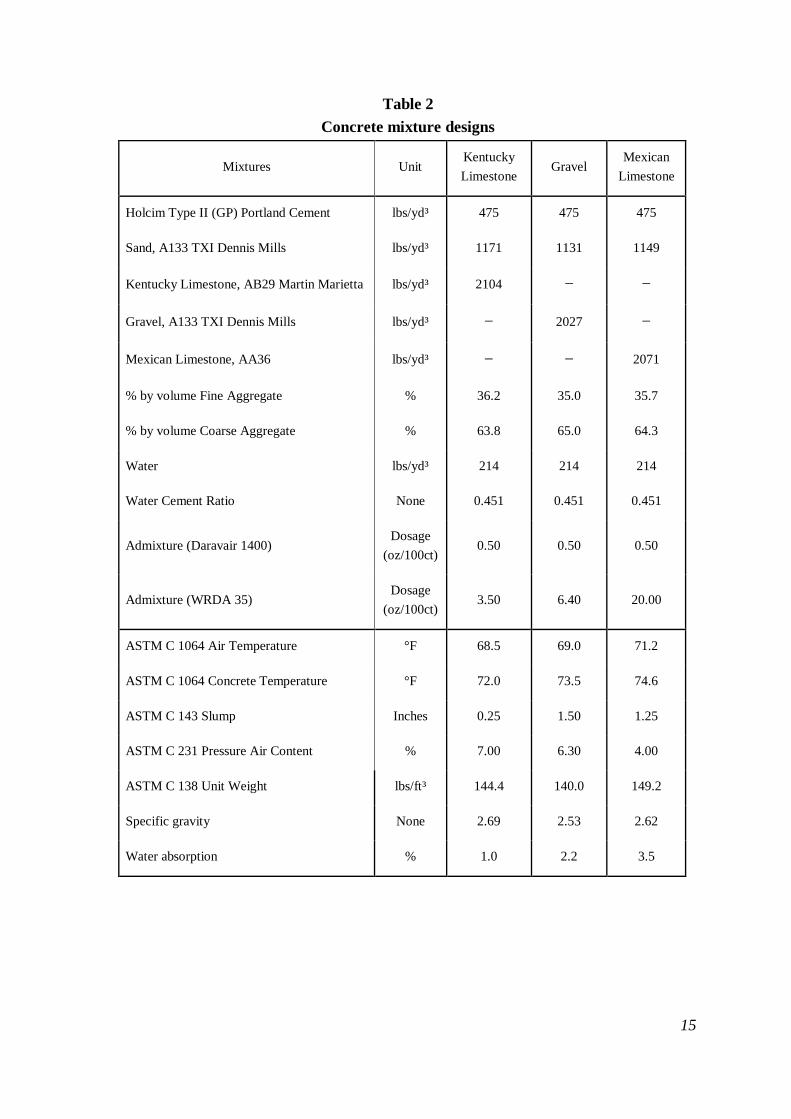
Concrete Mixture Design
To study the effects of different parameters on CTE, three different mixtures were
designed as shown in Table 2. The three mixtures had different coarse aggregates:
Kentucky limestone, river gravel, and Mexican limestone. These three aggregates were
chosen because they are the most widely used in pavement construction in Louisiana. The
mixtures were named with the coarse aggregate due to its dominant effects on CTE. A
siliceous sand (A 133 TXI Dennis Mills) was used for fine aggregate for all of the
mixtures. The percentile of coarse aggregate and fine aggregate were kept close to 64
percent and 36 percent, respectively. The same amount of type II Portland cement
(Holcim) was used in all blends. A constant water-to-cement (w/c) ratio of 0.451 was
used for the mixtures to minimize the effect of cement paste. Daravair 1440 and WRDA
35 were used as admixtures to provide desirable air content and workability. Fresh
concrete properties were measured according to ASTM standards and are provided in
Table 2. Hardened mechanical properties of the mixtures were measured at several ages
to study aging effects and are presented in Table 3. Detailed discussions on the hardened
mechanical properties of the concrete will follow in a later section.
15
Table 2
Concrete mixture designs
Mixtures Unit Kentucky
Limestone Gravel
Mexican
Limestone
Holcim Type II (GP) Portland Cement lbs/yd³ 475 475 475
Sand, A133 TXI Dennis Mills lbs/yd³ 1171 1131 1149
Kentucky Limestone, AB29 Martin Marietta lbs/yd³ 2104 − −
Gravel, A133 TXI Dennis Mills lbs/yd³ − 2027 −
Mexican Limestone, AA36 lbs/yd³ − − 2071
% by volume Fine Aggregate % 36.2 35.0 35.7
% by volume Coarse Aggregate % 63.8 65.0 64.3
Water lbs/yd³ 214 214 214
Water Cement Ratio None 0.451 0.451 0.451
Admixture (Daravair 1400) Dosage
(oz/100ct) 0.50 0.50 0.50
Admixture (WRDA 35) Dosage
(oz/100ct) 3.50 6.40 20.00
ASTM C 1064 Air Temperature °F 68.5 69.0 71.2
ASTM C 1064 Concrete Temperature °F 72.0 73.5 74.6
ASTM C 143 Slump Inches 0.25 1.50 1.25
ASTM C 231 Pressure Air Content % 7.00 6.30 4.00
ASTM C 138 Unit Weight lbs/ft³ 144.4 140.0 149.2
Specific gravity None 2.69 2.53 2.62
Water absorption % 1.0 2.2 3.5

16
Table 3
Mechanical properties of concrete mixtures
Coarse
Aggregate
Mechanical property
tests
7 days 14 days 28 days 90 days
Avg. S Dev Avg. S Dev Avg. S Dev Avg. S Dev
Kentucky
Limestone
Compressive strength
(psi) 6,015 114.4 6,775 49.0 7,408 271.4 8,640 115.8
Modulus of Elasticity
(106psi)
5.883 0.378 5.866 0.621 6.466 0.375 6.750 0.132
Poisson's ratio 0.23 0.03 0.27 0.03 0.26 0.02 0.26 0.02
Flexural strength (psi) 678 112.4 925 48.1 811 12.7 809 84.9
Splitting Tensile (psi) 497 − 528 − 456 − 594 −
Gravel
Compressive strength
(psi) 3,782 72.8 4,363 101.8 4,900 172.4 6,004 376.4
Modulus of Elasticity
(106psi)
5.033 0.407 4.766 0.076 5.083 0.104 5.866 0.076
Poisson's ratio 0.23 0.01 0.15 0.02 0.14 0.03 0.15 0.02
Flexural strength (psi) 519 9.9 551 0.0 589 65.8 738 86.3
Splitting Tensile (psi) 396 53.0 424 48.8 455 41.0 532 31.1
Mexican
Limestone
Compressive strength
(psi) 4,671 570.0 5,272 331.1 5,935 355.7 6,314 177.8
Modulus of Elasticity
(106psi)
4.150 0.086 4.600 0.050 4.550 0.086 4.633 0.076
Poisson's ratio 0.19 0.01 0.23 0.03 0.26 0.01 0.22 0.04
Flexural strength (psi) 559 29.0 652 26.2 686 27.6 710 106.1
Splitting Tensile (psi) 394 54.5 423 14.1 425 2.1 433 1.4
* The average and standard deviation are based on three samples for compressive
strength, modulus of elasticity and Poisson’s ratio, and two samples for flexure strength
and splitting tensile test.

17
Effect of Aggregates Types on CTE
CTE is influenced by aggregate types in the mixture. In this research, three popular
coarse aggregates used in Louisiana were chosen for practical purposes. Those aggregates
were Kentucky limestone, river gravel, and Mexican limestone. Kentucky and Mexican
limestone have a different origin, and Mexican limestone is more absorptive. CTE tests
were performed at several ages to compare the variation of CTE depending on aggregate
types.
Effect of Aging on CTE
To investigate the aging effect on CTE, cylindrical specimens were produced in the
laboratory. To eliminate experimental variability, all specimens were produced from the
same batch. The specimens were cured in a 100 percent moisture chamber until the time
of testing. CTEs were measured at 3, 5, 7, 14, 28, 60, and 90 days for each concrete
mixture and compared.
Effect of Dimension on CTE
To verify the scale effect on CTE, both cylindrical [4 in. (101.6 mm) diameter and 8 in.
(203.2 mm) high] and prismatic [3 in. (76.2 mm) long, 3 in. (76.2 mm) wide, and 8 in.
(203.2 mm) high] specimens for Kentucky limestone were fabricated at the same batch.
The specimens were cured in a 100 percent moisture chamber until the time of testing.
CTE tests were conducted at 7, 14, 28, and 60 days, and the CTE value of prismatic
specimen was compared to the CTE value of cylindrical specimen.
Effect of Coarse Aggregate Proportion on CTE
The CTE is also influenced by the volume fraction of cement paste and aggregates since
the CTEs of the ingredients are different. To verify it, two additional mixtures were
fabricated. In the Kentucky limestone mixture, the volume of coarse aggregate was
changed to 20 percent and 80 percent while keeping the total volume of aggregates
constant. That means the volume of fine aggregate was changed to 80 percent and 20
percent, respectively. The 20 percent and 80 percent volume of coarse aggregate are
rather extreme cases and were chosen to verify the relationship between the amount of
coarse aggregates and CTE.

18
Effect of Relative Humidity on CTE
The CTE is commonly defined by a constant value in MEPDG, but it has been known
that CTE varies depending on RH. The mechanism of moisture interaction is classified by
three categories: (1) pure thermal dilation, (2) thermal shrinkage or swelling, and (3)
relative humidity change [13].
1. Pure thermal dilation
This is the dilation due to the CTE of each constituent material, such as solid
particles, adsorbed water, and pore water. As temperature increases rapidly,
immediate expansion of each constituent occurs and then a time dependent
contraction occurs because excess pore pressure created by expansion of each
constituent dissipates by moving to an empty space of pores. This phenomenon is
also effective in a cooling process where immediate contraction occurs followed
by a time dependent expansion. Figure 9(a) explains the pure thermal dilation
with various RH where higher RH has larger amounts of both an immediate
expansion and a time dependent contraction during the heating process.
2. Thermal shrinkage or swelling
Pore water is categorized by two phases: (1) gel water is located in the
interconnected spaces between the solid particles such as interlayer water and
absorbed water in very small pores and (2) capillary water is free water, which
induces capillary tension in partially saturated condition and its space is much
larger than gel water. Increasing temperature cause the moisture to move from gel
pores to capillary pores leading to shrinkage, while a cooling process drives the
water from capillary pores to gel pores leading to expansion. The amount of
shrinkage in the heating process increases as the RH increases since a thicker
layer of gel water is prone to move easier than a thin layer of gel water as shown
in Figure 9(b).

19
Figure 9
Estimated typical response to a step input of temperature: (a) pure thermal dilation,
(b) thermal shrinkage, and (c) hygrothermal dilation [13]
3. Relative humidity change
Once the RH increases above 45 percent, capillary tension plays the most
important role in shrinkage and dilation mechanism, while capillary tension
doesn’t exist below 45 percent RH due to the instability of meniscus [13].
Capillary tension is related to the curved capillary meniscus in the partially
saturated porous materials, and the relationship is presented by using the Laplace
equation:
(2)
where, is the surface tension of the poor fluid, and r is the average radius of
meniscus curvature.
(3)
where, RH is the initial relative humidity, R is the universal gas constant, T is the
temperature in Kelvin, and is the molar volume of water.
(4)
(h: Relative humidity)
20
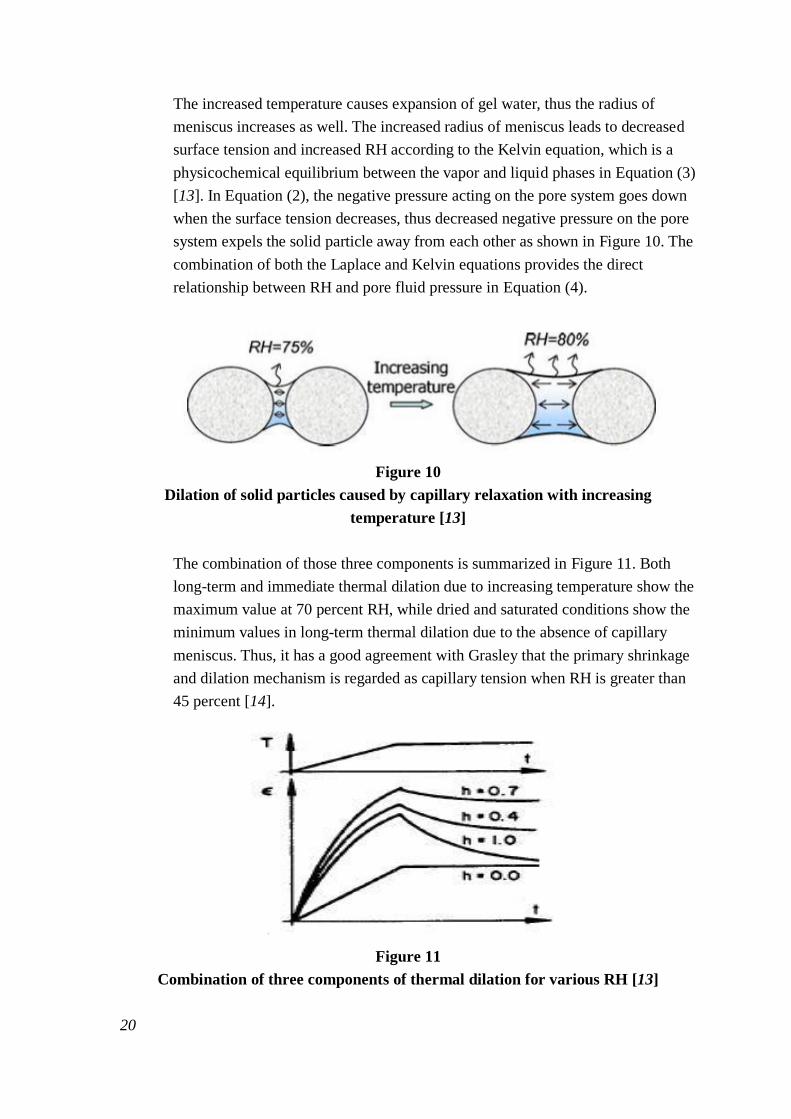
The increased temperature causes expansion of gel water, thus the radius of
meniscus increases as well. The increased radius of meniscus leads to decreased
surface tension and increased RH according to the Kelvin equation, which is a
physicochemical equilibrium between the vapor and liquid phases in Equation (3)
[13]. In Equation (2), the negative pressure acting on the pore system goes down
when the surface tension decreases, thus decreased negative pressure on the pore
system expels the solid particle away from each other as shown in Figure 10. The
combination of both the Laplace and Kelvin equations provides the direct
relationship between RH and pore fluid pressure in Equation (4).
Figure 10
Dilation of solid particles caused by capillary relaxation with increasing
temperature [13]
The combination of those three components is summarized in Figure 11. Both
long-term and immediate thermal dilation due to increasing temperature show the
maximum value at 70 percent RH, while dried and saturated conditions show the
minimum values in long-term thermal dilation due to the absence of capillary
meniscus. Thus, it has a good agreement with Grasley that the primary shrinkage
and dilation mechanism is regarded as capillary tension when RH is greater than
45 percent [14].
Figure 11
Combination of three components of thermal dilation for various RH [13]

21
AASHTO TP 60 clearly states that the specimen shall be conditioned by submersion in
saturated limewater at 73±4°F (23±2°C) for no less than 48 hours until two successive
weightings of the surface-dried sample at intervals of 24 hours show an increase in
weight of less than 0.5 percent [3]. As mentioned earlier, the saturated condition was
chosen from a practical testing point of view. In reality, PCC pavements are neither a dry
nor saturated condition. Janssen found that the moisture condition at the top 2 in. (50.8
mm) of PCC pavement changes significantly [12]. A nonlinear gradient of moisture may
cause a non-uniform CTE in PCC pavements, and a synergy effect with nonlinear
temperature gradient can result in significant curling and joint problems. Therefore, it is
necessary to measure the CTE corresponding to changing relative humidity inside the
specimen to better understand pavement performance under changing temperatures and
moisture conditions. RH was measured using the Rapid RH (ASTM F2170-02) device
manufactured by Wagner Electronics as shown in Figure 12. It consists of a smart sensor
probe and an RH reader. First, a hole [0.75 in. (19.1 mm) diameter and 1.75 in. (44.5 mm)
deep] was drilled at the top surface of the cylindrical specimen (Mexican limestone
specimen). A smart sensor probe was installed in the hole. The RH reader was inserted
inside of the smart sensor and both temperature and relative humidity of the concrete
specimen were measured immediately.
Figure 12
Relative humidity measuring device (rapid RH)
Effect of Concrete Mechanical Properties on CTE
Several mechanical property tests were conducted at 7, 14, 28, and 90 days. The
mechanical property tests include compressive strength (ASTM C39), modulus of
elasticity (ASTM C469), Poisson’s ratio (ASTM C469), flexure strength (ASTM C78),
and splitting tensile test (ASTM C496). These properties were compared with the CTE
22
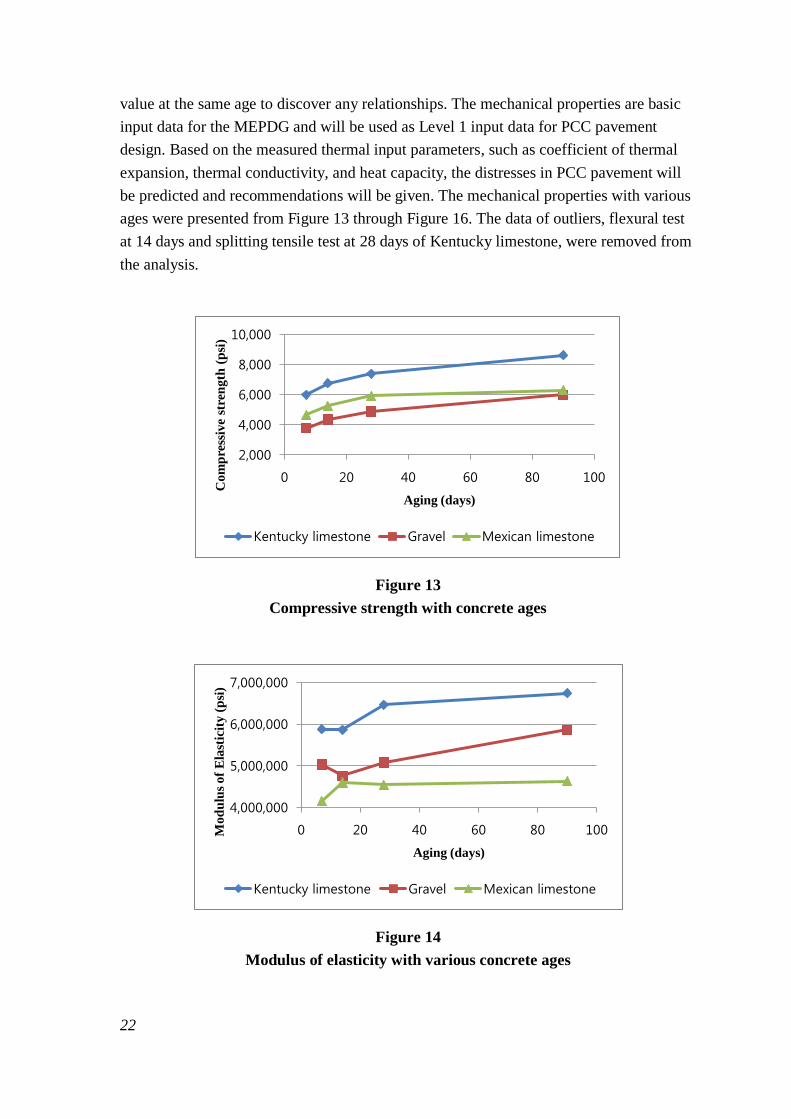
value at the same age to discover any relationships. The mechanical properties are basic
input data for the MEPDG and will be used as Level 1 input data for PCC pavement
design. Based on the measured thermal input parameters, such as coefficient of thermal
expansion, thermal conductivity, and heat capacity, the distresses in PCC pavement will
be predicted and recommendations will be given. The mechanical properties with various
ages were presented from Figure 13 through Figure 16. The data of outliers, flexural test
at 14 days and splitting tensile test at 28 days of Kentucky limestone, were removed from
the analysis.
Figure 13
Compressive strength with concrete ages
Figure 14
Modulus of elasticity with various concrete ages
2,000
4,000
6,000
8,000
10,000
0 20 40 60 80 100
Com
pre
ssiv
e st
ren
gth
(p
si)
Aging (days)
Kentucky limestone Gravel Mexican limestone
4,000,000
5,000,000
6,000,000
7,000,000
0 20 40 60 80 100 Mod
ulu
s of
Ela
stic
ity (
psi
)
Aging (days)
Kentucky limestone Gravel Mexican limestone

23
Figure 15
Splitting tensile with various concrete ages (outlier of Kentucky limestone at 28 days)
Figure 16
Flexural strength with various concrete ages (outlier of Kentucky
limestone at 14 days)
Correction Factor (CF) for the Overestimated CTE
The FHWA issued a memorandum on December 2009 to take an action on the “Concrete
Coefficient of Thermal Expansion Input for MEPDG” [15]. According to the
memorandum, FHWA has identified a problem with the American Association of State
Highway Transportation Official (AASHTO) TP 60-00 provisional test method used to
measure the CTE for concrete. The CTE value of the reference specimen (304 stainless
steel) for determining a calibration factor to account for expansion of the measuring
apparatus was based on the literature values [9.6×10⁻⁶
/°F (17.3×10⁻⁶
/°C)], instead of the
300
400
500
600
0 20 40 60 80 100
Sp
litt
ing t
ensi
le (
psi
)
Aging (days)
Kentucky limestone Gravel Mexican limestone
500
600
700
800
900
0 20 40 60 80 100
Fle
xu
ral
stre
ngth
(p
si)
Aging (days)
Kentucky limestone Gravel Mexican limestone
24
actual CTE value based on the temperature range specified 50°F to 122°F (10 to 50°C) in
AASHTO TP 60-00 [3]. The use of the incorrect CTE value for the reference specimen
has also resulted in a higher CTE value for the specimen being tested according to TP 60-
00. In order to fix this problem, AASHTO adopted T 336-09 test standard to replace the
TP 60-00 provisional test method [16].
There is a need to re-measure the CTE value according to AASHTO T 336-09 since the
measured CTE value used the incorrect CTE value of the reference specimen. Therefore,
this study was revised to measure the correct CTE of the concrete specimens in
accordance to AASHTO T 336-09, and find calibration factors to convert the CTE values
measured by AASHTO TP 60-00 without further measurements.
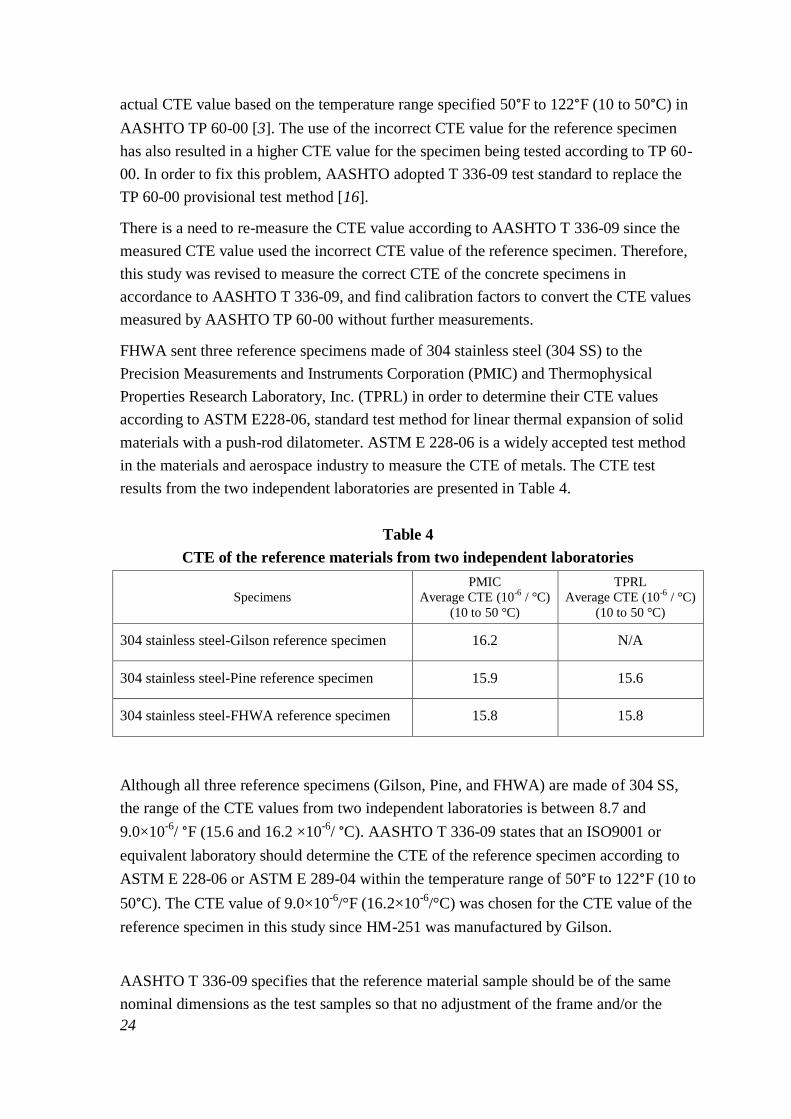
FHWA sent three reference specimens made of 304 stainless steel (304 SS) to the
Precision Measurements and Instruments Corporation (PMIC) and Thermophysical
Properties Research Laboratory, Inc. (TPRL) in order to determine their CTE values
according to ASTM E228-06, standard test method for linear thermal expansion of solid
materials with a push-rod dilatometer. ASTM E 228-06 is a widely accepted test method
in the materials and aerospace industry to measure the CTE of metals. The CTE test
results from the two independent laboratories are presented in Table 4.
Table 4
CTE of the reference materials from two independent laboratories
Specimens
PMIC
Average CTE (10-6
/ °C)
(10 to 50 °C)
TPRL
Average CTE (10-6
/ °C)
(10 to 50 °C)
304 stainless steel-Gilson reference specimen 16.2 N/A
304 stainless steel-Pine reference specimen 15.9 15.6
304 stainless steel-FHWA reference specimen 15.8 15.8
Although all three reference specimens (Gilson, Pine, and FHWA) are made of 304 SS,
the range of the CTE values from two independent laboratories is between 8.7 and
9.0×10⁻⁶
/ °F (15.6 and 16.2 ×10⁻⁶
/ °C). AASHTO T 336-09 states that an ISO9001 or
equivalent laboratory should determine the CTE of the reference specimen according to
ASTM E 228-06 or ASTM E 289-04 within the temperature range of 50°F to 122°F (10 to
50°C). The CTE value of 9.0×10⁻⁶
/°F (16.2×10⁻⁶
/°C) was chosen for the CTE value of the
reference specimen in this study since HM-251 was manufactured by Gilson.
AASHTO T 336-09 specifies that the reference material sample should be of the same
nominal dimensions as the test samples so that no adjustment of the frame and/or the

25
LVDT is necessary between calibration and testing. Thus, a full size reference specimen
[4 in. (101.6 mm) diameter and 7 in. (177.8 mm) height] made of 304 SS [Figure 17 (b)]
was purchased to calibrate the testing frame and correctly measure the concrete CTE.
(a) Old reference specimen (b) New reference specimen
Figure 17
Old and new reference specimen
The HM-251 manufactured by Gilson/Challenge technology was developed to measure
CTE in accordance to AASHTO TP 60-00. The length change of the measuring frame
was determined by testing a reference specimen of the known CTE value. A 304 SS was
used as a reference specimen in HM-251 and the erroneous literature value [9.6×10⁻⁶
/°F
(17.3×10⁻⁶
/°C)] was built in as a known CTE of the reference specimen. Thus, the
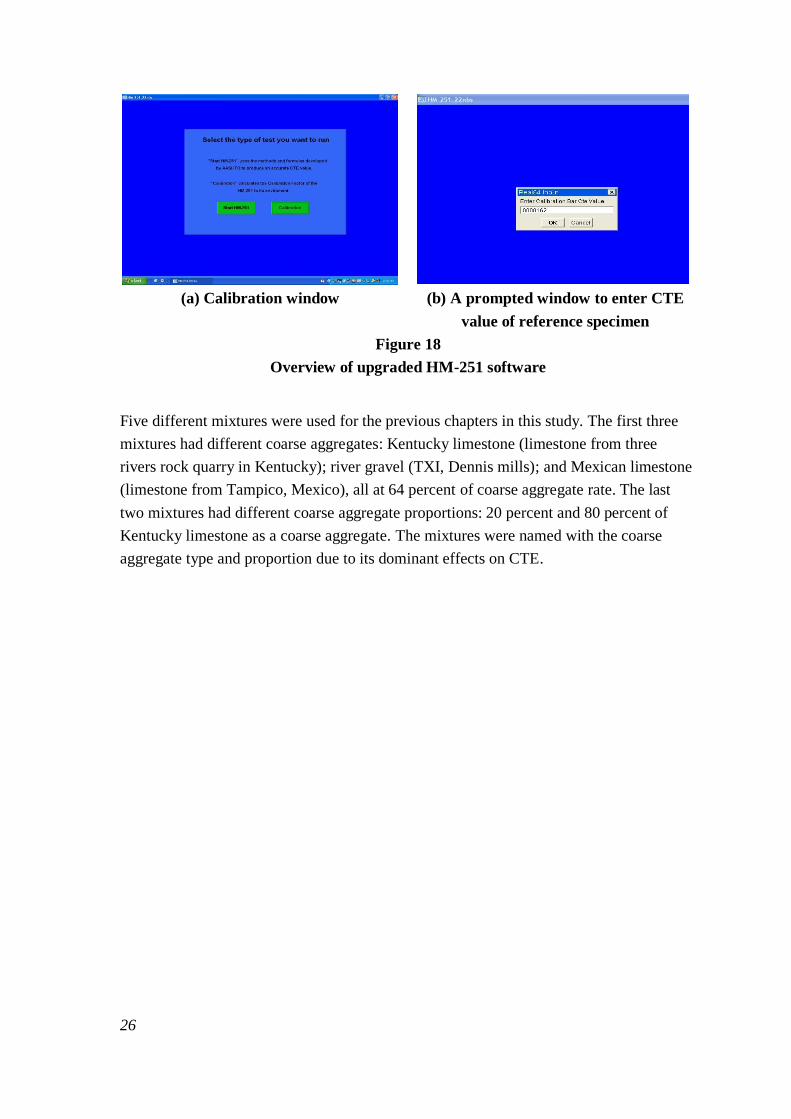
Gilson/Challenge technology provided an upgraded software that allows the user to input
the CTE value of the reference specimen to overcome this problem. Figure 18 shows the
overview of the upgraded HM-251 software. When the calibration testing is running,
click the calibration button in Figure 18 (a) and a prompted window will show up as
shown in Figure 18 (b). The CTE value of reference specimen can be typed in the box.
After completion of the calibration process, the typed CTE value of the reference
specimen will be effective in the subsequent CTE testing.
26
(a) Calibration window (b) A prompted window to enter CTE
value of reference specimen
Figure 18
Overview of upgraded HM-251 software
Five different mixtures were used for the previous chapters in this study. The first three
mixtures had different coarse aggregates: Kentucky limestone (limestone from three
rivers rock quarry in Kentucky); river gravel (TXI, Dennis mills); and Mexican limestone
(limestone from Tampico, Mexico), all at 64 percent of coarse aggregate rate. The last
two mixtures had different coarse aggregate proportions: 20 percent and 80 percent of
Kentucky limestone as a coarse aggregate. The mixtures were named with the coarse
aggregate type and proportion due to its dominant effects on CTE.

27
DISCUSSION OF RESULTS
In order to analyze test results more efficiently, an ANOVA was utilized in this research.
Statistical analyses (ANOVA) of each variable were performed on the corresponding
CTE, and the overall ANOVA results are summarized in Table 5.
Table 5
Summary of ANOVA results
Variables DF F-value P > F Significance
Aggregate types (KL, G, ML) 2 2852.56 < .0001 Yes
Mixture age 6 0.46 0.8195 No
Dimension of specimen 1 24.72 0.0025 Yes
Coarse aggregate proportion (57.8, 46.1, 14.5% of KL) 2 419.74 < .0001 Yes
Relative humidity (Average CTE) 5 0.78 0.5976 No
Relative humidity (expansion CTE) 6 4.40 0.0366 Yes
Concrete mechanical properties 3 0.06 0.9794 No
(KL: Kentucky Limestone, G: Gravel, ML: Mexican Limestone)
The P-value means the probability of error of the statement. A small P-value for a
variable indicated that the variable has a significant effect. If the P-value of the variable is
equal to or less than alpha (α), the variable is regarded as having a significant effect on
measuring parameters. Alpha is a probability error level and 0.05 was used in the
analysis. It should be emphasized that a statistical significance does not necessarily imply
a practical significance or vice versa.
Effect of Aggregates Types on CTE
The average CTE for Kentucky limestone, gravel, and Mexican limestone concrete were
4.964 με/°F, 7.144 με/°F, and 4.900 με/°F (8.935 με/°C, 12.860 με/°C, and 8.820 με/°C),
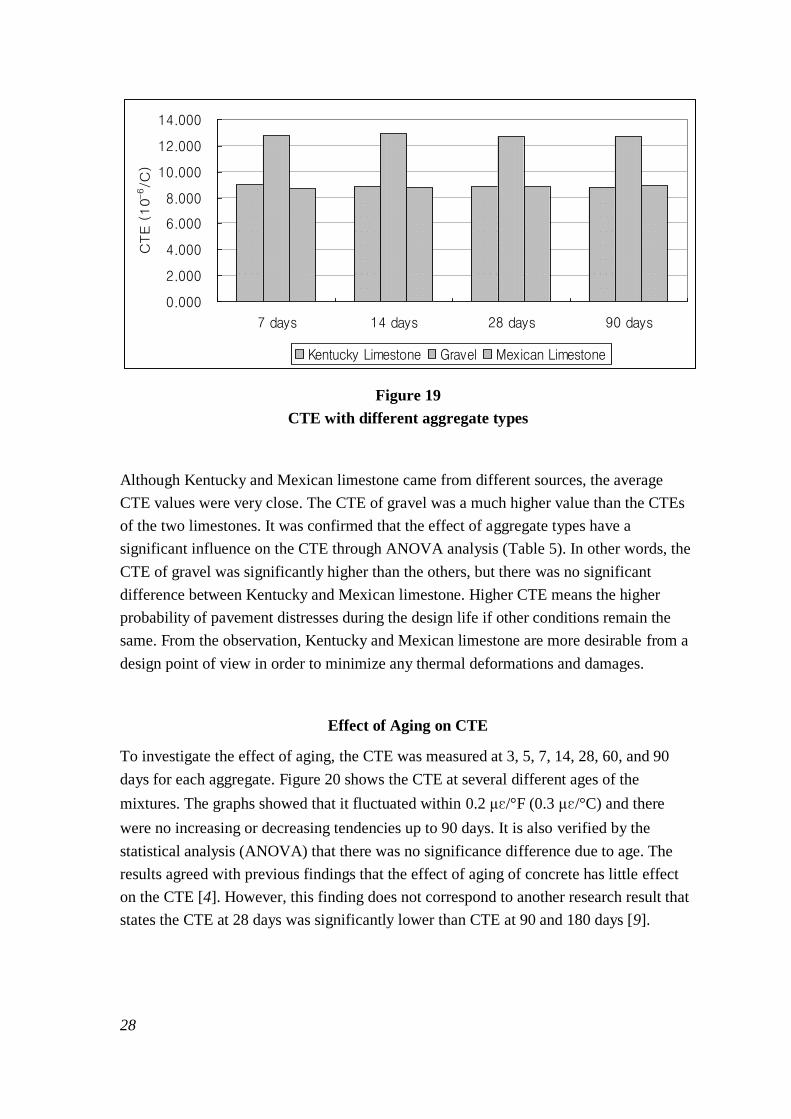
respectively. Figure 19 shows the CTE with different aggregate types at different ages.
28
Figure 19
CTE with different aggregate types
Although Kentucky and Mexican limestone came from different sources, the average
CTE values were very close. The CTE of gravel was a much higher value than the CTEs
of the two limestones. It was confirmed that the effect of aggregate types have a
significant influence on the CTE through ANOVA analysis (Table 5). In other words, the
CTE of gravel was significantly higher than the others, but there was no significant
difference between Kentucky and Mexican limestone. Higher CTE means the higher
probability of pavement distresses during the design life if other conditions remain the
same. From the observation, Kentucky and Mexican limestone are more desirable from a
design point of view in order to minimize any thermal deformations and damages.
Effect of Aging on CTE
To investigate the effect of aging, the CTE was measured at 3, 5, 7, 14, 28, 60, and 90
days for each aggregate. Figure 20 shows the CTE at several different ages of the
mixtures. The graphs showed that it fluctuated within 0.2 με/°F (0.3 με/°C) and there
were no increasing or decreasing tendencies up to 90 days. It is also verified by the
statistical analysis (ANOVA) that there was no significance difference due to age. The
results agreed with previous findings that the effect of aging of concrete has little effect
on the CTE [4]. However, this finding does not correspond to another research result that
states the CTE at 28 days was significantly lower than CTE at 90 and 180 days [9].
0.000
2.000
4.000
6.000
8.000
10.000
12.000
14.000
7 days 14 days 28 days 90 days
CTE (
10
-6/C
)
Kentucky Limestone Gravel Mexican Limestone

29
Figure 20
CTE at several different ages of mixture
Effect of Dimension on CTE
The CTE of both cylindrical [4 in. × 7.5 in. (101.6 mm × 190.0 mm)] and prismatic [3 in.
× 3 in. × 7.5 in. (76.2 mm × 76.2 mm × 190 mm)] for Kentucky limestone specimens
showed the similar trend that had a peak value at 7 days and decreased gradually as
shown in Figure 21. The differences of the CTE in both specimens were between 0.118
με/°F and 0.185 με/°F (0.212 με/°C and 0.333 με/°C) with each age and it has a
significant difference statistically. These two specimens had the same height, but a
different projection area. Since 4-in. (101.6-mm) diameter cylindrical specimen is
specified in AASHTO TP 60, other shapes of specimen having different projection area
should be avoided.
Figure 21
CTE of cylindrical and prismatic specimen
0
1
2
3
4
5
6
7
8
9
10
11
12
13
14
Kentucky Limestone Gravel Mexican Limestone
CTE
(10
-6/C
)
3 days 5 days 7days 14 days 28days 60 days 90 days
8.800
9.000
9.200
9.400
days 10days 20days 30days 40days 50days 60days
CTE (με/
°C)
Time (days) Cylindrical specimen Prismatic specimen

30
Effect of Coarse Aggregate Proportion on CTE
Gravel has a much higher CTE than limestone (Table 1). The CTE of limestone is 3.3
με/°F (6 με/°C) and gravel is between 6.1 and 7.2 με/°F (11 and 13 με/°C) [5]. Zoldners
showed the effect of aggregate content on the thermal expansion of concrete as shown in
Figure 22 [17]. The CTE varies depending on the types and proportion of aggregates
because the volume of aggregates occupies more than 70 percent of concrete volume.
Thus, the CTE of aggregates, especially coarse aggregates, predominantly control the
CTE of concrete. Figure 22 explains the CTE variation depending on types of aggregates
for both coarse aggregates (quartz gravel and crushed limestone) and fine aggregates
(siliceous sand and crushed limestone) and proportion of coarse aggregates from 0 to 100
percent. The best combination to reduce the CTE of concrete is crushed limestone as
coarse aggregate and limestone sand as fine aggregate. To study the effect of aggregate
contents, Kentucky limestone and siliceous sand were chosen for coarse and fine
aggregates and two additional mixtures were produced. From the Kentucky limestone
mixture, the volume of coarse aggregate was changed to 20 percent and 80 percent while
keeping the total volume of aggregate contents constant. That means the volume of fine
aggregates was changed to 80 percent and 20 percent, respectively. Those 20, 64, and 80
percent of relative coarse aggregate volume in total aggregate can be converted into 14.5
percent, 46.1 percent, and 57.8 percent of coarse aggregate volume in concrete mixture.
The results of measured CTE are shown in Figure 23.
Figure 22
Effect of aggregate content on the thermal expansion of concrete [5]

31
0
2
4
6
8
10
12
14
0 10 20 30 40 50 60
0 10 20 30 40 50 60
y = 13.03 - 0.080333x R2= 0.99601
CT
E (
10
-6/C
)
Fraction of coarse aggregate (Kentucky limestone) in concrete volume (%)
Figure 23
CTE vs proportion of coarse aggregate (Kentucky limestone) in concrete mixture
From Figure 22, the CTE starts at 6.3 με/°F (11.3 με/°C), which corresponds to 0 percent
of coarse aggregate (crushed limestone). The CTE decreased steeply until it reached 2.8
με/°F (5 με/°C) when coarse aggregate (crushed limestone) is 100 percent. Similarly, in
Figure 23, CTE decreased from 6.6 με/°F to 4.7 με/°F (11.9 με/°C to 8.4 με/°C) at 14.5
percent and 57.8 percent of coarse aggregate (Kentucky limestone) in concrete,
respectively. These data are fit into a linear curve with 0.996 of R2 value. The relation
between the CTE and the proportion of coarse aggregate (Kentucky limestone) in a
specified concrete mixture is as following:
(5)
where,
X= Proportion of Kentucky limestone in concrete mixture (%), and
Y= CTE corresponding to the proportional Kentucky limestone (με/°C).
A statistical analysis (ANOVA) also showed that the effect of coarse aggregate
proportion has a significant impact on CTE results (Table 5). CTE tests with a reasonable
range of coarse aggregate contents are needed to verify this result.
Concrete is comprised of two-phase material with coarse aggregate particles embedded in
a matrix of cement mortar. Hansen proposed the model to predict the modulus of
elasticity for composite concrete [18]. Hansen considered a two-phase material consisting
32
of spherical particles evenly distributed in a continuous matrix. The equation of the model
is as following.
(6)
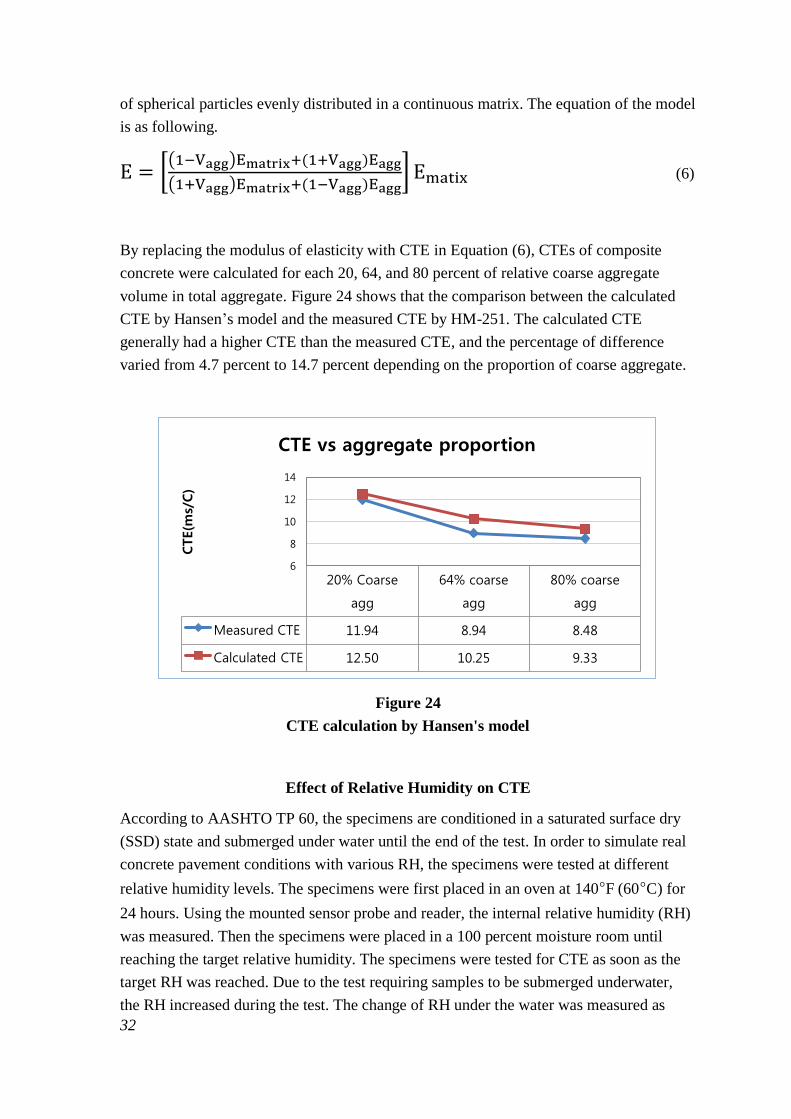
By replacing the modulus of elasticity with CTE in Equation (6), CTEs of composite
concrete were calculated for each 20, 64, and 80 percent of relative coarse aggregate
volume in total aggregate. Figure 24 shows that the comparison between the calculated
CTE by Hansen’s model and the measured CTE by HM-251. The calculated CTE
generally had a higher CTE than the measured CTE, and the percentage of difference
varied from 4.7 percent to 14.7 percent depending on the proportion of coarse aggregate.
Figure 24
CTE calculation by Hansen's model
Effect of Relative Humidity on CTE
According to AASHTO TP 60, the specimens are conditioned in a saturated surface dry
(SSD) state and submerged under water until the end of the test. In order to simulate real
concrete pavement conditions with various RH, the specimens were tested at different
relative humidity levels. The specimens were first placed in an oven at 140°F (60°C) for
24 hours. Using the mounted sensor probe and reader, the internal relative humidity (RH)
was measured. Then the specimens were placed in a 100 percent moisture room until
reaching the target relative humidity. The specimens were tested for CTE as soon as the
target RH was reached. Due to the test requiring samples to be submerged underwater,
the RH increased during the test. The change of RH under the water was measured as
20% Coarse
agg
64% coarse
agg
80% coarse
agg
Measured CTE 11.94 8.94 8.48
Calculated CTE 12.50 10.25 9.33
6
8
10
12
14
CTE(m
s/C)
CTE vs aggregate proportion

33
illustrated in Figure 25. The particular specimens illustrated that they started at 31 percent
of relative humidity and passed 41 percent of relative humidity after 8 hours and abruptly
increased to 96 percent after 15 hours. Since most CTE tests were done in 8 hours, the
average change in relative humidity for 8 hours was used in further analysis.
30
40
50
60
70
80
90
100
0 4 8 12 16 20
Rel
ativ
e hu
mid
ity (
%)
Time (hours)
Figure 25
Change of relative humidity in water
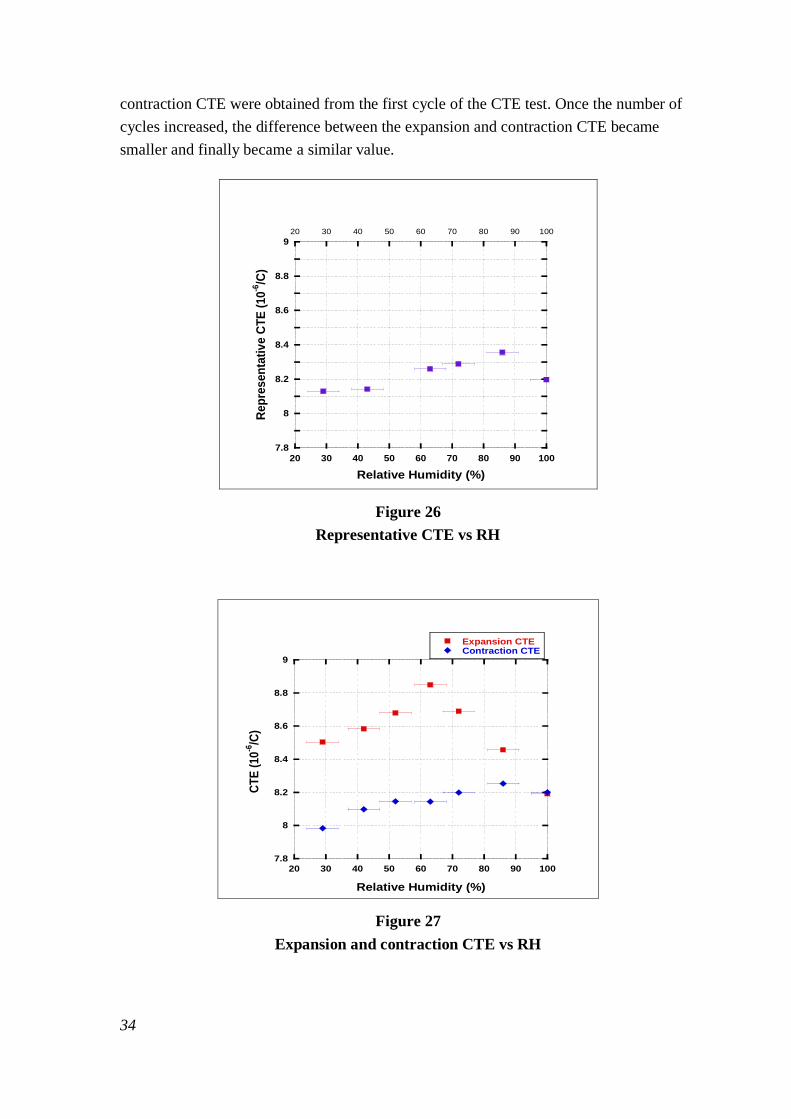
As shown in Figure 26, the representative CTE increases gradually as the relative
humidity increases to 86 percent RH. Then the CTE decreases until reaching 100 percent
RH. Although the graph showed a peak CTE value between 80 percent and 90 percent
RH, the variation was statistically too small to have a significant difference. In Figure 27,
however, the effect of relative humidity has a significant difference on the expansion
CTE by statistical analysis (ANOVA results in Table 3). Hockman and Kessler found that
the length change on a heating cycle has a higher CTE than that on a cooling cycle,
particularly in granite and marble [19] [20]. The heating and cooling procedures cause
complex stress and slippage among mineral crystals. The permanent deformation caused
by heating procedure is because the crystal fails to return its original volume due to
temperature change. This permanent deformation creates a different thermal coefficient
between expansion and contraction. According to Mitchell and Meyers, moisture content
may cause the variation of CTE of neat cement paste by as much as 100 percent [21] [22].
The minimum value was observed in both oven-dry and saturated conditions, and the
maximum value was observed at 65 percent to 70 percent RH for up to 6 months old and
at 45 percent to 50 percent RH after several years. In Figure 27, the expansion and
34
contraction CTE were obtained from the first cycle of the CTE test. Once the number of
cycles increased, the difference between the expansion and contraction CTE became
smaller and finally became a similar value.
7.8
8
8.2
8.4
8.6
8.8
9
20 30 40 50 60 70 80 90 100
20 30 40 50 60 70 80 90 100
Re
pre
sen
tati
ve C
TE
(10
-6/C
)
Relative Humidity (%)
Figure 26
Representative CTE vs RH
7.8
8
8.2
8.4
8.6
8.8
9
20 30 40 50 60 70 80 90 100
Expansion CTEContraction CTE
CT
E (
10
-6/C
)
Relative Humidity (%)
Figure 27
Expansion and contraction CTE vs RH

35
The relative humidity is directly related to the permeability of a concrete mixture, thus a
rapid chloride permeability test (ASTM C1202) was performed to estimate the
permeability of the concrete mixture. The specimen was cut 4 in. (101.6 mm) in diameter
and 2 in. (50.8 mm) in height and the side of the cylindrical specimen was coated with
epoxy. The specimen was put in the vacuum chamber to soak in water for 18 hours. One
side (-) of the cell was filled with a 3 percent NaCl solution, while the other side (+) of
the cell was filled with 0.3 normal NaOH solution. Then a 60-volt potential was applied
for 6 hours. After 6 hours, the specimen was removed and the amount of coulombs that
passed through the specimen was measured. The chloride permeability was classified by
five categories depending on the amount of passed coulombs as shown in Table 6. The
Mexican limestone and gravel specimen fell into moderate chloride permeability since the
amount of charge passed was 2067 and 2226, respectively, but Kentucky limestone
specimen fell into low chloride permeability because the amount of charge passed was
1936. Although they were categorized at different levels, the passed coulombs were very
close to 2000. This test is not accurate enough to define the concrete permeability level
precisely and should be used for only comparison purposes. To reduce the chloride
permeability, material modification using fly ash, slag, or silica fume is considered an
appropriate method. Figure 28 shows the apparatus of the rapid chloride permeability test.
Figure 28
Rapid chloride permeability test

36
Table 6
Chloride permeability based on charge passed
Charge passed
(coulombs) Chloride permeability Typical of
4000 High High W/C ratio (> 0.6)
Conventional PCC
2000 – 4000 Moderate Moderate W/C ratio (0.40-0.50)
Conventional PCC
1000 – 2000 Low Low W/C ratio (< 0.4)
Conventional PCC
100 – 1000 Very low Latex-modified concrete or
Internally-sealed concrete
< 100 Negligible Polymer-impregnated concrete,
Polymer concrete
Effect of Relative Humidity on Thermal Conductivity
Moisture content in the specimen dramatically changes the thermal conductivity of the
concrete. Five samples of different aggregate contents and different compositions were
selected and placed in the 50 percent humidity room and stabilized to room temperature
of 73.4ºF (23
ºC) for one day. The specimen was then weighed and the thermal
conductivity of the specimen was measured. The specimen was placed in a water bath for
24 hours and then weight and thermal conductivity were measured. The specimen was
placed in the water bath again and saturated until the specimen was in a fully saturated
state and the test was repeated. These specimens were dried further in the oven at 116.6 ºF
(47ºC) for about 24 hours in the same manner. Figure 29 shows that the moisture change
has a linearly proportional relationship with weight change.
Figure 29
Relationship between moisture content and weight change
-0.015
-0.01
-0.005
0
0.005
0.01
0.015
0.02
0.025
0.03
-0.02 -0.01 0 0.01 0.02 0.03
Mo
istu
re c
han
ge
Weight Change
Kentuckty Limestone
Gravel
Mexican Limestone
Kentucky Limestone- Coarse Agg-80%
Kentuckty Limestone-Coarse agg-20%

37
Figure 30 shows the relationship between change of thermal conductivity and weight
changes in the specimen. The origin of the graph is the normal state where a standard
temperature of 73.4ºF (23
ºC) and a constant relative humidity of 50 percent were
maintained. The percentile change in weight and thermal conductivity were plotted to
find a trend of the thermal conductivity with respect to water content. The trend lines and
regression analyses curves indicate that there is a linear relationship between the increase
of thermal conductivity and weight change of the specimen. As the moisture state of
specimen changes from dried state to saturated state, there is a change in the thermal
conductivity value. From the results, it can be inferred that thermal conductivity of
specimen increases with increase in water content. Since water is denser than air, air
voids in the concrete specimen were replaced by the water, making the specimen more
dense and increasing thermal conductivity.
Figure 30
Relationship between thermal conductivity and weight change
Effect of Concrete Mechanical Properties on CTE
The mechanical properties measured at 7, 14, 28, and 90 days are direct input data for
Level 1, 2, and 3 designs in the MEPDG software. The detailed information is shown in
Table 3 and summarized input data are presented in the Appendix. The relationship
between mechanical properties and the CTE of concrete specimens was investigated to
easily predict CTE of concrete specimens with various aggregates. Through the statistical
analysis (ANOVA), there was no significant effect of mechanical properties on CTE of
concrete.
-20.000
-15.000
-10.000
-5.000
0.000
5.000
10.000
15.000
20.000
25.000
-2.00% -1.00% 0.00% 1.00% 2.00% 3.00%
Per
cen
t ch
ange
in T
her
mal
Co
nd
uct
ivit
y
Moisture (in %)
Kentucky Limestone
Gravel
Mexican Limestone
Kentucky Limestone-Course AGG-80%
Kentucky Limestone-Coarse agg-20%
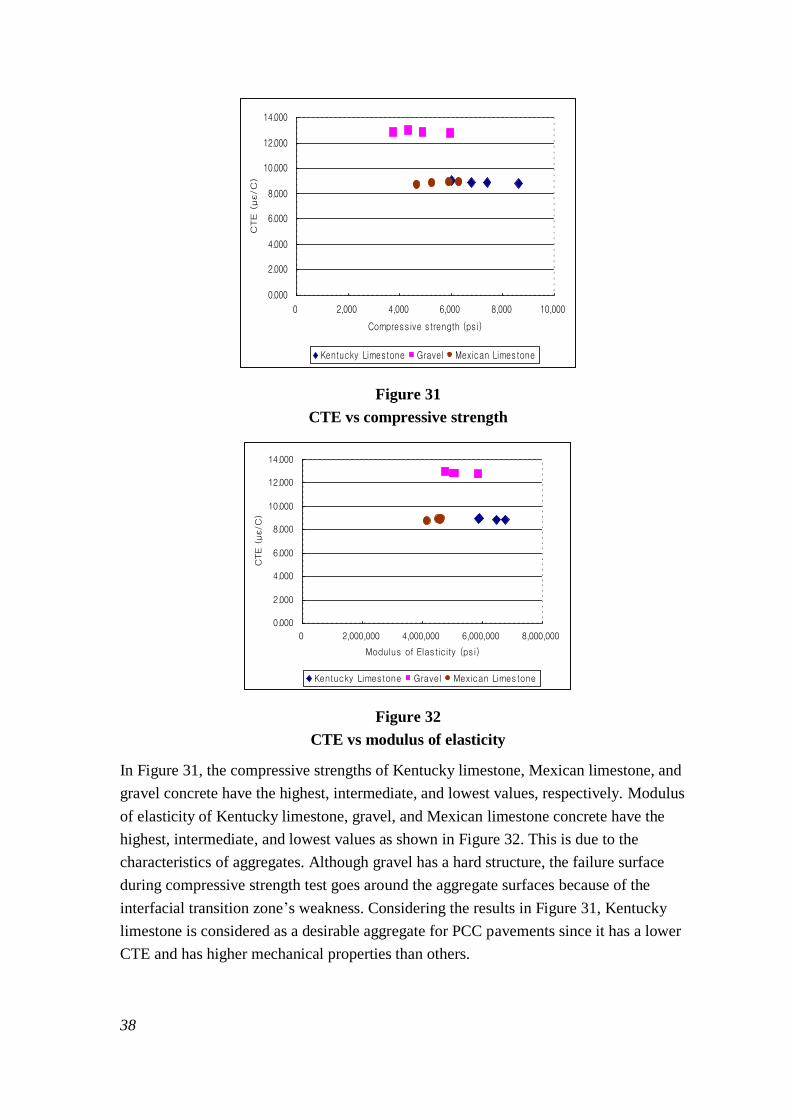
38
Figure 31
CTE vs compressive strength
Figure 32
CTE vs modulus of elasticity
In Figure 31, the compressive strengths of Kentucky limestone, Mexican limestone, and
gravel concrete have the highest, intermediate, and lowest values, respectively. Modulus
of elasticity of Kentucky limestone, gravel, and Mexican limestone concrete have the
highest, intermediate, and lowest values as shown in Figure 32. This is due to the
characteristics of aggregates. Although gravel has a hard structure, the failure surface
during compressive strength test goes around the aggregate surfaces because of the
interfacial transition zone’s weakness. Considering the results in Figure 31, Kentucky
limestone is considered as a desirable aggregate for PCC pavements since it has a lower
CTE and has higher mechanical properties than others.
0.000
2.000
4.000
6.000
8.000
10.000
12.000
14.000
0 2,000 4,000 6,000 8,000 10,000
Compress ive s trength (ps i)
CTE (
με/C
)
Kentucky Limestone Gravel Mexican Limestone
0.000
2.000
4.000
6.000
8.000
10.000
12.000
14.000
0 2,000,000 4,000,000 6,000,000 8,000,000
Modulus of Elasticity (ps i)
CTE (
με/C
)
Kentucky Limestone Gravel Mexican Limestone

39
Other Results
To verify the effect of water/cement ratio on CTE values, another mixture with a
water/cement ratio of 0.6 was fabricated and the CTE test was performed. The CTE of
higher water/cement ratio mixture was compared with that of fixed water/cement ratio
(0.451) mixture. It was found that change of water/cement ratio did not affect CTE values,
so the water/cement ratio did not have a significant effect on CTE values.
Seven percent silica fume was added to the mixture with a fixed water/cement ratio
(0.451) to test the effect of supplementary cementing materials (SCM) on CTE. Silica
fume consists of very small particles and usually provides concrete with high strength
parameters and lower porosity. The concrete mixture with silica fume resulted in a higher
CTE than the concrete mixture without silica fume. The difference was between 0.3 and
0.4 με/°F (0.6 and 0.7 με/°C) with various ages. The significant impact of silica fume on
the CTE was also confirmed by statistical analysis (ANOVA).
Correction Factor (CF) for the Overestimated CTE
Table 7 shows the variation of CTE values with various coarse aggregate types and
proportions as measured with AASHTO TP 60-00 and AASHTO T 336-09. Three
replicated samples for coarse aggregate types [KL(64%), G(64%), and ML(64%)] and
duplicated samples for coarse aggregate proportions [KL(20%) and KL(80%)] were used.
All the CTE values with AASHTO T 336-09 are lower than with AASHTO TP 60-00.
Correction factor (CF) was introduced to correlate the measured CTE values with TP 60-
00 and T336-09. The range of correction factors for all five mixtures is between 0.91 and
0.96.
(7)
Table 7
CTE values comparison between AASHTO TP 60-00 and AASHTO T 336-09
Specimen CTE (×10
-6 /°C)
CTE difference Correction factor
(CF) AASHTO TP 60-00 AASHTO T 336-09
KL (64%) 8.935 8.137 0.798 0.91
G (64%) 12.744 12.184 0.550 0.96
ML (64%) 8.729 7.900 0.829 0.91
KL (20%) 12.057 11.232 0.825 0.93
KL (80%) 8.463 7.678 0.785 0.91

40
Figure 33 shows the comparison of correction factors at various coarse aggregate types
and proportions. The correction factor of gravel (G 64%) has the largest values while the
correction factor of Mexican limestone (ML 64%) has the smallest value.
Figure 33
Comparison of CFs at various aggregate types and proportions
An analysis of variance (ANOVA) was utilized to validate the impact of both coarse
aggregate type and proportion on the correction factor of CTE. The overall ANOVA
results are summarized in Table 8. The P-value means the probability of error of the
statement. A small P-value for a variable indicates that the variable has a significant
effect. If the P-value of the variable is equal to or less than alpha (α), the variable is
regarded as having a significant effect on measuring parameters. Alpha is a probability
error level and 0.05 was used in the analysis.
Table 8
ANOVA results of correction factor
Variables DF F-value P > F Significance
Coarse aggregate type
[KL(64%), G(64%), ML(64%)] 2 48.40 0.0002 Yes
Coarse aggregate proportion
[KL(20%), KL(64%), KL(80%)] 2 3.48 0.1655 No
The statistically significance indicates that the null hypothesis (all group means are the
same) is rejected. Once the null hypothesis is rejected in the results of ANOVA, it implies
that at least one pair of group means are unequal. In order to determine specifically which
of the means are different from one another, further analyses called multiple comparisons
0.80
0.82
0.84
0.86
0.88
0.90
0.92
0.94
0.96
0.98
1.00
KL (64%) G (64%) ML (64%) KL (20%) KL (80%)
Corr
ecti
on
fact
or
(CF
)
Coarse aggregate types and proportions
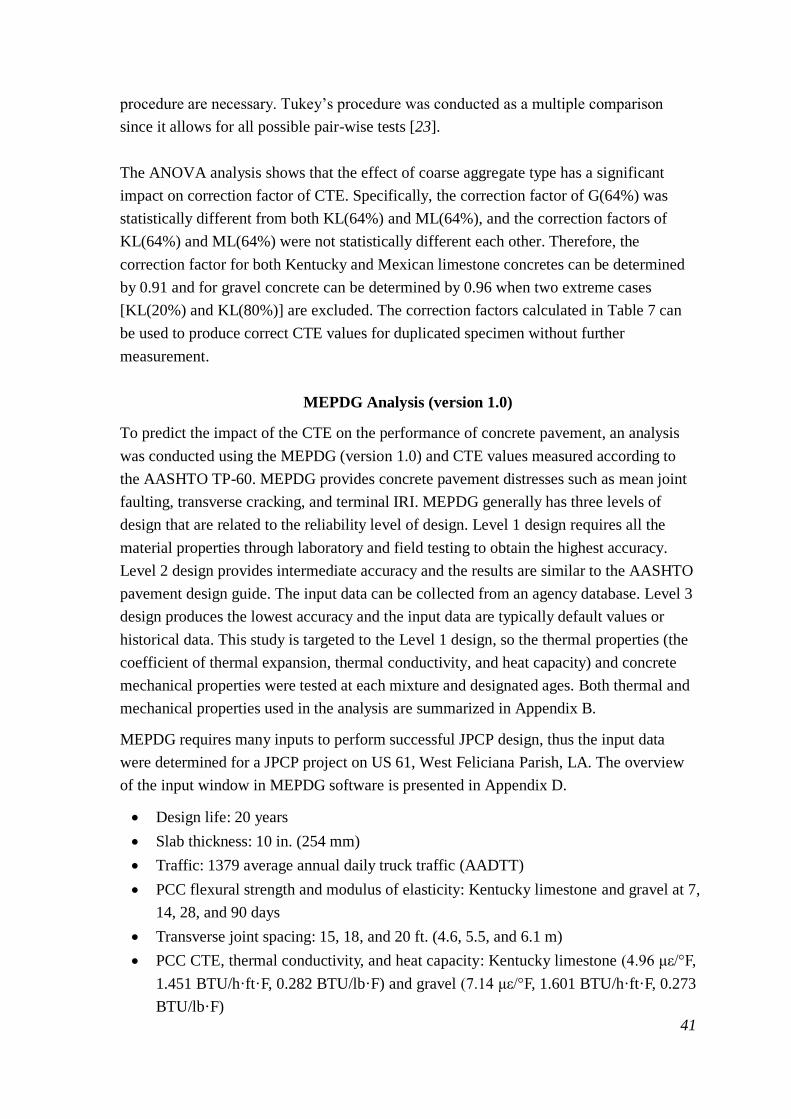
41
procedure are necessary. Tukey’s procedure was conducted as a multiple comparison
since it allows for all possible pair-wise tests [23].
The ANOVA analysis shows that the effect of coarse aggregate type has a significant
impact on correction factor of CTE. Specifically, the correction factor of G(64%) was
statistically different from both KL(64%) and ML(64%), and the correction factors of
KL(64%) and ML(64%) were not statistically different each other. Therefore, the
correction factor for both Kentucky and Mexican limestone concretes can be determined
by 0.91 and for gravel concrete can be determined by 0.96 when two extreme cases
[KL(20%) and KL(80%)] are excluded. The correction factors calculated in Table 7 can
be used to produce correct CTE values for duplicated specimen without further
measurement.
MEPDG Analysis (version 1.0)
To predict the impact of the CTE on the performance of concrete pavement, an analysis
was conducted using the MEPDG (version 1.0) and CTE values measured according to
the AASHTO TP-60. MEPDG provides concrete pavement distresses such as mean joint
faulting, transverse cracking, and terminal IRI. MEPDG generally has three levels of
design that are related to the reliability level of design. Level 1 design requires all the
material properties through laboratory and field testing to obtain the highest accuracy.
Level 2 design provides intermediate accuracy and the results are similar to the AASHTO
pavement design guide. The input data can be collected from an agency database. Level 3
design produces the lowest accuracy and the input data are typically default values or
historical data. This study is targeted to the Level 1 design, so the thermal properties (the
coefficient of thermal expansion, thermal conductivity, and heat capacity) and concrete
mechanical properties were tested at each mixture and designated ages. Both thermal and
mechanical properties used in the analysis are summarized in Appendix B.
MEPDG requires many inputs to perform successful JPCP design, thus the input data
were determined for a JPCP project on US 61, West Feliciana Parish, LA. The overview
of the input window in MEPDG software is presented in Appendix D.
Design life: 20 years
Slab thickness: 10 in. (254 mm)
Traffic: 1379 average annual daily truck traffic (AADTT)
PCC flexural strength and modulus of elasticity: Kentucky limestone and gravel at 7,
14, 28, and 90 days
Transverse joint spacing: 15, 18, and 20 ft. (4.6, 5.5, and 6.1 m)
PCC CTE, thermal conductivity, and heat capacity: Kentucky limestone (4.96 με/°F,
1.451 BTU/h·ft·F, 0.282 BTU/lb·F) and gravel (7.14 με/°F, 1.601 BTU/h·ft·F, 0.273
BTU/lb·F)

42
Layers: JPCP [10 in. (254 mm)], crushed stone [4 in. (101.6 mm)], soil cement [6 in.
(152.4 mm)], and cement treated 6% [(8 in.(203.2 mm)]
Climate: interpolated among New Orleans, Baton Rouge, and Lafayette.
Mean joint faulting increases linearly as joint spacing increases for both Kentucky
limestone and gravel in Figure 34. It is clear that mean joint faulting is higher for longer
joint spacing and higher CTE because of severe curling deflection in longer joint spacing.
Neither Kentucky limestone nor gravel exceeds the specification for all joint spacing. The
effect of CTE and joint spacing on the transverse cracking is presented in Figure 35.
Gravel has a higher percentage of transverse cracking than Kentucky limestone in all joint
spacing due to the higher CTE and lower strength parameters. Even with 15 ft. (4.6 m)
joint spacing, the percent of transverse cracking of gravel exceeds the specification
because of the high CTE of gravel. It is obvious that transverse cracking is very sensitive
to the CTE value. The percentage of transverse cracking of Kentucky limestone increases
slightly from joint spacing 15 to 18 ft. (4.6 to 5.5 m), but it increases dramatically from
joint spacing 18 to 20 ft. (5.5 to 6.1 m). Only 15 and 18 ft. (4.6 and 5.5 m) joint spacing
of Kentucky limestone satisfies specified limits. The terminal IRI also shows similar
trends to previous results since smoothness is directly connected to joint faulting and
transverse cracking. Increased CTE and longer joint spacing causes increased IRI as
shown in Figure 36. The Kentucky limestone for all joint spacing and gravel for 15 ft.
(4.6 m) joint spacing meet the specification. The specified limits of target distresses in
MEPDG are 0.12 in. (3.0 mm), 15 percent, and 172 in/mile for mean joint faulting,
transverse cracking, and terminal IRI, respectively. Based on the results of MEPDG
analysis, 15 and 18 ft. (4.6 and 5.5 m) joint spacing for Kentucky limestone satisfy the
specification of all three PCC pavement distresses. Thus, 20 ft. (6.1 m) joint spacing used
in Louisiana should be shortened to 15 or 18 ft. (4.6 or 5.5 m) joint spacing when using
Kentucky limestone as a coarse aggregate. The reliability summary of MEPDG results for
Kentucky limestone with 18 ft. (5.5 m) joint spacing is presented in Appendix E.

43
Figure 34
Mean joint faulting vs joint spacing
Figure 35
Transverse cracking vs joint spacing
0
0.05
0.1
0.15
15 16 17 18 19 20
Mean J
oin
t Faultin
g (
in)
Joint spacing (ft)
Gravel Kentucky Limestone Specification
0
50
100
150
15 16 17 18 19 20
Tra
nsv
ers
e c
rack
ing (
% s
labs
crack
ing)
Joint spacing (ft)
Gravel Kentucky Limestone Specification
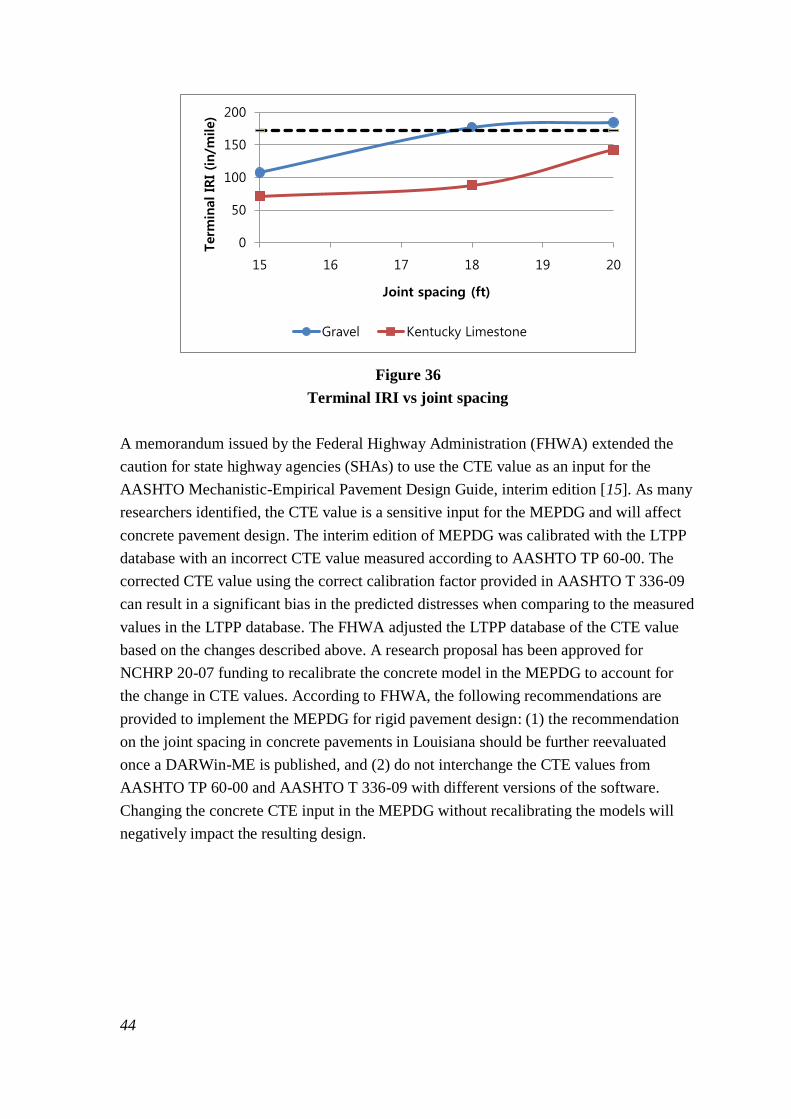
44
Figure 36
Terminal IRI vs joint spacing
A memorandum issued by the Federal Highway Administration (FHWA) extended the
caution for state highway agencies (SHAs) to use the CTE value as an input for the
AASHTO Mechanistic-Empirical Pavement Design Guide, interim edition [15]. As many
researchers identified, the CTE value is a sensitive input for the MEPDG and will affect
concrete pavement design. The interim edition of MEPDG was calibrated with the LTPP
database with an incorrect CTE value measured according to AASHTO TP 60-00. The
corrected CTE value using the correct calibration factor provided in AASHTO T 336-09
can result in a significant bias in the predicted distresses when comparing to the measured
values in the LTPP database. The FHWA adjusted the LTPP database of the CTE value
based on the changes described above. A research proposal has been approved for
NCHRP 20-07 funding to recalibrate the concrete model in the MEPDG to account for
the change in CTE values. According to FHWA, the following recommendations are
provided to implement the MEPDG for rigid pavement design: (1) the recommendation
on the joint spacing in concrete pavements in Louisiana should be further reevaluated
once a DARWin-ME is published, and (2) do not interchange the CTE values from
AASHTO TP 60-00 and AASHTO T 336-09 with different versions of the software.
Changing the concrete CTE input in the MEPDG without recalibrating the models will
negatively impact the resulting design.
0
50
100
150
200
15 16 17 18 19 20
Term
inal IR
I (in/m
ile)
Joint spacing (ft)
Gravel Kentucky Limestone

45
Stress Analysis Caused by Non-linear Temperature and Moisture Gradient
Temperature and moisture variation through slab thickness cause curling and warping
deformation in PCC pavement as shown in Figure 37. The curling and warping stresses,
which are combined with traffic load, predominantly affect the performance of PCC
pavement.
Figure 37
PCC pavement deformation under temperature, moisture, and loading [24]
Westgaard and Bradbury solved the stress of concrete slab subjected to a linear
temperature gradient that the stresses due to temperature gradient may be as high as the
stresses due to traffic load [25], [26]. However, the actual distribution of both temperature
and moisture content gradient through the slab thickness is non-linear [11], [12]. By
assuming a typical non-linear temperature and moisture gradient with an 8 percent
increase of CTE at 63 percent RH comparing to saturated condition obtained from this
study, the tensile stress at the top surface of PCC pavement increases by 12 percent in the
morning as shown in Figure 38. When the moisture gradient with a 20 percent increase of
CTE cited from Simon is compared to a saturated condition, the tensile stress at the top
surface of PCC pavement remarkably increases by 29 percent in the morning as presented
in Figure 38 [8]. Those increases of tensile stress at the top surface of PCC pavement in
the morning can dramatically change the reliability prediction of PCC pavement in
MEPDG.
Temperature Curling
Moisture Warping

46
Figure 38
Stress distribution through the slab thickness
-5
-4
-3
-2
-1
0
1
2
3
4
5
-60.0 -30.0 0.0 30.0 60.0 90.0 120.0
Dep
th (
z)
Stress (psi)
Constant CTE Nonlinear CTE (8%, measured)
Nonlinear CTE (20%, literature value)

47
CONCLUSIONS
With the development of MEPDG as a new pavement design tool, thermal properties of
PCC pavements, especially the CTE, are now considered more important design
parameters in estimating pavement performance including cracking, faulting, and IRI.
This study was developed to measure typical CTE values of the concrete mixture used for
PCC pavement structures with various aggregates used in Louisiana and to investigate the
relationship between the CTE and other critical variables such as aggregate types, age of
concrete, dimension of specimen, amount of coarse aggregate, relative humidity, and
concrete mechanical properties. Based on the measured CTE and MEPDG analysis, the
following conclusions were drawn:
The results of the MEPDG (version 1.0) analysis show that joint spacing of 15 and
18 ft. (4.6 and 5.5 m) for Kentucky limestone are in compliance with the reliability
of slab cracking, faulting, and IRI. Thus, the current maximum transverse joint
spacing [20 ft. (6.1 m)] in Louisiana should be adjusted by coarse aggregate types
following the results of the MEPDG analysis. This result should be reevaluated
with DARWin-ME using the CTE values measured according to AASHTO T 336-
09.
CTE for Kentucky limestone, gravel, and Mexican limestone concrete were 4.964
με/°F, 7.144 με/°F, and 4.900 με/°F (8.935 με/°C, 12.860 με/°C, and 8.820 με/°C),
respectively. Aggregate types have a statistically significant impact on CTE.
Measured CTEs at various ages (3, 5, 7, 14, 28, 60, 90 days) fluctuated within 0.2
με/°F (0.3 με/°C), and the age of concrete was statistically found to have no
significant effect on CTE.
The CTE between cylindrical and prismatic specimen has a statistically significant
difference, thus 4-in. (101.6-mm) nominal diameter cylinders should be used for
measuring CTE to follow AASHTO TP 60.
As the amount of coarse aggregate (Kentucky limestone) increases with decreasing
fine aggregate (siliceous sand), the measured CTE decreases accordingly.
Statistical analysis (ANOVA) showed that the CTE of concrete is significantly
influenced by the amount of coarse aggregate. The impact of coarse aggregate
percentile on CTE should be considered at the mixture design and construction
stage to minimize thermal distresses in PCC pavement.
Relative humidity changes the CTE of concrete. Representative CTE shows the
peak point around 85 percent humidity, but it did not have statistical significance.
However, expansion CTE shows a clear peak point around 60 percent of relative
humidity and has a statistical significance. Concrete mechanical properties are

48
essential to the MEPDG software, but its relationship with concrete CTE was not
found.
With an 8 percent increase of CTE at 63 percent RH compared to a saturated
condition under the same non-linear temperature gradient, tensile stress at the top
surface of PCC pavement increases by 12 percent in early morning. Higher CTE
value causes high tensile stress at the top surface of PCC pavement.
The CTE values according to AASHTO TP 60-00 can be corrected to comply with
the AASHTO T 336-09 with the correction factor of 0.91 for limestone concretes
(both Kentucky and Mexican limestone) and 0.96 for gravel concrete.

49
RECOMMENDATIONS
Kentucky and Mexican limestone have a higher compressive strength and lower CTE
value compared to gravel. Although both limestones satisfy the required compressive
strength at 28 days (4000 psi), Kentucky limestone is considered as a better coarse
aggregate in concrete mixture which is susceptible to thermal distresses in the PCC
pavement due to its higher compressive strength and low water absorption.
Three joint spacings [15-, 18-, 20-ft. (4.6-, 5.5-, 6.1-m)] joint spacing] and two coarse
aggregates (Kentucky limestone, and gravel) were analyzed in MEPDG. Only 15- and 18-
ft. (4.6- and 5.5-m) joint spacing of Kentucky limestone satisfied the specification for all
distress types. Even with the shortest joint spacing [15 ft. (4.6 m)], gravel exceeded the
specification for transverse cracking, so transverse cracking is the most sensitive distress
to the CTE. According to an AASHTO Research and Communication (RAC) survey,
most states have joint spacing of JPCP less than 20 ft. (6.1 m), for example, 15 ft. (4.6 m)
for Arkansas, between 13- to 17-ft. (4.0- to 5.2-m) for Arizona, 15 ft. (4.6 m) for Georgia,
and 15 ft. (4.6 m) for Missouri. Considering both the MEPDG analysis and the case study
of other states, current maximum joint spacing [20 ft. (6.1 m)] can be adjusted to 15- or
18- ft. (4.6- or 5.5-m) joint spacing when Kentucky limestone is used as coarse aggregate.
The recommendation on the joint spacing in concrete pavements in Louisiana should be
further reevaluated once a DARWin-ME is published. The CTE values measured from
AASHTO TP 60-00 and AASHTO T 336-09 should not be interchanged with different
versions of the software. The CTE values measured according to AASHTO TP 60-00
should be used for only the MEPDG version 1.xx software. The CTE values measured
according to AASHTO TP 60-00 can be corrected to comply with the AASHTO T 336-
09 using the correction factor developed in this study, and corrected CTE values can be
used for the DARWin-ME software that is currently not available. Changing the concrete
CTE input in the MEPDG without recalibrating the models will negatively impact the
resulting design.
A future study can be focused on the nonlinear stress effect on curling and failure in PCC
pavement. Measurement of RH gradients and temperature through slab thickness are
necessary to understand curling behavior of PCC pavements. With the measured
nonlinear RH gradient in the slab thickness, CTE gradients in the slab thickness can be
predicted. The nonlinear stress analysis in the PCC pavements can be performed using the
nonlinear temperature and CTE gradients, and the results should be verified with the
measured curling behavior in the pavements. When there is a significant impact of
nonlinear temperature and CTE gradients, implementation of MEPDG is recommended.


51
ACRONYMS, ABBREVIATIONS, AND SYMBOLS
AADTT Average Annual Daily Truck Traffic
AASHTO American Association of State Highway and Transportation Officials
ANOVA Analysis of Variance
CF Correction Factor
CTE Coefficient of Thermal Expansion
FHWA Federal Highway Administration
IRI International Roughness Index
JPCP Jointed Plain Concrete Pavements
LADOTD Louisiana Department of Transportation and Development
LTPP Long Term Pavement Performance
LTRC Louisiana Transportation Research Center
LVDT Linear Variable Displacement Transducer
MEPDG Mechanistic Empirical Pavement Design Guide
NCHRP National Cooperative Highway Research Program
PCC Portland cement concrete
PMIC Precision Measurements and Instruments Corporation
RAC Research and Communication
RH Relative Humidity
SCM Supplementary Cementing Materials
SHA State Highway Agencies
SSD Saturated Surface Dry
TPRL Thermophysical Properties Research Laboratory
WLCR Water Level Control Reservoir


53
REFERENCES
1. ARA, Inc., ERES Consultants Division, Guide for Mechanistic-Empirical Design of
New and Rehabilitated Pavement Structures, NCHRP Project 1-37A, Final Report,
Applied Research Association, Inc., ERES Consultants Division, 2004.
2. Mallela, J.; Abbas, A.; Harman, T.; Chetana, R.; Liu, R.; and Darter, M. Measurement
and Significance of the Coefficient of Thermal Expansion of Concrete in Rigid
Pavement Design, TRR: Journal of the Transportation Research Board No. 1919,
Washington D.C., 2005.
3. AASHTO, Standard Test Method for the Coefficient of Thermal Expansion of
Hydraulic Cement Concrete, TP60-00, 2000.
4. Won, M. Improvements of Testing Procedures for Concrete Coefficient of Thermal
Expansion, TRR: Journal of the Transportation Research Board No. 1919,
Washington D.C., 2005.
5. Mindess, S.; and Young, J.F.; and Darwin, D. Concrete, 2nd
ed. Prentice-Hall, Inc.,
Englewood Cliffs, New Jersey, 2003.
6. Alungbe, G.D.; Tia, M.; and Bloomquist, D.G. Effects of Aggregate, Water/Cement
Ratio, and Curing on the Coefficient of Linear Thermal Expansion of Concrete, TRR
1335, 1992, pp. 44-51.
7. Kohler E.; Alvarado, R.F.; and Jones, D. Measurement and Variability of Coefficient of
Thermal Expansion for Concrete Pavements, Proceeding of the 86th
Transportation
Research Board Annual Meeting, Washington D.C., 2006.
8. Simon, M.J., and Dallaire, M.P. Taking Concrete to the Next Level, Public Roads, Vol.
66, No. 1, 2002. http://www.tfhrc.gov/pubrds/02jul/01.htm. Accessed April 10, 2009.
9. Jahangirnejad, S.; Buch, N.; Kravchendo, A. A Laboratory Investigation of the Effects
of Aggregate Geology and Sample Age on the Coefficient of Thermal Expansion of
Portland Cement Concrete, Proceeding of the 87th
Transportation Research Board
Annual Meeting, Washington D.C., 2008.
54
10. Hossain, M.; Khanum, T.; Tanesi, J.; Scheiber, G.; and Montney, R. The PCC
Coefficient of Thermal Expansion Input for the Mechanistic-Empirical Pavement
Design Guide, Proceeding of the 85th
Transportation Research Board Annual Meeting,
Washington D.C., 2006.
11. Thompson, M. R., Dempsey, B. J., Hill, H., and Vogel, J. Characterizing Temperature
Effects for Pavement Analysis and Design, Transportation Research Record, 1121,
1987, pp. 14-22.
12. Janssen, D.J. Moisture in Portland Cement Concrete, Transportation Research Record
1211, 1987, pp. 40-44.
13. Bazant, Z.P. Delayed Thermal Dilations of Cement Paste and Concrete Due to Mass
Transport, Nuclear Engineering and Design, Vol. 14, 1970, pp. 308-318.
14. Grasley, Z.C. and Lange, D.A. Thermal Dilation and Internal Relative Humidity of
Hardened Cement Paste, Materials and Structures, Vol. 40, 2007, pp. 311-317.
15. FHWA, Concrete Coefficient of Thermal Expansion Input for MEPDG, Memorandum,
Federal Highway Administration, Washington D.C., Dec. 2009.
16. AASHTO, Standard Test Method for the Coefficient of Thermal Expansion of
Hydraulic Cement Concrete, T 336-09, 2009.
17. Zoldners, N.G. In Temperature and Concrete, SP-25, American Concrete Institute,
Detroit, MI., 1971, pp. 1-31.
18. Hansen, T.C. Influence of Aggregate and Voids on Modulus of Elasticity of Concrete,
Cement Mortar, and Cement Paste, ACI Journal, Vol. 62, No. 2, Feb. 1965, pp. 193-
216.
19. Hockman, A. and Kessler, D.W. Thermal and Moisture Expansion Studies of Some
Domestic Granite, National Bureau of Standards, RP2087, 1950.
20. Kessler, D.W. Growth of Marble as a Basis for Durability Tests, Technical News
Bulletin, National Bureau of Standards, March, 1948, Vol. 32, pp. 28-29.
21. Mitchell, L.J. Thermal Expansion Tests on Aggregates, Neat Cements, and Concrete,
Proceeding, ASTM, V. 53, 1953, pp. 963-976.

55
22. Meyers, S.L. How Temperature and Moisture Changes May Affect Durability of
Concrete, Rock Products, August, 1951, Vol. 54, No. 8, pp. 153-157.
23. Devore, J., Probability and Statistics for Engineering and the Science, 6th
ed.,
Thompson Learning, Inc., Belmont, CA, 2004.
24. Mohamed, A.R. and Hansen, W. Prediction of Stress in Concrete Pavement Subjected
to Non-linear Gradients, Cement and Concrete Composites, Vol. 18, 1996, pp. 381-
387.
25. Westergaard, H.M. Computation of Stress in Concrete Roads, In process of the Fifth
Annual Meeting, Vol. 5, Part 1, Highway Research Board, pp. 90-112, 1926.
26. Bradbury, R.D. Reinforced Concrete Pavement, Wire Reinforcement Institute,
Washington D.C., 1947.


57
APPENDIX
APPENDIX A AASHTO TP-60 ........................................................................................ 59
APPENDIX B Thermal and Mechanical Properties in MEPDG ....................................... 67
APPENDIX C CTE Test Procedure (HM-251) and Raw Data from CTE Test Results ... 69
APPENDIX D Overview of Inputs in MEPDG Software ................................................. 75
APPENDIX E Reliability Summary of MEPDG Result (Kentucky limestone, 18 ft.
joint spacing) ............................................................................................ 79


59
APPENDIX A
AASHTO TP-60

60

61

62
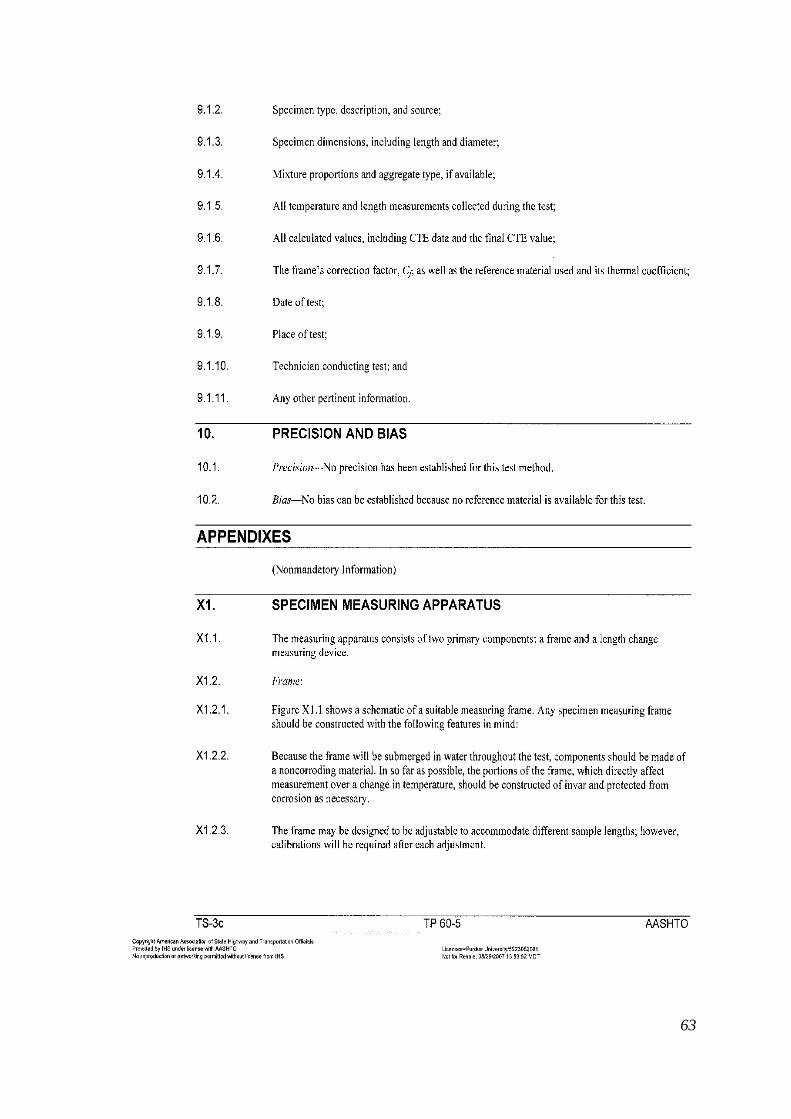
63

64

65


67
APPENDIX B
Thermal and Mechanical Properties in MEPDG
Table 9
Thermal properties
Coarse aggregate
Thermal properties
CTE
(με/°F)
Thermal
conductivity
(BTU/h·ft·F)
Heat capacity
(BTU/lb·F)
Kentucky limestone 4.96 1.451 0.282
Gravel 7.14 1.601 0.273
Mexican limestone 4.90 1.219 0.279
Thermal properties are only valid when the concrete mixture design is similar to this
study (refer to Table 2)
Table 10
CTE unit conversion chart
(με/°F) (με/°C)
4.0 7.2
4.5 8.1
5.0 9.0
5.5 9.9
6.0 10.8
6.5 11.7
7.0 12.6
7.5 13.5
8.0 14.4
8.5 15.3
9.0 16.2
9.5 17.1
10 18

68
Table 11
Mechanical properties
Coarse
aggregate
Design
level Mechanical properties
Ages
7 days 14 days 28 days 90 days
Kentucky
limestone
Level 1
Modulus of elasticity
(106 psi)
5.883 5.866 6.466 6.750
Flexural strength (psi) 678 925 811 809
Level 2 Compressive strength
(psi) 6015 6775 7408 8640
Level 3
Compressive strength
(psi) − − 7408 −
Flexural strength (psi) − − 811 −
Gravel
Level 1
Modulus of elasticity
(106 psi)
5.033 4.766 5.083 5.866
Flexural strength (psi) 519 551 589 738
Level 2 Compressive strength
(psi) 3782 4363 4900 6004
Level 3
Compressive strength
(psi) − − 4900 −
Flexural strength (psi) − − 589 −
Mexican
limestone
Level 1
Modulus of elasticity
(106 psi) 4.150 4.600 4.550 4.633
Flexural strength (psi) 559 652 686 710
Level 2 Compressive strength
(psi) 4671 5272 5935 6314
Level 3
Compressive strength
(psi) − − 5935 −
Flexural strength (psi) − − 686 −
Mechanical properties are only valid when the concrete mixture design is similar to this
study (refer to Table 2)
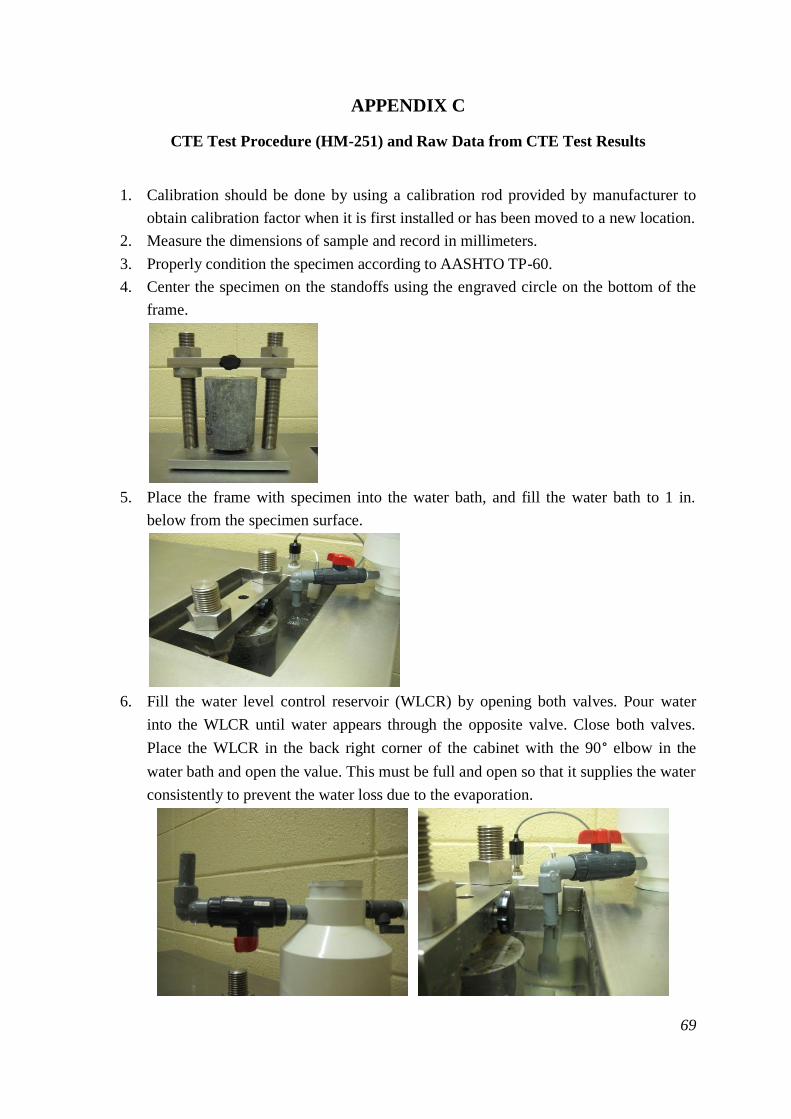
69
APPENDIX C
CTE Test Procedure (HM-251) and Raw Data from CTE Test Results
1. Calibration should be done by using a calibration rod provided by manufacturer to
obtain calibration factor when it is first installed or has been moved to a new location.
2. Measure the dimensions of sample and record in millimeters.
3. Properly condition the specimen according to AASHTO TP-60.
4. Center the specimen on the standoffs using the engraved circle on the bottom of the
frame.
5. Place the frame with specimen into the water bath, and fill the water bath to 1 in.
below from the specimen surface.
6. Fill the water level control reservoir (WLCR) by opening both valves. Pour water
into the WLCR until water appears through the opposite valve. Close both valves.
Place the WLCR in the back right corner of the cabinet with the 90° elbow in the
water bath and open the value. This must be full and open so that it supplies the water
consistently to prevent the water loss due to the evaporation.

70
7. Turn on the HM-251 power switch, which is on the back side of heating/cooling
circulator.
8. Open HM-251 software, press “Enter” at the initial screen and select “Start HM-251.”
9. Enter file name and specimen length in millimeters consecutively. Heights range
between 150 mm and 250 mm.
10. Insert LVDT in the top of the measuring frame with the flat side to the set-knob.
11. Manually raise and lower the LVDT in the direction of the screen arrow until the
check mark appears. Once the check mark shows up on the screen, tight on the set-
knob to hold the LVDT.
12. Press “Done” and the test will begin.

71
13. The temperature and LVDT graphs with time can be seen during the testing.
14. Testing is complete when the difference between the expansion CTE and contraction
CTE is between 0.3 microstrains/C. The average CTE is then displayed.
15. When test is complete, select “Exit.”
16. After testing is complete, remove the LVDT and place it in the holder. Remove the
specimen and turn off the CTE power switch.
17. Trouble shooting:
E-FL message appears on the LCD of heating/cooling unit.
There is an air lock in the reservoir, so slowly open the reservoir vent valve until
water reaches the top and close.
Temperature range is not between 10˚C and 50˚C.
Press F3 at the initial start-up screen. Fix HI-L to 55˚C, and AFS to 48˚C. This
adjustment will bring the temperature range back to between 10˚C and 50˚C.

72
Raw Data from CTE Test Result
"Gilson Company,Inc."
HM-251 Concrete Thermal Expansion
Date: 22/Apr/2009 9:29:51 AM
Sample Length: 190.1
Cf: 1.874794590570295E-005
timer Time La (actual) Displ Lm (measured) temp
9:41:19 0 0.021774308 -0.021774308 0.007236356 17.93415392
9:51:19 10 0.040183209 -0.040183209 0.013073105 14.40659864
9:59:25 20 0.052710368 -0.052710368 0.017020491 11.99924451
10:09:25 30 0.065428004 -0.065428004 0.021137756 9.586110859
10:19:25 40 0.0704736 -0.0704736 0.022855211 8.652284804
10:29:25 50 0.063590564 -0.063590564 0.020363698 9.884479625
10:39:25 60 0.06460988 -0.06460988 0.021093528 9.803254265
10:49:25 70 0.063781653 -0.063781653 0.020902955 9.982170273
10:59:25 80 0.063566918 -0.063566918 0.020902685 10.04234572
11:09:25 90 0.063928575 -0.063928575 0.021092852 9.994228495
Stable reading at 10C CTE=unknown Lm= 0.02109285182930963
La= 0.06392857458018066 temp= 9.994228494792642
11:20:52 100 0.04349608 -0.04349608 0.014177534 13.78694347
11:30:52 110 0.023874978 -0.023874978 0.00768726 17.47125465
11:40:52 120 0.005781714 -0.005781714 0.001727123 20.87562608
11:50:52 130 -0.011020707 0.011020707 -0.003943562 23.99902231
12:00:52 140 -0.026848116 0.026848116 -0.009394932 26.9103814
12:10:52 150 -0.041737183 0.041737183 -0.014532329 29.64655217
12:20:52 160 -0.056201198 0.056201198 -0.019608356 32.28067896
12:30:52 170 -0.069617284 0.069617284 -0.024185342 34.76079622
12:40:52 180 -0.0822717 0.0822717 -0.02853411 37.09123545
12:50:52 190 -0.094116185 0.094116185 -0.032678356 39.25180544
13:00:52 200 -0.105122412 0.105122412 -0.036486575 41.2714575
13:10:52 210 -0.115289733 0.115289733 -0.039989589 43.14136094
13:20:52 220 -0.124723853 0.124723853 -0.043242603 44.87568568
13:30:52 230 -0.133373198 0.133373198 -0.046253151 46.45784643
13:40:52 240 -0.141280255 0.141280255 -0.049011507 47.90249387
13:41:36 250 -0.141822137 0.141822137 -0.049180685 48.00706908
13:51:36 260 -0.148234664 0.148234664 -0.050994522 49.29739152
14:01:36 270 -0.152284447 0.152284447 -0.052299317 50.06759347
14:11:36 280 -0.150885196 0.150885196 -0.051756002 49.82743091
14:21:36 290 -0.150592597 0.150592597 -0.051721647 49.75497135

73
14:31:36 300 -0.152574547 0.152574547 -0.052546696 50.07958038
14:41:36 310 -0.152138014 0.152138014 -0.052268073 50.03527311
14:51:36 320 -0.151400325 0.151400325 -0.052140664 49.86403788
15:01:36 330 -0.152310827 0.152310827 -0.052493406 50.02053687
15:11:36 340 -0.152700579 0.152700579 -0.052677893 50.07813123
15:21:36 350 -0.152428859 0.152428859 -0.05254602 50.03889221
15:31:36 360 -0.152229071 0.152229071 -0.052453371 50.0088307
Stable reading at 50C Expansion CTE= -9.085255848917289 Lm= -0.05245337120443637
La= -0.1522290711512687 temp= 50.00883069929005
15:43:05 370 -0.117345347 0.117345347 -0.039474403 43.8626883
15:53:05 380 -0.085662187 0.085662187 -0.028937039 37.9294987
16:03:05 390 -0.058403787 0.058403787 -0.019956583 32.80098466
16:13:05 400 -0.034292291 0.034292291 -0.011914384 28.29218387
16:23:05 410 -0.012738323 0.012738323 -0.004714682 24.26459467
16:33:05 420 0.006723569 -0.006723569 0.001859471 20.64849044
16:43:05 430 0.024580478 -0.024580478 0.007829986 17.31334866
16:53:05 440 0.040802453 -0.040802453 0.01328613 14.29261977
17:01:39 450 0.053004631 -0.053004631 0.017297897 11.99451464
17:11:39 460 0.065648762 -0.065648762 0.021631163 9.662611726
17:21:39 470 0.070120225 -0.070120225 0.023123554 8.826729633
17:31:39 480 0.064907031 -0.064907031 0.021263407 9.767543801
17:41:39 490 0.064851694 -0.064851694 0.021527828 9.857263104
17:51:39 500 0.064876355 -0.064876355 0.021714749 9.902790818
18:01:39 510 0.064496717 -0.064496717 0.021620883 9.982974029
18:11:39 520 0.064809153 -0.064809153 0.021827281 9.953221083
18:21:39 530 0.064872165 -0.064872165 0.021883276 9.951252245
18:31:39 540 0.064952803 -0.064952803 0.021956989 9.949309418
18:41:39 550 0.06503581 -0.06503581 0.022047474 9.951407676
Stable reading at 10C Contraction CTE= 8.976530458528165 Lm= 0.02204747413268409
La= 0.0650443032958288 temp= 9.949024479028841
Expansion CTE: -9.085255848917289
Contraction CTE: 8.976530458528165
CTE: 9.030893153722726


75
APPENDIX D
Overview of Inputs in MEPDG Software
Figure 39
Overview of software

76
Figure 40
Design life, AADTT, slab thickness, and joint spacing
Figure 41
Thermal properties and mixture properties
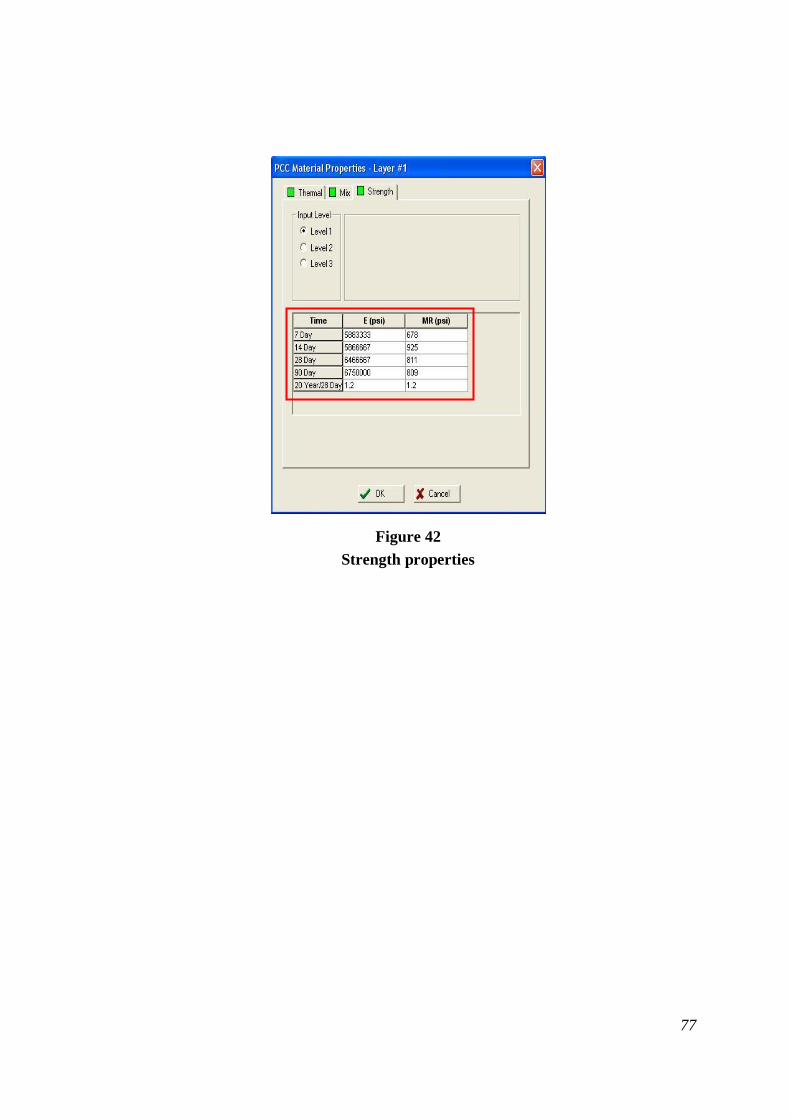
77
Figure 42
Strength properties

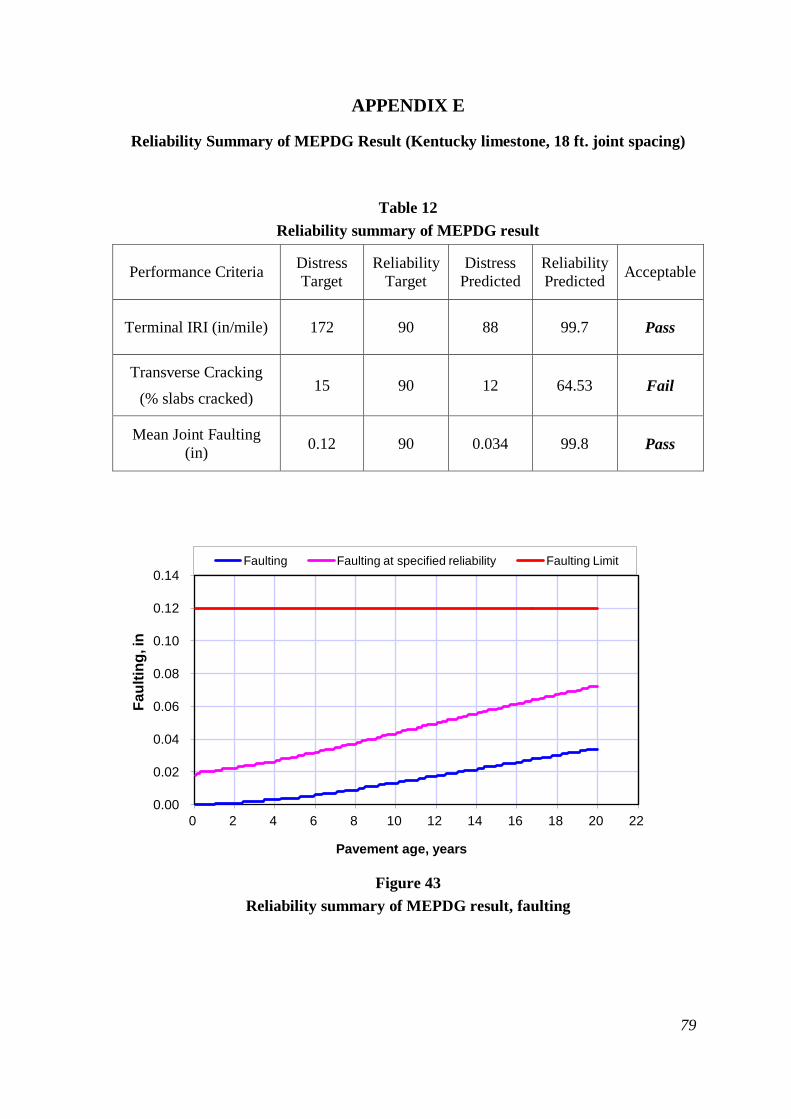
79
APPENDIX E
Reliability Summary of MEPDG Result (Kentucky limestone, 18 ft. joint spacing)
Table 12
Reliability summary of MEPDG result
Performance Criteria Distress
Target
Reliability
Target
Distress
Predicted
Reliability
Predicted Acceptable
Terminal IRI (in/mile) 172 90 88 99.7 Pass
Transverse Cracking
(% slabs cracked) 15 90 12 64.53 Fail
Mean Joint Faulting
(in) 0.12 90 0.034 99.8 Pass
Figure 43
Reliability summary of MEPDG result, faulting
0.00
0.02
0.04
0.06
0.08
0.10
0.12
0.14
0 2 4 6 8 10 12 14 16 18 20 22
Fa
ult
ing
, in
Pavement age, years
Faulting Faulting at specified reliability Faulting Limit

80
Figure 44
Reliability summary of MEPDG result, slab cracking
Figure 45
Reliability summary of MEPDG result, IRI
0
10
20
30
40
50
60
70
80
90
100
0 2 4 6 8 10 12 14 16 18 20 22
Pe
rce
nt
sla
bs
cra
ck
ed
, %
Pavement age, years
Percent slabs cracked Cracked at specified reliability
Limit percent slabs cracked
0
30
60
90
120
150
180
210
240
270
300
0 2 4 6 8 10 12 14 16 18 20 22
IRI, i
n/m
ile
Pavement age, years
IRI IRI at specified reliability IRI Limit