determination of crispness in breaded fried chicken
TRANSCRIPT

DETERMINATION OF CRISPNESS IN BREADED FRIED CHICKEN
NUGGETS USING ULTRASONIC TECHNIQUE
Irina Antonova
Thesis submitted to the Faculty of the
Virginia Polytechnic Institute and State University
in partial fulfillment of the requirements for the degree of
Master of Science
in
Biological Systems Engineering
Parameswarakumar Mallikarjunan, Chair
C. Gene Haugh
Susan E. Duncan
John C. Duke
December 18, 2001
Blacksburg, Virginia
Copyright 2001, Irina Antonova

DETERMINATION OF CRISPNESS IN BREADED FRIED CHICKEN
NUGGETS USING ULTRASONIC TECHNIQUE
by
Irina Antonova
P. Kumar Mallikarjunan, Chairman
Biological Systems Engineering
(ABSTRACT)
Crispness is one of the most important and desirable textural characteristics that
signify freshness and high quality in breaded fried foods. Though many approaches to
instrumental measurement of crispness have been made, the best measurements are still
inconclusive. There is no reliable method available that can accurately measure and
quantify crispness in breaded fried foods.
In this study, the mechanical and ultrasonic techniques were used to determine
crispness in breaded fried chicken nuggets under different storage conditions. The
mechanical measurements have been made, using an Instron universal testing machine.
An ultrasonic non-destructive evaluation system was used to measure ultrasonic
properties of breaded friend chicken nuggets. A pair of dry-coupling 250-kHz ultrasonic
transducers was used to perform the ultrasonic transmission through the breaded fried
chicken nugget. The equipment set up was in the through-transmission mode because
breaded fried chicken nugget is highly attenuative material.
A sensory panel of eight members was trained to evaluate crispness in breaded
fried foods. Panelists rated crispness on a nine-point category scale (1 = not crisp/soggy,

ii
9 = very crisp). Sensory crispness values for breaded fried foods under different storage
conditions were obtained.
Ultrasonic velocity, transmission loss, peak frequencies and its energies, peak
force and total energy were determined for each tested product. Correlation between
sensory crispness and instrumental parameters suggests that the ultrasonic method can be
used to evaluate crispness. The ultrasonic velocity had high correlation with sensory
crispness (R2 = 0.83). This indicates that sensory crispness could be reasonably well
predicted by the ultrasonic velocity.

iii
ACNOWLEDGEMENTS
I would like to express my sincere appreciation and respect to my major advisor,
Dr. Kumar Mallikarjunan, for his thoughtful guidance, friendship, encouragement, time
and all of his assistance throughout my M. S. study and this research. I admire his
research skills especially the ways to deal with the problems of different facets, and
organize the thoughts efficiently.
I am grateful for Dr. Susan E. Duncan, Dr. C. Gene Haugh, and Dr. John C. Duke
for serving on my advisory committee. I thank them for kindness, friendliness and all the
help they have provided in this study. Their suggestions and support were very helpful
and invaluable throughout this study.
Special thanks are extended to my fellow graduate students who have been very
friendly and helpful in conducting many experimental tests in this study. My appreciation
has also been given to my Russian friends who cherished and fancied my life here.
Lastly, I would like to express my deepest gratitude and love to my dear parents
and my beloved son for their support. Without their love, understanding, support and
encouragement, the completion of this study would have never become possible. I thank
them for all their love and help they are giving me.

iv
TABLE OF CONTENTS
Page ABSTRACT..........................................................................................................................i
ACKNOWLEDGMENTS .................................................................................................. iii
LIST OF TABLES ...............................................................................................................v
LIST OF FIGURES ........................................................................................................... vii
I. INTRODUCTION .........................................................................................................1
II. LITERATURE REVIEW ..............................................................................................4
III. THE DEVELOPMENT OF AN ULTRASONIC TECHNIQUE TO EVALUATE
CRISPNESS IN BREADED FRIED CHICKEN NUGGETS.....................................40
IV. SENSORY ASSESMENT OF CRISPNESS IN BREADED FRIED FOODS
HELD UNDER A HEAT LAMP ................................................................................57
V. CORRELATION BETWEEN INSTRUMENTAL AND SENSORY
MEASUREMENTS OF CRISPNESS IN BREADED FRIED
CHICKEN NUGGETS ................................................................................................75
VI. SUMMARY AND CONCLUSIONS……………………………………………. 117
APPENDIX: SENSORY WORKSHEETS AND SCORECARD...................................120
VITA ................................................................................................................................126
v
LIST OF TABLES
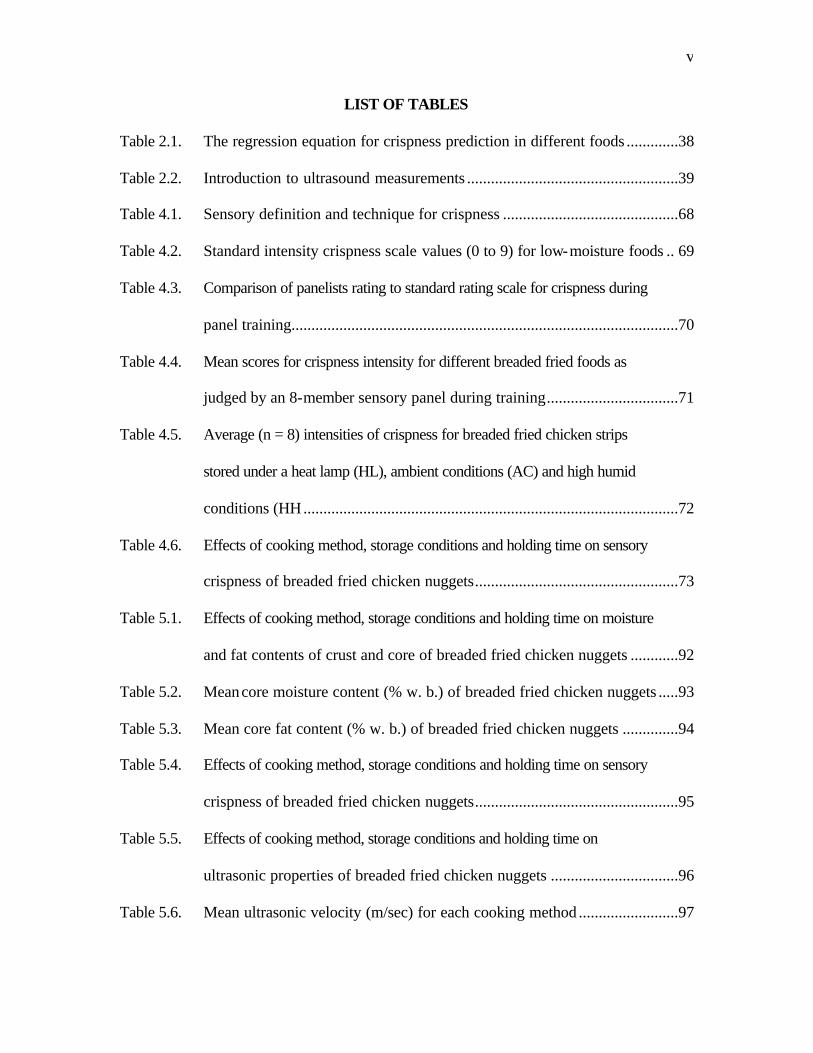
Table 2.1. The regression equation for crispness prediction in different foods .............38
Table 2.2. Introduction to ultrasound measurements .....................................................39
Table 4.1. Sensory definition and technique for crispness ............................................68
Table 4.2. Standard intensity crispness scale values (0 to 9) for low-moisture foods .. 69
Table 4.3. Comparison of panelists rating to standard rating scale for crispness during
panel training.................................................................................................70
Table 4.4. Mean scores for crispness intensity for different breaded fried foods as
judged by an 8-member sensory panel during training.................................71
Table 4.5. Average (n = 8) intensities of crispness for breaded fried chicken strips
stored under a heat lamp (HL), ambient conditions (AC) and high humid
conditions (HH..............................................................................................72
Table 4.6. Effects of cooking method, storage conditions and holding time on sensory
crispness of breaded fried chicken nuggets...................................................73
Table 5.1. Effects of cooking method, storage conditions and holding time on moisture
and fat contents of crust and core of breaded fried chicken nuggets ............92
Table 5.2. Mean core moisture content (% w. b.) of breaded fried chicken nuggets .....93
Table 5.3. Mean core fat content (% w. b.) of breaded fried chicken nuggets ..............94
Table 5.4. Effects of cooking method, storage conditions and holding time on sensory
crispness of breaded fried chicken nuggets...................................................95
Table 5.5. Effects of cooking method, storage conditions and holding time on
ultrasonic properties of breaded fried chicken nuggets ................................96
Table 5.6. Mean ultrasonic velocity (m/sec) for each cooking method .........................97

vi
Table 5.7. Mean transmission loss (dB/mm) for breaded fried chicken nuggets...........98
Table 5.8. Mean signal amplitude for each peak frequency of breaded fried chicken
nuggets ..........................................................................................................99
Table 5.9. Effects of cooking method, storage conditions and holding time on the peak
force and total energy of breaded fried chicken nuggets ............................100
Table 5.10. Mean values of peak force (N/g) and total energy (N/g) for each cooking
method.........................................................................................................101
Table 5.11. Correlation between instrumental and sensory measurements of crispness in
breaded fried chicken nuggets.....................................................................102

vii
LIST OF FIGURES
Fig.3.1 Instrumentation setup for 250-kHz, 500-kHz and 1-MHz ultrasonic
transducers in through-transmission mode ......................................................53
Fig.3.2 Time domain plot of the transmitted ultrasound ..............................................54
Fig.3.3 Effect of placement of breaded fried chicken nuggets either under a heat lamp
or ambient conditions on maximum peak-to-peak amplitude of ultrasonic
signal................................................................................................................55
Fig. 3.4 Effect of placement of samples under either ambient conditions or a heat lamp
on the velocity of ultrasonic propagation.........................................................56
Fig. 4.1 Effect of holding time on the mean sensory crispness intensity ratings of
breaded fried chicken nuggets for each cooking method.................................74
Fig.5.1 Schematic diagram of the instrumentation setup for 250-kHz ultrasonic
transducers in through-transmission mode ....................................................103
Fig. 5.2 Time domain plot of transmitted ultrasound ..................................................104
Fig.5.3 Effect of holding time on the moisture content of the crust ..........................105
Fig. 5.4 Effect of holding time on the fat content of the crust ....................................106 Fig.5.5 Effect of holding time on the mean sensory crispness intensity ratings of
breaded fried chicken nuggets for each cooking method...............................107
Fig.5.6 Relating moisture content to sensory crispness .............................................108
Fig.5.7 Effect of holding time on ultrasonic velocity for each cooking method........109
Fig. 5.8 Relating moisture content to ultrasonic velocity ...........................................110
Fig. 5.9 Frequency domain plot of transmitted ultrasound .........................................111 Fig.5.10 Effect of holding time on peak force for each cooking method.....................112
viii
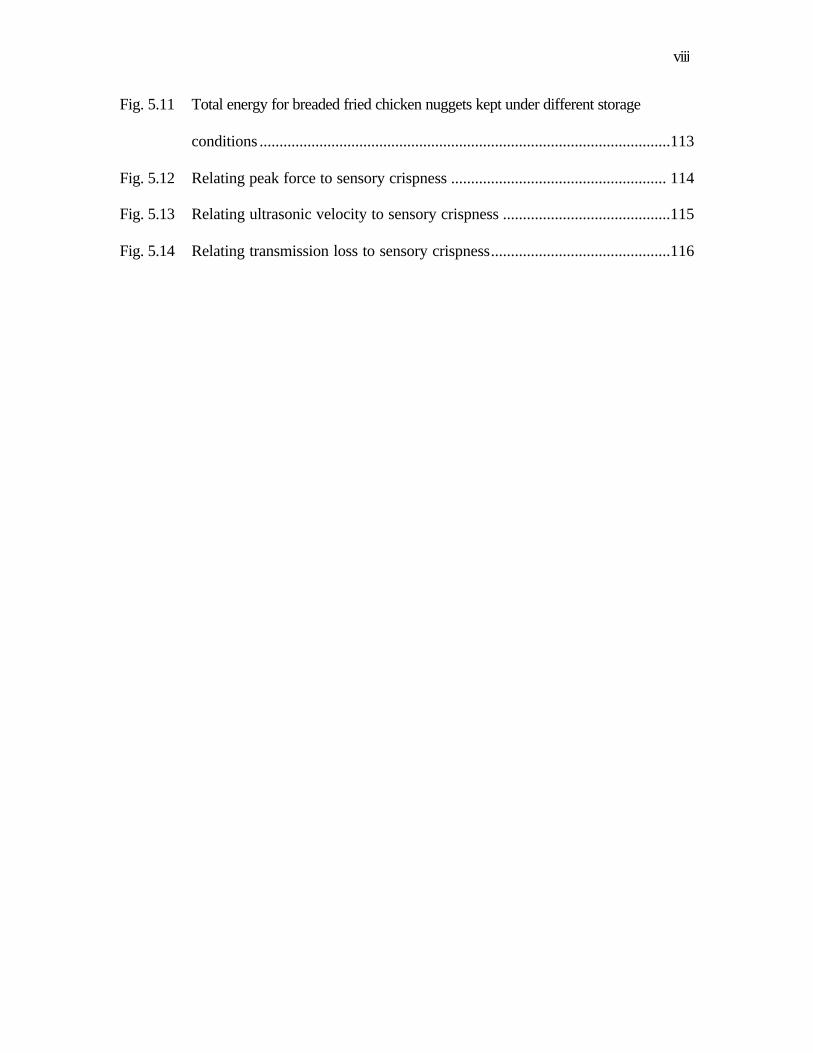
Fig. 5.11 Total energy for breaded fried chicken nuggets kept under different storage
conditions .......................................................................................................113
Fig. 5.12 Relating peak force to sensory crispness ...................................................... 114
Fig. 5.13 Relating ultrasonic velocity to sensory crispness ..........................................115
Fig. 5.14 Relating transmission loss to sensory crispness.............................................116
1
SECTION I
INTRODUCTION
Crispness is one of the most distinctive characteristics of dry crisp and fried
foods. It is conveyed to consumers by a snapping characteristic when the food is bitten
through. This characteristic signifies freshness and high quality in food products.
Breaded fried foods are favored by consumers due to unique and desirable
characteristic of crispness provided by a soft and moist interior with an outer crispy crust.
However, the loss of crispness in fried foods is mainly due to the absorption of moisture
by the crust, causing it to become soggy. Consequently, the breaded fried products
become less desirable to consumers. The loss of crispness can be retarded temporarily by
holding fried foods under a heat lamp. However, the holding time can be critical for fried
foods.
Over the years, many investigators have worked on various techniques to measure
crispness. However, most measurements were applied for low moisture foods. Studies
related to crispness in high moisture foods have been very limited. There is no reliable
method available that can accurately measure and quantify crispness in breaded fried
foods with a dry outer crust layer and a moist core. The development of such an objective
technique that can be correlated to sensory crispness will benefit the food service
business and food processing industry to produce products with desirable attributes and
high quality.
Hypothesis
The hypothesis for this research is that an ultrasonic technique can reliably
quantify crispness on breaded fried food having a moist core.
2
Objectives
The goal of this research was to investigate and use an ultrasonic non-destructive
testing method to evaluate crispness in breaded fried foods having a moist core. The
specific objective were as follows:
1. Investigate the possibility of using ultrasound at various frequencies to
perform the ultrasonic transmission on the breaded fried chicken nuggets.
2. Train a sensory panel for evaluating crispness in breaded fried foods.
3. Obtain sensory crispness values for breaded fried foods under different
storage conditions.
4. Determine the ultrasonic parameters that can correlate well with sensory
crispness of breaded fried chicken nuggets.
5. Measure the mechanical properties such as peak force and total energy for
breaded fried chicken nuggets.
6. Investigate the relationships between the instrumental parameters and sensory
crispness scores obtained using trained panel.
Rationale and Significance
Developing quality-enhanced products with desirable attributes give food
companies an added advantage and increased competitiveness in the market. In order to
achieve this, companies need a reliable method to evaluate the quality attributes of the
product. This study was conducted to reveal the possibilities of using an ultrasonic non-
destructive method as an objective method to quantify crispness in breaded fried chicken
nuggets.

3
Outline
This thesis consists of five sections. Section II, “ Literature review”, is presented
first as a guide for the theoretical background and as a description of previous research
work applying to crispness. Section III, “The development of an ultrasonic technique to
evaluate crispness in breaded fried chicken nuggets”, deals with the development of an
ultrasonic non-destructive method for characterizing crispness. Section IV, “The sensory
evaluation of crispness in a breaded fried foods held under a heat lamp”, provides the
information about training a sensory panel and obtaining sensory crispness scores.
Section V, “Instrumental measures of crispness and their correlation with sensory
crispness”, provides discussion on some objective qualities and on the relationships
between the instrumental parameters and sensory crispness. Section VI, “ Summary and
conclusions”, is provided as the final section of this thesis.

4
SECTION II
LITERATURE REVIEW

5
Crispness is one of most important textural and desirable characteristic of dry
crisp foods and fried foods, and has been studied by many investigators. Various
definitions and meanings of crispness, studies of instrumental measurement of crispness,
and its importance are described in this chapter. Ultrasonic technique is presented as a
potential method for the objective evaluation of crispness. Ultrasonics have been used
successfully in food industry for many years for various purposes. The basic principles of
ultrasonics and its applications are reviewed in this chapter.
Batters/Breading for Fried Food and Its Significance to Crispness
Among battered and breaded food products, fried foods constitute a major
portion. Fried chicken products exceeded $8.2 billion in sales in the U.S. in 1996.
Coating seafood, poultry, red meat, and vegetable products with a batter and/or breading
before cooking is a common practice of homemakers, food processors, and commercial
fast-food outlets. Batter was defined as the liquid mixture comprised of water, flour,
starch, and seasonings into which food products are dipped prior to cooking. Breading
was defined as a dry mixture of flour, starch, and seasonings, coarse in nature, and
applied to moistened or battered food products prior to cooking. Coating was referred as
the batter and/or breading adhering to a food product after cooking (Suderman, 1983).
The batter systems are classified into two categories: interface/adhesion and
puff/tempura (Loewe, 1992). The interface/adhesion batters are used with breading,
serving primarily as an adhesive layer between the product’s surface and the breading.
Chemical leavening is not normally used. Puff/tempura batters use leavening agents and
are used as an outside coating for the food. The batter uniformity and thickness, which is

6
related to the batter viscosity, determine acceptability of the finished product. A more
viscous batter will pick up more breading than will a less viscous one.
Batters and breadings serve many functions as food coatings, such as enhancing a
food product’s appearance (Elston, 1975), giving a crispy texture (Elston, 1975 and
Zwiercan, 1974) and contributing to the pleasure of substantial eating (Vickers and
Bourne, 1976b). Coating material is a key for producing a desirable crispness in breaded
fried chicken nuggets, chicken strips and seafood. Ideally, the coating should exhibit a
structure that sufficiently resists the initial bite, and then should disappear with a quick
meltaway in the mouth. A coating that does not readily break down during subsequent
mastication will be rated chewy, heavy, undesirable, and perhaps even lacking in
freshness (Loewe, 1992).
Hanson and Fletcher (1963) suggested that mixtures of thickening agents could be
used for achieving desirable crispness. Cooking also affects coating crispness. Donahoo
(1970) reported that crispness can be adjusted by time and temperature of cooking.
The optimum method for producing crisp coated foods is through deep-fat frying
at temperatures ranging from 1760 C to 2040 C. Rapid heat transfer quickly sets the
coating structure, allowing little time fore excess moisture infiltration. This cooking
procedure is the method of choice in the food service industry for both interface/adhesion
and puff/tempura coatings. Primarily used in the home, oven heating is the method for
producing a moderate acceptable product in terms of crispness, color, and flavor.
Although the heating rate is slower than that of deep-fat frying, the elevated chamber
temperature of the oven causes some evaporative drying of the coating, resulting in the
perception of crispness. It appears that microwave heating is not suitable method for
7
coated foods. Microwave oscillations cause molecular vibrations and resultant frictional
heating within the food. The evaporative drying does not occur. The result is a soggy
coating with minimal crispness. Use of microwave heating will require a unique
technology for effective product development of coated foods (Kulp and Loewe, 1992).
One problem common to all battered and/or breaded products is adhesion. Poultry
parts are known as the most difficult food substrate to batter or bread (Suderman, 1983).
Batter and breading adhesion is affected by several factors such as poultry skin
ultrastructure, freezing of parts, product surface temperature, predip composition, batter
viscosity, breading and batter composition, and the cooking process. In typical deep-fat
frying, the batter or breading coating quickly coagulates upon exposure to high frying-oil
temperatures. As a result, the coating essentially takes the size and configuration of the
product. However, as the food product continues to cook, the substrate shrinks to a size
smaller than the coating matrix. Precooking of the product by steaming, simmering, or
boiling has been recommended to improve its adhesive properties before the batter was
applied (Kulp and Loewe, 1992).
Crispness in Foods
Crispness is a highly-valued and universally-liked textural characteristic that has
many positive connotations. Its presence signifies freshness and high quality. It goes well
with many other textural characteristics and is often used to create pleasing textural
contrasts. Probing into consumer attitudes to texture and its specific characteristics
Szczesniak and Kahn (1971) stated that crispness is particularly good as an appetizer and
as a stimulant to active eating. It is very important to the pleasure of substantial eating. It
appears to hold a particular place in the basic psychology of appetite and hunger
8
satiation. It is notable as a relaxing or satiable texture and appears to be universally liked
characteristic. Crispness is very prominent in texture combinations that mark excellent
cooking and is synonymous with freshness and wholesomeness. In their 1984 study of
textural combinations Szczesniak and Kahn added that crispness appears to be the most
versatile single texture parameter.
Over the years, many investigators have worked on the various definitions and
meanings of crispness. However, the definition of crispness is not completely understood.
Only the generalized concept has been established as close to the definition as possible.
The importance and desirability of crispness have increased research efforts to define and
measure this attribute (Vickers, 1988; Szczesniak, 1988; Lee et al., 1990; Dacremont,
1995).
Szczesniak (1988) tried to characterize crispness based on the consumer
descriptions and found that crispness was associated with brittleness, crackling, snapping,
crunchiness and sound emission during eating.
Crispness and Crunchiness
Several scientists have shown that crispness and crunchiness are very closely
related sensations, but crunchiness is used more often in reference to moist foods
(Szczesniak and Kahn, 1971; Moskowitz and Kapsalis, 1974; Vickers and Wasserman,
1980; Vickers, 1981). Moskowitz and Kapsalis (1974) derived regression equations
relating descriptors to one another and found that crispness was most closely related to
the quality of crunchiness and crunchiness was most closely related to crispness and
hardness. Vickers and Wasserman (1980) used multidimensional scaling to arrange 15
food sound descriptors in two-dimensional space. The descriptors crisp and crunchy were

9
very close to each other in this space, indicating that they have similar meanings when
used to describe sounds. Vickers (1981) had subjects judge 16 foods and the biting and
chewing sounds of these foods for both crispness and crunchiness. She found large
correlations between the two descriptors, whether the judgments were made on the basis
of biting and chewing the foods or by only listening to the sounds.
It has been suggested that the sensations of crispness and crunchiness may differ
in the pitch of their respective sounds (Vickers, 1979 and 1984). Foods that were more
crisp than crunchy produced higher pitched sounds than foods that were more crunchy
than crisp. However, pitch is a complex characteristic and is not dependent on a single
physical quantity, the pitch of sound being determined by its frequency, intensity and
waveform.
Seymour and Hamann (1988) studied the relationships between descriptive
sensory crispness and crunchiness and acoustic and mechanical measurements for low
moisture foods. A trained texture profile panel developed sensory definitions of crispness
and crunchiness. Sensory crispness was evaluated by placing sample between incisors
and detecting a level of higher pitched noise. Sensory crunchiness was evaluated by
placing sample between molar teeth and detecting a degree of low-pitched noise. High
correlations were found between sensory crispness and crunchiness in all products.
Seymour and Hamann (1988) indicated that crispness and crunchiness are closely related
sensory interpretations of food texture, and can be quantified by a combination of
mechanical and acoustic measurements. Mechanical force and work done to failure had
strong inverse correlations with sensory crispness and crunchiness. Acoustic parameters
also had high correlations with the sensory parameters. Crisp products were mechanically
10
weaker than crunchy products. More force was required to fracture a crunchy product.
However, the acoustic parameters that highly correlated with sensory crunchiness tended
to be at lower frequencies than was the case for crisp products.
Characterization and Determination of Crispness
Though many approaches to the instrumental measurement of crispness in foods
have been made, the best measurements are still inconclusive. However, the properties
related to crispness were able to disclose the complexity of crispness and its association
to other similar sensory attributes, such as brittleness, hardness, crackliness or
crunchiness.
Structural and geometrical properties
Many researches agree that crispness should result from the structural properties
of a food (Barrett et al., 1994; Gao and Tan, 1996a; Bouvier et al., 1997; Mohammed et
al., 1982; Stanley and Tung, 1976; and Vickers and Bourne, 1976b). Matz (1962) and
Coppock and Carnford (1960) indicated that crisp, dry foods such as biscuits, break into
many pieces when masticated and that their eating quality is affected by the size of air
cells and thickness of the cell walls.
Crispness is related to the cellular structure of foods. Perhaps the most direct
method of its objective measurement is likely to be the investigation of the product’s
structure and geometrical properties. Scanning electronic microscopy (SEM) is often
used to reveal the internal structure of the product. Gao and Tan (1996a) used this
technique to measure the cell size and density. Barrett et al. (1994) investigated the
structural properties characterized in terms of cell size distribution and bulk density of
corn-based extrudates. They found that mechanical strength, defined by a compressive

11
stress, and fracturability, quantified by fractal and Fourier analyses of stress-strain
functions, increased with either decreasing mean cell size or increasing bulk density. The
correlation of fracturability parameters or structural characteristics with sensory scores of
crunchiness, crispness, and hardness indicated that cellular structure strongly influences
the pattern of mechanical failure.
Recently Gao and Tan (1996b) proposed that some important sensory attributes
could be analyzed by an image processing technique. Some important sensory attributes
could be predicted by processing the surface and cross-section images of the product.
Mechanical properties
Perhaps the most prevalent objective measurement for crispness is a
determination via mechanical properties. The mechanical properties are associated with
the structural properties of materials derived by means of the resistance to a compression
of blade/probe and to a tensile that pulls the structure of food material apart by a
universal testing machine such as Instron or a texture analyzer.
In order to authenticate the sensory assumptions, various modifications of jigs and
tools were created for objective investigations, such as shear compression blade, puncture
probe, Kramer shear-compression test cell, and snap test cell. Nevertheless, there are no
definite criteria for selection of an apparatus to measure the mechanical properties of
foods. Also, the tests are dependent upon the nature of products. Therefore, a variety of
mechanical tests have been reported for different low moisture foods.
Vickers and Bourne (1976a) used a snap test to measure such parameters as bend
deformation to fracture, and stiffness (the slope of a force-deformation curve of Young’s
modulus). They found large correlations between these measurements and sensory

12
crispness. Voisey and Stanley (1979) suggested that the number of peaks or breaks using
a Warner-Bratzler test cell would be a good indicator of crispness in fried bacon.
Mohamed et al. (1982) used a constant force rate texture testing instrument to
study crispness of the biscuits. Good correlations were found between sensory crispness
and the ratio of work to fracture to total work. Seymour (1985) used a Kramer shear cell
in an Instron to crush samples of several dry crisp foods altered in crispness by
humidification. He found large negative correlations between crispness and the following
mechanical parameters: maximum force at failure and work done to failure.
Although mechanical tests are relatively quick and easy to perform they have not
produced high enough degree of correlation with sensory crispness. Also, many crisp
foods cannot be tested by these tests because they are too small, have irregular sizes and
shapes or are part of a food that also consists of noncrisp parts.
Acoustical properties
Drake (1963) was the first scientist to study food crushing sounds. He observed
that sounds from crisp foods differ from those of noncrisp foods in their amplitude. In
another study, Drake (1965) found high correlation between sound amplitude and
perceived loudness. Since the pioneering work by Drake (1963, 1965), several studies
have been made to relate textural characteristics (especially crispness) to a sound quality,
which is a complex function of several acoustical parameters. Pitch is the main sound
quality and is defined by the frequency of pure tones or by the frequency range with the
highest energy level for complex tones. The sound produced when a food is crushed
contains a large amount of information. It is composed of many different pitches and the
loudness of the sound varies over these different pitches.

13
Studies have shown that the auditory sensations are an important for evaluating
crispness (Vickers and Bourne, 1976b; Christensen and Vickers, 1981; Mohamed et al.,
1982; Edmister and Vickers, 1985; Lee et al., 1988). Vickers and Bourne (1976) studied
the acoustical properties of tape-recorded biting sounds of wet and dry crisp foods. They
found that crisp foods consist of an uneven and irregular series of noises, and suggested
that the repeated breaking or fracturing of food samples during biting and chewing
produced these acoustical characteristics. Observing differences in amplitude-time plots
between the samples, Vickers and Bourne concluded that less crisp samples produced
less noise. Christensen and Vickers (1981) evaluated separately the loudness and
crispness of 16 different products during chewing and biting. They found high positive
correlations between crispness and loudness, indicating that biting and chewing sounds
were important for evaluating crispness. Mohamed et al. (1982) studied the sound
produced by five varieties of dry crisp foods stored at different relative humidities. The
sounds were recorded as the foods were fractured by compressing in a constant loading
rate texture testing instrument. The sound energy correlated significantly with sensory
crispness. Edmister and Vickers (1985) investigated the relationships between several
instrumental acoustical parameters and sensory crispness. They found that the best
acoustical predictor of auditory crispness was the logarithm of the number of sound
bursts and the mean amplitude of the bursts.
Dacremont (1995) asserted that sounds generated from a food fractured by a
mechanical apparatus are different from eating sounds and do not contain the relevant
information for texture judgment. Nevertheless, eating sounds are still varied in
frequency components that are either airborne or conducted via the bone. Regarding this

14
matter, Lee et al. (1988) investigated acoustic behavior during 10 consecutive chews of
potato chips and tortilla chips. They found that as chews increased, sound intensity
tended to increase. Also, the higher frequency of chewing sound which is audible
decreased as chews increased. This finding was supportive of the psychoacoustical
theory proposed by Vickers and Bourne (1976a) that crispness should be characterized by
high-pitched sound. Therefore, they hypothesized that the assessment of crispness may be
more dependent on the information obtained from initial mastication as opposed to later
chews.
Caution has been raised by Peleg (1997) concerning the recent development in
acoustical properties that have been proposed and the measured acoustic variables used in
the past in that the count for the number of peaks does not account for the peak
magnitude and shape which can be sharp or broad. In addition, the count also can be
affected by the selected resolution and sampling rate. Peleg (1997) recommended using
the Fourier transform method to obtain more reliable information for determining
crispness (or crunchiness) in foods.
Acoustical analysis is not sufficient enough to measure crispness. It has been
suggested that combination of the acoustical and mechanical measurements might predict
better the crispness of foods (Mohamed et al., 1982; Seymour, 1985; Vickers, 1987; and
Vickers, 1988).
Combination Measurements
Sensory crispness has been predicted using both acoustical and force-deformation
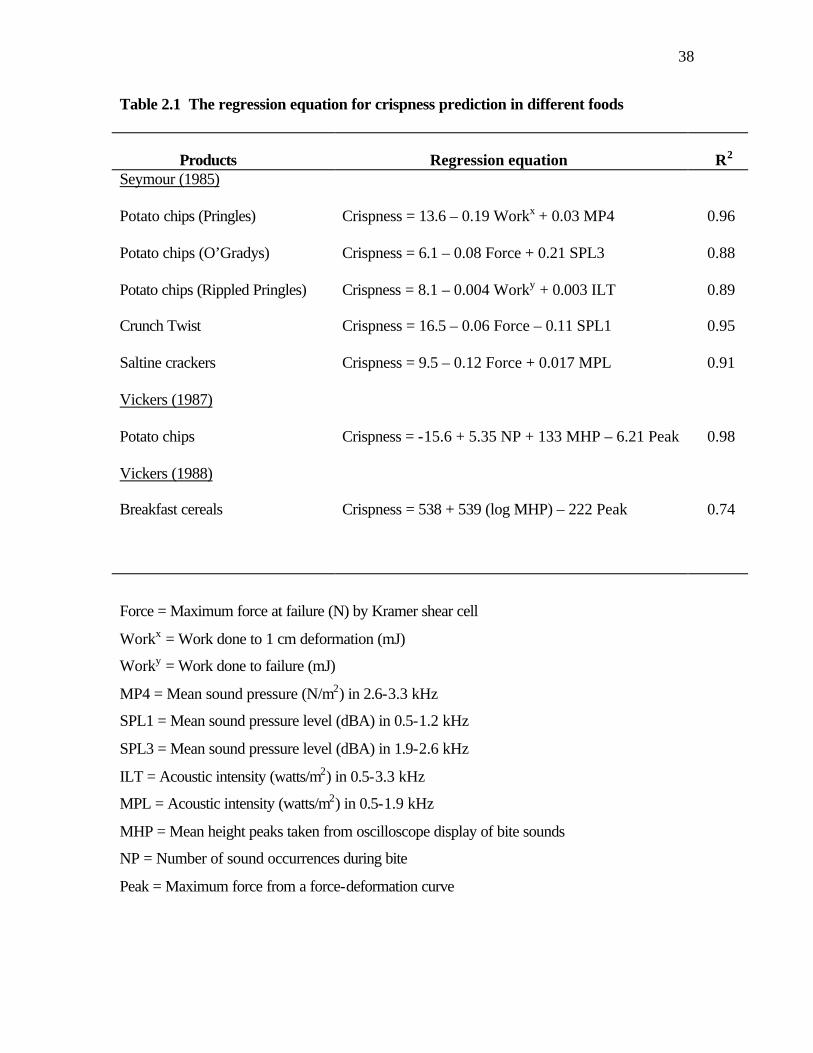
measurements by the multiple linear regression technique summarized in Table 2.1.
Seymour (1985) studied crispness in four different low moisture foods. In all cases except

15
Crunch Twist, crispness was positively related to an acoustical parameter and inversely
related to a force-deformation parameter. This inverse relationship of crispness to force-
deformation parameters and positive relations to acoustical parameters was also shown
by Vickers (1987, 1988). Vickers (1988) noted that the inverse relationship between
crispness and the force-deformation parameters is more unusual and may mean that
sensations of hardness and/or toughness are detracting from crispness.
Characterization of crispness has been more complicated since Tesch et al. (1996)
found no relationships between the mechanical and acoustical parameters. They were
concerned that complication may have been due to the effect of unequal frequency for the
mechanical and acoustical measurements or that some parts of the crisp or crunchy
information manifested in acoustical properties may not have been fully revealed in the
mechanical properties, or vice versa.
However, all these tests were applied just for low moisture foods. Studies related
to crispness in high moisture products have been very limited. In addition, the
measurements may be very different from that developed for low moisture foods. Recent
efforts by Tahnpoonsuk and Hung (1998) to characterize crispness in breaded shrimp did
not give a conclusive correlation. They attempted to record sound signals during
compression testing, using modified Warner-Bratzler shear blade.
Introduction to Ultrasonics
Ultrasound has been successfully used as an analytical tool in many areas, such as
industrial processes, metal fabrication, medical scanning, and evaluation of biological
and food materials. Ultrasonic technique is non-hazardous, provides means to determine
mechanical properties, microstructure, imaging, and microscopy, and is cost-effective.

16
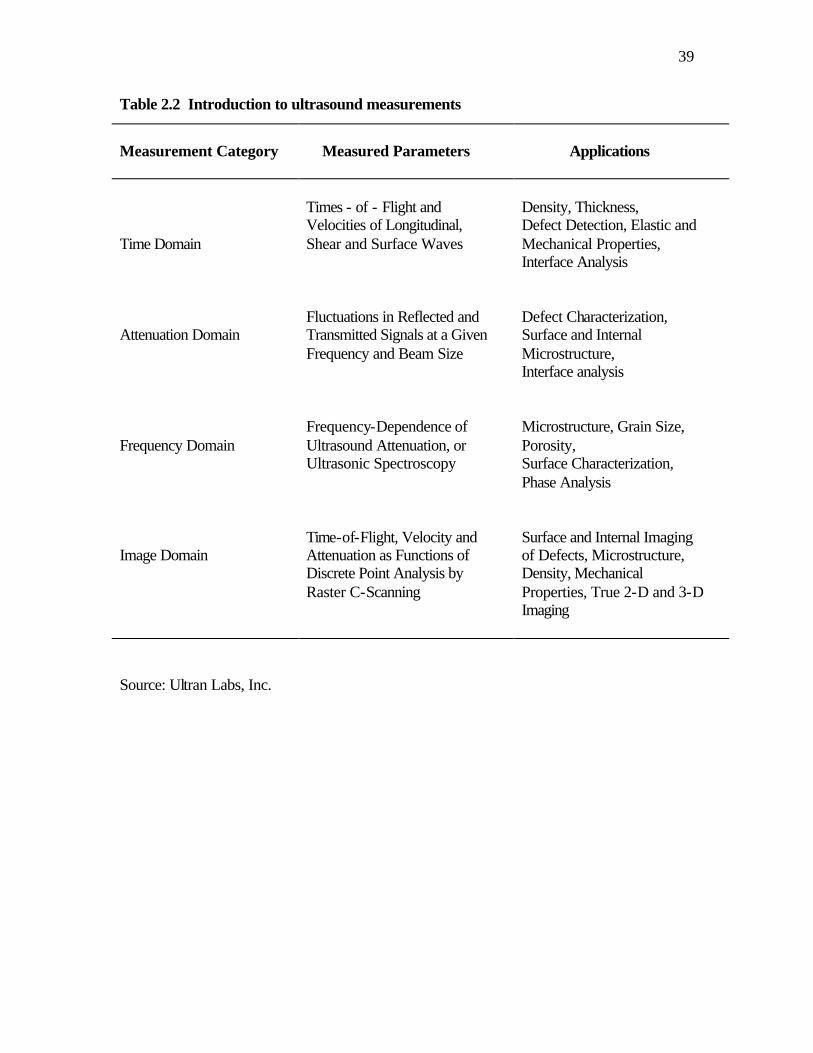
Propagation of ultrasound in a medium is not affected by its optical opacity. Table 2.2
provides an introduction to ultrasound measurements and to the information revealed
either directly or through correlation (Ultran Laboratories, Inc., 1999).
Fundamental Physics of Ultrasonics
Sound waves are produced as a result of the mechanical vibration of the particles
in gas, liquid, or a solid material about the equilibrium positions of these particles.
Vibration of these particles in a material is an essential characteristic of acoustic
propagation. If a particle is displaced from its equilibrium position by applied stress, such
as by the pressure of a sound wave, internal forces in the particles tend to place a particle
to its original equilibrium position. A displacement at one point induces a displacement at
the neighboring points. The transmission of a wave through a medium is the result of the
effects of elastic force between the particles and inertia of the particles.
Sound waves can provide useful information about the material through which
they propagate. Ultrasonic is the name given to the study and application of sound waves
having frequencies above those within the hearing range of the average person, i.e., at
frequencies above 16 kHz.
Ultrasonic energy travels through a medium in the form of a wave. To study such
waves, it is better to begin with the simplest type of a wave such as a plane wave. Plane
wave is a sinusoidal vibration that has only a single frequency component occurring in an
isotropic medium, which is perfectly elastic (Wells, 1969).
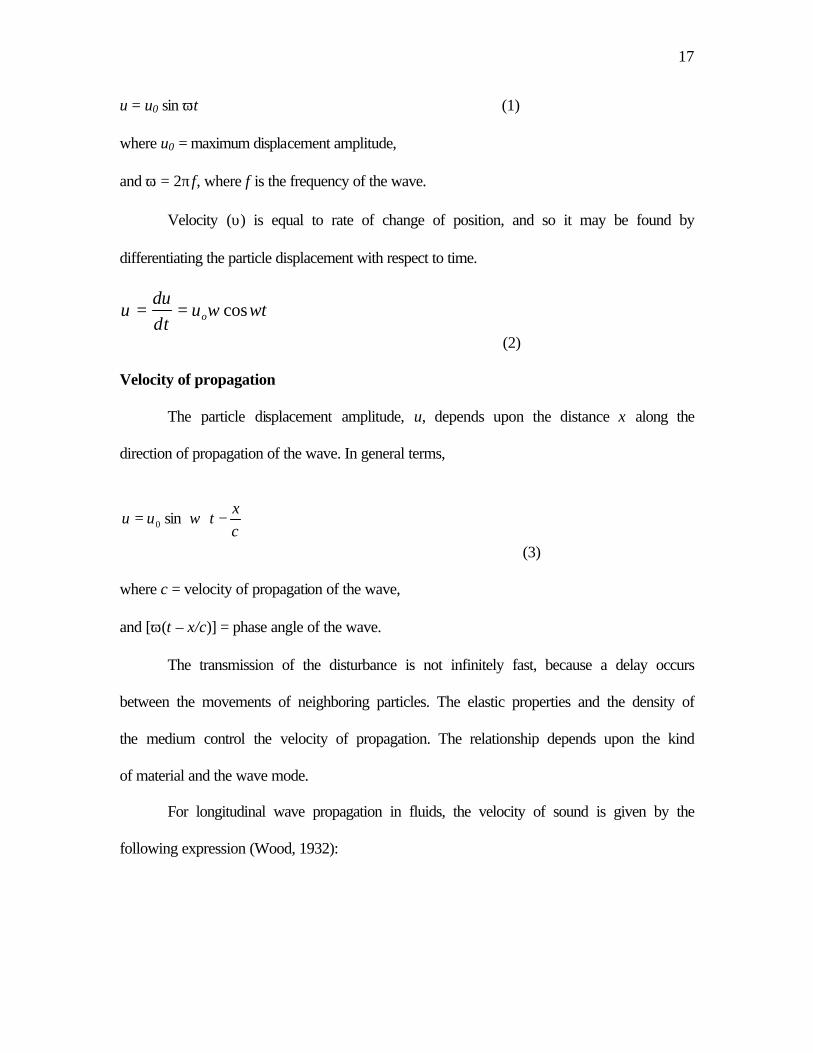
The displacement amplitude, u, from the mean position of particles in simple
harmonic motion, at any time, t, and at a fixed point along the direction of propagation of
the wave where u = 0 when t = 0, is given by
17
u = u0 sin ωt (1)
where u0 = maximum displacement amplitude,
and ω = 2πf, where f is the frequency of the wave.
Velocity (υ) is equal to rate of change of position, and so it may be found by
differentiating the particle displacement with respect to time.
(2)
Velocity of propagation
The particle displacement amplitude, u, depends upon the distance x along the
direction of propagation of the wave. In general terms,
(3)
where c = velocity of propagation of the wave,
and [ω(t – x/c)] = phase angle of the wave.
The transmission of the disturbance is not infinitely fast, because a delay occurs
between the movements of neighboring particles. The elastic properties and the density of
the medium control the velocity of propagation. The relationship depends upon the kind
of material and the wave mode.
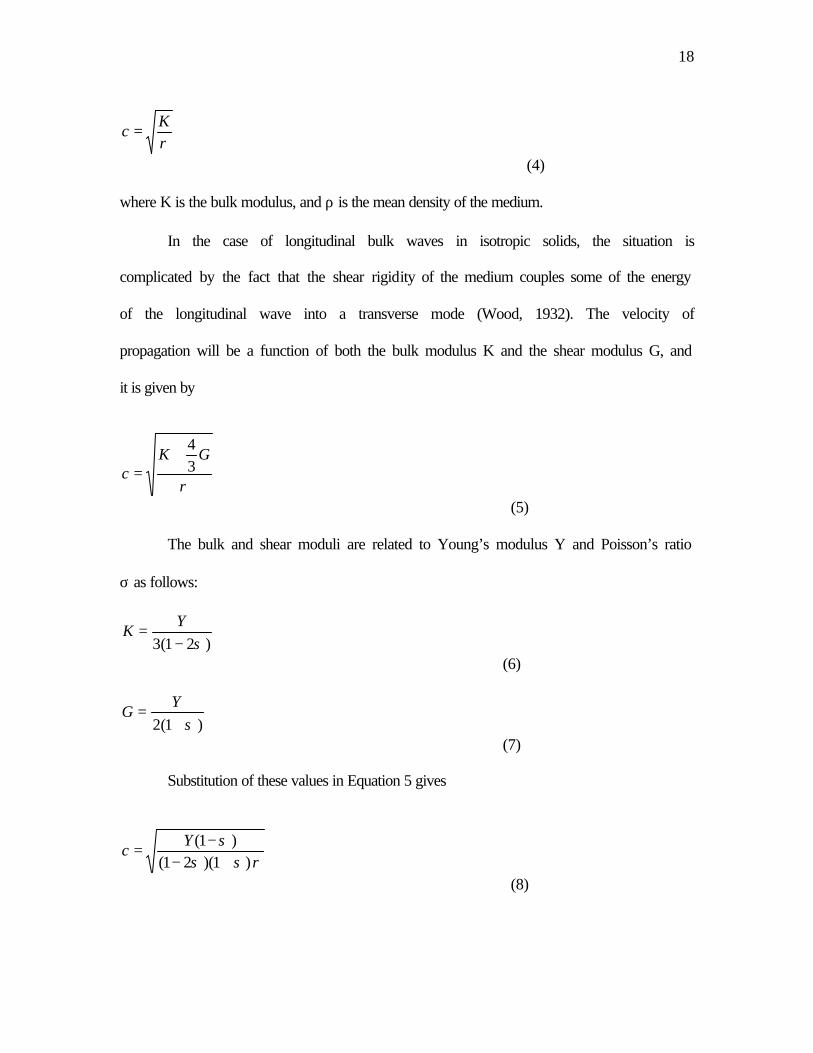
For longitudinal wave propagation in fluids, the velocity of sound is given by the
following expression (Wood, 1932):
tutu
o ωωδδ
υ cos==
−=
cx
tuu ωsin0
18
(4)
where K is the bulk modulus, and ρ is the mean density of the medium.
In the case of longitudinal bulk waves in isotropic solids, the situation is
complicated by the fact that the shear rigidity of the medium couples some of the energy
of the longitudinal wave into a transverse mode (Wood, 1932). The velocity of
propagation will be a function of both the bulk modulus K and the shear modulus G, and
it is given by
(5)
The bulk and shear moduli are related to Young’s modulus Y and Poisson’s ratio
σ as follows:
(6)
(7)
Substitution of these values in Equation 5 gives
(8)
ρK
c =
ρ
GKc 3
4+
=
)21(3 σ−=
YK
ρσσσ
)1)(21()1(
+−−
=Y
c
)1(2 σ+=
YG
19
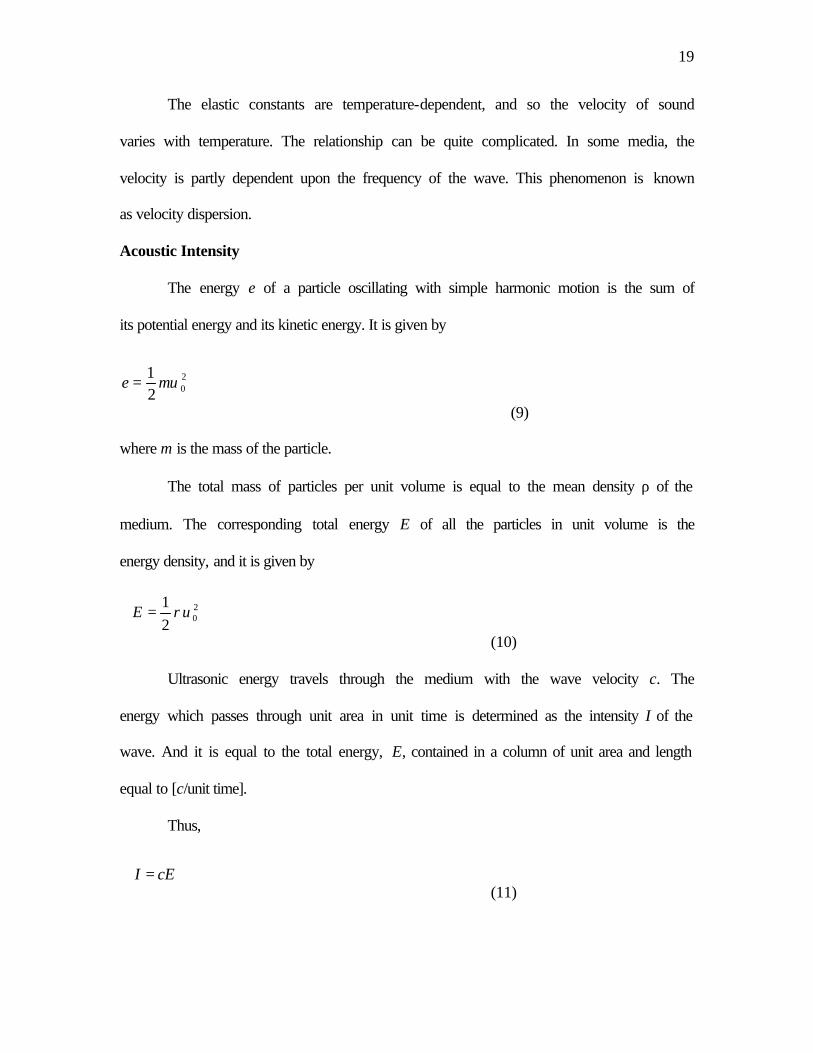
The elastic constants are temperature-dependent, and so the velocity of sound
varies with temperature. The relationship can be quite complicated. In some media, the
velocity is partly dependent upon the frequency of the wave. This phenomenon is known
as velocity dispersion.
Acoustic Intensity
The energy e of a particle oscillating with simple harmonic motion is the sum of
its potential energy and its kinetic energy. It is given by
(9)
where m is the mass of the particle.
The total mass of particles per unit volume is equal to the mean density ρ of the
medium. The corresponding total energy E of all the particles in unit volume is the
energy density, and it is given by
(10)
Ultrasonic energy travels through the medium with the wave velocity c. The
energy which passes through unit area in unit time is determined as the intensity I of the
wave. And it is equal to the total energy, E, contained in a column of unit area and length
equal to [c/unit time].
Thus,
(11)
202
1ρυ=E
202
1υme =
cEI =

20
(12)
In ultrasonics, variations of intensity and wave amplitude are expressed in a
logarithmic manner. The logarithmic unit is the decibel (dB). It is defined as follows:
(13)
Acoustic Pressure
The oscillations of the particles in the medium lead to the formation of
compression and rarefaction, relative to the mean pressure. The derivation of the
relationship between pressure and the other parameters of the wave is rather complicated
(Blitz, 1963). For plane waves in a non-absorbent medium the acoustic pressure (p) can
be shown as:
(14)
Characteristic Impedance
There is a similarity between the variations of sound wave characteristics and
those of certain quantities used in electrical theory. Thus, the quantity ρc is known as the
characteristic impedance Z of the medium. The value of the characteristic impedance for
a given material depends upon its physical properties.
tccp ωυρυρ sin0==
)log(20)log(1000 A
AII
dB ==
202
1υρcI =

21
Reflection and Transmission
When an ultrasonic wave reaches a boundary between two different media, some
of the sound energy will be reflected. If the boundary dimensions normal to the
propagation direction are much greater than the wavelength and the thickness is much
less that the wavelength, then the reflection coefficient, R, for normal incidence will be
(15)
And the transmission coefficient for normal incidence will be
T = 1 – R (16)
(17)
where Z1 and Z2 are the characteristic impedances for the two materials, and R
and T are the fractions of the incident ultrasonic power that are reflected and transmitted
respectively.
Impedance matching to ensure that Z1 and Z2 are nearly equal is an important
consideration when choosing a transducer for a given food, since if Z1 and Z2 are
significantly different in value, then almost all the energy from the transducer will be
reflected at the boundary and fail to enter the material (Povey and McClements, 1988).
Attenuation of ultrasound
The intensity of a wave of ultrasound traveling through a medium may be
attenuated by any of several different mechanisms. One of the mechanisms is the result of
deviation from a parallel beam, so that the energy per unit area is reduced.
2
12
12
+−
=ZZZZ
R
212
12
)(4
ZZZZ
T+
=

22
Another attenuation mechanism is due to scattering by elastic discontinuities
within the medium. A discontinuity acts as a reflecting surface, the size of which in
relation to the wavelength of the ultrasound determines its effect as a scatterer. Since the
energy, which is scattered no longer, moves in the original direction of propagation the
attenuation of the beam occurs.
These two effects are not really absorption mechanisms, for none of the ultrasonic
energy is converted from its vibrational form. True absorption mechanisms involve
energy conversion. The most important of these mechanisms are elastic hysteresis,
viscosity and heat conduction in fluids, and molecular-level energies.
Attenuation is generally expressed in the following form (Bray and Stanley,
1997):
(18)
where
P0 = original pressure level at a source
P = pressure level at second reference location
a = attenuation coefficient
L = distance from original source to second reference location
Ultrasonic Transducer
Ultrasonic energy is generated and detected by devices called transducers. By a
definition a transducer is “a device that is actuated by power from one system to supply
power to a second system” (Ensminger, 1973). A transducer converts energy of one from
to that of another. Piezoelectric transducers are the most common mechanism, and are
used at all ultrasonic frequencies for generating and detecting ultrasonic energy at all
aLePP −= 0

23
levels of intensity. Most modern piezoelectric materials are ceramics such as barium
titanate (BaTi), lead zirconate titanate (PZT), and lead metaniobate (PMN).
A transducer can be as simple as a piezoelectric disc with leads attached to both
faces. Or, it can be a complex device intended to evaluate a number of materials and
interfaces. A transducer device must be characterized by proper acoustics and mechanical
construction.
The selection of the appropriate transducer is very important to any successful
application of ultrasonics. It depends upon the composition, texture, microstructure,
shape and the objectives of the materials testing. It also depends upon the mode of
coupling the transducer to the test material.
A variety of devices other than piezoelectric ceramics, such as the piezoelectric
film (PVDF), magnetostrictive, lasers, and electromagnetic-acoustic (EMAT) devices,
offer current and future advantages in ultrasonic nondestructive evaluation.
Ultrasonic techniques in foods
Ultrasonic technology was first developed as a means of submarine detection in
World War I, and developments in this area have continued to the present day (Kinsler et
al., 1982). In the inter-war years the high-intensity ultrasonics has been applied for the
ultrasonic cleaning, cell disruption and emulsification equipment. These high-intensity
applications are characterized by relatively low frequencies, up to about 100 kHz, by
continuous operation and by power levels from 10 kWm-2 upwards. Recently, high-power
ultrasonics has used for promoting chemical reactions, acquiring the name
“Sonochemistry” in the process (Mason, 1987).
24
Ultrasonic techniques for non-destructive testing (NDT) of metal were based on
developments in radar electronics in World War II. Ultrasonics NDT is characterized by
high frequencies (between 0-1 and 20 MHz), pulsed operation and lower power levels (<
100 mW) than high-power ultrasonics.
Ultrasonics have been used in the food industry for many years for various
purposes, such as emulsification (Sajas, 1978a,b), cleaning (Lambert, 1982), animal
backfat thickness estimation (Lister, 1984), and the bulk properties of food materials
(Agricultural Research Council, 1982; Food and Drink Federation, 1985).
Ultrasonic measurements on food systems have special demands. Foods are
generally more complex than other materials presented to ultrasonic systems. The
electronic systems need to be environmentally protected, and their sensors must endure
cleaning and maintenance. The sample temperature and properties and method of
presentation to the sensor may be different from the laboratory ideal. However, ultrasonic
techniques have such advantages as relatively low cost, a well-established theory of the
interaction between acoustic fields and matter, and an indifference to hostile
environments, for example hot materials and accessibility to materials opaque to light.
Ultrasonic radiation also has fewer hazards associated with it most other forms of
radiation (Apfel, 1981; Carstensen, 1982).
Food ultrasonics represents a new area of application and provides new sources of
information about the properties of material being processed. The following properties
can be determined from ultrasonic measurements (Povey and McClements, 1989).
1. Bulk modulus and rigidity modulus may be determined by measurements of the
compressional and shear wave velocities and of the density.

25
2. The complex shear viscosity of viscoelastic media may be found by the shear
reflectance technique.
3. Scattering experiments can provide information on shear viscosity and thermal
diffusivity.
4. Reflection at boundaries can provide a means of gauging thickness and depth of
acoustically dissimilar layers.
5. The temperature dependence of the quantities provides a means by which the velocity
of sound measurements can be used to measure temperature.
6. Fluid flow velocity and velocity profile can be determined ultrasonically.
7. Measurement of ultrasound velocity in two-phase systems can provide information
about the volume ratio of the phases and compressibility of the dispersed phase.
Applications of the ultrasonic technique in the food industry
Ultrasonic techniques have been used in food industry for various purposes.
Povey (1984) and Miles et al. (1985) used ultrasonics for solids content determination. In
liquids containing suspended solids, ultrasonic velocity and solids content are related.
The solids content can be determined by measuring ultrasonic velocity. The technique
has been applied to foods (Zacharis and Parnell, 1972), to polymer solutions (Kuster and
Toksoz, 1974), and to coal slurries (Sayers, 1980). Povey and Harden (1981) measured
solid foams and composites on biscuits, using soft-tipped ultrasonic probes adapted to the
surface contours of the biscuit. Ultrasonics has been applied for gels (Pryor et al., 1958;
Wyn-Jones et al., 1982; Morris, 1985). The measurements of rigidity and compressibility
have been made by two methods that are transmitting a shear wave through the gel and
measuring its velocity, and reflecting a shear wave from the gel surface. Shear waves

26
could not be transmitted through the gels. Povey and Wilkinson (1980) studied the
components of the eggs such as yolk, thick white and thin white to design the ultrasonic
quality control equipment for whole eggs. Bachaman et al. (1978) used ultrasonics to
search the coagulation of milk protein. Ultrasonics has been used to study cheese
maturation (Maiorov and Ostroumov,1977; Orlandini and Annibaldi, 1983; Benedito et
al., 2001). Maiorov and Ostroumov (1977) evaluated the rigidity, which is an important
factor in the development of the desired texture, from velocity measurements. Orlandini
and Annibaldi (1983) suggested that ultrasonics could be used to indicate structural
defects during the early stages of the maturation of Parmesan cheese. Gunasekaran and
Ay (1996) applied ultrasonic technique to evaluate the curd firmness in order to
determine the optimum cut-time for cheese making. Benedito et al. (2001) determined the
degree of cheese maturity from ultrasonic velocity measurements performed in the
through-transmission mode, and detected cracks within the cheese, using pulse-echo
technique. The particle size, liquid shear viscosity and thermal diffusivity of emulsions
were determined ultrasonically (McClements and Povey, 1987).
Povey and Harden (1981) measured crispness of biscuits using the ultrasonic
pulse echo technique. They found good correlation between the crispness from sensory
measurement and the velocity of longitudinal sound. The ultrasonic velocity correlated
with crispness better than either the ultrasonically derived Young’s modulus, or the
Instron universal testing machine derived modulus. Povey and Harden concluded that the
ultrasonic technique offers a promise as a method for the electromechanical measurement
of the crispness.
27
Ultrasonics can be used to evaluate physical properties of fruits and vegetables.
The parameters generally measured in low-intensity ultrasonics are the velocity,
attenuation and acoustic impedance of the propagation medium. The measured parameter
depends on the physical properties of the propagation medium, such as the elastic
modulus, density and microstructure.
Ultrasonic nondestructive techniques have also been applied to detect anomalies,
such as foreign bodies, voids, and hollow hearts. Hollow hearts in potatoes were detected
analyzing ultrasound transmitted through the potato (Cheng and Haugh, 1994). Taubert
and Stuempel (1997) used ultrasonic imaging technique to detect absences and foreign
bodies in pork and pig carcasses.
Ultrasonic techniques can be successfully used in the food industry and can give
significant advantages. Future successful applications depend upon understanding of the
technology on which ultrasonics is based.
Conclusions
Crispness is one of the most important and desirable textural characteristics that
indicate freshness and high quality in breaded fried foods. A general understanding of
the crispness and its meaning exists but there is disagreement on a definition. There have
been numerous approaches to the instrumental measurement of crispness in foods.
However, there is no objective method available that can accurately measure and define
this quality attribute for breaded fried foods having a moist core. Development of such a
method will allow food product manufacturers to develop products with desirable
attributes.
28
Ultrasonic techniques have not, so far been used for the measurement of crispness
in breaded fried foods although successful applications of ultrasonics exist in
characterization of foods. It has been pointed that there may be an encouraging
relationship between the sensory crispness of biscuits and the velocity of longitudinal
sound. In addition, ultrasonics is a technique that has wide application in industrially on-
line, non-destructive measurement.
29
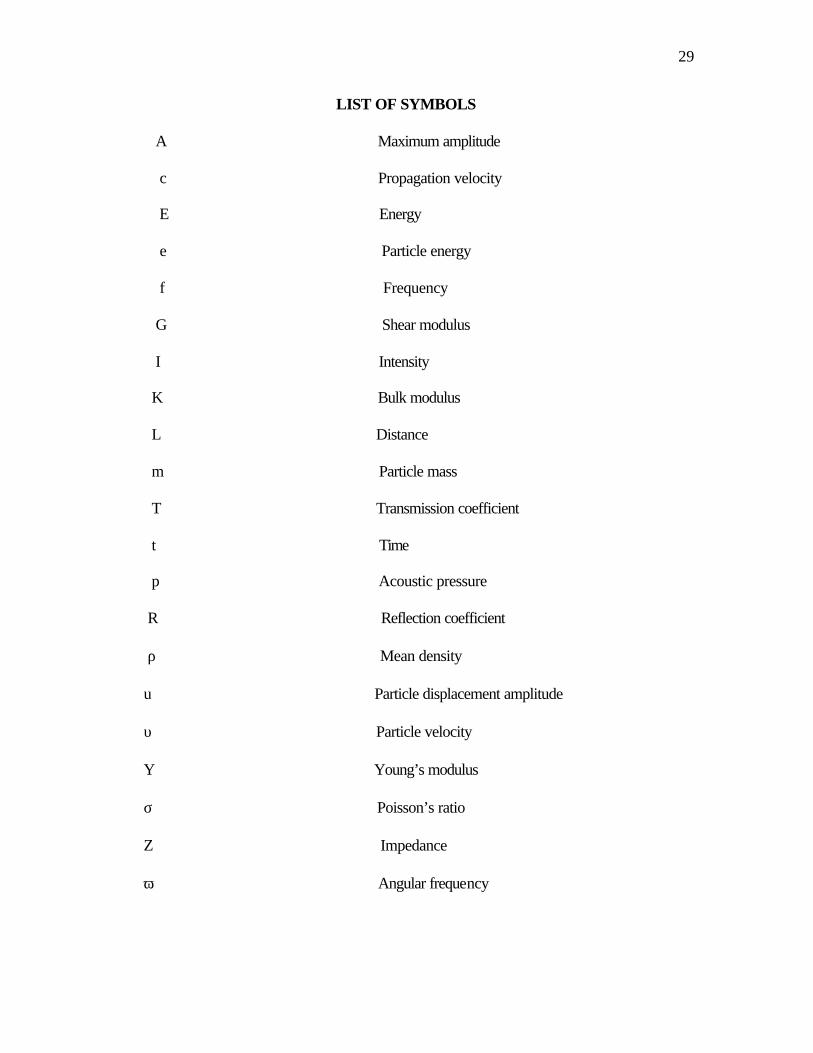
LIST OF SYMBOLS
A Maximum amplitude
c Propagation velocity
E Energy
e Particle energy
f Frequency
G Shear modulus
I Intensity
K Bulk modulus
L Distance
m Particle mass
T Transmission coefficient
t Time
p Acoustic pressure
R Reflection coefficient
ρ Mean density
u Particle displacement amplitude
υ Particle velocity
Y Young’s modulus
σ Poisson’s ratio
Z Impedance
ω Angular frequency

30
REFERENCES Agricultural Research Council. 1982. Sensors in Agriculture. Report of ARC Working
Party on Transducers, HMSO, London.
Apfel, R.A. 1981. Acoustic cavitation. In Methods of Experimental Physics, Vol.19,
Ultrasonics (Edmonds, P.D., Ed.) Academic Press, New York.
Bachaman, S., Klimaczak, B., and Gasyna, Z. 1978. Non-destructive viscometric studies
of enzymic milk coagulation. Acta Aliment. Polon. 4(28): 55-62.
Barrett, A.H., Cardello, A.V., Lesher, L.L., and Taub, I.A. 1994. Cellularity, mechanical
failure, and textural perception of corn meal extrudates. J. Texture Stud. 25: 77-
95.
Benedito, J., Carcel, J., Gisbert, M., and Mulet, A. 2001. Quality control of cheese
maturation and defects using ultrasonics. J. Food Sci. 66(1): 100-104.
Blitz, J. 1963. Fundamentals of Ultrasonics. Butterworths, London, England.
Bouvier, J.M., Bonneville, R. and Goullieux, A. 1997. Instrumental methods for the
measurement of extrudate crispness. Agro-Food-Industry Hi-Tech. 8(1): 16-19.
Bray, D.E. and Stanley, R.K. 1997. Nondestructive Evaluation: a Tool in Design,
Manufacturing, and Service. CRC Press, Inc., Boca Raton, FL.
Carstensen, E.L. 1982. Biological effects of low-temporal, average-intensity, pulsed
ultrasound. In The Interaction of Acoustical and Electromagnetic Fields with
Biological Systems (Takashima and Postow, Ed.) Alan R. Liss, New York.
Cheng, Y. and Haugh, C.G. 1994. Detecting hollow heart in potatoes using ultrasound.
Trans. ASAE 37(1): 217-222.
31
Christensen, C.M. and Vickers, Z.M. 1981. Relationships of chewing sounds to
judgments of food crispness. J. Food Sci. 45: 574-578.
Coppock, J.B.M. and Carnford, S.J. 1960. Texture in foods, SCI Monograph, No.7, p.64.
Dacremont, C. 1995. Spectral composition of eating sounds generated by crispy, crunchy
and crackly foods. J. Texture Stud. 26(1): 27-43.
Donahoo, P. 1970. Choosing the right batter and breading. Proceedings of the Seventh
Annual Poultry and Egg Further Processing Conference. 18.
Drake, B.K. 1963. Food crushing sounds – an introductory study. J. Food Sci. 28: 233-
241.
Drake, B.K. 1965. Food crushing sounds: comparisons of objective and subjective data.
J. Food Sci. 30: 556-559.
Edmister, J.A. and Vickers, Z.M. 1985. Instrumental acoustical measures of crispness in
foods. J. Texture Stud. 16: 153-167.
Elston, E. 1975. Why fish fingers top the market. Fishing News International. 14:30.
Ensminger, D. 1973. Ultrasonics: the Low and High-Intensity Applications. Marcel
Dekker, Inc., New York.
Food and Drink Federation. 1985. Sensing and Process Control in Tomorrow’s Food and
Drink Industry. Report of a Working Party of the Food and Drink Federation and
the Food Manufacturers Federation.
Gao, X. and Tan, J. 1996a. Analysis of expanded-food texture by image processing. Part
I: geometrical properties. J. Food Process Eng. 19: 425-444.
Gao, X. and Tan, J. 1996b. Analysis of expanded-food texture by image processing. Part
II: mechanical properties. J. Food Process Eng. 19: 445-456.
32
Gunasekaran, S. and Ay, C. 1996. Milk coagulation cut-time determination using
ultrasonics. J. Food Process Eng. 19: 63-73.
Hanson, H.L. and Fletcher, L.R. 1963. Adhesion of coatings on frozen fried chicken.
Food Technol. 17: 793.
Kinsler, L.E., Frey, A.R., Coppens, A.B., and Sanders, J.V. 1982. Fundamentals of
Acoustics, 3rd edn. John Wiley, New York.
Kohyama, K., Nishi, M. and Suzuki, T. 1997. Measuring texture of crackers with a
multiple-point sheet sensor. J. Food Sci. 62(5): 922-925.
Kohyama, K. and Nishi, M. 1997. Direct measurement of biting pressures for crackers
using a multiple-point sheet sensor. J. Texture Stud. 28: 605-617.
Kulp, K. and Loewe, R. 1992. Batters and Breadings in Food Processing, American
Association of Cereal Chemists, St. Paul, MN.
Kuster, G.T. and Toksoz, M.N. 1974. Velocity and attenuation of seismic waves in two
phase media. I. Theoretical formulations. II. Experimental results. Geophysics,
39(I): 587-606; 39(II): 607-17.
Lambert, W. 1982. Ultrasonic cleaning – its role in the process industries. Chem. Eng.:
320-323.
Lee III, W.E., Deibel, A.E., Glembin, C.T., and Munday, E.G. 1988. Analysis of food
crushing sounds during mastication frequency – time studies. J. Texture Stud. 19:
27-38.

33
Lee III, W.E., Schweitzer, M.A., Morgan, G.M., and Shepherd, D.C. 1990. Analysis of
food crushing sounds during mastication: total sound level studies. J. Texture
Stud. 19: 27-38.
Lister, D. 1984. In vivo Measurement of Body Composition in Meat Animals. Elsevier
Applied Science Publishers, London.
Loewe, R. 1992. Ingredient selection for batter systems. In Batters and Breadings in
Food Processing, (Kulp, K. and Loewe, R., eds.), American Association of Cereal
Chemists, St. Paul, MN.
Mason, T. 1987. The developing science of sono-chemistry. Lab. Equip. Digest.: 99-105.
Matz, S.A. 1962. Food Texture. AVI Publishing Co. Inc., Westport, CT.
McClements, D.J. and Povey, M.J.W. 1987. Ultrasonic velocity as a probe of emulsions
and suspensions. Adv. Colloid Interface Sci. 27(3-4): 285-316.
Miles, C.A., Fursey, G.A.J., and York, R.W.R. 1985. Ultrasonic estimation of the
solid/liquid ratio in fats, oils and adipose tissue. J. Sci. Food Agric. 36: 215-28.
Mohammed, A.A.A., Jowitt, R. and Brennan, J.G. 1982. Instrumental and sensory
evaluations of crispness: 1 – in friable foods. J. Food Eng. 1: 55-75.
Morris, V.J. 1985. Food gels – roles played by polysaccharides. Chem. Ind., March: 159 -
64.
Moskowitz, H.R. and Kapsalis, J.G. 1974. Psychophysical relations in texture. Presented
at the Symposium on Advances in Food Texture, Guelph, Ontario.
Peleg, M. 1997. Effect of absorbed moisture on the mechanical properties of cereal foods,
instant coffee, legumes and nuts. In the Proceedings of 5th Conference of Food

34
Engineering a topical conference at the Annual Meeting of the American Institute
of Chemical Engineers (AICHE). Paper no. 68d.
Povey, M.J.W. 1984. A study of dilation and acoustical propagation in solidifying fats
and oils. I. Theoretical. J. Am. Oil Chem. 61: 558-60.
Povey, M.J.W. and Wilkinson, J.M. 1980. Application of ultrasonic pulse echo
techniques to egg albumen quality testing: preliminary report. Br. Poultry Sci., 21:
489-95.
Povey, M.J.W. and Harden, C.A. 1981. An application of the ultrasonic pulse echo
technique to the measurement of crispness of biscuits. J. Food Technol. 16: 167-
175.
Povey, M.J.W. and McClements, D.J. 1989. Ultrasonics in food engineering. Part I:
Introduction and Experimental methods. J. Food Eng. 8(1988): 217-245.
Povey, M.J.W. 1989. Ultrasonics in food engineering. Part II: Applications. J. Food Eng.
9(1989): 1-20.
Pryor, A.W., Reed, R.D.C., and Richardson, E.G. 1958. The propagation of ultrasonic
waves in sols and gels. In Recent Advances in Gelatin and Glue Research
(Stainsby, S., Ed.) Pergamon Press, London.
Sajas, J.F., Zayas, Y.F., Gorbatov, W.M., and Gorbatov, V.M. 1978a. Use of ultrasonics
in meat technology, I. Fleischwirtschaft, 58(6): 957, 1009-12, 1015-21.
Sajas, J.F., Zayas, Y.F., Gorbatov, W.M., and Gorbatov, V.M. 1978b. Use of ultrasonics
in meat technology, II. Fleischwirtschaft, 58(7): 1143-6, 1149-52.

35
Self, G.K., Povey, M.J.W., and Wainwright, H. 1992. What do ultrasound measurements
in fruit and vegetables tell you? IOP Publishing Ltd.
Seymour, S.K. 1985. Studies on the relationships between the mechanical, acoustical and
sensory properties in low moisture food products. Ph. D. Thesis, North Carolina
State University, Raleigh, NC.
Seymour, S.K. and Hamann, D.D. 1988. Crispness and crunchiness of selected low
moisture foods. J. Texture Stud. 19: 79-95.
Stanley, D.W. and Tung, M.A. 1976. Microstructure of food and its relationship to
texture. In Rheology and Texture in Food Quality (de Man, J.M., Voisey, P.W.,
Rasper, V.F. and Stanley, D.W., eds.), AVI Publishing Co., Inc., Westport, CT.
Suderman, D.R. 1983. Use of batters and breadings on food products: a review. In Batter
and Breadings (Suderman, D.R. and Cunningham, F.E., eds.) AVI Publishing
Co., Inc., Westport, CT.
Szczesniak, A.S. 1988. The meaning of textural characteristics – crispness. J. Texture
Stud. 19: 51-59.
Szczesniak, A.S. and Kahn, E.L. 1971. Consumer awareness and attitudes to food texture.
J. Texture Stud. 1: 280-295.
Szczesniak, A.S. and Kahn, E.L. 1984. Texture contrasts and combinations. A valued
consumer attribute! J. Texture Stud. 15: 285-301.
Tahnpoonsuk, P. and Hung, Y.C. 1998. Effect of moisture on the crispness of a
heterogeneous multiplayer food. IFT Annual Meeting Technical Program
Abstracts.
36
Taubert, H. and Stuempel, G. 1997. Possibilities and limits of the ultrasound technique
for detection of absences and foreign bodies. Mitteilungsblatt der Bundesanstalt
fuer Fleischforschung, Kulmbach 36(136): 169-174.
Tesch, R., Normand, M.D., and Peleg, M. 1996. Comparison of the acoustic and
mechanical signatures of two cellular crunchy cereal foods at various water
activity levels. J. Sci. Food Agric. 67: 453-459.
Ultran Laboratories, Inc., 1999. website: www.ultranlabs.com. Last day it was referred,
December 20, 2001.
Vickers, Z.M. 1979. Crispness and crunchiness of foods. In Food Texture and Rheology.
(Sherman, P., Ed.) Academic Press, London.
Vickers, Z.M. 1981. Relationships of chewing sounds to judgments of crispness,
crunchiness and hardness. J. Food Sci. 47: 121-124.
Vickers, Z.M. 1984. Crispness and crunchiness – a difference in pitch? J. Text. Stud. 15:
157-163.
Vickers, Z.M. 1987. Crispness and crunchiness. In Food Texture: Instrumental and
Sensory Measurement (Moskowitz, H.R., eds.) Marcel Dekker, Inc., New York.
Vickers, Z.M. 1988. Instrumental measures of crispness and their correlation with
sensory assessment. J. Texture Stud. 19: 1-14.
Vickers, Z.M. and Bourne, M.C. 1976a. A psychoacoustical theory of crispness. J. Food
Sci. 41: 1158-1164.
Vickers, Z.M. and Bourne, M.C. 1976b. Crispness in foods – a review. J. Food Sci. 41:
1153-1157.

37
Vickers, Z.M. and Wasserman, S.S. 1980. Sensory qualities of food sounds based on
individual perceptions. J. Texture Stud. 11: 319-332.
Voisey, P.W. and Stanley, D.W. 1979. Interpretation of instrumental results in measuring
bacon crispness and brittleness. J. Can. Inst. Food Sci. Technol. 12(1): 7-15.
Wells, P.N.T. 1969. Physical Principles of Ultrasonic Diagnosis. Academic Press Inc.,
New York, NY.
Wood, A.B. 1932. A Textbook of Sound. G. Bell and Sons Ltd., London, England.
Wyn-Jones, E., Pereira, M.C. and Morris, E.R. 1982. Ultrasonic relaxation studies in sols
and gels. Prog. Food Nutr. Sci. 6: 21-31.
Zacharias, E.M. and Parnell, R.A. 1972. Measuring the solids content of foods by sound
velocimetry. J. Food Technol. April: 160-166.
Zwiercan, G.A. 1974. Case of the weeping pies (and others). Food Eng. 46: 79, 81.
38
Table 2.1 The regression equation for crispness prediction in different foods Products
Regression equation
R2
Seymour (1985)
Potato chips (Pringles)
Potato chips (O’Gradys)
Potato chips (Rippled Pringles)
Crunch Twist
Saltine crackers
Vickers (1987)
Potato chips
Vickers (1988)
Breakfast cereals
Crispness = 13.6 – 0.19 Workx + 0.03 MP4
Crispness = 6.1 – 0.08 Force + 0.21 SPL3
Crispness = 8.1 – 0.004 Worky + 0.003 ILT
Crispness = 16.5 – 0.06 Force – 0.11 SPL1
Crispness = 9.5 – 0.12 Force + 0.017 MPL
Crispness = -15.6 + 5.35 NP + 133 MHP – 6.21 Peak
Crispness = 538 + 539 (log MHP) – 222 Peak
0.96
0.88
0.89
0.95
0.91
0.98
0.74
Force = Maximum force at failure (N) by Kramer shear cell
Workx = Work done to 1 cm deformation (mJ)
Worky = Work done to failure (mJ)
MP4 = Mean sound pressure (N/m2) in 2.6-3.3 kHz
SPL1 = Mean sound pressure level (dBA) in 0.5-1.2 kHz
SPL3 = Mean sound pressure level (dBA) in 1.9-2.6 kHz
ILT = Acoustic intensity (watts/m2) in 0.5-3.3 kHz
MPL = Acoustic intensity (watts/m2) in 0.5-1.9 kHz
MHP = Mean height peaks taken from oscilloscope display of bite sounds
NP = Number of sound occurrences during bite
Peak = Maximum force from a force-deformation curve
39
Table 2.2 Introduction to ultrasound measurements
Measurement Category
Measured Parameters
Applications
Time Domain
Times - of - Flight and Velocities of Longitudinal, Shear and Surface Waves
Density, Thickness, Defect Detection, Elastic and Mechanical Properties, Interface Analysis
Attenuation Domain
Fluctuations in Reflected and Transmitted Signals at a Given Frequency and Beam Size
Defect Characterization, Surface and Internal Microstructure, Interface analysis
Frequency Domain
Frequency-Dependence of Ultrasound Attenuation, or Ultrasonic Spectroscopy
Microstructure, Grain Size, Porosity, Surface Characterization, Phase Analysis
Image Domain
Time-of-Flight, Velocity and Attenuation as Functions of Discrete Point Analysis by Raster C-Scanning
Surface and Internal Imaging of Defects, Microstructure, Density, Mechanical Properties, True 2-D and 3-D Imaging
Source: Ultran Labs, Inc.

40
SECTION III
THE DEVELOPMENT OF AN ULTRASONIC TECHNIQUE TO EVALUATE
CRISPNESS IN BREADED FRIED CHICKEN NUGGETS*
* Submitted for publication in Journal of Food Process Engineering

41
ABSTRACT
This study explored the possibilities of using the ultrasonic non-destructive testing
technique to evaluate crispness in breaded fried chicken nuggets. Pairs of dry-coupling
ultrasonic transducers at frequencies of 250 kHz were used to perform the ultrasonic
transmission on the breaded fried chicken nuggets. The evaluation of ultrasonic
properties was based on analyzing the time domain of the transmitted ultrasound. This
study found that ultrasonic parameters such as maximum peak-to-peak amplitude of the
signal and ultrasonic velocity varied with the changes of samples properties. Maximum
peak-to-peak amplitude ranged from 1.2 to 2.8 V. Ultrasonic velocity varied from 422 to
580 m/sec. Ultrasonic velocity seems to describe the changes in product crispness. The
samples kept under ambient conditions had lower values for velocity than samples held
under a heat lamp, which could be due to the lack of crispness in samples stored under
ambient conditions.
42
INTRODUCTION
Crispness is one of the most important and desirable textural properties that
indicate freshness and high quality in breaded fried foods. It goes well with many other
textural characteristics and is often used to create pleasing textural contrasts (Szczesniak
and Kahn, 1971). Crispness in low moisture foods has been studied by many
investigators. Many definitions and meanings of crispness exist. However, this attribute
was not adequately defined. In addition, the crispness in breaded fried foods with high
moisture core has not been studied extensively (Tahnpoonsuk, 1999).
Many studies had shown that crispness is affected by the cellular structure of
foods (Barrett et al., 1994; Gao and Tan, 1996a, b; Mohammed et al., 1982; Stanley and
Tung, 1976; and Vickers and Bourne, 1976b). Crispness had been measured by the
investigation of the microstructural properties such as cell wall thickness and cell size
distribution.
Mechanical properties are associated with the structural properties derived from
the stress-strain or force-deformation relationships of tested food material. The
mechanical tests were performed for measuring crispness in different foods, such as
bacon (Voisey and Stanley, 1979), potato chips (Katz and Labuza, 1981), biscuits
(Mohamed et al., 1982), breakfast cereals (Sauvageot and Blond, 1991), and breaded
shrimps (Tahnpoonsuk, 1999).
Many investigators have performed acoustical analysis to evaluate crispness. The
acoustical properties of biting and chewing sounds were studied to determine crispness in
dry foods (Vickers and Bourne, 1976; Christensen and Vickers, 1981; Mohamed et al.,
1982; Lee et al., 1988; Dacremont, 1995). Although acoustical tests produced high

43
enough correlations with sensory crispness and eating process may vary the quality of
sound. It has been suggested that combination of the acoustical and mechanical
measurements might predict better the crispness of foods (Mohamed et al., 1982;
Seymour, 1985; Vickers, 1987 and 1988). Chakra et al. (1995) explained that mechanical
measurement can ascertain the link existing between the acoustic emission and the elastic
behavior by thermodynamic principles, and also found that the changes in mechanical
parameters were compatible with the changes in acoustic parameters. Glass transition is
believed to be associated with the loss of crispness as affected by the moisture content of
the products (Tesch et al., 1996).
Ultrasonic technique was used to assess crispness in biscuits (Povey and Harden,
1981). Good correlation between sensory crispness and velocity of longitudinal sound
was found. Ultrasonic technique offers a promise as a method for objective measurement
of the crispness.
However, all these tests were applied just for low moisture foods. Studies on
crispness in high moisture foods are very limited. Tahnpoonsuk (1999) studied crispness
in breaded shrimps stored under a heat lamp. Sensory crispness had been predicted using
both acoustical and force-deformation measurements. Crispness was positively related to
amplitude of the sound emitted during eating process and a shear/compression force and
inversely related to a sound energy. Although the model was significant it did not
produce satisfactory correlations with sensory crispness. In addition, the method
proposed was destructive.
There is no reliable method that can accurately measure and quantify crispness in
breaded fried foods with a dry outer crust layer and a moist core. The objectives of this

44
study was to investigate the possibilities of using an ultrasonic non-destructive testing
method to evaluate crispness in breaded fried chicken nuggets, and also to study the
effect of holding samples under a heat lamp on the properties of breaded chicken nugget.
MATERIALS AND METHODS
The battered and breaded fried chicken nuggets obtained from local fast food
restaurants were sorted for similar size and weight (15 ± 2g), then reheated in a
microwave oven (model 1000W/R-21HT, Sharp Electronics Corporation, NJ) for 3 min
at full power. Samples were then placed uncovered under a heat lamp (model SW-2430,
Merco Inc., Lakewood, NJ) at 60 0C to maintain crispness. Samples were also held under
ambient conditions (45 –55% RH). Samples were removed at 5-min intervals and tested
for objective crispness. Breaded fried chicken nuggets that developed off color (dark
brown) during holding time were not used in the experiments.
The Ultrasonic Non-Destructive Testing System
The ultrasonic non-destructive evaluation system developed at Virginia Tech
(Cheng and Haugh, 1994) was used to conduct ultrasonic measurements. The basic setup
of the ultrasonic non-destructive evaluation system included an Ultran BP 9400A high-
power burst pulser, an Ultran BR 640A broadband receiver, a Tektronix 2232 digital
storage oscilloscope, pairs of dry-coupling ultrasonic transducers at frequencies of
50 kHz, 250 kHz, 500 kHz and 1 MHz, and a microcomputer system for data acquisition
and analysis (see Fig.3.1). For the ultrasonic transducers at frequencies of 250 kHz, 500
kHz, and 1 MHz, the driving voltage from the burst pulser to the transducers was 400
Volts with nominal impedance of 4 ohms. For the ultrasonic transducer at nominal
frequency of 50 kHz, a high-power step-up transformer was used to yield approximately

45
650 Volts into 50 ohms. The pulse width, pulse separation, and repetition period can be
adjusted to match with transducers of different frequencies. The broadband receiver,
performed as a signal amplifier and signal filter, had a maximum gain of 64 dB. The
transmitted signal was measured and shown on the oscilloscope screen. A general
purpose interface board (GPIB) installed in a microcomputer allowed the transfer of
digital data of the signal from the oscilloscope to the microcomputer for further analysis.
Because breaded fried chicken nugget is highly attenuative material, the
equipment setup was in the through-transmission mode, where the two broadband
ultrasonic transducers were placed on the opposite sides of the surface of the chicken
nugget, one acting as a transmitter, and the other one as a receiver. For ultrasonic
transducers at frequencies of 250 kHz, 500 kHz, and 1 MHz, the transmitting transducer
was connected to the burst pulser directly. For the 50-kHz transducer, the transmitting
transducer was connected to the burst pulser through the step-up transformer. The
receiving transducer was wired to the receiver directly. A breaded fried chicken nugget
was placed directly between the two transducers along the center line of the sample and
transducers to assure the optimal propagation of the sound wave. A transducer holding
device was used to apply a uniform pressure and a precise alignment of the transducers
during each ultrasonic measurement, permitting the most efficient ultrasonic energy
transmission through the sample.
A single square pulse at defined duration and repetition period was generated
from the burst pulser, and then converted to ultrasonic wave by the transmitting
transducer. The ultrasonic signal traveled through the sample and reached the receiving
transducer. The ultrasonic signal was converted back to an electrical signal in the

46
receiving transducer, and then was sent to the broadband receiver to filter out undesired
frequencies in order to improve the recovery time and signal-to-noise ratio, and finally
was amplified. The received signal was first displayed on the oscilloscope screen as real
time radio-frequency traces, from which the properties of the ultrasonic wave could be
determined. For further analysis, the digital data were then transferred to the
microcomputer.
Determination of Ultrasonic Properties
From the transmitted ultrasonic signal, such ultrasonic properties as ultrasonic
velocity and maximum peak-to-peak amplitude were determined in this study.
Ultrasonic velocity of breaded fried chicken nugget
An ultrasonic velocity was determined by placing breaded fried chicken nugget
directly between the two transducers along the center line of the sample and transducers
to assure the optimal propagation of the sound wave. This velocity represents the average
speed of ultrasound through the sample from one side to the other. The holding device
was used to assure a uniform pressure and a uniform alignment of the transducers during
each ultrasonic measurement.
The time-of-flight (TOF), known as the traveling time of the ultrasonic signal
from one side of sample to the other, was determined from the plot of time domain
waveform as shown in Fig. 3.2. The predetermined sample thickness and the determined
time-of-flight through the sample and time-of-flight of the transducer are used to
calculate the propagation velocity of the ultrasonic wave through the sample.
The ultrasonic velocity for each breaded fried chicken nugget was defined
according to the following equation:

47
where
υsample = Ultrasonic velocity of breaded fried chicken nugget (m/s)
l = Path length of transmission (mm)
TOF = Time-of-flight with the sample (ms)
TOF0 = Calibrated time-of-flight without the sample (ms)
Maximum Peak-to-Peak Amplitude of Transmitted Signal
The maximum peak-to-peak amplitude of transmitted signal was determined as a
sum of two absolute maximum voltages from a positive peak and a negative peak from
the time domain of the transmitted signal.
Sample thickness and moisture content
The thickness of the sample was measured in millimeters using a caliper (model
CHC-60150-D, Aerospace Inc., China). The moisture content of the sample was
determined using the freeze-drying method (AOAC method 960.39, 1985).
RESULTS AND DISCUSSION
Selection of Ultrasonic Frequency
The selection of frequency of transducer was based on the fact that the attenuation
of the signal transmission at higher frequencies is greater than at lower frequencies.
Cheng and Haugh (1994) used a frequency of 250 kHz rather than 1 MHz to detect the
hollow heart in potato during their study. They did not successfully transmit ultrasound
through a whole tuber of potato using the 1-MHz transducers.
0TOFTOFl
sample −=υ

48
Preliminary experiments were conducted to verify that the ultrasonic transmission
is better at lower frequencies. Pairs of dry-coupling ultrasonic transducers at frequencies
of 50 kHz, 250 kHz, 500 kHz, and 1 MHz were used to perform the ultrasonic
transmission on the breaded fried chicken nuggets. No transmitted signal was observed
using 500-kHz and 1-MHz transducers. Only the signals for 50-kHz and 250-kHz
transducers were detectible. For the 50-kHz ultrasonic transducer, the transmitting
transducer has to be connected to the burst pulser through a high-power step-up
transformer. For the 250-kHz ultrasonic transducer, the transmitting transducer is
connected to the burst pulser directly. Therefore, the experiments were conducted only
using the 250-kHz dry-coupling broadband transducers to measure the ultrasonic
properties of breaded fried chicken nuggets in this study.
Ultrasonic property measurements
The breaded fried chicken nuggets reheated in microwave oven were held under a
heat lamp or ambient conditions and tested after every 5 min. The thickness of the
samples was 15.5 ± 3 mm. Moisture content of the samples ranged from 35 to 48 %.
Dehydration of the samples occurred when left under a heat lamp, and moisture content
decreased significantly with holding time.
This study found that ultrasonic parameters such as ultrasonic velocity and
maximum peak-to-peak amplitude of the signal varied with the changes of sample
properties. The value of ultrasonic velocity varied from 422 to 580 m/sec.
The value of maximum peak-to-peak amplitude of the signal was found in range
of 1.2 – 2.8 V. The samples held under a heat lamp had higher maximum peak-to-peak
amplitude than the samples stored under ambient conditions (Fig. 3.3). The differences in
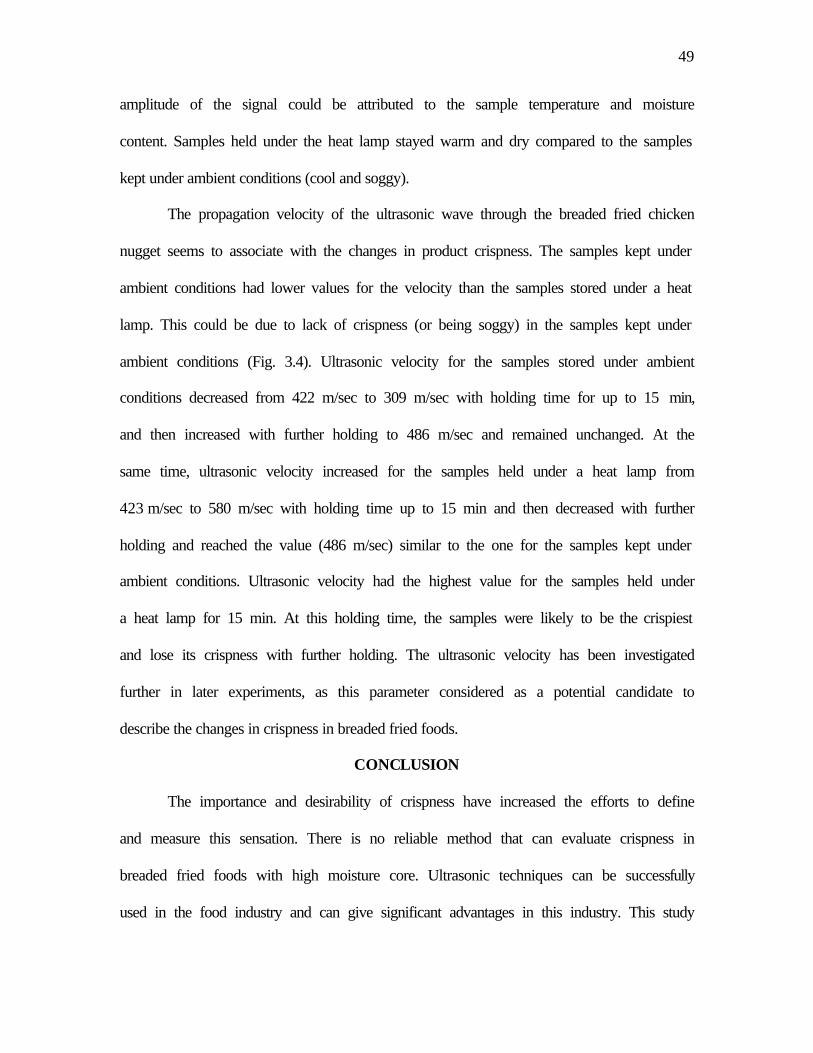
49
amplitude of the signal could be attributed to the sample temperature and moisture
content. Samples held under the heat lamp stayed warm and dry compared to the samples
kept under ambient conditions (cool and soggy).
The propagation velocity of the ultrasonic wave through the breaded fried chicken
nugget seems to associate with the changes in product crispness. The samples kept under
ambient conditions had lower values for the velocity than the samples stored under a heat
lamp. This could be due to lack of crispness (or being soggy) in the samples kept under
ambient conditions (Fig. 3.4). Ultrasonic velocity for the samples stored under ambient
conditions decreased from 422 m/sec to 309 m/sec with holding time for up to 15 min,
and then increased with further holding to 486 m/sec and remained unchanged. At the
same time, ultrasonic velocity increased for the samples held under a heat lamp from
423 m/sec to 580 m/sec with holding time up to 15 min and then decreased with further
holding and reached the value (486 m/sec) similar to the one for the samples kept under
ambient conditions. Ultrasonic velocity had the highest value for the samples held under
a heat lamp for 15 min. At this holding time, the samples were likely to be the crispiest
and lose its crispness with further holding. The ultrasonic velocity has been investigated
further in later experiments, as this parameter considered as a potential candidate to
describe the changes in crispness in breaded fried foods.
CONCLUSION
The importance and desirability of crispness have increased the efforts to define
and measure this sensation. There is no reliable method that can evaluate crispness in
breaded fried foods with high moisture core. Ultrasonic techniques can be successfully
used in the food industry and can give significant advantages in this industry. This study

50
explored the possibilities of applying an ultrasonic non-destructive method to evaluate
crispness in breaded fried chicken nuggets. The experiments were conducted using the
dry-coupling ultrasonic transducers at frequencies of 50 kHz, 250 kHz, 500 kHz, and
1 MHz in direct transmission mode. The ultrasonic transmission through the breaded
fried chicken nugget using the 250 kHz transducers was successful. The basic signal
analysis was performed in time domain of the transmitted ultrasound, and two ultrasonic
parameters, such as ultrasonic velocity and maximum peak-to-peak amplitude, were
determined. This study found that the ultrasonic properties changed with holding time.
The ultrasonic velocity seems to describe the changes in product crispness. The samples
kept under ambient conditions had lower values for velocity than the samples stored
under a heat lamp, which could be due to the lack of crispness in those samples. Next
study is to optimize measurement conditions that will correlate with sensory crispness
parameters using trained panelists.
REFERENCES
BARRETT, A.H., CARDELLO, A.V., LESHER, L.L. and TAUB, I.A. 1994.
Cellularity, mechanical failure, and textural perception of corn meal extrudates.
J. Texture Stud. 25: 77-95.
CHAKRA, W.A., ALLAF, K. and JEMAI, A.B. 1995. Characterization of brittle food
products: application of the acoustical emission method. J. Texture Stud. 27: 327-348.
CHENG, Y. and HAUGH, C.G. 1994. Detecting hollow heart in potatoes using
ultrasound. Trans. ASAE 37(1): 217-222.
CHRISTENSEN, C.M. and VICKERS, Z.M. 1981. Relationships of chewing sounds to
judgments of food crispness. J. Food Sci., 45: 574-578.

51
DACREMONT, C. 1995. Spectral composition of eating sounds generated by crispy,
crunchy and crackly foods. J. Texture Stud. 26(1): 27-43.
GAO, X. and TAN, J. 1996. Analysis of expanded-food texture by image processing. Part
I: geometrical properties. Part II: mechanical properties. J. Food Process Eng., 19: 425-
444; 445-456.
KATZ, E.E. and LABUZA, T.T. 1981. Effect of water activity on the sensory crispness
and mechanical deformation of snack food products. J. Food Sci., 46: 403-409.
LEE III, W.E., DEIBEL, A.E., GLEMBIN, C.T. and MUNDAY, E.G. 1988. Analysis of
food crushing sounds during mastication frequency – time studies. J. Texture Stud. 19:
27-38.
MOHAMED, A.A.A., JOWITT, R. and BRENNAN, J.G. 1982. Instrumental and sensory
evaluations of crispness: 1 – in friable foods. J. Food Eng. 1: 55-75.
SAUVAGEOT, F. and BLOND, G. 1991. Effect of water activity on crispness of
breakfast cereals. J. Texture Stud., 22: 423-442.
SEYMOUR, S.K. 1985. Studies on the relationships between the mechanical, acoustical
and sensory properties in low moisture food products. Ph. D. Dissertation, North Carolina
State University, Raleigh, NC.
STANLEY, D.W. and TUNG, M.A. 1976. Microstructure of food and its relationship to
texture. In Rheology and Texture in Food Quality (de Man, J.M., Voisey, P.W., Rasper,
V.F. and Stanley, D.W., eds.), AVI Publishing Co, Inc., Westport, CT.
SZCZESNIAK, A.S. and KAHN, E.L. 1971. Consumer awareness and attitudes to food
texture. J. Texture Stud.1: 280-295.

52
TAHNPOONSUK, P. 1999. Determination of crispness in breaded shrimp. M. S. Thesis,
The University of Georgia, Athens, GA.
TESCH, R., NORMAND, M.D. and PELEG, M. 1996. Comparison of the acoustic and
mechanical signatures of two cellular crunchy cereal foods at various water activity
levels. J. Sci. Food Agric., 67: 453-459.
VICKERS, Z.M. and BOURNE, M.C. 1976b. Crispness in foods – a review. J. Food Sci.,
41: 1153-1157.
VICKERS, Z.M. 1987. Crispness and crunchiness. In Food Texture: Instrumental and
Sensory Measurement (Moskowitz, H.R., eds.) Marcel Dekker, Inc., New York.
VICKERS, Z.M. 1988. Instrumental measures of crispness and their correlation with
sensory assessment. J. Texture Stud., 19: 11-14.
VOISEY, P.W. and STANLEY, D.W. 1979. Interpretation of instrumental results in
measuring bacon crispness and brittleness. J. Can. Inst. Food Sci. Technol., 12(1): 7-15.

53
Fig.3.1 Instrumentation setup for 250-kHz, 500-kHz and 1-MHz ultrasonic transducers
in through-transmission mode
Pulser Receiver
OscilloscopeSample
Transducer
Transducer
Trigger Transmit Sig.Out Gain Sig. In
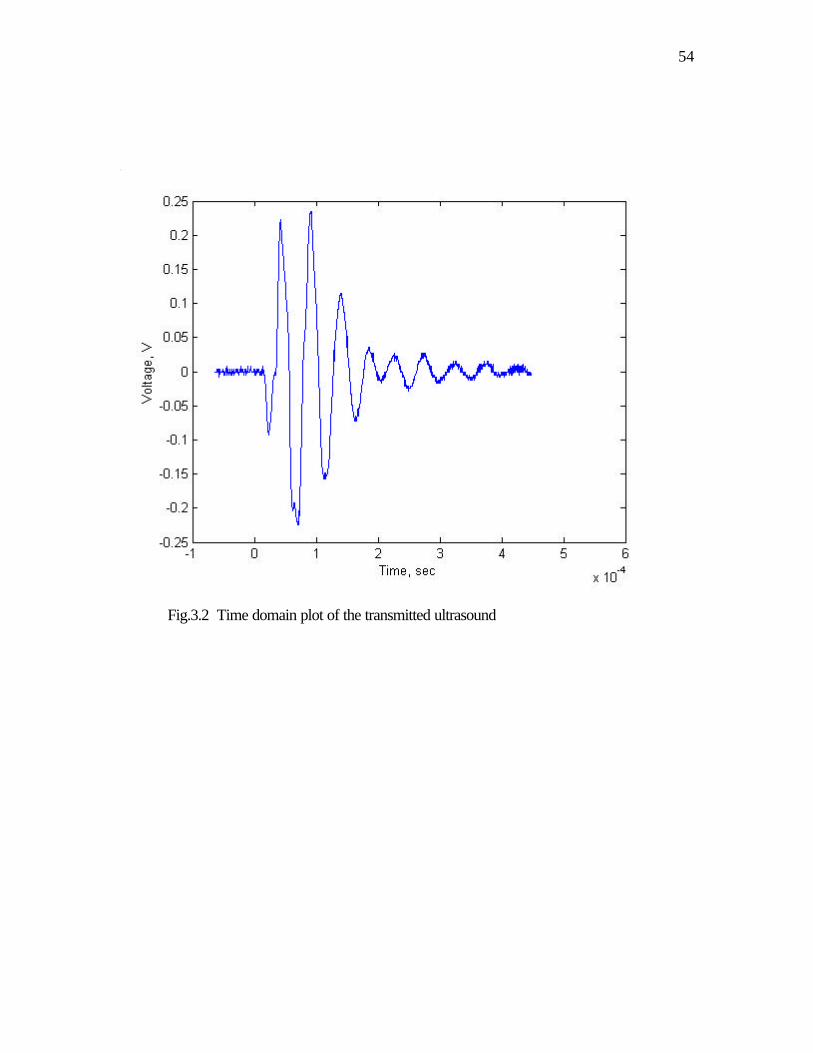
54
Fig.3.2 Time domain plot of the transmitted ultrasound

55
0
0.5
1
1.5
2
2.5
3
0 5 10 15 20 25 30 35
Time, min
Am
plit
ud
e, V
Fig.3.3 Effect of placement of breaded fried chicken nuggets either under a heat lamp or
ambient conditions on maximum peak-to-peak amplitude of ultrasonic signal
(n- Samples stored under ambient conditions, l - Samples stored under heat lamp)
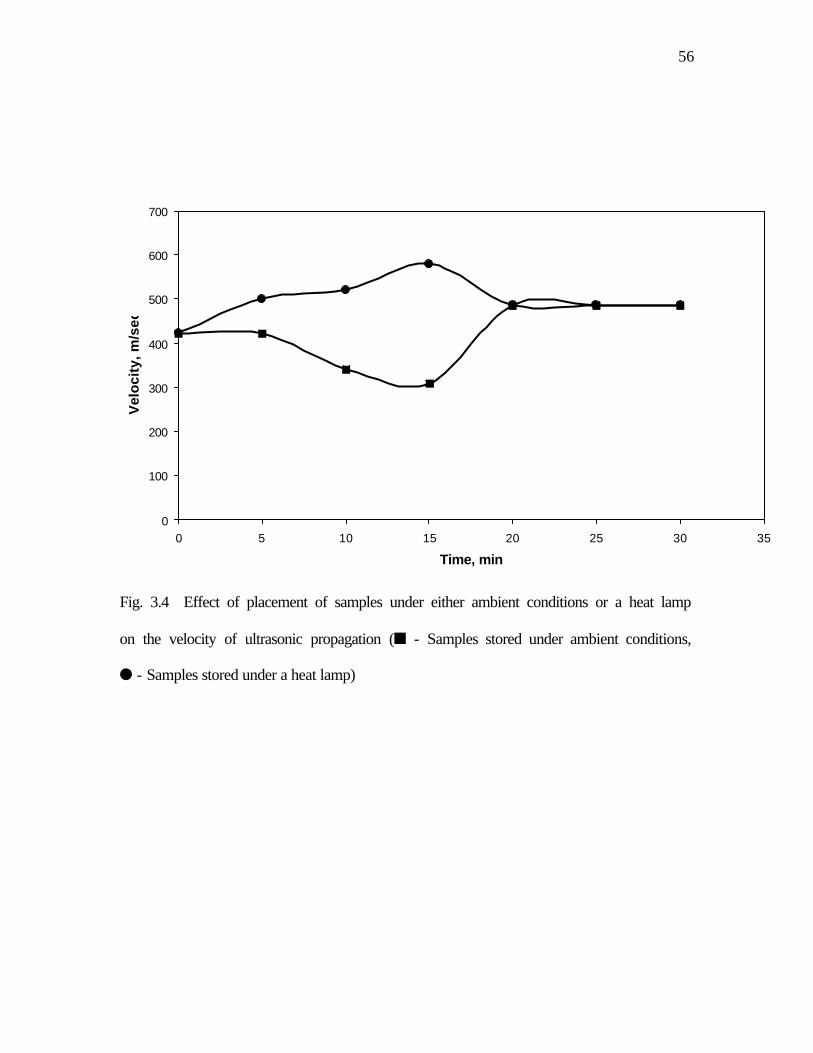
56
Fig. 3.4 Effect of placement of samples under either ambient conditions or a heat lamp
on the velocity of ultrasonic propagation (n - Samples stored under ambient conditions,
l - Samples stored under a heat lamp)
0
100
200
300
400
500
600
700
0 5 10 15 20 25 30 35
Time, min
Vel
oci
ty, m
/sec

57
SECTION IV
SENSORY ASSESMENT OF CRISPNESS IN A BREADED FRIED FOOD HELD
UNDER A HEAT LAMP*
* Submitted to Journal of Food Quality

58
ABSTRACT
Crispness is an important textural characteristic that indicates freshness and high
quality in breaded fried foods. There is no reliable method that can accurately measure
crispness in breaded fried foods with high moisture core. Development of such an
objective technique that can be correlated to sensory crispness will provide new
opportunities to develop products with desirable attributes. This study was undertaken
with following objectives: (1) to train a panel for evaluating crispness in breaded fried
foods, (2) to assess whether panelists can perceive the intensity differences of crispness
among the products, and (3) to obtain sensory crispness values for breaded fried foods
held under different storage conditions.
A panel of eight members was selected and trained to describe the texture of
breaded fried foods, focusing on crispness. A training period involved eleven sessions
over a period of six weeks. Panelists rated crispness on a nine-point category scale (1 =
not crisp/soggy, 9 = very crisp). Such breaded fried foods as chicken strips, chicken
nuggets, onion rings, and French Fries were presented to a panel for crispness evaluation
during training.
Panelists perceived a significant difference in crispness among the samples tested
(p ≤ 0.05). The mean scores for crispness (6.0 – 8.7) were significantly higher for
samples held under a heat lamp to both samples stored under ambient conditions (3.4 –
5.2) and high humid conditions (2.8 – 3.4). The developed procedure for evaluating
sensory crispness of breaded fried foods can be used to correlate the objective crispness
measurements.

59
INTRODUCTION
The importance and desirability of crispness as a sensory quality in many food
products is well documented (Szczesniak and Kahn, 1971; Vickers, 1988; Szczesniak,
1988; Lee et al., 1990; Dacremont, 1995). Crispness is a highly valued and universally
liked textural characteristic that indicates freshness and high quality. Probing into
consumer attitudes to texture and its specific attributes, Szczesniak and Kahn (1971)
concluded that crispness appears to be the most versatile single texture parameter.
Szczesniak (1988) studied the sensory perception of crispness and developed
sensory definitions of this attribute. Two hundred consumers were asked to give
examples of crisp foods and to provide descriptions of crispness. Three types of crispness
were perceived that are (1) in raw fruits/vegetables such as lettuce, celery, carrots, (2)
porous, dry foods such as crackers, cold cereals, potato chips, and (3) in fried products
such as bacon, chicken, French fries. Crispness was associated with crunchiness,
crackling, freshness, brittleness, snapping and sound emission during eating.
The importance and desirability of crispness has increased efforts to define and
measure that sensation. Many investigators have tried to measure crispness in foods,
using different instrumental methods. However, the best measurements are still
inconclusive. Studies related to crispness in high moisture products have been very
limited. Tahnpoonsuk (1999) conducted sensory and instrumental measurements to
evaluate crispness in breaded shrimps baked in an oven and held under a heat lamp. The
panel consisting of 12 trained panelists rated the intensity of crispness on a 150 mm line
scale with anchors at the ends. Crispness was defined as the ease of fracture in the mouth
combined with loudness of the sound produced. Panelists perceived significant
60
differences in crispness among the tested samples. The change in sensory crispness was
significantly dependent on the holding time under a heat lamp and baking location in the
oven. Although the objective analysis was significant it did not produce satisfactory
correlations with sensory crispness.
There is no reliable objective method that can accurately measure and quantify
crispness in breaded fried foods with high moisture core. A successful instrumental
measurement that correlates well to sensory crispness will allow control of crispness for
process evaluation and to produce foods with desirable attributes.
This study has been conducted to develop a panel that produces valid and reliable
results as an analytical instrument, and it was undertaken with the following objectives:
(1) to develop and test a panelist training procedure for evaluating crispness of breaded
fried foods, and (2) to assess the performance of the panel.
MATERIALS AND METHODS
Product Description
Different products were used to familiarize panelists with definitions of crispness.
Eight samples of low-moisture foods were used as standard dry crisp samples with
different levels of crispness (Table 4.1) during panel training. The purpose was to
increase familiarity with the crispness attribute and practice describing it.
Four samples of breaded fried foods, including french fries, onion rings, chicken
nuggets and chicken strips obtained from local fast food restaurants, were used to assist
panelists in relating crispness intensity in a product with a dry outer crust layer and a
moist core.

61
Panelists were presented with products stored under different conditions for crispness
evaluation. The breaded fried chicken strips and chicken nuggets were stored uncovered
under a heat lamp (model SW-2430, Merco, Inc., Lakewood, NJ) at 600C to maintain
crispness. Samples also were held under ambient conditions (45-55% RH) and high
humid conditions (75% RH) to accelerate loss in crispness. Samples were removed at 10-
min intervals and tested for sensory crispness in order to validate a trained panel.
Panelist Training
Eight panelists, students, from the VPI&SU Biological Systems Engineering
Department and Food Science and Technology Department, were selected on the basis of
their willingness to participate in the project. Panelists participated in twelve 1-h training
sessions over a period of six weeks during which training in identifying and rating the
intensity of crispness was completed. Panelists were introduced to sensory definitions and
techniques for different texture attributes, including crispness, hardness, cohesiveness,
and fracturability (Table 4.1).
In order to become familiar with crispness, the panel of eight judges spent three
sessions evaluating eight samples of dry crisp foods as reference standards with different
intensities of crispness. Panelists were presented with standard crispness scale values of
dry crisp foods (Table 4.2). During first session, panelists were involved in a group
discussion of texture characteristics of presented samples, concentrating on crispness. For
the following two sessions, panelists rated crispness of dry crisp products on a nine-point
intensity scale (1=not crisp/soggy, 9=very crisp) by checking the appropriate space on the
scale. Crispness scale values obtained by panelists were compared to standard crispness
scale values. The worksheet (1) is included in Appendix.
62
Having established that panelists could rate crispness intensity in dry crisp
products, the training then continued with discussion of crispness in breaded fried foods
with a moist core. For the following four sessions, panelists were presented four samples
of breaded fried foods such as onion rings, chicken nuggets, chicken strips, and breaded
chicken breasts obtained from local fast food restaurants for crispness evaluation.
Panelists practiced describing texture characteristics of presented products, focusing on
crispness. For each session, panel was seated around a table to discuss product crispness,
and then independently, in sensory testing booths, evaluated products for crispness.
A nine-point category scale was used to indicate the intensity of crispness of tested
breaded fried foods. The worksheet (2) is included in Appendix.
For the final training sessions, panelists evaluated five samples of commercially
available fried products stored under different conditions for crispness intensity by using
the same nine-point scale. Chicken strips and chicken nuggets were held under a heat
lamp at 600C to maintain crispness. Chicken strips also were stored under ambient
conditions. Samples were removed at 10-min intervals for sensory evaluation. The
worksheet (3) is included in Appendix.
Each panelist performed independent evaluations, rating samples for crispness.
Evaluations were completed in individual booths under white fluorescent light. Samples
were served in plastic soufflé cups coded with 3-digit random numbers. Samples were
presented such that each panelist received all samples, one at a time, in a random order.
Panelists evaluated one sample, and then waited at least 30 seconds before the next
sample was presented. The instructions to panelists were given in the appropriate
scorecard (see Appendix).
63
To validate the performance of each panelist and the performance of the panel,
two sessions of evaluating chicken strips for crispness intensity were conducted. Samples
were stored under a heat lamp at 600C, ambient conditions (45 - 55% RH) and high
humid conditions (75% RH). Panelists received three coded samples at a time at 10-min
interval. Panelists were seated in individual testing booths with red lighting to mask
appearance differences. The worksheet (4) and the appropriate scorecard are included in
Appendix.
Evaluation of Breaded Chicken Nuggets Under Experimental Conditions
For actual experiments, a trained panel evaluated crispness intensity in breaded
par-fried chicken nuggets under different conditions. Samples were finish cooked using
following procedures: (1) finish-fried in a deep-fat fryer, (2) baked in a convection oven,
and (3) heated in a microwave oven. Fried samples were placed uncovered under a heat
lamp at 600 C for up to 40 min to maintain crispness. Samples also were held under
ambient conditions (45 – 55% RH) to accelerate loss of crispness.
Panelists evaluated three samples at a time at 10-min intervals, using a nine-point
category scale (1 = not crisp/soggy, 9 = very crisp). The instructions to panelists were
given in the scorecard (Appendix). Evaluations were completed in individual testing
booths with red lighting to mask appearance differences of the samples.
Statistical Analysis
A generalized randomized complete block design was used to analyze the data
from each training test and to determine if panelists could perceive significant differences
in crispness among the products. A randomized block design is effective when the
panelists are consistent in rating the samples but might use different parts of the scale to

64
express their perceptions. Data in form of ratings from a randomized block design were
analyzed by analysis of variance (ANOVA). Significant differences were determined at
the confidence level of 0.05. Tukey’s Test was used to determine which of the samples
differ significantly. Experimental sensory data were analyzed, using split-plot design.
Sensory data were analyzed by the Statistical Analysis Software (SAS, Cary, NC).
RESULTS AND DISCUSSION
Panel Training
A randomized complete block design used to analyze the panelists’ responses
allowed for the intensity differences of crispness among the products to be perceived. The
analysis of data obtained from panelists’ evaluations during training showed that the
panel could determine a significant difference in crispness among the tested samples of
breaded fried foods obtained from local fast food restaurants.
For first two training sessions, panelists were taught to describe crispness through
the use of reference standards, which are needed to train an attribute-rating panel
effectively. Panelists’ scores were similar to standard crispness scale values (Table 4.3).
These tests were conducted to indicate that panelists could use a nine-point category scale
for crispness evaluation and recognize the differences in crispness intensity among the
tested products.
However, the standard crispness scale for dry crisp products was not appropriate
to use for rating crispness in high moisture products. Crispness intensity in breaded fried
foods with a moist core would not be perceived at the same level of crispness intensity in
dry crisp products. Therefore, panelists were practicing to rate crispness in breaded fried
foods with various levels of crispness and moisture content. Panelists were asked to

65
determine the levels of crispness in high moisture products on a nine-point category scale
as a complete range of crispness. The mean scores for crispness obtained from panelists’
evaluations are summarized in Table 4.4. Chicken strips, breaded chicken, and chicken
nuggets were defined to be significantly crispier (5.8 – 7.5) than french fries and onion
rings (3.5 – 3.8). A panel did not perceive the intensity difference of crispness between
french fries and onion rings.
To assess a performance of trained panel, two sessions to evaluate crispness of
breaded fried chicken strips stored under a heat lamp, ambient conditions and high humid
conditions were conducted. For the first replication, a panel perceived a significant
difference in crispness among the tested samples. The panelists found that samples held
under a heat lamp were crispier (6.0 – 8.0) than samples stored under ambient conditions
(3.4 – 4.9) and high humid conditions (2.8 – 3.4) (Table 4.5). Most panelists could not
indicate a significant difference in crispness between samples kept under a heat lamp for
10 min and samples kept under a heat lamp for 20 min. For the second replication of the
same samples, panelists perceived a significant difference in crispness between samples
held under a heat lamp (7.8 – 8.7) and samples stored under ambient conditions (4.5 –
5.2) and samples stored under high humid conditions (3.0 – 3.2), but most panelists could
not identify an intensity difference of crispness between samples stored under ambient
conditions for 10 min and samples kept in high humid conditions for 10 min. The sample
means are arranged in Table 4.5.
Upon analysis of variance performed on the panelists’ scores, the F-ratio for
panelists was found to be not significant, indicating that a panel was adequately trained.
66
Sensory Crispness Evaluation of Breaded Fried Chicken Nuggets
Trained panelists perceived significant differences in crispness intensity among
the samples cooked by different methods and stored under different conditions
(Table 4.6). Breaded chicken nuggets cooked in a deep-fat fryer were significantly
crispier than chicken nuggets cooked in either a convection oven or a microwave oven.
Panelists indicated crispness changes with holding time under either a heat lamp or
ambient conditions (Figure 4.1). Fried samples held under a heat lamp were significantly
crispier than samples stored under ambient conditions.
CONCLUSION
The attribute-rating panel was trained to evaluate crispness in breaded
fried foods with a high degree of reproducibility and precision. Samples were
significantly different for the intensity of crispness (p ≤ 0.05). Panel determined the
increasing intensity of crispness among the samples stored under the heat lamp. No
significant crispness changes with holding time under either ambient conditions or high
humid conditions were perceived by judges.
A sensory panel, consisting of eight trained members, was used to evaluate
sensory crispness in breaded fried chicken. Panelists determined significant differences in
crispness intensity among the samples cooked by different methods and kept under
different storage conditions. Panelists perceived crispness changes with holding samples
under either a heat lamp or ambient conditions.
67
REFERENCES
DACREMONT, C. 1995. Spectral composition of eating sounds generated by crispy,
crunchy and crackly foods. J. Texture Stud. 26(1): 27-43.
LEE III, W.E., SCHWEITZER, M.A., MORGAN, G.M., & SHEPHERD, D.C. 1990.
Analysis of food crushing sounds during mastication: total sound level studies. J.
Texture Stud. 19: 27-38.
MEILGAARD, M., CIVILLE, G.V., & CARR, B.T. 1999. Sensory evaluation
techniques. CRC Press LLC.
SZCZESNIAK, A.S. 1988. The meaning of textural characteristics – crispness. J. Texture
Stud. 19: 51-59.
SZCZESNIAK, A.S. & KAHN, E.L. 1971. Consumer awareness and attitudes to food
texture. J. Texture Stud. 1: 280-295.
TAHNPOONSUK, P. 1999. Determination of crispness in breaded shrimp. M. S. Thesis,
The University of Georgia, Athens, GA.
VICKERS, Z.M. 1988. Instrumental measures of crispness and their correlation with
sensory assessment. J. Texture Stud., 19: 1-14.

68
TABLE 4.1
SENSORY DEFINITION AND TECHNIQUE FOR CRISPNESS
Term
Definition
Technique
Crispness
Hardness
Cohesiveness
Fracturability
The force and noise with which a
product breaks or fractures (rather
than deforms) when chewed with the
molar teeth (first and second chew).
The force to attain a given
deformation, such as the force to
compress between molars, the force
to compress between tongue and
palate, and the force to bite through
with incisors.
The degree to which sample deforms
rather than crumbles, cracks, or
breaks.
The force with which the sample
breaks.
Place sample between molar
teeth and bite down evenly
until the food breaks,
crumbles, cracks or shatters.
Place food between the
molars and bite down evenly,
evaluating the force required
to compress the food.
Place sample between molars
and compress fully (can be
done with incisors).
Place food between molars
and bite down evenly until
the food crumbles, cracks, or
shatters.
Source: Meilgaard et al. (1999)

69
TABLE 4.2
STANDARD INTENSITY CRISPNESS SCALE VALUES (0 TO 9)
FOR LOW-MOISTURE FOODS
Scale Value
Product
Brand/Type/Manufacturer
Sample Size
1.0
Granola Bar
Quaker Low Fat Chewy Chunk
1/3 bar
3.0
Club Cracker
Keeblers Partner Club Cracker
½ cracker
3.0
Graham Cracker
Honey Maid
1” sq.
4.0
Oat Cereal
Cheerios
1 oz.
5.0
Bran Flakes
Kellogg’s Bran Flakes Cereal
1 oz.
6.0
Cheese Crackers Goldfish
Cheddar Cheese Crackers
1 oz.
7.0
Corn Flakes
Kellogg’s Corn Flakes Cereal
1 oz.
9.0
Melba Toast
Devonsheer Melba Toast
½ cracker
Source: Meilgaard et al. (1999)

70
TABLE 4.3
COMPARISON OF PANELIST’S RATING* TO STANDARD RATING SCALE
FOR CRISPNESS DURING PANEL TRAINING
Product
Brand/Type/Manufacturer
Standard Value
R 1
R 2
Granola Bar
Quaker Low Fat Chewy Chunk
1.0
1.25
1.12
Club Cracker
Keeblers Partner Club Cracker
3.0
3.37
3.62
Graham Cracker
Honey Maid
3.0
2.12
2.7
Oat Cereal
Cheerios
4.0
4.25
4.6
Bran Flakes
Kellogg’s Bran Flakes Cereal
5.0
5.78
5.78
Cheese
Crackers Goldfish
Cheddar Cheese Crackers
6.0
5.25
5.25
Corn Flakes
Kellogg’s Corn Flakes Cereal
7.0
8.0
7.6
Melba Toast
Devonsheer Melba Toast
9.0
9.0
9.0
* Rating: 1 = soggy/not crisp; 9 = very crisp R = replication

71
TABLE 4.4
MEAN SCORES* FOR CRISPNESS INTENSITY FOR DIFFERENT BREADED
FRIED FOODS AS JUDGED BY AN 8-MEMBER SENSORY
PANEL DURING TRAINING
Samples of breaded fried foods
Average Intensity
ŷ ± s.d.
French fries
3.52 ± 0.46
Onion rings
3.8 ± 0.32
Chicken nuggets
5.78 ± 0.72
Chicken breasts
5.9 ± 0.92
Chicken strips
7.5 ± 0.32
* Score Rating: 1 = soggy/not crisp; 9 = very crisp
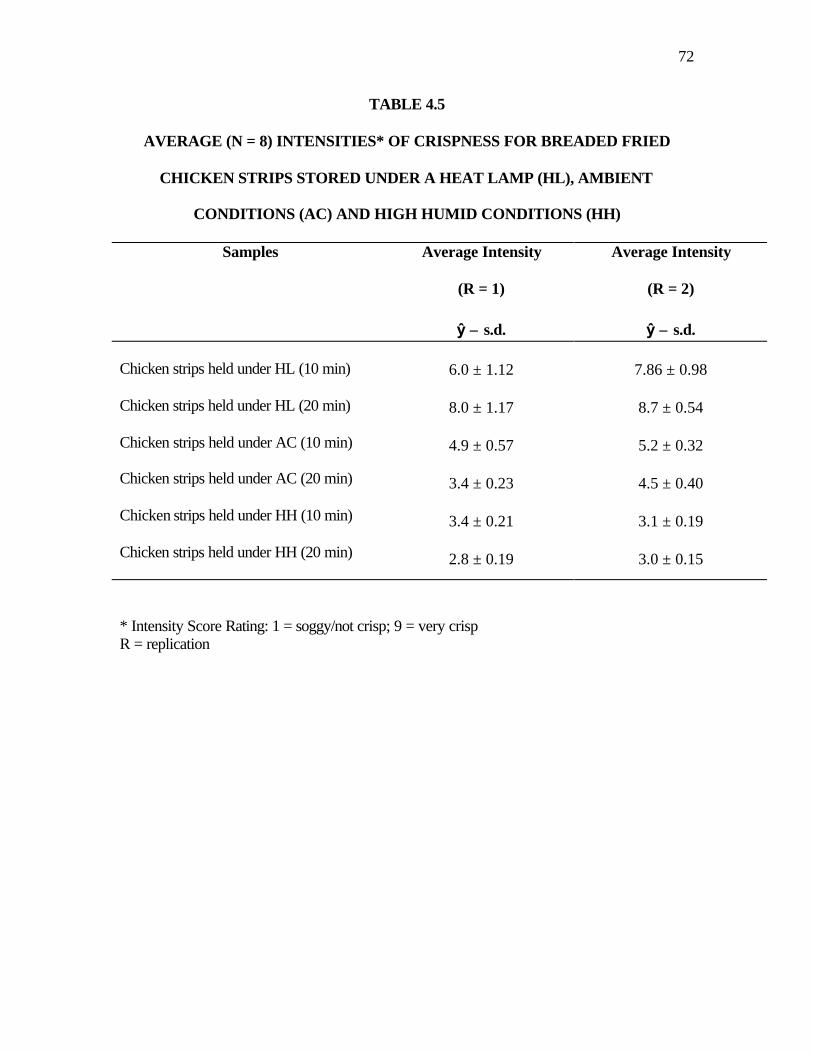
72
TABLE 4.5
AVERAGE (N = 8) INTENSITIES* OF CRISPNESS FOR BREADED FRIED
CHICKEN STRIPS STORED UNDER A HEAT LAMP (HL), AMBIENT
CONDITIONS (AC) AND HIGH HUMID CONDITIONS (HH)
Samples Average Intensity
(R = 1)
ŷ ± s.d.
Average Intensity
(R = 2)
ŷ ± s.d. Chicken strips held under HL (10 min) Chicken strips held under HL (20 min)
Chicken strips held under AC (10 min)
Chicken strips held under AC (20 min)
Chicken strips held under HH (10 min)
Chicken strips held under HH (20 min)
6.0 ± 1.12
8.0 ± 1.17
4.9 ± 0.57
3.4 ± 0.23
3.4 ± 0.21
2.8 ± 0.19
7.86 ± 0.98
8.7 ± 0.54
5.2 ± 0.32
4.5 ± 0.40
3.1 ± 0.19
3.0 ± 0.15
* Intensity Score Rating: 1 = soggy/not crisp; 9 = very crisp R = replication

73
TABLE 4.6
THE EFFECTS OF COOKING METHOD, STORAGE CONDITIONS AND
HOLDING TIME ON SENSORY CRISPNESS OF
BREADED FRIED CHICKEN NUGGETS
Main effects
DF
Mean Square
Storage condition Cooking method Storage condition*Time Storage condition*Time*Cooking method Error
1 2 3 6 88
2.74*
371.89*
2.79*
0.36
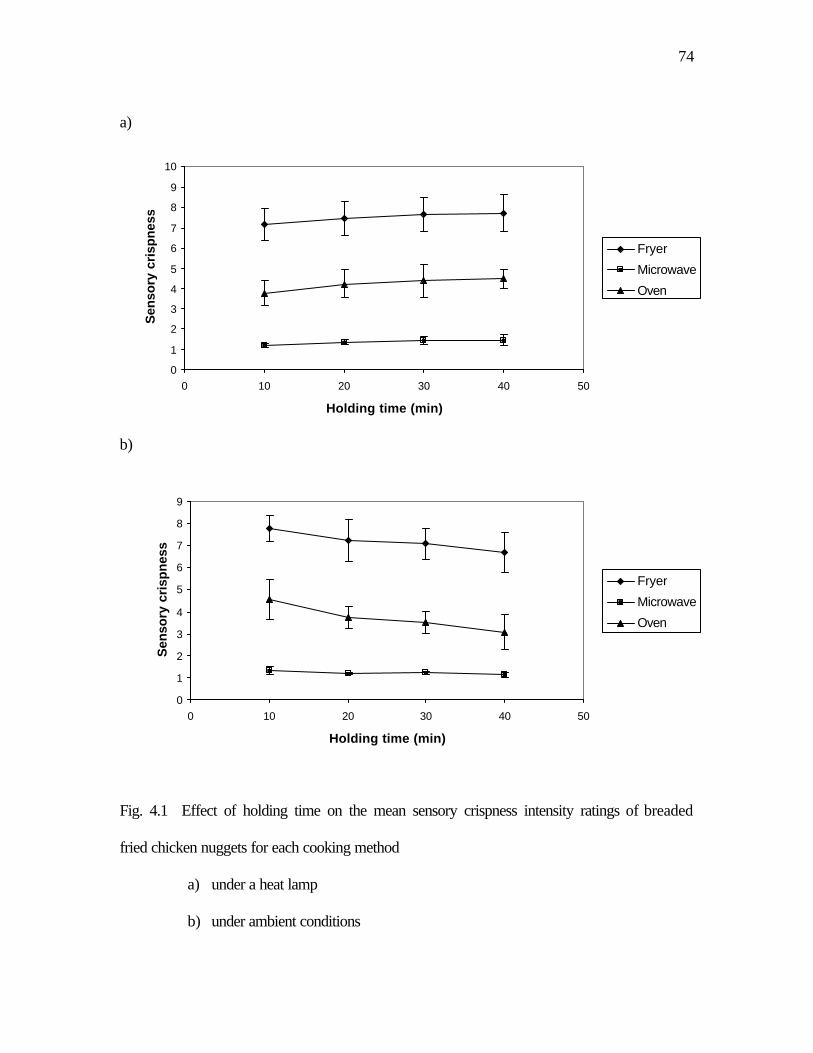
74
a)
b)
Fig. 4.1 Effect of holding time on the mean sensory crispness intensity ratings of breaded
fried chicken nuggets for each cooking method
a) under a heat lamp
b) under ambient conditions
0
1
2
3
4
5
6
7
8
9
10
0 10 20 30 40 50
Holding time (min)
Sen
sory
cri
spn
ess
Fryer
Microwave
Oven
0
1
2
3
4
5
6
7
8
9
0 10 20 30 40 50
Holding time (min)
Sen
sory
cri
spn
ess
Fryer
Microwave
Oven
75
SECTION V
CORRELATION BETWEEN INSTRUMENTAL AND SENSORY MEASUREMENTS
OF CRISPNESS IN BREADED FRIED CHICKEN NUGGETS
Submitted to Journal of Food Science
76
ABSTRACT
Crispness is one of the most distinctive textural characteristics of dry crisp and
fried products. A reliable objective method to evaluate crispness of breaded fried foods is
not currently available. This study was undertaken with following objectives: (1) to
determine ultrasonic parameters that can correlate well with sensory crispness, (2) to
measure mechanical properties for breaded fried chicken nuggets, and (3) to investigate
the relationships between the instrumental parameters and sensory crispness scores
obtained using trained panel.
Significant differences in ultrasonic velocity, transmission loss, peak force, and
total energy were observed among the samples cooked by different methods. Ultrasonic
velocity increased with increasing holding time, indicating that samples became crispier
during holding under a heat lamp. This can be attributed to the changes in moisture
content during holding. However, transmission loss, peak force, and total energy did not
significantly change with holding time. The peak frequencies were found in a range of
216 – 252 kHz, 846 – 882 kHz, and 1368 – 1386 kHz, respectively. Samples stored under
a heat lamp had higher signal amplitudes for each peak frequency than those stored under
ambient conditions. This could be due to lack of crispness (or being soggy) of the
samples kept under ambient conditions.
Ultrasonic velocity had high correlation with sensory crispness. This indicates
that sensory crispness could be predicted reasonably by the ultrasonic velocity.

77
INTRODUCTION
Breaded fried foods are favored by consumers due to the increased palatability
provided by a soft and moist interior along with a porous outer crispy crust. Studies
sponsored by Proctor and Gamble and the National Restaurant Association confirmed an
increase in breaded fried food consumption. They reported that more than 500,000
institutional and commercial restaurants in the U.S. were involved in deep-fat frying
operations (Brooks, 1991). Traditional fried products, such as French fries, chicken
nuggets and breaded chicken, are still prevailing in the food service business. Fried
chicken products exceeded $8.2 billion in sales in the U.S. in 1996.
Crispness is one of the most important and desirable textural characteristics that
signify freshness and high quality in breaded fried foods. Crispness appears to be the
most versatile single textural characteristic in many foods. Over the years, many
investigators have worked on various techniques to characterize and measure crispness. It
has been suggested that crispness might be better predicted by combination of mechanical
and acoustical properties (Mohamed and others, 1982; Seymour, 1985; Vickers, 1987 and
Vickers, 1988). Characterization of crispness has been more complicated since Tesch and
others (1996) found no relationships between the mechanical and acoustical parameters.
This complication may have been due to the effect of unequal frequency for the
mechanical and acoustical measurements or that some parts of crisp information
manifested in acoustical properties have not been fully revealed in the mechanical
properties, or vice versa.
However, all these measurements were applied to low moisture foods. Studies
related to crispness in high moisture foods have been very limited. In addition, the

78
measurements may be very different from that developed for low moisture foods. Recent
studies by Tahnpoonsuk (1999) to evaluate crispness in breaded shrimps stored under a
heat lamp did not give a satisfactory correlation. Crispness had been predicted using both
acoustical and force-deformation measurements. In addition, the method proposed was
destructive.
There is no reliable method that can accurately measure and quantify crispness in
breaded fried foods having a moist core. Development of such a method, which will
correlate to sensory crispness, will allow food product manufacturers to develop products
with desirable attributes. Ultrasonic techniques have not, so far, been used for the
measurement of crispness in breaded fried foods although successful applications of
ultrasonics exist in characterization of foods. This study was undertaken with following
objectives: (1) to determine ultrasonic parameters that can correlate well with sensory
crispness, (2) to measure mechanical properties for breaded fried chicken nuggets, and
(3) to investigate the relationships between the instrumental parameters and sensory
crispness scores obtained using trained panel.
MATERIALS AND METHODS Sample Preparation
Breaded par-fried chicken nuggets were obtained from Perdue Farms, Inc.,
Monterey, TN and kept frozen at –200 C until used. Samples were sorted for similar size
and weight, and most uniform samples were used for sensory and objective evaluation.
Frozen breaded chicken nuggets were finish cooked using following procedures: (1)
finish-fried in a deep-fat fryer at 3750 F for 4-5 min, (2) baked in a convection oven at
4000 F for 10 min, and (3) heated in a microwave oven at full power for 3 min. The finish
79
frying times were obtained by measuring the temperature in the product and frying the
sample until the geometric center of the product reached 700 C.
Fried samples were then placed uncovered under a heat lamp (model SW-2430,
Merco Inc., Lakewood, NJ) at 600 C for up to 40 min to maintain crispness. Samples also
were held under ambient conditions (45 – 55% RH) to accelerate loss of crispness (by
getting soggier). Samples were removed at 10-min intervals and tested for sensory and
objective crispness. Five replications were conducted in the study.
Quality Characteristics of Breaded Fried Chicken Nugget
Temperature
A data logger (model 5100, Electronic Controls Design Inc., Milwaukie, Oregon)
was used to monitor the temperature (at 5-min intervals) at the core of the samples during
holding under a heat lamp and ambient conditions for up to 40 min.
Thickness
The thickness of the crust and the thickness of the sample were measured in
millimeters using a caliper (model CHC-60150-D, Aerospace Inc., China) every 10 min
for up to 40 min.
Mass
Mass of breaded fried chicken nugget during holding under a heat lamp and
ambient conditions was measured using a digital balance every 10 min, for up to 40 min.
Moisture and Fat Contents
The moisture and fat contents of the crust and core of the sample were determined
using the freeze-drying method (AOAC method 960.39, 1985) and a solvent extraction
80
method (SOXTEC System HT2, 1045 Extraction Unit), respectively. Two replications
were conducted for the measurements.
Sensory Crispness Measurement
A sensory panel consisting of eight trained members was used to evaluate sensory
crispness in breaded fried chicken nuggets. The panelists had previously participated in
eleven 1-h training sessions over a period of six weeks during which training in
identifying and rating the intensity of crispness was completed. Crispness was defined as
the force and noise with which a product breaks or fractures (rather than deforms) when
chewed with the molar teeth (first and second chew) (Meilgaard and others, 1999).
Panelists were instructed to evaluate each tested sample for crispness by placing sample
between molar teeth and biting down evenly until the food breaks, crumbles, cracks or
shatters and rate the intensity of crispness on a nine-point category scale (1 = not
crisp/soggy, 9 = very crisp) by checking the appropriate space on the scale. Panelists
evaluated three samples at a time at 10-min intervals. The instructions to panelists were
given in the appropriate scorecard (see Appendix). Evaluations were completed in
individual testing booths with red lighting to mask appearance differences of the samples.
Samples were served in plastic soufflé cups coded with 3-digit random numbers. Samples
were presented such that each panelist received all samples, three at a time, in a random
order.
Ultrasonic Property Measurements
The ultrasonic non-destructive evaluation system developed at Virginia Tech
(Cheng and Haugh, 1994) was used to conduct ultrasonic measurements. The basic setup
of the ultrasonic non-destructive evaluation system included an Ultran BP 9400A high-
81
power burst pulser, an Ultran BR 640A broadband receiver, a Tektronix 2232 digital
storage oscilloscope, 250-kHz dry-coupling ultrasonic transducers, and a microcomputer
system for data acquisition and analysis (Figure 5.1). The driving voltage from the burst
pulser for the transducers was 400 Volts with nominal output impedance of 4 ohms (Ω).
The pulse width and separation time between pulses were adjusted for 250-kHz
transducers. The broadband receiver, performed as a signal amplifier and signal filter,
had a maximum gain of 64 dB. The transmitted signal was measured and shown on the
oscilloscope screen. A general purpose interface board (GPIB) installed in a
microcomputer allowed the transfer of digital data of the signal from the oscilloscope to
the microcomputer for further analysis.
The system setup was in the through-transmission mode because breaded fried
chicken nugget is highly attenuative material. Two transducers were placed on the
opposite sides of a chicken nugget surface, one acting as a transmitter, and the other one
as a receiver. For ultrasonic transducers at frequency of 250 kHz, the transmitting
transducer was connected to the burst pulser directly. The receiving transducer was wired
to the receiver directly. A breaded fried chicken nugget to be tested was placed directly
between the two transducers along the center line of the sample and transducers to assure
the optimal propagation of the sound wave. A transducer holding device was used to
apply a uniform pressure and a precise alignment of the transducers during each
ultrasonic measurement, permitting the most efficient ultrasonic energy transmission
through the sample.
The burst pulser sent electrical energy bursts into the transmitting transducer to
convert the electrical energy to ultrasonic energy in form of ultrasonic pulses. The

82
transducer then launched an ultrasonic pulse into the sample material. The ultrasound
traveled through the sample material until it reached a boundary or discontinuity in the
material. In such case, some ultrasonic energy will be reflected. The transmitted
ultrasound was received and converted to an electrical signal by the receiving transducer,
amplified and displayed on the oscilloscope screen as real time radio-frequency traces,
from which the properties of the ultrasonic wave could be determined. The data were
then transferred to the microcomputer for further analysis.
From the transmitted ultrasonic signal, such ultrasonic properties as ultrasonic
velocity (υ) and transmission loss (Tloss) were determined in this study.
Ultrasonic velocity
Ultrasonic velocity represents the average speed of ultrasound through the sample
from one side to the other. The time-of-flight (TOF), known as the traveling time of the
ultrasonic pulse from one side of sample to the other, was derived from the plot of time
domain waveform as shown in Figure 5.2. The predetermined sample thickness and the
determined time-of-flight through the sample and time-of-flight of the transducer were
used to calculate the propagation velocity of the ultrasonic wave through the sample.
The ultrasonic velocity for each breaded fried chicken nugget was determined
according to the following equation:
0TOFTOFl
sample −=υ

83
where
υsample = Ultrasonic velocity for breaded fried chicken nugget (m/sec)
l = Path length of transmission (mm)
TOF = Time-of-flight with the sample (ms)
TOF0 = Calibrated time-of-flight without the sample (ms)
Transmission loss
For ultrasound transmission through breaded fried chicken nuggets, the total loss
of the ultrasonic energy, including attenuation, was determined. The transmission loss
was calculated as follows:
lA
A
T
ref
loss
=log20
where
Tloss = Transmission loss (dB/mm)
Aref = Maximum amplitude of the signal without sample in between (V)
A = Maximum amplitude of the signal after traveling the distance l (V)
l = Path length of ultrasonic transmission (mm)
Mechanical Property Measurements
An Instron universal testing machine (Model 1011, Instron Inc., Canton, MA)
interfaced with a microcomputer for data acquisition was used for mechanical property
measurements. The test sample was placed in the Kramer shear-compression cell and the
crosshead speed was set at 100 mm/min. The maximum peak force and total energy were
obtained from the measurements.
84
Statistical Analysis
Experimental data were analyzed by the Statistical Analysis Software (SAS, Cary,
NC). Statistical differences were determined among different levels of treatments using
split-plot design and generalized linear model (GLM) at the 0.05 confidence level.
RESULTS AND DISCUSSION
Quality characteristics of breaded fried chicken nugget
Moisture content
The effects of cooking method, storage conditions and holding time on the
moisture content of the crust and core are shown in Table 5.1. Significant differences in
moisture content of the crust among the samples cooked by different methods and stored
under either a heat lamp or ambient conditions were observed. The moisture content of
the crust was higher for samples cooked in a microwave oven (33.66 – 47.20 % w.b.)
than for samples cooked in an oven (28.50 – 43.44 % w.b.) and a deep-fat fryer (20.73 -
34.36 % w.b.). Effect of holding samples under a heat lamp and ambient conditions on
moisture content of the crust is shown in Figure 5.3. The moisture content of the crust
decreased with holding samples under a heat lamp and increased with holding samples
under ambient conditions (45 – 55% RH).
The moisture content of the core did not significantly change among the samples
cooked by different methods; however, the storage conditions had a significant effect on
the moisture content of the core (Table 5.1). Samples held under ambient conditions had
higher values of moisture content of the core (58.22 – 64.92 % w.b.) than samples stored

85
under a heat lamp (55.36 – 60.54 % w.b.). The mean scores of the moisture content of the
core are arranged in Table 5.2.
Fat content
Significant differences (p ≤ 0.05) in fat content of the crust among the samples
cooked by different methods were observed (Table 5.1). The fat content of the crust had
higher values for samples cooked in a deep-fat fryer (30.73 – 39.25 % w.b.) than for
samples cooked in an oven (25.36 – 33.93 % w.b.) and microwave oven (21.92 –
28.82 % w.b.). The holding time under either a heat lamp or ambient conditions did not
significantly affect the fat content of the crust (Table 5.1). Effect of holding samples
under a heat lamp and ambient conditions on fat content of the crust is shown in
Figure 5.4.
The fat content of the core did not significantly change among the samples
cooked by different methods and held under either a heat lamp or ambient conditions
(Table 5.1). The mean scores of the fat content of the core are shown in Table 5.3.
Sensory crispness evaluation of breaded fried chicken nuggets
The cooking method of breaded chicken nuggets, storage conditions either under
a heat lamp or ambient conditions, and holding time had a significant effect on sensory
crispness (Table 5.4). Breaded chicken nuggets fried in a deep-fat fryer were crispier (6 –
8) than nuggets baked in an oven (3 – 5) and nuggets cooked in a microwave oven (1 –
2). The panelists found that cooked samples held under a heat lamp were significantly
crispier than samples stored under ambient conditions. Crispness changes with holding
time under either a heat lamp or ambient conditions were perceived by judges. Panel
determined the increasing intensity of crispness among samples kept under a heat lamp.

86
Effect of holding time under a heat lamp and ambient conditions on the crispness
intensity ratings of breaded fried chicken nuggets for each cooking method is shown in
Figure 5.5. Panel indicated the decreasing intensity of crispness with holding time under
ambient conditions. Sensory crispness was inversely related to moisture content,
indicating that crispness intensity was increasing, while moisture content was decreasing
when the samples were held under a heat lamp (Fig. 5.6).
Time domain signal analysis
The ultrasonic parameters, which are ultrasonic velocity and transmission loss,
were obtained from the time domain of the transmitted signal.
Ultrasonic velocity
The significant differences in the ultrasonic velocity for the breaded chicken
nuggets cooked by three different methods and stored under either a heat lamp or ambient
conditions were observed (Table 5.5). The samples cooked in a deep-fat fryer had higher
ultrasonic velocities (431.56 – 715.38 m/sec) than the samples cooked in an oven
(221.41 – 533.83 m/sec), while the samples cooked in a microwave oven had much lower
velocities (90.22 – 306.92 m/sec). This can be attributed to the changes in moisture and
fat contents among the samples. The samples cooked in a deep-fat fryer had the lowest
moisture content, while the samples cooked in a microwave oven had the highest
moisture content. The mean values of ultrasonic velocity for each cooking method are
arranged in Table 5.6. The ultrasonic velocity increased with increasing holding time
under a heat lamp as the moisture content decreased during holding. This implied that
samples became crispier during holding under a heat lamp. On the other hand, ultrasonic
velocity decreased with holding samples under ambient conditions as samples became
87
soggier and softer. The changes of mean ultrasonic velocities of the breaded fried chicken
nuggets are plotted in Figure 5.7. The relationships between ultrasonic velocity and
moisture content are shown in Figure 5.8. The decrease in the velocity with respect to an
increase in moisture content can be attributed to the transmission loss in liquid than the
transmission loss in a solid. Ultrasound can propagate better in solids than liquids.
Transmission loss
The differences in the values of transmission loss measured for the breaded
chicken nuggets cooked by different methods were found statistically significant
(Table 5.5). The values of transmission loss measured for the samples cooked in a deep-
fat fryer (0.36 – 0.64 dB/mm) were lower than those measured for the samples cooked in
an oven (0.69 – 1.09 dB/mm) and a microwave oven (0.76 – 1.12 dB/mm), which can be
due to the moisture and fat contents of samples. However, the storage conditions and
holding time did not have a significant effect on the transmission loss (Table 5.5). The
mean scores for transmission loss are shown in Table 5.7.
Frequency domain signal analysis
Frequency analysis was performed to obtain the energy content distributed over
the frequency bandwidth determined as a power spectrum of the signal. A Fast Fourier
Transformation (FFT) algorithm was used to convert data at the time domain into
frequency domain, using Matlab. The frequency domain plots shown in Figure 5.9 reveal
the distribution of frequency components of the time-domain signals. The peak
frequencies of tested samples were found in a range of 216 – 252 kHz, 846 – 882 kHz,
and 1368 – 1386 kHz, respectively. The signal amplitudes for each peak frequency did
not significantly change among the samples cooked by different methods; however, the
88
storage conditions had a significant effect on the signal amplitude (Table 5.5). The
breaded fried chicken nuggets kept under a heat lamp had higher peak amplitudes than
those stored under ambient conditions. This could be due to lack of crispness (or being
soggy) in the samples kept under ambient conditions. The mean values of the signal
amplitude for each peak frequency are shown in Table 5.8.
Mechanical property measurements
Normalization of the peak force and total energy was done by dividing the values
by mass of the sample. The normalized peak force and normalized total energy
significantly varied among the samples cooked by different methods and stored under
different conditions (Table 5.9). The mean values of peak force and total energy for each
cooking method are shown in Table 5.10. Samples cooked in a deep-fat fryer had higher
values for the peak force and total energy than samples cooked in an oven and microwave
oven. However, holding time either under a heat lamp or ambient conditions did not
have a significant effect on either the peak force or total energy (Table 5.9). The effect of
holding time under a heat lamp and ambient conditions for each cooking method on the
peak force is shown in Figure 5.10. The peak force slightly increased with holding time
under either a heat lamp or ambient conditions. Samples stored under a heat lamp had
higher values of the total energy than those kept under ambient conditions (Fig. 5.11).
Relating instrumental parameters to sensory crispness
To investigate the relationship between sensory crispness and objective quality
parameters, the linear regression procedure was performed. Correlation coefficients
between sensory crispness and instrumental measurements are summarized in Table 5.11.
Except for the relationship between ultrasonic velocity and sensory crispness, all the
89
objective parameters did not have an improvement in the correlation coefficient when
analyzed separately against each cooking method.
The relationship between sensory crispness and peak force is shown in Figure
5.12 and described by equation 1. The positive sign preceding the slope implied that
sensory crispness increased when a high peak force was required.
Sensory crispness = 3.3518(Peak Force) – 5.1989 (1)
[R2 = 0.6379]
The positive relationship between sensory crispness and ultrasonic velocity is
described by equation 2 showing that sensory crispness and ultrasonic velocity are
closely related. Increasing sensory crispness of the breaded fried chicken nuggets is
illustrated by increasing mean ultrasonic velocities, as presented in Figure 5.13.
Sensory Crispness = 0.0127(Velocity) – 0.6692 (2)
[R2 = 0.8257]
On the other hand, the transmission loss decreased as the samples became
crispier, as is shown in Figure 5.14. The inverse relationship of sensory crispness to
transmission loss is described by equation 3. The negative sign preceding the slope
implied that sensory crispness increased when the transmission loss was low.
Sensory Crispness = -7.6352(Transmission loss) + 8.8325 (3)
[R2 = 0.5532]
The model was significant at the 0.05 confidence level. This indicates that sensory
crispness could be explained based on the ultrasonic and mechanical parameters. The
ultrasonic velocity had high correlation to the sensory crispness (R2 = 0.8257). This

90
implies that sensory crispness could be reasonably well predicted by the ultrasonic
velocity.
CONCLUSION
Significant differences in ultrasonic velocity, transmission loss, peak force and
total energy were observed among the breaded chicken nuggets cooked by different
methods. During holding of samples either under a heat lamp or ambient conditions,
transmission loss, peak force and total energy did not significantly change. However,
ultrasonic velocity varied with holding time, indicating the changes in intensity of
crispness. This can be attributed to the changes in moisture content during holding.
Breaded fried chicken nuggets held under a heat lamp had higher signal
amplitudes for each peak frequency than those stored under ambient conditions. This
could be due to lack of crispness (or being soggy) in the samples kept under ambient
conditions.
Sensory crispness of breaded fried chicken nuggets was found to be affected by
cooking method, storage conditions and holding time. The relationship between sensory
crispness and instrumental parameters suggests that the ultrasonic method can be used to
measure and explain sensory crispness in breaded fried chicken nuggets. Ultrasonic
velocity had high correlation with sensory crispness (R2 = 0.83). This indicates that
sensory crispness could be reasonably well predicted by the ultrasonic velocity.
REFERENCES
Brooks, D.D. 1991. Some perspectives on deep-fat frying. INFORM 2(12): 1091-1095.
Cheng, Y. and Haugh, C.G. 1994. Detecting hollow heart in potatoes using ultrasound.
Trans. ASAE 37(1): 217-222.
91
Meilgaard, M. Civille, G.V., and Carr, B.T. 1999. Sensory evaluation techniques.
CRC Press LLC.
Mohamed, A.A.A., Jowitt, R. and Brennan, J.G. 1982. Instrumental and sensory
evaluations of crispness: 1 – in friable foods. J. Food Eng. 1: 55-75. Seymour, S.K. 1985. Studies on the relationships between the mechanical, acoustical and
sensory properties in low moisture food products. Ph. D. Dissertation, North Carolina State University, Raleigh, NC.
Tahnpoonsuk, P. 1999. Determination of crispness in breaded shrimp. M. S. Thesis,
The University of Georgia, Athens, GA. Tesch, R., Normand, M.D., and Peleg, M. 1996. Comparison of the acoustic and
mechanical signatures of two cellular crunchy cereal foods at various water activity levels. J. Sci. Food Agric., 67: 453-459.
Vickers, Z.M. 1987. Crispness and crunchiness. In Food Texture: Instrumental and
Sensory Measurement (Moskowitz, H.R., eds.) Marcel Dekker, Inc., New York and Basel.
Vickers, Z.M. 1988. Instrumental measures of crispness and their correlation with
sensory assessment. J. Texture Stud., 19: 11-14.

92
Table 5.1 Effects of cooking method, storage conditions and holding time on
moisture and fat contents of crust and core of breaded fried chicken nuggets
Mean Sum of Squares
Moisture content Fat content
Main effects DF
Crust Core Crust Core
M 2 684.35* 6.48 371.58* 0.96
C 1 132.58* 156.45* 1.15 3.34
C * T 3 359.61* 14.71 12.47 9.38
C * T * M 8 44.50 11.14 17.64 4.98
Error 22
* indicates a significant difference for the main effect at 0.05 level
DF = Degrees of Freedom
M = Cooking method
C = Storage condition
T = Holding time

93
Table 5.2 Mean* core moisture content (% w. b.) of breaded fried chicken nuggets
Deep-fat Fryer Microwave Oven Oven Holding Time, Min
HL
AC
HL
AC
HL
AC
10
55.94±3.98
65.50±0.45
55.67±0.12
61.53±0.17
59.72±1.24
63.52±4.59
20
55.86±5.48
62.29±1.38
58.46±0.95
62.24±4.15
59.52±0.12
62.27±1.38
30
56.67±2.18
61.46±1.85
56.42±0.89
59.85±0.78
61.26±3.08
59.59±2.5
40
59.39±0.03
61.49±2.77
56.44±0.46
62.20±1.06
60.19±1.87
56.89±9.87
* Values are ŷ ± s. d.
HL = Heat lamp
AC = Ambient conditions

94
Table 5.3 Mean* core fat content (% w. b.) of breaded fried chicken nuggets
Deep-fat Fryer Microwave Oven Oven Holding
Time,
Min
HL
AC
HL
AC
HL
AC
10
24.85±3.15
25.14±1.86
24.23±1.50
23.79±0.32
24.38±0.89
21.62±1.18
20
22.08±3.53
23.09±3.08
23.18±1.35
22.73±2.04
26.46±3.05
21.59±1.07
30
23.42±1.24
23.16±2.93
23.62±0.14
21.78±0.83
22.91±0.96
20.96±6.45
40
20.18±0.72
23.43±0.29
21.00±0.28
22.45±0.11
22.12±0.35
21.40±0.82
* Values are ŷ ± s. d.
HL = Heat lamp
AC = Ambient conditions

95
Table 5.4 The effects of cooking method, storage conditions and holding time on
sensory crispness of breaded fried chicken nuggets
Main effects
DF
Mean Square
Storage condition Cooking method Storage condition*Time Storage condition*Time*Cooking method Error
1 2 3 6 88
2.74*
371.89*
2.79*
0.36
* indicates a significant level at p < 0.05

96
Table 5.5 Effects of cooking method, storage conditions and holding time on
ultrasonic properties of breaded fried chicken nuggets
DF Mean Sum of Squares Main effects
υ Tloss A1 A2 A3
M 2 1406427.86* 1.83* 830.15 33.65 1.85
C 1 280495.76* 0.12 5400.42* 163.11* 13.48*
C * T 3 223260.95* 0.31 698.74 6.43 0.92
C * T * M 6 7140.46 0.25 282.89 1.52 0.14
Error 88
* indicates a significant difference for the main effect at 0.05 level
DF = Degrees of freedom
υ = Ultrasonic velocity for breaded fried chicken nugget (m/sec)
Tloss = Transmission loss (dB/mm)
A1, A2, and A3 = Signal amplitudes for each peak frequency, respectively
M = Cooking method
C = Storage condition
T = Holding time
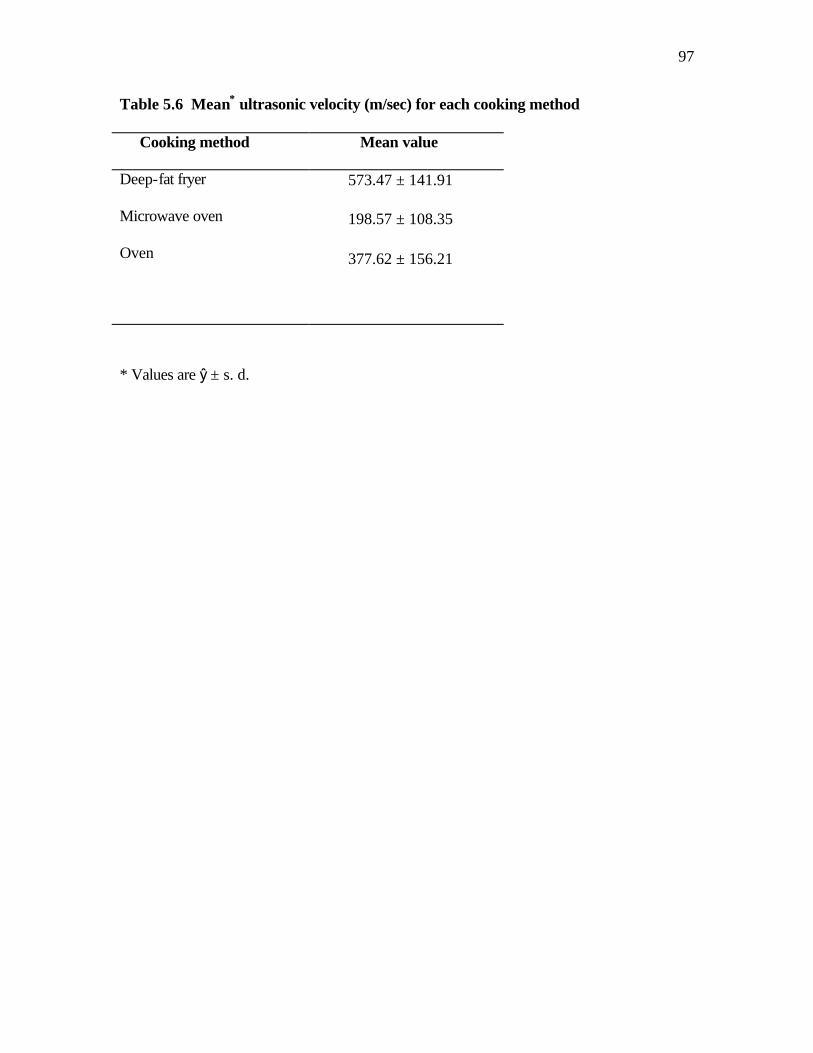
97
Table 5.6 Mean* ultrasonic velocity (m/sec) for each cooking method
Cooking method Mean value
Deep-fat fryer
Microwave oven
Oven
573.47 ± 141.91
198.57 ± 108.35
377.62 ± 156.21
* Values are ŷ ± s. d.

98
Table 5.7 Mean* transmission loss (dB/mm) for breaded fried chicken nuggets
Deep-fat Fryer Microwave Oven Oven Holding
Time,
Min
HL
AC
HL
AC
HL
AC
10
0.41±0.28
0.27±0.30
0.60±0.55
0.84±0.30
0.94±0.39
0.36±0.20
20
0.36±0.24
0.34±0.38
0.93±0.36
0.71±0.45
0.59±0.53
0.65±0.56
30
0.19±0.16
0.30±0.20
0.61±0.32
0.87±0.52
0.46±0.21
0.78±0.37
40
0.53±0.43
0.49±0.24
0.70±0.55
0.84±0.48
0.57±0.45
1.19±0.37
* Values are ŷ ± s. d.
HL = Heat lamp
AC = Ambient conditions
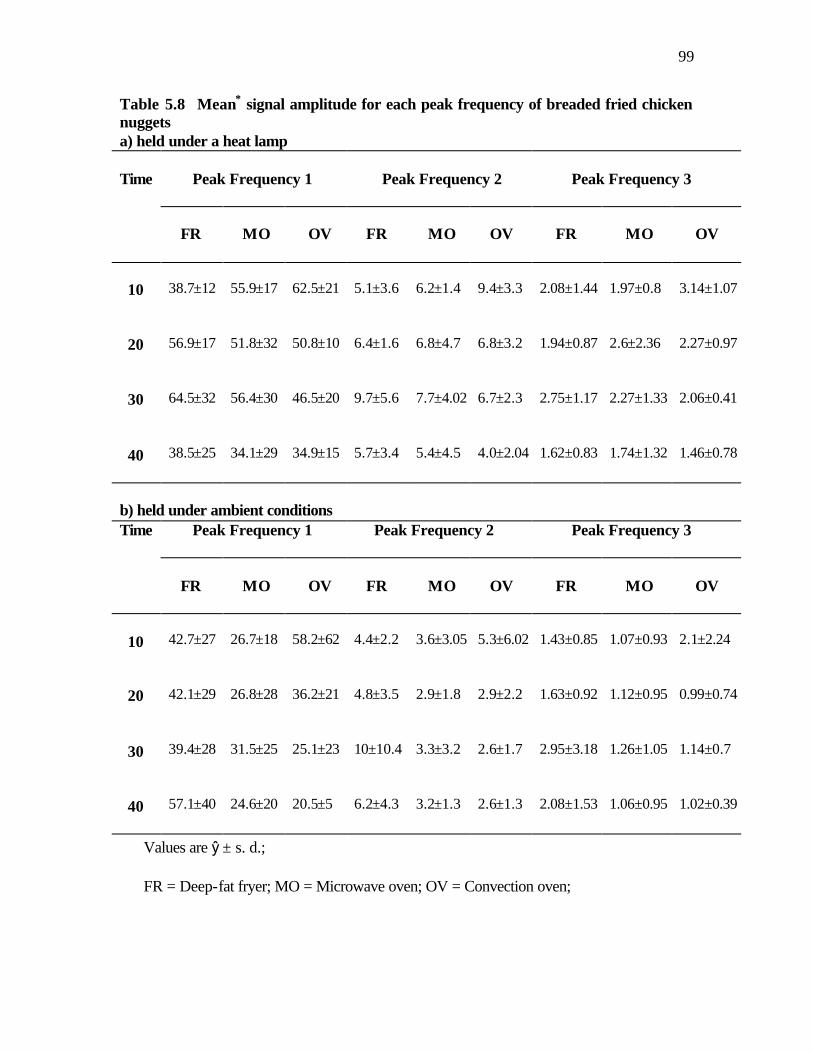
99
Table 5.8 Mean* signal amplitude for each peak frequency of breaded fried chicken nuggets a) held under a heat lamp Time
Peak Frequency 1
Peak Frequency 2
Peak Frequency 3
FR
MO
OV
FR
MO
OV
FR
MO
OV
10
38.7±12
55.9±17
62.5±21
5.1±3.6
6.2±1.4
9.4±3.3
2.08±1.44
1.97±0.8
3.14±1.07
20
56.9±17
51.8±32
50.8±10
6.4±1.6
6.8±4.7
6.8±3.2
1.94±0.87
2.6±2.36
2.27±0.97
30
64.5±32
56.4±30
46.5±20
9.7±5.6
7.7±4.02
6.7±2.3
2.75±1.17
2.27±1.33
2.06±0.41
40
38.5±25
34.1±29
34.9±15
5.7±3.4
5.4±4.5
4.0±2.04
1.62±0.83
1.74±1.32
1.46±0.78
b) held under ambient conditions Time Peak Frequency 1 Peak Frequency 2
Peak Frequency 3
FR
MO
OV
FR
MO
OV
FR
MO
OV
10
42.7±27
26.7±18
58.2±62
4.4±2.2
3.6±3.05
5.3±6.02
1.43±0.85
1.07±0.93
2.1±2.24
20
42.1±29
26.8±28
36.2±21
4.8±3.5
2.9±1.8
2.9±2.2
1.63±0.92
1.12±0.95
0.99±0.74
30
39.4±28
31.5±25
25.1±23
10±10.4
3.3±3.2
2.6±1.7
2.95±3.18
1.26±1.05
1.14±0.7
40
57.1±40
24.6±20
20.5±5
6.2±4.3
3.2±1.3
2.6±1.3
2.08±1.53
1.06±0.95
1.02±0.39
Values are ŷ ± s. d.; FR = Deep-fat fryer; MO = Microwave oven; OV = Convection oven;
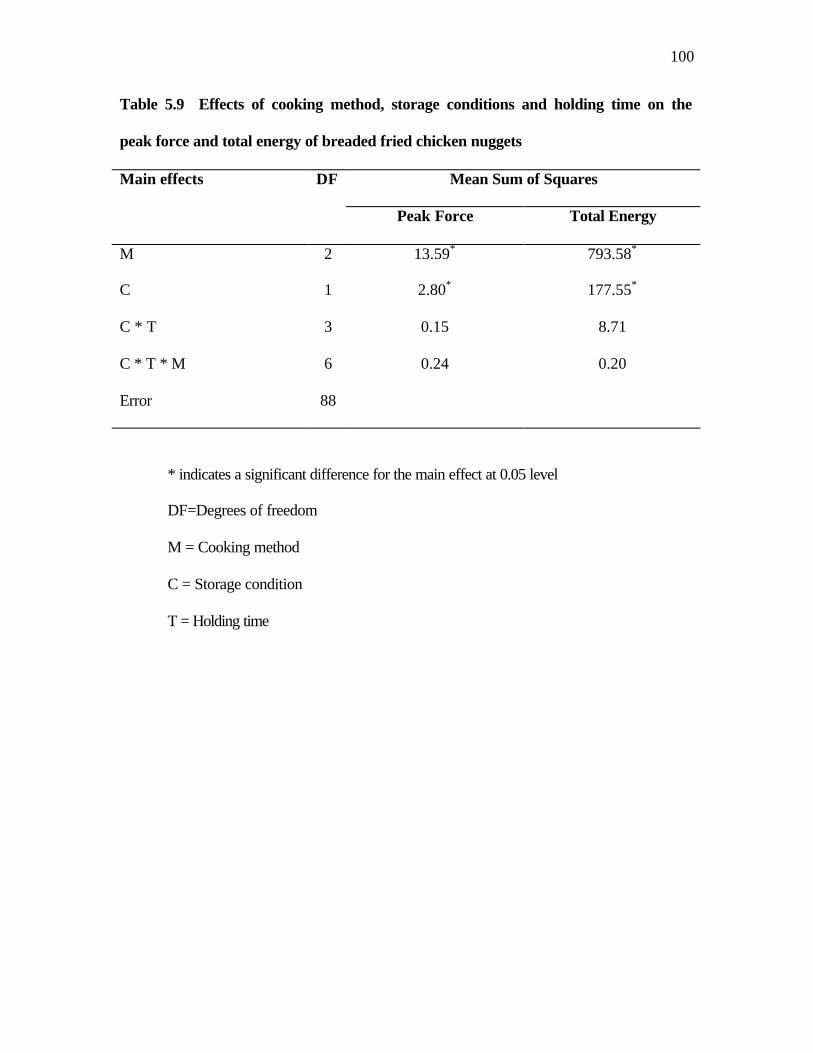
100
Table 5.9 Effects of cooking method, storage conditions and holding time on the
peak force and total energy of breaded fried chicken nuggets
Mean Sum of Squares Main effects DF
Peak Force
Total Energy
M
C
C * T
C * T * M
Error
2
1
3
6
88
13.59*
2.80*
0.15
0.24
793.58*
177.55*
8.71
0.20
* indicates a significant difference for the main effect at 0.05 level
DF=Degrees of freedom
M = Cooking method
C = Storage condition
T = Holding time
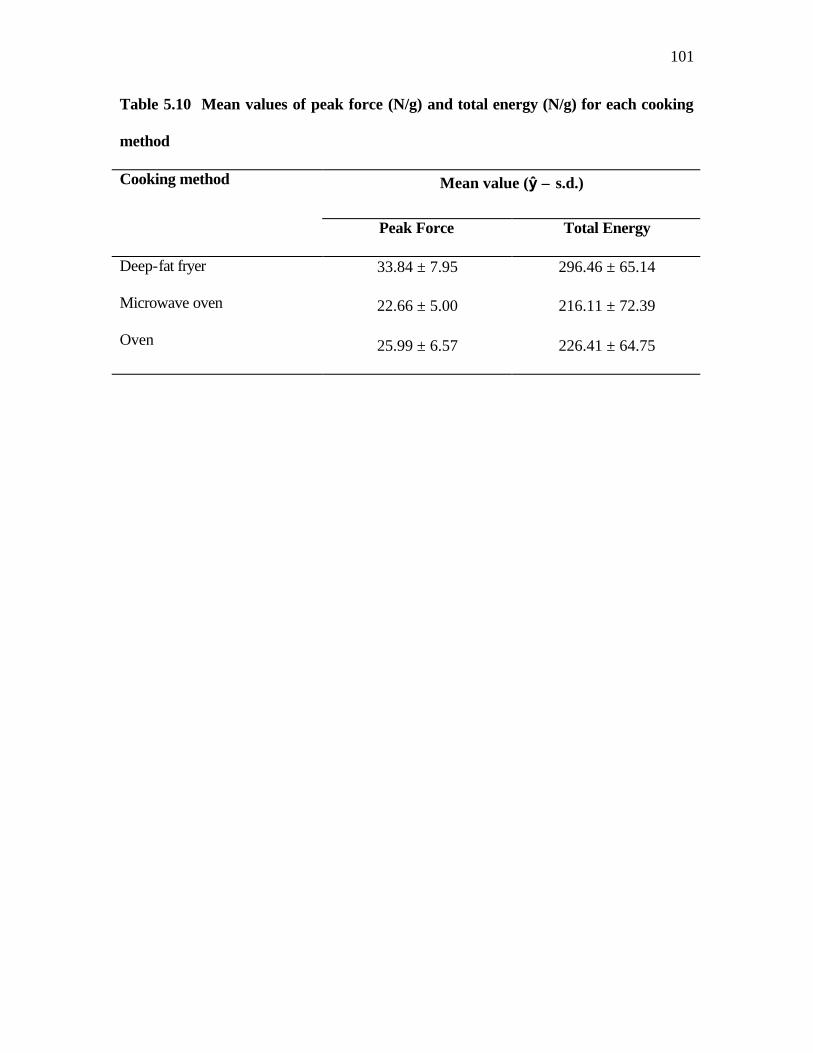
101
Table 5.10 Mean values of peak force (N/g) and total energy (N/g) for each cooking
method
Mean value (ŷ ± s.d.) Cooking method
Peak Force Total Energy
Deep-fat fryer
Microwave oven
Oven
33.84 ± 7.95
22.66 ± 5.00
25.99 ± 6.57
296.46 ± 65.14
216.11 ± 72.39
226.41 ± 64.75

102
Table 5.11 Correlation between instrumental and sensory measurements of
crispness in breaded fried chicken nuggets (y = ax + b)
Instrumental parameters a b R2
Peak Force All data points Fryer Convection oven Microwave oven Total Energy All data points Fryer Convection oven Microwave oven Ultrasonic Velocity All data points Fryer Convection oven Microwave oven Transmission Loss All data points Fryer Convection oven Microwave oven
3.35 0.05 0.06 -0.02
0.37 0.02 0.01 -0.02
0.0127 0.0036 0.0042 0.0014
-7.64 -1.24 -1.76 -0.14
5.19 5.53 2.38 1.77
-5.14 6.61 3.69 1.65
-0.67 5.30 2.38 0.99
8.83 7.80 1.37 5.19
0.64 0.58 0.10 0.24
0.50 0.07 0.01 0.16
0.83 0.87 0.94 0.85
0.55 0.13 0.85 0.02

103
Fig.5.1 Schematic diagram of the instrumentation setup for 250-kHz ultrasonic
transducers in through-transmission mode
Pulser Receiver
OscilloscopeSample
Transducer
Transducer
Trigger Transmit Sig.Out Gain Sig. In

104
Fig. 5.2 Time domain plot of transmitted ultrasound

105
a)
0
5
10
15
20
25
30
35
40
45
50
0 5 10 15 20 25 30 35 40 45
Holding time (min)
Mo
istu
re c
on
ten
t (%
)
Fryer
Microwave
Oven
b)
0
10
20
30
40
50
60
0 10 20 30 40 50
Holding time (min)
Mo
istu
re c
on
ten
t (%
)
Fryer
Microwave
Oven
Fig.5.3 Effect of holding time on the moisture content of the crust
a) – under a heat lamp
b) – under ambient conditions

106
a)
b)
Fig. 5.4 Effect of holding time on the fat content of the crust: (a) under a heat lamp; and
(b) under ambient conditions
0
5
10
15
20
25
30
35
40
45
0 5 10 15 20 25 30 35 40 45
Holding time (min)
Fat
Co
nte
nt
(%)
Fryer
Microwave
Oven
0
5
10
15
20
25
30
35
40
45
0 5 10 15 20 25 30 35 40 45
Holding time (min)
Fat
Co
nte
nt
(%)
FryerMicrowaveOven
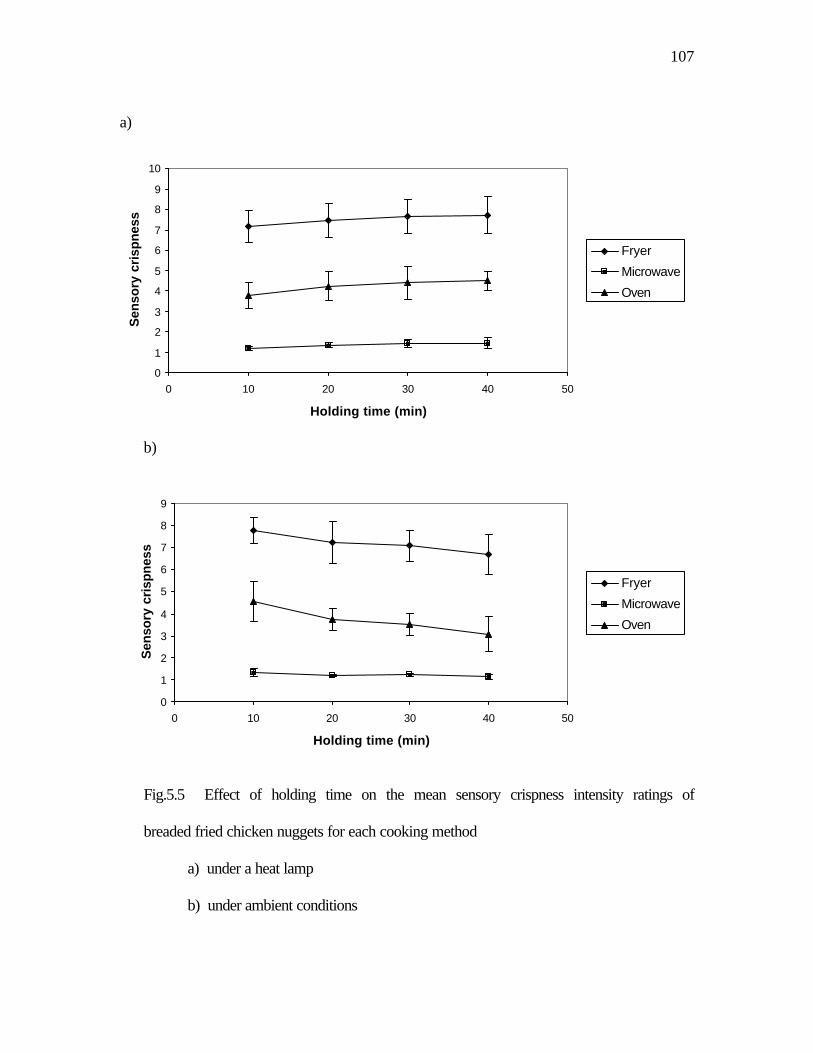
107
a)
b)
Fig.5.5 Effect of holding time on the mean sensory crispness intensity ratings of
breaded fried chicken nuggets for each cooking method
a) under a heat lamp
b) under ambient conditions
0
1
2
3
4
5
6
7
8
9
0 10 20 30 40 50
Holding time (min)
Sen
sory
cri
spn
ess
Fryer
Microwave
Oven
0
1
2
3
4
5
6
7
8
9
10
0 10 20 30 40 50
Holding time (min)
Sen
sory
cri
spn
ess
Fryer
Microwave
Oven

108
0
1
2
3
4
5
6
7
8
9
15 20 25 30 35 40 45 50 55
Moisture content (%)
Sen
sory
cri
spn
ess
Fryer Microwave Oven
Fig. 5.6 Relating moisture content to sensory crispness

109
a)
0
100
200
300
400
500
600
700
800
0 10 20 30 40 50
Holding time (min)
Vel
oci
ty (
m/s
ec)
Fryer
Microwave
Oven
b)
0
100
200
300
400
500
600
700
800
0 5 10 15 20 25 30 35 40 45
Holding time (min)
Vel
oci
ty (
m/s
ec)
Fryer
Microwave
Oven
Fig.5.7 Effect of holding time on ultrasonic velocity for each cooking method
a) under a heat lamp
b) under ambient conditions

110
0
100
200
300
400
500
600
700
800
15 20 25 30 35 40 45 50 55
Moisture content (%)
Ultr
aso
nic
vel
oci
ty (m
/sec
)
Fryer Microwave Oven
Fig. 5.8 Relating moisture content to ultrasonic velocity

111
Fig. 5.9 Frequency domain plot of transmitted ultrasound
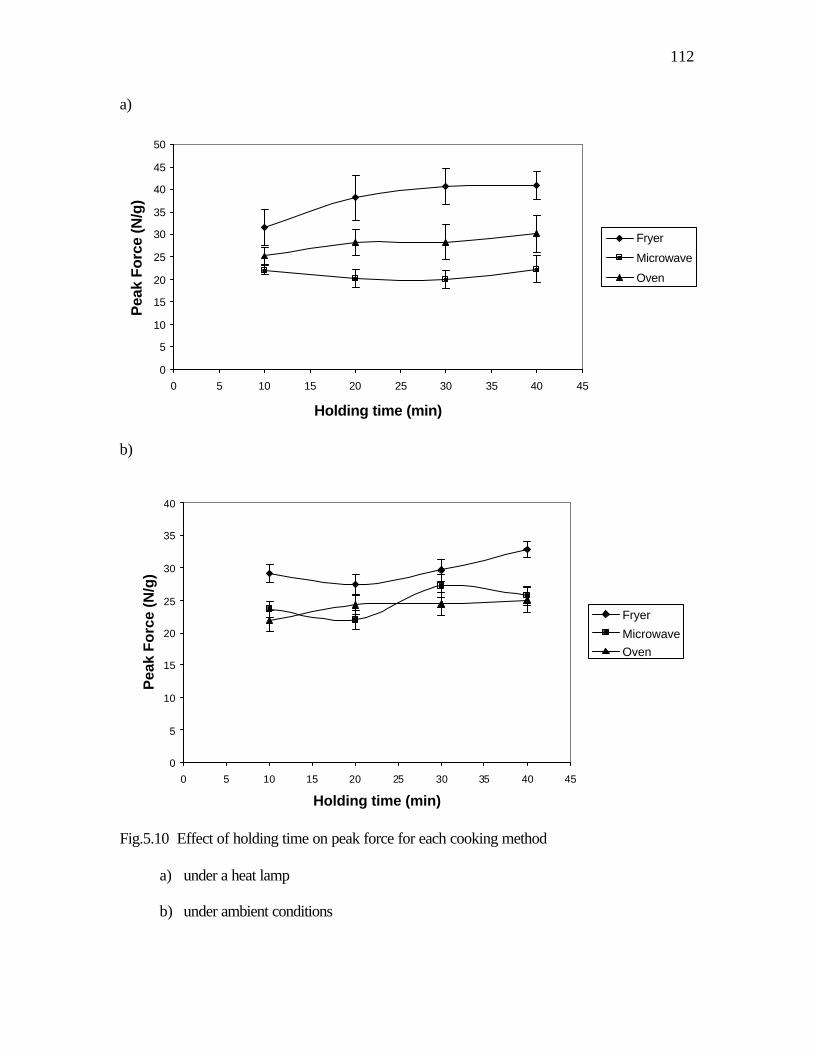
112
a)
b)
0
5
10
15
20
25
30
35
40
0 5 10 15 20 25 30 35 40 45
Holding time (min)
Pea
k F
orc
e (N
/g)
Fryer
MicrowaveOven
Fig.5.10 Effect of holding time on peak force for each cooking method
a) under a heat lamp
b) under ambient conditions
0
5
10
15
20
25
30
35
40
45
50
0 5 10 15 20 25 30 35 40 45
Holding time (min)
Pea
k Fo
rce
(N/g
)
Fryer
Microwave
Oven
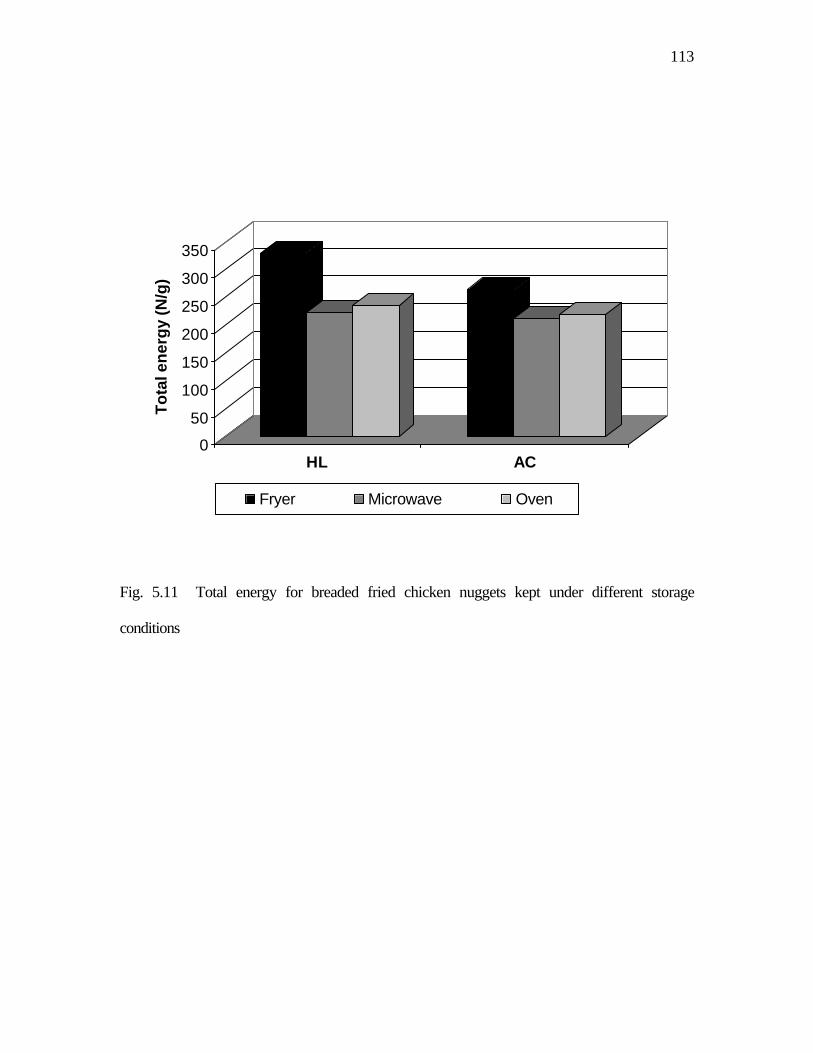
113
0
50
100
150
200
250
300
350
To
tal e
ner
gy
(N/g
)
HL AC
Fryer Microwave Oven
Fig. 5.11 Total energy for breaded fried chicken nuggets kept under different storage
conditions

114
0
1
2
3
4
5
6
7
8
9
15 20 25 30 35 40 45
Peak force (N/g)
Sen
sory
cri
spn
ess
Fryer Microwave Oven
Fig. 5.12 Relating peak force to sensory crispness

115
0
1
2
3
4
5
6
7
8
9
0 100 200 300 400 500 600 700 800
Ultrasonic velocity (m/sec)
Sen
sory
cri
spn
ess
Fryer Microwave Oven
Fig. 5.13 Relating ultrasonic velocity to sensory crispness

116
0
1
2
3
4
5
6
7
8
9
0 0.2 0.4 0.6 0.8 1 1.2 1.4
Transmission loss (dB/mm)
Sen
sory
cri
spne
ss
Fryer Microwave Oven
Fig. 5.14 Relating transmission loss to sensory crispness

117
SECTION VI
SUMMARY AND CONCLUSIONS
118
SUMMARY
Crispness is one of the most important textural characteristics in breaded fried
foods. Though many experiments have been dedicated to determining crispness, the best
measurements are still inconclusive. There is a need for developing an objective method
that can accurately measure and quantify crispness for breaded fried foods having moist
core.
In this study, the mechanical and ultrasonic techniques were investigated and used
for crispness evaluation of breaded fried chicken nuggets cooked by different methods
and held under either a heat lamp or ambient conditions. An Instron universal testing
machine was used to measure the mechanical properties of breaded fried chicken
nuggets. For the ultrasonic measurements, the ultrasonic non-destructive evaluation
system was used. The system included a high power burst pulser, a broadband receiver, a
digital storage oscilloscope, 250-kHz dry-coupling ultrasonic transducers, and a
microcomputer system for data acquisition and analysis. The equipment setup was in the
through-transmission mode because breaded fried chicken nugget is highly atttenuative
material.
Ultrasonic velocity, transmission loss, peak frequencies and its amplitudes, peak
force and total energy were determined for each sample. Correlation between
instrumental measurements and sensory measurements showed that the ultrasonic method
can be used to measure and explain sensory crispness in breaded fried chicken nuggets.
Ultrasonic velocity had high correlation with sensory crispness (R2 = 0.83). This
indicates that sensory crispness could be reasonably well predicted by the ultrasonic
velocity.
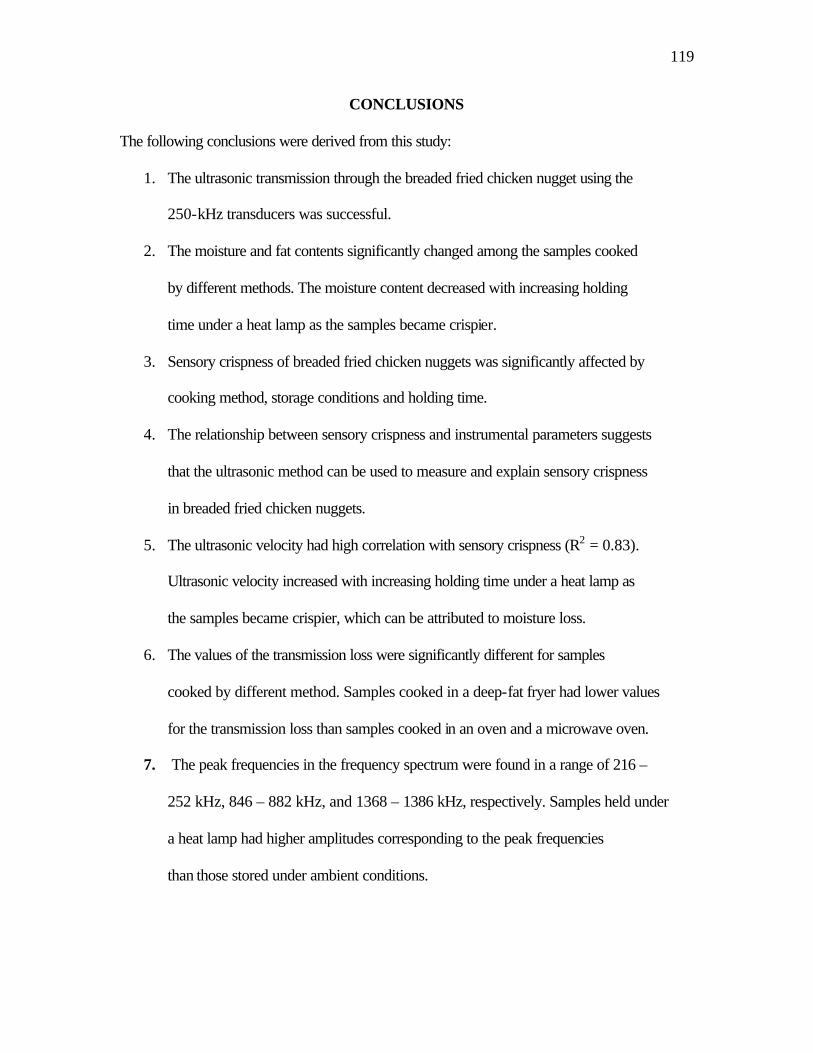
119
CONCLUSIONS
The following conclusions were derived from this study:
1. The ultrasonic transmission through the breaded fried chicken nugget using the
250-kHz transducers was successful.
2. The moisture and fat contents significantly changed among the samples cooked
by different methods. The moisture content decreased with increasing holding
time under a heat lamp as the samples became crispier.
3. Sensory crispness of breaded fried chicken nuggets was significantly affected by
cooking method, storage conditions and holding time.
4. The relationship between sensory crispness and instrumental parameters suggests
that the ultrasonic method can be used to measure and explain sensory crispness
in breaded fried chicken nuggets.
5. The ultrasonic velocity had high correlation with sensory crispness (R2 = 0.83).
Ultrasonic velocity increased with increasing holding time under a heat lamp as
the samples became crispier, which can be attributed to moisture loss.
6. The values of the transmission loss were significantly different for samples
cooked by different method. Samples cooked in a deep-fat fryer had lower values
for the transmission loss than samples cooked in an oven and a microwave oven.
7. The peak frequencies in the frequency spectrum were found in a range of 216 –
252 kHz, 846 – 882 kHz, and 1368 – 1386 kHz, respectively. Samples held under
a heat lamp had higher amplitudes corresponding to the peak frequencies
than those stored under ambient conditions.

120
APPENDIX

121
WORKSHEET 1Day No.
Each panelist receives an eight samples of standard products to evaluate for crispness at sametime. Each sample is coded with a 3-digit random number.
Type of test: Category Scales
Code SampleA Quaker Low Fat Chewy Chunk, 1/3 barB Keeblers partner Club Cracker, 1/2 crackerC Honey Maid Graham Cracker, 1" sq.D Cheerios oat Cereal, 1 oz.F Kellogg's Bran Flakes Cereal, 1 oz.H Cheddar Cheese Crackers, 1 oz.G Kellogg's Corn Flakes Cereal, 1 oz.K Devonsheer melba Toast, 1/2 cracker
Panelist Order of presentation and serving codeNo. 1 2 3 4 5 6 7 8
1 A C D B F G K H862 756 544 681 199 918 335 477
2 B A C F K H G D681 862 756 199 335 477 918 544
3 C B F K G A H D756 681 199 335 918 862 477 544
4 D A B C H K F G544 862 681 756 477 335 199 918
5 A B K H C D G F862 681 335 477 756 544 918 199
6 F G D C H K B A199 918 544 756 477 335 681 862
7 K H G F B D C A335 477 918 199 681 544 756 862
8 G F K H D C A B918 199 335 477 544 756 862 681

122
WORKSHEET 2
Date No.
Each panelist receives five samples of fried products obtained from local fast-food restaurants.Each sample is coded with a 3-digit random number.Only one sample is presented at a time. When the panelist finished the evaluation of the firstsample, the second sample is presented in the set of tray with the appropriate scorecard.Repear the procedure for the following samples.
Type of test: Category Scales
Code SampleA Fried and breaded chicken nuggetsB French friesC Fried and breaded onion ringsD Chicken stripsK Breaded chicken
Panelist Order of presentation and serving codeNo. 1 2 3 4 5
1 A C B D K332 691 549 855 714
2 B A K C D549 332 714 691 855
3 K B D A C714 549 855 332 691
4 C D A K B691 855 332 714 549
5 D K C B A855 714 691 549 332
6 A B C D K332 549 691 855 714
7 K D B C A714 855 549 691 332
8 B K C D A549 714 691 855 332

123
WORKSHEET 3
Date No.
Each panelist receives five samples of fried products obtained from local fast-food restaurants.Each sample is coded with a 3-digit random number.Only one sample is presented at a time. When the panelist finished the evaluation of thefirst sample, the second sample is presented in the set of tray with the appropriate scorecard.Repeat the procedure for the following samples.
Type of test: Category Scales
Code SampleA Chicken strips stored under AC (10 min)B Chicken strips store under AC (20 min)H Chicken strips stored under HL (10 min)D Chicken strips stored under HL (20 min)G Chicken nuggets stored under HL (10 min)
Panelist Order of presentation and serving codeNo. 1 2 3 4 5
1 A H G D B332 855 112 714 549
2 A H G D B332 855 112 714 549
3 A H G D B332 855 112 714 549
4 A H G D B332 855 112 714 549
5 A H G D B332 855 112 714 549
6 A H G D B332 855 112 714 549
7 A H G D B332 855 112 714 549
8 A H G D B332 855 112 714 549

124
WORKSHEET 4
Date No.
Each panelist receives six samples of chicken strips obtained from KFC.Each sample is coded with a 3-digit random number.Three samples are presented at a time. Next three samples are presented in the set of tray with the appropriate scorecardat 10 min interval.Red lighting is provided.
Type of test: Category Scales
Code Sample Serving codeAC-10 Chicken strips stored under AC (10 min) 332HL-10 Chicken strips stored under HL (10 min) 112HH-10 Chicken strips stored under HH (10 min) 855AC-20 Chicken strips stored under AC (20 min) 714HL-20 Chicken strips stored under HL (20 min) 623HH-20 Chicken strips stored under HH (20 min) 477
Panelist Order of presentation and serving codeNo. 1 2 3 4 5 6
1 AC-10 HL-10 HH-10 AC-20 HH-20 HL-20332 112 855 714 477 623
2 HL-10 AC-10 HH-10 HH-20 AC-20 HL-20112 332 855 477 714 623
3 AC-10 HH-10 HL-10 HL-20 HH-20 AC-20332 855 112 623 477 714
4 HH-10 HL-10 AC-10 AC-20 HL-20 HH-20855 112 332 714 623 477
5 HL-10 AC-10 HH-10 HH-20 AC-20 HL-20112 332 855 477 714 623
6 AC-10 HH-10 HL-10 AC-20 HL-20 HH-20332 855 112 714 623 477
7 HH-10 AC-10 HL-10 HL-20 HH-20 AC-20855 332 112 623 477 714
8 HL-10 AC-10 HH-10 HL-20 HH-20 AC-20112 332 855 623 477 714
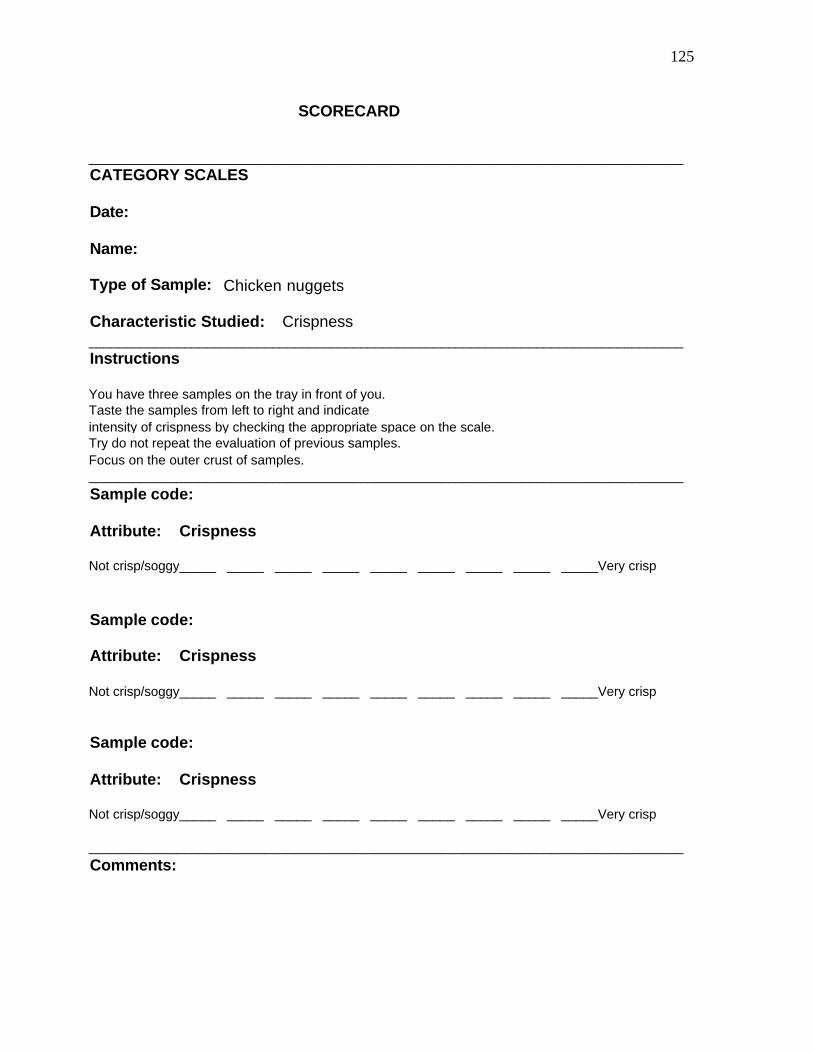
125
SCORECARD
_________________________________________________________________________________CATEGORY SCALES
Date:
Name:
Type of Sample: Chicken nuggets
Characteristic Studied: Crispness_________________________________________________________________________________Instructions
You have three samples on the tray in front of you. Taste the samples from left to right and indicate intensity of crispness by checking the appropriate space on the scale.Try do not repeat the evaluation of previous samples.Focus on the outer crust of samples._________________________________________________________________________________Sample code:
Attribute: Crispness
Not crisp/soggy_____ _____ _____ _____ _____ _____ _____ _____ _____Very crisp
Sample code:
Attribute: Crispness
Not crisp/soggy_____ _____ _____ _____ _____ _____ _____ _____ _____Very crisp
Sample code:
Attribute: Crispness
Not crisp/soggy_____ _____ _____ _____ _____ _____ _____ _____ _____Very crisp
_________________________________________________________________________________Comments:

126
VITA
Irina Antonova was born on April 28, 1974 in Moscow city, Russia. She
graduated from high school in 1991, and then entered Moscow State University of
Applied Biotechnology, majoring in Automation of Technological Processes and
Productions. She graduated in June 1996 with a Master degree in Automation of
Technological Processes and Productions. From 1996 to 1998 she worked as a graduate
research assistant in the Automation of Biotechnological Systems Department at Moscow
State University of Applied Biotechnology, Moscow, Russia.
In August of 1998, she entered Virginia Polytechnic Institute and State University
to pursue a Master of Science degree in Biological Systems Engineering Department
under the direction of Dr. P. Kumar Mallikarjunan, while she worked as a graduate
research assistant. She completed the final exam for the degree in December 2001.