determination of energy usage and potential …umpir.ump.edu.my/9005/1/cd8597 @ 32.pdf · (spd)....
TRANSCRIPT

III
DETERMINATION OF ENERGY USAGE AND
POTENTIAL ENVIRONMENT IMPACT (PEI) OF A
MULTI EFFECT DISTILLATION SYSTEM FOR
PRODUCTION OF WATER FOR INJECTION (WFI)
IN PHARMACEUTICAL INDUSTRIES
NUR MAHIRAH BINTI HIBRAHIM
Thesis submitted in partial fulfilment of the requirements
for the award of the degree of
Bachelor of Chemical Engineering
Faculty of Chemical & Natural Resources Engineering
UNIVERSITI MALAYSIA PAHANG
JANUARY 2014
©NUR MAHIRAH BINTI HIBRAHIM (2014)

VIII
ABSTRACT
Pharmaceuticals are emerging as a rapidly growing global industry because health is a
crucially important social and economic asset whilst the cornerstone for human
development. Energy in pharmaceutical industries is used to operate the unit operations
and also needed to produce water for injection (WFI) as production utilities.
Significantly, WFI is largely used in pharmaceutical processes. Typical process for
generating WFI is through a multi effect distillation which needs temperature and
therefore uses large amount of energy. The high energy consumption increase the
amount of greenhouse gases in the atmosphere particularly carbon dioxide, methane and
nitrous oxide. As the pharmaceutical industry expands, the industry faced more serious
environmental problems arising from increasing global production. Thus aware of this
fact, it is important to assess the energy consumption and its environmental impact as
early as possible especially during the process design stage to avoid further harm to the
future generation to meet their needs. In order to know the emission of mass and energy
would emit to environmental, we used the waste reduction (WAR) algorithm
methodology analysis to access the energy usage in process which is potential
environmental impact (PEI) and economic impact. In this work, we used Super Pro
software to gain the amount of energy used for the WFI production in pharmaceutical
industry. Furthermore, the data from the research can be analysis to achieve the
sustainable development of process without sacrificed our worth earth. The total energy
demand is 95.29 kWh was calculated to produce 880 L/hr WFI in pharmaceutical
industry. The energy produced from several equipment such as listed above. Result
from the PEI value calculation suggested that the higher amount of component emission
is 122 CO2 contain.

IX
ABSTRAK
Kertas kerja ini menerangkan tentang potensi kesan terhadap alam sekitar ataupun “Potential Environmental(PEI)dankajianmengenaiImpact”penggunaan tenaga dalam penghasilan “Water For Injection” (WFI) menggunakan sistem “Vapor Compression Distillaton”(VCD). Jumlah PEI telah dianalisis menggunakan algoritma “Waste Reduction”(WAR) dengan mengambil kira jumlah tenaga yang diadaptasi dalam sistem simulasi. Persamaan yang digunakan telah dibina menggunakan perisiaan “Excel”. Terdapat lapan kategori bagi impak yang telah dikira untuk mengetahui kesan proses kimia terhadap alam sekitar. Keputusan daripada Excel menunjukkan bahawa potensi kesan toksik melalui pernafasan serta pendedahan pada kulit , “Human Toxicity Potential by Inhalation/ dermal exposure” (HTPE) adalah yang paling tinggi berbanding yang lain. Penggunaan tenaga bagi sistem VCD telah dikira dengan mensimulasikan proses aliran VCD tersebut menggunakan “SuperPro Designer” (SPD). Keputusan bagi model tersebut mendapati keperluan tenaga WFI daripada sistem VCD adalah 53.07kWh/h. Memandangkan system VCD menggunakan elektrik sebagai sumber tenaga, beberapa gas berbahaya seperti CO2, SO2 dan NOx telah dibebaskan ke atmosfera. CO2 adalah gas yang paling banyak dibebaskan daripada proses tersebut dengan nilai 112.19. Keputusan yang diperolehi daripada hasil kerja ini mungkin berguna bagi mencegah pembebasan gas CO2 terhadap alam sekitar. Jumlah permintaan tenaga adalah 95,29 kWh dikira untuk menghasilkan 880 L / jam WFI dalam industri farmaseutikal. Tenaga yang dihasilkan daripada beberapa peralatan seperti yang disenaraikan di atas. Keputusan daripada pengiraan nilai PEI mencadangkan bahawa jumlah yang lebih tinggi daripada pengeluaran komponen adalah kandungan 122 CO2.

X
TABLE OF CONTENTS
SUPERVISOR’S DECLARATION ............................................................................IV
STUDENT’S DECLARATION ................................................................................... V
Dedication ...................................................................................................................VI
ACKNOWLEDGEMENT ......................................................................................... VII
ABSTRACT ............................................................................................................. VIII
ABSTRAK ..................................................................................................................IX
TABLE OF CONTENTS ............................................................................................. X
LIST OF FIGURES .....................................................................................................XI
LIST OF TABLES .................................................................................................... XII
LIST OF ABBREVIATIONS ................................................................................... XIII
1 INTRODUCTION ................................................................................................. 1
1.1 Motivation and statement of problem .............................................................. 1
1.2 Objectives ....................................................................................................... 1
1.3 Scope of this research ...................................................................................... 2
1.4 Main contribution of this work ........................................................................ 2
1.5 Organisation of this thesis ............................................................................... 2
2 LITERATURE REVIEW ...................................................................................... 4
2.1 Introduction to pharmaceutical Industry .......................................................... 4
2.2 Water For Injection ......................................................................................... 5
2.3 MED process for WFI ..................................................................................... 7
2.4 Energy usage ................................................................................................... 8
2.5 Potential environment impact .......................................................................... 8
3 PROCESS MODELLING AND SIMULATION ................................................. 11
3.1 Overview ...................................................................................................... 11
3.2 Environmental assessment using WAR algorithm.......................................... 11
3.3 Energy usage to generate steam ..................................................................... 12
3.4 Development of PEI ...................................................................................... 13
3.5 SuperPro designer ......................................................................................... 15
4 RESULTS AND DISCUSSION .......................................................................... 18
4.1 Overview ...................................................................................................... 18
4.2 Impact Factor (Energy Usage) ....................................................................... 19
4.3 Specific PEI value ......................................................................................... 20
4.4 Comparison of method between MED and VCD ........................................... 21
5 CONCLUSION AND RECOMMENDATION .................................................... 24
5.1 Conclusion .................................................................................................... 24
5.2 Recommendation .......................................................................................... 24
REFRENCES .............................................................................................................. 26
APPENDICES ............................................................................................................ 29

XI
LIST OF FIGURES Figure 1: Flow diagram using MED method .................................................................. 6
Figure 2: Mass and energy balance for the calculation of the PEI ................................ 11
Figure 3: Process flow and calculation to generate 1 kg steam ..................................... 12
Figure 4: Process flow diagram of MED from SPD simulation .................................... 17
Figure 5: Percentage of energy demand during operation ............................................. 19
Figure 6: Specific PEI of gas emitted by kWh ............................................................. 20
Figure 7: Specific PEI by Impact Category .................................................................. 20
Figure 8: Comparison energy usage between equipments with different methods ........ 22

XII
LIST OF TABLES Table 1: Environment impact category of method .......................................................... 9
Table 2: Heat transfer agent demand ............................................................................ 13
Table 3: Impact factor (enegy) with hazardous gases value for each PEI indicator ....... 14
Table 4: Specific PEI value calculation........................................................................ 14
Table 5: Normalized PEI value from energy consumption ........................................... 15
Table 6: Emisssion factor and specific PEI of component from energy consumption ... 15
Table 7: Energy demand for major equipment during operation ................................... 18
Table 8: PEI for the energy consumption of 95.29 kWh ............................................... 22
Table 9: Amount of steam consumption and specific enthalpy ..................................... 23

XIII
LIST OF ABBREVIATIONS
EP European Pharmacopeia
JP Japanese Pharmacopeia
MED Multi Effect Distillation
PEI Potential Environmental Impact
PW Purified Water
SPD Super Pro Design
VCD Vapor Compressor Distillation
WAR Waste Reduction Algorithm
WFI Water for Injection

1
1 INTRODUCTION
1.1 Motivation and statement of problem
In the pharmaceutical industry, water is an essential ingredient and the water should
meet the set standard (Rakesh et al, 2010).One of the types of water is WFI which used
in many areas of the pharmaceutical industry for the production of medicaments and
intermediates as well as for the final cleaning of equipment. Unfortunately, large
amount of energy must be transferred to the water in order to achieve phase transition
and this input of energy causes the water to move rapidly. When more energy used,
potential environmental impact will be increases from the process to generate the
energy. In Malaysia, fossil fuel was used as sources to generate the energy. In the
United State alone, more than 80% of greenhouse gas emissions released were from
fossil fuels which contribute to climate changes (EPA, 2009).
For future stability, sustainable development in early stage of design process play
important role to considering the environmental and social impacts.As an engineer, the
potential impacts to the environment when developing and manufacturing the
pharmaceutical industry should be consider. Sustainable development in process is
important while protecting the environment for the present and future generations. The
waste reduction (WAR) algorithm methodology is used to determine the potential
environmental impact. Better technology can help us study and better understand how
our process is affecting the environment and prevent the impact from effecting the
environment. Potential environmental impact is the unrealized effect or impact that the
emission of mass and energy would have on the environment (Cabezas, Bare, &
Mallick, 1999). Although the pharmaceutical industry is not considered a ‘heavy’
industry compared to chemical industry and others, it faces new challenges in
controlling and preventing environmental pollution as it expands.Thus aware of this
fact, it is important to assess the energy consumption and its environmental impact as
early as possible especially during the process design stage to avoid further harm to the
future generation to meet their needs.

2
1.2 Objectives
The following are the objective of this research:
This work aims to determine the energy usage and potential environment impact to
produce water for injection using multi effect distillation process for pharmaceutical
use.
1.3 Scope of this research
The following are the scope of this research:
i) Simulate MED process using SPD to calculate amount of energy generated
per unit of time
ii) The amount of energy generated were used to calculate the amount of PEI
indicator
iii) Apply Waste WAR Algorithm methods to analysed PEI indicator in an
Excel spreadsheet.
1.4 Main contribution of this work
The following are the contributions of this research:
o MED process flow diagram and equation for each PEI indicator.
o Environment impact for WFI production using MED method.
1.5 Organisation of this thesis
The structure of the reminder of the thesis is outlined as follow:
Chapter 2 provides a description of the pharmaceutical industry and the process utility
for Water For Injection production. A general description of applications and general
design features of multi effect distillation system. This chapter also provides
information of the energy usage and potential environment impact.
Chapter 3 gives a review of the multi effect distillation method applied for determine of
steam generated, energy usage and potential environment impact by using waste
reduction algorithm.

3
Chapter 4 is showed the result and discussion for an environmental assessment, total
energy usage during operation, PEI indication comparison and energy comparison
between MED and VCD methods.
Chapter 5 to combine together a conclusion and recommendation outlines the future
work which might be derived from the model developed in this research.

4
2 LITERATURE REVIEW
2.1 Introduction to pharmaceutical Industry
Water is the most important natural resource in worldwide. Quality of water is the
important part need consider for human being especially for drinking water. Furthermore,
in the pharmaceutical industry water is the basic carrier in the pharmaceutical processes and
products. Pharmaceutical industry business has divide by section such as are
manufacturing, formulating and processing medicinal chemicals and pharmaceutical
products. Most of product sold in various dosage delivery forms such as tablets, capsules,
ointments, solutions, suspension and powders (Berry & Rondjnelli, 2002). Water is the
essential and high demand expectation components in the pharmaceutical industry due to
the nature of its production processes. Production of biological pharmaceutical in general
requires more water than conventional drugs. WFI is one of the types of water used in
pharmaceutical industry. WFI used for the preparation of medicines for parental
administration when water is used as vehicle WFI in bulk and for dissolving or diluting of
substance or preparations for parenteral administration (sterilised WFI).Additionally, WFI
is mainly used with drugs that need to diluted or dissolved in aqueous solution for patient
use. Certain biological require water for injection which must be sterile and devoid of
minerals and microbes. According with World Health Organization (2005) WFI is not
sterile water and not a final dosage form. The element is important for cleaning agent and
ingredient in many formulations.
2.2 Water For Injection
Water is the most frequently used as a raw material in the pharmaceutical industry. It is an
essential ingredient of various pharmaceutical preparations and most apply to the
pharmaceutical industry which the quality of water is critical and high priority in
pharmaceutical process or product (Pahwa, Piplani, & Sharma, 2010). There are two basic
types of pharmaceutical water which are purified water (PW) and WFI. PW used for
cleaning while WFI used for irrigation and most sterile water for inhalation. There are no
chemicals, bacteria or endotoxins in it. The main difference between WFI and PW is the

5
amount of bacterial contamination allowed, measured by colony count and endotoxin level.
Generally, WFI used in injectable product preparations for dissolving or dilution substances
or preparations for parental administration before use and for sterile water for preparation
of injections (Scope, 2005). In the production of water for the pharmaceutical, there are few
methods to produce WFI and follow the standard. Generally, methods that are used are
distillation, reverse osmosis and ultrafiltration. Three types of standard and regulation
method in the production of water for injection are United State Pharmacopeia (USP),
European Pharmacopeia (EP) and Japanese Pharmacopeia (JP). According to Brush &
Zoccolante (2009), distillation is the only WFI method of production that is approved by
the EP. While EP, USP and JP have attempted to harmonize the method for production of
water for injection, it strongly suggested that distillation because the robust nature of
distillation process specifically as it relates to the phase change of water to steam.
2.3 MED Process for WFI
Distillation is simply the phase change from liquid to vapour, thus enabling the pre-treated
feed water to be stripped of any residual ionic materials, particulates, colloids and non-
volatile organic compounds. Distillation also removes bacterial endotoxins. This is crucial
to the production of the WFI. The evaporation stage of the distillation process leaves the
non-volatile compounds and large particulates in the feed water. The presence of demisters
and separation devices removes any of these materials that may be entrained in the vapour.
There are several types of distillation units in use in the processing industries such as single
effect, multiple effect and vapour compression units. For larger outputs it is necessary to
use multiple units in which the steam generated in the first effect is used to heat the feed
water in the second effect and so on. With both types of distillation unit the distillate is
typically gravity fed to the storage tank, requiring that the outlet from the unit be higher
than the inlet to the tank and if possible within close proximity. In this way the need for
transfer pumps or extensive piping in the system can be avoided.
MED used multiple effect still design which easily recognized by its multiple column
which the flow diagram as seen in Figure 1. Function of multiple column in this process to
re-use heat energy through the additional effects. The first column is heated by an external

6
source such as plant steam with remaining columns heated by the pure steam produced
form the initial evaporation process. This pure steam is utilized as both a heating source for
additional columns as well as a preheating source for incoming feed water at next column.
In turn, the feed water helps condense the pure steam so that the remaining pure steam
produced during the process requires minimal cooling water in the final condenser. Both
methods are based on the physical law that any particles, endotoxins, pyrogens or other
contaminants remain in the water during the phase transition from water to steam.
Unfortunately, large amounts of energy must be transferred to the water in order to achieve
this phase transition and this input of energy causes the water to move rapidly. This is, in
fact necessary in order to transfer the heat from the secondary medium (normally hot
steam) to the water to be evaporated. These droplets may contain undesirable contaminants
and must be removed from the water vapour (Solid State Technology, Pure Steam and
water for injection in the pharmaceutical industry).
Figure 1: Process Flow Diagram using MED Method

7
2.4 Energy Usage
Normally, water system in pharmaceutical constantly recirculates water which
consumes electricity for pumps, instruments and others devices. Often the water must
be heated or cooled to maintain adequate water temperature specifications. These
systems can quickly consume valuable raw water, consume electrical and steam utilities
and produce a wastewater stream even if the water system is not being used in the
production process. Although in the production of WFI the raw material is the water not
contains any harm toxic or chemical that could impact the environment. This situation
should not be over looked because WFI process consumed higher energy through
equipment used such as pumps. When more energy use it means to generate energy is
higher. There is gave more effect to the potential environmental impact from the
process.
Energy is the fundamental to the human life and growing economy for new generation.
Energy is essential in human life to give the better life but the world changing from the
impact to generate the energy. An expanding population, economic growth, new
technology development and changes in the nature and scope of regulations are all
transforming the energy landscape. Malaysia pursue to expand the economy for the
grow of citizen life, which mean Malaysia energy supply demand increase from 50
Mtoe in 2010 to 65 Mtoe in 2020(Sin, Indati, Mustapa, & Peng, 2011). Malaysia
currently adopts a five type fuel such as gas, coal, hydro, oil and other sources for
electricity generation. The variety of fuel power used to generate electricity impact on
the environment. Fossil fuel power plants release air pollution, require large amount of
cooling water and large tracts of lands during the mining process. The impact can divide
to specifics category such to air, water and land impacts. The main reasons for the
climate change particularly on the rise of earth temperature are industrialization and
modernization, burning of oil, gasoline and coal. These activities have helped to
increase the amount of greenhouse gases in the atmosphere particularly carbon dioxide,
methane and nitrous oxide(Sin et al., 2011). In the industry, have a several types of
chemical need to control the release because it will be the effect to the environment.
Carbon Dioxide, CO2need to avoid from discharge into soil, waterways, drains and
sewers and must be control when released to the environment (Cruce, A. et al., 2012).

8
As conclusion to obtain the sustainable development in process design, industry activity
should be transformed into a more integrated model and industrial ecosystem to
optimize the consumption of energy and materials (Frosch, R,. et al., 1995).
2.5 Potential environment impact
Pharmaceutical industry less in paying attention towards the environmental impact from
the manufacturing because is not consider a dirty industry compared to others which
consistent with medical substances which are pharmaceutical a group of substances that
until recently have been exposed to the environment with very little attention (Science,
E., & Britain, G., 1998).
Waste WAR Algorithm methods used to evaluating the potential environmental impacts
and the design or modification of WFI processes. There are few impacts to the
environment need to manage which is air emissions and waste water discharge. As the
engineer, the potential impacts to the environment when developing and manufacturing
the pharmaceutical should be consider while patients will be access to the best available
pharmaceutical treatment. Health care without harm provides resources to increase our
understanding of the issues involving pharmaceuticals and suggests ways to reduce their
environmental impact. Sustainable development in process is important while protecting
the environment for the present and future generations. Better technology can help us
study and better understand how our process is affecting the environment and prevent
the impact from effect the environment. Potential environmental impact is the
unrealized effect or impact that the emission of mass and energy would have on the
environment on average. It is, essentially a probability function for the realization of a
potential effect (Cabezas, Bare, & Mallick, 1999). The sustainable development with
the particular indicator is important from initial stages of process design. There is the
indicator presents a direct correlation among flows and reduces the requirement of
complex models. In the potential environment impact (PEI), the WAR algorithm is
adopted to assess the environmental performance of a process design. The reason is
because of its ability to describe the environmental impact of the input-output material
and energy stream in a simple approach. Moreover, it uses less extensive data which can
be found in open literature and could greatly facilitate design comparison to modified or
new processes (Othman, 2011).

9
The WAR algorithm uses eight environmental impact categories in its evaluation. The
impact categories are generally divided into two categories which are to measure the
effect to the environment (Heijungs et al,1992). Two categories were used to estimate
the potential for human toxicity, ingestion and inhalation. There also to estimate toxicity
potential because they considered all of the primary routes of exposure of a chemical.
Based on the study by Othman M. R. those categories are:
Table 1: Environmental impact categories of method
Global Atmospheric Method
Global warming potential (GWP) By comparing the extent to which a unit mass
of a chemical absorbs infrared radiation over
its atmospheric lifetime and the extent that
CO2 absorbs infrared radiation over its
respective lifetimes.
Ozone depletion potential (ODP) By comparing the rate at which a unit mass of
chemical reacts with ozone to form molecular
oxygen to the rate at which a unit mass of
CFC-11 (trichlorouoromethane) reacts with
ozone to form molecular oxygen.
Acidification potential (AP) By comparing the rate of release of H+ in the
atmosphere as promoted by a chemical to the
rate of release of H+ in the atmosphere as
promoted by SO2.
Photochemical oxidation (PCOP) By comparing the rate at which a unit mass of
chemical reacts with a hydroxyl radical (OH-)
to the rate at which a unit mass of ethylene
reacts with OH-.
Local Toxilogical Definition
Human toxicity potential by ingestion (HTPI) Calculated for a chemical if it existed as a
liquid or solid at a temperature of 0oC and
atmospheric pressure and an exposure
potential.
Human toxicity potential by inhalation/dermal
exposure (HTPE)
Determined for that chemical if it existed as a
gas at those conditions. However, some
chemicals were assigned values for both
categories if it was warranted.

10
Aquatic toxicity potential (ATP)
The toxilogical level the lethal dose (LD50)
was used as estimate for the ATP.
Terrestrial toxicity potential (TTP) The toxilogical level lethal concentration
(LC50) was used as estimate for the TTP.

11
3 PROCESS SIMULATION AND MODELLING
3.1 Overview
In this chapter, it will discuss about the methodology flow on energy usage for WFI
process and waste reduction (WAR) algorithm. To achieve the above stated objective,
the methodology employed in this research. First step is modelling MED process in
SPD to simulate the process for gain the amount of energy usage. From that, the PEI
value was calculated used WAR Algorithm.
3.2 Environmental assessment using WAR algorithm
The concept of the potential environment impact (PEI) in the WAR algorithm is based
on the conventional mass and energy balance on Figure 2. The waste reduction
algorithm (WAR) was developed by EPA scientists so that the environmental impacts
of designs could easily be evaluated. The goal of WAR is to reduce environmental and
related human health impacts at the design stage. WAR algorithm has been developed
to describe the flow and the generation of potential environmental impact through a
chemical process (Young, Scharp, & Cabezas, 2000). Potential environmental impact
theory is the quantity of material and energy balance would have effect if they were to
be emitted into the environment.
Figure 2: Mass and energy balance for the calculation of the PEI

12
3.3 Energy usage to generate steam
A process flow diagram to generate steam and Figure 3 shows the calculation to produce 1 kg of heating steam by using Excel spreadsheet
whereas Table 2 shows the heat transfer agent (steam) demand for MED process.
Calculation to produce 1 kg of heating steam
Feedwater Heating Steam
Pressure: 1 bar Temp.: 175 C
Temp.: 80 C Pressure: 9 bar
hf: 335.02 kJ/kg Massflow: 1 kg
Massflow: 1 kg hf: 742.56 kJ/kg
Raw Water Energy: 335.02 kJ/kg hfg: 2030.5 kJ/kg
h: 2671.54 kJ/kg
Fuel Dryness: 0.95
Energy: 2671.54 kJ/kg
Heating Steam
Feedwater for boiler
Hot Condensate
Boiler
Fuel: Natural gas
LHV fuel: 49967.7 kJ/kg
Efficiency: 0.82
Boiler energy: 2336.52 kJ/kg(steam)
Fuel energy: 2849.41 kJ/kg(steam)
Fuel required: 0.05703 kg fuel
Feed Tank
Steam Boiler
Distribution to variouspoint
Figure 3: Process flow and calculation to generate 1kg steam

13
Table 2: Heat transfer agent demand
1.1b Heat transfer Agent Demand
Steam kg/yr kg/h kg/kgMP
Steam 675661.70 85.31 N/A
TOTAL 675661.70 85.31 N/A
Source: Adapted from SPD result under Utilities & Labor report at Appendices, A2.
The calculation for lower heating value (LHV) can be reviewed at Appendices, A3.
3.4 Development of PEI
Potential environmental impact is the unrealized effect or impact that the emission of
mass and energy would have on the environment on average. It is, essentially a
probability function for the realization of a potential effect (Cabezas, Bare, & Mallick,
1999).
There are four main environmental indicators will calculate and evaluate from WAR
algorithm; , , and . Here some equations use to calculate these indicators.
The total rate of PEI generated, and total PEI output, can be expressed as:
= - + eq. (1)
= + eq. (2)
The indices presented to this end are in terms of rate PEI/h. To evaluate on a
product basis (PEI/kg), a simple transformation can be made to the index by,
= eq. (3)
= eq. (4)
The symbol is the mass flow rate of product p. The value of total rate of PEI
output, ,enables us to identify an appropriate site for a plant and measures the

14
efficiency of material utilization by a specific process per unit mass of products; it
decreases when the mass rate of PEI. On the other hand, is used for comparing
processes and products based on the amount of new potential environmental impact
generated in product manufacturing. Then, is an indicator useful in comparing
processes based on how fast they generate impact.
Table 3 till Table 5 shows the PEI calculation and it is developed in excel spreadsheet
whereas Table 6 shows the emission factor and specific PEI of component from energy
consumption.
Table 3: Impact factor (energy) with hazardous gases value for each PEI indicator
Gases SOx NOx CO2 CO
Component
HTPI 1.2 0.78 0 0
HTPE 0 5.6 9000 29
ATP 0 19.6 0 0
TTP 1.2 0.78 0 0
GWP 0 0 1 0
PCOP 0 0 0 0
AP 1 1.77 0 0
ODP 0 0 0 0
Table 4: Specific PEI value calculation
Gases SOx NOx CO2 CO
Component
HTPI 0.8333333 1.2820513 0 0
HTPE 0 5.6 9000 29
ATP 0 0.0510204 0 0
TTP 0.8333333 1.2820513 0 0
GWP 0 0 1 0
PCOP 0 0 0 0
AP 1 1.77 0 0
ODP 0 0 0 0

15
Table 5: Normalized PEI value from energy consumption
Gases SOx NOx CO2 CO
Component
HTPI 0.787878 1.2121212 0 0
HTPE 0 0.0018595 2.988511 0.009629
ATP 0 0.0510204 0 0
TTP 0.787878 1.2121212 0 0
GWP 0 0 1 0
PCOP 0 0 0 0
AP 0.722022 1.277978 0 0
ODP 0 0 0 0
Table 6: Emission factor and specific PEI of component from energy consumption
Component Emission Factor (kg/kWh) Specific PEI of component
SOX 0.0005 0.11
NOX 0.0009 0.40
CO2 0.5300 122.00
CO 0.0005 0.00
3.5 Super Pro designer
Super Pro Designer facilitates modelling to evaluation and optimization of integrated
processes in a wide range of industries such as Pharmaceutical, Water Purification,
Wastewater Treatment, Air Pollution Control and etc. The more detail results can access
from SPD as seen in Appendices, A1.
Process Simulation software is used to perform the following tasks (Intelligen, Inc):
Represent the entire process on the computer such as perform material and energy
balances of process, calculate demand for utilities as a function of time, estimate the
cycle of the process and assess the environmental impact.
The basic steps to using Super Pro (Shawna et al., 2011):
1. Specify Mode of Operation
2. Set Default Physical Units
3. Register Components and Mixtures
4. Add Unit Procedures
5. Add Input and Output Streams

16
6. Specify Operations
7. Schedule Process
8. Specify Labor Requirements
9. Perform Cost Analysis
10. Perform Environmental Impact Assessment
The flow diagram in Figure 4 is shows modelling of MED process in SPD.
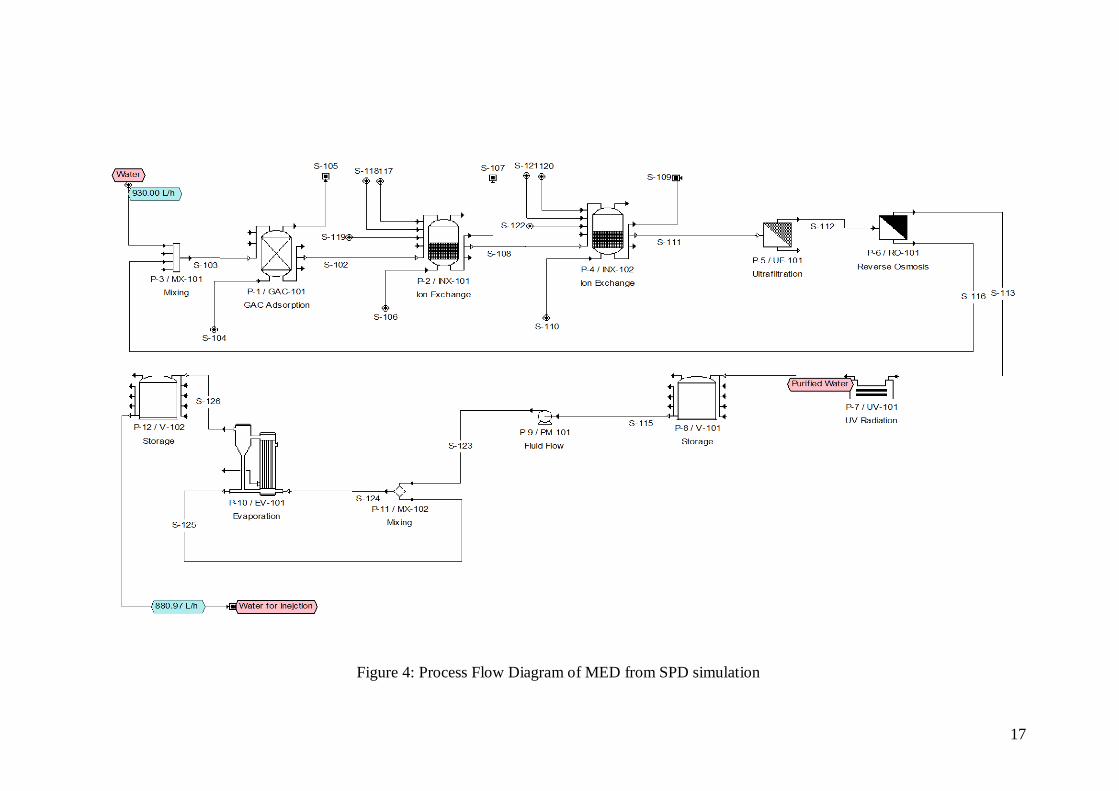
17
Figure 4: Process Flow Diagram of MED from SPD simulation